UNITED STATES
SECURITIES AND EXCHANGE COMMISSION
Washington, D.C. 20549
FORM 10-K
(Mark One)
S ANNUAL REPORT PURSUANT TO SECTION 13 OR 15(d) OF THE SECURITIES
EXCHANGE ACT OF 1934
For the fiscal year ended December 31, 2013
OR
£ TRANSITION REPORT PURSUANT TO SECTION 13 OR 15(d) OF THE SECURITIES
EXCHANGE ACT OF 1934
For the transition period from to
Commission file number: 33-92990; 333-187309
TIAA REAL ESTATE ACCOUNT
(Exact name of registrant as specified in its charter)
NEW YORK
(State or other jurisdiction of incorporation or organization)
NOT APPLICABLE
(I.R.S. Employer Identification No.)
C/O TEACHERS INSURANCE AND
ANNUITY ASSOCIATION OF AMERICA
730 THIRD AVENUE
NEW YORK, NEW YORK 10017-3206
(Address of principal executive offices, including zip code)
Registrant’s telephone number, including area code: (212) 490-9000
Securities registered pursuant to Section 12(b) of the Act: None
Securities registered pursuant to Section 12(g) of the Act: None
Indicate by check mark if the registrant is a well-known seasoned issuer, as defined in Rule 405 of the Securities Act.
YES£ NOS
Indicate by check mark if the registrant is not required to file reports pursuant to Section 13 or Section 15(d) of the Exchange Act:
YES£ NOS
Indicate by check mark whether the Registrant (1) has filed all reports required to be filed by Section 13 or 15(d) of the Securities Exchange Act of 1934 during the preceding 12 months (or for such shorter period that the Registrant was required to file such reports), and (2) has been subject to such filing requirements for the past 90 days.
YESS NO£
Indicate by check mark if disclosure of delinquent filers pursuant to Item 405 or regulation S-K is not contained herein, and will not be contained, to the best of registrant’s knowledge, in definitive proxy or information statements incorporated by reference in Part III of this Form 10-K or any amendment to this Form 10-K: Not Applicable
Indicate by check mark whether the registrant has submitted electronically and posted on its corporate Web site, if any, every Interactive Data File required to be submitted and posted pursuant to Rule 405 of Regulation S-T (§232.405 of this chapter) during the preceding 12 months (or for such shorter period that the registrant was required to submit and post such files).
YESS NO£
Indicate by check mark whether the registrant is a large accelerated filer, an accelerated filer, a non-accelerated filer, or smaller reporting company. See the definitions of “large accelerated filer,” “accelerated filer” and “smaller reporting company” in Rule 12b-2 of the Exchange Act. (Check one):
| | |
Large accelerated filer£ | | Accelerated filer£ |
Non-accelerated filerS | | Smaller Reporting Company£ |
(Do not check if a smaller reporting company) | | |
Indicate by check mark whether the registrant is a shell company (as defined in Rule 12b-2 of the Exchange Act).
YES£ NOS
Aggregate market value of voting stock held by non-affiliates: Not Applicable
Documents Incorporated by Reference: None
TABLE OF CONTENTS
| | | | | | |
| | Item | | | | Page |
Part I | | | | | | |
| | Item 1. | | Business | | | | 3 | |
| | Item 1A. | | Risk Factors | | | | 9 | |
| | Item 1B. | | Unresolved Staff Comments | | | | 22 | |
| | Item 2. | | Properties | | | | 22 | |
| | Item 3. | | Legal Proceedings | | | | 30 | |
| | Item 4. | | Mine Safety Disclosures | | | | 30 | |
Part II | | | | | | |
| | Item 5. | | Market for Registrant’s Securities, Related Stockholder Matters, and Issuer Purchases of Equity Securities | | | | 31 | |
| | Item 6. | | Selected Financial Data | | | | 32 | |
| | Item 7. | | Management’s Discussion and Analysis of Account’s Financial Condition and Results of Operations | | | | 34 | |
| | Item 7A. | | Quantitative and Qualitative Disclosures about Market Risk | | | | 62 | |
| | Item 8. | | Consolidated Financial Statements and Supplementary Data | | | | 64 | |
| | Item 9. | | Changes in and Disagreements with Accountants on Accounting and Financial Disclosure | | | | 100 | |
| | Item 9A. | | Controls and Procedures | | | | 100 | |
| | Item 9B. | | Other Information | | | | 100 | |
Part III | | | | | | |
| | Items 10 and 11. | | Directors, Executive Officers, and Corporate Governance of the Registrant; Executive Compensation | | | | 101 | |
| | Item 12. | | Security Ownership of Certain Beneficial Owners and Management and Related Stockholder Matters | | | | 104 | |
| | Item 13. | | Certain Relationships and Related Transactions, and Director Independence | | | | 104 | |
| | Item 14. | | Principal Accountant Fees and Services | | | | 104 | |
Part IV | | | | | | |
| | Item 15. | | Exhibits and Consolidated Financial Statement Schedules | | | | 106 | |
Signatures | | | | 107 | |
2
PART I
ITEM 1. BUSINESS.
General. The TIAA Real Estate Account (the “Real Estate Account”, the “Account” or the “Registrant”) was established on February 22, 1995, as an insurance company separate account of Teachers Insurance and Annuity Association of America (“TIAA”), a New York insurance company, by resolution of TIAA’s Board of Trustees (the “Board”). The Account, which invests mainly in real estate and real estate-related investments, is a variable annuity investment option offered through individual, group and tax-deferred annuity contracts available to employees in the academic, medical, cultural and research fields. The Account commenced operations on July 3, 1995, and interests in the Account were first offered to eligible participants on October 2, 1995.
The Account offers individual and group accumulating annuity contracts (with contributions made on a pre-tax or after-tax basis), as well as individual lifetime and term-certain variable payout annuity contracts (including the payment of death benefits to beneficiaries). Investors are entitled to transfer funds to or from the Account under certain circumstances. Funds invested in the Account for each category of contract are expressed in terms of units, and unit values will fluctuate depending on the Account’s performance.
The Account is regulated by the New York Department of Financial Services (“NYDFS”) and the insurance departments of certain other jurisdictions in which the annuity contracts are offered. Although TIAA owns the assets of the Real Estate Account, and the Account’s obligations are obligations of TIAA, the Account’s income, investment gains, and investment losses are credited to or charged against the assets of the Account without regard to TIAA’s other income, gains, or losses. Under New York insurance law, the Account cannot be charged with liabilities incurred by any other TIAA business activities or any other TIAA separate account.
The Real Estate Account is designed as an option for retirement and tax-deferred savings plans for employees of non-profit and governmental institutions. TIAA currently offers the Real Estate Account under the following annuity contracts:
|
• | | | | RAs and GRAs (Retirement Annuities and Group Retirement Annuities) |
|
• | | | | SRAs (Supplemental Retirement Annuities) |
|
• | | | | GSRAs (Group Supplemental Retirement Annuities) |
|
• | | | | Retirement Choice and Retirement Choice Plus Annuity |
|
• | | | | GAs (Group Annuities) and Institutionally-Owned GSRAs |
|
• | | | | Classic and Roth IRAs (Individual Retirement Annuities) including SEP IRAs (Simplified Employee Pension Plans) |
|
• | | | | Keoghs |
|
• | | | | ATRAs (After-Tax Retirement Annuities) |
|
• | | | | Real Estate Account Accumulation Contract |
Note that state regulatory approval may be pending for certain of these contracts and these contracts may not currently be available in every state. TIAA may also offer the Real Estate Account as an investment option under additional contracts, both at the individual and plan sponsor level, in the future.
Investment Objective. The Real Estate Account seeks favorable long-term returns primarily through rental income and appreciation of real estate and real estate-related investments owned by the Account. The Account will also invest in non-real estate-related publicly traded securities and short-term higher quality liquid investments that are easily converted to cash to enable the Account to meet participant redemption requests, purchase or improve properties, or cover expense needs.
Investment Strategy
Real Estate-Related Investments.The Account intends to have between 75% and 85% of its net assets invested directly in real estate or real estate-related investments with the goal of producing favorable long-term returns primarily through rental income and appreciation. These investments may consist of:
3
|
• | | | | Direct ownership interests in real estate, |
|
• | | | | Direct ownership of real estate through interests in joint ventures, |
|
• | | | | Indirect interests in real estate through real estate-related securities, such as: |
|
• | | | | equity investments in real estate investment trusts (“REITs”), which investments may consist of common or preferred stock interests, |
|
• | | | | real estate limited partnerships, |
|
• | | | | investments in equity or debt securities of companies whose operations involve real estate (i.e., that primarily own or manage real estate) which may not be REITs, and |
|
• | | | | conventional commercial mortgage loans, participating mortgage loans, secured mezzanine loans and collateralized mortgage obligations, including commercial mortgage-backed securities (“CMBS”) and other similar investments. |
The Account’s principal strategy is to purchase direct ownership interests in income-producing real estate, primarily office, industrial, retail and multi-family residential properties. The Account is targeted to hold between 65% and 80% of the Account’s net assets in such direct ownership interests at any time. Historically, approximately 70% of the Account’s net assets have been comprised of such direct ownership interests in real estate.
In addition, while the Account is authorized to hold up to 25% of its net assets in liquid real estate-related securities, such as REITs and CMBS, management intends that the Account will not hold more than 10% of its net assets in such securities on a long-term basis. Traditionally, less than 10% of the Account’s net assets have been comprised of interests in these securities, although the Account has recently held approximately 10% of its net assets in equity REIT securities. In addition, under the Account’s current investment guidelines, the Account is authorized to hold up to 10% of its net assets in CMBS. As of December 31, 2013, REIT securities comprised approximately 8.9% of the Account’s net assets, and the Account held no CMBS as of such date.
Non-Real Estate-Related Investments.The Account will invest the remaining portion of its assets (targeted to be between 15% and 25% of its net assets) in publicly traded, liquid investments; namely:
|
• | | | | Short-term government related instruments, including U.S. Treasury bills, |
|
• | | | | Long-term government related instruments, such as securities issued by U.S. government agencies or U.S. government sponsored entities, |
|
• | | | | Short-term non-government related instruments, such as money market instruments and commercial paper, and |
|
• | | | | Long-term non-government related instruments, such as corporate debt securities and stock of companies that do not primarily own or manage real estate. |
However, from time to time (most recently between late 2008 and mid 2010), the Account’s non-real estate-related liquid investments may comprise less than 15% (and possibly less than 10%) of its assets (on a net basis and/or a gross basis), especially during and immediately following periods of significant net participant outflows, in particular due to significant participant transfer activity. In addition, the Account, from time to time and on a temporary basis, may hold in excess of 25% of its net assets in non-real estate-related liquid investments, particularly during times of significant inflows into the Account and/or a lack of attractive real estate-related investments available in the market.
Liquid Securities Generally.Primarily due to management’s need to manage fluctuations in cash flows, in particular during and immediately following periods of significant participant net transfer activity into or out of the Account, the Account may, on a temporary basis (i) exceed the upper end of its targeted holdings (currently 35% of the Account’s net assets) in liquid securities of all types, including both publicly traded non-real estate-related liquid investments and liquid real estate-related securities, such as REITs and CMBS, or (ii) be below the low end of its targeted holdings in such liquid securities (currently 15% of the Account’s net assets).
The portion of the Account’s net assets invested in liquid investments of all types may exceed the upper end of its target, for example, if (i) the Account receives a large inflow of money in a short period of time, in particular due to significant participant transfer activity into the Account, (ii) the Account receives significant
4
proceeds from sales or financings of direct real estate assets, (iii) there is a lack of attractive direct real estate investments available on the market, and/or (iv) the Account anticipates more near-term cash needs, including to apply to acquire direct real estate investments, pay expenses or repay indebtedness.
Foreign Investments. The Account from time to time will also make foreign real estate investments. Under the Account’s investment guidelines, investments in direct foreign real estate, together with foreign real estate-related securities and foreign non-real estate related liquid investments may not comprise more than 25% of the Account’s net assets. However, through the date of this report, such foreign real estate-related investments have never represented more than 7.5% of the Account’s net assets and management does not intend such foreign investments to exceed 10% of the Account’s net assets. As of December 31, 2013, the Account held one foreign real estate investment in France, which represented 1.3% of the Account’s net assets.
More detailed information concerning the composition of the Account’s properties, including the Account’s foreign investments and information regarding significant tenants in the Account’s properties, is contained below under the heading “Item 2. Properties.”
Investment Summary: At December 31, 2013, the Account’s net assets totaled $16.9 billion. As of that date, the Account’s investments in real estate properties, real estate joint ventures, limited partnerships and real estate-related marketable securities, net of the fair value of mortgage loans payable on real estate, represented 81.1% of the Account’s net assets.
At December 31, 2013, the Account held a total of 102 real estate property investments (including its interests in 13 real estate-related joint ventures), representing 73.9% of the Account’s total investments, measured on a gross asset value basis (“Total Investments”). As of that date, the Account also held investments in REIT equity securities (representing 7.9% of Total Investments), real estate limited partnerships (representing 1.9% of Total Investments), government agency notes (representing 10.4% of Total Investments) and U.S. Treasury securities (representing 5.9% of Total Investments). See the Account’s audited consolidated financial statements for more information as to the Account’s investments as of December 31, 2013.
Borrowing: The Account may borrow money and assume or obtain a mortgage on a property—i.e., make leveraged real estate investments. Under the Account’s current investment guidelines, management intends to maintain the Account’s loan to value ratio (as defined below) at or below 30% (measured at the time of incurrence and after giving effect thereto). Forms of borrowing may include:
|
• | | | | incurring new debt on the Account’s properties, |
|
• | | | | refinancing outstanding debt, |
|
• | | | | assuming debt on the Account’s properties, or |
|
• | | | | long term extensions of the maturity date of outstanding debt |
The Account’s loan to value ratio at any time is based on the ratio of the outstanding principal amount of the Account’s debt to the Account’s total gross asset value. The Account’s total gross asset value, for these purposes, is equal to the total fair value of the Account’s assets (including the fair value of the Account’s interest in joint ventures), with no reduction associated with any indebtedness on such assets. In calculating outstanding indebtedness, we will include only the Account’s actual percentage interest in any borrowings on a joint venture investment and not that of any joint venture partner. Also, at the time the Account (or a joint venture in which the Account is a partner) enters into a revolving line of credit, management deems the maximum amount which may be drawn under that line of credit as fully incurred, regardless of whether the maximum amount available has been drawn from time to time.
As of December 31, 2013, the aggregate principal amount of the Account’s outstanding debt (including the Account’s share of debt on its joint venture investments) was $3.9 billion and the Account’s loan to value ratio was approximately 18.4%.
In times of high net inflow activity, in particular during times of high net participant transfer inflows, management may determine to apply a portion of such cash flows to make prepayments of indebtedness prior to scheduled maturity, which would have the effect of reducing the Account’s loan to value ratio. Such prepayments may require the Account to pay fees or ‘yield maintenance’ amounts to lenders.
5
In addition, the Account may obtain a line of credit to meet short-term cash needs, if needed. Management expects the proceeds from any such short-term borrowing would be used to meet the cash flow needs of the Account’s properties and real estate-related investments.
The Account may only borrow up to 70% of the then current value of a property, although construction loans may be for 100% of costs incurred in developing the property. Except for construction loans, any mortgage loans on a property will be non-recourse to the Account, meaning that if there is a default on a loan in respect of a specific property, the lender will have recourse to (i.e., be able to foreclose on) only the property encumbered (or the joint venture owning the property), or to other specific Account properties that may have been pledged as security for the defaulted loan, but not to any other assets of the Account. When possible, the Account will seek to have loans mature at varying times to limit the risks of borrowing.
Risk Factors. The Account’s assets and income can be affected by a variety of risk factors. These risks are more fully described under Item 1A of this Report and in the Account’s prospectus (as supplemented from time to time).
Personnel and Management. The Account has no officers, directors or employees. TIAA employees, under the direction and control of TIAA’s Board of Trustees (“The Board”) and its Investment Committee, manage the investment of the Account’s assets, following investment management procedures TIAA has adopted for the Account. In addition, TIAA performs administration functions for the Account (which includes receiving and allocating premiums, calculating and making annuity payments and providing recordkeeping and other services). Distribution services for the Account (which include, without limitation, distribution of the annuity contracts, advising existing annuity contract owners in connection with their accumulations and helping employers implement and manage retirement plans) are performed by TIAA-CREF Individual & Institutional Services, LLC (“Services”), a wholly owned subsidiary of TIAA and registered broker-dealer and member of the Financial Industry Regulatory Authority (“FINRA”). TIAA and Services provide investment advisory, administration, and distribution services, as applicable, on an “at-cost” basis.
Contracts. TIAA offers the Account as a variable option for the annuity contracts listed earlier in this Item 1, although some employer plans may not offer the Account as an option for certain contracts. Each payment to the Account buys a number of accumulation units. Similarly, any transfer or withdrawal from the Account results in the redemption of a number of accumulation units. The price paid for an accumulation unit, and the price received for an accumulation unit when redeemed, is the accumulation unit value (“AUV”) calculated for the business day on which we receive a participant’s purchase, redemption or transfer request in good order (unless a participant asks for a later date for a redemption or transfer).
Subject to the terms of the contracts and a participant’s employer’s plan, a participant can move money to and from the Account in the following ways:
|
• | | | | from the Account to a CREF investment account, a TIAA Access variable account (if available), TIAA’s Traditional Annuity or a fund (including TIAA-CREF affiliated funds) or other option available under the plan; |
|
• | | | | to the Account from a CREF investment account, a TIAA Access variable account (if available), TIAA’s Traditional Annuity (transfers from TIAA’s Traditional Annuity under RA, GRA or Retirement Choice contracts are subject to restrictions), a TIAA-CREF affiliated fund or from other companies/ plans; |
|
• | | | | by withdrawing cash; and/or |
|
• | | | | by setting up a program of automatic withdrawals or transfers. |
Importantly, transfers out of the Account to a TIAA or CREF account or into another investment option can be executed on any business day but are limited to once per calendar quarter, although some plans may allow systematic transfers that result in more than one transfer per calendar quarter. Other limited exceptions may apply. Also, transfers to CREF accounts or to certain other options may be restricted by an employer’s plan, current tax law or by the terms of a participant’s contract. In addition, individual participants are limited from making internal transfers into their Account accumulation if, after giving effect to such transfer, the total value of such participant’s Account accumulation (under all contracts issued to such participant) would exceed $150,000. Categories of transactions that TIAA deems “internal funding vehicle transfers” for purposes of this limitation are described in the applicable contract or endorsement form in the Account’s Prospectus. As of the date of this Annual Report on Form 10-K, all jurisdictions in which the Account is
6
offered have approved this limitation, but the effective date of the limitation as applies to an individual participant will be reflected on his or her applicable contract or endorsement form. See the Account’s prospectus for more information.
Appraisals and Valuations. With respect to the Account’s real property investments, following the initial purchase of a property or the making of a mortgage loan on a property by the Account (at which time the Account normally receives an independent appraisal on such property), each of the Account’s real properties are appraised, and mortgage loans are valued, at least once every calendar quarter or sooner as circumstances arise. Each of the Account’s real estate properties are appraised each quarter by an independent external state-certified (or its foreign equivalent) appraiser (which we refer to in this report as an “independent appraiser”) who is a member of a professional appraisal organization. In addition, TIAA’s internal appraisal staff performs a review of each of these quarterly appraisals, in conjunction with the Account’s independent fiduciary and TIAA’s internal appraisal staff or the independent fiduciary may request an additional appraisal or valuation outside of this quarterly cycle. Any differences in the conclusions of TIAA’s internal appraisal staff and the independent appraiser will be reviewed by the independent fiduciary, which will make a final determination on the matter (which may include ordering a subsequent independent appraisal).
In general, the Account records appraisals of its real estate properties spread out throughout the quarter, which is intended to result in appraisal adjustments and thus adjustments to the valuations of its holdings (to the extent adjustments are made) happen regularly throughout each quarter and not on one specific day in each period. In addition, an estimated daily equivalent of net operating income is taken into consideration and is adjusted for actual transactional activity. The remaining assets in the Account are primarily marketable securities that are priced on a daily basis. See “Management’s Discussion and Analysis of the Account’s Results of Operations and Financial Condition—Critical Accounting Policies” in this Form 10-K for more information on how each class of the Account’s investments are valued.
Liquidity Guarantee. The TIAA General Account provides the Account with a liquidity guarantee enabling the Account to have funds available to meet participant redemption, transfer or cash withdrawal requests. If the Account cannot fund participant requests from the Account’s own cash flow and liquid investments, the TIAA General Account will fund them by purchasing accumulation units issued by the Account (accumulation units that are purchased by TIAA are generally referred to as “liquidity units”). This liquidity guarantee is required by the NYDFS. TIAA guarantees that participants can redeem their accumulation units at the accumulation unit value next determined after their transfer or cash withdrawal request is received in good order. Liquidity units owned by TIAA are valued in the same manner as accumulation units owned by the Account’s participants.
This liquidity guarantee is not a guarantee of the investment performance of the Account or a guarantee of the value of a participant’s units. The Account pays TIAA for the liquidity guarantee through a daily deduction from the Account’s net assets. Primarily as a result of significant net participant transfers in the second half of 2008 and the first half of 2009, pursuant to this liquidity guarantee obligation, the TIAA General Account purchased an aggregate of $1.2 billion of liquidity units issued by the Account between December 2008 and June 2009. Since July 1, 2009 and through the date of filing this Form 10-K, no further liquidity units have been purchased.
Redemption of Liquidity Units. The independent fiduciary is vested with oversight and approval over any redemption of TIAA’s liquidity units, acting in the best interests of Real Estate Account participants.
As of March 31, 2013, the independent fiduciary completed the systematic redemption of all of the liquidity units held by the TIAA General Account. Approximately one-quarter of such units were redeemed evenly over the business days in each of the months of June, September and December 2012, and March 2013, representing a total of $1.3 billion redeemed during this period.
To the extent liquidity units are held by the TIAA General Account, the independent fiduciary reserves the right to authorize or direct the redemption of all or a portion of liquidity units at any time. Upon termination and liquidation of the Account (wind-up), any liquidity units held by TIAA will be the last units redeemed, unless the independent fiduciary directs otherwise. The Account pays TIAA for the risk associated with providing the liquidity guarantee through a daily deduction from the Account’s net assets.
Independent Fiduciary. Because TIAA’s ability to purchase and sell liquidity units raises certain technical issues under the Employee Retirement Income Security Act of 1974, as amended (“ERISA”), TIAA applied for and received a prohibited transaction exemption from the U.S. Department of Labor in 1996 (PTE
7
96-76). In connection with the exemption, TIAA has appointed an independent fiduciary for the Account, with overall responsibility for reviewing the Account’s transactions to determine whether they are in accordance with the Account’s investment guidelines. Real Estate Research Corporation, a real estate consulting firm whose principal offices are located in Chicago, Illinois (“RERC”), was appointed as independent fiduciary effective March 1, 2006 and currently serves as the Account’s independent fiduciary whose term expires in February 2015. In February 2014, RERC was acquired by Situs Corp., a real estate advisory and consulting firm. The independent fiduciary’s responsibilities include:
|
• | | | | reviewing and approving the Account’s investment guidelines and monitoring whether the Account’s investments comply with those guidelines; |
|
• | | | | reviewing and approving valuation procedures for the Account’s properties; |
|
• | | | | approving adjustments to any property valuations that change the value of the property or the Account as a whole above or below certain prescribed levels, or that are made within three months of the annual independent appraisal; |
|
• | | | | reviewing and approving how the Account values accumulation and annuity units; |
|
• | | | | approving the appointment of all independent appraisers; |
|
• | | | | reviewing the purchase and sale of units by TIAA to ensure that the Account uses the correct unit values; and |
|
• | | | | requiring appraisals besides those normally conducted, if the independent fiduciary believes that any of the properties have changed materially, or that an additional appraisal is necessary to ensure the Account has correctly valued a property. |
In addition, the independent fiduciary has certain responsibilities with respect to the Account that it had historically undertaken or is currently undertaking with respect to TIAA’s purchase and ownership of liquidity units, including among other things, reviewing the purchases and redemption of liquidity units by TIAA to ensure the Account uses the correct unit values. In connection therewith, as set forth in PTE 96-76, the independent fiduciary’s responsibilities include:
|
• | | | | establishing the percentage of total accumulation units that TIAA’s ownership should not exceed (the “trigger point”) and creating a method for changing the trigger point; |
|
• | | | | approving any adjustment of TIAA’s ownership interest in the Account and, in its discretion, requiring an adjustment if TIAA’s ownership of liquidity units reaches the trigger point; and |
|
• | | | | once the trigger point has been reached, participating in any program to reduce TIAA’s ownership in the Account by utilizing cash flow or liquid investments in the Account, or by utilizing the proceeds from asset sales. If the independent fiduciary were to determine that TIAA’s ownership should be reduced following the trigger point, its role in participating in any asset sales program would include (i) participating in the selection of properties for sale, (ii) providing sales guidelines, and (iii) approving those sales if, in the independent fiduciary’s opinion, such sales are desirable to reduce TIAA’s ownership of liquidity units. |
The independent fiduciary is vested with oversight and approval over any redemption of TIAA’s liquidity units, acting in the best interests of Real Estate Account participants.
Available Information. The Account’s annual report on Form 10-K, and quarterly reports on Form 10-Q, and any amendments to those reports, filed by the Account with the Securities and Exchange Commission on or after the date hereof, can be accessed free of charge at www.tiaa-cref.org. Information contained on this website is expressly not incorporated by reference into this Annual Report on Form 10-K.
8
ITEM 1A. RISK FACTORS.
The value of your investment in the Account will fluctuate based on the value of the Account’s assets, the income the assets generate and the Account’s expenses.Participants can lose money by investing in the Account. There is risk associated with an investor attempting to “time” an investment in the Account’s units, or effecting a redemption of an investor’s units. The Account’s assets and income can be affected by many factors, and you should consider the specific risks presented below before investing in the Account. In particular, for a discussion of how forward-looking statements contained in this Annual Report on Form 10-K are subject to uncertainties that are difficult to predict, which may be beyond management’s control and which could cause actual results to differ materially from historical experience or management’s present expectations, please refer to the subsection entitled “Forward-Looking Statements,” which is contained in the section entitled“Management’s Discussion and Analysis of the Account’s Financial Condition and Results of Operations.”
RISKS ASSOCIATED WITH REAL ESTATE INVESTING
General Risks of Acquiring and Owning Real Property:As referenced elsewhere in this report, the substantial majority of the Account’s net assets are comprised of direct ownership interests in real estate. As such, the Account is particularly subject to the risks inherent in acquiring and owning real property, including in particular the following:
|
• | | | | Adverse Global and Domestic Economic Conditions.The economic conditions in the markets where the Account’s properties are located may be adversely impacted by factors which include: |
| | | adverse domestic or global economic conditions, particularly in the event of a deep recession which results in significant employment losses across many sectors of the economy and reduced levels of consumer spending; | |
• | | | | a weak market for real estate generally and/or in specific locations where the Account may own property; |
|
• | | | | business closings, industry or sector slowdowns, employment losses and related factors; |
|
• | | | | the availability of financing (both for the Account and potential purchasers of the Account’s properties); |
|
• | | | | an oversupply of, or a reduced demand for, certain types of real estate properties; |
|
• | | | | natural disasters, flooding and other significant and severe weather-related events, including those caused by global climate change; |
|
• | | | | terrorist attacks and/or other man-made events; and |
|
• | | | | decline in population or shifting demographics. |
The incidence of some or all of these factors could reduce occupancy, rental rates and the fair value of the Account’s real properties or interests in investment vehicles (such as limited partnerships) which directly hold real properties.
|
• | | | | Concentration Risk.The Account may experience periods in which its investments are geographically concentrated, either regionally or in certain markets with similar demographics. Further, while the Account seeks diversification across its four primary property types: office, industrial, retail and multi-family residential properties, the Account may experience periods where it has concentration in one property type, increasing the potential exposure if there were to be an oversupply of, or a reduced demand for, certain types of real estate properties in the markets in which the Account operates. |
|
| | | | Also, the Account may experience periods in which its tenant base is concentrated within a particular industry sector. For example, the Account owns and operates a number of industrial properties, which, typically feature larger tenant concentration. The insolvency and/or closing of a single tenant in one of our industrial properties may significantly impair the income generated by an industrial property, and may also depress the value of such property. |
9
|
| | | | In addition, the Account owns and operates a number of properties in the Washington, DC metropolitan area and a prolonged period of significantly diminished federal expenditures could have an adverse impact on demand for office space by the U.S. government and the sectors and industries dependent upon the U.S. government in such region or other regions where the government or such related businesses are large lessees. |
|
| | | | If any or all of these events occur, the Account’s income and performance may be adversely impacted disproportionately by deteriorating economic conditions in those areas or industry sectors in which the Account’s investments are concentrated. Also, the Account could experience a more rapid negative change in the value of its real estate investments than would be the case if its real estate investments were more diversified. |
|
• | | | | Leasing Risk. A number of factors could cause the Account’s rental income, a key source of the Account’s revenue and investment return, to decline, which would adversely impact the Account’s results and investment returns. These factors include the following: |
|
• | | | | A property may be unable to attract new tenants or retain existing tenants. This situation could be exacerbated if a concentration of lease expirations occurred during any one time period or multiple tenants exercise early termination at the same time. |
|
• | | | | The financial condition of our tenants may be adversely impacted, particularly in a prolonged economic downturn. The Account could lose revenue if tenants do not pay rent when contractually obligated, request some form of rent relief and/or default under a lease at one of the Account’s properties. Such a default could occur if a tenant declared bankruptcy, suffered from a lack of liquidity, failed to continue to operate its business or for other reasons. In the event of any such default, we may experience a delay in, or an inability to effect, the enforcement of our rights against that tenant, particularly if that tenant filed for bankruptcy protection. Further, any disputes with tenants could involve costly and time consuming litigation. |
|
• | | | | In the event a tenant vacates its space at one of the Account’s properties, whether as a result of a default, the expiration of the lease term, rejection of the lease in bankruptcy or otherwise, given current market conditions, we may not be able to re-lease the vacant space either (i) for as much as the rent payable under the previous lease or (ii) at all. Also, we may not be able to re-lease such space without incurring substantial expenditures for tenant improvements and other lease-up related costs, while still being obligated for any mortgage payments, real estate taxes and other expenditures related to the property. |
|
• | | | | In some instances, our properties may be specifically suited to and/or outfitted for the particular needs of a certain tenant based on the type of business the tenant operates. For example, many companies desire space with an open floor plan. We may have difficulty obtaining a new tenant for any vacant space in our properties, particularly if the floor plan limits the types of businesses that can use the space without major renovation, which may require us to incur substantial expense in re-planning the space. Also, upon expiration of a lease, the space preferences of our major tenants may no longer align with the space they previously rented, which could cause those tenants to not renew their lease, or may require us to expend significant sums to reconfigure the space to their needs. |
|
• | | | | The Account owns and operates retail properties, which, in addition to the risks listed above, are subject to specific risks, including the insolvency and/or closing of an anchor tenant. Many times, anchor tenants will be “big box” stores and other large retailers that can be particularly adversely impacted by a global recession and reduced consumer spending generally. Factors that can impact the level of consumer spending include increases in fuel and energy costs, residential and commercial real estate and mortgage conditions, labor and healthcare costs, access to credit, consumer confidence and other macroeconomic factors. Under certain circumstances, co-tenancy clauses in tenants’ leases may allow certain tenants in a retail property to terminate their leases or reduce or withhold rental payments when overall occupancy at the property falls below certain minimum levels. The insolvency and/or closing of an anchor tenant may also cause such tenants to terminate their leases, or to fail to renew their leases at expiration. |
|
• | | | | Competition.The Account may face competition for real estate investments from multiple sources, including individuals, corporations, insurance companies or other insurance company separate accounts, as well as real estate limited partnerships, real estate investment funds, commercial developers, pension |
10
| | | | plans, other institutional and foreign investors and other entities engaged in real estate investment activities. Some of these competitors may have similar financial and other resources as the Account, and/or they may have investment strategies and policies (including the ability to incur significantly more leverage than the Account) that allow them to compete more aggressively for real estate investment opportunities, which could result in the Account paying higher prices for investments, experiencing delays in acquiring investments or failing to consummate such purchases. Any resulting delays in the acquisition of investments, or the failure to consummate acquisitions the Account deems desirable, may increase the Account’s costs or otherwise adversely affect the Account’s investment results. |
|
| | | | In addition, the Account’s properties may be located close to properties that are owned by other real estate investors and that compete with the Account for tenants. These competing properties may be better located, more suitable for tenants than our properties, or have owners who may compete more aggressively for tenants, resulting in a competitive advantage for these other properties. We may also face similar competition from other properties that may be developed in the future. This competition may limit the Account’s ability to lease space, increase its costs of securing tenants, and limit our ability to maximize our rents and/or require the Account to make capital improvements it otherwise would not, in order to make its properties more attractive to prospective tenants. |
|
• | | | | Operating Costs.A property’s cash flow could decrease if operating costs, such as property taxes, utilities, litigation expenses associated with a property, maintenance and insurance costs that are not reimbursed by tenants, increase in relation to gross rental income, or if the property needs unanticipated repairs and renovations. In addition, the Account’s expenses of owning and operating a property are not necessarily reduced when the Account’s income from a property is reduced. |
|
• | | | | Condemnation.A governmental agency may condemn and convert for a public use (i.e., through eminent domain) all or a portion of a property owned by the Account. While the Account would receive compensation in connection with any such condemnation, such compensation may not be in an amount the Account believes represents equivalent value for the condemned property. Further, a partial condemnation could impair the ability of the Account to maximize the value of the property during its operation, including making it more difficult to find new tenants or retain existing tenants. Finally, a property which has been subject to a partial condemnation may be more difficult to sell at a price the Account believes is appropriate. |
|
• | | | | Terrorism and Acts of War and Violence. Terrorist attacks may harm our property investments. The Account cannot assure you that there will not be further terrorist attacks against the United States or U.S. businesses or elsewhere in the world. These attacks or armed conflicts may directly or indirectly impact the value of the property we own or that secure our loans. Losses resulting from these types of events may be uninsurable or not insurable to the full extent of the loss suffered. Moreover, any of these events could cause consumer confidence and spending to decrease or result in increased volatility in the United States, worldwide financial markets, and the global economy. Such events could also result in economic uncertainty in the United States or abroad. Adverse economic conditions resulting from terrorist activities could reduce demand for space in the Account’s properties and thereby reduce the value of the Account’s properties and therefore your investment return. |
General Risks of Selling Real Estate Investments:Among the risks of selling real estate investments are:
|
• | | | | The sale price of an Account property might differ, perhaps significantly, from its estimated or appraised value, leading to losses or reduced profits to the Account. |
|
• | | | | The Account might not be able to sell a property at a particular time for a price which management believes represents its fair or full value. This illiquidity may result from the cyclical nature of real estate, general economic conditions impacting the location of the property, disruption in the credit markets or the availability of financing on favorable terms or at all, and the supply of and demand for available tenant space, among other reasons. This might make it difficult to raise cash quickly which could impair the Account’s liquidity position (particularly during any period of sustained significant net participant outflows) and also could lead to Account losses. Further, the liquidity guarantee does not serve as a working capital facility or credit line to enhance the Account’s liquidity levels generally, as its purpose is tied to participants having the ability to redeem their accumulation units upon demand (thus, alleviating the Account’s need to dispose of properties solely to increase liquidity levels in what management deems a suboptimal sales environment). |
11
|
• | | | | The Account may need to provide financing to a purchaser if no cash buyers are available, or if buyers are unable to receive financing on terms enabling them to consummate the purchase. Such seller financing introduces a risk that the counterparty may not perform its obligations to repay the amounts borrowed from the Account to complete the purchase. |
|
• | | | | For any particular property, the Account may be required to make expenditures for improvements to, or to correct defects in, the property before the Account is able to market and/or sell the property. |
|
• | | | | Interests in real estate limited partnerships tend to be, in particular, illiquid, and the Account may be unable to dispose of such investments at opportune times. |
Valuation and Appraisal Risks:Investments in the Account’s assets are stated at fair value, which is defined as the price that would be received to sell the asset in an orderly transaction between market participants at the measurement date. Determination of fair value, particularly for real estate assets, involves significant judgment. Valuation of the Account’s real estate properties (which comprise a substantial majority of the Account’s net assets) are based on real estate appraisals, which are estimates of property values based on a professional’s opinion and may not be accurate predictors of the amount the Account would actually receive if it sold a property. Appraisals can be subjective in certain respects and rely on a variety of assumptions and conditions at that property or in the market in which the property is located, which may change materially after the appraisal is conducted. Among other things, market prices for comparable real estate may be volatile, in particular if there has been a lack of recent transaction activity in such market. Recent disruptions in the macroeconomy, real estate markets and the credit markets have led to a significant decline in transaction activity in most markets and sectors and the lack of observable transaction data may have made it more difficult for an appraisal to determine the fair value of the Account’s real estate. In addition, a portion of the data used by appraisers is based on historical information at the time the appraisal is conducted, and subsequent changes to such data, after an appraiser has used such data in connection with the appraisal, may not be adequately captured in the appraised value. Also, to the extent that the Account uses a relatively small number of independent appraisers to value a significant portion of its properties, valuations may be subject to any institutional biases of such appraisers and their valuation procedures.
Further, as the Account generally obtains appraisals on a quarterly basis, there may be circumstances in the period between appraisals or interim valuation adjustments in which the true realizable value of a property is not reflected in the Account’s daily net asset value calculation or in the Account’s periodic consolidated financial statements. This disparity may be more apparent when the commercial and/or residential real estate markets experience an overall and possibly dramatic decline (or increase) in property values in a relatively short period of time between appraisals.
If the appraised values of the Account’s properties as a whole are too high, those participants who purchased accumulation units prior to (i) a downward valuation adjustment of a property or multiple properties or (ii) a property or properties being sold for a lower price than the appraised value will be credited with less of an interest than if the value had previously been adjusted downward. Also, those participants who redeem during any such period will have received more than their pro rata share of the value of the Account’s assets, to the detriment of other non-redeeming participants. In particular, appraised property values may prove to be too high (as a whole) in a rapidly declining commercial real estate market. Further, implicit in the Account’s definition of fair value is a principal assumption that there will be a reasonable time to market a given property and that the property will be exchanged between a willing buyer and willing seller in a non-distressed scenario. However, an appraised value may not reflect the actual realizable value that would be obtained in a rush sale where time was of the essence. Also, appraised values may lag actual realizable values to the extent there is significant and rapid economic deterioration in a particular geographic market or a particular sector within a geographic market.
If the appraised values of the Account’s properties as a whole are too low, those participants who redeem prior to (i) an upward valuation adjustment of a property or multiple properties or (ii) a property or properties being sold for a higher price than the appraised value will have received less than their pro rata share of the value of the Account’s assets, and those participants who purchase units during any such period will be credited with more than their pro rata share of the value of the Account’s assets.
Finally, the Account recognizes items of income (such as net operating income from real estate investments, distributions from real estate limited partnerships or joint ventures, or dividends from REIT stocks) and expense in many cases on an intermittent basis, where the Account cannot predict with certainty the
12
magnitude or the timing of such item. As such, even as the Account estimates items of net operating income on a daily basis, the AUV for the Account may fluctuate, perhaps significantly, from day to day, as a result of adjusting these estimates for the actual recognized item of income or expense.
Investment Risk Associated with Participant Transactions:The amount the Account has available to invest in new properties and other real estate-related assets will depend, in large part, on the level of net participant transfers into or out of the Account as well as participant premiums into the Account. As noted elsewhere in this report, the Account intends to hold between 15% and 25% of its net assets in publicly traded liquid investments (other than real estate and real estate-related investments). These liquid assets are intended to be available to purchase real estate-related investments in accordance with the Account’s investment objective and strategy and are also available to meet participant redemption requests and the Account’s expense needs (including, from time to time, obligations on debt). Significant participant transaction activity into or out of the Account’s units is generally not predictable, and wide fluctuations can occur as a result of macroeconomic or geopolitical conditions, the performance of equities or fixed income securities or general investor sentiment, regardless of the historical performance of the Account or of the performance of the real estate asset class generally.
In the second half of 2008 and in 2009, the Account experienced significant net participant transfers out of the Account, eventually causing the Account’s liquid assets to comprise less than 10% of the Account’s assets (on a net and total basis) throughout all of 2009 and into early 2010. Due in large part to this activity, the TIAA liquidity guarantee was initially executed in December 2008. See “Establishing and Managing the Account—The Role of TIAA—Liquidity Guarantee.” Among other things, this continued shortfall in the amount of liquid assets impaired management’s ability to consummate new transactions. If a significant amount of net participant transfers out of the Account were to recur, particularly in high volumes similar to those experienced in late 2008 and 2009, the Account may not have enough available liquid assets to pursue, or consummate, new investment opportunities presented to us that are otherwise attractive to the Account. This, in turn, could harm the Account’s returns. Even though net transfers out of the Account ceased in early 2010 and, as of the date of this report, the Account has been in a net inflow position since such time, there is no guarantee that redemption activity will not increase again, perhaps in a significant and rapid manner.
Alternatively, periods of significant net transfer activity into the Account can result in the Account holding a higher percentage of its net assets in publicly traded liquid non-real estate-related investments than the Account’s managers would target to hold under the Account’s long-term strategy. As of December 31, 2013, the Account’s non-real estate-related liquid assets comprised 18.5% of its net assets. At times, the portion of the Account’s net assets invested in these types of liquid instruments may exceed 25%, particularly if the Account receives a large inflow of money in a short period of time, coupled with a lack of attractive real estate-related investments on the market. Also, large inflows from participant transactions often occur in times of appreciating real estate values and pricing which can render it challenging to execute on some transactions at ideal prices.
In an appreciating real estate market generally, this large percentage of assets held in liquid investments and not in real estate and real estate-related investments may impair the Account’s overall returns. This scenario may be exacerbated in a low interest rate environment for U.S. Treasury securities and related highly liquid securities, such as has existed since 2009 and which may persist in the future. In addition, to manage cash flow, the Account may temporarily hold a higher percentage of its net assets in liquid real estate-related securities, such as REIT and CMBS securities, than its long-term targeted holdings in such securities, particularly during and immediately following times of significant net transfer activity into the Account. Such holdings could increase the volatility of the Account’s returns.
Risks of Borrowing:The Account acquires some of its properties subject to existing financing and from time to time borrows new funds at the time of purchase. Also, the Account may from time to time place new leverage on, increase the leverage already placed on, or refinance maturing debt on, existing properties the Account owns. Under the Account’s current investment guidelines, the Account intends to maintain its loan to value ratio at or below 30% (measured at the time of incurrence and after giving effect thereto). As of December 31, 2013, the Account’s loan to value ratio was approximately 18.4%. Also, the Account may borrow up to 70% of the then-current value of a particular property. Non-construction mortgage loans on a property will be non-recourse to the Account.
Among the risks of borrowing money or otherwise investing in a property subject to a mortgage are:
13
|
• | | | | General Economic Conditions. General economic conditions, dislocations in the capital or credit markets generally or the market conditions then in effect in the real estate finance industry, may hinder the Account’s ability to obtain financing or refinancing for its property investments on favorable terms or at all, regardless of the quality of the Account’s property for which financing or refinancing is sought. Such unfavorable terms might include high interest rates, increased fees and costs and restrictive covenants applicable to the Account’s operation of the property. Longer term disruptions in the capital and credit markets as a result of uncertainty, changing or increased regulation, reduced alternatives, rising interest rates or failures of significant financial institutions could adversely affect our access to financing necessary to make profitable real estate investments. Our failure to obtain financing or refinancing on favorable terms due to the current state of the credit markets or otherwise could have an adverse impact on the returns of the Account. Also, the Account’s ability to secure financing may be impaired if negative marketplace effects, such as those which followed from the worldwide economic slowdown following the banking crisis of 2008 and the subsequent sovereign debt and banking difficulties recently experienced in parts of the Eurozone were to persist. These difficulties could include tighter lending standards instituted by banks and financial institutions, the reduced availability of credit facilities and project finance facilities from banks and the fall of consumer and/or business confidence. |
|
• | | | | Default Risk.The property or group of encumbered properties may not generate sufficient cash flow to support the debt service on the loan, the property may fail to meet certain financial or operating covenants contained in the loan documents and/or the property may have negative equity (i.e., the loan balance exceeds the value of the property) or inadequate equity. In any of these circumstances, we (or a joint venture in which we invest) may default on the loan, including due to the failure to make required debt service payments when due. If a loan is in default, the Account or the venture may determine that it is not economically desirable and/or in the best interests of the Account to continue to make payments on the loan (including accessing other sources of funds to support debt service on the loan), and/or the Account or venture may not be able to otherwise remedy such default on commercially reasonable terms or at all. In either case, the lender then could accelerate the outstanding amount due on the loan and/or foreclose on the underlying property, in which case the Account could lose the value of its investment in the foreclosed property. Further, any such default or acceleration could trigger a default under loan agreements in respect of other Account properties pledged as security for the defaulted loan or other loans. Finally, any such default could increase the Account’s borrowing costs, or result in less favorable terms, with respect to financing future properties. |
|
• | | | | Balloon Maturities.If the Account obtains a mortgage loan that involves a balloon payment, there is a risk that the Account may not be able to make the lump sum principal payment due under the loan at the end of the loan term, or otherwise obtain adequate refinancing on terms commercially acceptable to the Account or at all. The Account then may be forced to sell the property or other properties under unfavorable market conditions, restructure the loan on terms not advantageous to the Account, or default on its mortgage, resulting in the lender exercising its remedies, which may include repossession of the property, and the Account could lose the value of its investment in that property. |
|
• | | | | Variable Interest Rate Risk.If the Account obtains variable-rate loans, the Account’s returns may be volatile when interest rates are volatile. Further, to the extent that the Account takes out fixed-rate loans and interest rates subsequently decline, this may cause the Account to pay interest at above-market rates for a significant period of time. Any interest rate hedging activities the Account engages in to mitigate this risk may not fully protect the Account from the impact of interest rate volatility. |
|
• | | | | Variable Rate Demand Obligation (“VRDO”) Risk. To the extent the Account obtains financing pursuant to a variable rate demand obligation subject to periodic remarketing or similar mechanisms, the Account or the joint ventures in which it invests could face higher borrowing costs if the remarketing results in a higher prevailing interest rate. In addition, the terms of such variable rate obligations may allow the remarketing agent to cause the Account or venture to repay the loan on demand in the event insufficient market demand for such loans is present. In particular, RGM 42, LLC, a joint venture in which the Account holds a 70% interest, is the borrower under a VRDO loan program. |
|
• | | | | Valuation Risk.The market valuation of mortgage loans payable could have an adverse impact on the Account’s performance. Valuations of mortgage loans payable are generally based on the amount at |
14
| | | | which the liability could be transferred in a current transaction, exclusive of transaction costs, and such valuations are subject to a number of assumptions and factors with respect to the loan and the underlying property, a change in any of which could cause the value of a mortgage loan to fluctuate. |
A general disruption in the credit markets, such as the disruption experienced in 2008 and 2009, may aggravate some or all of these risks.
Risks of Joint Ownership:Investing in joint venture partnerships or other forms of joint property ownership may involve special risks, many of which are exacerbated when the consent of parties other than the Account is required to take action.
| | | The co-venturer may have interests or goals inconsistent with those of the Account, including during times when a co-venturer may be experiencing financial difficulty. For example: | | | | a co-venturer may desire a higher current income return on a particular investment than does the Account (which may be motivated by a longer-term investment horizon or exit strategy), or vice versa, which could cause difficulty in managing a particular asset; | |
• | | | | a co-venturer may desire to maximize or minimize leverage in the venture, which may be at odds with the Account’s strategy; |
|
• | | | | a co-venturer may be more or less likely than the Account to agree to modify the terms of significant agreements (including loan agreements) binding the venture, or may significantly delay in reaching a determination whether to do so, each of which may frustrate the business objectives of the Account and/or lead to a default under a loan secured by a property owned by the venture; and |
|
• | | | | for reasons related to its own business strategy, a co-venturer may have different concentration standards as to its investments (geographically, by sector, or by tenant), which might frustrate the execution of the business plan for the joint venture. |
|
• | | | | The co-venturer may be unable to fulfill its obligations (such as to fund its pro rata share of committed capital, expenditures or guarantee obligations of the venture) during the term of such agreement or may become insolvent or bankrupt, any of which could expose the Account to greater liabilities than expected and frustrate the investment objective of the venture. |
|
• | | | | If a co-venturer doesn’t follow the Account’s instructions or adhere to the Account’s policies, the jointly owned properties, and consequently the Account, might be exposed to greater liabilities than expected. |
|
• | | | | The Account may have limited rights with respect to the underlying property pursuant to the terms of the joint venture, including the right to operate, manage or dispose of a property, and a co-venturer could have approval rights over the marketing or the ultimate sale of the underlying property. |
|
• | | | | The terms of the Account’s ventures often provide for complicated agreements which can impede our ability to direct the sale of the property owned by the venture at times the Account views most favorable. One such agreement is a buy-sell right, which may force us to make a decision (either to buy our co- venturer’s interest or sell our interest to our co-venturer) at inopportune times. |
|
• | | | | A co-venturer can make it harder for the Account to transfer its equity interest in the venture to a third party, which could adversely impact the valuation of the Account’s interest in the venture. |
|
• | | | | To the extent the Account serves as the general partner or managing member in a venture, it may owe certain contractual or other duties to the co-venturer, including fiduciary duties, which may present perceived or actual conflicts of interest in the management of the underlying assets. Such an arrangement could also subject the Account to liability to third parties in the performance of its duties as a general partner or managing member. |
Risks of Developing or Redeveloping Real Estate or Buying Recently Constructed Properties:If the Account chooses to develop or redevelop a property or buys a recently constructed property, it may face the following risks:
|
• | | | | There may be delays or unexpected increases in the cost of property development, redevelopment and construction due to strikes, bad weather, material shortages, increases in material and labor costs or other events. |
15
|
• | | | | There are risks associated with potential underperformance or nonperformance by, and/or solvency of a contractor we select or other third party vendors involved in developing or redeveloping the property. |
|
• | | | | If the Account were viewed as developing or redeveloping underperforming properties, suffering losses on our investments, or defaulting on any loans on our properties, our reputation could be damaged. Damage to our reputation could make it more difficult to successfully develop or acquire properties in the future and to continue to grow and expand our relationships with our lenders, venture partners and tenants. |
|
• | | | | Because external factors may have changed from when the project was originally conceived (e.g.,slower growth in the local economy, higher interest rates, overbuilding in the area, or changes in the regulatory and permitting environment), the property may not attract tenants on the schedule we originally planned and/or may not operate at the income and expense levels first projected. |
Risks with Purchase-Leaseback Transactions:To the extent the Account invested in a purchase-leaseback transaction, the major risk is that the third party lessee will be unable to make required payments to the Account. If the leaseback interest is subordinate to other interests in the real property, such as a first mortgage or other lien, the risk to the Account increases because the lessee may have to pay the senior lienholder to prevent foreclosure before it pays the Account. If the lessee defaults or the leaseback is terminated prematurely, the Account might not recover its investment unless the property is sold or leased on favorable terms.
Real Estate Regulatory Risks:Government regulation at the federal, state and local levels, including, without limitation, zoning laws, rent control or rent stabilization laws, laws regulating housing on the Account’s multifamily residential properties, the Americans with Disabilities Act, property taxes and fiscal, accounting, environmental or other government policies, could operate or change in a way that adversely affects the Account and its properties. For example, these regulations could raise the cost of acquiring, owning, improving or maintaining properties, present barriers to otherwise desirable investment opportunities or make it harder to sell, rent, finance, or refinance properties either on economically desirable terms, or at all, due to the increased costs associated with regulatory compliance.
Environmental Risks:The Account may be liable for damage to the environment or injury to individuals caused by hazardous substances used or found on its properties. Under various environmental regulations, the Account may also be liable, as a current or previous property owner or mortgagee, for the cost of removing or cleaning up hazardous substances found on a property, even if it did not know of and wasn’t responsible for the hazardous substances. If any hazardous substances are present or the Account does not properly clean up any hazardous substances, or if the Account fails to comply with regulations requiring it to actively monitor the business activities on its premises, the Account may have difficulty selling or renting a property or be liable for monetary penalties. Further, environmental laws may impose restrictions on the manner in which a property may be used, the tenants which may be allowed, or the manner in which businesses may be operated, which may require the Account to expend funds in order to comply with these laws. These laws may also cause the most ideal use of the property to differ from that originally contemplated and as a result could impair the Account’s returns. The cost of any required cleanup relating to a single real estate investment (including remediating contaminated property) and the Account’s potential liability for environmental damage, including paying personal injury claims and performing under indemnification obligations to third parties, could exceed the value of the Account’s investment in a property, the property’s value, or in an extreme case, a significant portion of the Account’s assets. Finally, while the Account may from time to time acquire third-party insurance related to environmental risks, such insurance coverage may be inadequate to cover the full cost of any loss and would cause the Account to be reliant on the financial health of our third-party insurer at the time any such claim is submitted.
Uninsurable Losses:Certain catastrophic losses (e.g.,from earthquakes, wars, terrorist acts, nuclear accidents, hurricanes, wind, floods or environmental or industrial hazards or accidents) may be uninsurable or so expensive to insure against that it is economically disadvantageous to buy insurance for them. Further, the terms and conditions of the insurance coverage the Account has on its properties, in conjunction with the type of loss actually suffered at a property, may subject the property, or the Account as a whole, to a cap on insurance proceeds that is less than the loss or losses suffered. If a disaster that we have not insured against occurs, if the insurance contains a high deductible, and/or if the aggregate insurance proceeds for a particular type of casualty are capped, the Account could lose some of its original investment and any future profits
16
from the property. Also, the Account may not have sufficient access to internal or external sources of funding to repair or reconstruct a damaged property to the extent insurance proceeds do not cover the full loss. In addition, some leases may permit a tenant to terminate its obligations in certain situations, regardless of whether those events are fully covered by insurance. In that case, the Account would not receive rental income from the property while that tenant’s space is vacant, and any such vacancy might impact the value of that property. Finally, as with respect to all third-party insurance, we are reliant on the continued financial health of such insurers and their ability to pay on valid claims. If the financial health of an insurer were to deteriorate quickly, we may not be able to find adequate coverage from another carrier on favorable terms, which could adversely impact the Account’s returns.
RISKS OF INVESTING IN REAL ESTATE INVESTMENT TRUST SECURITIES
The Account invests in REIT securities for diversification, liquidity management and other purposes. The Account’s investment in REITs may also increase, as a percentage of net assets, during periods in which the Account is experiencing large net inflow activity, in particular due to net participant transfers into the Account. As of December 31, 2013, REIT securities comprised approximately 8.9% of the Account’s net assets. Investments in REIT securities are part of the Account’s real estate-related investment strategy and are subject to many of the same general risks associated with direct real property ownership. In particular, equity REITs may be affected by changes in the value of the underlying properties owned by the entity, while mortgage REITs may be affected by the quality of any credit extended. In addition to these risks, because REIT investments are securities and generally publicly traded, they may be exposed to market risk and potentially significant price volatility due to changing conditions in the financial markets and, in particular, changes in overall interest rates, regardless of the value of the underlying real estate such REIT may own. Also, sales of REIT securities by the Account for liquidity management purposes may occur at times when values of such securities have declined and it is otherwise an inopportune time to sell the security. Volatility in REITs can cause significant fluctuations in the Account’s AUV on a daily basis, as they are correlated to equity markets which have experienced significant day to day fluctuations over the past few years.
REITs do not pay federal income taxes if they distribute most of their earnings to their shareholders and meet other tax requirements. Many of the requirements to qualify as a REIT, however, are highly technical and complex. Failure to qualify as a REIT results in tax consequences, as well as disqualification from operating as a REIT for a period of time. Consequently, if the Account invests in securities of a REIT that later fails to qualify as a REIT, this may adversely affect the performance of our investment.
RISKS OF MORTGAGE-BACKED SECURITIES
The Account from time to time has invested in mortgage-backed securities and may in the future invest in such securities. Mortgage-backed securities, such as CMBS, are subject to many of the same general risks inherent in real estate investing, making mortgage loans and investing in debt securities. The underlying mortgage loans may experience defaults with greater frequency than projected when such mortgages were underwritten, which would impact the values of these securities, and could hamper our ability to sell such securities. In particular, these types of investments may be subject to prepayment risk or extension risk (i.e., the risk that borrowers will repay the loans earlier or later than anticipated). If the underlying mortgage assets experience faster than anticipated prepayments of principal, the Account could fail to recoup some or all of its initial investment in these securities, since the original price paid by the Account was based in part on assumptions regarding the receipt of interest payments. If the underlying mortgage assets are repaid later than anticipated, the Account could lose the opportunity to reinvest the anticipated cash flows at a time when interest rates might be rising. The rate of prepayments depends on a variety of geographic, social and other functions, including prevailing market interest rates and general economic factors. Further, it is possible that the U.S. Government may change its support of, and policies regarding, Fannie Mae and Freddie Mac and, thus, the Account may be unable to acquire agency mortgage-backed securities in the future and even if the Account so acquired them, such changes may result in a negative effect on the pricing of such securities. Other policy changes impacting Fannie Mae and Freddie Mac and/or U.S. Government programs related to mortgages that may be implemented in the future could create market uncertainty and affect the actual or perceived credit quality of issued securities, adversely affecting mortgage-backed securities through an increased risk of loss.
17
Importantly, the fair market value of these securities is also highly sensitive to changes in interest rates, liquidity of the secondary market and economic conditions impacting financial institutions and the credit markets generally. Note that the potential for appreciation, which could otherwise be expected to result from a decline in interest rates, may be limited by any increased prepayments. Further, volatility and disruption in the mortgage market and credit markets generally (such as was the case in 2008 and 2009) may cause there to be a very limited or even no secondary market for these securities and they therefore may be harder to sell than other securities.
RISKS OF U.S. GOVERNMENT AGENCY SECURITIES AND CORPORATE OBLIGATIONS
The Account invests in securities issued by U.S. government agencies and U.S. government-sponsored entities. Some of these issuers may not have their securities backed by the full faith and credit of the U.S. government, which could adversely affect the pricing and value of such securities. Also, the Account may invest in corporate obligations (such as commercial paper) and while the Account seeks out such holdings in short-term, higher-quality liquid instruments, the ability of the Account to sell these securities may be uncertain, particularly when there are general dislocations in the finance or credit markets. Any such volatility could have a negative impact on the value of these securities. Further, transaction activity may fluctuate significantly from time to time, which could impair the Account’s ability to dispose of a security at a favorable time, regardless of the credit quality of the underlying issuer. Also, inherent with investing in any corporate obligation is the risk that the credit quality of the issuer will deteriorate, which could cause the obligations to be downgraded and hamper the value or the liquidity of these securities. Finally, any further downgrades or threatened downgrades of the credit rating for U.S. government obligations generally could impact the pricing and liquidity of agency securities or corporate obligations in a manner which could impact the value of the Account’s units.
RISKS OF LIQUID INVESTMENTS
The Account’s investments in liquid investments (whether real estate-related, such as REITs, CMBS or some mortgage loans receivable, or non-real estate-related, such as cash equivalents and government securities, and whether debt or equity), are subject to the following general risks:
| | | Financial / Credit Risk—The risk, for debt securities, that the issuer will not be able to pay principal and interest when due (and/or declare bankruptcy or be subject to receivership) and, for equity securities such as common or preferred stock, that the issuer’s current earnings will fall or that its overall financial soundness will decline, reducing the security’s value. | |
• | | | | Market Volatility Risk—The risk that the Account’s investments will experience price volatility due to changing conditions in the financial markets even regardless of the credit quality or financial condition of the underlying issuer. This risk is particularly acute to the extent the Account holds equity securities, which have experienced significant short-term price volatility in recent years. Also, to the extent the Account holds debt securities, changes in overall interest rates can cause price fluctuations. |
|
• | | | | Interest Rate Volatility—The risk that interest rate volatility may affect the Account’s current income from an investment. As interest rates rise, the value of certain debt securities (such as those bearing lower fixed rates) held by the Account is likely to decrease. As of the date of this report, interest rates in the United States are at or near historic lows, which may increase the Account’s exposure to risks associated with rising interest rates. |
|
• | | | | Deposit / Money Market Risk—The risk that, to the extent the Account’s cash held in bank deposit accounts exceeds federally insured limits as to that bank, the Account could experience losses if banks fail. In addition, there is some risk that investments held in money market accounts or funds can suffer losses. |
Further, to the extent that a significant portion of the Account’s net assets at any particular time are comprised of cash, cash equivalents and non-real estate-related liquid securities, the Account’s returns may suffer as compared to the return that could have been generated by more profitable real estate-related investments. Such a potential negative impact on returns may be exacerbated in times of low prevailing interest rates payable on many classes of liquid securities, such as is the case as of the date hereof and which may persist in the future.
18
RISKS OF FOREIGN INVESTMENTS
In addition to other investment risks noted above, foreign investments present the following special risks:
|
• | | | | The value of foreign investments or rental income can increase or decrease due to changes in currency rates, currency exchange control regulations, possible expropriation or confiscatory taxation, political, social, and economic developments and foreign regulations. The Account translates into U.S. dollars purchases and sales of securities, income receipts and expense payments made in foreign currencies at the exchange rates prevailing on the respective dates of the transactions. The effect of any changes in currency exchange rates on investments and mortgage loans payable is included in the Account’s net realized and unrealized gains and losses. As such, fluctuations in currency exchange rates may impair the Account’s returns. |
|
• | | | | The Account may, but is not required to, hedge its exposure to changes in currency rates, which could involve extra costs. Further, any hedging activities might not be successful. Such hedges may also be subject to valuation changes. In addition, a lender to a foreign property owned by the Account could require the Account to compensate it for its loss associated with such lender’s hedging activities. |
|
• | | | | Non-U.S. jurisdictions may impose taxes on the Account as a result of its investment activity in that jurisdiction. TIAA may be eligible for a foreign tax credit in respect of such tax paid by the Account and such credit (if available to TIAA) would be reimbursed to the Account. However, there may be circumstances where TIAA is unable to receive some or all of the benefit of a foreign tax credit and the Account would thus not receive reimbursement, which could harm the value of the Account’s units. |
|
• | | | | Foreign real estate markets may have different liquidity and volatility attributes than U.S. markets. |
|
• | | | | The regulatory environment in non-U.S. jurisdictions may disfavor owners and operators of real estate investment properties, resulting in less predictable and/or economically harmful outcomes if the Account were to face a significant dispute with a tenant or with a regulator itself. |
|
• | | | | The Account may be subject to increased risk of regulatory scrutiny pursuant to U.S. federal statutes, such as the Foreign Corrupt Practices Act, which, among other things, requires robust compliance and oversight programs to help prevent violations. The costs associated with maintaining such programs, in addition to costs associated with a potential regulatory inquiry, could impair the Account’s returns and divert management’s attention from other Account activities. |
|
• | | | | It may be more difficult to obtain and collect a judgment on foreign investments than on domestic investments, and the costs associated with contesting claims relating to foreign investments may exceed those costs associated with a similar claim on domestic investments. |
|
• | | | | We may invest from time to time in securities issued by (1) entities domiciled in foreign countries, (2) domestic affiliates of such entities and/or (3) foreign domiciled affiliates of domestic entities. Such investments could be subject to the risks associated with investments subject to foreign regulation, including political unrest or the repatriation or nationalization of the issuer’s assets. These events could depress the value of such securities and/or make such securities harder to sell on favorable terms, if at all. |
RISKS OF INVESTING IN MORTGAGE LOANS AND RELATED INVESTMENTS
The Account’s investment strategy includes, to a limited extent, investments in mortgage loans (i.e., the Account serving as lender).
|
• | | | | General Risks of Mortgage Loans.The Account will be subject to the risks inherent in making mortgage loans, including: |
| | | The borrower may default on the loan, requiring that the Account foreclose on the underlying property to protect the value of its mortgage loan. Since its mortgage loans are usually non-recourse, the Account must rely solely on the value of a property for its security. | |
• | | | | The larger the mortgage loan compared to the value of the property securing it, the greater the loan’s risk. Upon default, the Account may not be able to sell the property for its estimated or appraised |
19
| | | | value. Also, certain liens on the property, such as mechanic’s or tax liens, may have priority over the Account’s security interest. |
|
• | | | | A deterioration in the financial condition of tenants, which could be caused by general or local economic conditions or other factors beyond the control of the Account, or the bankruptcy or insolvency of a major tenant, may adversely affect the income of a property, which could increase the likelihood that the borrower will default under its obligations. |
|
• | | | | The borrower may be unable to make a lump sum principal payment due under a mortgage loan at the end of the loan term, unless it can refinance the mortgage loan with another lender. |
|
• | | | | If interest rates are volatile during the loan period, the Account’s variable-rate mortgage loans could have volatile yields. Further, to the extent the Account makes mortgage loans with fixed interest rates, it may receive lower yields than that which is then available in the market if interest rates rise generally. |
|
• | | | | Prepayment Risks.The Account’s mortgage loan investments will usually be subject to the risk that the borrower repays a loan early. Also, the Account may be unable to reinvest the proceeds at as high an interest rate as the original mortgage loan rate. |
|
• | | | | Interest Limitations.The interest rate we charge on mortgage loans may inadvertently violate state usury laws that limit rates, if, for example, state law changes during the loan term. If this happens, the Account could incur penalties or may be unable to enforce payment of the loan. |
|
• | | | | Risks of Investing in Mezzanine Loans. The Account may invest from time to time in mezzanine loans to entities which own real estate assets. Generally these loans will be secured by a pledge of the equity securities of the entity, but not by a first lien security interest in the property itself. As such, the Account’s recovery in the event of an adverse circumstance at the property (such as a default under a mortgage loan on the property) will be subordinated to the recovery available to the first lien mortgage lender(s) to the property. Also, as a subordinated lender, the Account may have limited rights to exercise control over the process by which the mortgage loan is restructured or the property is liquidated following a default. Any of these circumstances may result in the Account being unable to recover some or all of its original investment. |
|
• | | | | Risks of Participations.To the extent the Account invested in a participating mortgage, the following additional risks would apply: |
|
• | | | | The participation feature, in tying the Account’s returns to the performance of the underlying asset, might generate insufficient returns to make up for the higher interest rate the loan would have obtained without the participation feature. |
|
• | | | | In very limited circumstances, a court may characterize the Account’s participation interest as a partnership or joint venture with the borrower and the Account could lose the priority of its security interest or become liable for the borrower’s debts. |
CONFLICTS OF INTEREST WITHIN TIAA
General. TIAA and its affiliates (including TIAA-CREF Alternatives Advisors, LLC and Teachers Advisors, Inc., its wholly owned subsidiaries and registered investment advisers) have interests in other real estate programs and accounts and also engage in other business activities and as such, they will have conflicts of interest in allocating their time between the Account’s business and these other activities. Also, the Account may be buying properties at the same time as TIAA affiliates that may have similar investment objectives to those of the Account. There is also a risk that TIAA will choose a property that provides lower returns to the Account than a property purchased by TIAA and its affiliates. Further, the Account will likely acquire properties in geographic areas where TIAA and its affiliates own or manage properties. In addition, the Account may desire to sell a property at the same time another TIAA affiliate is selling a property in an overlapping market. Conflicts could also arise because some properties owned or managed by TIAA and its affiliates may compete with the Account’s properties for tenants. Among other things, if one of the TIAA entities attracts a tenant that the Account is competing for, the Account could suffer a loss of revenue due to delays in locating another suitable tenant. TIAA has adopted allocation policies and procedures applicable to the purchasing conflicts scenario, but the resolution of such conflicts may be economically disadvantageous to
20
the Account. As a result of TIAA’s and its affiliates’ obligations to TIAA itself and to other current and potential investment vehicles sponsored by TIAA affiliates with similar objectives to those of the Account, there is no assurance that the Account will be able to take advantage of every attractive investment opportunity that otherwise is in accordance with the Account’s investment objectives.
Liquidity Guarantee.In addition, as discussed elsewhere in this report, the TIAA General Account provides a liquidity guarantee to the Account. While an independent fiduciary is responsible for establishing a “trigger point” (a percentage of TIAA’s ownership of liquidity units beyond which TIAA’s ownership may be reduced at the fiduciary’s direction), there is no express cap on the amount TIAA may be obligated to fund under this guarantee. Further, the Account’s independent fiduciary oversees any redemption of TIAA liquidity units. TIAA’s ownership of liquidity units (including the potential for changes in its levels of ownership in the future) from time to time could result in the perception that TIAA is taking into account its own economic interests while serving as investment manager for the Account. In particular, the value of TIAA’s liquidity units fluctuates in the same manner as the value of accumulation units held by all participants. Any perception of a conflict of interest could cause participants to transfer accumulations out of the Account to another investment option, which could have an adverse impact on the Account’s ability to act most optimally upon its investment strategy. For a discussion of the relevant allocation policies and procedures TIAA has established as well as a summary of other conflicts of interest which may arise as a result of TIAA’s management of the Account, see “Establishing and Managing the Account—the Role of TIAA—Conflicts of Interest.”
NO OPPORTUNITY FOR PRIOR REVIEW OF TRANSACTIONS
Investors do not have the opportunity to evaluate the economic or financial merit of the purchase, sale or financing of a property or other investment before the Account completes the transaction, so investors will need to rely solely on TIAA’s judgment and ability to select investments consistent with the Account’s investment objective and policies. Further, the Account may change its investment objective and pursue specific investments in accordance with any such amended investment objective without the consent of the Account’s investors.
RISKS OF REGISTRATION UNDER THE INVESTMENT COMPANY ACT OF 1940
The Account has not registered, and management intends to continue to operate the Account so that it will not have to register, as an “investment company” under the Investment Company Act of 1940, as amended (the “Investment Company Act”). Generally, a company is an “investment company” and required to register under the Investment Company Act if, among other things, it holds itself out as being engaged primarily, or proposes to engage primarily, in the business of investing, reinvesting or trading in securities, or it is engaged or proposes to engage in the business of investing, reinvesting, owning, holding or trading in securities and owns or proposes to acquire investment securities having a value exceeding 40% of the value of such company’s total assets (exclusive of government securities and cash items) on an unconsolidated basis.
If the Account were obligated to register as an investment company, the Account would have to comply with a variety of substantive requirements under the Investment Company Act that impose, among other things, limitations on capital structure, restrictions on certain investments, compliance with reporting, record keeping, voting and proxy disclosure requirements and other rules and regulations that could significantly increase its operating expenses and reduce its operating flexibility. To maintain compliance with the exemptions from the Investment Company Act, the Account may be unable to sell assets it would otherwise want to sell and may be unable to purchase securities it would otherwise want to purchase, which might materially adversely impact the Account’s performance.
21
ITEM 1B. UNRESOLVED STAFF COMMENTS.
Not applicable.
ITEM 2. PROPERTIES.
THE PROPERTIES—IN GENERAL
In the table below, participants will find general information about each of the Account’s property investments as of December 31, 2013. The Account’s property investments include both properties that are wholly owned by the Account and properties owned by the Account’s joint venture investments. Certain investments are comprised of a portfolio of properties. The Account calculates the percent leased or vacant as a percentage of a property’s net rentable square footage that is under contractual lease obligation in effect at the end of the period. Please carefully read the footnotes to these tables, which immediately follow.
OFFICE PROPERTIES
| | | | | | | | | | | | | | |
Property | | Location | | Year
Built | | Year
Purchased | | Rentable
Area
(Sq. ft.)(1) | | Percent
Leased | | Annual Avg.
Base Rent
Per Leased
Sq. Ft.(2) | | Fair
Value(3)
(in millions) |
1001 Pennsylvania Ave | | Washington, D.C. | | 1987 | | 2004 | | | | 772,842 | | | | | 93% | | | | $ | | 36.53 | | | | $ | | 726.7 | (4) | |
50 Fremont Street | | San Francisco, CA | | 1983 | | 2004 | | | | 817,412 | | | | | 76% | | | | | 34.47 | | | | | 518.0 | (4) | |
99 High Street | | Boston, MA | | 1971 | | 2005 | | | | 731,710 | | | | | 83% | | | | | 45.27 | | | | | 438.0 | (4) | |
Fourth & Madison | | Seattle, WA | | 2002 | | 2004 | | | | 845,533 | | | | | 92% | | | | | 29.26 | | | | | 435.0 | (4) | |
780 Third Avenue | | New York, NY | | 1984 | | 1999 | | | | 487,598 | | | | | 87% | | | | | 57.49 | | | | | 365.2 | (4) | |
501 Boylston Street | | Boston, MA | | 1940-1961 | | 2006 | | | | 607,438 | | | | | 100% | | | | | 33.39 | | | | | 364.1 | |
1900 K Street NW | | Washington, D.C. | | 1996 | | 2004 | | | | 344,022 | | | | | 78% | | | | | 42.72 | | | | | 287.3 | |
Four Oaks Place LP(14) | | Houston, TX | | 1983 | | 2012 | | | | 1,738,585 | | | | | 97% | | | | | 20.12 | | | | | 275.9 | |
701 Brickell Avenue | | Miami, FL | | 1986 | | 2002 | | | | 677,667 | | | | | 93% | | | | | 38.78 | | | | | 271.3 | |
Lincoln Centre | | Dallas, TX | | 1984 | | 2005 | | | | 1,625,465 | | | | | 89% | | | | | 20.75 | | | | | 267.7(4 | ) | |
Colorado Center(6) | | Santa Monica, CA | | 1984 | | 2004 | | | | 1,104,381 | | | | | 96% | | | | | 46.06 | | | | | 261.3 | |
275 Battery Street | | San Francisco, CA | | 1988 | | 2005 | | | | 475,138 | | | | | 86% | | | | | 42.29 | | | | | 251.4 | |
1401 H Street NW | | Washington, D.C. | | 1992 | | 2006 | | | | 350,787 | | | | | 99% | | | | | 46.84 | | | | | 231.8 | (4) | |
One Boston Place(7) | | Boston, MA | | 1970 | | 2002 | | | | 804,444 | | | | | 90% | | | | | 51.48 | | | | | 208.3 | |
Wilshire Rodeo Plaza | | Beverly Hills, CA | | 1935, 1984 | | 2006 | | | | 245,869 | | | | | 80% | | | | | 62.66 | | | | | 181.1 | (4) | |
Ten & Twenty Westport Road | | Wilton, CT | | 1974, 2001 | | 2001 | | | | 531,606 | | | | | 99% | | | | | 22.57 | | | | | 150.0 | |
Millennium Corporate Park | | Redmond, WA | | 1999, 2000 | | 2006 | | | | 536,884 | | | | | 81% | | | | | 12.86 | | | | | 149.0 | |
88 Kearny Street | | San Francisco, CA | | 1986 | | 1999 | | | | 228,359 | | | | | 82% | | | | | 38.68 | | | | | 111.8 | |
Urban Centre | | Tampa, FL | | 1984, 1987 | | 2005 | | | | 549,085 | | | | | 80% | | | | | 27.43 | | | | | 107.6 | |
The Ellipse at Ballston | | Arlington, VA | | 1989 | | 2006 | | | | 195,743 | | | | | 87% | | | | | 38.20 | | | | | 85.3 | |
Pacific Plaza | | San Diego, CA | | 2000, 2002 | | 2007 | | | | 217,890 | | | | | 100% | | | | | 29.71 | | | | | 82.0 | |
West Lake North Business Park | | Westlake Village, CA | | 2000 | | 2004 | | | | 197,366 | | | | | 82% | | | | | 27.83 | | | | | 48.7 | |
Parkview Plaza | | Oakbrook, IL | | 1990 | | 1997 | | | | 264,162 | | | | | 71% | | | | | 13.66 | | | | | 45.6 | |
8270 Greensboro Drive | | McLean, VA | | 2000 | | 2005 | | | | 158,110 | | | | | 98% | | | | | 28.99 | | | | | 41.8 | |
3 Hutton Centre Drive | | Santa Ana, CA | | 1985 | | 2003 | | | | 198,217 | | | | | 82% | | | | | 21.06 | | | | | 41.3 | |
Camelback Center | | Phoenix, AZ | | 2001 | | 2007 | | | | 232,615 | | | | | 84% | | | | | 23.63 | | | | | 38.6 | |
North 40 Office Complex | | Boca Raton, FL | | 1983, 1984 | | 2006 | | | | 349,999 | | | | | 61% | | | | | 10.57 | | | | | 27.8 | |
| | | | | | | | | | | | | | |
Subtotal—Office Properties | | | | | | | | | | | | 89% | | | | | | $ | | 6,012.6 | |
| | | | | | | | | | | | | | |
| | | | | | | | | | | | | | |
22
| | | | | | | | | | | | | | |
Property | | Location | | Year
Built | | Year
Purchased | | Rentable
Area
(Sq. ft.)(1) | | Percent
Leased | | Annual Avg.
Base Rent
Per Leased
Sq. Ft.(2) | | Fair
Value(3)
(in millions) |
INDUSTRIAL PROPERTIES | | | | | | |
Ontario Industrial Portfolio | | Various, CA | | 1997-1998 | | 1998, 2000, 2004 | | | | 3,981,894 | | | | | 100% | | | | $ | | 3.61 | | | | $ | | 329.2 | |
Dallas Industrial Portfolio | | Dallas and Coppell, TX | | 1997-2001 | | 2000-2002 | | | | 3,684,941 | | | | | 98% | | | | | 3.08 | | | | | 176.9 | |
Rancho Cucamonga Industrial Portfolio | | Rancho Cucamonga, CA | | 2000-2002 | | 2000, 2001, 2002, 2004 | | | | 1,490,235 | | | | | 100% | | | | | 4.04 | | | | | 124.4 | |
Great West Industrial Portfolio | | Rancho Cucamonga and Fontana, CA | | 2004-2005 | | 2008 | | | | 1,358,925 | | | | | 100% | | | | | 4.44 | | | | | 119.0 | |
Southern CA RA Industrial Portfolio | | Los Angeles, CA | | 1982 | | 2004 | | | | 920,078 | | | | | 62% | | | | | 4.95 | | | | | 88.6 | |
Rainier Corporate Park | | Fife, WA | | 1991-1997 | | 2003 | | | | 1,104,399 | | | | | 88% | | | | | 4.24 | | | | | 86.5 | |
Cerritos Industrial Park | | Cerritos, CA | | 1970-1977 | | 2012 | | | | 934,213 | | | | | 88% | | | | | 4.89 | | | | | 86.4 | |
Weston Business Center | | Weston, FL | | 1998-1999 | | 2011 | | | | 679,918 | | | | | 96% | | | | | 7.42 | | | | | 85.5 | |
Mohawk Distribution Center | | Teterboro, NJ | | 1958-1974 | | 2013 | | | | 616,992 | | | | | 100% | | | | | 7.60 | | | | | 78.0 | |
Seneca Industrial Park | | Pembroke Park, FL | | 1999-2001 | | 2007 | | | | 882,182 | | | | | 67% | | | | | 5.61 | | | | | 73.8 | |
Regal Logistics Campus | | Seattle, WA | | 1999-2004 | | 2005 | | | | 968,535 | | | | | 100% | | | | | 3.68 | | | | | 73.4 | |
Chicago Industrial Portfolio | | Chicago and Joliet, IL | | 1997-2000 | | 1998, 2000 | | | | 1,427,687 | | | | | 91% | | | | | 3.63 | | | | | 66.7 | |
Chicago Caleast Industrial Portfolio(9) | | Chicago, IL | | 1974-2005 | | 2003 | | | | 1,145,152 | | | | | 94% | | | | | 3.92 | | | | | 62.7 | |
Shawnee Ridge Industrial Portfolio | | Atlanta, GA | | 2000-2005 | | 2005 | | | | 1,422,922 | | | | | 84% | | | | | 3.31 | | | | | 61.4 | |
South River Road Industrial | | Cranbury, NJ | | 1999 | | 2001 | | | | 858,957 | | | | | 100% | | | | | 4.47 | | | | | 54.7 | |
Northern CA RA Industrial Portfolio | | Oakland, CA | | 1981 | | 2004 | | | | 657,602 | | | | | 99% | | | | | 4.49 | | | | | 47.3 | |
Pinnacle Industrial Portfolio | | Grapevine, TX | | 2003, 2004, 2006 | | 2006 | | | | 899,200 | | | | | 100% | | | | | 3.38 | | | | | 44.1 | |
Atlanta Industrial Portfolio | | Lawrenceville, GA | | 1996-1999 | | 2000 | | | | 1,295,440 | | | | | 27% | | | | | 3.07 | | | | | 42.5 | |
Pacific Corporate Park | | Fife, WA | | 2006 | | 2012 | | | | 388,783 | | | | | 100% | | | | | 4.95 | | | | | 35.8 | |
Centre Pointe and Valley View | | Los Angeles County, CA | | 1965-1989 | | 2004 | | | | 307,685 | | | | | 85% | | | | | 5.90 | | | | | 31.9 | |
Northeast RA Industrial Portfolio | | Boston, MA | | 2000 | | 2004 | | | | 384,126 | | | | | 100% | | | | | 5.02 | | | | | 29.6 | |
Northwest RA Industrial Portfolio | | Seattle, WA | | 1996 | | 2004 | | | | 312,321 | | | | | 95% | | | | | 5.14 | | | | | 27.1 | |
Konica Photo Imaging Headquarters | | Mahwah, NJ | | 1999 | | 1999 | | | | 168,000 | | | | | 100% | | | | | 8.36 | | | | | 20.4 | |
Summit Distribution Center | | Memphis, TN | | 2002 | | 2003 | | | | 708,532 | | | | | 0% | | | | | N/A | | | | | 17.0 | |
IDI Nationwide Industrial Portfolio | | Various, U.S. | | 1999-2004 | | 2004 | | | | N/A | | | | | N/A | | | | | N/A | | | | | 0.6 | (13) | |
| | | | | | | | | | | | | | |
Subtotal—Industrial Properties | | | | | | 88% | | | | | | $ | | 1,863.5 | |
| | | | | | | | | | | | | | |
RETAIL PROPERTIES | | | | | | | | | | | | | | |
The Florida Mall(9) | | Orlando, FL | | 1986 | | 2002 | | | | 1,146,291 | | | | | 99% | | | | $ | | 41.83 | | | | $ | | 490.9 | |
DDR Joint Venture(8) | | Various, U.S. | | Various | | 2007 | | | | 9,148,980 | | | | | 93% | | | | | 11.99 | | | | | 413.7 | |
Printemps de L’Homme | | Paris, FR | | 1930 | | 2007 | | | | 130,266 | | | | | 100% | | | | | 90.65 | | | | | 226.9 | (5) | |
Miami International Mall(9) | | Miami, FL | | 1982 | | 2002 | | | | 306,357 | | | | | 95% | | | | | 44.19 | | | | | 196.4 | |
23
| | | | | | | | | | | | | | |
Property | | Location | | Year
Built | | Year
Purchased | | Rentable
Area
(Sq. ft.)(1) | | Percent
Leased | | Annual Avg.
Base Rent
Per Leased
Sq. Ft.(2) | | Fair
Value(3)
(in millions) |
The Forum at Carlsbad | | Carlsbad, CA | | 2003 | | 2011 | | | | 262,687 | | | | | 99% | | | | $ | | 31.43 | | | | $ | | 192.9 | (4) | |
Florida Retail Portfolio(10) | | Various, FL | | 1974-2005 | | 2006 | | | | 831,636 | | | | | 89% | | | | | 15.53 | | | | | 119.3 | |
Valencia Town Center(17) | | Valencia, CA | | 1991 | | 2012 | | | | 1,055,382 | | | | | 95% | | | | | 17.97 | | | | | 113.5 | |
The Shops at Wisconsin Place | | Chevy Chase, MD | | 2007-2010 | | 2012 | | | | 117,842 | | | | | 99% | | | | | 52.17 | | | | | 113.0 | (15) | |
Westwood Marketplace | | Los Angeles, CA | | 1950 | | 2002 | | | | 202,202 | | | | | 83% | | | | | 25.80 | | | | | 108.0 | |
Marketfair | | West Windsor, NJ | | 1987 | | 2006 | | | | 244,900 | | | | | 82% | | | | | 27.16 | | | | | 84.7 | |
Charleston Plaza | | Mountain View, CA | | 2006 | | 2012 | | | | 132,590 | | | | | 100% | | | | | 34.38 | | | | | 82.0 | (4) | |
Mazza Gallerie | | Washington, D.C. | | 1975 | | 2004 | | | | 294,112 | | | | | 90% | | | | | 13.45 | | | | | 80.2 | |
West Town Mall(9) | | Knoxville, TN | | 1972 | | 2002 | | | | 954,150 | | | | | 97% | | | | | 19.18 | | | | | 77.8 | |
South Denver Marketplace | | Denver, CO | | 1996-1998 | | 2013 | | | | 261,135 | | | | | 100% | | | | | 15.59 | | | | | 69.9 | |
Publix at Weston Commons | | Weston, FL | | 2005 | | 2006 | | | | 126,922 | | | | | 100% | | | | | 26.45 | | | | | 55.0 | (4) | |
Northpark Village Square | | Valencia, CA | | 1996 | | 2011 | | | | 87,094 | | | | | 94% | | | | | 26.84 | | | | | 40.8 | |
1619 Walnut Street | | Philadelphia, PA | | 1937-2013 | | 2013 | | | | 34,047 | | | | | 100% | | | | | 38.26 | | | | | 19.0 | |
Suncrest Village Shopping Center | | Orlando, FL | | 1987 | | 2005 | | | | 93,358 | | | | | 79% | | | | | 11.21 | | | | | 13.5 | |
Plantation Grove | | Ocoee, FL | | 1995 | | 1995 | | | | 73,655 | | | | | 100% | | | | | 12.09 | | | | | 12.5 | |
| | | | | | | | | | | | | | |
Subtotal—Retail Properties | | | | | | 94% | | | | | | $ | | 2,510.0 | |
| | | | | | | | | | | | | | |
OTHER COMMERCIAL PROPERTIES | | | | | | | | |
425 Park Avenue(11) | | New York, NY | | N/A | | 2011 | | | | N/A | | | | | 100% | | | | | N/A | | | | $ | | 400.0 | |
Storage Portfolio(12) | | Various, U.S. | | 1972-1990 | | 2003 | | | | 1,684,275 | | | | | 91% | | | | | 16.14 | | | | | 101.6 | |
Four Oaks Place—Land Development | | Houston, TX | | 1983 | | 2004 | | | | N/A | | | | | N/A | | | | | N/A | | | | | 64.3 | |
| | | | | | | | | | | | | | |
Subtotal—Other Commercial Properties | | | | | | | | | $ | | 565.9 | |
| | | | | | | | | | | | | | |
Subtotal—Commercial Properties | | | | 90% | | | | | | $ | | 10,952.0 | |
| | | | | | | | | | | | | | |
RESIDENTIAL PROPERTIES | | | | | | | | |
MiMA(16) | | New York, NY | | 2010 | | 2012 | | | | N/A | | | | | 95% | | | | | N/A | | | | $ | | 290.4 | |
Palomino Park | | Highlands Ranch, CO | | 1996-2001 | | 2005 | | | | N/A | | | | | 95% | | | | | N/A | | | | | 264.3 | (4) | |
Houston Apartment Portfolio | | Houston, TX | | 1984-2004 | | 2006 | | | | N/A | | | | | 94% | | | | | N/A | | | | | 263.2 | |
The Corner | | New York, NY | | 2010 | | 2011 | | | | N/A | | | | | 97% | | | | | N/A | | | | | 230.0 | (4) | |
The Colorado | | New York, NY | | 1987 | | 1999 | | | | N/A | | | | | 94% | | | | | N/A | | | | | 190.3 | (4) | |
Mass Court | | Washington, D.C. | | 2004 | | 2012 | | | | N/A | | | | | 96% | | | | | N/A | | | | | 170.3 | (4) | |
Stella | | Marina Del Rey, CA | | 2013 | | 2013 | | | | N/A | | | | | 77% | | | | | N/A | | | | | 168.5 | |
The Palatine | | Arlington, VA | | 2008 | | 2011 | | | | N/A | | | | | 94% | | | | | N/A | | | | | 130.0 | (4) | |
The Legacy at Westwood | | Los Angeles, CA | | 2001 | | 2002 | | | | N/A | | | | | 91% | | | | | N/A | | | | | 126.0 | (4) | |
Holly Street Village | | Pasadena, CA | | 1997 | | 2013 | | | | N/A | | | | | 94% | | | | | N/A | | | | | 124.0 | |
Kierland Apartment Portfolio | | Scottsdale, AZ | | 1996-2000 | | 2006 | | | | N/A | | | | | 94% | | | | | N/A | | | | | 119.0 | (4) | |
Ashford Meadows Apartments | | Herndon, VA | | 1998 | | 2000 | | | | N/A | | | | | 92% | | | | | N/A | | | | | 105.6 | (4) | |
Larkspur Courts | | Larkspur, CA | | 1991 | | 1999 | | | | N/A | | | | | 93% | | | | | N/A | | | | | 96.4 | |
Residence at Rivers Edge | | Medford, MA | | 2009 | | 2011 | | | | N/A | | | | | 93% | | | | | N/A | | | | | 87.6 | |
Oceano at Warner Center | | Woodland Hill, CA | | 2012 | | 2013 | | | | N/A | | | | | 95% | | | | | N/A | | | | | 87.3 | |
Circa Green Lake | | Seattle, WA | | 2009 | | 2012 | | | | N/A | | | | | 93% | | | | | N/A | | | | | 85.0 | |
24
| | | | | | | | | | | | | | |
Property | | Location | | Year
Built | | Year
Purchased | | Rentable
Area
(Sq. ft.)(1) | | Percent
Leased | | Annual Avg.
Base Rent
Per Leased
Sq. Ft.(2) | | Fair
Value(3)
(in millions) |
The Caruth | | Dallas, TX | | 1999 | | 2005 | | | | N/A | | | | | 96% | | | | | N/A | | | | $ | 81.3 | (4) | |
Regents Court | | San Diego, CA | | 2001 | | 2002 | | | | N/A | | | | | 97% | | | | | N/A | | | | | | 78.5 | (4) | |
South Florida Apartment Portfolio | | Boca Raton and Plantation, FL | | 1986 | | 2001 | | | | N/A | | | | | 92% | | | | | N/A | | | | | 77.9 | |
Windsor at Lenox Park | | Atlanta, GA | | 2001 | | 2005 | | | | N/A | | | | | 95% | | | | | N/A | | | | | 64.9 | |
The Residences at the Village of Merrick Park | | Coral Gables, FL | | 2003 | | 2012 | | | | N/A | | | | | 99% | | | | | N/A | | | | | 63.8 | |
Prescott Wallingford Apartments | | Seattle, WA | | 2012 | | 2012 | | | | N/A | | | | | 82% | | | | | N/A | | | | | 53.6 | |
The Maroneal | | Houston, TX | | 1998 | | 2005 | | | | N/A | | | | | 96% | | | | | N/A | | | | | 51.7 | |
The Pepper Building | | Philadelphia, PA | | 1927, 2010 | | 2011 | | | | N/A | | | | | 97% | | | | | N/A | | | | | 51.1 | |
Glenridge Walk | | Sandy Springs, GA | | 1996, 2001 | | 2005 | | | | N/A | | | | | 97% | | | | | N/A | | | | | 40.1 | |
Cliffs at Barton Creek | | Austin, TX | | 1994 | | 2013 | | | | N/A | | | | | 93% | | | | | N/A | | | | | 39.1 | |
Westcreek | | Westlake Village, CA | | 1988 | | 1997 | | | | N/A | | | | | 100% | | | | | N/A | | | | | 36.8 | |
| | | | | | | | | | | | | | |
Subtotal—Residential Properties | | | | | | 94% | | | | | | $ | | 3,176.7 | |
| | | | | | | | | | | | | | |
Total—All Properties—Percent Leased | | | | 91% | | | | | | $ | | 14,128.7 | |
| | | | | | | | | | | | | | |
|
(1) | | | | The square footage is an approximate measure and is subject to periodic remeasurement. |
|
(2) | | | | Based on total contractual rent for leases existing as of December 31, 2013. The contractual rent can be either on a gross or net basis, depending on the terms of the leases. |
|
(3) | | | | Fair value reflects the value determined in accordance with the procedures described in the Account’s prospectus and as stated in the Notes to Consolidated Financial Statements. |
|
(4) | | | | Property is subject to a mortgage. The fair value shown represents the Account’s interest gross of debt. |
|
(5) | | | | Printemps de l’Homme is located in France. The fair value of the property is converted from local currency to U.S. Dollars using the exchange rate as of December 31, 2013. |
|
(6) | | | | This property is held in 50%/50% joint venture with Equity Office Properties Trust. Fair value shown reflects the value of the Account’s interest in the joint venture, net of debt. |
|
(7) | | | | The Account purchased a 50.25% interest in a private REIT, which owns this property. A 49.70% interest is owned by Societe Immobiler Trans-Quebec, and 0.05% is owned by 100 individuals. Fair value shown reflects the value of the Account’s interest in the joint venture. |
|
(8) | | | | This investment property consists of 27 properties located in 12 states and is held in a 85%/15% joint venture with DDR Corp. Fair value shown reflects the value of the Account’s interest in the joint venture, net of debt. |
|
(9) | | | | This investment property is held in a 50%/50% joint venture with the Simon Property Group. Fair value shown reflects the value of the Account’s interest in the joint venture, net of debt. |
|
(10) | | | | This investment property is held in a 80%/20% joint venture with Weingarten Realty Investors. Fair value shown reflects the value of the Account’s interest in the joint venture. This portfolio contains four neighborhood and/or community shopping centers located in the Orlando and Tampa, Florida areas. |
|
(11) | | | | Represents a fee interest encumbered by a ground lease real estate investment. |
|
(12) | | | | This investment property is held in a 75%/25% joint venture with Storage USA. Fair value shown reflects the value of the Account’s interest in the joint venture, net of debt. |
|
(13) | | | | The fair value reflects the final settlement due to the Account. The property investment held within the joint venture was sold during the quarter ended December 31, 2012. |
|
(14) | | | | This property is held in 51%/49% joint venture with Allianz. Fair value shown reflects the Account’s interest in the joint venture. |
|
(15) | | | | Fair value shown reflects both the retail property and the Account’s 33.3% interest in a joint venture investment. |
|
(16) | | | | This property is held in 70%/30% joint venture with RGM 42, LLC. Fair value shown reflects the value of the Account’s interest in the joint venture, net of debt. |
|
(17) | | | | This property is held in 50%/50% joint venture with Valencia Town Center Associates LP. Fair value shown reflects the value of the Account’s interest in the joint venture, net of debt. |
25
Commercial (Non-Residential) Properties
At December 31, 2013, the Account held 75 commercial (non-residential) property investments in its portfolio, including a portfolio of storage facilities located throughout the United States. Twelve of these property investments were held through joint ventures, and 17 were subject to mortgages (including six joint venture property investments). Although the terms vary under each lease, certain expenses, such as real estate taxes and other operating expenses are paid or reimbursed in whole or in part by the tenants.
Management believes that the Account’s portfolio is diversified by both property type and geographic location. The portfolio consists of:
|
• | | | | Office. 27 property investments containing approximately 15.3 million square feet located in 10 states and the District of Columbia. As of December 31, 2013, the Account’s office properties had an aggregate fair value of approximately $6.0 billion. |
|
• | | | | Industrial. 25 property investments containing approximately 26.6 million square feet located in 10 states. As of December 31, 2013, the Account’s industrial properties had an aggregate fair value of approximately $1.9 billion. |
|
• | | | | Retail. 20 property investments containing approximately 17.3 million square feet located in eight states, the District of Columbia and Paris, France. As of December 31, 2013, the Account’s retail properties had an aggregate fair value of approximately $2.5 billion. One of the retail property investments is an 85% interest in a portfolio containing 27 individual retail shopping centers located throughout the Eastern and Southeastern states. |
|
• | | | | Other-Storage. The Account has a 75% interest in a portfolio of storage facilities located throughout the United States containing approximately 1.7 million square feet. As of December 31, 2013, the Account’s interest in this portfolio had a fair value of approximately $101.6 million. |
|
• | | | | Other-Land. The Account has a fee interest real estate investment encumbered by a ground lease. As of December 31, 2013, this real estate investment had a fair value of $400.0 million. The Account also has an interest in land under development. This investment had a fair value of $64.3 million as of December 31, 2013. |
As of December 31, 2013, the Account’s commercial real estate investment holdings were 90.1% leased. The Account’s:
|
• | | | | office property investments were 88.8% leased; |
|
• | | | | industrial property investments were 88.3% leased; |
|
• | | | | retail property investments were 93.9% leased; and |
|
• | | | | the storage portfolio was 90.8% leased. |
Major Tenants: The following tables list the Account’s ten most significant tenants based on the total space they occupied as of December 31, 2013 in each of the Account’s commercial property types.
| | | | | | |
Major Office Tenants | | Occupied Square Feet | | Percentage of
Total Rentable
Area of
Account’s
Office Properties | | Percentage of
Total Rentable
Area of
Non-Residential
Properties |
|
BHP Petroleum (Americas), Inc.(1) | | | | 782,956 | | | | | 5.1 | % | | | | | 1.3 | % | |
Crowell & Moring LLP(2) | | | | 447,822 | | | | | 2.9 | % | | | | | 0.8 | % | |
Microsoft Corporation(2) | | | | 379,248 | | | | | 2.5 | % | | | | | 0.6 | % | |
The Bank of New York Mellon Corporation(1) | | | | 374,610 | | | | | 2.5 | % | | | | | 0.6 | % | |
Salesforce.com Inc(2) | | | | 361,409 | | | | | 2.4 | % | | | | | 0.6 | % | |
Atmos Energy Corporation(2) | | | | 312,238 | | | | | 2.0 | % | | | | | 0.5 | % | |
Yahoo! Inc.(1) | | | | 307,134 | | | | | 2.0 | % | | | | | 0.5 | % | |
GE Healthcare(2) | | | | 294,306 | | | | | 1.9 | % | | | | | 0.5 | % | |
Pearson Education, Inc.(2) | | | | 234,745 | | | | | 1.5 | % | | | | | 0.4 | % | |
Bridgewater Associates LP(2) | | | | 227,883 | | | | | 1.5 | % | | | | | 0.4 | % | |
26
| | | | | | |
Major Industrial Tenants | | Occupied Square Feet | | Percentage of
Total Rentable
Area of
Account’s
Industrial Properties | | Percentage of
Total Rentable
Area of
Non-Residential
Properties |
|
Wal-Mart Stores, Inc.(2) | | | | 1,099,112 | | | | | 4.1 | % | | | | | 1.9 | % | |
Regal West Corporation(2) | | | | 968,535 | | | | | 3.6 | % | | | | | 1.6 | % | |
Restoration Hardware, Inc.(2) | | | | 886,052 | | | | | 3.3 | % | | | | | 1.5 | % | |
Kumho Tire U.S.A. Inc.(2) | | | | 830,485 | | | | | 3.1 | % | | | | | 1.4 | % | |
Del Monte Fresh Product, N.A., Inc.(2) | | | | 689,660 | | | | | 2.6 | % | | | | | 1.2 | % | |
R.R Donnelley & Sons Company(2) | | | | 659,157 | | | | | 2.5 | % | | | | | 1.1 | % | |
Rheem Sales Company, Inc.(2) | | | | 656,600 | | | | | 2.5 | % | | | | | 1.1 | % | |
Global Equipment Company, Inc.(2) | | | | 647,228 | | | | | 2.4 | % | | | | | 1.1 | % | |
Mohawk Carpet Distribution LP(2) | | | | 616,992 | | | | | 2.3 | % | | | | | 1.0 | % | |
Campbell Soup Supply Company LLC(2) | | | | 573,000 | | | | | 2.2 | % | | | | | 1.0 | % | |
| | | | | | |
Major Retail Tenants | | Occupied Square Feet | | Percentage of
Total Rentable
Area of
Account’s
Retail Properties | | Percentage of
Total Rentable
Area of
Non-Residential
Properties |
|
Dick’s Sporting Goods, Inc.(1) | | | | 415,902 | | | | | 2.4 | % | | | | | 0.7 | % | |
Publix Super Markets, Inc.(3) | | | | 369,482 | | | | | 2.1 | % | | | | | 0.6 | % | |
Kohl’s Corporation(1) | | | | 349,777 | | | | | 2.0 | % | | | | | 0.6 | % | |
Ross Stores, Inc.(1) | | | | 346,072 | | | | | 2.0 | % | | | | | 0.6 | % | |
PetSmart, Inc.(3) | | | | 332,745 | | | | | 1.9 | % | | | | | 0.6 | % | |
Nordstrom, Inc(3) | | | | 312,509 | | | | | 1.8 | % | | | | | 0.5 | % | |
Sears, Roebuck & Co.(1) | | | | 304,465 | | | | | 1.8 | % | | | | | 0.5 | % | |
Bed Bath & Beyond, Inc.(3) | | | | 279,347 | | | | | 1.6 | % | | | | | 0.5 | % | |
Best Buy Co., Inc.(3) | | | | 267,791 | | | | | 1.5 | % | | | | | 0.5 | % | |
Michael’s Stores, Inc.(1) | | | | 236,646 | | | | | 1.4 | % | | | | | 0.4 | % | |
|
(1) | | | | Tenant occupied space within joint venture investments. |
|
(2) | | | | Tenant occupied space within wholly owned property investments. |
|
(3) | | | | Tenant occupied space within wholly owned property investments and joint venture investments. |
27
The following tables list the rentable area subject to expiring leases during the next five years, and an aggregate figure for expirations in 2019 and after, in the Account’s commercial (non-residential) properties. While many of the leases contain renewal options with varying terms, these charts assume that none of the tenants exercise their renewal options, including those with terms that expired on December 31, 2013 or are month to month leases.
Office Properties
| | | | |
Year of
Lease Expiration | | Rentable Area
Subject to
Expiring Leases (sq. ft.) | | Percentage of
Total Rentable
Area of Account’s
Office Properties
Represented by
Expiring Leases |
|
2014 | | | | 1,726,244 | | | | | 11.3% | |
2015 | | | | 1,859,734 | | | | | 12.2% | |
2016 | | | | 1,465,559 | | | | | 9.6% | |
2017 | | | | 1,072,775 | | | | | 7.0% | |
2018 | | | | 1,505,626 | | | | | 9.8% | |
2019 and thereafter | | | | 5,402,775 | | | | | 35.3% | |
|
Total | | | | 13,032,713 | | | | | 85.2% | |
Industrial Properties
| | | | |
Year of
Lease Expiration | | Rentable Area
Subject to
Expiring Leases (sq. ft.) | | Percentage of
Total Rentable
Area of Account’s
Industrial Properties
Represented by
Expiring Leases |
|
2014 | | | | 2,660,392 | | | | | 10.0% | |
2015 | | | | 5,990,179 | | | | | 22.5% | |
2016 | | | | 3,758,003 | | | | | 14.1% | |
2017 | | | | 2,095,453 | | | | | 7.9% | |
2018 | | | | 4,337,544 | | | | | 16.3% | |
2019 and thereafter | | | | 4,326,546 | | | | | 16.3% | |
|
Total | | | | 23,168,117 | | | | | 87.1% | |
28
Retail Properties
| | | | |
Year of Lease Expiration | | Rentable Area
Subject to
Expiring Leases (sq. ft.) | | Percentage of
Total Rentable
Area of Account’s
Retail Properties
Represented by
Expiring Leases |
|
2014 | | | | 1,530,543 | | | | | 8.8% | |
2015 | | | | 1,532,076 | | | | | 8.9% | |
2016 | | | | 2,209,582 | | | | | 12.8% | |
2017 | | | | 1,650,841 | | | | | 9.5% | |
2018 | | | | 1,527,610 | | | | | 8.8% | |
2019 and thereafter | | | | 5,261,131 | | | | | 30.4% | |
|
Total | | | | 13,711,783 | | | | | 79.2% | |
Residential Properties
The Account’s residential property investment portfolio consisted of 27 properties as of December 31, 2013, comprised of first class or luxury multi-family, garden, mid-rise, and high-rise apartment buildings. The portfolio contains approximately 10,525 units located in 11 states, with one located in the District of Columbia. The portfolio was 94.0% leased as of December 31, 2013. Eleven of the residential properties in the portfolio are subject to mortgages. The complexes generally contain one to three bedroom apartment units with a range of amenities, such as patios or balconies, washers and dryers, and central air conditioning. Many of these apartment communities have on-site fitness facilities, including some with swimming pools. Rents on each of the properties tend to be comparable with competitive communities and are not subject to rent regulation. The Account is responsible for the expenses of operating its residential properties. As of December 31, 2013, the Account’s residential properties had an aggregate fair value of approximately $3.2 billion.
29
The table below contains detailed information regarding the apartment complexes in the Account’s portfolio as of December 31, 2013.
| | | | | | | | |
Property | | Location | | Number
Of Units | | Average
Unit Size
(Square Feet) | | Avg. Rent
Per Unit/
Per Month |
|
Houston Apartment Porfolio(1) | | Houston, TX | | | | 1,777 | | | | | 1,013 | | | | $ | | 1,350 | |
Palomino Park(1) | | Highlands Ranch, CO | | | | 1,184 | | | | | 1,096 | | | | | 1,367 | |
Kierland Apartment Portfolio(1) | | Scottsdale, AZ | | | | 724 | | | | | 1,048 | | | | | 1,061 | |
MiMA | | New York, NY | | | | 651 | | | | | 792 | | | | | 5,686 | |
South Florida Apartment Portfolio(1) | | Boca Raton and Plantation, FL | | | | 550 | | | | | 889 | | | | | 1,179 | |
Ashford Meadows Apartments | | Herndon, VA | | | | 440 | | | | | 1,050 | | | | | 1,550 | |
Windsor at Lenox Park | | Atlanta, GA | | | | 407 | | | | | 1,024 | | | | | 1,220 | |
Holly Street Village | | Pasadena, CA | | | | 374 | | | | | 875 | | | | | 1,801 | |
Mass Court | | Washington, DC | | | | 371 | | | | | 835 | | | | | 2,475 | |
The Caruth | | Dallas, TX | | | | 338 | | | | | 1,167 | | | | | 1,769 | |
The Maroneal | | Houston, TX | | | | 309 | | | | | 928 | | | | | 1,470 | |
Glenridge Walk | | Sandy Springs, GA | | | | 296 | | | | | 1,146 | | | | | 1,101 | |
The Palatine | | Arlington, VA | | | | 262 | | | | | 1,055 | | | | | 2,692 | |
The Colorado | | New York, NY | | | | 256 | | | | | 623 | | | | | 3,148 | |
Regents Court | | San Diego, CA | | | | 251 | | | | | 886 | | | | | 1,719 | |
Larkspur Courts | | Larkspur, CA | | | | 248 | | | | | 1,001 | | | | | 2,451 | |
Stella | | Marina Del Rey, CA | | | | 244 | | | | | 970 | | | | | 3,185 | |
Oceano at Warner Center | | Woodland Hill, CA | | | | 244 | | | | | 935 | | | | | 1,915 | |
Residences at Rivers Edge | | Medford, MA | | | | 222 | | | | | 955 | | | | | 2,366 | |
Cliffs at Barton Creek | | Austin, TX | | | | 210 | | | | | 952 | | | | | 1,318 | |
Circa Green Lake | | Seattle, WA | | | | 199 | | | | | 765 | | | | | 1,903 | |
The Corner | | New York, NY | | | | 196 | | | | | 790 | | | | | 6,135 | |
The Legacy at Westwood | | Los Angeles, CA | | | | 187 | | | | | 1,181 | | | | | 3,583 | |
The Pepper Building | | Philadelphia, PA | | | | 185 | | | | | 820 | | | | | 1,774 | |
Prescott Wallingford Apartments | | Seattle, WA | | | | 154 | | | | | 665 | | | | | 1,700 | |
Westcreek | | Westlake Village, CA | | | | 126 | | | | | 951 | | | | | 1,845 | |
The Residences at the Village of Merrick Park | | Coral Gables, FL | | | | 120 | | | | | 1,231 | | | | | 2,879 | |
|
(1) | | | | Represents a portfolio containing multiple properties. |
ITEM 3. LEGAL PROCEEDINGS.
The Account is party to various claims and routine litigation arising in the ordinary course of business. Management of the Account does not believe that the results of any such claims or litigation, individually or in the aggregate, will have a material effect on the Account’s business, financial position or results of operations.
ITEM 4. MINE SAFETY DISCLOSURES.
Not applicable.
30
PART II
ITEM 5. MARKET FOR THE REGISTRANT’S SECURITIES, RELATED STOCKHOLDER MATTERS, AND ISSUER PURCHASES OF EQUITY SECURITIES.
(a) Market Information. There is no established public trading market for securities issued by the Account. Accumulation units in the Account are sold to eligible participants at the Account’s current accumulation unit value, which is based on the value of the Account’s then current net assets and are redeemable in accordance with the terms of the participant’s contract. For the period from January 1, 2013 to December 31, 2013, the high and low accumulation unit values for the Account were $298.981 and $272.924, respectively. For the period January 1, 2012 to December 31, 2012, the high and low accumulation unit values for the Account were $272.569 and $247.578, respectively.
Holders. The approximate number of Account contract owners at December 31, 2013 was 1,026,600.
Dividends. Not applicable.
Securities Authorized for Issuance under Equity Compensation Plans. Not applicable.
(b) Use of Proceeds: Not applicable.
(c) Purchases of Equity Securities by Issuer: Not applicable.
31
ITEM 6. SELECTED FINANCIAL DATA
The following selected financial data should be considered in conjunction with the Account’s consolidated financial statements and notes provided in this Form 10-K (amounts in millions except for per accumulation unit amounts).
| | | | | | | | | | |
| | Years Ended December 31, |
| | 2013 | | 2012 | | 2011 | | 2010 | | 2009 |
Investment income: | | | | | | | | | | |
Real estate income, net | | | $ | | 391.0 | | | | $ | | 388.7 | | | | $ | | 435.6 | | | | $ | | 421.1 | | | | $ | | 479.7 | |
Income from real estate joint ventures and limited partnerships | | | | 104.7 | | | | | 80.9 | | | | | 86.4 | | | | | 89.3 | | | | | 114.6 | |
Dividends and interest | | | | 45.1 | | | | | 35.3 | | | | | 22.4 | | | | | 8.6 | | | | | 1.7 | |
| | | | | | | | | | |
Total investment income | | | | 540.8 | | | | | 504.9 | | | | | 544.4 | | | | | 519.0 | | | | | 596.0 | |
Expenses | | | | 145.1 | | | | | 136.7 | | | | | 121.3 | | | | | 95.8 | | | | | 95.5 | |
| | | | | | | | | | |
Investment income, net | | | | 395.7 | | | | | 368.2 | | | | | 423.1 | | | | | 423.2 | | | | | 500.5 | |
Net realized and unrealized gains (losses) on investments and mortgage loans payable | | | | 1,060.2 | | | | | 1,011.2 | | | | | 1,076.0 | | | | | 757.0 | | | | | (3,612.5 | ) | |
| | | | | | | | | | |
Net increase (decrease) in net assets resulting from operations | | | | 1,455.9 | | | | | 1,379.4 | | | | | 1,499.1 | | | | | 1,180.2 | | | | | (3,112.0 | ) | |
Participant transactions | | | | 916.3 | | | | | 894.8 | | | | | 1,225.0 | | | | | 1,743.0 | | | | | (1,575.7 | ) | |
TIAA (redemption) purchase of Liquidity Units | | | | (325.4 | ) | | | | | (940.3 | ) | | | | | — | | | | | — | | | | | 1,058.7 | |
| | | | | | | | | | |
Net increase (decrease) in net assets | | | $ | | 2,046.8 | | | | $ | | 1,333.9 | | | | $ | | 2,724.1 | | | | $ | | 2,923.2 | | | | $ | | (3,629.0 | ) | |
| | | | | | | | | | |
| | Years Ended December 31, |
| | 2013 | | 2012 | | 2011 | | 2010 | | 2009 |
| | | | | | | | | | |
Total assets | | | $ | | 19,417.1 | | | | $ | | 17,378.6 | | | | $ | | 15,749.9 | | | | $ | | 12,839.9 | | | | $ | | 9,912.7 | |
Total liabilities | | | | 2,509.2 | | | | | 2,517.5 | | | | | 2,222.7 | | | | | 2,036.8 | | | | | 2,032.8 | |
| | | | | | | | | | |
Total net assets | | | $ | | 16,907.9 | | | | $ | | 14,861.1 | | | | $ | | 13,527.2 | | | | $ | | 10,803.1 | | | | $ | | 7,879.9 | |
| | | | | | | | | | |
Number of per accumulation unit amounts | | | | 55.3 | | | | | 53.3 | | | | | 53.4 | | | | | 48.1 | | | | | 39.5 | |
| | | | | | | | | | |
Net asset value, per accumulation unit | | | $ | | 298.872 | | | | $ | | 272.569 | | | | $ | | 247.654 | | | | $ | | 219.173 | | | | $ | | 193.454 | |
| | | | | | | | | | |
Mortgage loans payable | | | $ | | 2,279.1 | | | | $ | | 2,282.6 | | | | $ | | 2,028.2 | | | | $ | | 1,860.2 | | | | $ | | 1,858.1 | |
| | | | | | | | | | |
32
Quarterly Selected Financial Data
The following quarterly selected unaudited financial data for each full quarter of 2013 and 2012 are derived from the consolidated financial statements of the Account for the years ended December 31, 2013 and 2012 (amounts in millions).
| | | | | | | | | | |
| | 2013 | | Year Ended
December 31, 2013 |
| | For the Three Months Ended |
| | March 31 | | June 30 | | September 30 | | December 31 |
Investment income, net | | | $ | | 84.1 | | | | $ | | 98.0 | | | | $ | | 91.4 | | | | $ | | 122.2 | | | | $ | | 395.7 | |
Net realized and unrealized gain on investments and mortgage loans payable | | | | 196.1 | | | | | 287.9 | | | | | 430.5 | | | | | 145.7 | | | | $ | | 1,060.2 | |
| | | | | | | | | | |
Net increase in net assets resulting from operations | | | $ | | 280.2 | | | | $ | | 385.9 | | | | $ | | 521.9 | | | | $ | | 267.9 | | | | $ | | 1,455.9 | |
| | | | | | | | | | |
Total return | | | | 1.88 | % | | | | | 2.54 | % | | | | | 3.29 | % | | | | | 1.62 | % | | | | | 9.65 | % | |
| | | | | | | | | | |
| | 2012 | | Year Ended
December 31, 2012 |
| | For the Three Months Ended |
| | March 31 | | June 30 | | September 30 | | December 31 |
| | | | | | | | | | |
Investment income, net | | | $ | | 90.9 | | | | $ | | 95.6 | | | | $ | | 101.8 | | | | $ | | 79.9 | | | | $ | | 368.2 | |
Net realized and unrealized gain on investments and mortgage loans payable | | | | 354.0 | | | | | 263.7 | | | | | 174.0 | | | | | 219.5 | | | | | 1,011.2 | |
| | | | | | | | | | |
Net increase in net assets resulting from operations | | | $ | | 444.9 | | | | $ | | 359.3 | | | | $ | | 275.8 | | | | $ | | 299.4 | | | | $ | | 1,379.4 | |
| | | | | | | | | | |
Total return | | | | 3.26 | % | | | | | 2.52 | % | | | | | 1.89 | % | | | | | 2.03 | % | | | | | 10.06 | % | |
| | | | | | | | | | |
33
ITEM 7. MANAGEMENT’S DISCUSSION AND ANALYSIS OF THE ACCOUNT’S FINANCIAL CONDITION AND RESULTS OF OPERATIONS
The following discussion and analysis of our financial condition and results of operations should be read together with our consolidated financial statements and notes contained in this report and with consideration to the sub-section entitled “Forward-Looking Statements,” which begins below, and the section entitled “Item 1A. Risk Factors.” The past performance of the Account is not indicative of future results.
Forward-Looking Statements
Some statements in this Form 10-K which are not historical facts may be “forward-looking statements” within the meaning of Section 27A of the Securities Act of 1933, Section 21E of the Securities Exchange Act of 1934 and the Private Securities Litigation Reform Act of 1995. Forward-looking statements include statements about management’s expectations, beliefs, intentions or strategies for the future, include the assumptions and beliefs underlying these forward-looking statements, and are based on current expectations, estimates and projections about the real estate industry, domestic and global economic conditions, including conditions in the credit and capital markets, the sectors, and markets in which the Account invests and operates, and the transactions described in this Form 10-K. While management believes the assumptions underlying any of its forward-looking statements and information to be reasonable, such information may be subject to uncertainties and may involve certain risks which may be difficult to predict and are beyond management’s control. These risks and uncertainties could cause actual results to differ materially from those contained in any forward-looking statement. These risks and uncertainties include, but are not limited to, the following:
|
• | | | | Acquiring and Owning Real Estate:The risks associated with acquiring and owning real property, including general economic and real estate market conditions, the availability of, and economic cost associated with, financing the Account’s properties, the risk that the Account’s properties become too concentrated (whether by geography, sector or tenant mix), competition for acquiring real estate properties, leasing risk (including tenant defaults) and the risk of uninsured losses at properties (including due to terrorism, natural disasters, and acts of violence); |
|
• | | | | Selling Real Estate:The risk that the sales price of a property might differ, perhaps significantly, from its estimated or appraised value, leading to losses or reduced profits to the Account, the risk that the Account might not be able to sell a property at a particular time for a price which management believes represents its fair or full value, the risk of a lack of availability of financing (for potential purchasers of the Account’s properties), risks associated with disruptions in the credit and capital markets, and the risk that the Account may be required to make significant expenditures before the Account is able to market and/or sell a property; |
|
• | | | | Valuation:The risks associated with property valuations, including the fact that appraisals can be subjective in a number of respects and the fact that the Account’s appraisals are generally obtained on a quarterly basis and there may be periods in between appraisals of a property during which the value attributed to the property for purposes of the Account’s daily accumulation unit value may be more or less than the actual realizable value of the property; |
|
• | | | | Borrowing:Risks associated with financing the Account’s properties, including the risk of default on loans secured by the Account’s properties (which could lead to foreclosure), the risk associated with high loan to value ratios on the Account’s properties (including the fact that the Account may have limited, or no net value in such a property), the risk that significant sums of cash could be required to make principal and interest payments on the loans and the risk that the Account may not have the ability to obtain financing or refinancing on favorable terms (or at all), which may be aggravated by general disruptions in credit and capital markets; |
|
• | | | | Participant Transactions and Cash Management:Investment risk associated with participant transactions, in particular that (i) significant net participant transfers out of the Account may impair our ability to pursue or consummate new investment opportunities that are otherwise attractive to the Account and/ or may result in sales of real estate-related assets to generate liquidity, (ii) significant net participant transfers into the Account may result, on a temporary basis, in our cash holdings and/or holdings in liquid real estate-related investments exceeding our long-term targeted holding levels and |
34
| | | | (iii) high levels of cash in the Account during times of appreciating real estate values can impair the Account’s overall return; |
|
• | | | | Joint Venture Investments:The risks associated with joint venture partnerships, including the risk that a co-venturer may have interests or goals inconsistent with that of the Account, that a co-venturer may have financial difficulties, and the risk that the Account may have limited rights with respect to operation of the property and transfer of the Account’s interest; |
|
• | | | | Regulatory Matters:Uncertainties associated with environmental liability and regulations and other governmental regulatory matters such as zoning laws, rent control laws, and property taxes; |
|
• | | | | Foreign Investments:The risks associated with purchasing, owning and disposing foreign investments (primarily real estate properties), including political risk, the risk associated with currency fluctuations (whether hedged or not), regulatory and taxation risks and risks of enforcing judgments; |
|
• | | | | Conflicts of Interest:Conflicts of interest associated with TIAA serving as investment manager of the Account and provider of the liquidity guarantee at the same time as TIAA and its affiliates are serving as an investment manager to other real estate accounts or funds, including conflicts associated with satisfying its fiduciary duties to all such accounts and funds associated with purchasing, selling and leasing of properties; |
|
• | | | | Required Property Sales:The risk that, if TIAA were to own too large a percentage of the Account’s accumulation units through funding the liquidity guarantee (as determined by the independent fiduciary), the independent fiduciary could require the sales of properties to reduce TIAA’s ownership interest, which sales could occur at times and at prices that depress the sale proceeds to the Account; |
|
• | | | | Government and Government Agency Securities:Risks associated with investment securities issued by U.S. government agencies and U.S. government-sponsored entities, including the risk that the issuer may not have their securities backed by the full faith and credit of the U.S. government, and that transaction activity may fluctuate significantly from time to time, which could negatively impact the value of the securities and the Account’s ability to dispose of a security at a favorable time; and |
|
• | | | | Liquid Assets and Securities:Risks associated with investments in real estate-related liquid assets (which could include, from time to time, REIT securities and CMBS), and non-real estate-related liquid assets, including: |
|
• | | | | Financial/credit risk—Risks that the issuer will not be able to pay principal and interest when due or that the issuer’s earnings will fall; |
|
• | | | | Market volatility risk—Risk that the changing conditions in financial markets may cause the Account’s investments to experience price volatility; |
|
• | | | | Interest rate volatility risk—Risk that interest rate volatility may affect the Account’s current income from an investment or the pricing of that investment. As of the date of this report, interest rates in the United States are at or near historic lows, which may increase the Fund’s exposure to risk associated with rising interest rates; and |
|
• | | | | Deposit/money market risk—Risks that the Account could experience losses if banks fail. |
More detailed discussions of certain of these risk factors are contained in the section of this Form 10-K entitled “Item 1A. Risk Factors” and in this section below and also in the section entitled “Item 7A. Quantitative and Qualitative Disclosures About Market Risk,” that could cause actual results to differ materially from historical experience or management’s present expectations.
Caution should be taken not to place undue reliance on management’s forward-looking statements, which represent management’s views only as of the date that this report is filed. Neither management nor the Account undertake any obligation to update publicly or revise any forward-looking statement, whether as a result of new information, changed assumptions, future events or otherwise.
Commercial real estate market statistics discussed in this section are obtained by the Account from sources that management considers reliable, but some of the data are preliminary for the year or quarter ended December 31, 2013 and may be subsequently revised. Prior period data may have been adjusted to reflect
35
updated calculations. Investors should not rely exclusively on the data presented below in forming a judgment regarding the current or prospective performance of the commercial real estate market generally.
2013 U.S. ECONOMIC AND COMMERCIAL REAL ESTATE OVERVIEW
The Account invests primarily in high-quality, core real estate in order to meet its investment objective of obtaining favorable long-term returns through rental income and the appreciation of its real estate holdings.
Economic and Capital Markets Overview and Outlook
Recent trends in key U.S. economic indicators are summarized in the table below. The Bureau of Economic Analysis’ initial estimate of growth of Gross Domestic Product (“GDP”) in the fourth quarter of 2013 was a gain of 3.2%, as compared with an increase of 4.1% in the third quarter of 2013. Fourth quarter GDP growth was seemingly weaker largely because the third quarter was boosted by inventory gains which added 1.7% to the quarter’s growth. By comparison, inventory gains added just 0.4% to fourth quarter’s growth. Personal consumption expenditures grew 3.3% in the fourth quarter, well above the 2.0% rate in the third quarter. Exports also bolstered growth with its largest contribution in three years.
Economic Indicators*
| | | | | | | | | | | | | | |
| | 1Q 2013 | | 2Q 2013 | | 3Q 2013 | | 4Q 2013 | | 2013 | | Forecast |
| | 2014 | | 2015 |
Economy(1) | | | | | | | | | | | | | | |
Gross Domestic Product | | | | 1.1 | % | | | | | 2.5 | % | | | | | 4.1 | % | | | | | 3.2 | % | | | | | 1.9 | % | | | | | 2.8 | % | | | | | 3.0 | % | |
Employment Growth (Thousands) | | | | 622 | | | | | 547 | | | | | 502 | | | | | 515 | | | | | 2,186 | | | | | 2,472 | | | | | 3,112 | |
Unemployment Rate | | | | 7.5 | % | | | | | 7.5 | % | | | | | 7.2 | % | | | | | 6.7 | % | | | | | 7.4 | % | | | | | 6.8 | % | | | | | 6.3 | % | |
Interest Rates(2) | | | | | | | | | | | | | | |
10 Year Treasury | | | | 1.95 | % | | | | | 2.00 | % | | | | | 2.71 | % | | | | | 2.75 | % | | | | | 2.35 | % | | | | | 3.20 | % | | | | | 3.70 | % | |
Sources: BEA, BLS, Federal Reserve, Blue Chip Consensus Forecasts, and Moody’s Analytics
|
* | | | | Data subject to revision |
|
(1) | | | | GDP growth rates are annual rates. |
|
(2) | | | | The Treasury rates are an average over the stated time period. The Federal Funds rates are as of the end of the stated time period. |
Economic growth in the latter half of 2013 was slowed by the sixteen day shutdown of the federal government due to failure to raise the debt ceiling; however, a bipartisan $1.0 trillion budget agreement was reached in early 2014, which will provide funding for the government through September 2015. The agreement will provide $23 billion in deficit reduction and will eliminate some $63 billion in across-the-board spending cuts that were part of sequestration. When passed, it should resolve much of the political and economic uncertainty which have hampered economic growth in recent years. This spending bill coupled with ongoing improvement in the labor market should bolster economic growth in 2014-2015.
After its December 17-18 meeting, the Federal Open Market Committee (“FOMC”) announced that it would begin tapering its $85 billion asset purchase program by reducing monthly bond purchases by $10 billion in January. The FOMC’s rationale for this decision was that it saw “the improvement in economic activity and labor market conditions as consistent with underlying strength in the broader economy.” The FOMC reaffirmed this decision following its January meeting, when it announced another $10 billion reduction in asset purchases and led the markets to expect that similar reductions in subsequent months would ultimately bring the program to an end by Fall 2014. The FOMC’s December announcement briefly pushed the yield on the 10-Year Treasury above 3.0%, a level last seen in mid-2011. However, yields subsequently dipped to 2.85-2.90% as of late-January 2014 and have remained in the 2.65-2.75% range through early February. Notwithstanding tapering of its bond purchases, the FOMC reaffirmed its expectation that the federal funds rate would remain at the “exceptionally low target range” of 0 to 0.25% for an extended period. In its December statement, the FOMC stated that it would not begin to raise the federal funds rate target until the unemployment rate had fallen to “well past” 6.5%, provided inflation remained below its 2.0% long-term target. The recent appointment of Janet Yellen as Federal Reserve Chair is not expected to alter the FOMC’s policies.
36
Markets were jolted in late January 2014 by weaker than expected manufacturing data from China which fueled concerns about a slowdown in the global economy. Upheaval in Argentina, Turkey and the Ukraine fanned the fire and led to a selloff in emerging market stocks and currencies. U.S. markets sold off as well with the S&P posting its worst week since mid-2012. Markets subsequently stabilized as of early February but concerns remained about a slowdown in China, a contagion effect on emerging markets, and the future impact of Fed tapering on global financial markets.
Despite uncertainty about the global economy, economists remain optimistic about prospects for the U.S. economy in 2014 given signs of strengthening economic activity and the recent Congressional agreement on a budget plan that reduces fiscal uncertainty. GDP is expected to grow by 2.5% in the first quarter of 2014 and gain momentum over the balance of the year. Compared to prior years, fiscal drag from the federal government should be minimal while state and local government spending will contribute meaningfully to economic growth. Consumers should also contribute to growth given the improvement in labor market conditions, the strengthening of the housing market, and the recent performance of the stock market. Factors that could potentially affect 2014 growth include a rise in medium and long-term interest rates that results from the FOMC’s tapering. However, while 98% of the economists surveyed by the Blue Chip survey expect the FOMC to have ended its bond purchasing program by the end of 2014, only 2% expect the FOMC to begin raising the federal funds target rate in 2014. The majority of economists expect the FOMC to start raising the federal funds rate in the second half of 2015, which suggests that interest rates should remain low until the latter half of 2015.
The consensus of economists surveyed as part of the January 10, 2014 Blue Chip Economic Forecast publication was for GDP to grow at a 2.8% rate in 2014. Employment is expected to grow by an average of 200,000 per month in 2014 and the unemployment rate is projected to fall to 6.3% by the end of 2014. Economists’ forecasts of GDP and employment growth reflect underlying strength in the U.S. economy, and particularly the increase in consumer spending during the second half of 2013, a steadily improving housing market, and recent growth in exports. Economic growth in-line with economists’ projections would provide support for additional improvement in commercial real estate market conditions.
Real Estate Market Conditions and Outlook
Industry sources such as CB Richard Ellis Econometric Advisors calculate vacancy based on square footage. Except where otherwise noted, the Account’s vacancy data is calculated as a percentage of net rentable space leased, weighted by square footage, in keeping with industry standards.
Commercial real estate activity continued at a steady pace during the fourth quarter of 2013 as net absorption for the major property sectors either increased or remained stable compared with the third quarter of 2013. As a result, real estate market fundamentals improved modestly across all sectors. Sales of office, industrial, retail and multi-family properties totaled $100.2 billion in the fourth quarter, a modest increase from fourth quarter 2012. For 2013 as a whole, sales totaled $312.8 billion, an 18% increase from 2012 and sales increased for all property types.
Green Street Advisors’ Commercial Property Price Index (“CPPI”) was unchanged during the fourth quarter as compared to the third quarter of 2013. Despite healthy market conditions and investment activity, the CPPI was unchanged during the entire second half of 2013, though it did increase by 8% in 2013 as a whole. Regarding the recent quarter, Green Street Advisors noted: “Property appreciation has come to a virtual stop over the past several months, as the sharp increase in interest rates that occurred last summer continues to weigh on valuations.”
The FTSE NAREIT All Equity REIT index return was a negative 0.7% during the fourth quarter following a decline of 3.1% in the third quarter. However, the index return was a positive 2.5% for 2013 as a whole. In its January 2014 Real Estate Securities Monthly, Green Street Advisors concluded that REIT prices are in a “fair value range” based on a comparison of current and prospective REIT yields and returns with those of fixed income investments like corporate and high-yield bonds as well as private real estate.
Commercial property returns increased during the fourth quarter of 2013. For the quarter ending December 31, 2013, the NCREIF Fund Index Open-End Diversified Core Equity (“NFI-ODCE”) total return was 3.17%. By comparison, the total return for the quarter ending September 30, 2013 was 3.56%. The
37
NFI-ODCE is a fund-level return index including property investments at ownership share with cash balances and leverage.
Data for the Account’s top five markets in terms of market value as of December 31, 2013 are provided below. These markets represented 50.0% of the Account’s total real estate investment portfolio.
| | | | | | | | |
Top 5 Metro Areas by Fair Market Value | | Account %
Leased Fair
Market Value
Weighted* | | Number of
Property
Investments | | Metro Area
Fair Market Value
as a % of Total
RE Portfolio | | Metro Area
Fair Market Value
as a % of Total
Investments |
|
Washington-Arlington-Alexandria,
DC-VA-MD-WV | | | | 91.9% | | | | | 10 | | | | | 14.0% | | | | | 10.3% | |
New York-White Plains-Wayne, NY-NJ | | | | 94.8% | | | | | 7 | | | | | 11.1% | | | | | 8.2% | |
Los Angeles-Long Beach-Glendale, CA | | | | 87.2% | | | | | 14 | | | | | 10.6% | | | | | 7.9% | |
Boston-Quincy, MA | | | | 90.9% | | | | | 4 | | | | | 7.4% | | | | | 5.4% | |
San Francisco-San Mateo-Redwood City, CA | | | | 81.1% | | | | | 4 | | | | | 6.9% | | | | | 5.1% | |
|
* | | | | Weighted by fair market value, which differs from the calculations provided for market comparisons to CBRE-EA data and are used here to reflect the fair market value of the Account’s monetary investments in those markets. |
Office
According to CB Richard Ellis Economic Advisors (“CBRE-EA”), the national office vacancy rate declined to 14.9% in the fourth quarter of 2013 as compared to 15.1% in the third quarter of 2013. This national office vacancy rate has declined steadily since peaking at 16.9% in the second quarter of 2010. However, the rate of decline continues to be slow as a result of modest job growth and companies seeking to lower occupancy costs by reducing the amount of office space per employee.
The vacancy rate for the Account’s office portfolio averaged 11.2% as of fourth quarter 2013 as compared with 12.9% in the third quarter of 2013. As shown in the table below, the average vacancy rate of the Account’s properties in four of its five top markets remained below their respective market averages. The only exception was San Francisco where a major technology company has leased virtually all of the space in the Account’s largest building with occupancy of additional floors to take place in the first quarter of 2014. The average vacancy rate will decline to 8.5% when the additional space is occupied. Similarly, a large lease has been signed in one of the Account’s Seattle buildings which will reduce the average vacancy rate to 5.0% when the tenant takes occupancy in mid-2014.
| | | | | | | | | | | | | | | | | | | | | | Account
Square Foot
Weighted Average
Vacancy | | Market Vacancy* |
|
Sector | | Metropolitan Area | | Total Sector by
Metro Area ($M) | | % of Total
Investments | | 2013 Q4 | | 2013 Q3 | | 2013 Q4 | | 2013 Q3 |
|
Office | | Account/Nation | | | | | | | | 11.2% | | | | | 12.9% | | | | | 14.9% | | | | | 15.1% | |
|
1 | | Washington-Arlington-Alexandria, DC-VA-MD-WV | | | | $1,372.9 | | | | | 7.2% | | | | | 8.8% | | | | | 11.1% | | | | | 15.4% | | | | | 15.2% | |
2 | | Boston-Quincy, MA | | | | $1,010.4 | | | | | 5.3% | | | | | 9.6% | | | | | 9.9% | | | | | 11.2% | | | | | 12.0% | |
3 | | San Francisco-San Mateo-Redwood City, CA | | | | $881.1 | | | | | 4.6% | | | | | 19.8% | | | | | 23.7% | | | | | 8.9% | | | | | 9.5% | |
4 | | Seattle-Bellevue-Everett, WA | | | | $584.0 | | | | | 3.1% | | | | | 12.2% | | | | | 17.2% | | | | | 13.2% | | | | | 13.0% | |
5 | | Los Angeles-Long Beach-Glendale, CA | | | | $491.2 | | | | | 2.6% | | | | | 8.4% | | | | | 9.1% | | | | | 16.7% | | | | | 16.8% | |
The Account’s results for the fourth quarter of 2013 were largely consistent with office market trends at the national level. Demand for office space has historically been driven largely by job growth in the financial and professional and business services sectors. More recently, technology, media and entertainment companies have accounted for a large portion of demand in a number of markets. While job growth in the financial services sector remained steady but modest in 2013, banks and financial firms are reducing space usage in order to improve profitability. Employment growth in the professional and business services sector remained healthy and was stronger in 2013, particularly in the sector’s computer and technology industries as was
38
evident in markets like San Francisco, Seattle, Boston and New York. Continued gradual improvement in office market conditions appears likely given recent office employment growth trends coupled with minimal construction.
Industrial
Conditions in the industrial market are influenced to a large degree by growth in GDP, industrial production and international trade flows. U.S. industrial market conditions continued to improve in the fourth quarter due to ongoing growth in U.S. GDP and industrial production coupled with further improvement in global trade flows. Coastal port markets continue to be the biggest beneficiaries of the growth in trade. During the fourth quarter of 2013, the national industrial availability rate fell to 11.3% as compared to 11.7% in the third quarter of 2013. The national industrial availability rate has declined steadily since peaking at 14.5% in the second quarter of 2010.
The vacancy rate for the Account’s industrial property portfolio declined to 11.7% in the fourth quarter compared to 12.7% in the third quarter. As shown below, the vacancy rate of the Account’s properties in three of its top five industrial markets were very modest and remained well below their respective market averages. In Riverside, the Account’s top market, all of the space in the Account’s properties remained fully leased during the 4th quarter. However, the average vacancy rate of the Account’s properties in Los Angeles and Ft. Lauderdale remained high. In Los Angeles, the vacancy rate has been elevated since the recession due to the large number of smaller tenants in the Account’s properties and the recession’s detrimental effect on small companies. In Ft. Lauderdale, the average vacancy of the Account’s properties remained high due to the move-out of a large tenant from one of the Account’s properties. Space in the building, which has been subdivided to accommodate moderate-sized tenants that are more prevalent in the market, is currently being marketed. The building is one of several owned by the Account in a large industrial park; two existing mid-sized tenants recently renewed their leases at two of the Account’s other buildings.
| | | | | | | | | | | | | | | | | | | | | | Account
Square Foot
Weighted Average
Vacancy | | Market Vacancy* |
|
Sector | | Metropolitan Area | | Total Sector by
Metro Area ($M) | | % of Total
Investments | | 2013 Q4 | | 2013 Q3 | | 2013 Q4 | | 2013 Q3 |
|
Industrial | | Account/Nation | | | | | | | | 11.7% | | | | | 12.7% | | | | | 11.3% | | | | | 11.7% | |
|
1 | | Riverside-San Bernardino-Ontario, CA | | | | $572.6 | | | | | 3.0% | | | | | 0.0% | | | | | 0.0% | | | | | 8.5% | | | | | 10.0% | |
2 | | Tacoma, WA | | | | $222.8 | | | | | 1.2% | | | | | 5.2% | | | | | 12.9% | | | | | 8.3% | | | | | 9.1% | |
3 | | Dallas-Plano-Irving, TX | | | | $221.0 | | | | | 1.2% | | | | | 1.3% | | | | | 1.3% | | | | | 10.7% | | | | | 11.8% | |
4 | | Los Angeles-Long Beach-Glendale, CA | | | | $206.8 | | | | | 1.1% | | | | | 23.4% | | | | | 17.1% | | | | | 6.1% | | | | | 6.3% | |
5 | | Fort Lauderdale-Pompano Beach-Deerfield Beach, FL | | | | $159.2 | | | | | 0.8% | | | | | 20.1% | | | | | 20.9% | | | | | 13.1% | | | | | 12.8% | |
Multi-Family
U.S. apartment markets remained tight during fourth quarter 2013. The national vacancy rate averaged 5.0% versus 4.6% in third quarter 2013. However, vacancy rates were stable compared with fourth quarter 2012, as leasing activity in the fourth quarter is typically more moderate. Effective rents, which include concessions like free rent, grew 2.5-3.0% nationally, with the strongest growth reported in West Coast markets and markets with sizeable technology sectors such as San Jose, San Francisco, Seattle, Portland, Denver, and Oakland. Weaker rent growth was reported in the Northeast, particularly Washington DC, New York, and Philadelphia. Construction has increased nationally, with most of the new supply poised to hit the market in 2014 and the first half of 2015. Over the near term, however, apartment markets are expected to benefit from favorable demographic and socio-economic trends. Longer-term, Green Street Advisors notes that “new permit and start activity has leveled off due to slowing rent growth and higher construction costs. The implications for 2015-2016 rent growth expectations are positive.”
39
The vacancy rate of the Account’s multi-family portfolio remained low and stable at 6.0% in the fourth quarter of 2013 as compared with 5.9% in the third quarter. As shown in the table below, the average vacancy rate of the Account’s properties in New York and Houston remained below their respective market averages. In Denver, the average vacancy rate of the Account’s properties declined to 4.6% as a result of the healthy leasing activity but remained above the market vacancy rate 3.7%. In Los Angeles, the average vacancy rate of properties owned by the Account remained above the market average because of the recent acquisition of a newly constructed property which is in its initial lease-up. Excluding this property, the vacancy rate of the Account’s properties in Los Angeles declined to 5.6% as compared with 7.2% previously. In Washington, DC, the average vacancy rate of the Account’s properties declined to 6.0% following completion of the renovation and re-leasing of a portion of the units at one of the Account’s properties.
| | | | | | | | | | | | | | | | | | | | | | Account
Square Foot
Weighted Average
Vacancy | | Market Vacancy* |
|
Sector | | Metropolitan Area | | Total Sector by
Metro Area ($M) | | % of Total
Investments | | 2013 Q4 | | 2013 Q3 | | 2013 Q4 | | 2013 Q3 |
|
Apartment | | Account/Nation | | | | | | | | 6.0% | | | | | 5.9% | | | | | 5.0% | | | | | 4.6% | |
|
1 | | New York-White Plains-Wayne, NY-NJ | | | | $710.7 | | | | | 3.7% | | | | | 4.9% | | | | | 4.0% | | | | | 5.3% | | | | | 5.2% | |
2 | | Los Angeles-Long Beach-Glendale, CA | | | | $542.6 | | | | | 2.8% | | | | | 9.1% | | | | | 8.1% | | | | | 3.8% | | | | | 3.6% | |
3 | | Washington-Arlington-Alexandria, DC-VA-MD-WV | | | | $405.9 | | | | | 2.1% | | | | | 6.0% | | | | | 7.6% | | | | | 4.9% | | | | | 4.4% | |
4 | | Houston-Sugar Land-Baytown, TX | | | | $314.8 | | | | | 1.6% | | | | | 5.7% | | | | | 5.9% | | | | | 5.9% | | | | | 5.9% | |
5 | | Denver-Aurora, CO | | | | $264.3 | | | | | 1.4% | | | | | 4.6% | | | | | 5.4% | | | | | 3.7% | | | | | 3.2% | |
Retail
As was the case with other property sectors, U.S. retail markets experienced modest improvement during the fourth quarter and over the course of 2013. Markets have benefited partly from a rebound in consumer confidence and spending following the slump caused by the government shutdown in October 2013. Preliminary data from the U.S. Census Bureau indicate that retail sales excluding motor vehicles and parts increased 1.0% in the fourth quarter of 2013 as compared with the third quarter of 2013 and 3.1% compared with the fourth quarter of 2012. Availability rates in neighborhood and community centers declined to an average of 12.0% in the fourth quarter of 2013 as compared with 12.3% in the third quarter. However, national retailers reported mixed results for the important holiday season and remain cautious about opening new stores given ambivalent consumers and the growth in on-line sales. The vacancy rate for the Account’s retail portfolio remained low but increased to 6.1% during the fourth quarter of 2013 as compared with 4.1% in the third quarter of 2013. The vacancy rate of the Account’s retail portfolio remained below the neighborhood and community center average because the Account’s portfolio includes several high quality regional malls and lifestyle centers which have minimal vacancy.
Outlook
During the fourth quarter of 2013 and through much of 2013, commercial real estate fundamentals continued their gradual improvement as the U.S. economy grew at a moderate pace. Contributing to the improvement in fundamentals was healthy employment growth with the U.S. economy adding roughly 2.2 million jobs over the course of the year, moderate construction, and low interest rates. Though competition for top properties remained intense, commercial real estate continued to offer attractive returns over the short- and long-term compared with other asset classes. Markets with sizeable technology, energy, medical and biotechnology sectors experienced the most improvement while metro areas with sizeable U.S. government and defense sectors saw very modest improvement at best. However, the new $1.0 trillion bipartisan budget deal should strengthen consumer and business confidence and set the stage for stronger healthy economic growth in 2014. The budget agreement should also diminish near term uncertainty in markets with sizeable U.S. government and defense sectors. In addition to diminished uncertainty, the U.S. economy is expected to benefit from
40
healthy consumer spending, stronger employment growth and a resumption of federal government spending. Prospects for the global economy also appear stronger than they have in a number of years. While downside risk remains, economic conditions in much of Europe have stabilized and are improving slowly. Ongoing growth in China and other emerging markets have contributed to an uptick in global trade as evidenced by the recent increase in U.S. exports. If domestic and global economic conditions generally fall in-line with economists’ expectations, U.S. real estate market conditions are likely to experience further improvement in 2014.
Management’s 2013 investment strategy maintained a primary focus on apartment, retail and industrial properties in target markets and selective opportunities in the central business district (“CBD”) of target office markets. Disposition activities targeted properties in non-target markets and/or underperforming properties. The Account acquired two new properties during the fourth quarter of 2013. The first was a newly constructed apartment building in the Los Angeles metropolitan area; the second was a high street retail property in downtown Philadelphia. In addition, several additional properties were under contract to be purchased as of the end of the quarter, with closings expected in the first half of 2014. Disposition activity in the fourth quarter included the sale of an industrial property in a non-target market, one office property in a non-target market and four community shopping centers in non-target markets from within the Account’s joint venture investments. Management continued to bolster the Account’s income returns through aggressive property management and leasing in combination with expense management. As of the fourth quarter of 2013, the Account’s holdings were 90.7% leased as compared with 90.4% as of the third quarter of 2013. For 2013, the Account generated a 9.65% return. The Account’s real estate assets generated a 1.29% income return and a 1.28% capital return in the fourth quarter. As shown in the graph below, real estate asset returns for the fourth quarter of 2013 were the fifteenth consecutive quarter of positive income and capital returns; however, income and capital returns moderated in the fourth quarter compared with the prior two quarters.
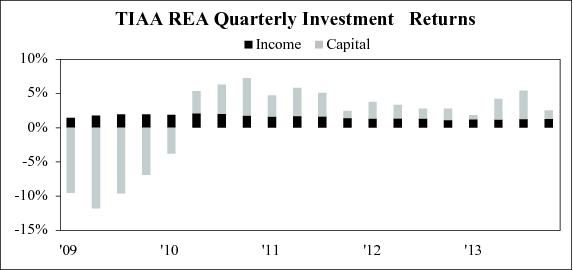
Participant inflows continued at a steady pace during the fourth quarter of 2013, with the Account maintaining a solid cash position as of the start of 2014. During 2014, management intends to manage the Account’s cash position in a manner that maintains adequate liquidity reserves for new acquisitions, the potential redemption of units from participants, the Account’s targeted cash holdings, and capital expenses for the Account’s real estate investments. Taking into account the expected short- and long-term return prospects for the four property types, Management’s anticipated acquisitions program in 2014 will focus on all four primary sectors in which the Account invests. The Account will also evaluate whether to pursue selected foreign acquisitions. In general, Management intends to maintain the Account’s diversification across property sectors at or close to its current sector weightings. In addition to ongoing investment activities, Management will carefully evaluate opportunities to place commercial mortgage debt on recent acquisitions and refinance existing debt on existing encumbered assets at lower interest rates in order to reduce the Account’s overall weighted cost of capital. However, refinancing activities will only be undertaken provided mortgage proceeds can be reinvested in real estate properties or other investments that will benefit overall Account returns.
41
A portion of the Account’s liquid assets is invested in REITs, which provides incremental exposure to U.S. commercial real estate, an attractive dividend yield, and a high degree of liquidity. The Account’s $1.5 billion portfolio consists of a mix of REIT stocks that closely replicates the FTSE NAREIT All Equity REIT index, thereby providing the Account with exposure to a diverse mix of property types and geographic markets. By effectively replicating the index, the Account portfolio avoids the risks associated with concentrated investments in any particular company or sector. The return profile of REITs is currently and has historically been favorable to corporate bonds and government agency debt, albeit with added near term volatility as compared to direct investments in commercial real estate property. The Account’s REIT investments total return, which included dividends, was -0.16% during the fourth quarter and 2.63% in 2013.
During the latter half of the year the Account began construction of a build-to-suit office building on vacant land owned by the Account in Houston. The development property will consist of a 593,856 square foot, 30-story, Class A office tower, which, at its completion, will be fully leased under a fifteen year lease with the American subsidiary of a major global energy company. The project monetizes an existing land site that is adjacent to the Account’s other real estate investment in the Houston market, and represents the Account’s first ground-up development.
Based on the economic and real estate market outlook for 2014, Management believes that the Account is solidly positioned to benefit from expected further strengthening of the U.S. economy and U.S. real estate market conditions along with investors’ focus on major metropolitan markets. Competition for top tier properties remains intense which has driven initial cash-on-cash returns to relatively low levels. Management will therefore carefully evaluate prospective acquisitions based on short- and long-term growth potential, purchase price relative to replacement cost, and portfolio diversification benefits as well as initial cash-on-cash returns. Emphasis will be given to institutional quality properties with strong occupancy histories, favorable tenant rollover schedules, and manageable capital expenses. The Account believes that a disciplined investment strategy coupled with a focus on high quality properties will position the Account for favorable long-term performance.
Investments as of December 31, 2013
As of December 31, 2013, the Account had total net assets of $16.9 billion, a 13.8% increase from December 31, 2012. The increase in the Account’s net assets from December 31, 2012 to December 31, 2013 was primarily due to net participant inflows into the Account exclusive of the liquidity unit redemptions, see “Liquidity and Capital Resources” below, and net appreciation in value of the Account’s investments.
As of December 31, 2013, the Account owned a total of 102 real estate property investments (89 of which were wholly owned, 13 of which were held in joint ventures). The real estate portfolio included 27 office property investments (including three held in joint ventures), 25 industrial property investments (including one held in a joint venture), 27 apartment property investments (including one held in a joint venture), 20 retail property investments (including seven held in joint ventures and one located in Paris, France), one 75% owned joint venture interest in a portfolio of storage facilities, one land development investment and one fee interest encumbered by a ground lease. Of the real estate property investments, 28 are subject to debt (including seven joint venture property investments).
The outstanding principal on mortgage loans payable on the Account’s wholly owned real estate portfolio as of December 31, 2013 was $2.3 billion. The Account’s proportionate share of outstanding principal on mortgage loans payable within its joint venture investments was $1.6 billion, which is netted against the underlying properties when determining the joint venture investments fair value presented on the consolidated statements of investments. When the mortgage loans payable within the joint venture investments are considered, total outstanding principal on the Account’s portfolio as of December 31, 2013 was $3.9 billion, which represented a loan to value ratio of 18.4%. The Account currently has no Account-level debt.
Management believes that the Account’s real estate portfolio is diversified by location and property type. The Account’s largest investment, 1001 Pennsylvania Avenue located in Washington, DC, represented 5.1% of total real estate investments and 3.8% of total investments. As discussed in the Account’s prospectus, the Account does not intend to buy and sell its real estate investments simply to make short-term profits. Rather, the Account’s general strategy in selling real estate investments is to dispose of those assets that management believes (i) have maximized in value, (ii) have underperformed or face deteriorating property-specific or market conditions, (iii) need significant capital infusions in the future, (iv) are appropriate to dispose of in order to remain consistent with the Account’s intent to diversify the Account by property type and
42
geographic location (including reallocating the Account’s exposure to or away from certain property types in certain geographic locations), or (v) otherwise do not satisfy the investment objectives of the Account. Management, from time to time, will evaluate the need to manage liquidity in the Account as part of its analysis as to whether to undertake a particular asset sale. The Account could reinvest any sale proceeds that it does not need to pay operating expenses or to meet debt service or redemption requests (e.g., cash withdrawals or transfers, and any redemption of TIAA’s liquidity units in the future).
During 2013, the Account purchased seven wholly owned real estate investments for $582.0 million, as displayed in the chart below.
Property Investments Acquired in 2013
| | | | | | | | (In millions) |
Property Name | | Property Type | | City | | State | | Net
Acquisition
Cost |
Wholly Owned | | | | | | | | |
Oceano at Warner Center | | Apartments | | Woodland Hills | | CA | | | $ | | 84.2 | |
Holly Street Village | | Apartments | | Pasadena | | CA | | | | 123.8 | |
Mohawk Distribution Center | | Industrial | | Teterboro | | NJ | | | | 81.1 | |
South Denver Marketplace | | Retail | | Denver | | CO | | | | 69.3 | |
Cliffs at Barton Creek | | Apartments | | Austin | | TX | | | | 36.5 | |
1619 Walnut Street | | Retail | | Philadelphia | | PA | | | | 19.4 | |
Stella | | Apartments | | Marina Del Rey | | CA | | | | 167.7 | |
| | | | | | | | |
Total | | | | | | | | | $ | | 582.0 | |
| | | | | | | | |
During 2013, the Account sold 11 wholly owned real estate investments for a net sales price of $435.8 million, while concurrently settling $219.4 million of debt associated with certain of those assets. The Account’s joint venture investments sold two real estate investments along with 12 properties that are part of the DDR Joint Venture investment, for a net sales price of $239.5 million, while concurrently settling $158.6 million of debt associated with certain of those assets, all representing the Account’s proportionate share. The Account realized a loss of $207.2 million and $154.1 million from its wholly owned real estate investment sales and from its proportionate share of real estate investment sales from within its joint venture investments, respectively.
43
Property Investments Sold in 2013
| | | | | | | | | | |
(In millions) |
Property Name | | Property Type | | City | | State | | Net
Sales Price
(less selling
expense) | | Mortgage
Loan
Payoff |
Wholly Owned | | | | | | | | | | |
Phoenix Apartment Portfolio | | Apartments | | Chandler | | AZ | | | $ | | 33.3 | | | | $ | | — | |
1 & 7 Westferry Circus | | Office | | London | | UK | | | | 193.1 | | | | | (193.1 | ) | |
Plainsboro Plaza | | Retail | | Plainsboro | | NJ | | | | 22.4 | | | | | — | |
Lincoln Woods Apartments | | Apartments | | Lafayette Hill | | PA | | | | 28.7 | | | | | — | |
South Frisco Village Shopping
Center | | Retail | | Frisco | | TX | | | | 33.9 | | | | | (26.3 | ) | |
Reserve at Sugarloaf | | Apartments | | Duluth | | GA | | | | 46.5 | | | | | — | |
The Fairways of Carolina | | Apartments | | Margate | | FL | | | | 26.5 | | | | | — | |
Quiet Waters at Coquina Lakes | | Apartments | | Deerfield Beach | | FL | | | | 27.3 | | | | | — | |
Marketfair—Liquor License | | Other | | West Windsor | | NJ | | | | 0.6 | | | | | — | |
Fernley Distribution | | Industrial | | Fernley | | NV | | | | 6.4 | | | | | — | |
Creeksides at Centerpoint | | Office | | Kent | | WA | | | | 17.1 | | | | | — | |
| | | | | | | | | | |
Total Wholly Owned | | | | | | | | | $ | | 435.8 | | | | $ | | (219.4 | ) | |
| | | | | | | | | | | |
Joint Ventures | | | | | | | | | | |
Palm Lakes Plaza(1) | | Retail | | Margate | | FL | | | $ | | 11.8 | | | | $ | | — | |
Kendall Corners(1) | | Retail | | Kendall | | FL | | | | 24.3 | | | | | — | |
Douglas Pavilion(2) | | Retail | | Douglasville | | GA | | | | 27.4 | | | | | (20.8 | ) | |
Jefferson Plaza(2) | | Retail | | Newport News | | VA | | | | 8.5 | | | | | (5.6 | ) | |
Chesterfield Crossing(2) | | Retail | | Richmond | | VA | | | | 12.3 | | | | | (9.0 | ) | |
Commonwealth Center(2) | | Retail | | Midlothian | | VA | | | | 24.9 | | | | | (17.6 | ) | |
Walks at Highwood Preserve I(2) | | Retail | | Tampa | | FL | | | | 20.8 | | | | | (16.7 | ) | |
West Colonial Center(2) | | Retail | | Orlando | | FL | | | | 4.1 | | | | | — | |
Capital Plaza(2) | | Retail | | Wake Forest | | NC | | | | 6.0 | | | | | (4.4 | ) | |
Stonebridge Plaza(2) | | Retail | | Roswell | | GA | | | | 19.5 | | | | | (13.8 | ) | |
Naugatuck Valley Shopping Center(2) | | Retail | | Waterbury | | CT | | | | 33.8 | | | | | (31.6 | ) | |
Cox Creek Shopping Center(2) | | Retail | | Florence | | AL | | | | 14.5 | | | | | (6.4 | ) | |
Suwanee Crossroads(2) | | Retail | | Suwanee | | GA | | | | 3.2 | | | | | (2.6 | ) | |
Carlisle Commons(2) | | Retail | | Carlisle | | PA | | | | 28.4 | | | | | (30.1 | ) | |
| | | | | | | | | | |
Total Joint Ventures | | | | | | | | | $ | | 239.5 | | | | $ | | (158.6 | ) | |
| | | | | | | | | | |
Total | | | | | | | | | $ | | 675.3 | | | | $ | | (378.0 | ) | |
| | | | | | | | | | |
|
(1) | | | | Properties held within the Florida Retail Portfolio investment (80% Account interest). |
|
(2) | | | | Properties held within the DDR Joint Venture investment (85% Account interest). |
44
The following charts reflect the diversification of the Account’s real estate assets by region and property type and list its ten largest investments. All information is based on the fair values of the investments at December 31, 2013.
Diversification by Fair Value(1)
| | | | | | | | | | | | |
| | East | | West | | South | | Foreign(2) | | Midwest | | Total |
Office | | | | 20.5 | % | | | | | 15.0 | % | | | | | 6.7 | % | | | | | — | | | | | 0.3 | % | | | | | 42.5 | % | |
Apartment | | | | 8.9 | % | | | | | 8.8 | % | | | | | 4.8 | % | | | | | — | | | | | — | | | | | 22.5 | % | |
Retail | | | | 3.2 | % | | | | | 4.3 | % | | | | | 8.4 | % | | | | | 1.6 | % | | | | | 0.2 | % | | | | | 17.7 | % | |
Industrial | | | | 1.3 | % | | | | | 7.4 | % | | | | | 3.6 | % | | | | | — | | | | | 0.9 | % | | | | | 13.2 | % | |
Other(3) | | | | 3.1 | % | | | | | 0.3 | % | | | | | 0.6 | % | | | | | — | | | | | 0.1 | % | | | | | 4.1 | % | |
| | | | | | | | | | | | |
Total | | | | 37.0 | % | | | | | 35.8 | % | | | | | 24.1 | % | | | | | 1.6 | % | | | | | 1.5 | % | | | | | 100.0 | % | |
| | | | | | | | | | | | |
|
(1) | | | | Wholly-owned properties are represented at fair value and gross of any debt, while joint venture properties are represented at net equity value. |
|
(2) | | | | Represents real estate investment in France. |
|
(3) | | | | Represents interest in Storage Portfolio investment, a fee interest encumbered by a ground lease real estate investment and a land development. |
Properties in the “East” region are located in: CT, DC, DE, KY, MA, MD, ME, NC, NH, NJ, NY, PA, RI, SC, VA, VT, WV
Properties in the “West” region are located in: AK, AZ, CA, CO, HI, ID, MT, NM, NV, OR, UT, WA, WY
Properties in the “South” region are located in: AL, AR, FL, GA, LA, MS, OK, TN, TX
Properties in the “Midwest” region are located in: IA, IL, IN, KS, MI, MN, MO, ND, NE, OH, SD, WI
Top Ten Largest Real Estate Investments
| | | | | | | | | | | | |
Property Investment Name | | City | | State | | Type | | Value
(in millions)(1) | | Property as a
% of Total
Real Estate
Portfolio | | Property as a
% of Total
Investments |
1001 Pennsylvania Avenue | | Washington | | DC | | Office | | | $ | | 726.7 | (2) | | | | | 5.1 | % | | | | | 3.8 | % | |
50 Fremont Street | | San Francisco | | CA | | Office | | | | 518.0 | (3) | | | | | 3.7 | % | | | | | 2.7 | % | |
The Florida Mall | | Orlando | | FL | | Retail | | | | 490.9 | (4) | | | | | 3.5 | % | | | | | 2.6 | % | |
99 High Street | | Boston | | MA | | Office | | | | 438.0 | (5) | | | | | 3.1 | % | | | | | 2.3 | % | |
Fourth and Madison | | Seattle | | WA | | Office | | | | 435.0 | (6) | | | | | 3.1 | % | | | | | 2.3 | % | |
DDR Corp. | | Various | | USA | | Retail | | | | 413.7 | (7) | | | | | 2.9 | % | | | | | 2.2 | % | |
425 Park Avenue | | New York | | NY | | Land | | | | 400.0 | | | | | 2.8 | % | | | | | 2.1 | % | |
780 Third Avenue | | New York | | NY | | Office | | | | 365.2 | (8) | | | | | 2.6 | % | | | | | 1.9 | % | |
501 Boylston Street | | Boston | | MA | | Office | | | | 364.1 | | | | | 2.6 | % | | | | | 1.9 | % | |
Ontario Industrial Portfolio | | Ontario | | CA | | Industrial | | | | 329.2 | | | | | 2.3 | % | | | | | 1.7 | % | |
|
(1) | | | | Value as reported in the December 31, 2013 Statement of Investments. Investments owned 100% by the Account are reported based on fair value. Investments in joint ventures are reported at fair value and are presented at the Account’s ownership interest. |
|
(2) | | | | This property investment is presented gross of debt. The value of the Account’s interest less the fair value of leverage was $408.6 million. |
|
(3) | | | | This property investment is presented gross of debt. The value of the Account’s interest less the fair value of leverage was $324.6 million. |
|
(4) | | | | This property investment is a 50% / 50% joint venture with Simon Property Group, L.P. and is presented net of debt. As of December 31, 2013, this debt had a fair value of $192.5 million. |
|
(5) | | | | This property investment is presented gross of debt. The value of the Account’s interest less the fair value of leverage was $253.0 million. |
|
(6) | | | | This property investment is presented gross of debt. The value of the Account’s interest less the fair value of leverage was $244.3 million. |
|
(7) | | | | This property is held in a 85% / 15% joint venture with DDR Corp., consists of 27 retail properties located in 12 states and is presented net of debt. As of December 31, 2013, this debt had a fair value of $691.0 million. |
|
(8) | | | | This property investment is presented gross of debt. The value of the Account’s interest less the fair value of leverage was $207.4 million. |
As of December 31, 2013, the Account held 73.9% of its total investments in real estate and real estate joint ventures. The Account also held investments in government agency notes representing 10.4% of total investments, real estate-related equity securities representing 7.9% of total investments, U.S. Treasury securities representing 5.9% of total investments, and real estate limited partnerships, representing 1.9% of total investments.
45
Results of Operations
Year Ended December 31, 2013 Compared to Year Ended December 31, 2012
Performance
The Account’s total return was 9.65% for the year ended December 31, 2013 as compared to 10.06% for the year ended 2012. The Account’s annualized total returns over the past one, three, five, and ten year periods ended December 31, 2013 were 9.65%, 10.89%, 2.25%, and 4.80%, respectively. As of December 31, 2013, the Account’s annualized total return since inception was 6.11%.
Net Investment Income
The table below shows the results of operations for the years ended December 31, 2013 and 2012 and the dollar and percentage changes for those periods (dollars in millions).
| | | | | | | | |
| | Years Ended
December 31, | | Change |
| | 2013 | | 2012 | | $ | | % |
INVESTMENT INCOME | | | | | | | | |
Real estate income, net: | | | | | | | | |
Rental income | | | $ | | 831.5 | | | | $ | | 872.0 | | | | $ | | (40.5 | ) | | | | | -4.6 | % | |
| | | | | | | | |
Real estate property level expenses and taxes: | | | | | | | | |
Operating expenses | | | | 202.4 | | | | | 218.2 | | | | | (15.8 | ) | | | | | -7.2 | % | |
Real estate taxes | | | | 121.3 | | | | | 119.1 | | | | | 2.2 | | | | | 1.8 | % | |
Interest expense | | | | 116.8 | | | | | 146.0 | | | | | (29.2 | ) | | | | | -20.0 | % | |
| | | | | | | | |
Total real estate property level expenses and taxes | | | | 440.5 | | | | | 483.3 | | | | | (42.8 | ) | | | | | -8.9 | % | |
| | | | | | | | |
Real estate income, net | | | | 391.0 | | | | | 388.7 | | | | | 2.3 | | | | | 0.6 | % | |
Income from real estate joint ventures and limited partnerships | | | | 104.7 | | | | | 80.9 | | | | | 23.8 | | | | | 29.4 | % | |
Interest | | | | 2.9 | | | | | 3.0 | | | | | (0.1 | ) | | | | | -3.3 | % | |
Dividends | | | | 42.2 | | | | | 32.3 | | | | | 9.9 | | | | | 30.7 | % | |
| | | | | | | | |
TOTAL INVESTMENT INCOME | | | | 540.8 | | | | | 504.9 | | | | | 35.9 | | | | | 7.1 | % | |
| | | | | | | | |
Expenses: | | | | | | | | |
Investment advisory charges | | | | 59.3 | | | | | 56.3 | | | | | 3.0 | | | | | 5.3 | % | |
Administrative charges | | | | 41.7 | | | | | 32.4 | | | | | 9.3 | | | | | 28.7 | % | |
Distribution charges | | | | 12.8 | | | | | 13.9 | | | | | (1.1 | ) | | | | | -7.9 | % | |
Mortality and expense risk charges | | | | 0.8 | | | | | 2.8 | | | | | (2.0 | ) | | | | | -71.4 | % | |
Liquidity guarantee charges | | | | 30.5 | | | | | 31.3 | | | | | (0.8 | ) | | | | | -2.6 | % | |
| | | | | | | | |
TOTAL EXPENSES | | | | 145.1 | | | | | 136.7 | | | | | 8.4 | | | | | 6.1 | % | |
| | | | | | | | |
INVESTMENT INCOME, NET | | | $ | | 395.7 | | | | $ | | 368.2 | | | | $ | | 27.5 | | | | | 7.5 | % | |
| | | | | | | | |
Rental Income:
Rental Income decreased $40.5 million or 4.6% primarily related to net disposition activity of real estate investments during 2012 and 2013. Rental income decreased $99.0 as a result of dispositions; partially offset by $42.4 million of additional rental income related to new acquisitions and $16.1 million attributed to existing real estate investments driven by higher occupancy, higher rents and lower rent concessions, most notably in the apartment and retail sectors.
Operating Expenses:
Operating expenses decreased $15.8 million or 7.2% primarily related to net disposition activity of real estate investments during 2012 and 2013. Operating expenses decreased $29.7 million as a result of dispositions; partially offset by $7.3 million of additional operating expenses related to new acquisitions and $6.6 million
46
attributed to existing real estate investments, driven most notably by higher expenses in the apartment and office sectors, due to higher occupancy.
Real Estate Taxes:
Real estate taxes increased $2.2 million or 1.8% primarily due to increased property tax assessments, most notably in the Texas and California regions.
Interest Expense:
Interest expense decreased $29.2 million or 20.0% primarily due to the extinguishment of mortgage loans with higher interest rates.
Income from Real Estate Joint Ventures and Limited Partnerships:
Income from real estate joint ventures and limited partnerships increased $23.8 million or 29.4% due primarily to three new joint venture investments during the fourth quarter of 2012, partially offset by the dispositions of several smaller investments from within the Florida Retail Portfolio and DDR joint ventures.
Interest and Dividend Income:
Interest income decreased $0.1 million or 3.3% due to decreases in short term treasury rates during the year.
Dividend income increased $9.9 million or 30.7% due primarily to the $208.6 million increase in the cost of real estate-related marketable securities.
Expenses:
The Account’s expenses increased $8.4 million or 6.1%. Investment advisory, administrative and distribution charges are costs charged to the Account associated with managing the Account. These costs have fixed and variable components, the latter of which generally correspond to the level of the Account’s net assets under management. These costs increased 10.9% during 2013, generally corresponding to the 13.8% increase in the Account’s net assets from December 31, 2012 to December 31, 2013.
Mortality and expense risk and liquidity guarantee charges are contractual charges to the Account from TIAA for TIAA’s assumption of these risks and provision of the guarantee. The rate for these charges generally is established annually effective May 1 for each twelve month period ending each April 30 and is charged based on the Account’s net assets. Even though net assets increased in 2013 compared to 2012, mortality and expense risk charges decreased as a result of the change in such rates.
47
Net Realized and Unrealized Gains and Losses on Investments and Mortgage Loans Payable
The table below shows the net realized and unrealized gains (losses) on investments and mortgage loans payable for the years ended December 31, 2013 and 2012 and the dollar and percentage changes for those periods (dollars in millions).
| | | | | | | | |
| | Years Ended
December 31, | | Change |
| | 2013 | | 2012 | | $ | | % |
NET REALIZED AND UNREALIZED GAIN (LOSS) ON INVESTMENTS AND MORTGAGE LOANS PAYABLE | | | | | | | | |
Net realized gain (loss) on investments: | | | | | | | | |
Real estate properties | | | $ | | (210.0 | ) | | | | $ | | (11.3 | ) | | | | $ | | (198.7 | ) | | | | | N/M | |
Real estate joint ventures and limited partnerships | | | | (153.0 | ) | | | | | (104.5 | ) | | | | | (48.5 | ) | | | | | -46.4 | % | |
Marketable securities | | | | 31.6 | | | | | 53.7 | | | | | (22.1 | ) | | | | | -41.2 | % | |
| | | | | | | | |
Total realized loss on investments: | | | | (331.4 | ) | | | | | (62.1 | ) | | | | | (269.3 | ) | | | | | N/M | | |
| | | | | | | | |
Net change in unrealized appreciation (depreciation) on: | | | | | | | | |
Real estate properties | | | | 863.1 | | | | | 555.8 | | | | | 307.3 | | | | | 55.3 | % | |
Real estate joint ventures and limited partnerships | | | | 479.0 | | | | | 424.1 | | | | | 54.9 | | | | | 12.9 | % | |
Marketable securities | | | | (41.7 | ) | | | | | 126.8 | | | | | (168.5 | ) | | | | | N/M | |
Mortgage loans payable | | | | 91.2 | | | | | (33.4 | ) | | | | | 124.6 | | | | | N/M | |
| | | | | | | | |
Net change in unrealized appreciation on investments and mortgage loans payable | | | | 1,391.6 | | | | | 1,073.3 | | | | | 318.3 | | | | | 29.7 | % | |
| | | | | | | | |
NET REALIZED AND UNREALIZED GAIN ON INVESTMENTS AND MORTGAGE LOANS PAYABLE | | | $ | | 1,060.2 | | | | $ | | 1,011.2 | | | | $ | | 49.0 | | | | | 4.8 | % | |
| | | | | | | | |
N/M—Not meaningful
Real Estate Properties:
Real estate properties experienced net realized and unrealized gains of $653.1 million for the year as compared to net realized and unrealized gains of $544.5 million for 2012.
Net realized losses in the Account are due to the sale of real estate property investments during 2013. See theRecent Transactionssection herein for additional discussions regarding the sale of real estate property investments.
Net unrealized gains in the Account increased primarily as a result of improved occupancy, continued compression in capitalization rates, and increased market rents. The largest increases were experienced in the office sector, with larger increases in the Boston, San Francisco and Washington D.C. markets. These increases were offset by foreign exchange losses of $4.8 million during the year as compared to foreign exchange gains of $14.6 million during 2012.
Real Estate Joint Ventures and Limited Partnerships:
Real estate joint ventures and limited partnerships experienced net realized and unrealized gains of $326.0 million for the year ended December 31, 2013 compared to net realized and unrealized gains of $319.6 million for 2012.
Net realized losses related to the Account’s investments in joint ventures and limited partnerships are primarily due to the sale of real estate property investments underlying the Account’s joint venture investments during 2013. See theRecent Transactionssection herein for additional discussions regarding the sale of real estate property investments.
Net unrealized appreciation increased $54.9 million as compared to 2012. The largest increases were experienced in the retail sector, specifically in the Florida market.
48
Marketable Securities:
The Account’s marketable securities experienced net realized and unrealized losses of $10.1 million for the year as compared to net realized and unrealized gains of $180.5 million for 2012. At December 31, 2013 the Account’s real estate related marketable securities were $1.5 billion as compared to $1.3 billion at December 31, 2012, an increase of $167.0 million or 12.5%. During 2013 the markets for REITs in the United States decreased as measured by the FTSE NAREIT All Equity REITs Index. The Account’s real estate related equity securities depreciated in line with these market movements.
Additionally, the Account held $3.1 billion of short term marketable securities invested in government agency notes and United States Treasury Securities, which had nominal appreciation due to the short term nature of these investments.
Mortgage Loans Payable:
Mortgage loans payable experienced unrealized gains of $91.2 million for the year compared to unrealized losses of $33.4 million for 2012. Valuation adjustments to mortgage loans payable are highly dependent upon interest rates, investment return demands, the performance of the underlying real estate investment, and where applicable, foreign exchange rates. The increase in unrealized gains during the year was primarily due to increases in 10-year treasury rates as well as favorable foreign exchange rates, resulting in exchange gains of $16.0 million as compared to foreign exchange losses of $9.4 million during 2012.
Year Ended December 31, 2012 Compared to Year Ended December 31, 2011
Performance
The Account’s total return was 10.06% for the year ended December 31, 2012 as compared to 12.99% for the year ended 2011. The Account’s performance during the year ended December 31, 2012 decreased as the velocity of the overall economic and real estate market recoveries slowed and reduced net participant inflows as a result of the $150,000 participant account restriction effective March 31, 2011, being in place throughout 2012, and the $940.3 million redemption of the TIAA Liquidity Units.
The Account’s annualized total returns over the past one, three, five, and ten year periods ended December 31, 2012 were 10.06%, 12.11%, -2.63%, and 4.60%, respectively. As of December 31, 2012, the Account’s annualized total return since inception was 5.91%.
49
Net Investment Income
The table below shows the results of operations for the years ended December 31, 2012 and 2011 and the dollar and percentage changes for those periods (dollars in millions).
| | | | | | | | |
| | Years Ended
December 31, | | Change |
| | 2012 | | 2011 | | $ | | % |
INVESTMENT INCOME | | | | | | | | |
Real estate income, net: | | | | | | | | |
Rental income | | | $ | | 872.0 | | | | $ | | 874.1 | | | | $ | | (2.1 | ) | | | | | -0.2 | % | |
| | | | | | | | |
Real estate property level expenses and taxes: | | | | | | | | |
Operating expenses | | | | 218.2 | | | | | 217.8 | | | | | 0.4 | | | | | 0.2 | % | |
Real estate taxes | | | | 119.1 | | | | | 111.5 | | | | | 7.6 | | | | | 6.8 | % | |
Interest expense | | | | 146.0 | | | | | 109.2 | | | | | 36.8 | | | | | 33.7 | % | |
| | | | | | | | |
Total real estate property level expenses and taxes | | | | 483.3 | | | | | 438.5 | | | | | 44.8 | | | | | 10.2 | % | |
| | | | | | | | |
Real estate income, net | | | | 388.7 | | | | | 435.6 | | | | | (46.9 | ) | | | | | -10.8 | % | |
Income from real estate joint ventures and limited partnerships | | | | 80.9 | | | | | 86.4 | | | | | (5.5 | ) | | | | | -6.4 | % | |
Interest | | | | 3.0 | | | | | 3.3 | | | | | (0.3 | ) | | | | | -9.1 | % | |
Dividends | | | | 32.3 | | | | | 19.1 | | | | | 13.2 | | | | | 69.1 | % | |
| | | | | | | | |
TOTAL INVESTMENT INCOME | | | | 504.9 | | | | | 544.4 | | | | | (39.5 | ) | | | | | -7.3 | % | |
| | | | | | | | |
Expenses: | | | | | | | | |
Investment advisory charges | | | | 56.3 | | | | | 53.9 | | | | | 2.4 | | | | | 4.5 | % | |
Administrative charges | | | | 32.4 | | | | | 28.7 | | | | | 3.7 | | | | | 12.9 | % | |
Distribution charges | | | | 13.9 | | | | | 8.8 | | | | | 5.1 | | | | | 58.0 | % | |
Mortality and expense risk charges | | | | 2.8 | | | | | 6.2 | | | | | (3.4 | ) | | | | | -54.8 | % | |
Liquidity guarantee charges | | | | 31.3 | | | | | 23.7 | | | | | 7.6 | | | | | 32.1 | % | |
| | | | | | | | |
TOTAL EXPENSES | | | | 136.7 | | | | | 121.3 | | | | | 15.4 | | | | | 12.7 | % | |
| | | | | | | | |
INVESTMENT INCOME, NET | | | $ | | 368.2 | | | | $ | | 423.1 | | | | $ | | (54.9 | ) | | | | | -13.0 | % | |
| | | | | | | | |
Rental Income:
Rental income decreased by $2.1 million or 0.2% for the year ended December 31, 2012 as compared to the comparable period in 2011. Rental income increased in the Account’s residential, retail and industrial sectors and land by $23.6 million, $12.0 million, $1.5 million and $4.5 million, respectively, specifically due to acquisitions. These increases were offset by a decrease in the Account’s office sector of $43.7 million during the year, $14.4 million of this decrease related to dispositions. The remaining $29.3 million of the decrease was due to tenant vacancies in the California and Connecticut regions. Furthermore, the Account recognized approximately $20.2 million in early termination fee income in 2011 which did not occur in 2012.
Operating Expenses:
Operating expenses increased slightly by $0.4 million or 0.2% for the year ended December 31, 2012 as compared to the comparable period of 2011. The increase is primarily due to acquisitions in the residential and retail sectors offset by dispositions in the office sector.
Real Estate Taxes:
The $7.6 million or 6.8% increase in real estate taxes for the year ended December 31, 2012 as compared to the comparable period of 2011 was attributed to property acquisitions during 2012 coupled with increased tax values primarily in the apartment and office sectors.
50
Interest Expense:
The $36.8 million or 33.7% increase in interest expense for the year ended December 31, 2012 as compared to the comparable period of 2011 was primarily due to the refinancing of debt on four real estate investments.
Income from Real Estate Joint Ventures and Limited Partnerships:
Income from real estate joint ventures and limited partnerships decreased $5.5 million or 6.4% during the year ended 2012 compared to the comparable period of 2011. The decrease was attributed to decreased distributions from the joint ventures and limited partnerships, primarily the DDR joint venture, as a result of debt restructuring activity as well as the disposition of several joint venture assets during 2012.
Dividend and Interest Income:
Dividend and interest income increased $12.9 million from the comparable period of 2011. The increase in dividend income can be directly attributed to the Account’s increased investment in real estate related securities held of $1.3 billion as compared to $927.9 million for the periods ended December 31, 2012 and 2011, respectively.
Expenses:
The Account’s expenses increased $15.4 million or 12.7% for the year ended 2012 as compared to the comparable period of 2011. The increase in Account level expenses was due to the increase in the Account’s average net assets throughout the year ended December 31, 2012. The Account’s average net assets for 2012 increased 16.8% when compared to the Account’s average net assets for 2011. However, as a basis point (“bp”) charge to the Account, expenses have decreased from 98 bp during 2011 to 95 bp during 2012, a reduction of 3 bps. Investment advisory, administrative and distribution charges are costs charged to the Account associated with managing the Account. Investment advisory costs are primarily fixed, with some variable components. Administrative and distribution charges generally correspond to the level of assets under management. Mortality and expense risk charges decreased 3 bps during 2012. The decrease in mortality and expense risk charges during the year was primarily driven by a decrease of participants annuitizing into the Account as well as changes in participant mortality assumptions. SeeNote 2—Management Agreements and Arrangementsto the consolidated financial statements included herein for further discussion related to these expenses.
51
Net Realized and Unrealized Gains and Losses on Investments and Mortgage Loans Payable
The table below shows the net realized and unrealized gains (losses) on investments and mortgage loans payable for the years ended December 31, 2012 and 2011 and the dollar and percentage changes for those periods (dollars in millions).
| | | | | | | | |
| | Years Ended
December 31, | | Change |
| | 2012 | | 2011 | | $ | | % |
NET REALIZED AND UNREALIZED GAIN (LOSS) ON INVESTMENTS AND MORTGAGE LOANS PAYABLE | | | | | | | | |
Net realized gain (loss) on investments: | | | | | | | | |
Real estate properties | | | $ | | (11.3 | ) | | | | $ | | (41.7 | ) | | | | $ | | 30.4 | | | | | 72.9 | % | |
Real estate joint ventures and limited partnerships | | | | (104.5 | ) | | | | | (70.5 | ) | | | | | (34.0 | ) | | | | | -48.2 | % | |
Marketable securities | | | | 53.7 | | | | | 6.5 | | | | | 47.2 | | | | | N/M | |
| | | | | | | | |
Total realized loss on investments: | | | | (62.1 | ) | | | | | (105.7 | ) | | | | | 43.6 | | | | | 41.2 | % | |
| | | | | | | | |
Net change in unrealized appreciation (depreciation) on: | | | | | | | | |
Real estate properties | | | | 555.8 | | | | | 829.9 | | | | | (274.1 | ) | | | | | -33.0 | % | |
Real estate joint ventures and limited partnerships | | | | 424.1 | | | | | 331.0 | | | | | 93.1 | | | | | 28.1 | % | |
Marketable securities | | | | 126.8 | | | | | 21.5 | | | | | 105.3 | | | | | N/M | |
Mortgage loans payable | | | | (33.4 | ) | | | | | (0.7 | ) | | | | | (32.7 | ) | | | | | N/M | |
| | | | | | | | |
Net change in unrealized appreciation on investments and mortgage loans payable | | | | 1,073.3 | | | | | 1,181.7 | | | | | (108.4 | ) | | | | | -9.2 | % | |
| | | | | | | | |
NET REALIZED AND UNREALIZED GAIN ON INVESTMENTS AND MORTGAGE LOANS PAYABLE | | | $ | | 1,011.2 | | | | $ | | 1,076.0 | | | | $ | | (64.8 | ) | | | | | -6.0 | % | |
| | | | | | | | |
Real Estate Properties:
During the year ended December 31, 2012, the Account experienced net realized and unrealized gains on real estate properties of $544.5 million compared to net realized and unrealized gain of $788.2 million for the comparable period of 2011.
Net realized losses in the Account are due to the sale of real estate property investments during 2012.
Net unrealized gains in the Account continue to be driven by improved but stabilizing market conditions in 2012 but at a decreased rate than that experienced during the comparable period of 2011. Included within the net unrealized gains discussed above, were foreign exchange gains of $14.6 million for the year ended December 31, 2012 as compared to losses of $3.3 million for the comparable period of 2011 related to the Account’s foreign investment properties.
Real Estate Joint Ventures and Limited Partnerships:
Real estate joint ventures and limited partnerships experienced net realized and unrealized gains of $319.6 million for the year ended December 31, 2012 compared to net realized and unrealized gains of $260.5 million for the comparable period of 2011.
Net realized losses related to the Account’s investments in joint ventures and limited partnerships are primarily due to the sale of real estate property investments underlying the Account’s joint venture investments during 2012.
Net unrealized appreciation increased $93.1 million or 28.1% compared to the comparable period of 2011, due to the Account’s increased investments in joint ventures during 2012.
Marketable Securities:
The Account’s marketable securities positions experienced net realized and unrealized gains of $180.5 million as compared to $28.0 million for the comparable period of 2011. The increase is directly attributable to the Account’s increased investment in real estate related marketable securities (primarily REITs). At December 31, 2012 the Account’s real estate related marketable securities were $1.3 billion as compared
52
to $927.9 million as of December 31, 2011, an increase of $404.4 million or 43.6%. During 2012 the markets for REITs in the United States increased approximately 15.6% as measured by the FTSE NAREIT All Equity REITs Index. The Account’s real estate related equity securities appreciated in line with these market movements.
Additionally, the Account held $2.6 billion of short term marketable securities invested in government agency notes and United States Treasury Securities, which had nominal appreciation due to the short term nature of these investments.
Mortgage Loans Payable:
Mortgage loans payable experienced unrealized losses of $33.4 million for the year ended December 31, 2012 compared to unrealized losses of $0.7 million for the comparable period of 2011. Valuation adjustments to mortgage loans payable are highly dependent upon interest rates, investment return demands, the performance of the underlying real estate investment, and where applicable, foreign exchange rates. The increase in unrealized losses during the year ended December 31, 2012 was primarily due to unfavorable foreign exchange rates resulting in exchanges losses of $9.4 million, $18.5 million accrued for anticipated mortgage loan extinguishments associated with the Account’s property investment located in London, England, and $5.4 million related to valuation changes in mortgage loans.
Liquidity and Capital Resources
As of December 31, 2013 and 2012, the Account’s cash and cash equivalents and non-real estate-related marketable securities had a value of $3.1 billion and $2.6 billion, respectively (18.5% and 17.4% of the Account’s net assets at such dates, respectively).
Year Ended December 31, 2013 compared to Year Ended December 31, 2012
During the year ended December 31, 2013, the Account received $2.3 billion in premiums, which included $1.3 billion of participant transfers into the Account. The Account had outflows of $1.3 billion in annuity payments, withdrawals (excluding liquidity unit redemptions) and death benefits, which included $673.9 million of participant transfers out of the Account. The Account had outflows of $325.4 million related to redemptions of liquidity units during the year. During the year ended December 31, 2012, the Account received $1.9 billion in premiums, which included $1.1 billion of participant transfers into the Account. The Account had outflows of $1.0 billion in annuity payments, withdrawals and death benefits, which included $466.9 million of participant transfers out of the Account. The Account had outflows of $940.3 million related to redemptions of liquidity units during the year ended December 31, 2012. SeeRedemption of Liquidity Units section below for additional discussions related to the redemption of liquidity units.
Liquidity Guarantee
Primarily as a result of significant net participant transfers out of the Account during late 2008 and mid-2009, pursuant to TIAA’s existing liquidity guarantee obligation, the TIAA General Account purchased $1.2 billion of liquidity units issued by the Account in a number of separate transactions between December 2008 and June 2009. Subsequent to June 2009, the TIAA General Account did not purchase any additional liquidity units. As disclosed under “Establishing and Managing the Account—the Role of TIAA—Liquidity Guarantee” in the Account’s prospectus, in accordance with this liquidity guarantee obligation, TIAA guarantees that all participants in the Account may redeem their accumulation units at their accumulation unit value next determined after their transfer or cash withdrawal request is received in good order.
Net participant transfers out of the Account significantly slowed following the first quarter of 2009, and net participant transfer activity turned to net inflows in early 2010, which has continued through the date of this report. As a result, while management cannot predict whether any future TIAA liquidity unit purchases will be required under this liquidity guarantee, it is unlikely that additional purchases will be required in the near term. However, management cannot predict for how long net inflows will continue to occur. If net outflows were to occur (even if not at the same intensity as in 2008 and early 2009), it could have a negative impact on
53
the Account’s operations and returns and could require TIAA to purchase additional liquidity units, perhaps to a significant degree, as was the case in late 2008 and early 2009.
TIAA’s obligation to provide Account participants liquidity through purchases of liquidity units is not subject to an express regulatory or contractual limitation, although as described in the paragraph below, the independent fiduciary may (but is not obligated to) require the reduction of TIAA’s interest through sales of assets from the Account if TIAA’s interest exceeds the trigger point. Even if the independent fiduciary so requires TIAA’s obligation to provide liquidity under the guarantee, which is required by the New York State Department of Financial Services, will continue. Management also believes that TIAA has the ability to meet its obligations under this liquidity guarantee.
Whenever TIAA owns liquidity units, the duties of the Account’s independent fiduciary, as part of its monitoring of the Account, include reviewing the purchase and redemption of liquidity units by TIAA to ensure the Account uses the correct accumulation unit values. In addition, the independent fiduciary’s responsibilities include:
|
• | | | | establishing the percentage of total accumulation units that TIAA’s ownership should not exceed (the “trigger point”) and creating a method for reviewing the trigger point; |
|
• | | | | approving any adjustment of TIAA’s ownership interest in the Account and, in its discretion, requiring an adjustment if TIAA’s ownership of liquidity units reaches the trigger point; and |
|
• | | | | once the trigger point has been reached, participating in any program to reduce TIAA’s ownership in the Account by utilizing cash flow or liquid investments in the Account, or by utilizing the proceeds from asset sales. If the independent fiduciary were to determine that TIAA’s ownership should be reduced following the trigger point, its role in participating in any asset sales program would include (i) participating in the selection of properties for sale, (ii) providing sales guidelines and (iii) approving those sales if, in the independent fiduciary’s opinion, such sales are desirable to reduce TIAA’s ownership of liquidity units. |
In establishing the appropriate trigger point, including whether or not to require certain actions once the trigger point has been reached, the independent fiduciary will assess, among other things and to the extent consistent with the Prohibited Transaction Exemption (PTE 96-76) issued by the U.S. Department of Labor in 1996 with respect to the liquidity guarantee and the independent fiduciary’s duties under ERISA, the risk that a conflict of interest could arise due to the level of TIAA’s ownership interest in the Account.
Redemption of Liquidity Units. The independent fiduciary is vested with oversight and approval over any redemption of TIAA’s liquidity units, acting in the best interests of Real Estate Account participants.
As of March 31, 2013, the independent fiduciary completed the systematic redemption of all of the liquidity units held by the TIAA General Account. Approximately one-quarter of such units were redeemed evenly over the business days in each of the months of June, September, and December 2012, and March 2013, representing a total of $1.3 billion redeemed during this period.
Net Income and Marketable Securities
The Account’s net investment income continues to be an additional source of liquidity for the Account. Net investment income was $395.7 million for the year ended December 31, 2013 as compared to $368.2 million during 2012. Total net investment income increased as described more fully in theResults of Operations section above.
As of December 31, 2013, cash and cash equivalents, along with real estate-related and non-real estate-related marketable securities comprised 27.4% of the Account’s net assets. The Account’s real estate-related marketable securities primarily consist of publicly traded REITS. The Account’s liquid assets continue to be available to purchase additional suitable real estate properties, meet the Account’s debt obligations, expense needs, and participant redemption requests (i.e., cash withdrawals, benefit payments, or transfers).
Leverage
The Account may borrow money and assume or obtain a mortgage on a property to make leveraged real estate investments. Also, to meet any short-term cash needs, the Account may obtain a line of credit that
54
may be unsecured and/or contain terms that may require the Account to secure the loan with one or more of its properties.
The Account is authorized to borrow money in accordance with its investment guidelines. Under the Account’s current investment guidelines, the Account’s loan to value ratio (as described below) is to be maintained at or below 30%. Such incurrences of debt from time to time may include:
|
• | | | | placing new debt on properties; |
|
• | | | | refinancing outstanding debt; |
|
• | | | | assuming debt on acquired properties or interests in the Account’s properties; and/or |
|
• | | | | long term extensions of the maturity date of outstanding debt. |
In calculating this limit, only the Account’s actual percentage interest in any borrowings is included, and not that percentage interest held by any joint venture partner. Further, the Account may only borrow up to 70% of the then-current value of a property, although construction loans may be for 100% of the costs incurred in developing a property. As of December 31, 2013, there were no amounts outstanding on the construction loan secured by a real estate investment held within the Account. Also, at the time the Account (or a joint venture in which the Account is a partner) enters into a revolving line of credit, management deems the maximum amount which may be drawn under that line of credit as fully incurred, regardless of whether the maximum amount available has been drawn from time to time.
As of December 31, 2013, the Account’s ratio of outstanding principal amount of debt (inclusive of the Account’s proportionate share of debt held within its joint venture investments) to total gross asset value (i.e., a “loan to value ratio”) was 18.4%. The Account intends to maintain its loan to value ratio at or below 30% (this ratio is measured at the time of incurrence and after giving effect thereto). The Account’s total gross asset value, for these purposes, is equal to the total fair value of the Account’s assets (including the fair value of the Account’s interest in joint ventures), with no reduction associated with any indebtedness on such assets.
As of December 31, 2013, $222.7 million in principal amount of mortgage obligations secured by real estate investments wholly owned by the Account are obligated to be paid throughout 2014. The Account currently has sufficient liquidity in the form of cash and cash equivalents and short term securities to meet its current mortgage obligations.
In times of high net inflow activity, in particular during times of high net participant transfer inflows, management may determine to apply a portion of such cash flows to make prepayments of indebtedness prior to scheduled maturity, which would have the effect of reducing the Account’s loan to value ratio.
Recent Transactions
The following describes property transactions by the Account during the fourth quarter of 2013. Except as noted, the expenses for operating the properties purchased are either borne or reimbursed, in whole or in part, by the property tenants, although the terms vary under each lease. The Account is responsible for operating expenses not reimbursed under the terms of a lease. All rental rates are quoted on an annual basis unless otherwise noted.
Purchases
1619 Walnut Street—Philadelphia, PA
On November 6, 2013, the Account purchased a retail property located in Philadelphia, Pennsylvania for $19.4 million. 1619 Walnut Street is a six story, 34,047 square feet (“SF”) building anchored by ULTA Beauty, which occupies 13,647 SF on three floors. The remaining space is occupied by two office tenants, Keller Williams and Neiman Group. At the time of purchase, the property was 100% leased.
55
Stella—Marina Del Rey, CA
On November 26, 2013, the Account purchased a multi-use property located in Marina Del Rey, California for $167.7 million. Stella was recently constructed and consists of 244 units, occupying 236,775 SF in two residential buildings, one four story and one five story, which sit on top of a podium deck and retail space totaling 8,652 SF. The residential space is in its initial lease up phase and was 80% leased at the time of purchase, while the retail space was 100% leased to FedEx and a restaurant.
Sales
DDR Joint Venture—Waterbury, CT
On November 8, 2013, a retail property in Waterbury, Connecticut was sold by the Account’s DDR joint venture investment in which the Account holds an 85.0% interest. The Account’s portion of the net sales price was $33.8 million. The Account realized a loss from the sale of $27.0 million, the majority of which had been previously recognized as unrealized losses in the Account’s consolidated statement of operations. The Account’s portion of its cost basis in the property at the date of sale was $60.8 million. Concurrent with this sale, the Account settled its portion of the outstanding mortgage obligation for this investment in the amount of $31.6 million.
DDR Joint Venture—Various, USA
On December 13, 2013, two retail properties, one located in Florence, Alabama and the other in Suwanee, Georgia, were sold by the Account’s DDR joint venture investment in which the Account holds an 85.0% interest. The Account’s portion of the net sales price was $17.7 million. The Account realized a loss from the sale of $24.1 million, the majority of which had been previously recognized as unrealized losses in the Account’s consolidated statement of operations. The Account’s portion of its cost basis in these two properties at the date of sale was $41.8 million. Concurrent with this sale, the Account settled its portion of the outstanding mortgage obligations for these two investments in the amount of $9.0 million.
Fernley Distribution—Fernley, NV
On December 19, 2013, the Account sold an industrial property located in Fernley, Nevada for a net sales price of $6.4 million, realizing a loss from the sale of $5.4 million, the majority of which had been previously recognized as unrealized losses in the Account’s consolidated statement of operations. The Account’s cost basis in the property at the date of sale was $11.8 million.
Creeksides at Centerpoint—Kent, WA
On December 19, 2013, the Account sold an office property located in Kent, Washington for a net sales price of $17.1 million, realizing a loss from the sale of $30.0 million, the majority of which had been previously recognized as unrealized losses in the Account’s consolidated statement of operations. The Account’s cost basis in the property at the date of sale was $47.1 million.
DDR Joint Venture—Carlisle, PA
On December 20, 2013, a retail property in Carlisle, Pennsylvania was sold by the Account’s DDR joint venture investment in which the Account holds an 85.0% interest. The Account’s portion of the net sales price was $28.4 million. The Account realized a loss from the sale of $15.6 million, the majority of which had been previously recognized as unrealized losses in the Account’s consolidated statement of operations. The Account’s portion of its cost basis in the property at the date of sale was $44.0 million. Concurrent with this sale, the Account settled its portion of the outstanding mortgage obligation for this investment in the amount of $30.1 million.
56
Financings
Windsor at Lenox Park—Atlanta, GA
On November 1, 2013, the Account extinguished a $24.0 million mortgage loan associated with the property.
San Montego Apartments—Houston, TX
On November 1, 2013, the Account extinguished a $21.8 million mortgage loan associated with the property.
Montecito Apartments—Houston, TX
On November 1, 2013, the Account extinguished a $20.2 million mortgage loan associated with the property.
Phoenician Apartments—Houston, TX
On November 1, 2013, the Account extinguished a $21.3 million mortgage loan associated with the property.
Five Oaks—Houston, TX
On December 20, 2013, the Account entered into a construction loan for up to $160 million to help finance development of an office property. During its initial three year term, the loan is interest only with a variable interest rate equal to the 30-Day London Interbank Offered Rate (LIBOR) plus 1.70%, declining to 1.45% at project stabilization. At December 31, 2013, no amounts were outstanding on this loan.
DDR Joint Venture—Various, USA
On December 20, 2013, the Account’s DDR joint venture investment restructured its outstanding $182.3 million term loan (the Account’s share) which is collateralized by 11 properties held within the DDR joint venture. As part of the restructuring, the debt’s interest rate was reduced to LIBOR plus 1.80%, maturing February 2017.
Contractual Obligations
The following table sets forth a summary regarding the Account’s known contractual obligations, including required interest payments for those items that are interest bearing, as of December 31, 2013 (amounts in millions):
| | | | | | | | | | | | | | |
| | Amounts Due During Years Ending December 31, |
| | 2014 | | 2015 | | 2016 | | 2017 | | 2018 | | Thereafter | | Total |
Mortgage Loans Payable: | | | | | | | | | | | | | | |
Principal Payments | | | $ | | 222.7 | | | | $ | | 185.8 | | | | $ | | 188.5 | | | | $ | | 51.9 | | | | $ | | 16.8 | | | | $ | | 1,642.0 | | | | $ | | 2,307.7 | |
Interest Payments(1) | | | | 97.4 | | | | | 88.0 | | | | | 71.0 | | | | | 67.2 | | | | | 65.2 | | | | | 251.2 | | | | | 640.0 | |
| | | | | | | | | | | | | | |
Total Mortgage Loans Payable | | | $ | | 320.1 | | | | $ | | 273.8 | | | | $ | | 259.5 | | | | $ | | 119.1 | | | | $ | | 82.0 | | | | $ | | 1,893.2 | | | | $ | | 2,947.7 | |
Other Commitments(2) | | | | 0.5 | | | | | — | | | | | — | | | | | — | | | | | — | | | | | — | | | | | 0.5 | |
Tenant improvements(3) | | | | 74.1 | | | | | — | | | | | — | | | | | — | | | | | — | | | | | — | | | | | 74.1 | |
| | | | | | | | | | | | | | |
Total Contractual Obligations | | | $ | | 394.7 | | | | $ | | 273.8 | | | | $ | | 259.5 | | | | $ | | 119.1 | | | | $ | | 82.0 | | | | $ | | 1,893.2 | | | | $ | | 3,022.3 | |
| | | | | | | | | | | | | | |
|
(1) | | | | These amounts represent interest payments due on mortgage loans payable based on the stated rates at December 31, 2013. |
|
(2) | | | | This includes the Account’s commitment to purchase interest in its limited partnerships, which could be called by the partner at any time. |
|
(3) | | | | This amount represents tenant improvements and leasing inducements committed by the Account as of December 31, 2013. |
Note that the Contractual Obligations table above does not include payments on debt held in joint ventures, which are the obligation of the individual joint venture entities.
Effects of Inflation and Increasing Operating Expenses
Inflation, along with increased insurance, taxes, utilities and security costs, may increase property operating expenses in the future. Any such increases in operating expenses are generally billed to tenants either
57
through contractual lease provisions in office, industrial, and retail properties or through rent increases in apartment complexes. The Account remains responsible for the expenses for unleased space in a property as well as expenses which may not be reimbursed under the terms of an existing lease.
Critical Accounting Policies
The consolidated financial statements of the Account are prepared in conformity with accounting principles generally accepted in the United States of America.
In preparing the Account’s consolidated financial statements, management is required to make estimates and judgments that affect the reported amounts of assets, liabilities, revenues, and expenses. Management bases its estimates on historical experience and assumptions that are believed to be reasonable under the circumstances, the results of which form the basis for making judgments about the carrying value of assets and liabilities that are not readily apparent from other sources. Actual results may differ from these estimates.
Determination of Investments at Fair Value:The Account reports all investments and investment related mortgage loans payable at fair value. The Financial Accounting Standards Board ("FASB") has defined fair value as the price that would be received to sell an asset or paid to transfer a liability in an orderly transaction between market participants.
The following is a description of the valuation methodologies used to determine the fair value of the Account’s investments and investment related mortgage payables.
Valuation of Real Estate Properties—Investments in real estate properties are stated at fair value, as determined in accordance with policies and procedures reviewed by the Investment Committee of the Board and in accordance with the responsibilities of the Board as a whole. Accordingly, the Account does not record depreciation. Determination of fair value involves judgment because the actual fair value of real estate can be determined only by negotiation between the parties in a sales transaction. The Account’s primary objective when valuing its real estate investments will be to produce a valuation that represents a reasonable estimate of the fair value of its investments. Implicit in the Account’s definition of fair value are the consummation of a sale as of a specified date and the passing of title from seller to buyer under conditions whereby:
|
• | | | | Buyer and seller are typically motivated; |
|
• | | | | Both parties are well informed or well advised, and acting in what they consider their best interests; |
|
• | | | | A reasonable time is allowed for exposure in the open market; |
|
• | | | | Payment is made in terms of cash or in terms of financial arrangements comparable thereto; and |
|
• | | | | The price represents the normal consideration for the property sold unaffected by special or creative financing or sales concessions granted by anyone associated with the sale. |
Property and investment values are affected by, among other things, the availability of capital, occupancy rates, rental rates, and interest and inflation rates. As a result, determining real estate and investment values involves many assumptions. Key inputs and assumptions include rental income and expense amounts, related rental income and expense growth rates, discount rates and capitalization rates. Valuation techniques include discounted cash flow analysis, prevailing market capitalization rates or multiples applied to earnings from the property, analysis of recent comparable sales transactions, actual sale negotiations and bona fide purchase offers received from third parties. Amounts ultimately realized from each investment may vary significantly from the fair value presented.
Real estate properties owned by the Account are initially valued based on an independent third party appraisal, as reviewed by TIAA’s internal appraisal staff and as applicable the Account’s independent fiduciary at the time of the closing of the purchase, which may result in a potential unrealized gain or loss reflecting the difference between an investment’s fair value (i.e., exit price) and its cost basis (which is inclusive of transaction costs).
Subsequently, each property is appraised each quarter by an independent third party appraiser, reviewed by TIAA’s internal appraisal staff and as applicable the Account’s independent fiduciary. In general, the
58
Account obtains appraisals of its real estate properties spread out throughout the quarter, which is intended to result in appraisal adjustments, and thus, adjustments to the valuations of its holdings (to the extent such adjustments are made) that happen regularly throughout each quarter and not on one specific day or month in each period.
Further, management reserves the right to order an appraisal and/or conduct another valuation outside of the normal quarterly process when facts or circumstances at a specific property change. For example, under certain circumstances a valuation adjustment could be made when the Account receives a bona fide bid for the sale of a property held within the Account or one of the Account’s joint ventures. In addition, adjustments may be made for events or circumstances indicating an impairment of a tenant’s ability to pay amounts due to the Account under a lease (including due to a bankruptcy filing of that tenant). Alternatively, adjustments may be made to reflect the execution or renewal of a significant lease. Also, adjustments may be made to reflect factors (such as sales values for comparable properties or local employment rate) bearing uniquely on a particular region in which the Account holds properties. TIAA’s internal appraisal staff oversees the entire appraisal process, in conjunction with the Account’s independent fiduciary (the independent fiduciary is more fully described in the paragraph below). Any differences in the conclusions of TIAA’s internal appraisal staff and the independent appraiser will be reviewed by the independent fiduciary, which will make a final determination on the matter (which may include ordering a subsequent independent appraisal).
The independent fiduciary, Real Estate Research Corporation, has been appointed by a special subcommittee of the Investment Committee of the Board to, among other things, oversee the appraisal process. The independent fiduciary must approve all independent appraisers used by the Account. All appraisals are performed in accordance with Uniform Standards of Professional Appraisal Practices, the real estate appraisal industry standards created by The Appraisal Foundation. Real estate appraisals are estimates of property values based on a professional’s opinion. Appraisals of properties held outside of the U.S. are performed in accordance with industry standards commonly applied in the applicable jurisdiction. These independent appraisers are always expected to be MAI-designated members of the Appraisal Institute (or its European equivalent, Royal Institute of Chartered Surveyors) and state certified appraisers from national or regional firms with relevant property type experience and market knowledge. Under the Account’s current procedures, each independent appraisal firm will be rotated off of a particular property at least every three years, although such appraisal firm may perform appraisals of other Account properties subsequent to such rotation.
Also, the independent fiduciary can require additional appraisals if factors or events have occurred that could materially change a property’s value (including those identified above) and such change is not reflected in the quarterly valuation review, or otherwise to ensure that the Account is valued appropriately. The independent fiduciary must also approve any valuation change of real estate-related assets where a property’s value changed by more than 6% from the most recent independent annual appraisal, or if the value of the Account would change by more than 4% within any calendar quarter or more than 2% since the prior calendar month. When a real estate property is subject to a mortgage, the property is valued independently of the mortgage and the property and mortgage fair values are reported separately (seeValuation of Mortgage Loans Payable below). The independent fiduciary reviews and approves all mortgage valuation adjustments before such adjustments are recorded by the Account. The Account continues to use the revised value for each real estate property and mortgage loan payable to calculate the Account’s daily net asset value until the next valuation review or appraisal.
Valuation of Real Estate Joint Ventures—Real estate joint ventures are stated at the fair value of the Account’s ownership interests of the underlying entities. The Account’s ownership interests are valued based on the fair value of the underlying real estate, any related mortgage loans payable, and other factors, such as ownership percentage, ownership rights, buy/sell agreements, distribution provisions and capital call obligations. Upon the disposition of all real estate investments by an investee entity, the Account will continue to state its equity in the remaining net assets of the investee entity during the wind down period, if any, which occurs prior to the dissolution of the investee entity.
Valuation of Real Estate Limited Partnerships—Limited partnership interests are stated at the fair value of the Account’s ownership in the partnership which are recorded based upon the changes in the net asset values of the limited partnerships as determined from the financial statements of the limited partnerships when received by the Account. Prior to the receipt of the financial statements from the limited partnerships,
59
the Account estimates the value of its interest in good faith and will from time to time seek input from the issuer or the sponsor of the investments. Since market quotations are not readily available, the limited partnership interests are valued at fair value as determined in good faith by management under the direction of the Investment Committee of the Board and in accordance with the responsibilities of the Board as a whole.
Valuation of Marketable Securities—Equity securities listed or traded on any national market or exchange are valued at the last sale price as of the close of the principal securities market or exchange on which such securities are traded or, if there is no sale, at the mean of the last bid and asked prices on such market or exchange, exclusive of transaction costs.
Debt securities, other than money market instruments, are generally valued at the most recent bid price or the equivalent quoted yield for such securities (or those of comparable maturity, quality and type). Money market instruments, with maturities of one year or less, are valued in the same manner as debt securities or derived from a pricing matrix.
Short-term investments with maturities of 60 days or less (excluding money market instruments) are valued at amortized cost. Short-term investments with maturities in excess of 60 days (excluding money market instruments) are valued in the same manner as debt securities, as described above.
Money market instruments are valued at amortized cost.
Equity and fixed income securities traded on a foreign exchange or in foreign markets are valued using their closing values under the valuation methods generally accepted in the country where traded, as of the valuation date. This value is converted to U.S. dollars at the exchange rate in effect on the valuation day. Under certain circumstances (for example, if there are significant movements in the United States markets and there is an expectation the securities traded on foreign markets will adjust based on such movements when the foreign markets open the next day), the Account may adjust the value of equity or fixed income securities that trade on a foreign exchange or market after the foreign exchange or market has closed.
Valuation of Mortgage Loans Payable—Mortgage loans payable are stated at fair value. The estimated fair value of mortgage loans payable are based on the amount at which the liability could be transferred to a third party exclusive of transaction costs. Mortgage loans payable are valued internally by TIAA’s internal valuation department, as reviewed by the Account’s independent fiduciary, at least quarterly based on market factors, such as market interest rates and spreads for comparable loans, the performance of the underlying collateral (such as the loan-to-value ratio and the cash flow of the underlying collateral), the liquidity for mortgage loans of similar characteristics, the maturity date of the loan, the return demands of the market.
Foreign Currency Transactions and Translation: Portfolio investments and other assets and liabilities denominated in foreign currencies are translated into U.S. dollars at the exchange rates prevailing at the end of the period. Purchases and sales of securities, income receipts and expense payments made in foreign currencies are translated into U.S. dollars at the exchange rates prevailing on the respective dates of the transactions. The effect of any changes in foreign currency exchange rates on portfolio investments and mortgage loans payable are included in net realized and unrealized gains and losses on real estate properties and mortgage loans payable. Net realized gains and losses on foreign currency transactions include disposition of foreign currencies, and currency gains and losses between the accrual and receipt dates of portfolio investment income and between the trade and settlement dates of portfolio investment transactions.
Accumulation and Annuity Funds:The accumulation fund represents the net assets attributable to participants in the accumulation phase of their investment (“Accumulation Fund”). The annuity fund represents the net assets attributable to the participants currently receiving annuity payments (“Annuity Fund”). The net increase or decrease in net assets from investment operations is apportioned between the accounts based upon their relative daily net asset values. Once an Account participant begins receiving lifetime annuity income benefits, payment levels cannot be reduced as a result of the Account’s adverse mortality experience. In addition, the contracts pursuant to which the Account is offered are required to stipulate the maximum expense charge for all Account level expenses that can be assessed, which is not to exceed 2.5% of average net assets per year. The Account pays a fee to TIAA to assume mortality and expense risks.
60
Accounting for Investments:The investments held by the Account are accounted for as follows:
Real Estate Properties—Rent from real estate properties consists of all amounts earned under tenant operating leases, including base rent, recoveries of real estate taxes and other expenses and charges for miscellaneous services provided to tenants. Rental income is recognized in accordance with the billing terms of the lease agreements. The Account bears the direct expenses of the real estate properties owned. These expenses include, but are not limited to, fees to local property management companies, property taxes, utilities, maintenance, repairs, insurance, and other operating and administrative costs. An estimate of the net operating income earned from each real estate property is accrued by the Account on a daily basis and such estimates are adjusted when actual operating results are determined.
Real Estate Joint Ventures—The Account has limited ownership interests in various real estate joint ventures (collectively, the “joint ventures”). The Account records its contributions as increases to its investments in the joint ventures, and distributions from the joint ventures are treated as income within income from real estate joint ventures and limited partnerships in the Account’s consolidated statements of operations. Distributions that are identified as returns of capital are recorded as a reduction to the cost basis of the investment, whereas distributions identified as capital gains or losses are recorded as realized gains or losses. Income from the joint ventures is recorded based on the Account’s proportional interest of the income distributed by the joint ventures. Income earned by the joint ventures, but not yet distributed to the Account by the joint ventures is recorded as unrealized gains and losses.
Limited Partnerships—The Account has limited ownership interests in various private real estate funds (primarily limited partnerships) and a private real estate investment trust (collectively, the “limited partnerships”). The Account records its contributions as increases to the investments, and distributions from the investments are treated as income within income from real estate joint ventures and limited partnerships in the Account’s consolidated statements of operations. Distributions that are identified as returns of capital are recorded as a reduction to the cost basis of the investment, whereas distributions identified as capital gains or losses are recorded as realized gains or losses. Unrealized gains and losses are recorded based upon the changes in the net asset values of the limited partnerships as determined from the financial statements of the limited partnerships when received by the Account. Prior to the receipt of the financial statements from the limited partnerships, the Account estimates the value of its interest in good faith and will from time to time seek input from the issuer or the sponsor of the investment. Changes in value based on such estimates are recorded by the Account as unrealized gains and losses.
Marketable Securities—Transactions in marketable securities are accounted for as of the date the securities are purchased or sold (trade date). Interest income is recorded as earned. Dividend income is recorded on the ex-dividend date within dividend income. Dividends that are identified as returns of capital are recorded as a reduction to the cost basis of the investment, whereas dividends identified as capital gains or losses are recorded as realized gains or losses. Realized gains and losses on securities transactions are accounted for on the specific identification method.
Realized and Unrealized Gains and Losses—Unrealized gains and losses are recorded as the fair values of the Account’s investments are adjusted, and as discussed within theReal Estate Joint VenturesandLimited Partnershipssectionsabove. Realized gains and losses are recorded at the time an investment is sold or a distribution is received from the joint ventures or limited partnerships. Real estate transactions are accounted for as of the date on which the purchase or sale transactions for the real estate properties close (settlement date). The Account recognizes a realized gain on the sale of a real estate property to the extent that the contract sales price exceeds the cost-to-date of the property being sold. A realized loss occurs when the cost-to-date exceeds the sales price.
Net Assets—The Account’s net assets as of the close of each valuation day are valued by taking the sum of:
|
• | | | | the value of the Account’s cash; cash equivalents, and short-term and other debt instruments; |
|
• | | | | the value of the Account’s other securities and other non-real estate assets; |
|
• | | | | the value of the individual real properties (based on the most recent valuation of that property) and other real estate-related investments owned by the Account; |
61
|
• | | | | an estimate of the net operating income accrued by the Account from its properties, other real estate-related investments and non-real estate-related investments (including short-term marketable securities) since the end of the prior valuation day; and |
|
• | | | | actual net operating income earned from the Account’s properties, other real estate-related investments and non-real estate-related investments (but only to the extent any such item of income differs from the estimated income accrued for on such investments), |
and then reducing the sum by liabilities held within the Account, including the daily investment management fee, administration and distribution fees and certain other expenses attributable to operating the Account.
After the end of every quarter, the Account reconciles the amount of expenses deducted from the Account (which is established in order to approximate the costs that the Account will incur) with the expenses the Account actually incurred. If there is a difference, the Account adds it to or deducts it from the Account in equal daily installments over the remaining days of the following quarter. Material differences may be repaid in the current calendar quarter. The Account’s at-cost deductions are based on projections of Account assets and overall expenses, and the size of any adjusting payments will be directly affected by the difference between management’s projections and the Account’s actual assets or expenses.
Federal Income Taxes:Based on provisions of the Internal Revenue Code, Section 817, the Account is taxed as a segregated asset account of TIAA and as such, the Account should incur no material federal income tax attributable to the net investment activity of the Account.
ITEM 7A. QUANTITATIVE AND QUALITATIVE DISCLOSURES ABOUT MARKET RISK.
The Account’s real estate holdings, including real estate joint ventures and limited partnerships, which, as of December 31, 2013, represented 75.8% of the Account’s total investments, expose the Account to a variety of risks. These risks include, but are not limited to:
|
• | | | | General Real Estate Risk—The risk that the Account’s property values or rental and occupancy rates could go down due to general economic conditions, a weak market for real estate generally, disruptions in the credit and/or capital markets, or changing supply and demand for certain types of properties; |
|
• | | | | Appraisal Risk—The risk that the sale price of an Account property (i.e., the value that would be determined by negotiations between independent parties) might differ substantially from its estimated or appraised value, leading to losses or reduced profits to the Account upon sale; |
|
• | | | | Risk Relating to Property Sales—The risk that the Account might not be able to sell a property at a particular time for its full value, particularly in a poor market. This might make it difficult to raise cash quickly and also could lead to Account losses; |
|
• | | | | Risks of Borrowing—The risk that interest rate changes may impact Account returns if the Account takes out a mortgage on a property, buys a property subject to a mortgage or holds a property subject to a mortgage, and hedging against such interest rate changes, if undertaken by the Account, may entail additional costs and be unsuccessful; and |
|
• | | | | Foreign Currency Risk—The risk that the value of the Account’s foreign investments, related debt, or rental income could increase or decrease due to changes in foreign currency exchange rates or foreign currency exchange control regulations, and hedging against such currency changes, if undertaken by the Account, may entail additional costs and be unsuccessful. |
The Account believes the diversification of its real estate portfolio, both geographically and by sector, along with its quarterly valuation procedure, helps manage the real estate and appraisal risks described above.
As of December 31, 2013, 24.2% of the Account’s total investments were comprised of marketable securities. Marketable securities include high-quality debt instruments (i.e., government agency notes) and REIT securities. The consolidated statement of investments for the Account sets forth the general financial terms of these instruments, along with their fair values, as determined in accordance with procedures described earlier in Critical Accounting Policies section above and inNote 1—Organization and Significant Accounting Policiesto the Account’s consolidated financial statements included herewith. As of the date of this report,
62
the Account does not invest in derivative financial investments, nor does the Account engage in any hedging activity, although it may do so in selected circumstances in the future.
Risks associated with investments in real estate-related liquid assets (which could include, from time to time, REIT securities and CMBS), and non-real estate-related liquid assets, including financial/credit risk, market volatility risk, interest rate volatility risk and deposit/money market risk.
|
• | | | | Financial/Credit Risk—The risk, for debt securities, that the issuer will not be able to pay principal and interest when due (and/or declare bankruptcy or be subject to receivership) and, for equity securities such as common or preferred stock, that the issuer’s current earnings will fall or that its overall financial soundness will decline, reducing the security’s value. |
|
• | | | | Market Volatility Risk—The risk that the Account’s investments will experience price volatility due to changing conditions in the financial markets regardless of the credit quality or financial condition of the underlying issuer. This risk is particularly acute to the extent the Account holds equity securities, which have experienced significant short-term price volatility over the past year. Also, to the extent the Account holds debt securities, changes in overall interest rates can cause price fluctuations. |
|
• | | | | Interest Rate Volatility—The risk that interest rate volatility may affect the Account’s current income from an investment. |
|
• | | | | Deposit/Money Market Risk—The risk that, to the extent the Account’s cash held in bank deposit accounts exceeds federally insured limits as to that bank, the Account could experience losses if banks fail. The Account does not believe it has exposure to significant concentration of deposit risk. In addition, there is some risk that investments held in money market accounts can suffer losses. |
In addition, to the extent the Account were to hold mortgage-backed securities (including commercial mortgage-backed securities) these securities are subject to prepayment risk or extension risk (i.e., the risk that borrowers will repay the loans earlier or later than anticipated). If the underlying mortgage assets experience faster than anticipated repayments of principal, the Account could fail to recoup some or all of its initial investment in these securities, since the original price paid by the Account was based in part on assumptions regarding the receipt of interest payments. If the underlying mortgage assets are repaid later than anticipated, the Account could lose the opportunity to reinvest the anticipated cash flows at a time when interest rates might be rising. The rate of prepayment depends on a variety of geographic, social and other functions, including prevailing market interest rates and general economic factors. The fair value of these securities is also highly sensitive to changes in interest rates. Note that the potential for appreciation, which could otherwise be expected to result from a decline in interest rates, may be limited by any increased prepayments. These securities may be harder to sell than other securities.
In addition to these risks, real estate equity securities (such as REIT stocks and mortgage-backed securities) would be subject to many of the same general risks inherent in real estate investing, making mortgage loans and investing in debt securities. For more information on the risks associated with all of the Account’s investments, see Item 1A. “Risk Factors” in this Form 10-K.
63
ITEM 8. CONSOLIDATED FINANCIAL STATEMENTS AND SUPPLEMENTARY DATA.
INDEX TO CONSOLIDATED FINANCIAL STATEMENTS
TIAA REAL ESTATE ACCOUNT
64
REPORT OF MANAGEMENT RESPONSIBILITY
To the Participants of the
TIAA Real Estate Account:
The accompanying consolidated financial statements of the TIAA Real Estate Account (“Account”) of Teachers Insurance and Annuity Association of America (“TIAA”) are the responsibility of TIAA’s management. They have been prepared in accordance with accounting principles generally accepted in the United States of America and have been presented fairly and objectively in accordance with such principles.
TIAA has established and maintains an effective system of internal controls over financial reporting designed to provide reasonable assurance that assets are properly safeguarded, that transactions are properly executed in accordance with management’s authorization, and to carry out the ongoing responsibilities of management for reliable consolidated financial statements. In addition, TIAA’s internal audit personnel provide regular reviews and assessments of the internal controls and operations of the Account, and the Senior Vice President of Internal Audit regularly reports to the Audit Committee of the TIAA Board of Trustees.
The independent registered public accounting firm of PricewaterhouseCoopers LLP has audited the accompanying consolidated financial statements for the years ended December 31, 2013, 2012 and 2011. To maintain auditor independence and avoid even the appearance of a conflict of interest, it continues to be the Account’s policy (consistent with TIAA’s specific auditor independence policies, which are designed to avoid such conflicts) that any management advisory or consulting services would be obtained from a firm other than the independent accounting firm. The independent auditors’ report expresses an independent opinion on the fairness of presentation of the Account’s consolidated financial statements.
The Audit Committee of the TIAA Board of Trustees, comprised entirely of independent, non-management trustees, meets regularly with management, representatives of the independent registered public accounting firm and internal audit group personnel to review matters relating to financial reporting, internal controls and auditing. In addition to the annual independent audit of the Account’s consolidated financial statements, the New York State Insurance Department and other state insurance departments regularly examine the operations and consolidated financial statements of the Account as part of their periodic corporate examinations.
| | |
March 13, 2014 | | /s/ Robert G. Leary |
| | Robert G. Leary
Executive Vice President and
President, Asset Management |
| | /s/ Virginia M. Wilson |
| | Virginia M. Wilson
Executive Vice President and
Chief Financial Officer |
65
REPORT OF THE AUDIT COMMITTEE
To the Participants of the
TIAA Real Estate Account:
The TIAA Audit Committee (“Committee”) oversees the financial reporting process of the TIAA Real Estate Account (“Account”) on behalf of TIAA’s Board of Trustees. The Committee operates in accordance with a formal written charter (copies of which are available upon request) which describes the Audit Committee’s responsibilities. All members of the Committee are independent, as defined under the listing standards of the New York Stock Exchange.
Management has the primary responsibility for the Account’s consolidated financial statements, development and maintenance of a strong system of internal controls and disclosure controls, and compliance with applicable laws and regulations. In fulfilling its oversight responsibilities, the Committee reviewed and approved the audit plans of the internal audit group and the independent registered public accounting firm in connection with their respective audits of the Account. The Committee also meets regularly with the internal audit group and the independent registered public accounting firm, both with and without management present, to discuss the results of their examinations, their evaluation of internal controls, and the overall quality of financial reporting. As required by its charter, the Committee will evaluate rotation of the independent registered public accounting firm whenever circumstances warrant, but in no event will the evaluation be later than between their fifth and tenth years of service.
The Committee reviewed and discussed the accompanying audited consolidated financial statements with management, including a discussion of the quality and appropriateness of the accounting principles and financial reporting practices followed, the reasonableness of significant judgments, and the clarity and completeness of disclosures in the consolidated financial statements. The Committee has also discussed the audited consolidated financial statements with PricewaterhouseCoopers LLP, the independent registered public accounting firm responsible for expressing an opinion on the conformity of these audited consolidated financial statements with accounting principles generally accepted in the United States of America.
The discussion with PricewaterhouseCoopers LLP focused on their judgments concerning the quality and appropriateness of the accounting principles and financial reporting practices followed by the Account, the clarity and completeness of the consolidated financial statements and related disclosures, and other significant matters, such as any significant changes in accounting policies, internal controls, management judgments and estimates, and the nature of any uncertainties or unusual transactions. In addition, the Committee discussed with PricewaterhouseCoopers LLP the auditors’ independence from management and the Account, and has received a written disclosure regarding such independence, as required by the Securities and Exchange Commission.
Based on the review and discussions referred to above, the Committee has approved the release of the accompanying audited consolidated financial statements for publication and filing with appropriate regulatory authorities.
Jeffrey R. Brown, Audit Committee Chair
Lisa W. Hess, Audit Committee Member
Lawrence H. Linden, Audit Committee Member
Donald K. Peterson, Audit Committee Member
March 13, 2014
66
TIAA REAL ESTATE ACCOUNT
CONSOLIDATED STATEMENTS OF ASSETS AND LIABILITIES
(In millions, except per accumulation unit amounts)
| | | | |
| | December 31,
2013 | | December 31,
2012 |
ASSETS | | | | |
Investments, at fair value: | | | | |
Real estate properties
(cost: $10,679.5 and $10,543.6) | | | $ | | 11,565.1 | | | | $ | | 10,554.6 | |
Real estate joint ventures and limited partnerships
(cost: $2,424.7 and $2,553.8) | | | | 2,925.6 | | | | | 2,631.3 | |
Marketable securities: | | | | |
Real estate related
(cost: $1,384.3 and $1,175.7) | | | | 1,499.3 | | | | | 1,332.3 | |
Other
(cost: $3,119.3 and $2,569.3) | | | | 3,119.6 | | | | | 2,569.7 | |
| | | | |
Total investments
(cost: $17,607.8 and $16,842.4) | | | | 19,109.6 | | | | | 17,087.9 | |
| | | | |
Cash and cash equivalents | | | | 14.6 | | | | | 21.7 | |
Due from investment advisor | | | | 2.5 | | | | | — | |
Other | | | | 290.4 | | | | | 269.0 | |
| | | | |
TOTAL ASSETS | | | | 19,417.1 | | | | | 17,378.6 | |
| | | | |
LIABILITIES | | | | |
Mortgage loans payable, at fair value—Note 9
(principal outstanding: $2,307.7 and $2,253.8) | | | | 2,279.1 | | | | | 2,282.6 | |
Due to investment advisor | | | | — | | | | | 10.6 | |
Accrued real estate property level expenses | | | | 198.6 | | | | | 185.8 | |
Other | | | | 31.5 | | | | | 38.5 | |
| | | | |
TOTAL LIABILITIES | | | | 2,509.2 | | | | | 2,517.5 | |
| | | | |
COMMITMENTS AND CONTINGENCIES—Note 12 | | | | |
NET ASSETS | | | | |
Accumulation Fund | | | | 16,535.4 | | | | | 14,523.0 | |
Annuity Fund | | | | 372.5 | | | | | 338.1 | |
| | | | |
TOTAL NET ASSETS | | | $ | | 16,907.9 | | | | $ | | 14,861.1 | |
| | | | |
NUMBER OF ACCUMULATION UNITS OUTSTANDING—Note 11 | | | | 55.3 | | | | | 53.3 | |
| | | | |
NET ASSET VALUE, PER ACCUMULATION UNIT—Note 10 | | | $ | | 298.872 | | | | $ | | 272.569 | |
| | | | |
See notes to the consolidated financial statements
67
TIAA REAL ESTATE ACCOUNT
CONSOLIDATED STATEMENTS OF OPERATIONS
(In millions)
| | | | | | |
| | Years Ended December 31, |
| | 2013 | | 2012 | | 2011 |
INVESTMENT INCOME | | | | | | |
Real estate income, net: | | | | | | |
Rental income | | | $ | | 831.5 | | | | $ | | 872.0 | | | | $ | | 874.1 | |
| | | | | | |
Real estate property level expenses and taxes: | | | | | | |
Operating expenses | | | | 202.4 | | | | | 218.2 | | | | | 217.8 | |
Real estate taxes | | | | 121.3 | | | | | 119.1 | | | | | 111.5 | |
Interest expense | | | | 116.8 | | | | | 146.0 | | | | | 109.2 | |
| | | | | | |
Total real estate property level expenses and taxes | | | | 440.5 | | | | | 483.3 | | | | | 438.5 | |
| | | | | | |
Real estate income, net | | | | 391.0 | | | | | 388.7 | | | | | 435.6 | |
Income from real estate joint ventures and limited partnerships | | | | 104.7 | | | | | 80.9 | | | | | 86.4 | |
Interest | | | | 2.9 | | | | | 3.0 | | | | | 3.3 | |
Dividends | | | | 42.2 | | | | | 32.3 | | | | | 19.1 | |
| | | | | | |
TOTAL INVESTMENT INCOME | | | | 540.8 | | | | | 504.9 | | | | | 544.4 | |
| | | | | | |
Expenses: | | | | | | |
Investment advisory charges | | | | 59.3 | | | | | 56.3 | | | | | 53.9 | |
Administrative charges | | | | 41.7 | | | | | 32.4 | | | | | 28.7 | |
Distribution charges | | | | 12.8 | | | | | 13.9 | | | | | 8.8 | |
Mortality and expense risk charges | | | | 0.8 | | | | | 2.8 | | | | | 6.2 | |
Liquidity guarantee charges | | | | 30.5 | | | | | 31.3 | | | | | 23.7 | |
| | | | | | |
TOTAL EXPENSES | | | | 145.1 | | | | | 136.7 | | | | | 121.3 | |
| | | | | | |
INVESTMENT INCOME, NET | | | | 395.7 | | | | | 368.2 | | | | | 423.1 | |
| | | | | | |
NET REALIZED AND UNREALIZED GAIN (LOSS) ON
INVESTMENTS AND MORTGAGE LOANS PAYABLE | | | | | | |
Net realized gain (loss) on investments: | | | | | | |
Real estate properties | | | | (210.0 | ) | | | | | (11.3 | ) | | | | | (41.7 | ) | |
Real estate joint ventures and limited partnerships | | | | (153.0 | ) | | | | | (104.5 | ) | | | | | (70.5 | ) | |
Marketable securities | | | | 31.6 | | | | | 53.7 | | | | | 6.5 | |
| | | | | | |
Net realized loss on investments | | | | (331.4 | ) | | | | | (62.1 | ) | | | | | (105.7 | ) | |
| | | | | | |
Net change in unrealized appreciation (depreciation) on: | | | | | | |
Real estate properties | | | | 863.1 | | | | | 555.8 | | | | | 829.9 | |
Real estate joint ventures and limited partnerships | | | | 479.0 | | | | | 424.1 | | | | | 331.0 | |
Marketable securities | | | | (41.7 | ) | | | | | 126.8 | | | | | 21.5 | |
Mortgage loans payable | | | | 91.2 | | | | | (33.4 | ) | | | | | (0.7 | ) | |
| | | | | | |
Net change in unrealized appreciation on
investments and mortgage loans payable | | | | 1,391.6 | | | | | 1,073.3 | | | | | 1,181.7 | |
| | | | | | |
NET REALIZED AND UNREALIZED
GAIN ON INVESTMENTS AND
MORTGAGE LOANS PAYABLE | | | | 1,060.2 | | | | | 1,011.2 | | | | | 1,076.0 | |
| | | | | | |
NET INCREASE IN NET ASSETS
RESULTING FROM OPERATIONS | | | $ | | 1,455.9 | | | | $ | | 1,379.4 | | | | $ | | 1,499.1 | |
| | | | | | |
See notes to the consolidated financial statements
68
TIAA REAL ESTATE ACCOUNT
CONSOLIDATED STATEMENTS OF CHANGES IN NET ASSETS
(In millions)
| | | | | | |
| | Years Ended December 31, |
| | 2013 | | 2012 | | 2011 |
FROM OPERATIONS | | | | | | |
Investment income, net | | | $ | | 395.7 | | | | $ | | 368.2 | | | | $ | | 423.1 | |
Net realized loss on investments | | | | (331.4 | ) | | | | | (62.1 | ) | | | | | (105.7 | ) | |
Net change in unrealized appreciation on investments and mortgage loans payable | | | | 1,391.6 | | | | | 1,073.3 | | | | | 1,181.7 | |
| | | | | | |
NET INCREASE IN NET ASSETS
RESULTING FROM OPERATIONS | | | | 1,455.9 | | | | | 1,379.4 | | | | | 1,499.1 | |
| | | | | | |
FROM PARTICIPANT TRANSACTIONS | | | | | | |
Premiums | | | | 2,251.0 | | | | | 1,923.5 | | | | | 2,321.0 | |
Liquidity units redeemed—Note 3 | | | | (325.4 | ) | | | | | (940.3 | ) | | | | | — | |
Annuity payments | | | | (28.3 | ) | | | | | (25.1 | ) | | | | | (24.3 | ) | |
Withdrawals and death benefits | | | | (1,306.4 | ) | | | | | (1,003.6 | ) | | | | | (1,071.7 | ) | |
| | | | | | |
NET INCREASE (DECREASE) IN NET
ASSETS RESULTING FROM
PARTICIPANT TRANSACTIONS | | | | 590.9 | | | | | (45.5 | ) | | | | | 1,225.0 | |
| | | | | | |
NET INCREASE IN NET ASSETS | | | | 2,046.8 | | | | | 1,333.9 | | | | | 2,724.1 | |
NET ASSETS | | | | | | |
Beginning of period | | | | 14,861.1 | | | | | 13,527.2 | | | | | 10,803.1 | |
| | | | | | |
End of period | | | $ | | 16,907.9 | | | | $ | | 14,861.1 | | | | $ | | 13,527.2 | |
| | | | | | |
See notes to the consolidated financial statements
69
TIAA REAL ESTATE ACCOUNT
CONSOLIDATED STATEMENTS OF CASH FLOWS
(In millions)
| | | | | | |
| | Years Ended December 31, |
| | 2013 | | 2012 | | 2011 |
CASH FLOWS FROM OPERATING ACTIVITIES | | | | | | |
Net increase in net assets resulting from operations | | | $ | | 1,455.9 | | | | $ | | 1,379.4 | | | | $ | | 1,499.1 | |
Adjustments to reconcile net changes in net assets resulting from operations to net cash used in operating activities: | | | | | | |
Deferred financing costs | | | | — | | | | | 3.8 | | | | | — | |
Net realized loss on investments | | | | 331.4 | | | | | 62.1 | | | | | 105.7 | |
Net change in unrealized appreciation on investments and mortgage loans payable | | | | (1,391.6 | ) | | | | | (1,073.3 | ) | | | | | (1,181.7 | ) | |
Purchase of real estate properties | | | | (582.0 | ) | | | | | (619.3 | ) | | | | | (1,108.9 | ) | |
Capital improvements on real estate properties | | | | (196.1 | ) | | | | | (186.3 | ) | | | | | (162.7 | ) | |
Proceeds from sale of real estate properties | | | | 435.8 | | | | | 449.8 | | | | | 335.9 | |
Purchases of long term investments | | | | (370.2 | ) | | | | | (1,076.6 | ) | | | | | (465.7 | ) | |
Proceeds from sale of long term investments | | | | 224.9 | | | | | 675.5 | | | | | 38.3 | |
(Increase) decrease in other investments | | | | (550.0 | ) | | | | | 233.3 | | | | | (392.3 | ) | |
Change in due to (from) investment advisor | | | | (13.1 | ) | | | | | 17.4 | | | | | 4.2 | |
Increase in other assets | | | | (21.4 | ) | | | | | (30.6 | ) | | | | | (61.3 | ) | |
Increase in other liabilities | | | | 8.6 | | | | | 15.6 | | | | | 1.8 | |
| | | | | | |
NET CASH USED IN
OPERATING ACTIVITIES | | | | (667.8 | ) | | | | | (149.2 | ) | | | | | (1,387.6 | ) | |
| | | | | | |
CASH FLOWS FROM FINANCING ACTIVITIES | | | | | | |
Mortgage loan proceeds received | | | | 900.0 | | | | | 208.1 | | | | | 185.0 | |
Payments of mortgage loans | | | | (830.2 | ) | | | | | (9.2 | ) | | | | | (17.8 | ) | |
Premiums | | | | 2,251.0 | | | | | 1,923.5 | | | | | 2,321.0 | |
Liquidity units redeemed | | | | (325.4 | ) | | | | | (940.3 | ) | | | | | — | |
Annuity payments | | | | (28.3 | ) | | | | | (25.1 | ) | | | | | (24.3 | ) | |
Withdrawals and death benefits | | | | (1,306.4 | ) | | | | | (1,003.6 | ) | | | | | (1,071.7 | ) | |
| | | | | | |
NET CASH PROVIDED BY
FINANCING ACTIVITIES | | | | 660.7 | | | | | 153.4 | | | | | 1,392.2 | |
| | | | | | |
NET INCREASE (DECREASE) IN
CASH AND CASH EQUIVALENTS | | | | (7.1 | ) | | | | | 4.2 | | | | | 4.6 | |
CASH AND CASH EQUIVALENTS | | | | | | |
Beginning of period | | | | 21.7 | | | | | 17.5 | | | | | 12.9 | |
| | | | | | |
End of period | | | $ | | 14.6 | | | | $ | | 21.7 | | | | $ | | 17.5 | |
| | | | | | |
SUPPLEMENTAL DISCLOSURES: | | | | | | |
Cash paid for interest | | | $ | | 116.2 | | | | $ | | 117.0 | | | | $ | | 109.2 | |
| | | | | | |
Debt assumed in acquisition of property | | | $ | | — | | | | $ | | 36.9 | | | | $ | | — | |
| | | | | | |
See notes to the consolidated financial statements
70
TIAA REAL ESTATE ACCOUNT
NOTES TO THE CONSOLIDATED FINANCIAL STATEMENTS
Note 1—Organization and Significant Accounting Policies
Business:The TIAA Real Estate Account (“Account”) is a segregated investment account of Teachers Insurance and Annuity Association of America (“TIAA”) and was established by resolution of TIAA’s Board of Trustees (the “Board”) on February 22, 1995, under the insurance laws of the State of New York, for the purpose of funding variable annuity contracts issued by TIAA. The Account offers individual and group accumulating annuity contracts (with contributions made on a pre-tax or after-tax basis), as well as individual lifetime and term-certain variable payout annuity contracts (including the payment of death benefits to beneficiaries). Investors are entitled to transfer funds to or from the Account, and make withdrawals from the Account on a daily basis under certain circumstances. Funds invested in the Account for each category of contract are expressed in terms of units, and unit values will fluctuate depending on the Account’s performance.
The investment objective of the Account is to seek favorable long-term returns primarily through rental income and capital appreciation from real estate and real estate-related investments owned by the Account. The Account holds real estate properties directly and through subsidiaries wholly owned by TIAA for the benefit of the Account. The Account also holds interests in real estate joint ventures and limited partnerships in which the Account does not hold a controlling interest; as such, such interests are not consolidated into these consolidated financial statements. The Account also has invested in mortgage loans receivable collateralized by commercial real estate properties. Additionally, the Account invests in real estate-related and non-real estate-related publicly traded securities, cash and other instruments to maintain adequate liquidity levels for operating expenses, capital expenditures and to fund benefit payments (withdrawals, transfers and related transactions).
The consolidated financial statements were prepared in accordance with accounting principles generally accepted in the United States of America (“GAAP”), which requires the use of estimates made by management. Actual results may vary from those estimates and such differences may be material. The following is a summary of the significant accounting policies of the Account.
Basis of Presentation:The accompanying consolidated financial statements include the Account and those subsidiaries wholly owned by TIAA for the benefit of the Account. All significant intercompany accounts and transactions between the Account and such subsidiaries have been eliminated.
The Accumulation Unit Value (“AUV”) used for financial reporting purposes may differ from the AUV used for processing transactions. The AUV used for financial reporting purposes includes security and participant transactions effective through the date of the report.
The preparation of financial statements that conform to GAAP requires the use of estimates by management. Actual results may vary from those estimates and such differences may be material. The following is a summary of the significant accounting policies of the Account.
Determination of Investments at Fair Value:The Account reports all investments at fair value in accordance with the Financial Accounting Standards Board (“FASB”) Accounting Standards Codification (“ASC”) 946,Financial Services—Investment Companies. Further in accordance with the adoption of the fair value option allowed under ASC 825,Financial Instruments, and at the election of Account management, mortgage loans payable are reported at fair value. The FASB has defined fair value as the price that would be received to sell an asset or paid to transfer a liability in an orderly transaction between market participants.
The following is a description of the valuation methodologies used to determine the fair value of the Account’s investments and investment related mortgage loans payable.
Valuation of Real Estate Properties—Investments in real estate properties are stated at fair value, as determined in accordance with policies and procedures reviewed by the Investment Committee of the Board and in accordance with the responsibilities of the Board as a whole. Accordingly, the Account does not record depreciation. Determination of fair value involves significant levels of judgment because the actual fair value of real estate can be determined only by negotiation between the parties in a sales transaction. The Account’s primary objective when valuing its real estate investments will be to produce a valuation that
71
represents a reasonable estimate of the fair value of its investments. Implicit in the Account’s definition of fair value are the consummation of a sale as of a specified date and the passing of title from seller to buyer under conditions whereby:
|
• | | | | Buyer and seller are typically motivated; |
|
• | | | | Both parties are well informed or well advised, and acting in what they consider their best interests; |
|
• | | | | A reasonable time is allowed for exposure in the open market; |
|
• | | | | Payment is made in terms of cash or in terms of financial arrangements comparable thereto; and |
|
• | | | | The price represents the normal consideration for the property sold unaffected by special or creative financing or sales concessions granted by anyone associated with the sale. |
Property and investment values are affected by, among other things, the availability of capital, occupancy rates, rental rates, and interest and inflation rates. As a result, determining real estate and investment values involves many assumptions. Key inputs and assumptions include rental income and expense amounts, related rental income and expense growth rates, discount rates and capitalization rates. Valuation techniques include discounted cash flow analysis, prevailing market capitalization rates or multiples applied to earnings from the property, analysis of recent comparable sales transactions, actual sale negotiations and bona fide purchase offers received from third parties. Amounts ultimately realized from each investment may vary significantly from the fair value presented.
Real estate properties owned by the Account are initially valued based on an independent third party appraisal, as reviewed by TIAA’s internal appraisal staff and as applicable the Account’s independent fiduciary at the time of the closing of the purchase, which may result in a potential unrealized gain or loss reflecting the difference between an investment’s fair value (i.e., exit price) and its cost basis (which is inclusive of transaction costs).
Subsequently, each property is appraised each quarter by an independent third party appraiser, reviewed by TIAA’s internal appraisal staff and as applicable the Account’s independent fiduciary. In general, the Account obtains appraisals of its real estate properties spread out throughout the quarter, which is intended to result in appraisal adjustments, and thus, adjustments to the valuations of its holdings (to the extent such adjustments are made) that happen regularly throughout each quarter and not on one specific day or month in each period.
Further, management reserves the right to order an appraisal and/or conduct another valuation outside of the normal quarterly process when facts or circumstances at a specific property change. For example, under certain circumstances a valuation adjustment could be made when the Account receives a bona fide bid for the sale of a property held within the Account or one of the Account’s joint ventures. In addition, adjustments may be made for events or circumstances indicating an impairment of a tenant’s ability to pay amounts due to the Account under a lease (including due to a bankruptcy filing of that tenant). Alternatively, adjustments may be made to reflect the execution or renewal of a significant lease. Also, adjustments may be made to reflect factors (such as sales values for comparable properties or local employment rate) bearing uniquely on a particular region in which the Account holds properties. TIAA’s internal appraisal staff oversees the entire appraisal process, in conjunction with the Account’s independent fiduciary (the independent fiduciary is more fully described in the paragraph below). Any differences in the conclusions of TIAA’s internal appraisal staff and the independent appraiser will be reviewed by the independent fiduciary, which will make a final determination on the matter (which may include ordering a subsequent independent appraisal).
The independent fiduciary, Real Estate Research Corporation, has been appointed by a special subcommittee of the Investment Committee of the Board to, among other things, oversee the appraisal process. The independent fiduciary must approve all independent appraisers used by the Account. All appraisals are performed in accordance with Uniform Standards of Professional Appraisal Practices, the real estate appraisal industry standards created by The Appraisal Foundation. Real estate appraisals are estimates of property values based on a professional’s opinion. Appraisals of properties held outside of the U.S. are performed in accordance with industry standards commonly applied in the applicable jurisdiction. These independent appraisers are always expected to be MAI-designated members of the Appraisal Institute (or its European equivalent, Royal Institute of Chartered Surveyors) and state certified appraisers from national or regional
72
firms with relevant property type experience and market knowledge. Under the Account’s current procedures, each independent appraisal firm will be rotated off of a particular property at least every three years, although such appraisal firm may perform appraisals of other Account properties subsequent to such rotation.
Also, the independent fiduciary can require additional appraisals if factors or events have occurred that could materially change a property’s value (including those identified above) and such change is not reflected in the quarterly valuation review, or otherwise to ensure that the Account is valued appropriately. The independent fiduciary must also approve any valuation change of real estate-related assets where a property’s value changed by more than 6% from the most recent independent annual appraisal, or if the value of the Account would change by more than 4% within any calendar quarter or more than 2% since the prior calendar month. When a real estate property is subject to a mortgage, the property is valued independently of the mortgage and the property and mortgage fair values are reported separately (seeValuation of Mortgage Loans Payable below). The independent fiduciary reviews and approves all mortgage valuation adjustments before such adjustments are recorded by the Account. The Account continues to use the revised value for each real estate property and mortgage loan payable to calculate the Account’s daily net asset value until the next valuation review or appraisal.
Valuation of Real Estate Joint Ventures—Real estate joint ventures are stated at the fair value of the Account’s ownership interests of the underlying entities. The Account’s ownership interests are valued based on the fair value of the underlying real estate, any related mortgage loans payable, and other factors, such as ownership percentage, ownership rights, buy/sell agreements, distribution provisions and capital call obligations. Upon the disposition of all real estate investments by an investee entity, the Account will continue to state its equity in the remaining net assets of the investee entity during the wind down period, if any, which occurs prior to the dissolution of the investee entity.
Valuation of Real Estate Limited Partnerships—Limited partnership interests are stated at the fair value of the Account’s ownership in the partnership which are recorded based upon the changes in the net asset values of the limited partnerships as determined from the financial statements of the limited partnerships when received by the Account. Prior to the receipt of the financial statements from the limited partnerships, the Account estimates the value of its interest in good faith and will from time to time seek input from the issuer or the sponsor of the investments. Since market quotations are not readily available, the limited partnership interests are valued at fair value as determined in good faith by management under the direction of the Investment Committee of the Board and in accordance with the responsibilities of the Board as a whole.
Valuation of Marketable Securities—Equity securities listed or traded on any national market or exchange are valued at the last sale price as of the close of the principal securities market or exchange on which such securities are traded or, if there is no sale, at the mean of the last bid and asked prices on such market or exchange, exclusive of transaction costs.
Debt securities, other than money market instruments, are generally valued at the most recent bid price or the equivalent quoted yield for such securities (or those of comparable maturity, quality and type). Money market instruments, with maturities of one year or less, are valued in the same manner as debt securities or derived from a pricing matrix.
Short-term investments with maturities of 60 days or less (excluding money market instruments) are valued at amortized cost. Short-term investments with maturities in excess of 60 days (excluding money market instruments) are valued in the same manner as debt securities, as described above.
Money market instruments are valued at amortized cost.
Equity and fixed income securities traded on a foreign exchange or in foreign markets are valued using their closing values under the valuation methods generally accepted in the country where traded, as of the valuation date. This value is converted to U.S. dollars at the exchange rate in effect on the valuation day. Under certain circumstances (for example, if there are significant movements in the United States markets and there is an expectation the securities traded on foreign markets will adjust based on such movements when the foreign markets open the next day), the Account may adjust the value of equity or fixed income securities that trade on a foreign exchange or market after the foreign exchange or market has closed.
Valuation of Mortgage Loans Payable—Mortgage loans payable are stated at fair value. The estimated fair values of mortgage loans payable are based on the amount at which the liability could be transferred to a
73
third party exclusive of transaction costs. Mortgage loans payable are valued internally by TIAA’s internal valuation department, as reviewed by the Account’s independent fiduciary, at least quarterly based on market factors, such as market interest rates and spreads for comparable loans, the performance of the underlying collateral (such as the loan-to-value ratio and the cash flow of the underlying collateral), the liquidity for mortgage loans of similar characteristics, the maturity date of the loan, the return demands of the market.
SeeNote 6—Assets and Liabilities Measured at Fair Value on a Recurring Basis for further discussion and disclosure regarding the determination of the fair value of the Account’s investments.
Foreign Currency Transactions and Translation: Portfolio investments and other assets and liabilities denominated in foreign currencies are translated into U.S. dollars at the exchange rates prevailing at the end of the period. Purchases and sales of securities, income receipts and expense payments made in foreign currencies are translated into U.S. dollars at the exchange rates prevailing on the respective dates of the transactions. The effect of any changes in foreign currency exchange rates on portfolio investments and mortgage loans payable are included in net realized and unrealized gains and losses on real estate properties and mortgage loans payable. Net realized gains and losses on foreign currency transactions include disposition of foreign currencies, and currency gains and losses between the accrual and receipt dates of portfolio investment income and between the trade and settlement dates of portfolio investment transactions.
Accumulation and Annuity Funds:The accumulation fund represents the net assets attributable to participants in the accumulation phase of their investment (“Accumulation Fund”). The annuity fund represents the net assets attributable to the participants currently receiving annuity payments (“Annuity Fund”). The net increase or decrease in net assets from investment operations is apportioned between the accounts based upon their relative daily net asset values. Once an Account participant begins receiving lifetime annuity income benefits, payment levels cannot be reduced as a result of the Account’s actual mortality experience. In addition, the contracts pursuant to which the Account is offered are required to stipulate the maximum expense charge for all Account level expenses that can be assessed, which is not to exceed 2.5% of average net assets per year. The Account pays a fee to TIAA to assume mortality and expense risks.
Accounting for Investments:The investments held by the Account are accounted for as follows:
Real Estate Properties—Rent from real estate properties consists of all amounts earned under tenant operating leases, including base rent, recoveries of real estate taxes and other expenses and charges for miscellaneous services provided to tenants. Rental income is recognized in accordance with the billing terms of the lease agreements. The Account bears the direct expenses of the real estate properties owned. These expenses include, but are not limited to, fees to local property management companies, property taxes, utilities, maintenance, repairs, insurance, and other operating and administrative costs. An estimate of the net operating income earned from each real estate property is accrued by the Account on a daily basis and such estimates are adjusted when actual operating results are determined.
Real Estate Joint Ventures—The Account has limited ownership interests in various real estate joint ventures (collectively, the “joint ventures”). The Account records its contributions as increases to its investments in the joint ventures, and distributions from the joint ventures are treated as income within income from real estate joint ventures and limited partnerships in the Account’s consolidated statements of operations. Distributions that are identified as returns of capital are recorded as a reduction to the cost basis of the investment, whereas distributions identified as capital gains or losses are recorded as realized gains or losses. Income from the joint ventures is recorded based on the Account’s proportional interest of the income distributed by the joint ventures. Income earned but not yet distributed to the Account by the joint ventures is recorded as unrealized gains and losses.
Limited Partnerships—The Account has limited ownership interests in various private real estate funds (primarily limited partnerships) and a private real estate investment trust (collectively, the “limited partnerships”). The Account records its contributions as increases to the investments, and distributions from the investments are treated as income within income from real estate joint ventures and limited partnerships in the Account’s consolidated statements of operations. Distributions that are identified as returns of capital are recorded as a reduction to the cost basis of the investment, whereas distributions identified as capital gains or losses are recorded as realized gains or losses. Unrealized gains and losses are recorded based upon the changes in the net asset values of the limited partnerships as determined from the financial statements of
74
the limited partnerships when received by the Account. Prior to the receipt of the financial statements from the limited partnerships, the Account estimates the value of its interest in good faith and will from time to time seek input from the issuer or the sponsor of the investments. Changes in value based on such estimates are recorded by the Account as unrealized gains and losses.
Marketable Securities—Transactions in marketable securities are accounted for as of the date the securities are purchased or sold (trade date). Interest income is recorded as earned. Dividend income is recorded on the ex-dividend date within dividend income. Dividends that are identified as returns of capital are recorded as a reduction to the cost basis of the investment, whereas dividends identified as capital gains or losses are recorded as realized gains or losses. Realized gains and losses on securities transactions are accounted for on the specific identification method.
Realized and Unrealized Gains and Losses—Realized gains and losses are recorded at the time an investment is sold or a distribution is received in relation to an investment sale from a joint venture or limited partnership. Real estate transactions are accounted for as of the date on which the purchase or sale transactions for the real estate properties close (settlement date). The Account recognizes a realized gain on the sale of a real estate property to the extent that the contract sales price exceeds the cost-to-date of the property being sold. A realized loss occurs when the cost-to-date exceeds the sales price.
Unrealized gains and losses are recorded as the fair values of the Account’s investments are adjusted, and as discussed within theReal Estate Joint Ventures andLimited Partnerships sections above.
Net Assets—The Account’s net assets as of the close of each valuation day are valued by taking the sum of:
|
• | | | | the value of the Account’s cash; cash equivalents, and short-term and other debt instruments; |
|
• | | | | the value of the Account’s other securities and other non-real estate assets; |
|
• | | | | the value of the individual real properties (based on the most recent valuation of that property) and other real estate-related investments owned by the Account; |
|
• | | | | an estimate of the net operating income accrued by the Account from its properties, other real estate-related investments and non-real estate-related investments (including short-term marketable securities) since the end of the prior valuation day; and |
|
• | | | | actual net operating income earned from the Account’s properties, other real estate-related investments and non-real estate-related investments (but only to the extent any such item of income differs from the estimated income accrued for on such investments), |
and then reducing the sum by liabilities held within the Account, including the daily investment management fee, administration and distribution fees, mortality and expense fee, and liquidity guarantee fee, and certain other expenses attributable to operating the Account. Daily estimates of net operating income are adjusted to reflect actual net operating income on a monthly basis, at which time such adjustments (if any) are reflected in the Account’s unit value.
After the end of every quarter, the Account reconciles the amount of expenses deducted from the Account (which is established in order to approximate the costs that the Account will incur) with the expenses the Account actually incurred. If there is a difference, the Account adds it to or deducts it from the Account in equal daily installments over the remaining days of the following quarter. Material differences may be repaid in the current calendar quarter. The Account’s at-cost deductions are based on projections of Account assets and overall expenses, and the size of any adjusting payments will be directly affected by the difference between management’s projections and the Account’s actual assets or expenses.
Cash and Cash Equivalents:Cash and cash equivalents are balances held by the Account in bank deposit accounts which, at times, exceed federally insured limits. The Account’s management monitors these balances to mitigate the exposure of risk due to concentration and has not experienced any losses from such concentration.
Other Assets and Other Liabilities:Other assets and other liabilities are comprised of operating assets and liabilities utilized and held at each individual real estate property investment. Other assets consist of, amongst other items, tenant receivables and prepaid expenses; whereas other liabilities primarily consist of security deposits.
75
Federal Income Taxes:Based on provisions of the Internal Revenue Code, Section 817, the Account is taxed as a segregated asset account of TIAA and as such, the Account incurs no material federal income tax attributable to the net investment activity of the Account. The Account’s federal income tax return is generally subject to examination for a period of three years after filed. State and local tax returns may be subject to examination for an additional period of time depending on the jurisdiction. Management has analyzed the Accounts’ tax positions taken for all open federal income tax years and has concluded that no provision for federal income tax is required in the Accounts’ financial statements.
Restricted Cash:The Account held $46.0 million and $61.4 million as of December 31, 2013 and December 31, 2012, respectively, in escrow accounts for property taxes, insurance, and various other property related matters as required by certain creditors related to outstanding mortgage loans payable collateralized by certain real estate investments. These amounts are recorded within other assets on the consolidated statements of assets and liabilities. SeeNote 9—Mortgage Loans Payable for additional information regarding the Account’s outstanding mortgage loans payable.
Changes in Net Assets:Premiums include premiums paid by existing accumulation unit holders in the Account and transfers into the Account. Withdrawals and death benefits include withdrawals out of the Account which include transfers out of the Account and required minimum distributions.
Due to/from Investment Manager:Due to/from investment manager represents amounts that are to be paid or received by TIAA on behalf of the Account. Amounts generally are paid or received by the Account within one or two business days and no interest is contractually charged on these amounts.
New Accounting Pronouncement:In June 2013, the FASB issued Accounting Standards Update 2013-08 Financial Services—Investment Companies (Topic 946)—Amendments to the Scope, Measurement, and Disclosure Requirements (the “ASU”) which amends the criteria for an entity to qualify as an investment company and introduces new disclosure requirements that apply to all investment companies. The ASU is effective for interim and annual reporting periods in fiscal years beginning after December 15, 2013. The Account is currently assessing the impact of applying the ASU but does not anticipate any material impacts to the Account’s consolidated financial statements.
Note 2—Management Agreements and Arrangements
Investment advisory services for the Account are provided by TIAA employees, under the direction of the Board and its Investment Committee, pursuant to investment management procedures adopted by TIAA for the Account. TIAA’s investment management decisions for the Account are subject to review by the Account’s independent fiduciary. TIAA also provides various portfolio accounting and related services for the Account.
The Account is a party to the Distribution Agreement for the Contracts Funded by the TIAA Real Estate Account (the “Distribution Agreement”), dated January 1, 2008, by and among TIAA, for itself and on behalf of the Account, and TIAA-CREF Individual and Institutional Services, LLC (“Services”), a wholly owned subsidiary of TIAA, a registered broker-dealer and a member of the Financial Industry Regulatory Authority. Pursuant to the Distribution Agreement, Services performs distribution services for the Account which include, among other things, (i) distribution of annuity contracts issued by TIAA and funded by the Account, (ii) advising existing annuity contract owners in connection with their accumulations and (iii) helping employers implement and manage retirement plans. In addition, TIAA performs administrative functions for the Account, which include, among other things, (i) maintaining accounting records and performing accounting services, (ii) receiving and allocating premiums, (iii) calculating and making annuity payments, (iv) processing withdrawal requests, (v) providing regulatory compliance and reporting services, (vi) maintaining the Account’s records of contract ownership and (vii) otherwise assisting generally in all aspects of the Account’s operations. Both distribution services (pursuant to the Distribution Agreement) and administrative services are provided to the Account by Services and TIAA, as applicable, on a cost basis.
The Distribution Agreement is terminable by either party upon 60 days written notice and terminates automatically upon any assignment thereof.
TIAA and Services provide investment management, administrative and distribution services at cost. TIAA and Services receive payments from the Account on a daily basis according to formulas established each year and adjusted periodically with the objective of keeping the payments as close as possible to the Account’s
76
expenses actually incurred. Any differences between actual expenses and the amounts paid by the Account are adjusted quarterly.
TIAA also provides a liquidity guarantee to the Account, for a fee, to ensure that sufficient funds are available to meet participant transfer and cash withdrawal requests in the event that the Account’s cash flows and liquid investments are insufficient to fund such requests. TIAA ensures sufficient funds are available for such transfer and withdrawal requests by purchasing accumulation units of the Account. See Note 3—Related Party Transactions below.
To the extent TIAA owns accumulation units issued pursuant to the liquidity guarantee, the independent fiduciary monitors and oversees, among other things, TIAA’s ownership interest in the Account and may require TIAA to eventually redeem some of its units, particularly when the Account has un-invested cash or liquid investments available. TIAA also receives a fee for assuming certain mortality and expense risks.
The expenses for the services noted above that are provided to the Account by TIAA and Services are identified in the accompanying consolidated statements of operations and are reflected inNote 10—Financial Highlights.
Note 3—Related Party Transactions
Pursuant to its existing liquidity guarantee obligation, the TIAA General Account purchased in multiple transactions an aggregate of 4.7 million accumulation units (which are generally referred to as “liquidity units”) in the Account between December 2008 and June 2009 for an aggregate amount of $1.2 billion. TIAA has not purchased additional liquidity units since June 2009.
In accordance with this liquidity guarantee obligation, TIAA guarantees that all participants in the Account may redeem their accumulation units at their accumulation unit value next determined after their transfer or cash withdrawal request is received in good order. Liquidity units owned by TIAA are valued in the same manner as accumulation units owned by the Account’s participants. Management believes that TIAA has the ability to meet its obligations under the liquidity guarantee.
As discussed in the Account’s prospectus and in accordance with a prohibited transaction exemption from the U.S. Department of Labor (PTE 96-76), the Account’s independent fiduciary, Real Estate Research Corporation, has certain responsibilities with respect to the Account that it has undertaken or is currently undertaking with respect to TIAA’s purchase of liquidity units, including among other things, reviewing the purchase and redemption of liquidity units by TIAA to ensure the Account uses the correct unit values. In addition, as set forth in PTE 96-76, the independent fiduciary’s responsibilities include:
|
• | | | | establishing the percentage of total accumulation units that TIAA’s ownership should not exceed (the “trigger point”) and creating a method for changing the trigger point; |
|
• | | | | approving any adjustment of TIAA’s ownership interest in the Account and, in its discretion, requiring an adjustment if TIAA’s ownership of liquidity units reaches the trigger point; and |
|
• | | | | once the trigger point has been reached, participating in any program to reduce TIAA’s ownership in the Account by utilizing cash flow or liquid investments in the Account, or by utilizing the proceeds from asset sales. The independent fiduciary’s role in participating in any such asset sales program would include (i) participating in the selection of properties for sale, (ii) providing sales guidelines and (iii) approving those sales if, in the independent fiduciary’s opinion, such sales are desirable to reduce TIAA’s ownership of liquidity units. |
The independent fiduciary, which has the right to adjust the trigger point, has established the trigger point at 45% of the outstanding accumulation units and it will continue to monitor TIAA’s ownership interest in the Account and provide further recommendations as necessary.
As of March 31, 2013, the independent fiduciary completed the systematic redemption of all of the liquidity units held by TIAA. Approximately one-quarter of such units were redeemed evenly over the business days in each of the months of June, September, and December 2012, and March 2013, representing a total of $940.3 million and $325.4 million redeemed during 2012 and 2013, respectively.
As discussed inNote 2—Management Agreements and Arrangements, TIAA and Services provide certain services to the Account on an at cost basis. SeeNote 10—Financial Highlights for details of the expense charge and expense ratio.
77
Note 4—Credit Risk Concentrations
Concentrations of credit risk may arise when a number of properties or tenants are located in a similar geographic region such that the economic conditions of that region could impact tenants’ obligations to meet their contractual obligations or cause the values of individual properties to decline. The Account has no significant concentrations of tenants as no single tenant has annual contract rent that makes up more than 2.4% of the rental income of the Account.
The substantial majority of the Account’s wholly owned real estate investments and investments in joint ventures are located in the United States. The following table represents the diversification of the Account’s portfolio by region and property type:
Diversification by Fair Value(1)
| | | | | | | | | | | | |
| | East | | West | | South | | Foreign(2) | | Midwest | | Total |
Office | | | | 20.5 | % | | | | | 15.0 | % | | | | | 6.7 | % | | | | | — | | | | | 0.3 | % | | | | | 42.5 | % | |
Apartment | | | | 8.9 | % | | | | | 8.8 | % | | | | | 4.8 | % | | | | | — | | | | | — | | | | | 22.5 | % | |
Retail | | | | 3.2 | % | | | | | 4.3 | % | | | | | 8.4 | % | | | | | 1.6 | % | | | | | 0.2 | % | | | | | 17.7 | % | |
Industrial | | | | 1.3 | % | | | | | 7.4 | % | | | | | 3.6 | % | | | | | — | | | | | 0.9 | % | | | | | 13.2 | % | |
Other(3) | | | | 3.1 | % | | | | | 0.3 | % | | | | | 0.6 | % | | | | | — | | | | | 0.1 | % | | | | | 4.1 | % | |
| | | | | | | | | | | | |
Total | | | | 37.0 | % | | | | | 35.8 | % | | | | | 24.1 | % | | | | | 1.6 | % | | | | | 1.5 | % | | | | | 100.0 | % | |
| | | | | | | | | | | | |
|
(1) | | | | Wholly owned properties are represented at fair value and gross of any debt, while joint venture properties are represented at net equity value. |
|
(2) | | | | Represents real estate investment in France. |
|
(3) | | | | Represents interest in Storage Portfolio investment, a fee interest encumbered by a ground lease real estate investment and a land development. |
|
| | | | Properties in the “East” region are located in: CT, DC, DE, KY, MA, MD, ME, NC, NH, NJ, NY, PA, RI, SC, VA, VT, WV |
|
| | | | Properties in the “West” region are located in: AK, AZ, CA, CO, HI, ID, MT, NM, NV, OR, UT, WA, WY |
|
| | | | Properties in the “South” region are located in: AL, AR, FL, GA, LA, MS, OK, TN, TX |
|
| | | | Properties in the “Midwest” region are located in: IA, IL, IN, KS, MI, MN, MO, ND, NE, OH, SD, WI |
Note 5—Leases
The Account’s wholly owned real estate properties are leased to tenants under operating lease agreements which expire on various dates through 2090. Aggregate minimum annual rentals for wholly owned real estate investments owned by the Account, excluding short-term residential leases, are as follows (in millions):
| | |
| | Years Ending
December 31, |
2014 | | | $ | | 495.9 | |
2015 | | | | 463.2 | |
2016 | | | | 416.0 | |
2017 | | | | 368.7 | |
2018 | | | | 315.8 | |
Thereafter | | | | 3,028.0 | |
| | |
Total | | | $ | | 5,087.6 | |
| | |
Certain leases provide for additional rental amounts based upon the recovery of actual operating expenses in excess of specified base amounts, sales volume or contractual increases as defined in the lease agreement. These contractual contingent rentals are not included in the table above.
78
Note 6—Assets and Liabilities Measured at Fair Value on a Recurring Basis
Valuation Hierarchy:The Account’s fair value measurements are grouped categorically into three levels, as defined by the FASB. The levels are defined as follows:
Level 1—Valuations using unadjusted quoted prices for assets traded in active markets, such as stocks listed on the New York Stock Exchange. Active markets are defined as having the following characteristics for the measured asset or liability: (i) many transactions, (ii) current prices, (iii) price quotes not varying substantially among market makers, (iv) narrow bid/ask spreads and (v) most information regarding the issuer is publicly available. Level 1 assets held by the Account are generally marketable equity securities.
Level 2—Valuations for assets and liabilities traded in less active, dealer or broker markets. Fair values are primarily obtained from third party pricing services for identical or comparable assets or liabilities. Level 2 inputs for fair value measurements are inputs, other than quoted prices included within Level 1, that are observable for the asset or liability, either directly or indirectly. Level 2 inputs include:
a. Quoted prices for similar assets or liabilities in active markets;
b. Quoted prices for identical or similar assets or liabilities in markets that are not active (that is, markets in which there are few transactions for the asset (or liability), the prices are not current, price quotations vary substantially either over time or among market makers (for example, some brokered markets), or in which little information is released publicly);
c. Inputs other than quoted prices that are observable within the market for the asset (or liability) (for example, interest rates and yield curves, implied volatilities, and credit spreads, that are observable at commonly quoted intervals); and
d. Inputs that are derived principally from or corroborated by observable market data by correlation or other means (for example, market-corroborated inputs).
Examples of securities which may be held by the Account and included in Level 2 include certificates of deposit, commercial paper, government agency notes, variable notes, United States Treasury securities, and debt securities.
Level 3—Valuations for assets and liabilities that are derived from other valuation methodologies, including pricing models, discounted cash flow models and similar techniques, and are not based on market exchange, dealer, or broker-traded transactions. Level 3 valuations incorporate certain assumptions and projections that are not observable in the market, and require significant professional judgment in determining the fair value assigned to such assets or liabilities. Examples of Level 3 assets and liabilities which may be held by the Account from time to time include investments in real estate, investments in joint ventures and limited partnerships, and mortgage loans receivable and payable.
An investment’s categorization within the valuation hierarchy described above is based upon the lowest level of input that is significant to the fair value measurement.
The Account’s determination of fair value is based upon quoted market prices, where available. If listed prices or quotes are not available, fair value is based upon vendor-provided, evaluated prices or internally developed models that primarily use market-based or independently sourced market data, including interest rate yield curves, market spreads, and currency rates. Valuation adjustments will be made to reflect changes in credit quality, counterparty’s creditworthiness, the Account’s creditworthiness, liquidity, and other observable and unobservable inputs that are applied consistently over time.
The methods described above are considered to produce fair values that represent a good faith estimate of what an unaffiliated buyer in the marketplace would pay to purchase the asset or would receive to transfer the liability. Since fair value calculations involve significant professional judgment in the application of both observable and unobservable attributes, actual realizable values or future fair values may differ from amounts reported.
Furthermore, while the Account believes its valuation methods are appropriate and consistent with other market participants, the use of different methodologies or assumptions to determine the fair value of certain financial instruments, while reasonable, could result in different estimates of fair value at the reporting date. As discussed inNote 1—Organization and Significant Accounting Policies in more detail, the Account generally obtains independent third party appraisals on a quarterly basis; there may be circumstances in the
79
interim in which the true realizable value of a property is not reflected in the Account’s daily net asset value calculation or in the Account’s periodic consolidated financial statements. This disparity may be more apparent when the commercial and/or residential real estate markets experience an overall and possibly dramatic decline (or increase) in property values in a relatively short period of time between appraisals.
The following tables show the major categories of assets and liabilities measured at fair value on a recurring basis as of December 31, 2013 and December 31, 2012, using unadjusted quoted prices in active markets for identical assets (Level 1); significant other observable inputs (Level 2); and significant unobservable inputs (Level 3) (in millions):
| | | | | | | | |
Description | | Level 1:
Quoted
Prices in
Active Markets
for Identical
Assets | | Level 2:
Significant
Other
Observable
Inputs | | Level 3:
Significant
Unobservable
Inputs | | Total at
December 31,
2013 |
Real Estate properties | | | $ | | — | | | | $ | | — | | | | $ | | 11,565.1 | | | | $ | | 11,565.1 | |
Real Estate joint ventures | | | | — | | | | | — | | | | | 2,563.6 | | | | | 2,563.6 | |
Limited partnerships | | | | — | | | | | — | | | | | 362.0 | | | | | 362.0 | |
Marketable securities: | | | | | | | | |
Real Estate Related | | | | 1,499.3 | | | | | — | | | | | — | | | | | 1,499.3 | |
Government Agency Notes | | | | — | | | | | 1,989.1 | | | | | — | | | | | 1,989.1 | |
United States Treasury securities | | | | — | | | | | 1,130.5 | | | | | — | | | | | 1,130.5 | |
| | | | | | | | |
Total Investments at December 31, 2013 | | | $ | | 1,499.3 | | | | $ | | 3,119.6 | | | | $ | | 14,490.7 | | | | $ | | 19,109.6 | |
| | | | | | | | |
Mortgage loans payable | | | $ | | — | | | | $ | | — | | | | $ | | (2,279.1 | ) | | | | $ | | (2,279.1 | ) | |
| | | | | | | | |
| | | | | | | | |
Description | | Level 1:
Quoted
Prices in
Active Markets
for Identical
Assets | | Level 2:
Significant
Other
Observable
Inputs | | Level 3:
Significant
Unobservable
Inputs | | Total at
December 31,
2012 |
Real Estate properties | | | $ | | — | | | | $ | | — | | | | $ | | 10,554.6 | | | | $ | | 10,554.6 | |
Real Estate joint ventures | | | | — | | | | | — | | | | | 2,291.5 | | | | | 2,291.5 | |
Limited partnerships | | | | — | | | | | — | | | | | 339.8 | | | | | 339.8 | |
Marketable securities: | | | | | | | | |
Real Estate Related | | | | 1,332.3 | | | | | — | | | | | — | | | | | 1,332.3 | |
Government Agency Notes | | | | — | | | | | 1,379.6 | | | | | — | | | | | 1,379.6 | |
United States Treasury securities | | | | — | | | | | 1,190.1 | | | | | — | | | | | 1,190.1 | |
| | | | | | | | |
Total Investments at December 31, 2012 | | | $ | | 1,332.3 | | | | $ | | 2,569.7 | | | | $ | | 13,185.9 | | | | $ | | 17,087.9 | |
| | | | | | | | |
Mortgage loans payable | | | $ | | — | | | | $ | | — | | | | $ | | (2,282.6 | ) | | | | $ | | (2,282.6 | ) | |
| | | | | | | | |
The following tables show the reconciliation of the beginning and ending balances for assets and liabilities measured at fair value on a recurring basis using significant unobservable inputs (Level 3) during the years ended December 31, 2013 and December 31, 2012 (in millions):
| | | | | | | | | | |
| | Real Estate
Properties | | Real Estate
Joint
Ventures | | Limited
Partnerships | | Total
Level 3
Investments | | Mortgage
Loans
Payable |
For the year ended December 31, 2013 | | | | | | | | | | |
Beginning balance January 1, 2013 | | | $ | | 10,554.6 | | | | $ | | 2,291.5 | | | | $ | | 339.8 | | | | $ | | 13,185.9 | | | | $ | | (2,282.6 | ) | |
Total realized and unrealized gains included in changes in net assets | | | | 653.1 | | | | | 294.1 | | | | | 31.9 | | | | | 979.1 | | | | | 73.3 | |
Purchases(1) | | | | 793.2 | | | | | 48.7 | | | | | 3.2 | | | | | 845.1 | | | | | (900.0 | ) | |
Sales | | | | (435.8 | ) | | | | | — | | | | | — | | | | | (435.8 | ) | | | | | — | |
Settlements(2) | | | | — | | | | | (70.7 | ) | | | | | (12.9 | ) | | | | | (83.6 | ) | | | | | 830.2 | |
| | | | | | | | | | |
Ending balance December 31, 2013 | | | $ | | 11,565.1 | | | | $ | | 2,563.6 | | | | $ | | 362.0 | | | | $ | | 14,490.7 | | | | $ | | (2,279.1 | ) | |
| | | | | | | | | | |
80
| | | | | | | | | | |
| | Real Estate
Properties | | Real Estate
Joint
Ventures | | Limited
Partnerships | | Total
Level 3
Investments | | Mortgage
Loans
Payable |
For the year ended December 31, 2012 | | | | | | | | | | |
Beginning balance January 1, 2012 | | | $ | | 9,857.6 | | | | $ | | 1,591.4 | | | | $ | | 307.5 | | | | $ | | 11,756.5 | | | | $ | | (2,028.2 | ) | |
Total realized and unrealized gains (losses) included in changes in net assets | | | | 544.5 | | | | | 281.5 | | | | | 38.1 | | | | $ | | 864.1 | | | | | (14.8 | ) | |
Purchases(1) | | | | 838.3 | | | | | 765.2 | | | | | 23.4 | | | | $ | | 1,626.9 | | | | | (248.8 | ) | |
Sales | | | | (685.8 | ) | | | | | — | | | | | — | | | | $ | | (685.8 | ) | | | | | — | |
Settlements(2) | | | | — | | | | | (346.6 | ) | | | | | (29.2 | ) | | | | $ | | (375.8 | ) | | | | | 9.2 | |
| | | | | | | | | | |
Ending balance December 31, 2012 | | | $ | | 10,554.6 | | | | $ | | 2,291.5 | | | | $ | | 339.8 | | | | $ | | 13,185.9 | | | | $ | | (2,282.6 | ) | |
| | | | | | | | | | |
|
(1) | | | | Includes purchases, contributions for joint ventures and limited partnerships, and capital expenditures. |
|
(2) | | | | Includes operating income for real estate joint ventures and limited partnerships, net of distributions and principal payments on mortgage loans payable. |
The following table shows quantitative information about unobservable inputs related to the Level 3 fair value measurements as of December 31, 2013.
| | | | | | | | |
Type | | Asset
Class | | Valuation Technique(s) | | Unobservable Inputs | | Range (Weighted
Average) |
|
Real Estate Properties | | Office | | Income Approach—Discounted Cash Flow | | Discount Rate | | 6.0%–9.5% (7.0%) |
and Joint Ventures | | | | | | Terminal Capitalization Rate | | 5.0%–8.3% (5.9%) |
| | | |
| | | | Income Approach—Direct Capitalization | | Overall Capitalization Rate | | 4.8%–8.3% (5.4%) |
| | |
| | Industrial | | Income Approach—Discounted Cash Flow | | Discount Rate | | 6.7%–10.0% (7.4%) |
| | | | | | Terminal Capitalization Rate | | 5.5%–8.0% (6.3%) |
| | | |
| | | | Income Approach—Direct Capitalization | | Overall Capitalization Rate | | 4.8%–8.3% (5.6%) |
| | |
| | Residential | | Income Approach—Discounted Cash Flow | | Discount Rate | | 6.0%–8.0% (6.6%) |
| | | | | | Terminal Capitalization Rate | | 4.3%–6.3% (5.0%) |
| | | |
| | | | Income Approach—Direct Capitalization | | Overall Capitalization Rate | | 3.8%–5.8% (4.4%) |
| | |
| | Retail | | Income Approach—Discounted Cash Flow | | Discount Rate | | 6.0%–13.0% (7.5%) |
| | | | | | Terminal Capitalization Rate | | 5.3%–12.5% (6.3%) |
| | | |
| | | | Income Approach—Direct Capitalization | | Overall Capitalization Rate | | 4.5%–12.0% (5.7%) |
|
Mortgage Loans | | Office and | | Discounted Cash Flow | | Loan to Value Ratio | | 38.7%–57.3% (45.2%) |
Payable | | Industrial | | | | Equivalency Rate | | 2.2%–4.8% (3.9%) |
| | | |
| | | | Net Present Value | | Loan to Value Ratio | | 38.7%–57.3% (45.2%) |
| | | | | | Weighted Average Cost of Capital Risk Premiums | | 1.5%–2.9% (1.9%) |
| | |
| | Residential | | Discounted Cash Flow | | Loan to Value Ratio | | 34.8%–61.5% (47.4%) |
| | | | | | Equivalency Rate | | 2.6%–4.4% (3.8%) |
| | | |
| | | | Net Present Value | | Loan to Value Ratio | | 34.8%–61.5% (47.4%) |
| | | | | | Weighted Average Cost of Capital Risk Premiums | | 1.4%–3.2% (2.1%) |
| | |
| | Retail | | Discounted Cash Flow | | Loan to Value Ratio | | 26.5%–130.7% (59.9%) |
| | | | | | Equivalency Rate | | 2.4%–7.4% (4.3%) |
| | | |
| | | | Net Present Value | | Loan to Value Ratio | | 26.5%–130.7% (59.9%) |
| | | | | | Weighted Average Cost of Capital Risk Premiums | | 0.9%–13.8% (4.5%) |
|
Real Estate Properties and Joint Ventures:The significant unobservable inputs used in the fair value measurement of the Account’s real estate properties and joint ventures are the selection of certain investment rates (Discount Rate, Terminal Capitalization Rate, and Overall Capitalization Rate). Significant increases (decreases) in any of those inputs in isolation would result in significantly lower (higher) fair value measurements, respectively.
Mortgage Loans Payable:The significant unobservable inputs used in the fair value measurement of the Account’s mortgage loans payable are the loan to value ratios and the selection of certain credit spreads and weighted average cost of capital risk premiums. Significant increases (decreases) in any of those inputs in isolation would result in a significantly lower (higher) fair value, respectively.
During the years ended December 31, 2013 and 2012 there were no transfers between Levels 1, 2 or 3.
81
The amount of total net unrealized gains (losses) included in changes in net assets attributable to the change in net unrealized gains (losses) relating to Level 3 investments and mortgage loans payable using significant unobservable inputs still held as of the reporting date is as follows (in millions):
| | | | | | | | | | |
| | Real Estate
Properties | | Real Estate
Joint Ventures | | Limited
Partnerships | | Total
Level 3
Investments | | Mortgage
Loans
Payable |
For the year ended December 31, 2013 | | | $ | | 676.1 | | | | $ | | 300.6 | | | | $ | | 31.0 | | | | $ | | 1,007.7 | | | | $ | | 57.4 | |
| | | | | | | | | | |
For the year ended December 31, 2012 | | | $ | | 474.6 | | | | $ | | 444.1 | | | | $ | | 63.5 | | | | $ | | 982.2 | | | | $ | | (14.8 | ) | |
| | | | | | | | | | |
Note 7—Investments in Joint Ventures
The Account owns interests in several real estate properties through joint ventures and receives distributions and allocations of profits and losses from the joint ventures based on the Account’s ownership interest in those investments. Several of these joint ventures have mortgage loans payable collateralized by the properties owned by the aforementioned joint ventures. At December 31, 2013, the Account held 13 investments in joint ventures with non-controlling ownership interest percentages that ranged from 33% to 85%. Certain joint ventures are subject to adjusted distribution percentages when earnings in the investment reach a pre-determined threshold. The Account’s equity in the joint ventures was $2.6 billion at December 31, 2013 and $2.3 billion at December 31, 2012, respectively. The Account’s most significant joint venture investment is the DDR joint venture which represented 2.4% of the Account’s net assets and 2.2% of the Account’s invested assets at December 31, 2013.
The Account’s proportionate share of the mortgage loans payable within the joint venture investments at fair value was $1.6 billion at December 31, 2013 and $1.8 billion at December 31, 2012. The Account’s share in the outstanding principal of the mortgage loans payable within the joint ventures was $1.6 billion at December 31, 2013 and $1.8 billion at December 31, 2012, respectively.
A condensed summary of the financial position and results of operations of the joint ventures are shown below (in millions):
| | | | |
| | December 31, 2013 | | December 31, 2012 |
Assets | | | | |
Real Estate properties, at fair value | | | $ | | 6,715.6 | | | | $ | | 6,495.4 | |
Other assets | | | | 249.0 | | | | | 181.5 | |
| | | | |
Total assets | | | $ | | 6,964.6 | | | | $ | | 6,676.9 | |
| | | | |
Liabilities & Equity | | | | |
Mortgage Notes Payable and Other Note Obligations, at fair value | | | $ | | 2,360.4 | | | | $ | | 2,656.0 | |
Other liabilities | | | | 139.9 | | | | | 82.8 | |
| | | | |
Total liabilities | | | | 2,500.3 | | | | | 2,738.8 | |
Equity | | | | 4,464.3 | | | | | 3,938.1 | |
| | | | |
Total liabilities and equity | | | $ | | 6,964.6 | | | | $ | | 6,676.9 | |
| | | | |
| | | | | | |
| | Years Ended
December 31, |
| | 2013 | | 2012 | | 2011 |
Operating Revenue and Expenses | | | | | | |
Revenues | | | $ | | 562.5 | | | | $ | | 478.9 | | | | $ | | 457.7 | |
Expenses | | | | 309.6 | | | | | 273.5 | | | | | 279.4 | |
| | | | | | |
Excess of revenues over expenses | | | $ | | 252.9 | | | | $ | | 205.4 | | | | $ | | 178.3 | |
| | | | | | |
Management of the Account monitors the financial position of the Account’s joint venture partners. To the extent that management of the Account determines that a joint venture partner has financial or liquidity concerns, management will evaluate all actions and remedies available to the Account under the applicable joint venture agreement to minimize any potential adverse implications to the Account.
82
Note 8—Investments in Limited Partnerships
The Account invests in limited partnerships, limited liability companies, and private real estate equity investment trusts that own real estate properties and real estate-related securities. The Account receives distributions from these investments based on the Account’s ownership interest percentages. At December 31, 2013, the Account held interests in three limited partnerships, one limited liability company and one private real estate equity investment trust. The Account held non-controlling ownership interest percentages in these investments ranging from 5.3% to 18.5%. Under the terms of the partnership agreements governing such investments, and based upon the expected term of each such partnership, the partnerships could engage in liquidation activities beginning in 2014 through 2017. During 2013, the Heitman Value Partners Fund began liquidation; the remaining investment assets are anticipated to be liquidated during 2014. Cobalt Industrial REIT and Colony Realty Partners LP are anticipated to begin liquidation in 2014. The Account’s ownership interest in the five investments, including the Account’s remaining interest in the Heitman Value Partners Fund, was $362.0 million and $339.8 million at December 31, 2013 and December 31, 2012, respectively.
83
Note 9—Mortgage Loans Payable
At December 31, 2013, the Account had outstanding mortgage loans payable secured by the following properties (in millions):
| | | | | | | | |
Property | | Interest Rate
and
Payment Frequency(3) | | Principal
Amounts as of
December 31, | | Maturity |
| | 2013 | | 2012 |
1 & 7 Westferry Circus(1)(2)(5) | | 5.40% paid quarterly | | | $ | | — | | | | $ | | 208.4 | | | | | February 28, 2013 | |
Reserve at Sugarloaf(1)(5) | | 5.49% paid monthly | | | | — | | | | | 23.9 | | | | | June 1, 2013 | |
South Frisco Village | | 5.85% paid monthly | | | | — | | | | | 26.3 | | | | | June 1, 2013 | |
Pacific Plaza(1)(5) | | 5.55% paid monthly | | | | — | | | | | 8.0 | | | | | September 1, 2013 | |
Wilshire Rodeo Plaza(5) | | 5.28% paid monthly | | | | 112.7 | | | | | 112.7 | | | | | April 11, 2014 | |
1401 H Street NW(1)(5) | | 5.97% paid monthly | | | | 109.3 | | | | | 110.8 | | | | | December 7, 2014 | |
Windsor at Lenox Park(5)(10) | | 4.43% paid monthly | | | | — | | | | | 24.0 | | | | | August 1, 2015 | |
San Montego Apartments(5)(6)(10) | | 4.47% paid monthly | | | | — | | | | | 21.8 | | | | | August 1, 2015 | |
Montecito Apartments(5)(6)(10) | | 4.47% paid monthly | | | | — | | | | | 20.2 | | | | | August 1, 2015 | |
Phoenician Apartments(5)(6)(10) | | 4.47% paid monthly | | | | — | | | | | 21.3 | | | | | August 1, 2015 | |
99 High Street | | 5.52% paid monthly | | | | 185.0 | | | | | 185.0 | | | | | November 11, 2015 | |
Lincoln Centre | | 5.51% paid monthly | | | | 153.0 | | | | | 153.0 | | | | | February 1, 2016 | |
Charleston Plaza(1)(5) | | 5.60% paid monthly | | | | 36.2 | | | | | 36.9 | | | | | September 11, 2016 | |
The Legend at Kierland(5)(7) | | 4.97% paid monthly | | | | 21.8 | | | | | 21.8 | | | | | August 1, 2017 | |
The Tradition at Kierland(5)(7) | | 4.97% paid monthly | | | | 25.8 | | | | | 25.8 | | | | | August 1, 2017 | |
Mass Court(5) | | 2.88% paid monthly | | | | 92.6 | | | | | 92.6 | | | | | September 1, 2019 | |
Red Canyon at Palomino Park(5)(8) | | 5.34% paid monthly | | | | 27.1 | | | | | 27.1 | | | | | August 1, 2020 | |
Green River at Palomino Park(5)(8) | | 5.34% paid monthly | | | | 33.2 | | | | | 33.2 | | | | | August 1, 2020 | |
Blue Ridge at Palomino Park(5)(8) | | 5.34% paid monthly | | | | 33.4 | | | | | 33.4 | | | | | August 1, 2020 | |
Ashford Meadows(5) | | 5.17% paid monthly | | | | 44.6 | | | | | 44.6 | | | | | August 1, 2020 | |
The Corner(5) | | 4.66% paid monthly | | | | 105.0 | | | | | 105.0 | | | | | June 1, 2021 | |
The Palatine(5) | | 4.25% paid monthly | | | | 80.0 | | | | | 80.0 | | | | | January 10, 2022 | |
The Forum at Carlsbad(5) | | 4.25% paid monthly | | | | 90.0 | | | | | 90.0 | | | | | March 1, 2022 | |
The Colorado(5) | | 3.69% paid monthly | | | | 91.7 | | | | | 91.7 | | | | | November 1, 2022 | |
The Legacy at Westwood(5) | | 3.69% paid monthly | | | | 46.7 | | | | | 46.7 | | | | | November 1, 2022 | |
Regents Court(5) | | 3.69% paid monthly | | | | 39.6 | | | | | 39.6 | | | | | November 1, 2022 | |
The Caruth(5) | | 3.69% paid monthly | | | | 45.0 | | | | | 45.0 | | | | | November 1, 2022 | |
Fourth & Madison(5)(9) | | 3.75% paid monthly | | | | 200.0 | | | | | 145.0 | | | | | June 1, 2023 | |
1001 Pennsylvania Avenue(9) | | 3.70% paid monthly | | | | 330.0 | | | | | 210.0 | | | | | June 1, 2023 | |
50 Fremont Street(5)(9) | | 3.75% paid monthly | | | | 200.0 | | | | | 135.0 | | | | | June 1, 2023 | |
780 Third Avenue(5) | | 3.55% paid monthly | | | | 150.0 | | | | | — | | | | | August 1, 2025 | |
780 Third Avenue(5) | | 3.55% paid monthly | | | | 20.0 | | | | | — | | | | | August 1, 2025 | |
Publix at Weston Commons(5) | | 5.08% paid monthly | | | | 35.0 | | | | | 35.0 | | | | | January 1, 2036 | |
| | | | | | | | |
Total Principal Outstanding | | | | | $ | | 2,307.7 | | | | $ | | 2,253.8 | | | |
Fair Value Adjustment(4) | | | | | | (28.6 | ) | | | | | 28.8 | | | |
| | | | | | | | |
Total mortgage loans payable | | | | | $ | | 2,279.1 | | | | $ | | 2,282.6 | | | |
| | | | | | | | |
|
(1) | | | | The mortgage is adjusted monthly for principal payments. |
|
(2) | | | | The mortgage is denominated in British pounds and the principal payment had been converted to U.S. dollars using the exchange rate as of December 31, 2012. |
|
(3) | | | | Interest rates are fixed, unless stated otherwise. |
|
(4) | | | | The fair value adjustment consists of the difference (positive or negative) between the principal amount of the outstanding debt and the fair value of the outstanding debt. See Note 1—Organization and Significant Accounting Policies. |
|
(5) | | | | These properties are each owned by separate wholly owned subsidiaries of TIAA for benefit of the Account. The assets and credit of each of these borrowings entities are not available to satisfy the debts and other obligations of the Account or any other entity or person other than such borrowing entity. |
|
(6) | | | | Represents mortgage loans payable on these individual properties, which are held within the Houston Apartment Portfolio. |
|
(7) | | | | Represents mortgage loans payable on these individual properties, which are held within the Kierland Apartment Portfolio. |
|
(8) | | | | Represents mortgage loans payable on these individual properties, which are held within Palomino Park. |
84
|
(9) | | | | Represents mortgage loans that were refinanced in the quarter ended June 30, 2013, into 10-year loans with interest only due for the first five years and principal payments due thereafter. |
|
(10) | | | | Represents mortgage loans payable that were paid off before maturity in the fourth quarter of 2013. |
On December 20, 2013, the Account entered into a construction loan for up to $160.0 million for the development of an office property. During its initial three year term, the loan is interest only with a variable interest rate equal to the 30-Day London Interbank Offered Rate (LIBOR) plus 1.70%, declining to 1.45% at project stabilization. At December 31, 2013 no amounts were outstanding on this loan.
Principal payment schedule on mortgage loans payable as of December 31, 2013 was as follows (in millions):
| | |
| | Amount |
2014 | | | $ | | 222.7 | |
2015 | | | | 185.8 | |
2016 | | | | 188.5 | |
2017 | | | | 51.9 | |
2018 | | | | 16.8 | |
Thereafter | | | | 1,642.0 | |
| | |
Total maturities | | | $ | | 2,307.7 | |
| | |
Note 10—Financial Highlights
Selected condensed financial information for an Accumulation Unit of the Account is presented below. Per Accumulation Unit data is calculated on average units outstanding.
| | | | | | | | | | |
| | Years Ended December 31, |
| | 2013 | | 2012 | | 2011 | | 2010 | | 2009 |
Per Accumulation Unit data: | | | | | | | | | | |
Rental income | | | $ | | 15.313 | | | | $ | | 16.345 | | | | $ | | 17.224 | | | | $ | | 19.516 | | | | $ | | 22.649 | |
Real estate property level expenses and taxes | | | | 8.112 | | | | | 9.059 | | | | | 8.640 | | | | | 9.987 | | | | | 11.193 | |
| | | | | | | | | | |
Real estate income, net | | | | 7.201 | | | | | 7.286 | | | | | 8.584 | | | | | 9.529 | | | | | 11.456 | |
Other income | | | | 2.759 | | | | | 2.178 | | | | | 2.143 | | | | | 2.214 | | | | | 2.778 | |
| | | | | | | | | | |
Total income | | | | 9.960 | | | | | 9.464 | | | | | 10.727 | | | | | 11.743 | | | | | 14.234 | |
Expense charges(1) | | | | 2.672 | | | | | 2.562 | | | | | 2.390 | | | | | 2.167 | | | | | 2.280 | |
| | | | | | | | | | |
Investment income, net | | | | 7.288 | | | | | 6.902 | | | | | 8.337 | | | | | 9.576 | | | | | 11.954 | |
Net realized and unrealized gain (loss) on investments and mortgage loans payable | | | | 19.015 | | | | | 18.013 | | | | | 20.144 | | | | | 16.143 | | | | | (85.848 | ) | |
| | | | | | | | | | |
Net increase (decrease) in Accumulation Unit Value | | | | 26.303 | | | | | 24.915 | | | | | 28.481 | | | | | 25.719 | | | | | (73.894 | ) | |
Accumulation Unit Value: | | | | | | | | | | |
Beginning of period | | | | 272.569 | | | | | 247.654 | | | | | 219.173 | | | | | 193.454 | | | | | 267.348 | |
| | | | | | | | | | |
End of period | | | $ | | 298.872 | | | | $ | | 272.569 | | | | $ | | 247.654 | | | | $ | | 219.173 | | | | $ | | 193.454 | |
| | | | | | | | | | |
Total return | | | | 9.65% | | | | | 10.06% | | | | | 12.99% | | | | | 13.29% | | | | | -27.64% | |
Ratios to Average net Assets: | | | | | | | | | | |
Expenses(1) | | | | 0.92% | | | | | 0.95% | | | | | 0.98% | | | | | 1.09% | | | | | 1.01% | |
Investment income, net | | | | 2.50% | | | | | 2.55% | | | | | 3.42% | | | | | 4.84% | | | | | 5.29% | |
Portfolio turnover rate: | | | | | | | | | | |
Real estate properties(2) | | | | 2.10% | | | | | 10.22% | | | | | 3.01% | | | | | 1.01% | | | | | 0.75% | |
Marketable securities(3) | | | | 8.36% | | | | | 21.92% | | | | | 3.43% | | | | | 19.18% | | | | | 0.00% | |
Accumulation Units outstanding at end of period (in millions): | | | | 55.3 | | | | | 53.3 | | | | | 53.4 | | | | | 48.1 | | | | | 39.5 | |
Net assets end of period (in millions) | | | $ | | 16,907.9 | | | | $ | | 14,861.1 | | | | $ | | 13,527.2 | | | | $ | | 10,803.1 | | | | $ | | 7,879.9 | |
|
(1) | | | | Expense charges per Accumulation Unit and the Ratio of Expenses to average net assets reflect the year to date Account-level expenses and exclude real estate property level expenses which are included in real estate income, net. |
|
(2) | | | | Real estate investment portfolio turnover rate is calculated by dividing the lesser of purchases or sales of real estate property investments (including contributions to, or return of capital distributions received from, existing joint venture and limited partnership investments) by the average value of the portfolio of real estate investments held during the period. |
|
(3) | | | | Marketable securities portfolio turnover rate is calculated by dividing the lesser of purchases or sales of securities, excluding securities having maturity dates at acquisition of one year or less, by the average value of the portfolio securities held during the period. |
85
Note 11—Accumulation Units
Changes in the number of Accumulation Units outstanding were as follows (in millions):
| | | | | | |
| | For The
Years Ended |
| | 2013 | | 2012 | | 2011 |
Outstanding: | | | | | | |
Beginning of period | | | | 53.3 | | | | | 53.4 | | | | | 48.1 | |
Credited for premiums | | | | 7.9 | | | | | 7.4 | | | | | 10.0 | |
Liquidity units redeemed—Note 3 | | | | (1.2 | ) | | | | | (3.6 | ) | | | | | — | |
Annuity, other periodic payments, withdrawals and death benefits | | | | (4.7 | ) | | | | | (3.9 | ) | | | | | (4.7 | ) | |
| | | | | | |
End of period | | | | 55.3 | | | | | 53.3 | | | | | 53.4 | |
| | | | | | |
Note 12—Commitments and Contingencies
Commitments—The Account had $0.5 million and $6.8 million of outstanding immediately callable commitments to purchase additional interests in its limited partnership investments as of December 31, 2013 and 2012, respectively.
The Account has committed a total of $74.1 million and $90.2 million as of December 31, 2013 and 2012, respectively, to various tenants for tenant improvements and leasing inducements.
Contingencies—The Account is party to various claims and routine litigation arising in the ordinary course of business. Management of the Account does not believe the results of any such claims or litigation, individually, or in the aggregate, will have a material effect on the Account’s business, financial position, or results of operations.
86
TIAA REAL ESTATE ACCOUNT
CONSOLIDATED STATEMENTS OF INVESTMENTS
December 31, 2013 and December 31, 2012
(Dollar values shown in millions)
REAL ESTATE PROPERTIES—60.5% and 61.8%
| | | | | | |
Location / Description | | Type | | Fair Value |
| | 2013 | | 2012 |
Arizona: | | | | | | |
Camelback Center | | Office | | | $ | | 38.6 | | | | $ | | 32.6 | |
Kierland Apartment Portfolio | | Apartments | | | | 119.0 | (1) | | | | | 114.1 | (1) | |
Phoenix Apartment Portfolio | | Apartments | | | | — | | | | | 33.6 | |
California: | | | | | | |
3 Hutton Centre Drive | | Office | | | | 41.3 | | | | | 38.6 | |
50 Fremont Street | | Office | | | | 518.0 | (1) | | | | | 433.9 | (1) | |
88 Kearny Street | | Office | | | | 111.8 | | | | | 101.7 | |
275 Battery Street | | Office | | | | 251.4 | | | | | 241.0 | |
Centre Pointe and Valley View | | Industrial | | | | 31.9 | | | | | 30.5 | |
Cerritos Industrial Park | | Industrial | | | | 86.4 | | | | | 83.3 | |
Charleston Plaza | | Retail | | | | 82.0 | (1) | | | | | 80.0 | (1) | |
Great West Industrial Portfolio | | Industrial | | | | 119.0 | | | | | 106.2 | |
Holly Street Village | | Apartments | | | | 124.0 | | | | | — | |
Larkspur Courts | | Apartments | | | | 96.4 | | | | | 93.4 | |
Northern CA RA Industrial Portfolio | | Industrial | | | | 47.3 | | | | | 45.3 | |
Northpark Village Square | | Retail | | | | 40.8 | | | | | 41.4 | |
Oceano at Warner Center | | Apartments | | | | 87.3 | | | | | — | |
Ontario Industrial Portfolio | | Industrial | | | | 329.2 | | | | | 304.1 | |
Pacific Plaza | | Office | | | | 82.0 | | | | | 75.7 | (1) | |
Rancho Cucamonga Industrial Portfolio | | Industrial | | | | 124.4 | | | | | 107.0 | |
Regents Court | | Apartments | | | | 78.5 | (1) | | | | | 81.6 | (1) | |
Southern CA RA Industrial Portfolio | | Industrial | | | | 88.6 | | | | | 86.9 | |
Stella | | Apartments | | | | 168.5 | | | | | — | |
The Forum at Carlsbad | | Retail | | | | 192.9 | (1) | | | | | 186.0 | (1) | |
The Legacy at Westwood | | Apartments | | | | 126.0 | (1) | | | | | 111.5 | (1) | |
West Lake North Business Park | | Office | | | | 48.7 | | | | | 46.3 | |
Westcreek | | Apartments | | | | 36.8 | | | | | 34.7 | |
Westwood Marketplace | | Retail | | | | 108.0 | | | | | 108.1 | |
Wilshire Rodeo Plaza | | Office | | | | 181.1 | (1) | | | | | 171.0 | (1) | |
Colorado: | | | | | | |
Palomino Park | | Apartments | | | | 264.3 | (1) | | | | | 247.4 | (1) | |
South Denver Marketplace | | Retail | | | | 69.9 | | | | | — | |
Connecticut: | | | | | | |
Ten & Twenty Westport Road | | Office | | | | 150.0 | | | | | 145.1 | |
Florida: | | | | | | |
701 Brickell Avenue | | Office | | | | 271.3 | | | | | 230.9 | |
North 40 Office Complex | | Office | | | | 27.8 | | | | | 28.6 | |
Plantation Grove | | Retail | | | | 12.5 | | | | | 10.3 | |
Publix at Weston Commons | | Retail | | | | 55.0 | (1) | | | | | 52.0 | (1) | |
Quiet Waters at Coquina Lakes | | Apartments | | | | — | | | | | 26.6 | |
Seneca Industrial Park | | Industrial | | | | 73.8 | | | | | 74.6 | |
South Florida Apartment Portfolio | | Apartments | | | | 77.9 | | | | | 79.7 | |
Suncrest Village Shopping Center | | Retail | | | | 13.5 | | | | | 11.4 | |
The Fairways of Carolina | | Apartments | | | | — | | | | | 25.1 | |
The Residences at the Village of Merrick Park | | Apartments | | | | 63.8 | | | | | 53.8 | |
Urban Centre | | Office | | | | 107.6 | | | | | 105.5 | |
Weston Business Center | | Industrial | | | | 85.5 | | | | | 87.5 | |
87
TIAA REAL ESTATE ACCOUNT
CONSOLIDATED STATEMENTS OF INVESTMENTS
December 31, 2013 and December 31, 2012
(Dollar values shown in millions)
| | | | | | |
Location / Description | | Type | | Fair Value |
| | 2013 | | 2012 |
France: | | | | | | |
Printemps de L’Homme | | Retail | | | $ | | 226.9 | | | | $ | | 209.2 | |
Georgia: | | | | | | |
Atlanta Industrial Portfolio | | Industrial | | | | 42.5 | | | | | 42.5 | |
Glenridge Walk | | Apartments | | | | 40.1 | | | | | 37.6 | |
Reserve at Sugarloaf | | Apartments | | | | — | | | | | 43.0 | (1) | |
Shawnee Ridge Industrial Portfolio | | Industrial | | | | 61.4 | | | | | 58.3 | |
Windsor at Lenox Park | | Apartments | | | | 64.9 | | | | | 55.0 | (1) | |
Illinois: | | | | | | |
Chicago Caleast Industrial Portfolio | | Industrial | | | | 62.7 | | | | | 58.3 | |
Chicago Industrial Portfolio | | Industrial | | | | 66.7 | | | | | 66.2 | |
Parkview Plaza | | Office | | | | 45.6 | | | | | 39.3 | |
Maryland: | | | | | | |
The Shops at Wisconsin Place | | Retail | | | | 99.1 | | | | | 96.3 | |
Massachusetts: | | | | | | |
99 High Street | | Office | | | | 438.0 | (1) | | | | | 386.2 | (1) | |
501 Boylston Street(7) | | Office | | | | 364.1 | | | | | 289.9 | |
Northeast RA Industrial Portfolio | | Industrial | | | | 29.6 | | | | | 28.1 | |
Residence at Rivers Edge | | Apartments | | | | 87.6 | | | | | 88.8 | |
Nevada: | | | | | | |
Fernley Distribution Facility | | Industrial | | | | — | | | | | 7.3 | |
New Jersey: | | | | | | |
Konica Photo Imaging Headquarters | | Industrial | | | | 20.4 | | | | | 19.1 | |
Marketfair | | Retail | | | | 84.7 | | | | | 72.2 | |
Mohawk Distribution Center | | Industrial | | | | 78.0 | | | | | — | |
Plainsboro Plaza | | Retail | | | | — | | | | | 23.5 | |
South River Road Industrial | | Industrial | | | | 54.7 | | | | | 47.4 | |
New York: | | | | | | |
425 Park Avenue | | Ground Lease | | | | 400.0 | | | | | 330.0 | |
780 Third Avenue | | Office | | | | 365.2 | (1) | | | | | 335.4 | |
The Colorado | | Apartments | | | | 190.3 | (1) | | | | | 161.0 | (1) | |
The Corner | | Apartments | | | | 230.0 | (1) | | | | | 228.0 | (1) | |
Pennsylvania: | | | | | | |
1619 Walnut Street | | Retail | | | | 19.0 | | | | | — | |
Lincoln Woods | | Apartments | | | | — | | | | | 31.0 | |
The Pepper Building | | Apartments | | | | 51.1 | | | | | 52.5 | |
Tennessee: | | | | | | |
Summit Distribution Center | | Industrial | | | | 17.0 | | | | | 19.6 | |
Texas: | | | | | | |
Cliffs at Barton Creek | | Apartments | | | | 39.1 | | | | | — | |
Dallas Industrial Portfolio | | Industrial | | | | 176.9 | | | | | 164.6 | |
Four Oaks Place | | Land | | | | 64.3 | | | | | 16.2 | |
Houston Apartment Portfolio | | Apartments | | | | 263.2 | | | | | 244.4 | (1) | |
Lincoln Centre | | Office | | | | 267.7 | (1) | | | | | 230.9 | (1) | |
Pinnacle Industrial Portfolio | | Industrial | | | | 44.1 | | | | | 42.0 | |
South Frisco Village | | Retail | | | | — | | | | | 34.0 | (1) | |
88
TIAA REAL ESTATE ACCOUNT
CONSOLIDATED STATEMENTS OF INVESTMENTS
December 31, 2013 and December 31, 2012
(Dollar values shown in millions)
| | | | | | |
Location / Description | | Type | | Fair Value |
| | 2013 | | 2012 |
Texas: (continued) | | | | | | |
The Caruth | | Apartments | | | $ | | 81.3 | (1) | | | | $ | | 78.1 | (1) | |
The Maroneal | | Apartments | | | | 51.7 | | | | | 48.5 | |
United Kingdom: | | | | | | |
1 & 7 Westferry Circus | | Office | | | | — | | | | | 223.5 | (1) | |
Virginia: | | | | | | |
8270 Greensboro Drive | | Office | | | | 41.8 | | | | | 34.0 | |
Ashford Meadows Apartments | | Apartments | | | | 105.6 | (1) | | | | | 100.3 | (1) | |
The Ellipse at Ballston | | Office | | | | 85.3 | | | | | 78.3 | |
The Palatine | | Apartments | | | | 130.0 | (1) | | | | | 134.2 | (1) | |
Washington: | | | | | | |
Circa Green Lake | | Apartments | | | | 85.0 | | | | | 84.0 | |
Creeksides at Centerpoint | | Office | | | | — | | | | | 20.2 | |
Fourth and Madison | | Office | | | | 435.0 | (1) | | | | | 429.3 | (1) | |
Millennium Corporate Park | | Office | | | | 149.0 | | | | | 139.4 | |
Northwest RA Industrial Portfolio | | Industrial | | | | 27.1 | | | | | 26.0 | |
Pacific Corporate Park | | Industrial | | | | 35.8 | | | | | 35.0 | |
Prescott Wallingford Apartments | | Apartments | | | | 53.6 | | | | | 53.6 | |
Rainier Corporate Park | | Industrial | | | | 86.5 | | | | | 88.5 | |
Regal Logistics Campus | | Industrial | | | | 73.4 | | | | | 69.5 | |
Washington DC: | | | | | | |
1001 Pennsylvania Avenue | | Office | | | | 726.7 | (1) | | | | | 679.4 | (1) | |
1401 H Street, NW | | Office | | | | 231.8 | (1) | | | | | 211.3 | (1) | |
1900 K Street, NW | | Office | | | | 287.3 | | | | | 257.7 | |
Mass Court | | Apartments | | | | 170.3 | (1) | | | | | 169.0 | (1) | |
Mazza Gallerie | | Retail | | | | 80.2 | | | | | 70.0 | |
| | | | | | |
TOTAL REAL ESTATE PROPERTIES | | | | | | |
(Cost $10,679.5 and $10,543.6) | | | | | $ | | 11,565.1 | | | | $ | | 10,554.6 | |
| | | | | | |
89
TIAA REAL ESTATE ACCOUNT
CONSOLIDATED STATEMENTS OF INVESTMENTS
December 31, 2013 and December 31, 2012
(Dollar values shown in millions)
OTHER REAL ESTATE-RELATED INVESTMENTS—15.3% and 15.4%
REAL ESTATE JOINT VENTURES—13.4% and 13.4% (Note 7)
| | | | | | |
Location / Description | | Type | | Fair Value |
| | 2013 | | 2012 |
California: | | | | | | |
CA—Colorado Center LP | | | | | | |
Colorado Center (50% Account Interest) | | Office | | | $ | | 261.3 | (2) | | | | $ | | 228.4 | (2) | |
CA—Treat Towers LP | | | | | | |
Treat Towers (75% Account Interest) | | Office | | | | — | (8) | | | | | 2.1 | (5) | |
Valencia Town Center Associates LP | | | | | | |
Valencia Town Center (49.9% Account Interest) | | Retail | | | | 113.5 | (2) | | | | | 99.1 | (2) | |
Florida: | | | | | | |
Florida Mall Associates, Ltd | | | | | | |
The Florida Mall (50% Account Interest) | | Retail | | | | 490.9 | (2) | | | | | 386.2 | (2) | |
TREA Florida Retail, LLC | | | | | | |
Florida Retail Portfolio (80% Account Interest) | | Retail | | | | 119.3 | | | | | 149.6 | |
West Dade County Associates | | | | | | |
Miami International Mall (50% Account Interest) | | Retail | | | | 196.4 | | | | | 137.0 | (2) | |
Georgia: | | | | | | |
GA—Buckhead LLC | | | | | | |
Prominence in Buckhead (75% Account Interest) | | Office | | | | — | (8) | | | | | 2.4 | (5) | |
Maryland: | | | | | | |
WP Project Developer | | | | | | |
The Shops at Wisconsin Place (33.33% Account Interest) | | Retail | | | | 13.9 | | | | | 14.6 | |
Massachusetts: | | | | | | |
MA—One Boston Place REIT | | | | | | |
One Boston Place (50.25% Account Interest) | | Office | | | | 208.3 | | | | | 195.5 | |
New York: | | | | | | |
RGM 42, LLC | | | | | | |
MiMA (70% Account Interest) | | Apartments | | | | 290.4 | (2) | | | | | 282.0 | (2) | |
Tennessee: | | | | | | |
West Town Mall, LLC | | | | | | |
West Town Mall (50% Account Interest) | | Retail | | | | 77.8 | (2) | | | | | 67.2 | (2) | |
Texas: | | | | | | |
Four Oaks Venture LP | | | | | | |
Four Oaks Place LP (51% Account Interest) | | Office | | | | 275.9 | | | | | 261.2 | |
Various: | | | | | | |
DDR TC LLC | | | | | | |
DDR Joint Venture (85% Account Interest) | | Retail | | | | 413.7 | (2,3) | | | | | 386.3 | (2,3) | |
Storage Portfolio I, LLC | | | | | | |
Storage Portfolio (75% Account Interest) | | Storage | | | | 101.6 | (2,3) | | | | | 78.6 | (2,3) | |
Strategic Ind Portfolio I, LLC | | | | | | |
IDI Nationwide Industrial Portfolio (60% Account Interest) | | Industrial | | | | 0.6 | (3,6) | | | | | 1.3 | (2,3,6) | |
| | | | | | |
TOTAL REAL ESTATE JOINT VENTURES | | | | | | |
(Cost $2,167.3 and $2,287.6) | | | | | $ | | 2,563.6 | | | | $ | | 2,291.5 | |
| | | | | | |
90
TIAA REAL ESTATE ACCOUNT
CONSOLIDATED STATEMENTS OF INVESTMENTS
December 31, 2013 and December 31, 2012
(Dollar values shown in millions)
| | | | |
Location / Description | | Fair Value |
| | 2013 | | 2012 |
LIMITED PARTNERSHIPS—1.9% and 2.0% (Note 8) | | | | |
Cobalt Industrial REIT (10.998% Account Interest) | | | $ | | 24.8 | | | | $ | | 26.1 | |
Colony Realty Partners LP (5.27% Account Interest) | | | | 20.7 | | | | | 20.5 | |
Heitman Value Partners Fund (8.43% Account Interest) | | | | 0.4 | | | | | 3.9 | |
Lion Gables Apartment Fund (18.46% Account Interest) | | | | 288.4 | | | | | 258.0 | |
Transwestern Mezz Realty Partners III, LLC (11.708% Account Interest) | | | | 27.7 | | | | | 31.3 | |
| | | | |
TOTAL LIMITED PARTNERSHIPS | | | | |
(Cost $257.4 and $266.2) | | | $ | | 362.0 | | | | $ | | 339.8 | |
| | | | |
TOTAL REAL ESTATE JOINT VENTURES AND LIMITED PARTNERSHIPS | | | | |
(Cost $2,424.7 and $2,553.8) | | | $ | | 2,925.6 | | | | $ | | 2,631.3 | |
| | | | |
91
TIAA REAL ESTATE ACCOUNT
CONSOLIDATED STATEMENTS OF INVESTMENTS
December 31, 2013 and December 31, 2012
(Dollar values shown in millions)
MARKETABLE SECURITIES—24.2% and 22.8%
REAL ESTATE-RELATED MARKETABLE SECURITIES—7.9% and 7.8%
| | | | | | | | |
Shares | | Issuer | | Fair Value |
2013 | | 2012 | | 2013 | | 2012 |
| | 134,862 | | | | | 111,782 | | | Acadia Realty Trust | | | $ | | 3.3 | | | | $ | | 2.8 | |
| | 33,840 | | | | | 30,210 | | | Agree Realty Corporation | | | | 1.0 | | | | | 0.8 | |
| | 5,049 | | | | | 4,959 | | | Alexander’s, Inc. | | | | 1.7 | | | | | 1.6 | |
| | 174,957 | | | | | 151,807 | | | Alexandria Real Estate Equities, Inc. | | | | 11.1 | | | | | 10.5 | |
| | 86,953 | | | | | 94,923 | | | American Assets Trust, Inc. | | | | 2.7 | | | | | 2.7 | |
| | 256,019 | | | | | 250,699 | | | American Campus Communities, Inc. | | | | 8.2 | | | | | 11.6 | |
| | 114,990 | | | | | — | | | American Homes 4 Rent | | | | 1.9 | | | | | — | |
| | 451,330 | | | | | 376,970 | | | American Realty Capital Properties, Inc. | | | | 5.8 | | | | | 4.4 | |
| | 45,810 | | | | | — | | | American Residential Properties | | | | 0.8 | | | | | — | |
| | 969,299 | | | | | 944,789 | | | American Tower Corp. | | | | 77.5 | | | | | 73.0 | |
| | 355,553 | | | | | 346,913 | | | Apartment Investment and Management Company | | | | 9.2 | | | | | 9.4 | |
| | 47,530 | | | | | — | | | Armada Hoffler Properties Inc. | | | | 0.4 | | | | | — | |
| | 31,236 | | | | | — | | | Ashford Hospitality Prime Inc. | | | | 0.6 | | | | | — | |
| | 156,183 | | | | | 164,643 | | | Ashford Hospitality Trust, Inc. | | | | 1.3 | | | | | 1.7 | |
| | 143,225 | | | | | 122,355 | | | Associated Estates Realty Corporation | | | | 2.3 | | | | | 2.0 | |
| | 316,410 | | | | | 270,130 | | | Avalonbay Communities, Inc. | | | | 37.4 | | | | | 36.6 | |
| | 25,510 | | | | | — | | | Aviv REIT, Inc. | | | | 0.6 | | | | | — | |
| | 470,857 | | | | | 366,497 | | | BioMed Realty Trust, Inc. | | | | 8.5 | | | | | 7.1 | |
| | 370,695 | | | | | 356,885 | | | Boston Properties, Inc. | | | | 37.2 | | | | | 37.8 | |
| | 386,249 | | | | | 346,409 | | | Brandywine Realty Trust | | | | 5.4 | | | | | 4.2 | |
| | 187,688 | | | | | 182,748 | | | BRE Properties, Inc. | | | | 10.3 | | | | | 9.3 | |
| | 101,190 | | | | | — | | | Brixmore Porperty Group Inc | | | | 2.1 | | | | | — | |
| | 207,546 | | | | | 200,136 | | | Camden Property Trust | | | | 11.8 | | | | | 13.7 | |
| | 161,828 | | | | | 95,388 | | | Campus Crest Communities, Inc. | | | | 1.5 | | | | | 1.2 | |
| | — | | | | | 160,579 | | | CapLease, Inc. | | | | — | | | | | 0.9 | |
| | 415,687 | | | | | 383,657 | | | CBL & Associates Properties, Inc. | | | | 7.5 | | | | | 8.1 | |
| | 183,285 | | | | | 183,285 | | | Cedar Shopping Centers, Inc. | | | | 1.1 | | | | | 1.0 | |
| | 578,960 | | | | | — | | | Chambers Street Properties | | | | 4.4 | | | | | — | |
| | 57,737 | | | | | 39,517 | | | Chatham Lodging Trust | | | | 1.2 | | | | | 0.6 | |
| | 123,712 | | | | | 96,842 | | | Chesapeake Lodging Trust | | | | 3.1 | | | | | 2.0 | |
| | 1,146,830 | | | | | — | | | Cole Real Estate Investments | | | | 16.1 | | | | | — | |
| | 270,050 | | | | | — | | | Columbia Property Trust Inc | | | | 6.8 | | | | | — | |
| | — | | | | | 209,214 | | | Colonial Properties Trust | | | | — | | | | | 4.5 | |
| | 289,848 | | | | | 198,258 | | | CommonWealth REIT | | | | 6.8 | | | | | 3.1 | |
| | 52,653 | | | | | 54,983 | | | CoreSite Realty Corporation | | | | 1.7 | | | | | 1.5 | |
| | 201,393 | | | | | 192,453 | | | Corporate Office Properties Trust | | | | 4.8 | | | | | 4.8 | |
| | 271,810 | | | | | — | | | Corrections Corporation of America | | | | 8.7 | | | | | — | |
| | 435,676 | | | | | 253,566 | | | Cousins Properties Incorporated | | | | 4.5 | | | | | 2.1 | |
| | 336,620 | | | | | 297,270 | | | Cubesmart | | | | 5.4 | | | | | 4.3 | |
| | 44,330 | | | | | — | | | CyrusOne Inc | | | | 1.0 | | | | | — | |
| | 773,940 | | | | | 631,210 | | | DCT Industrial Trust, Inc. | | | | 5.5 | | | | | 4.1 | |
| | 748,278 | | | | | 737,598 | | | DDR Corp | | | | 11.5 | | | | | 11.6 | |
| | 479,587 | | | | | 476,317 | | | DiamondRock Hospitality Company | | | | 5.5 | | | | | 4.3 | |
| | 313,752 | | | | | 293,762 | | | Digital Realty Trust, Inc. | | | | 15.4 | | | | | 19.9 | |
| | 326,594 | | | | | 249,384 | | | Douglas Emmett, Inc. | | | | 7.6 | | | | | 5.8 | |
| | 795,686 | | | | | 655,776 | | | Duke Realty Corporation | | | | 12.0 | | | | | 9.1 | |
| | 161,116 | | | | | 154,886 | | | DuPont Fabros Technology, Inc. | | | | 4.0 | | | | | 3.7 | |
| | 74,049 | | | | | 69,659 | | | EastGroup Properties, Inc. | | | | 4.3 | | | | | 3.7 | |
| | 281,251 | | | | | 277,561 | | | Education Realty Trust, Inc. | | | | 2.5 | | | | | 3.0 | |
| | 184,140 | | | | | — | | | Empire State Realty Trust | | | | 2.8 | | | | | — | |
| | 183,486 | | | | | 99,898 | | | Equity Lifestyle Properties, Inc. | | | | 6.6 | | | | | 6.7 | |
| | 143,936 | | | | | 139,076 | | | Equity One, Inc. | | | | 3.2 | | | | | 2.9 | |
92
TIAA REAL ESTATE ACCOUNT
CONSOLIDATED STATEMENTS OF INVESTMENTS
December 31, 2013 and December 31, 2012
(Dollar values shown in millions)
| | | | | | | | |
Shares | | Issuer | | Fair Value |
2013 | | 2012 | | 2013 | | 2012 |
| | 871,504 | | | | | 773,034 | | | Equity Residential | | | $ | | 45.2 | | | | $ | | 43.8 | |
| | 124,602 | | | | | 112,092 | | | EPR Properties | | | | 6.1 | | | | | 5.2 | |
| | 92,809 | | | | | 86,689 | | | Essex Property Trust, Inc. | | | | 13.3 | | | | | 12.7 | |
| | 111,535 | | | | | 90,725 | | | Excel Trust, Inc. | | | | 1.3 | | | | | 1.1 | |
| | 280,022 | | | | | 260,722 | | | Extra Space Storage, Inc. | | | | 11.8 | | | | | 9.5 | |
| | 160,436 | | | | | 153,346 | | | Federal Realty Investment Trust | | | | 16.3 | | | | | 16.0 | |
| | 300,775 | | | | | 300,415 | | | FelCor Lodging Trust Incorporated | | | | 2.5 | | | | | 1.4 | |
| | 273,923 | | | | | 237,873 | | | First Industrial Realty Trust, Inc. | | | | 4.8 | | | | | 3.3 | |
| | 144,421 | | | | | 124,191 | | | First Potomac Realty Trust | | | | 1.7 | | | | | 1.5 | |
| | 217,299 | | | | | 200,089 | | | Franklin Street Properties Corp. | | | | 2.6 | | | | | 2.5 | |
| | 1,270,239 | | | | | 1,118,209 | | | General Growth Properties, Inc. | | | | 25.5 | | | | | 22.2 | |
| | 169,050 | | | | | — | | | GEO Group Inc/The | | | | 5.4 | | | | | — | |
| | 63,548 | | | | | 61,368 | | | Getty Realty Corp. | | | | 1.2 | | | | | 1.1 | |
| | 34,020 | | | | | 27,330 | | | Gladstone Commercial Corporation | | | | 0.6 | | | | | 0.5 | |
| | 360,422 | | | | | 337,882 | | | Glimcher Realty Trust | | | | 3.4 | | | | | 3.7 | |
| | 136,327 | | | | | 96,757 | | | Government Properties Income Trust | | | | 3.4 | | | | | 2.3 | |
| | 127,720 | | | | | — | | | Gramercy Property Trust Inc | | | | 0.7 | | | | | — | |
| | 1,107,319 | | | | | 1,078,709 | | | HCP, Inc. | | | | 40.2 | | | | | 48.7 | |
| | 695,326 | | | | | 616,402 | | | Health Care REIT, Inc. | | | | 37.2 | | | | | 37.8 | |
| | 579,520 | | | | | 111,500 | | | Healthcare Trust of America | | | | 5.7 | | | | | 1.1 | |
| | 237,712 | | | | | 209,252 | | | Healthcare Realty Trust Incorporated | | | | 5.1 | | | | | 5.0 | |
| | 426,743 | | | | | 478,813 | | | Hersha Hospitality Trust | | | | 2.4 | | | | | 2.4 | |
| | 219,889 | | | | | 184,529 | | | Highwoods Properties, Inc. | | | | 8.0 | | | | | 6.2 | |
| | 140,210 | | | | | 121,160 | | | Home Properties, Inc. | | | | 7.5 | | | | | 7.4 | |
| | 366,850 | | | | | 297,940 | | | Hospitality Properties Trust | | | | 9.9 | | | | | 7.0 | |
| | 1,822,914 | | | | | 1,712,374 | | | Host Hotels & Resorts, Inc. | | | | 35.4 | | | | | 26.8 | |
| | 106,312 | | | | | 86,872 | | | Hudson Pacific Properties, Inc. | | | | 2.3 | | | | | 1.8 | |
| | 216,059 | | | | | 220,139 | | | Inland Real Estate Corporation | | | | 2.3 | | | | | 1.8 | |
| | 256,491 | | | | | 223,541 | | | Investors Real Estate Trust | | | | 2.2 | | | | | 2.0 | |
| | 1,500,000 | | | | | 1,500,000 | | | iShares Dow Jones US Real Estate Index Fund | | | | 94.6 | | | | | 97.1 | |
| | 201,093 | | | | | 177,253 | | | Kilroy Realty Corporation | | | | 10.1 | | | | | 8.4 | |
| | 993,333 | | | | | 966,453 | | | Kimco Realty Corporation | | | | 19.6 | | | | | 18.7 | |
| | 321,483 | | | | | 172,013 | | | Kite Realty Group Trust | | | | 2.1 | | | | | 1.0 | |
| | 254,432 | | | | | 204,562 | | | LaSalle Hotel Properties | | | | 7.9 | | | | | 5.2 | |
| | 543,895 | | | | | 423,245 | | | Lexington Realty Trust | | | | 5.6 | | | | | 4.4 | |
| | 355,290 | | | | | 280,060 | | | Liberty Property Trust | | | | 12.0 | | | | | 10.0 | |
| | 84,816 | | | | | 73,286 | | | LTC Properties, Inc. | | | | 3.0 | | | | | 2.6 | |
| | 217,063 | | | | | 208,783 | | | Mack-Cali Realty Corporation | | | | 4.7 | | | | | 5.5 | |
| | — | | | | | 141,919 | | | Maguire Properties, Inc. | | | | — | | | | | 0.4 | |
| | 395,297 | | | | | 327,007 | | | Medical Properties Trust, Inc. | | | | 4.8 | | | | | 3.9 | |
| | 181,705 | | | | | 99,184 | | | Mid-America Apartment Communities, Inc. | | | | 11.0 | | | | | 6.4 | |
| | 102,977 | | | | | 108,037 | | | Monmouth Real Estate Investment Corporation | | | | 0.9 | | | | | 1.1 | |
| | 72,294 | | | | | 66,724 | | | National Health Investors, Inc. | | | | 4.1 | | | | | 3.8 | |
| | 296,600 | | | | | 262,980 | | | National Retail Properties, Inc. | | | | 9.0 | | | | | 8.2 | |
| | 299,263 | | | | | 263,613 | | | Omega Healthcare Investors, Inc. | | | | 8.9 | | | | | 6.3 | |
| | 31,357 | | | | | 40,857 | | | One Liberty Properties, Inc. | | | | 0.6 | | | | | 0.8 | |
| | 133,229 | | | | | 83,079 | | | Parkway Properties, Inc. | | | | 2.6 | | | | | 1.2 | |
| | 153,837 | | | | | 144,447 | | | Pebblebrook Hotel Trust | | | | 4.7 | | | | | 3.3 | |
| | 162,035 | | | | | 136,245 | | | Pennsylvania Real Estate Investment Trust | | | | 3.1 | | | | | 2.4 | |
| | 47,950 | | | | | — | | | Physicians Realty Trust | | | | 0.6 | | | | | — | |
| | 409,892 | | | | | 400,132 | | | Piedmont Office Realty Trust, Inc. | | | | 6.8 | | | | | 7.2 | |
| | 432,157 | | | | | 387,897 | | | Plum Creek Timber Company, Inc. | | | | 20.1 | | | | | 17.2 | |
| | 133,253 | | | | | 129,083 | | | Post Properties, Inc. | | | | 6.0 | | | | | 6.5 | |
| | 92,248 | | | | | 98,748 | | | Potlatch Corporation | | | | 3.9 | | | | | 3.9 | |
| | 1,218,251 | | | | | 1,092,281 | | | ProLogis | | | | 45.0 | | | | | 39.9 | |
| | 49,510 | | | | | 42,980 | | | PS Business Parks, Inc. | | | | 3.8 | | | | | 2.8 | |
93
TIAA REAL ESTATE ACCOUNT
CONSOLIDATED STATEMENTS OF INVESTMENTS
December 31, 2013 and December 31, 2012
(Dollar values shown in millions)
| | | | | | | | |
Shares | | Issuer | | Fair Value |
2013 | | 2012 | | 2013 | | 2012 |
| | 349,519 | | | | | 303,799 | | | Public Storage, Inc. | | | $ | | 52.6 | | | | $ | | 44.0 | |
| | 150,090 | | | | | 115,370 | | | Ramco-Gershenson Properties Trust | | | | 2.4 | | | | | 1.5 | |
| | 308,209 | | | | | 291,439 | | | Rayonier, Inc. | | | | 13.0 | | | | | 15.1 | |
| | 500,294 | | | | | 316,623 | | | Realty Income Corporation | | | | 18.7 | | | | | 12.7 | |
| | 178,566 | | | | | 126,316 | | | Retail Opportunity Investment | | | | 2.6 | | | | | 1.6 | |
| | 468,255 | | | | | 315,375 | | | Retail Properties of America | | | | 6.0 | | | | | 3.8 | |
| | 224,748 | | | | | 213,778 | | | Regency Centers Corporation | | | | 10.4 | | | | | 10.1 | |
| | 39,760 | | | | | — | | | Rexford Industrial Realty Inc | | | | 0.5 | | | | | — | |
| | 300,884 | | | | | 251,880 | | | RLJ Lodging Trust | | | | 7.3 | | | | | 4.9 | |
| | 53,113 | | | | | 60,523 | | | Rouse Properties, Inc. | | | | 1.2 | | | | | 1.0 | |
| | 117,520 | | | | | — | | | Ryman Hospitality Properties | | | | 4.9 | | | | | — | |
| | 91,983 | | | | | — | | | Sabra Health Care REIT Inc | | | | 2.4 | | | | | — | |
| | 32,736 | | | | | 38,426 | | | Saul Centers, Inc. | | | | 1.6 | | | | | 1.7 | |
| | 68,430 | | | | | 46,820 | | | Select Income Real Estate Investment Trust | | | | 1.8 | | | | | 1.2 | |
| | 460,237 | | | | | 420,127 | | | Senior Housing Properties Trust | | | | 10.2 | | | | | 9.9 | |
| | 93,740 | | | | | — | | | Silver Bay Realty Trust Corp | | | | 1.5 | | | | | — | |
| | 750,616 | | | | | 731,366 | | | Simon Property Group, Inc. | | | | 114.2 | | | | | 115.6 | |
| | 232,245 | | | | | 214,765 | | | SL Green Realty Corp. | | | | 21.5 | | | | | 16.5 | |
| | 78,699 | | | | | 70,949 | | | Sovran Self Storage, Inc. | | | | 5.1 | | | | | 4.4 | |
| | 868,341 | | | | | 79,685 | | | Spirit Realty Capital Inc. | | | | 8.5 | | | | | 1.4 | |
| | 104,960 | | | | | 86,560 | | | Stag Industrial, Inc. | | | | 2.1 | | | | | 1.6 | |
| | 417,139 | | | | | 495,039 | | | Strategic Hotels & Resorts, Inc. | | | | 3.9 | | | | | 3.2 | |
| | 199,598 | | | | | 114,628 | | | Summit Hotel Properties, Inc. | | | | 1.8 | | | | | 1.1 | |
| | 85,816 | | | | | 71,926 | | | Sun Communities, Inc. | | | | 3.7 | | | | | 2.9 | |
| | — | | | | | 89,143 | | | Sun Healthcare Group, Inc. | | | | — | | | | | 1.9 | |
| | 447,056 | | | | | 328,016 | | | Sunstone Hotel Investors, L.L.C. | | | | 6.0 | | | | | 3.5 | |
| | 228,624 | | | | | 223,024 | | | Tanger Factory Outlet Centers, Inc. | | | | 7.3 | | | | | 7.6 | |
| | 155,209 | | | | | 147,289 | | | Taubman Centers, Inc. | | | | 9.9 | | | | | 11.6 | |
| | 59,134 | | | | | 36,064 | | | Terreno Realty Corporation | | | | 1.0 | | | | | 0.6 | |
| | 343,852 | | | | | 325,632 | | | The Macerich Company | | | | 20.2 | | | | | 19.0 | |
| | 612,561 | | | | | 596,001 | | | UDR, Inc. | | | | 14.3 | | | | | 14.2 | |
| | 31,724 | | | | | 31,724 | | | UMH Properties, Inc. | | | | 0.3 | | | | | 0.3 | |
| | 31,798 | | | | | 31,418 | | | Universal Health Realty Income Trust | | | | 1.3 | | | | | 1.6 | |
| | 58,833 | | | | | 56,293 | | | Urstadt Biddle Properties, Inc. | | | | 1.1 | | | | | 1.1 | |
| | 719,138 | | | | | 700,308 | | | Ventas, Inc. | | | | 41.2 | | | | | 45.3 | |
| | 409,723 | | | | | 443,493 | | | Vornado Realty Trust | | | | 36.4 | | | | | 35.5 | |
| | 164,207 | | | | | 160,177 | | | Washington Real Estate Investment Trust | | | | 3.8 | | | | | 4.2 | |
| | 266,400 | | | | | 288,060 | | | Weingarten Realty Investors | | | | 7.3 | | | | | 7.7 | |
| | 1,423,998 | | | | | 1,289,368 | | | Weyerhaeuser Company | | | | 45.0 | | | | | 35.9 | |
| | 45,930 | | | | | 26,270 | | | Whitestone Real Estate Investment Trust B | | | | 0.6 | | | | | 0.4 | |
| | 80,257 | | | | | 66,697 | | | Winthrop Realty Trust | | | | 0.9 | | | | | 0.7 | |
| | 141,520 | | | | | 114,000 | | | WP Carey Inc. | | | | 8.7 | | | | | 5.9 | |
| | | | | | | | | |
TOTAL REAL ESTATE-RELATED MARKETABLE SECURITIES | | | | |
(Cost $1,384.3 and $1,175.7) | | | $ | | 1,499.3 | | | | $ | | 1,332.3 | |
| | | | | | | | | |
94
TIAA REAL ESTATE ACCOUNT
CONSOLIDATED STATEMENTS OF INVESTMENTS
December 31, 2013 and December 31, 2012
(Dollar values shown in millions)
OTHER MARKETABLE SECURITIES—16.3% and 15.0%
GOVERNMENT AGENCY NOTES—10.4% and 8.0%
| | | | | | | | | | | | |
Principal | | Issuer | | Yield(4) | | Maturity
Date | | Fair Value |
2013 | | 2012 | | 2013 | | 2012 |
| $ | | — | | | | $ | | 12.0 | | | Fannie Mae Discount Notes | | 0.122% | | | | 1/2/2013 | | | | $ | | — | | | | $ | | 12.0 | |
| | — | | | | | 44.0 | | | Fannie Mae Discount Notes | | 0.086% | | | | 1/16/2013 | | | | | — | | | | | 44.0 | |
| | — | | | | | 20.5 | | | Fannie Mae Discount Notes | | 0.122% | | | | 1/30/2013 | | | | | — | | | | | 20.5 | |
| | — | | | | | 45.2 | | | Fannie Mae Discount Notes | | 0.137% | | | | 2/6/2013 | | | | | — | | | | | 45.1 | |
| | — | | | | | 26.8 | | | Fannie Mae Discount Notes | | 0.127% | | | | 2/27/2013 | | | | | — | | | | | 26.8 | |
| | — | | | | | 25.0 | | | Fannie Mae Discount Notes | | 0.130% | | | | 3/13/2013 | | | | | — | | | | | 25.0 | |
| | — | | | | | 10.0 | | | Fannie Mae Discount Notes | | 0.142% | | | | 3/20/2013 | | | | | — | | | | | 10.0 | |
| | — | | | | | 100.0 | | | Fannie Mae Discount Notes | | 0.149% | | | | 6/12/2013 | | | | | — | | | | | 100.0 | |
| | 21.0 | | | | | — | | | Fannie Mae Discount Notes | | 0.041%-0.046% | | | | 1/15/2014 | | | | | 21.0 | | | | | — | |
| | 3.5 | | | | | — | | | Fannie Mae Discount Notes | | 0.112% | | | | 1/21/2014 | | | | | 3.5 | | | | | — | |
| | 7.0 | | | | | — | | | Fannie Mae Discount Notes | | 0.035%-0.051% | | | | 1/22/2014 | | | | | 7.0 | | | | | — | |
| | 28.2 | | | | | — | | | Fannie Mae Discount Notes | | 0.041% | | | | 1/29/2014 | | | | | 28.2 | | | | | — | |
| | 32.1 | | | | | — | | | Fannie Mae Discount Notes | | 0.071% | | | | 2/3/2014 | | | | | 32.1 | | | | | — | |
| | 30.0 | | | | | — | | | Fannie Mae Discount Notes | | 0.061%-0.066% | | | | 2/5/2014 | | | | | 30.0 | | | | | — | |
| | 50.0 | | | | | — | | | Fannie Mae Discount Notes | | 0.077% | | | | 2/19/2014 | | | | | 50.0 | | | | | — | |
| | 31.0 | | | | | — | | | Fannie Mae Discount Notes | | 0.061% | | | | 2/24/2014 | | | | | 31.0 | | | | | — | |
| | 22.0 | | | | | — | | | Fannie Mae Discount Notes | | 0.086% | | | | 2/26/2014 | | | | | 22.0 | | | | | — | |
| | 31.0 | | | | | — | | | Fannie Mae Discount Notes | | 0.066% | | | | 3/3/2014 | | | | | 31.0 | | | | | — | |
| | 14.0 | | | | | — | | | Fannie Mae Discount Notes | | 0.066% | | | | 4/2/2014 | | | | | 13.9 | | | | | — | |
| | 18.0 | | | | | — | | | Fannie Mae Discount Notes | | 0.091%-0.101% | | | | 4/23/2014 | | | | | 18.0 | | | | | — | |
| | 23.0 | | | | | — | | | Fannie Mae Discount Notes | | 0.107% | | | | 5/1/2014 | | | | | 23.0 | | | | | — | |
| | 25.0 | | | | | — | | | Fannie Mae Discount Notes | | 0.107% | | | | 5/7/2014 | | | | | 25.0 | | | | | — | |
| | 32.7 | | | | | — | | | Fannie Mae Discount Notes | | 0.127% | | | | 6/4/2014 | | | | | 32.7 | | | | | — | |
| | 20.3 | | | | | — | | | Fannie Mae Discount Notes | | 0.127% | | | | 6/11/2014 | | | | | 20.3 | | | | | — | |
| | 38.0 | | | | | — | | | Fannie Mae Discount Notes | | 0.132% | | | | 6/18/2014 | | | | | 38.0 | | | | | — | |
| | — | | | | | 13.0 | | | Federal Farm Credit Bank Discount Notes | | 0.091% | | | | 5/6/2013 | | | | | — | | | | | 13.0 | |
| | — | | | | | 29.3 | | | Federal Home Loan Bank Discount Notes | | 0.117% | | | | 1/4/2013 | | | | | — | | | | | 29.3 | |
| | — | | | | | 50.0 | | | Federal Home Loan Bank Discount Notes | | 0.106% | | | | 1/9/2013 | | | | | — | | | | | 50.0 | |
| | — | | | | | 16.5 | | | Federal Home Loan Bank Discount Notes | | 0.137% | | | | 1/11/2013 | | | | | — | | | | | 16.5 | |
| | — | | | | | 8.0 | | | Federal Home Loan Bank Discount Notes | | 0.132% | | | | 1/16/2013 | | | | | — | | | | | 8.0 | |
| | — | | | | | 41.9 | | | Federal Home Loan Bank Discount Notes | | 0.157% | | | | 1/23/2013 | | | | | — | | | | | 41.9 | |
| | — | | | | | 29.0 | | | Federal Home Loan Bank Discount Notes | | 0.142% | | | | 1/23/2013 | | | | | — | | | | | 29.0 | |
| | — | | | | | 50.0 | | | Federal Home Loan Bank Discount Notes | | 0.142% | | | | 2/13/2013 | | | | | — | | | | | 50.0 | |
| | — | | | | | 19.4 | | | Federal Home Loan Bank Discount Notes | | 0.137% | | | | 2/20/2013 | | | | | — | | | | | 19.4 | |
| | — | | | | | 56.0 | | | Federal Home Loan Bank Discount Notes | | 0.127% | | | | 2/22/2013 | | | | | — | | | | | 56.0 | |
| | — | | | | | 80.0 | | | Federal Home Loan Bank Discount Notes | | 0.127% | | | | 3/1/2013 | | | | | — | | | | | 80.0 | |
| | — | | | | | 57.0 | | | Federal Home Loan Bank Discount Notes | | 0.112% | | | | 3/6/2013 | | | | | — | | | | | 57.0 | |
| | — | | | | | 17.1 | | | Federal Home Loan Bank Discount Notes | | 0.117% | | | | 3/13/2013 | | | | | — | | | | | 17.1 | |
| | — | | | | | 41.6 | | | Federal Home Loan Bank Discount Notes | | 0.147% | | | | 5/3/2013 | | | | | — | | | | | 41.5 | |
| | — | | | | | 11.5 | | | Federal Home Loan Bank Discount Notes | | 0.096%-0.157% | | | | 5/10/2013 | | | | | — | | | | | 11.5 | |
| | — | | | | | 52.7 | | | Federal Home Loan Bank Discount Notes | | 0.157%-0.162% | | | | 5/29/2013 | | | | | — | | | | | 52.7 | |
| | — | | | | | 50.0 | | | Federal Home Loan Bank Discount Notes | | 0.127% | | | | 6/19/2013 | | | | | — | | | | | 50.0 | |
| | 25.0 | | | | | — | | | Federal Home Loan Bank Discount Notes | | 0.056% | | | | 1/2/2014 | | | | | 25.0 | | | | | — | |
| | 27.2 | | | | | — | | | Federal Home Loan Bank Discount Notes | | 0.066% | | | | 1/3/2014 | | | | | 27.2 | | | | | — | |
| | 22.0 | | | | | — | | | Federal Home Loan Bank Discount Notes | | 0.051% | | | | 1/8/2014 | | | | | 22.0 | | | | | — | |
95
TIAA REAL ESTATE ACCOUNT
CONSOLIDATED STATEMENTS OF INVESTMENTS
December 31, 2013 and December 31, 2012
(Dollar values shown in millions)
| | | | | | | | | | | | |
Principal | | Issuer | | Yield(4) | | Maturity
Date | | Fair Value |
2013 | | 2012 | | 2013 | | 2012 |
| $ | | 100.0 | | | | $ | | — | | | Federal Home Loan Bank Discount Notes | | 0.061% | | | | 1/10/2014 | | | | $ | | 100.0 | | | | $ | | — | |
| | 50.0 | | | | | — | | | Federal Home Loan Bank Discount Notes | | 0.035%-0.066% | | | | 1/17/2014 | | | | | 50.0 | | | | | — | |
| | 14.0 | | | | | — | | | Federal Home Loan Bank Discount Notes | | 0.051% | | | | 1/24/2014 | | | | | 14.0 | | | | | — | |
| | 14.1 | | | | | — | | | Federal Home Loan Bank Discount Notes | | 0.086%-0.096% | | | | 2/21/2014 | | | | | 14.1 | | | | | — | |
| | 14.5 | | | | | — | | | Federal Home Loan Bank Discount Notes | | 0.071%-0.076% | | | | 3/7/2014 | | | | | 14.5 | | | | | — | |
| | 19.5 | | | | | — | | | Federal Home Loan Bank Discount Notes | | 0.076% | | | | 3/12/2014 | | | | | 19.5 | | | | | — | |
| | 50.0 | | | | | — | | | Federal Home Loan Bank Discount Notes | | 0.066%-0.106% | | | | 3/21/2014 | | | | | 50.0 | | | | | — | |
| | 43.2 | | | | | — | | | Federal Home Loan Bank Discount Notes | | 0.081% | | | | 3/26/2014 | | | | | 43.2 | | | | | — | |
| | 50.0 | | | | | — | | | Federal Home Loan Bank Discount Notes | | 0.071% | | | | 3/28/2014 | | | | | 50.0 | | | | | — | |
| | 23.8 | | | | | — | | | Federal Home Loan Bank Discount Notes | | 0.087% | | | | 4/2/2014 | | | | | 23.8 | | | | | — | |
| | 100.0 | | | | | — | | | Federal Home Loan Bank Discount Notes | | 0.112% | | | | 4/9/2014 | | | | | 100.0 | | | | | — | |
| | 31.0 | | | | | — | | | Federal Home Loan Bank Discount Notes | | 0.091% | | | | 4/16/2014 | | | | | 31.0 | | | | | — | |
| | 10.3 | | | | | — | | | Federal Home Loan Bank Discount Notes | | 0.096% | | | | 4/23/2014 | | | | | 10.2 | | | | | — | |
| | 13.8 | | | | | — | | | Federal Home Loan Bank Discount Notes | | 0.101% | | | | 4/25/2014 | | | | | 13.8 | | | | | — | |
| | 46.0 | | | | | — | | | Federal Home Loan Bank Discount Notes | | 0.107%-0.122% | | | | 5/1/2014 | | | | | 46.0 | | | | | — | |
| | 25.0 | | | | | — | | | Federal Home Loan Bank Discount Notes | | 0.101% | | | | 5/2/2014 | | | | | 25.0 | | | | | — | |
| | 5.0 | | | | | — | | | Federal Home Loan Bank Discount Notes | | 0.112% | | | | 5/9/2014 | | | | | 5.0 | | | | | — | |
| | 16.0 | | | | | — | | | Federal Home Loan Bank Discount Notes | | 0.112% | | | | 5/14/2014 | | | | | 16.0 | | | | | — | |
| | 20.0 | | | | | — | | | Federal Home Loan Bank Discount Notes | | 0.122% | | | | 5/16/2014 | | | | | 20.0 | | | | | — | |
| | 55.1 | | | | | — | | | Federal Home Loan Bank Discount Notes | | 0.122%-0.127% | | | | 5/28/2014 | | | | | 55.1 | | | | | — | |
| | 20.0 | | | | | — | | | Federal Home Loan Bank Discount Notes | | 0.137% | | | | 6/25/2014 | | | | | 20.0 | | | | | — | |
| | 3.0 | | | | | — | | | Federal Home Loan Bank Discount Notes | | 0.122% | | | | 7/7/2014 | | | | | 3.0 | | | | | — | |
| | — | | | | | 22.3 | | | Freddie Mac Discount Notes | | 0.178% | | | | 1/3/2013 | | | | | — | | | | | 22.3 | |
| | — | | | | | 17.1 | | | Freddie Mac Discount Notes | | 0.173% | | | | 1/7/2013 | | | | | — | | | | | 17.1 | |
| | — | | | | | 37.6 | | | Freddie Mac Discount Notes | | 0.152% | | | | 1/14/2013 | | | | | — | | | | | 37.6 | |
| | — | | | | | 74.0 | | | Freddie Mac Discount Notes | | 0.142% | | | | 1/22/2013 | | | | | — | | | | | 74.0 | |
| | — | | | | | 50.0 | | | Freddie Mac Discount Notes | | 0.132% | | | | 2/11/2013 | | | | | — | | | | | 50.0 | |
| | — | | | | | 44.4 | | | Freddie Mac Discount Notes | | 0.117%-0.122% | | | | 2/19/2013 | | | | | — | | | | | 44.4 | |
| | — | | | | | 44.0 | | | Freddie Mac Discount Notes | | 0.127% | | | | 2/25/2013 | | | | | — | | | | | 44.0 | |
| | — | | | | | 14.0 | | | Freddie Mac Discount Notes | | 0.127% | | | | 2/27/2013 | | | | | — | | | | | 14.0 | |
| | — | | | | | 50.0 | | | Freddie Mac Discount Notes | | 0.152% | | | | 3/12/2013 | | | | | — | | | | | 50.0 | |
| | — | | | | | 19.9 | | | Freddie Mac Discount Notes | | 0.132% | | | | 3/18/2013 | | | | | — | | | | | 19.9 | |
| | — | | | | | 25.0 | | | Freddie Mac Discount Notes | | 0.137% | | | | 4/1/2013 | | | | | — | | | | | 25.0 | |
| | — | | | | | 25.1 | | | Freddie Mac Discount Notes | | 0.132% | | | | 4/3/2013 | | | | | — | | | | | 25.0 | |
| | — | | | | | 50.0 | | | Freddie Mac Discount Notes | | 0.152% | | | | 4/17/2013 | | | | | — | | | | | 50.0 | |
| | 40.0 | | | | | — | | | Freddie Mac Discount Notes | | 0.061% | | | | 1/6/2014 | | | | | 40.0 | | | | | — | |
| | 25.1 | | | | | — | | | Freddie Mac Discount Notes | | 0.046%-0.086% | | | | 1/13/2014 | | | | | 25.1 | | | | | — | |
| | 32.9 | | | | | — | | | Freddie Mac Discount Notes | | 0.046% | | | | 1/21/2014 | | | | | 32.9 | | | | | — | |
| | 51.2 | | | | | — | | | Freddie Mac Discount Notes | | 0.035%-0.051% | | | | 1/22/2014 | | | | | 51.2 | | | | | — | |
| | 13.2 | | | | | — | | | Freddie Mac Discount Notes | | 0.147% | | | | 1/23/2014 | | | | | 13.2 | | | | | — | |
| | 26.0 | | | | | — | | | Freddie Mac Discount Notes | | 0.058%-0.127% | | | | 2/4/2014 | | | | | 26.0 | | | | | — | |
| | 11.3 | | | | | — | | | Freddie Mac Discount Notes | | 0.086% | | | | 2/14/2014 | | | | | 11.3 | | | | | — | |
| | 62.8 | | | | | — | | | Freddie Mac Discount Notes | | 0.061%-0.066% | | | | 3/10/2014 | | | | | 62.7 | | | | | — | |
| | 24.5 | | | | | — | | | Freddie Mac Discount Notes | | 0.086% | | | | 3/11/2014 | | | | | 24.4 | | | | | — | |
| | 30.0 | | | | | — | | | Freddie Mac Discount Notes | | 0.081% | | | | 3/17/2014 | | | | | 30.0 | | | | | — | |
| | 33.0 | | | | | — | | | Freddie Mac Discount Notes | | 0.064% | | | | 3/24/2014 | | | | | 33.0 | | | | | — | |
| | 15.0 | | | | | — | | | Freddie Mac Discount Notes | | 0.061% | | | | 4/4/2014 | | | | | 15.0 | | | | | — | |
96
TIAA REAL ESTATE ACCOUNT
CONSOLIDATED STATEMENTS OF INVESTMENTS
December 31, 2013 and December 31, 2012
(Dollar values shown in millions)
| | | | | | | | | | | | |
Principal | | Issuer | | Yield(4) | | Maturity
Date | | Fair Value |
2013 | | 2012 | | 2013 | | 2012 |
| | 33.0 | | | | | — | | | Freddie Mac Discount Notes | | 0.091% | | | | 4/7/2014 | | | | $ | | 33.0 | | | | $ | | — | |
| | 30.0 | | | | | — | | | Freddie Mac Discount Notes | | 0.106% | | | | 4/14/2014 | | | | | 30.0 | | | | | — | |
| | 32.9 | | | | | — | | | Freddie Mac Discount Notes | | 0.096%-0.101% | | | | 4/21/2014 | | | | | 32.9 | | | | | — | |
| | 42.5 | | | | | — | | | Freddie Mac Discount Notes | | 0.096%-0.112% | | | | 4/24/2014 | | | | | 42.5 | | | | | — | |
| | 6.0 | | | | | — | | | Freddie Mac Discount Notes | | 0.101% | | | | 4/28/2014 | | | | | 6.0 | | | | | — | |
| | 12.8 | | | | | — | | | Freddie Mac Discount Notes | | 0.096% | | | | 5/1/2014 | | | | | 12.8 | | | | | — | |
| | 25.0 | | | | | — | | | Freddie Mac Discount Notes | | 0.112% | | | | 5/2/2014 | | | | | 25.0 | | | | | — | |
| | 50.7 | | | | | — | | | Freddie Mac Discount Notes | | 0.091%-0.101% | | | | 5/6/2014 | | | | | 50.6 | | | | | — | |
| | 21.2 | | | | | — | | | Freddie Mac Discount Notes | | 0.107% | | | | 5/12/2014 | | | | | 21.1 | | | | | — | |
| | 27.3 | | | | | — | | | Freddie Mac Discount Notes | | 0.101%-0.122% | | | | 5/21/2014 | | | | | 27.2 | | | | | — | |
| | 19.6 | | | | | — | | | Freddie Mac Discount Notes | | 0.101% | | | | 6/4/2014 | | | | | 19.6 | | | | | — | |
| | 18.5 | | | | | — | | | Freddie Mac Discount Notes | | 0.101% | | | | 6/5/2014 | | | | | 18.5 | | | | | — | |
| | 6.0 | | | | | — | | | Freddie Mac Discount Notes | | 0.127% | | | | 6/9/2014 | | | | | 6.0 | | | | | — | |
| | 18.8 | | | | | — | | | Freddie Mac Discount Notes | | 0.131% | | | | 6/16/2014 | | | | | 18.7 | | | | | — | |
| | 15.9 | | | | | — | | | Freddie Mac Discount Notes | | 0.117% | | | | 7/1/2014 | | | | | 15.9 | | | | | — | |
| | 7.1 | | | | | — | | | Freddie Mac Discount Notes | | 0.132% | | | | 7/11/2014 | | | | | 7.1 | | | | | — | |
| | 25.0 | | | | | — | | | Freddie Mac Discount Notes | | 0.134% | | | | 8/1/2014 | | | | | 25.0 | | | | | — | |
| | 7.3 | | | | | — | | | Freddie Mac Discount Notes | | 0.132% | | | | 9/3/2014 | | | | | 7.3 | | | | | — | |
| | | | | | | | | | | | | |
TOTAL GOVERNMENT AGENCY NOTES | | | | | | | | |
(Cost $1,989.0 and $1,379.4) | | | | | | | $ | | 1,989.1 | | | | $ | | 1,379.6 | |
| | | | | | | | | | | | | |
UNITED STATES TREASURY SECURITIES—5.9% and 7.0% | | | | | | |
| $ | | — | | | | $ | | 50.0 | | | United States Treasury Bills | | 0.074%-0.103% | | | | 1/10/2013 | | | | $ | | — | | | | $ | | 50.0 | |
| | — | | | | | 48.0 | | | United States Treasury Bills | | 0.084%-0.132% | | | | 1/17/2013 | | | | | — | | | | | 48.0 | |
| | — | | | | | 1.5 | | | United States Treasury Bills | | 0.135% | | | | 1/31/2013 | | | | | — | | | | | 1.5 | |
| | — | | | | | 97.5 | | | United States Treasury Bills | | 0.122%-0.153% | | | | 2/7/2013 | | | | | — | | | | | 97.5 | |
| | — | | | | | 50.0 | | | United States Treasury Bills | | 0.104% | | | | 2/21/2013 | | | | | — | | | | | 50.0 | |
| | — | | | | | 30.7 | | | United States Treasury Bills | | 0.128% | | | | 3/7/2013 | | | | | — | | | | | 30.7 | |
| | — | | | | | 39.1 | | | United States Treasury Bills | | 0.086%-0.135% | | | | 3/14/2013 | | | | | — | | | | | 39.1 | |
| | — | | | | | 51.0 | | | United States Treasury Bills | | 0.050%-0.143% | | | | 3/21/2013 | | | | | — | | | | | 51.0 | |
| | — | | | | | 50.0 | | | United States Treasury Bills | | 0.144% | | | | 3/28/2013 | | | | | — | | | | | 50.0 | |
| | — | | | | | 2.0 | | | United States Treasury Bills | | 0.070%-0.106% | | | | 4/4/2013 | | | | | — | | | | | 2.0 | |
| | — | | | | | 50.0 | | | United States Treasury Bills | | 0.122% | | | | 4/11/2013 | | | | | — | | | | | 50.0 | |
| | — | | | | | 30.0 | | | United States Treasury Bills | | 0.112% | | | | 4/18/2013 | | | | | — | | | | | 30.0 | |
| | — | | | | | 50.0 | | | United States Treasury Bills | | 0.072%-0.116% | | | | 4/25/2013 | | | | | — | | | | | 50.0 | |
| | — | | | | | 16.5 | | | United States Treasury Bills | | 0.061%-0.080% | | | | 5/2/2013 | | | | | — | | | | | 16.5 | |
| | — | | | | | 22.0 | | | United States Treasury Bills | | 0.091% | | | | 5/16/2013 | | | | | — | | | | | 22.0 | |
| | — | | | | | 13.0 | | | United States Treasury Bills | | 0.107%-0.135% | | | | 6/6/2013 | | | | | — | | | | | 13.0 | |
| | — | | | | | 20.5 | | | United States Treasury Bills | | 0.115% | | | | 6/20/2013 | | | | | — | | | | | 20.5 | |
| | 17.0 | | | | | — | | | United States Treasury Bills | | 0.052% | | | | 1/2/2014 | | | | | 17.0 | | | | | — | |
| | 26.6 | | | | | — | | | United States Treasury Bills | | 0.031%-0.069% | | | | 1/9/2014 | | | | | 26.6 | | | | | — | |
| | 30.0 | | | | | — | | | United States Treasury Bills | | 0.046%-0.048% | | | | 1/16/2014 | | | | | 30.0 | | | | | — | |
| | 4.0 | | | | | — | | | United States Treasury Bills | | 0.035% | | | | 1/23/2014 | | | | | 4.0 | | | | | — | |
| | 30.0 | | | | | — | | | United States Treasury Bills | | 0.071% | | | | 1/30/2014 | | | | | 30.0 | | | | | — | |
| | 17.0 | | | | | — | | | United States Treasury Bills | | 0.071% | | | | 3/6/2014 | | | | | 17.0 | | | | | — | |
| | 59.0 | | | | | — | | | United States Treasury Bills | | 0.054%-0.061% | | | | 3/13/2014 | | | | | 59.0 | | | | | — | |
| | 50.0 | | | | | — | | | United States Treasury Bills | | 0.030%-0.043% | | | | 3/20/2014 | | | | | 50.0 | | | | | — | |
97
TIAA REAL ESTATE ACCOUNT
CONSOLIDATED STATEMENTS OF INVESTMENTS
December 31, 2013 and December 31, 2012
(Dollar values shown in millions)
| | | | | | | | | | | | |
Principal | | Issuer | | Yield(4) | | Maturity
Date | | Fair Value |
2013 | | 2012 | | 2013 | | 2012 |
| $ | | 4.0 | | | | $ | | — | | | United States Treasury Bills | | 0.068% | | | | 4/3/2014 | | | | $ | | 4.0 | | | | $ | | — | |
| | 50.0 | | | | | — | | | United States Treasury Bills | | 0.079%-0.089% | | | | 6/26/2014 | | | | | 50.0 | | | | | — | |
| | 206.0 | | | | | — | | | United States Treasury Bills | | 0.102%-0.108% | | | | 7/24/2014 | | | | | 205.9 | | | | | — | |
| | 49.3 | | | | | — | | | United States Treasury Bills | | 0.091%-0.097% | | | | 8/21/2014 | | | | | 49.2 | | | | | — | |
| | 50.0 | | | | | — | | | United States Treasury Bills | | 0.093% | | | | 9/18/2014 | | | | | 50.0 | | | | | — | |
| | 6.4 | | | | | — | | | United States Treasury Bills | | 0.107%-0.117% | | | | 11/13/2014 | | | | | 6.4 | | | | | — | |
| | 25.0 | | | | | — | | | United States Treasury Bills | | 0.135% | | | | 12/11/2014 | | | | | 25.0 | | | | | — | |
| | — | | | | | 50.0 | | | United States Treasury Notes | | 0.162% | | | | 1/15/2013 | | | | | — | | | | | 50.0 | |
| | — | | | | | 58.4 | | | United States Treasury Notes | | 0.172%-0.174% | | | | 1/31/2013 | | | | | — | | | | | 58.4 | |
| | — | | | | | 44.7 | | | United States Treasury Notes | | 0.163% | | | | 2/15/2013 | | | | | — | | | | | 44.8 | |
| | — | | | | | 20.6 | | | United States Treasury Notes | | 0.198% | | | | 2/28/2013 | | | | | — | | | | | 20.6 | |
| | — | | | | | 39.4 | | | United States Treasury Notes | | 0.201% | | | | 3/31/2013 | | | | | — | | | | | 39.4 | |
| | — | | | | | 50.0 | | | United States Treasury Notes | | 0.161% | | | | 4/15/2013 | | | | | — | | | | | 50.3 | |
| | — | | | | | 28.4 | | | United States Treasury Notes | | 0.174% | | | | 4/30/2013 | | | | | — | | | | | 28.4 | |
| | — | | | | | 52.8 | | | United States Treasury Notes | | 0.169%-0.174% | | | | 5/15/2013 | | | | | — | | | | | 53.0 | |
| | — | | | | | 30.0 | | | United States Treasury Notes | | 0.201% | | | | 5/31/2013 | | | | | — | | | | | 30.1 | |
| | — | | | | | 50.0 | | | United States Treasury Notes | | 0.177% | | | | 7/15/2013 | | | | | — | | | | | 50.2 | |
| | — | | | | | 50.0 | | | United States Treasury Notes | | 0.187% | | | | 7/31/2013 | | | | | — | | | | | 50.1 | |
| | — | | | | | 50.0 | | | United States Treasury Notes | | 0.194% | | | | 8/15/2013 | | | | | — | | | | | 50.2 | |
| | — | | | | | 39.3 | | | United States Treasury Notes | | 0.199% | | | | 9/30/2013 | | | | | — | | | | | 39.3 | |
| | — | | | | | 3.5 | | | United States Treasury Notes | | 0.035%-0.206% | | | | 10/15/2013 | | | | | — | | | | | 3.5 | |
| | 56.4 | | | | | — | | | United States Treasury Notes | | 0.055%-0.113% | | | | 1/31/2014 | | | | | 56.4 | | | | | — | |
| | 17.7 | | | | | — | | | United States Treasury Notes | | 0.052%-0.152% | | | | 3/31/2014 | | | | | 17.7 | | | | | — | |
| | 25.0 | | | | | — | | | United States Treasury Notes | | 0.053% | | | | 4/15/2014 | | | | | 25.1 | | | | | — | |
| | 77.0 | | | | | — | | | United States Treasury Notes | | 0.097%-0.150% | | | | 4/30/2014 | | | | | 77.0 | | | | | — | |
| | 24.9 | | | | | — | | | United States Treasury Notes | | 0.082%-0.123% | | | | 5/15/2014 | | | | | 24.9 | | | | | — | |
| | 100.0 | | | | | — | | | United States Treasury Notes | | 0.076%-0.136% | | | | 6/30/2014 | | | | | 100.1 | | | | | — | |
| | 100.0 | | | | | — | | | United States Treasury Notes | | 0.114%-0.137% | | | | 7/15/2014 | | | | | 100.3 | | | | | — | |
| | 54.8 | | | | | — | | | United States Treasury Notes | | 0.119%-0.137% | | | | 7/31/2014 | | | | | 54.8 | | | | | — | |
| | 50.0 | | | | | — | | | United States Treasury Notes | | 0.144%-0.159% | | | | 8/15/2014 | | | | | 50.1 | | | | | — | |
| | | | | | | | | | | | | |
TOTAL UNITED STATES TREASURY SECURITIES | | | | | | |
(Cost $1,130.3 and $1,189.9) | | | | | | | $ | | 1,130.5 | | | | $ | | 1,190.1 | |
| | | | | | | | | | | | | |
TOTAL OTHER MARKETABLE SECURITIES | | | | | | |
(Cost $3,119.3 and $2,569.3) | | | | | | | $ | | 3,119.6 | | | | $ | | 2,569.7 | |
| | | | | | | | | | | | | |
TOTAL MARKETABLE SECURITIES | | | | | | |
(Cost $4,503.6 and $3,745.0) | | | | | | | $ | | 4,618.9 | | | | $ | | 3,902.0 | |
| | | | | | | | | | | | | |
TOTAL INVESTMENTS | | | | | | |
(Cost $17,607.8 and $16,842.4) | | | | | | | $ | | 19,109.6 | | | | $ | | 17,087.9 | |
| | | | | | | | | | | | | |
|
(1) | | | | The investment has a mortgage loan payable outstanding, as indicated in Note 9. |
|
(2) | | | | The fair value reflects the Account’s interest in the joint venture and is net of debt. |
|
(3) | | | | Properties within this investment are located throughout the United States. |
|
(4) | | | | Yield represents the annualized yield. |
|
(5) | | | | The fair value reflects the final settlement due to the Account. The property investment held within the joint venture was sold during the quarter ended September 30, 2012. |
|
(6) | | | | The fair value reflects the final settlement due to the Account. The property investment held within the joint venture was sold during the quarter ended December 31, 2012. |
|
(7) | | | | Investment was formerly named The Newbry. |
|
(8) | | | | The joint venture was dissolved during the quarter ended December 31, 2013. |
98
REPORT OF INDEPENDENT REGISTERED PUBLIC ACCOUNTING FIRM
To the Participants of the TIAA Real Estate Account and the Board of Trustees of Teachers Insurance and Annuity Association of America:
In our opinion, the accompanying consolidated statements of assets and liabilities, including the consolidated statements of investments, and the related consolidated statements of operations, of changes in net assets and of cash flows, present fairly, in all material respects, the financial position of the TIAA Real Estate Account and its subsidiaries (the “Account”) at December 31, 2013 and 2012, the results of their operations, the changes in their net assets and their cash flows for each of the three years in the period ended December 31, 2013 in conformity with accounting principles generally accepted in the United States of America. These financial statements are the responsibility of the Account’s management. Our responsibility is to express an opinion on these financial statements based on our audits. We conducted our audits of these financial statements in accordance with the standards of the Public Company Accounting Oversight Board (United States). Those standards require that we plan and perform the audit to obtain reasonable assurance about whether the financial statements are free of material misstatement. An audit includes examining, on a test basis, evidence supporting the amounts and disclosures in the financial statements, assessing the accounting principles used and significant estimates made by management, and evaluating the overall financial statement presentation. We believe that our audits provide a reasonable basis for our opinion.
/s/ PricewaterhouseCoopers LLP
Charlotte, North Carolina
March 13, 2014
99
ADDITIONAL INFORMATION
ITEM 9. CHANGES IN AND DISAGREEMENTS WITH ACCOUNTANTS ON ACCOUNTING AND FINANCIAL DISCLOSURE.
Not applicable.
ITEM 9A. CONTROLS AND PROCEDURES.
(a) The registrant maintains a system of disclosure controls and procedures that are designed to provide reasonable assurance that information required to be disclosed in the registrant’s reports under the Securities Exchange Act of 1934, as amended (the “Exchange Act”), is recorded, processed, summarized and reported within the time periods specified in the SEC’s rules and forms, and that such information is accumulated and communicated to management, including the registrant’s Principal Executive Officer (“PEO”) and the Principal Financial Officer (“PFO”), as appropriate, to allow timely decisions regarding required disclosure.
Under the supervision and participation of the registrant’s management, including the registrant’s PEO and PFO, the registrant conducted an evaluation of the effectiveness of the registrant’s disclosure controls and procedures as defined in Rule 13a-15(e) under the Exchange Act as of December 31, 2013. Based upon management’s review, the PEO and the PFO concluded that the registrant’s disclosure controls and procedures were effective as of December 31, 2013.
(b) Management’s Report on Internal Control over Financial Reporting. Management is responsible for establishing and maintaining adequate internal control over financial reporting for the Account. The Account’s internal control over financial reporting is a process designed under the supervision of the Account’s PEO and PFO to provide reasonable assurance regarding the reliability of financial reporting and the preparation of the Account’s consolidated financial statements for external purposes in accordance with U.S. generally accepted accounting principles.
Because of its inherent limitations, internal control over financial reporting may not prevent or detect misstatements. Also, projections of any evaluation of effectiveness to future periods are subject to the risk that controls may become inadequate because of changes in conditions, or that the degree of compliance with the policies or procedures may deteriorate.
Management has made a comprehensive review, evaluation, and assessment of the Account’s internal control over financial reporting as of December 31, 2013. In making its assessment of internal control over financial reporting, management used the criteria issued by the Committee of Sponsoring Organizations of the Treadway Commission inInternal Control—Integrated Framework. Based on this assessment, management has concluded that as of December 31, 2013, the Account’s internal control over financial reporting was effective to provide reasonable assurance regarding the reliability of financial reporting and the preparation of consolidated financial statements for external purposes in accordance with U.S. generally accepted accounting principles.
This annual report does not include an attestation report of the registrant’s independent registered public accounting firm regarding internal control over financial reporting. Management’s report was not subject to attestation by the Registrant’s independent registered public accounting firm pursuant to the rules of the U.S. Securities and Exchange Commission that permit the company to provide only management’s report in this annual report.
(c) Changes in internal control over financial reporting. There have been no changes in the registrant’s internal control over financial reporting that occurred during the registrant’s last fiscal quarter that materially affected, or are reasonably likely to materially affect, the registrant’s internal control over financial reporting.
ITEM 9B. OTHER INFORMATION
Not applicable.
100
PART III
ITEMS 10 AND 11. DIRECTORS, EXECUTIVE OFFICERS, AND CORPORATE GOVERNANCE OF THE REGISTRANT; EXECUTIVE COMPENSATION.
The TIAA Real Estate Account has no officers or directors and no TIAA trustee or executive officer receives compensation from the Account. The Trustees and certain principal executive officers of TIAA as of March 1, 2014, their dates of birth, and their principal occupations during at least the last five years, are as follows:
Trustees
Ronald L. Thompson,6/17/49
Former Chairman and Chief Executive Officer, Midwest Stamping and Manufacturing Company from 1993 through 2005. Lead Director, Chrysler Group, LLC and Director, Washington University in St. Louis. Member, Plymouth Ventures Partnership II Advisory Board.
Jeffrey R. Brown,2/16/68
William G. Karnes Professor of Finance and Director of the Center for Business and Public Policy, University of Illinois at Urbana-Champaign. Research Associate of the National Bureau of Economic Research (NBER) and Associate Director of the NBER Retirement Research Center. Manager, LLB Partners, LLC. Former member of the Social Security Advisory Board from 2006 to 2008.
Robert C. Clark,2/26/44
Harvard University Distinguished Service Professor and Austin Wakeman Scott Professor of Law, Harvard Law School, Harvard University. Formerly Dean and Royall Professor of Law, Harvard Law School from 1989 to 2003. Director of the Hodson Trust, Time Warner, Inc. and Omnicom Group.
Lisa W. Hess,8/8/55
President and Managing Partner, Sky Top Capital. Former Chief Investment Officer of Loews Corporation from 2002 to 2008. Founding partner of Zesiger Capital Group. Director of Radian Group, Inc. and Covariance Capital Management, Inc. (“Covariance”). Trustee of the Pomfret School and the Richard W. Wolfson Family Foundation.
Edward M. Hundert, M.D.,10/1/56
Senior lecturer in Medical Ethics and Director of the Center for Teaching and Learning, Harvard Medical School. Independent consultant, Huron Consulting Group. President, Case Western Reserve University from 2002 to 2006. Formerly, Dean, 2000 to 2002, University of Rochester School of Medicine and Dentistry, Professor of Medical Humanities and Psychiatry, 1997 to 2002. Scientific Advisory Board Member, Massachusetts General Hospital Center for Law, Brain and Behavior.
Lawrence H. Linden,2/19/47
Retired Managing Director and former General Partner at Goldman Sachs, Inc., retiring in 2008. After joining Goldman Sachs in 1992, served at various times the Head of Technology, Head of Operations, and Co-Chairman of the Global Control and Compliance Committee. Founding Trustee of the Linden Trust for Conservation, Member of the Board of Directors of the World Wildlife Fund and co-founder of, and senior advisor to, the Redstone Strategy Group. Strategic Advisory Board Member, New World Capital Group.
Maureen O’Hara,6/13/53
R.W. Purcell Professor of Finance at Johnson Graduate School of Management, Cornell University, where she has taught since 1979. Chair of the board of Investment Technology Group, Inc. since 2007, and member of the board since 2003. Director of New Star Financial, Inc.
Donald K. Peterson,8/13/49
Former Chairman and Chief Executive Officer, Avaya Inc. from 2002 to 2006 and President and Chief Executive Officer from 2000 to 2001. Formerly, Executive Vice President and Chief Financial Officer, Lucent Technologies from 1996 to 2000. Member and former chairman of the board of Worcester Polytechnic Institute and trustee of the Committee for Economic Development. Director of Sanford C. Bernstein Fund Inc.
101
Sidney A. Ribeau,12/3/47
President Emeritus, Howard University since 2014. President, Howard University, 2008 to 2013. President, Bowling Green State University, 1995 to 2008. Director, Worthington Industries.
Dorothy K. Robinson,2/18/51
Vice President and General Counsel, Yale University since 1995. Formerly General Counsel, Yale University, 1986 to 1995. Trustee, Newark Public Radio Inc., Director, Yale Southern Observatory, Inc., Youth Rights Media, Inc. and Friends of New Haven Legal Assistance.
David L. Shedlarz,4/17/48
Former Vice Chairman of Pfizer Inc. from 2006 to 2007, Executive Vice President from 1999 to 2005 and Chief Financial Officer of Pfizer from 1995 to 2005. Director, Pitney Bowes Inc. and the Hershey Corporation.
Marta Tienda,8/10/50
Maurice P. During ’22 Professor in Demographic Studies and Professor of Sociology and Public Affairs, Princeton University, since 1997. Visiting Research Scholar at the New York University Center for Advanced Research in Social Sciences, 2010 to 2011. Director, Office of Population Research, Princeton University, 1998 to 2002. Commissioner, President’s Advisory Commission on Educational Excellence for Hispanics. Trustee, Sloan Foundation and Jacobs Foundation. Member of Visiting Committee, Harvard University Kennedy School of Government. Member of Diversity Advisory Committee, Brown University. Director, Consortium of Social Science Associations. Member of Advisory Committee, American Education Research Association and the National Research Council’s Division of Behavioral and Social Sciences and Education.
Officer—Trustees
Roger W. Ferguson, Jr.,10/28/51
President and Chief Executive Officer of TIAA and CREF since April 2008. Formerly, Chairman of Swiss Re America Holding Corporation and Head of Financial Services and member of the Executive Committee, Swiss Re from 2006 to 2008; Vice Chairman and member of the Board of the U.S. Federal Reserve from 1999 to 2006 and a member of its Board of Governors from 1997 to 1999; and Partner and Associate, McKinsey & Company from 1984 to 1997. Currently a member of the advisory board of Brevan Howard Asset Management LLP and a director of Audax Health and International Flavors and Fragrances, Inc. Fellow of the American Academy of Arts & Sciences and member of its Commission on the Humanities and Social Sciences. Vice-chair of the Business—Higher Education Forum. Board member at the Institute for Advanced Study, Memorial Sloan-Kettering Cancer Center, and the Committee for Economic Development. Member of the Harvard University Visiting Committee for the Memorial Church, the Economic Club of New York, the Council on Foreign Relations, Prium, American Council of Life Insurers, Math for America, Partnership for NYC and the Group of Thirty.
Other TIAA Executive Officers
Robert G. Leary,3/20/61
Executive Vice President and President of Asset Management, TIAA; Executive Vice President of CREF and TIAA Separate Account VA-1; Principal Executive Officer and President of TIAA-CREF Funds and TIAA-CREF Life Funds; all since June 2013. Director, President & CEO of Teachers Advisors, Inc. since 2013. Manager, President & CEO of TIAA-CREF Investment Management, LLC since 2013. Director of TH RE Ltd since 2013. Director, President & CEO of Teachers Personal Investors Services, Inc. since 2013. Director of TIAA International Holdings 1 Ltd, TIAA International Holdings 2 Ltd, and TIAA International Holdings 3 Ltd since 2013. Director, President & CEO of TIAA-CREF Asset Management (“TCAM”) since 2013. Formerly, President and Chief Operating Officer of ING U.S. starting in April 2011, where he led all aspects of ING’s investment management, retirement, insurance and annuity businesses, as well as operations, information technology and marketing. Also served as chief executive officer of ING Insurance U.S. from January 2010 to April 2011 after joining ING in 2007 as chairman and chief executive officer of ING Investment Management, Americas. Previously was an executive vice president at AIG, helping to build investment solutions for the institutional investor community. Prior thereto was vice president at J.P. Morgan & Co., where he specialized in fixed income applications. Currently serves on the board of AmeriCares, a nonprofit, global health and disaster-relief organization.
102
Virginia M. Wilson,7/22/54
Executive Vice President and Chief Financial Officer, TIAA and CREF and Principal Accounting Officer of CREF since 2010. Manager, Executive Vice President and Chief Financial Officer of Redwood, LLC (“Redwood”) since 2010. Director, Executive Vice President and Chief Financial Officer of TCT Holdings, Inc. since 2010. Executive Vice President of TCAM since 2010. Served from 2006 to 2009 as Executive Vice President and Chief Financial Officer of Wyndham Worldwide Corporation, one of the world’s largest hospitality firms, following its 2006 spin-off from Cendant Corporation, a multinational holding company with operations in the real estate, travel, car rental, hospitality, mortgage banking and other service sectors. Served from 2003 to 2006 as Cendant’s Executive Vice President and Chief Accounting Officer. Corporate controller of MetLife, Inc. from 1999 to 2003 and was senior vice president and controller for the life insurance operations of Transamerica Corporation (which was acquired by AEGON NV in 1999) from 1995 to 1999. Prior to 1995, was an audit partner at Deloitte & Touche LLP. Currently a director of the Los Angeles Child Guidance Clinic and a trustee and vice chair for Catholic Charities in New York.
Ronald Pressman, 4/11/58
Executive Vice President and Chief Operating Officer of TIAA since 2012 and Executive Vice President of the TIAA-CREF Funds Complex since 2012. Director, of Covariance, TIAA-CREF Life Insurance Company (“TC Life”) and Kaspick & Company, LLC since 2012. Manager, Redwood since 2012. From 2007 to 2011, served as President and Chief Executive Officer of General Electric Capital Real Estate. Prior to 2007, served as president and CEO of General Electric Asset Management and Chairman, President and Chief Executive Officer of General Electric Employers Reinsurance Group. Currently a charter trustee of Hamilton College. Also serves as the Chairman of the National Board of A Better Chance and a director of Pathways to College. Currently serves as a director of Aspen Insurance Holdings Limited.
Edward D. Van Dolsen, 4/21/58
Executive Vice President, President of Retirement and Individual Services since 2011 of TIAA and Executive Vice President of CREF since 2008. Executive Vice President and President, Chief Operating Officer of TIAA and CREF from 2010 to 2011. Executive Vice President, Product Development and Management of TIAA from 2009 to 2010, Executive Vice President, Institutional Client Services from 2006 to 2009, and Executive Vice President, Product Management of TIAA from 2005 to 2006. Also served as Senior Vice President, Pension Products from 2003 to 2005. Director of Covariance since 2010. Director since 2007, Chairman and President since 2012 of TCT Holdings, Inc. Director 2007 to 2011 and Executive Vice President 2008 to 2010 of TCAM. Manager since 2006, President and CEO 2006 to 2010 of Redwood. Director of Tuition Financing 2008 to 2009 and Executive Vice President of T-C Life 2009 to 2010.
Portfolio Management Team
Margaret A. Brandwein,11/26/46
Managing Director and Portfolio Manager, TIAA Real Estate Account since 2004.
Thomas C. Garbutt,10/12/58
Senior Managing Director and Head of Global Real Estate, TIAA.
Philip J. McAndrews,12/13/58
Managing Director and Head of Global Real Estate, Americas, TIAA
Audit Committee Financial Expert
On February 13, 2014, the Board of Trustees of TIAA determined that each of Lisa W. Hess, Lawrence H. Linden, and Donald K. Peterson qualify as Audit Committee Financial Experts. Each such Trustee is independent (as that term is used in Item 7(d)(3)(iv) of Schedule 14A under the Securities Exchange Act of 1934) and has not accepted, directly or indirectly, any consulting, advisory or other compensatory fee from TIAA, other than in his or her capacity as Trustee.
Code of Ethics
The Board of Trustees of TIAA has adopted a code of ethics for senior financial officers, including its principal executive officer, principal financial officer, principal accounting officer, or controller, and persons
103
performing similar functions, in conformity with rules promulgated under the Sarbanes-Oxley Act of 2002. The code of ethics is filed as an exhibit to this annual report.
During the reporting period, there were no implicit or explicit waivers granted by the Registrant from any provision of the code of ethics.
ITEM 12. SECURITY OWNERSHIP OF CERTAIN BENEFICIAL OWNERS AND MANAGEMENT AND RELATED STOCKHOLDER MATTERS.
Not applicable.
ITEM 13. CERTAIN RELATIONSHIPS AND RELATED TRANSACTIONS, AND DIRECTOR INDEPENDENCE.
The TIAA general account plays a significant role in operating the Real Estate Account, including providing a liquidity guarantee, and investment advisory, administrative, and other services. In addition, Services, a wholly owned subsidiary of TIAA, provides distribution services for the Account.
Liquidity Guarantee. If the Account’s liquid assets and its cash flow from operating activities and participant transactions are insufficient to fund redemption requests, the TIAA general account has agreed to purchase liquidity units. TIAA thereby guarantees that a participant can redeem accumulation units at their net asset value next determined. For the year ended December 31, 2013, the Account expensed $30.5 million for this liquidity guarantee from TIAA through a daily deduction from the net assets of the Account. During 2012 and through the date of this annual report, the TIAA general account has not purchased any liquidity units. During the months of June, September, December 2012, and March 2013, the Account redeemed all outstanding liquidity units representing a total of $940.3 million and $325.4 million redeemed during 2012 and 2013, respectively.
Investment Advisory and Administration Services/Mortality and Expense Risks Borne by TIAA. Deductions are made each valuation day from the net assets of the Account for various services required to manage investments, administer the Account and distribute the contracts. These services are performed at cost by TIAA and Services. Deductions are also made each valuation day to cover mortality and expense risks borne by TIAA.
For the year ended December 31, 2013, the Account expensed $59.3 million for investment advisory services and $0.8 million for mortality and expense risks provided/borne by TIAA. For the same period, the Account expensed $54.5 million for administrative and distribution services provided by TIAA and Services.
ITEM 14. PRINCIPAL ACCOUNTANT FEES AND SERVICES.
PricewaterhouseCoopers LLP (“PwC”) performs independent audits of the registrant’s consolidated financial statements. To maintain auditor independence and avoid even the appearance of conflicts of interest, the registrant, as a policy, does not engage PwC for management advisory or consulting services.
Audit Fees. PwC’s fees for professional services rendered for the audits of the registrant’s annual consolidated financial statements for the years ended December 31, 2013 and 2012 and review of consolidated financial statements included in the registrant’s quarterly reports were $1,081,000 and $1,146,000, respectively.
Audit-Related Fees. The registrant had no audit-related services for the years ended December 31, 2013 and December 31, 2012.
Tax Fees. PwC had no tax fees with respect to registrant for the years ended December 31, 2013 and 2012.
All Other Fees. Other than as set forth above, there were no additional fees with respect to registrant.
Preapproval Policy. In June of 2003, the audit committee of TIAA’s Board of Trustees (“Audit Committee”) adopted a Preapproval Policy for External Audit Firm Services (the “Policy”), which applies to the registrant. The Policy describes the types of services that may be provided by the independent auditor to the registrant without impairing the auditor’s independence. Under the Policy, the Audit Committee is required to
104
preapprove services to be performed by the registrant’s independent auditor in order to ensure that such services do not impair the auditor’s independence.
The Policy requires the Audit Committee to: (i) appoint the independent auditor to perform the financial statement audit for the registrant and certain of its affiliates, including approving the terms of the engagement and (ii) preapprove the audit, audit-related and tax services to be provided by the independent auditor and the fees to be charged for provision of such services from year to year.
105
PART IV
ITEM 15. EXHIBITS AND FINANCIAL STATEMENT SCHEDULES
| | | | |
(1) | | (A) | | Distribution Agreement for the Contracts Funded by the TIAA Real Estate Account, dated as of January 1, 2008, by and among Teachers Insurance and Annuity Association of America, for itself and on behalf of the Account, and TIAA-CREF Individual & Institutional Services, LLC.4 |
(3) | | (A) | | Charter of TIAA.5 |
| | (B) | | Restated Bylaws of TIAA (as amended).6 |
(4) | | (A) | | Forms of RA, GRA, GSRA, SRA, IRA Real Estate Account Endorsements2, Keogh Contract,3 Retirement Select and Retirement Select Plus Contracts and Endorsements1 and Retirement Choice and Retirement Choice Plus Contracts.3 |
| | (B) | | Forms of Income-Paying Contracts2 |
| | (C) | | Form of Contract Endorsement for Internal Transfer Limitation7 |
| | (D) | | Form of Accumulation Contract8 |
(10) | | (A) | | Amended and Restated Independent Fiduciary Letter Agreement, dated as of November 23, 2011, between TIAA, on behalf of the Registrant, and Real Estate Research Corporation.9 |
| | (B) | | Custodian Agreement, dated as of March 3, 2008, by and between TIAA, on behalf of the Registrant, and State Street Bank and Trust Company, N.A.10 |
*(14) | | | | Code of Ethics of TIAA |
*(31) | | | | Rule 13(a)-15(e)/ Rule 13a-15(e)/15d-15(e) Certifications |
*(32) | | | | Section 1350 Certifications |
**(101) | | The following financial information from the Annual Report on Form 10-K for the periods ended December 31, 2013, formatted in XBRL (Extensible Business Reporting Language): (i) the Statements of Assets and Liabilities, (ii) the Statements of Operations, (iii) the Statements of Changes in Net Assets, (iv) the Statements of Cash Flows, and (v) the Notes to the Financial Statements |
|
* | | | | Filed herewith. |
|
** | | | | Furnished electronically herewith. |
|
(1) | | | | Previously filed and incorporated herein by reference to the Account’s Pre-Effective Amendment No. 1 to the Registration Statement on Form S-1 filed April 29, 2004 (File No. 333-113602). |
|
(2) | | | | Previously filed and incorporated herein by reference to the Account’s Post-Effective Amendment No. 2 to the Registration Statement on Form S-1 filed April 30, 1996 (File No. 33-92990). |
|
(3) | | | | Previously filed and incorporated herein by reference to the Account’s Post-Effective Amendment No. 1 to the Registration Statement on Form S-1 filed May 2, 2005 (File No. 333-121493). |
|
(4) | | | | Previously filed and incorporated herein by reference to the Account’s Registration Statement on Form S-1, filed with the Commission on March 15, 2013 (File No. 333-187309). |
|
(5) | | | | Previously filed and incorporated by reference to Exhibit 3(A) to the Account’s Quarterly Report on Form 10-Q for the quarter ended June 30, 2009 and filed with the Commission on August 13, 2009 (File No. 33-92990). |
|
(6) | | | | Previously filed and incorporated by reference to Exhibit 3(B) to the Account’s Quarterly Report on Form 10-Q for the quarter ended June 30, 2009 and filed with the Commission on August 13, 2009 (File No. 33-92990). |
|
(7) | | | | Previously filed and incorporated by reference to Exhibit 4(C) to the Account’s Quarterly Report on Form 10-Q for the quarter ended September 30, 2010 and filed with the Commission on November 12, 2010 (File No. 33-92990). |
|
(8) | | | | Previously filed and incorporated by reference to Exhibit 4(D) to the Account’s Pre-Effective Amendment No. 1 to the Registration Statement on Form S-1 filed April 27, 2011 (File No. 333-172900). |
|
(9) | | | | Previously filed and incorporated by reference to Exhibit 10.1 to the Account’s Current Report on Form 8-K, filed with the Commission on November 29, 2011 (File No. 33-92990). |
|
(10) | | | | Previously filed and incorporated herein by reference to Exhibit 10.(b) to the Annual Report on Form 10-K of the Account for the fiscal year ended December 31, 2012 and filed with the Commission on March 14, 2013 (File No. 33-92990). |
106
SIGNATURES
Pursuant to the requirements of the Securities Exchange Act of 1934, as amended, the registrant, TIAA Real Estate Account, has duly caused this Annual Report on Form 10-K to be signed on its behalf by the undersigned, thereunto duly authorized, in New York, New York, on the 13th day of March, 2014.
| | | | |
| | TIAA REAL ESTATE ACCOUNT |
| | By: | | TEACHERS INSURANCE AND
ANNUITY ASSOCIATION OF AMERICA |
March 13, 2014 | | | | /s/ Robert G. Leary |
| | | |
| | | | Robert G. Leary |
| | | | Executive Vice President and |
| | | | President, Asset Management |
Pursuant to the requirements of the Securities Exchange Act of 1934, as amended, this Report has been signed by the following trustees and officers of Teachers Insurance and Annuity Association of America, in the capacities and on the dates indicated.
Signature | | Title | | Date |
|
/s/ ROGER W. FERGUSON, JR.
| | President and Chief Executive Officer
and Trustee | | March 13, 2014 |
/s/ ROBERT G. LEARY
| | Executive Vice President and President,
Asset Management (Principal Executive Officer) | | March 13, 2014 |
/s/ VIRGINIA M. WILSON
| | Executive Vice President and Chief Financial
Officer (Principal Financial and Accounting Officer) | | March 13, 2014 |
/s/ RONALD L. THOMPSON
| | Chairman of the Board of Trustees | | March 13, 2014 |
/s/ JEFFREY R. BROWN
| | Trustee | | March 13, 2014 |
/s/ ROBERT C. CLARK
| | Trustee | | March 13, 2014 |
/s/ LISA W. HESS
| | Trustee | | March 13, 2014 |
/s/ EDWARD M. HUNDERT, M.D.
| | Trustee | | March 13, 2014 |
/s/ LAWRENCE H. LINDEN
| | Trustee | | March 13, 2014 |
/s/ MAUREEN O’HARA
| | Trustee | | March 13, 2014 |
/s/ DONALD K. PETERSON
| | Trustee | | March 13, 2014 |
/s/ SIDNEY A. RIBEAU
| | Trustee | | March 13, 2014 |
/S/ DOROTHY K. ROBINSON
| | Trustee | | March 13, 2014 |
/S/ DAVID L. SHEDLARZ
| | Trustee | | March 13, 2014 |
/S/ MARTA TIENDA
| | Trustee | | March 13, 2014 |
107
SUPPLEMENTAL INFORMATION TO BE FURNISHED WITH REPORTS FILED PURSUANT TO
SECTION 15(D) OF THE ACT BY REGISTRANTS WHICH HAVE NOT REGISTERED
SECURITIES PURSUANT TO SECTION 12 OF THE ACT
Because the Registrant has no voting securities, nor its own management or board of directors, no annual report or proxy materials will be sent to contract owners holding interests in the Account.
108