Exhibit 99.1
| TIAA Retirement Annuity Accounts | |
| | | | | |
| | | | | |
| | | | | |
| TIAA Real Estate Account |
| | | | | |
| | | | | |
| | | | | |
| Real Estate | | | | As of 3/31/2016 |
| | | | | |
| Portfolio Net Assets | Inception Date | Symbol | Estimated Annual Expenses1 2 | |
| $23.0 Billion | 10/02/1995 | QREARX | 0.87% | |
| | | | | |
Portfolio Strategies
This variable annuity account seeks favorable long-term returns primarily through rental income and appreciation of real estate and real estate-related investments owned by the Account. The Account will also invest in non-real estate-related publicly traded securities and short-term higher quality liquid investments that are easily converted to cash to enable the Account to meet participant redemption requests, purchase or improve properties or cover other expense needs. The Account intends to have between 75% and 85% of its net assets invested directly in real estate or real estate-related assets with the goal of producing favorable long-term returns. The Account’s principal strategy is to purchase direct ownership interests in income-producing real estate, primarily office, industrial, retail and multi-family residential properties. The Account may also make foreign real estate investments. Under the Account’s investment guidelines, investments in direct foreign real estate, together with foreign real estate-related securities and foreign non-real estate-related liquid investments may not comprise more than 25% of the Account’s net assets. The Account will invest the remaining portion of its assets (targeted between 15% and 25% of net assets) in publicly traded, liquid investments.
Learn More
For more information please contact:
800-842-2252
Weekdays,8 a.m. to 10 p.m. (ET),
Saturdays,9 a.m. to 6 p.m. (ET),
or visitTIAA.org
Performance
| | | Total Return | | | | Average Annual Total Return |
| | | 3 Months | | YTD | | 1 Year | | 3 Years | | 5 Years | | 10 Years | | Since
Inception |
| TIAA Real Estate Account | | 1.89% | | 1.89% | | 7.02% | | 10.00% | | 10.27% | | 4.09% | | 6.52% |
The returns quoted represent past performance, which is no guarantee of future results. Returns and the principal value of your investment will fluctuate. Current performance may be higher or lower than that shown, and you may have a gain or a loss when you redeem your accumulation units. For current performance information, including performance to the most recent month-end, please visit TIAA.org, or call 800-842-2252. Performance may reflect waivers or reimbursements of certain expenses. Absent these waivers or reimbursement arrangements, performance may be lower.
| 1 | The total annual expense deduction, which includes investment management, administration, and distribution expenses, mortality and expense risk charges, and the liquidity guarantee, is estimated each year based on projected expense and asset levels. Differences between actual expenses and the estimate are adjusted quarterly and are reflected in current investment results. Historically, adjustments have been small. |
| 2 | The Account’s total annual expense deduction appears in the Account’s prospectus, and may be different than that shown herein due to rounding. Please refer to the prospectus for further details. |
Hypothetical Growth of $10,000
| The chart illustrates the performance of a hypothetical $10,000 investment on March 31, 2006 and redeemed on March 31, 2016. | | 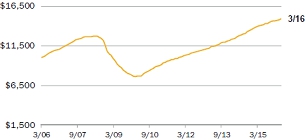 |
| | | |
| — TIAA Real Estate Account | $14,924 | |
| | | |
| | | |
| | | |
| | | |
| | | | |
The total returns are not adjusted to reflect sales charges, the effects of taxation or redemption fees, but are adjusted to reflect actual ongoing expenses, and assume reinvestment of dividends and capital gains, net of all recurring costs.
| Properties by Type | (As of 3/31/2016) | | Properties by Region | (As of 3/31/2016) |
| % of Real Estate Investments3 4 | | % of Real Estate Investments4 |
| Office | 44.9 | | East | 38.4 |
| Apartment | 22.2 | | West | 37.4 |
| Retail | 15.5 | | South | 22.8 |
| Industrial | 14.4 | | Midwest | 1.4 |
| Other | 3.0 | | | |
 | 3 | Other properties represents interest in Storage Portfolio investment and a fee interest encumbered by a ground lease real estate investment. |
| 4 | Wholly owned properties are represented at fair value and gross of any debt, while joint venture properties are represented at the net equity value. |
| | |
| | |
| | Please refer to the next page for important disclosure information. |
| | |
| TIAA Retirement Annuity Accounts | |
| TIAA Real Estate Account | |
| | |
| | |
| Real Estate | As of 3/31/2016 |
| Portfolio Composition | (As of 3/31/16) |
| Investments by Type | % of Net Assets |
| Real Estate Properties (Net Of Debt) | 56.3% |
| Short Term Investments | 19.6% |
| Real Estate Joint Venture And Limited Partnerships | 18.9% |
| Marketable Securities Real Estate Related | 4.7% |
| Loan Receivable | 0.4% |
| Other (Net Receivable/Liability) | 0.1% |
| Top 10 Holdings5 | (As of 3/31/16) |
| % of Total Investments6 |
| 1001 Pennsylvania Avenue | | 3.2% |
| The Florida Mall | | 2.9% |
| Colorado Center | | 2.3% |
| 99 High Street | | 2.1% |
| Fourth and Madison | | 2.0% |
| DDR Joint Venture | | 2.0% |
| 501 Boylston Street | | 1.9% |
| 425 Park Avenue | | 1.8% |
| Ontario Industrial Portfolio | | 1.7% |
| 780 Third Avenue | | 1.7% |
Market Recap
Steady job growth supports commercial real estate status quo
The Bureau of Labor Statistics reported that the U.S. economy added 628,000 jobs during first quarter 2016 as compared to 846,000 jobs during fourth quarter 2015. The stronger dollar, low oil prices, and weaker global economy weighed on the manufacturing, mining, and transportation sectors, which all shed jobs. All other major sectors expanded. Job growth averaged 209,000 during the quarter, which was in-line with average job growth over the past four years and more than enough to absorb growth in the labor force. The unemployment rate now stands at 5.0%.
Demand for office space is primarily driven by job growth in the finance and professional and business services sectors. During the first quarter, both sectors expanded. The financial services sector added 37,000 jobs for the second consecutive quarter while the professional and business services sector added 61,000 as compared to 199,000 previously. Despite favorable demand conditions, the national office vacancy rate ticked up to 13.2% from 13.1% during fourth quarter 2015 according to CB Richard Ellis Econometric Advisors (“CBRE-EA”). However, leasing is typically slow in the first quarter and fundamentals remain attractive as vacancy rates declined in 33 of the 63 markets tracked by CBRE-EA. CBRE-EA expects demand to outpace supply in 2016, contributing to a further decline in the national vacancy rate.
Industrial market conditions continued to benefit from growth in imports and consumer spending. CBRE-EA reported that the national industrial availability rate declined for the 24th consecutive quarter to 9.2% from 9.4% previously. Overall, availability rates declined in 36 of 59 markets tracked by CBRE-EA. However, construction has increased in response to historically low availability rates, and CBRE-EA expects industrial market conditions to improve only modestly in 2016 as new supply is delivered.
National apartment market conditions remained healthy with average vacancies of 4.7% as of first quarter 2016, the same as in first quarter 2015. Despite increased supply, 33 of the 62 markets tracked by CBRE-EA reported vacancy rate declines. To date, demand in most markets has been strong enough to absorb much of the new supply. CBRE-EA expects that conditions may begin to moderate in some markets due to the sizeable construction pipeline expected to deliver in the second half of the year.
Retail sales growth was modest to begin the year. Preliminary data from the U.S. Census Bureau indicate that retail sales excluding autos and auto parts were flat compared to fourth quarter 2015 but 2.3% above first quarter 2015 sales. Retail market conditions held their ground despite weak sales growth during the winter months and several retailer bankruptcies. The national retail availability rate remained at 11.2% in the first quarter of 2016, but has declined steadily from a peak of 13.3% in mid-2011.
Important Information |
| | |
| 5 | The top 10 holdings are subject to change and may not be representative of the Account’s current or future investments. The holdings listed only include the Account’s long-term investments. Money market instruments and/or futures contracts, if applicable, are excluded. The holdings do not include the Account’s entire investment portfolio and should not be considered a recommendation to buy or sell a particular security. |
| 6 | Fair Value as reported in the March 31, 2016 Consolidated Schedule of Investments. Investments owned 100% by the Account are reported based on fair value. Investments in joint ventures are reported at the net equity value on a fair value basis, and are presented at the Account’s ownership interest. |
| | |
| 1001 Pennsylvania Avenue is presented gross of debt. The value of the property less the fair value of leverage is $470.7 million.
The Florida Mall is held in a joint venture with Simon Property Group, L.P., in which the Account holds a 50% interest, and is presented net of debt. As of March 31, 2016, this debt had a fair value of $186.0 million. |
| Colorado Center is held in a joint venture with EOP Operating LP, in which the Account holds a 50% interest.
Fourth and Madison is presented gross of debt. The value of the property less the fair value of leverage is $299.3 million.
DDR Joint Venture, in which the Account holds an 85% interest, and consists of 25 retail properties located in 11 states and is presented net of debt. As of March 31, 2016, this debt had a fair value of $676.6 million.
780 Third Avenue is presented gross of debt. The value of the property less the fair value of leverage is $252.2 million. |
| | |
| Real estate investment portfolio turnover rate was 5.7% for the year ended 12/31/2015. Real estate investment portfolio turnover rate is calculated by dividing the lesser of purchases or sales of real estate property investments (including contributions to, or return of capital distributions received from, existing joint venture and limited partnership investments) by the average value of the portfolio of real estate investments held during the period. Marketable securities portfolio turnover rate was 10.0% for the year ended 12/31/2015. Marketable securities portfolio turnover rate is calculated by dividing the lesser of purchases or sales of securities, excluding securities having maturity dates at acquisition of one year or less, by the average value of the portfolio securities held during the period. |
Continued on next page…
| | |
| TIAA Retirement Annuity Accounts | |
| TIAA Real Estate Account | |
| | |
| | |
| Real Estate | As of 3/31/2016 |
Teachers Insurance and Annuity Association of America (TIAA), New York, NY, issues annuity contracts and certificates.
TIAA-CREF Individual & Institutional Services, LLC and Teachers Personal Investors Services, Inc., Members FINRA and SIPC, distribute securities products.
Investment, insurance and annuity products: are not FDIC insured, are not bank guaranteed, are not deposits, are not insured by any federal government agency, are not a condition to any banking service or activity and may lose value.
THIS MATERIAL MUST BE PRECEDED OR ACCOMPANIED BY A CURRENT PROSPECTUS FOR THE TIAA REAL ESTATE ACCOUNT. PLEASE CAREFULLY CONSIDER THE INVESTMENT OBJECTIVES, RISKS, CHARGES, AND EXPENSES BEFORE INVESTING AND CAREFULLY READ THE PROSPECTUS. ADDITIONAL COPIES OF THE PROSPECTUS CAN BE OBTAINED BY CALLING 877-518-9161.
A Note About Risks
In general, the value of the TIAA Real Estate Account will fluctuate based on the underlying value of the direct real estate or real estate-related securities in which it invests.
The risks associated with investing in the Real Estate Account include the risks associated with real estate ownership including among other things fluctuations in property values, higher expenses or lower income than expected, risks associated with borrowing and potential environmental problems and liability, as well as risks associated with participant flows and conflicts of interest. For a more complete discussion of these and other risks, please consult the prospectus.
©2016 Teachers Insurance and Annuity Association of America-College Retirement Equities Fund, 730 Third Avenue, New York, NY 10017
C30380