|
| | | | | | | | | | | | | | | | | | | | | | |
TIAA Real Estate Account |
| As of 12/31/18 |
| | | | | |
| |
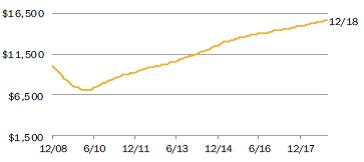
| Top 10 Holdings | As of 12/31/18 | | | Growth of $10,000 | 12/31/08-12/31/18 | | | |
| Fashion Show | 3.9 | % | | | nTIAA Real Estate Account |
| $15,613 |
| | | | |
| DDR | 3.7 | % | | | | | | | | | | |
| The Florida Mall | 2.9 | % | | | | | | | | | | |
| Simpson Housing Portfolio | 2.5 | % | | The total returns are not adjusted to reflect sales charges, the effects of taxation or redemption fees, but are adjusted to reflect actual ongoing expenses, and assume reinvestment of dividends and capital gains, net of all recurring costs.
| | | | |
| 1001 Pennsylvania Avenue | 2.5 | % | | | | | |
| Colorado Center | 1.9 | % | | | | | |
| Fourth and Madison | 1.8 | % | | | | | |
| 99 High Street | 1.6 | % | | | | | | |
| 425 Park Avenue | 1.5 | % | | | | | |
| Ontario Industrial Portfolio | 1.3 | % | | | | | |
| Total | 23.6 | % | | | | | |
| | | | | | | | | |
| | | | | | | | | |
| | | | | Sector Allocation | As of 12/31/18 | | | | | | |
| | | | | Fund | | | | | |
| | | | | Real Estate Properties (Net Of Debt) | 50.0 | % | | | | |
| | | | | Real Estate Joint Venture And Limited Partnerships | 25.3 | % | | | | |
| | | | | Short Term Investments | 15.8 | % | | | | |
| | | | | Marketable Securities Real Estate Related | 5.5 | % | | | | |
| | | | | Loans Receivable | 3.5 | % | | | | |
| | | | | Other (Net Receivable/Liability) | (0.1 | %) | | | | | |
| | | | | | | | | | |
| Real estate investment portfolio turnover rate was 11.8% for the year ended 12/31/2018. Real estate investment portfolio turnover rate is calculated by dividing the lesser of purchases or sales of real estate property investments (including contributions to, or return of capital distributions received from, existing joint venture and limited partnership investments) by the average value of the portfolio of real estate investments held during the period. Marketable securities portfolio turnover rate was 5.1% for the year ended 12/31/2018. Marketable securities portfolio turnover rate is calculated by dividing the lesser of purchases or sales of securities, excluding securities having maturity dates at acquisition of one year or less, by the average value of the portfolio securities held during the period. |
| | | | | | | | | | | | | | | | | | | | |
| The risks associated with investing in the TIAA Real Estate Account include the risks associated with real estate ownership including among other things fluctuations in property values, higher expenses or lower income than expected, risks associated with borrowing and potential environmental problems and liability, as well as risks associated with participant flows and conflicts of interest. For a more complete discussion of these and other risks, please consult the prospectus. |
| | | | | | | | | | | | | | | | | | | | |
| THIS MATERIAL MUST BE PRECEDED OR ACCOMPANIED BY A CURRENT PROSPECTUS FOR THE TIAA REAL ESTATE ACCOUNT. PLEASE CAREFULLY CONSIDER THE INVESTMENT OBJECTIVES, RISKS, CHARGES, AND EXPENSES BEFORE INVESTING AND CAREFULLY READ THE PROSPECTUS. ADDITIONAL COPIES OF THE PROSPECTUS CAN BE OBTAINED BY CALLING 877-518-9161. |
| | | | | | | | | | | | | | | | | | | | |
| Teachers Insurance and Annuity Association of America (TIAA), New York, NY, issues annuity contracts and certificates. |
| | | | | | | | | | | | | | | | | | | | |
| ©2018 Teachers Insurance and Annuity Association of America-College Retirement Equities Fund, | | | | | | | | | | |
| 730 Third Avenue, New York, NY 10017 | For Institutional Investor use only. Not for use with or distribution to the public. |
| | | | | | | | | | | | | | | | | | | | |