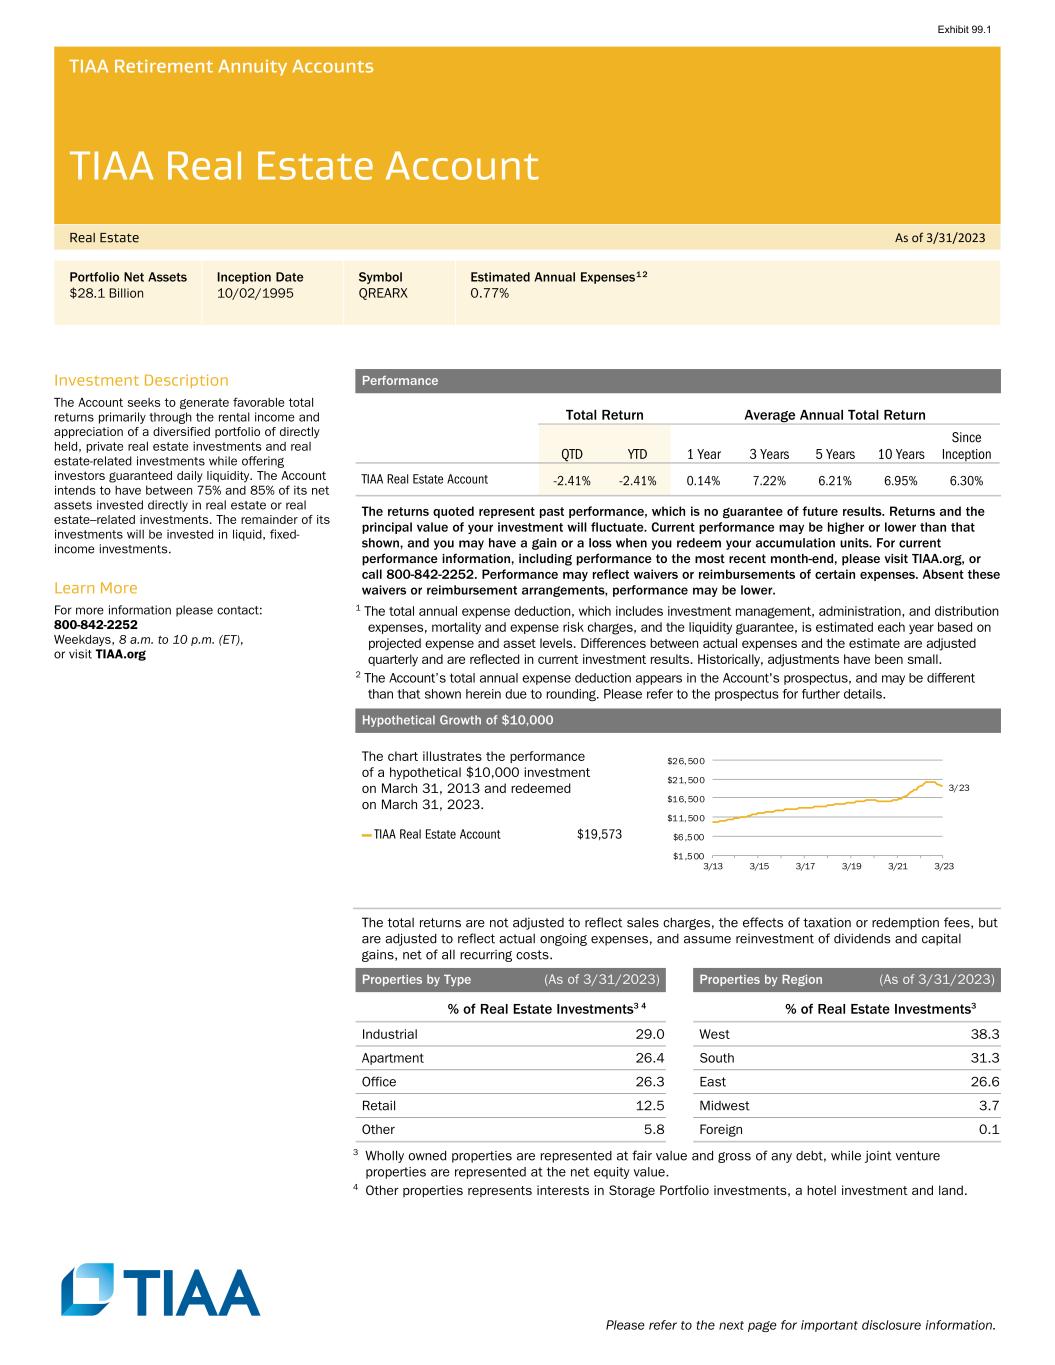
Please refer to the next page for important disclosure information. TIAA Retirement Annuity Accounts TIAA Real Estate Account Real Estate As of 3/31/2023 Portfolio Net Assets $28.1 Billion Inception Date 10/02/1995 Symbol QREARX Estimated Annual Expenses 1 2 0.77% Investment Description The Account seeks to generate favorable total returns primarily through the rental income and appreciation of a diversified portfolio of directly held, private real estate investments and real estate-related investments while offering investors guaranteed daily liquidity. The Account intends to have between 75% and 85% of its net assets invested directly in real estate or real estate–related investments. The remainder of its investments will be invested in liquid, fixed- income investments. Learn More For more information please contact: 800-842-2252 Weekdays, 8 a.m. to 10 p.m. (ET), or visit TIAA.org Performance Total Return Average Annual Total Return QTD YTD 1 Year 3 Years 5 Years 10 Years Since Inception TIAA Real Estate Account -2.41% -2.41% 0.14% 7.22% 6.21% 6.95% 6.30% The returns quoted represent past performance, which is no guarantee of future results. Returns and the principal value of your investment will fluctuate. Current performance may be higher or lower than that shown, and you may have a gain or a loss when you redeem your accumulation units. For current performance information, including performance to the most recent month-end, please visit TIAA.org, or call 800-842-2252. Performance may reflect waivers or reimbursements of certain expenses. Absent these waivers or reimbursement arrangements, performance may be lower. 1 The total annual expense deduction, which includes investment management, administration, and distribution expenses, mortality and expense risk charges, and the liquidity guarantee, is estimated each year based on projected expense and asset levels. Differences between actual expenses and the estimate are adjusted quarterly and are reflected in current investment results. Historically, adjustments have been small. 2 The Account’s total annual expense deduction appears in the Account's prospectus, and may be different than that shown herein due to rounding. Please refer to the prospectus for further details. Hypothetical Growth of $10,000 The chart illustrates the performance of a hypothetical $10,000 investment on March 31, 2013 and redeemed on March 31, 2023. — TIAA Real Estate Account $19,573 The total returns are not adjusted to reflect sales charges, the effects of taxation or redemption fees, but are adjusted to reflect actual ongoing expenses, and assume reinvestment of dividends and capital gains, net of all recurring costs. Properties by Type (As of 3/31/2023) % of Real Estate Investments3 4 Industrial 29.0 Apartment 26.4 Office 26.3 Retail 12.5 Other 5.8 Properties by Region (As of 3/31/2023) % of Real Estate Investments3 West 38.3 South 31.3 East 26.6 Midwest 3.7 Foreign 0.1 3 Wholly owned properties are represented at fair value and gross of any debt, while joint venture properties are represented at the net equity value. 4 Other properties represents interests in Storage Portfolio investments, a hotel investment and land. 3/23 $1,500 $6,500 $11,500 $16,500 $21,500 $26,500 3/13 3/15 3/17 3/19 3/21 3/23 Exhibit 99.1

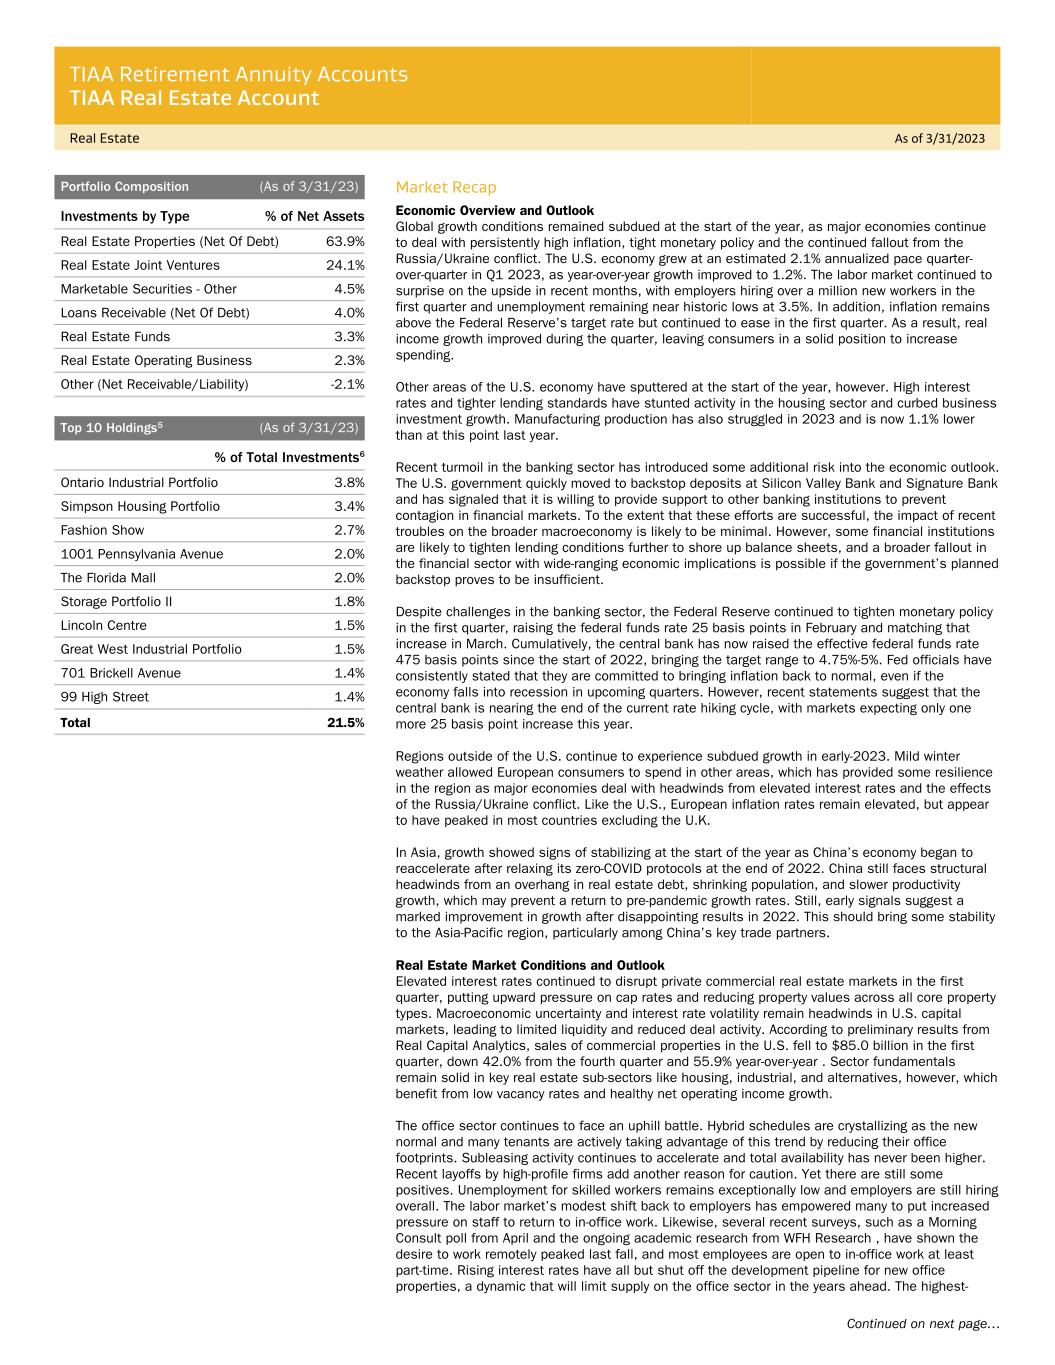
TIAA Retirement Annuity Accounts TIAA Real Estate Account Real Estate As of 3/31/2023 Continued on next page… Portfolio Composition (As of 3/31/23) Investments by Type % of Net Assets Real Estate Properties (Net Of Debt) 63.9% Real Estate Joint Ventures 24.1% Marketable Securities - Other 4.5% Loans Receivable (Net Of Debt) 4.0% Real Estate Funds 3.3% Real Estate Operating Business 2.3% Other (Net Receivable/Liability) -2.1% Top 10 Holdings 5 (As of 3/31/23) % of Total Investments 6 Ontario Industrial Portfolio 3.8% Simpson Housing Portfolio 3.4% Fashion Show 2.7% 1001 Pennsylvania Avenue 2.0% The Florida Mall 2.0% Storage Portfolio II 1.8% Lincoln Centre 1.5% Great West Industrial Portfolio 1.5% 701 Brickell Avenue 1.4% 99 High Street 1.4% Total 21.5% Market Recap Economic Overview and Outlook Global growth conditions remained subdued at the start of the year, as major economies continue to deal with persistently high inflation, tight monetary policy and the continued fallout from the Russia/Ukraine conflict. The U.S. economy grew at an estimated 2.1% annualized pace quarter- over-quarter in Q1 2023, as year-over-year growth improved to 1.2%. The labor market continued to surprise on the upside in recent months, with employers hiring over a million new workers in the first quarter and unemployment remaining near historic lows at 3.5%. In addition, inflation remains above the Federal Reserve’s target rate but continued to ease in the first quarter. As a result, real income growth improved during the quarter, leaving consumers in a solid position to increase spending. Other areas of the U.S. economy have sputtered at the start of the year, however. High interest rates and tighter lending standards have stunted activity in the housing sector and curbed business investment growth. Manufacturing production has also struggled in 2023 and is now 1.1% lower than at this point last year. Recent turmoil in the banking sector has introduced some additional risk into the economic outlook. The U.S. government quickly moved to backstop deposits at Silicon Valley Bank and Signature Bank and has signaled that it is willing to provide support to other banking institutions to prevent contagion in financial markets. To the extent that these efforts are successful, the impact of recent troubles on the broader macroeconomy is likely to be minimal. However, some financial institutions are likely to tighten lending conditions further to shore up balance sheets, and a broader fallout in the financial sector with wide-ranging economic implications is possible if the government’s planned backstop proves to be insufficient. Despite challenges in the banking sector, the Federal Reserve continued to tighten monetary policy in the first quarter, raising the federal funds rate 25 basis points in February and matching that increase in March. Cumulatively, the central bank has now raised the effective federal funds rate 475 basis points since the start of 2022, bringing the target range to 4.75%-5%. Fed officials have consistently stated that they are committed to bringing inflation back to normal, even if the economy falls into recession in upcoming quarters. However, recent statements suggest that the central bank is nearing the end of the current rate hiking cycle, with markets expecting only one more 25 basis point increase this year. Regions outside of the U.S. continue to experience subdued growth in early-2023. Mild winter weather allowed European consumers to spend in other areas, which has provided some resilience in the region as major economies deal with headwinds from elevated interest rates and the effects of the Russia/Ukraine conflict. Like the U.S., European inflation rates remain elevated, but appear to have peaked in most countries excluding the U.K. In Asia, growth showed signs of stabilizing at the start of the year as China’s economy began to reaccelerate after relaxing its zero-COVID protocols at the end of 2022. China still faces structural headwinds from an overhang in real estate debt, shrinking population, and slower productivity growth, which may prevent a return to pre-pandemic growth rates. Still, early signals suggest a marked improvement in growth after disappointing results in 2022. This should bring some stability to the Asia-Pacific region, particularly among China’s key trade partners. Real Estate Market Conditions and Outlook Elevated interest rates continued to disrupt private commercial real estate markets in the first quarter, putting upward pressure on cap rates and reducing property values across all core property types. Macroeconomic uncertainty and interest rate volatility remain headwinds in U.S. capital markets, leading to limited liquidity and reduced deal activity. According to preliminary results from Real Capital Analytics, sales of commercial properties in the U.S. fell to $85.0 billion in the first quarter, down 42.0% from the fourth quarter and 55.9% year-over-year . Sector fundamentals remain solid in key real estate sub-sectors like housing, industrial, and alternatives, however, which benefit from low vacancy rates and healthy net operating income growth. The office sector continues to face an uphill battle. Hybrid schedules are crystallizing as the new normal and many tenants are actively taking advantage of this trend by reducing their office footprints. Subleasing activity continues to accelerate and total availability has never been higher. Recent layoffs by high-profile firms add another reason for caution. Yet there are still some positives. Unemployment for skilled workers remains exceptionally low and employers are still hiring overall. The labor market’s modest shift back to employers has empowered many to put increased pressure on staff to return to in-office work. Likewise, several recent surveys, such as a Morning Consult poll from April and the ongoing academic research from WFH Research , have shown the desire to work remotely peaked last fall, and most employees are open to in-office work at least part-time. Rising interest rates have all but shut off the development pipeline for new office properties, a dynamic that will limit supply on the office sector in the years ahead. The highest-

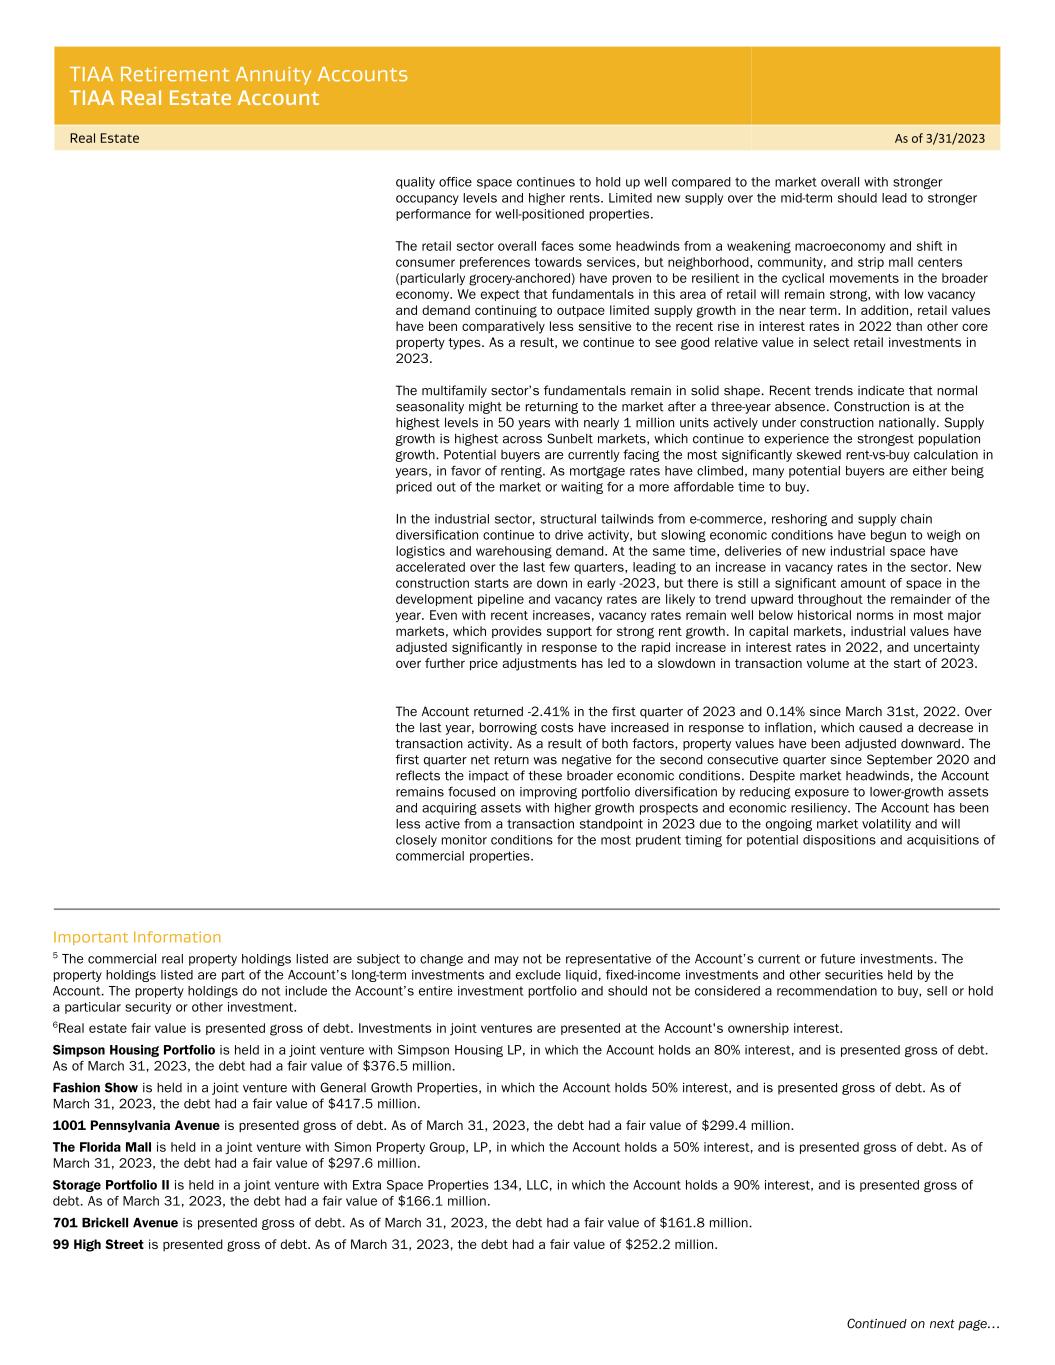
TIAA Retirement Annuity Accounts TIAA Real Estate Account Real Estate As of 3/31/2023 Continued on next page… quality office space continues to hold up well compared to the market overall with stronger occupancy levels and higher rents. Limited new supply over the mid-term should lead to stronger performance for well-positioned properties. The retail sector overall faces some headwinds from a weakening macroeconomy and shift in consumer preferences towards services, but neighborhood, community, and strip mall centers (particularly grocery-anchored) have proven to be resilient in the cyclical movements in the broader economy. We expect that fundamentals in this area of retail will remain strong, with low vacancy and demand continuing to outpace limited supply growth in the near term. In addition, retail values have been comparatively less sensitive to the recent rise in interest rates in 2022 than other core property types. As a result, we continue to see good relative value in select retail investments in 2023. The multifamily sector’s fundamentals remain in solid shape. Recent trends indicate that normal seasonality might be returning to the market after a three-year absence. Construction is at the highest levels in 50 years with nearly 1 million units actively under construction nationally. Supply growth is highest across Sunbelt markets, which continue to experience the strongest population growth. Potential buyers are currently facing the most significantly skewed rent-vs-buy calculation in years, in favor of renting. As mortgage rates have climbed, many potential buyers are either being priced out of the market or waiting for a more affordable time to buy. In the industrial sector, structural tailwinds from e-commerce, reshoring and supply chain diversification continue to drive activity, but slowing economic conditions have begun to weigh on logistics and warehousing demand. At the same time, deliveries of new industrial space have accelerated over the last few quarters, leading to an increase in vacancy rates in the sector. New construction starts are down in early -2023, but there is still a significant amount of space in the development pipeline and vacancy rates are likely to trend upward throughout the remainder of the year. Even with recent increases, vacancy rates remain well below historical norms in most major markets, which provides support for strong rent growth. In capital markets, industrial values have adjusted significantly in response to the rapid increase in interest rates in 2022, and uncertainty over further price adjustments has led to a slowdown in transaction volume at the start of 2023. The Account returned -2.41% in the first quarter of 2023 and 0.14% since March 31st, 2022. Over the last year, borrowing costs have increased in response to inflation, which caused a decrease in transaction activity. As a result of both factors, property values have been adjusted downward. The first quarter net return was negative for the second consecutive quarter since September 2020 and reflects the impact of these broader economic conditions. Despite market headwinds, the Account remains focused on improving portfolio diversification by reducing exposure to lower-growth assets and acquiring assets with higher growth prospects and economic resiliency. The Account has been less active from a transaction standpoint in 2023 due to the ongoing market volatility and will closely monitor conditions for the most prudent timing for potential dispositions and acquisitions of commercial properties. Important Information 5 The commercial real property holdings listed are subject to change and may not be representative of the Account’s current or future investments. The property holdings listed are part of the Account’s long-term investments and exclude liquid, fixed-income investments and other securities held by the Account. The property holdings do not include the Account’s entire investment portfolio and should not be considered a recommendation to buy, sell or hold a particular security or other investment. 6Real estate fair value is presented gross of debt. Investments in joint ventures are presented at the Account's ownership interest. Simpson Housing Portfolio is held in a joint venture with Simpson Housing LP, in which the Account holds an 80% interest, and is presented gross of debt. As of March 31, 2023, the debt had a fair value of $376.5 million. Fashion Show is held in a joint venture with General Growth Properties, in which the Account holds 50% interest, and is presented gross of debt. As of March 31, 2023, the debt had a fair value of $417.5 million. 1001 Pennsylvania Avenue is presented gross of debt. As of March 31, 2023, the debt had a fair value of $299.4 million. The Florida Mall is held in a joint venture with Simon Property Group, LP, in which the Account holds a 50% interest, and is presented gross of debt. As of March 31, 2023, the debt had a fair value of $297.6 million. Storage Portfolio II is held in a joint venture with Extra Space Properties 134, LLC, in which the Account holds a 90% interest, and is presented gross of debt. As of March 31, 2023, the debt had a fair value of $166.1 million. 701 Brickell Avenue is presented gross of debt. As of March 31, 2023, the debt had a fair value of $161.8 million. 99 High Street is presented gross of debt. As of March 31, 2023, the debt had a fair value of $252.2 million.

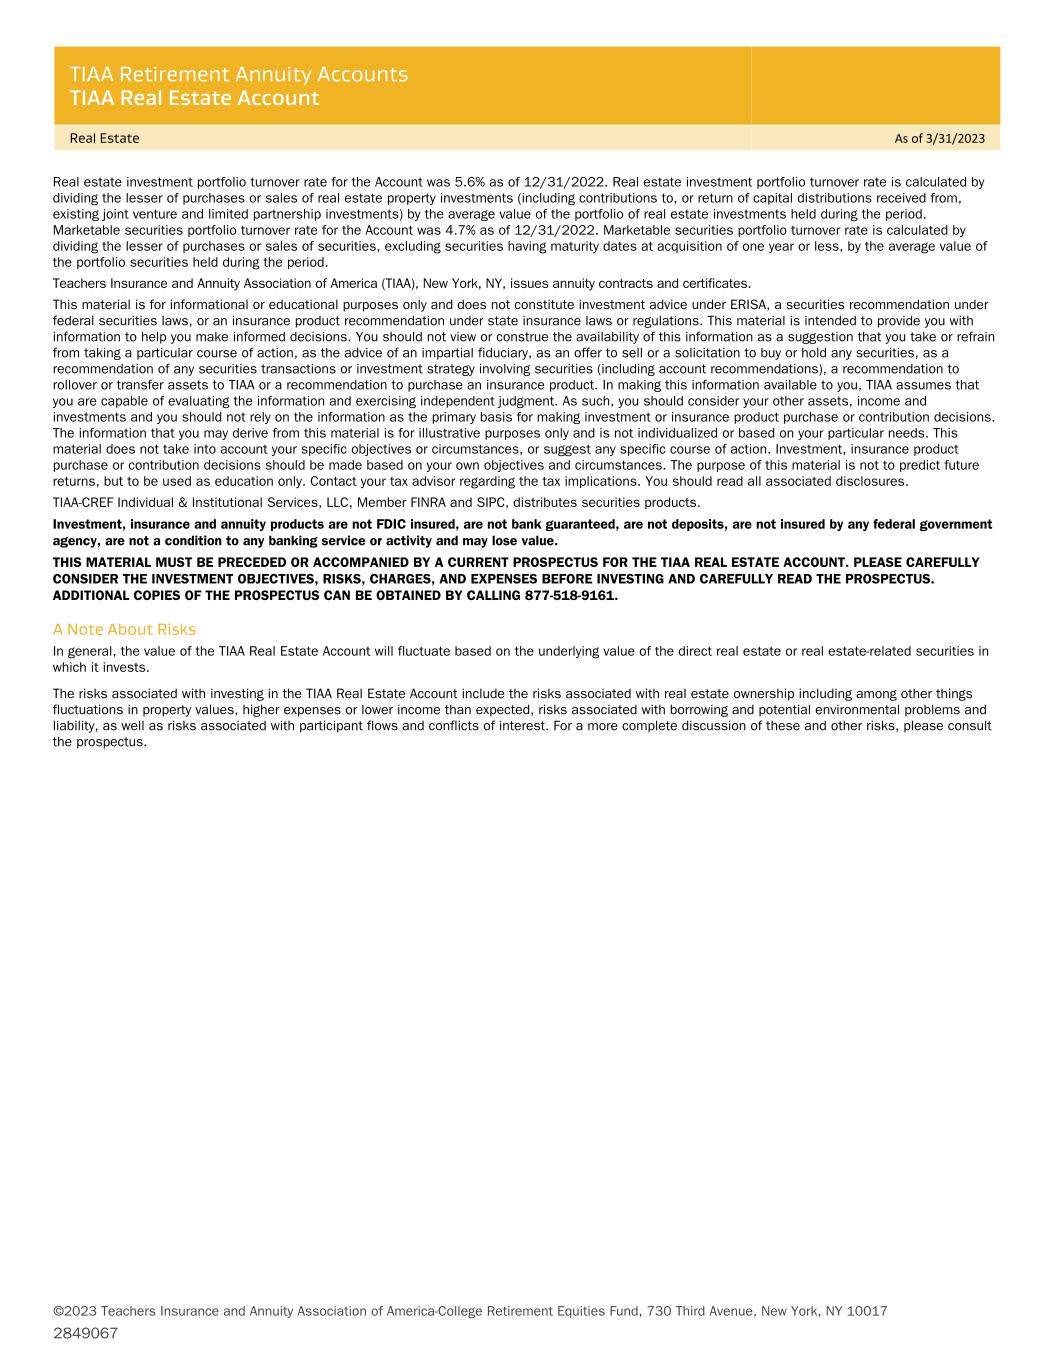
TIAA Retirement Annuity Accounts TIAA Real Estate Account Real Estate As of 3/31/2023 Continued on next page… Real estate investment portfolio turnover rate for the Account was 5.6% as of 12/31/2022. Real estate investment portfolio turnover rate is calculated by dividing the lesser of purchases or sales of real estate property investments (including contributions to, or return of capital distributions received from, existing joint venture and limited partnership investments) by the average value of the portfolio of real estate investments held during the period. Marketable securities portfolio turnover rate for the Account was 4.7% as of 12/31/2022. Marketable securities portfolio turnover rate is calculated by dividing the lesser of purchases or sales of securities, excluding securities having maturity dates at acquisition of one year or less, by the average value of the portfolio securities held during the period. Teachers Insurance and Annuity Association of America (TIAA), New York, NY, issues annuity contracts and certificates. This material is for informational or educational purposes only and does not constitute investment advice under ERISA, a securities recommendation under federal securities laws, or an insurance product recommendation under state insurance laws or regulations. This material is intended to provide you with information to help you make informed decisions. You should not view or construe the availability of this information as a suggestion that you take or refrain from taking a particular course of action, as the advice of an impartial fiduciary, as an offer to sell or a solicitation to buy or hold any securities, as a recommendation of any securities transactions or investment strategy involving securities (including account recommendations), a recommendation to rollover or transfer assets to TIAA or a recommendation to purchase an insurance product. In making this information available to you, TIAA assumes that you are capable of evaluating the information and exercising independent judgment. As such, you should consider your other assets, income and investments and you should not rely on the information as the primary basis for making investment or insurance product purchase or contribution decisions. The information that you may derive from this material is for illustrative purposes only and is not individualized or based on your particular needs. This material does not take into account your specific objectives or circumstances, or suggest any specific course of action. Investment, insurance product purchase or contribution decisions should be made based on your own objectives and circumstances. The purpose of this material is not to predict future returns, but to be used as education only. Contact your tax advisor regarding the tax implications. You should read all associated disclosures. TIAA-CREF Individual & Institutional Services, LLC, Member FINRA and SIPC, distributes securities products. Investment, insurance and annuity products are not FDIC insured, are not bank guaranteed, are not deposits, are not insured by any federal government agency, are not a condition to any banking service or activity and may lose value. THIS MATERIAL MUST BE PRECEDED OR ACCOMPANIED BY A CURRENT PROSPECTUS FOR THE TIAA REAL ESTATE ACCOUNT. PLEASE CAREFULLY CONSIDER THE INVESTMENT OBJECTIVES, RISKS, CHARGES, AND EXPENSES BEFORE INVESTING AND CAREFULLY READ THE PROSPECTUS. ADDITIONAL COPIES OF THE PROSPECTUS CAN BE OBTAINED BY CALLING 877-518-9161. A Note About Risks In general, the value of the TIAA Real Estate Account will fluctuate based on the underlying value of the direct real estate or real estate-related securities in which it invests. The risks associated with investing in the TIAA Real Estate Account include the risks associated with real estate ownership including among other things fluctuations in property values, higher expenses or lower income than expected, risks associated with borrowing and potential environmental problems and liability, as well as risks associated with participant flows and conflicts of interest. For a more complete discussion of these and other risks, please consult the prospectus. ©2023 Teachers Insurance and Annuity Association of America-College Retirement Equities Fund, 730 Third Avenue, New York, NY 10017 2849067


