Exhibit 99.1
Integrated Developer Owner and Operator of Renewable Energy Projects Investors Presentation – June 2020

General: The information contained in this presentation is subject to, and must be read in conjunction with, all other publically available information, including our Annual Report on Form 20-F for the year ended December 31, 2019, and other filings that we make from time to time with the SEC. Any person at any time acquiring securities must do so only on the basis of such person’s own judgment as to the merits or the suitability of the securities for its purpose and only based on such information as is contained in such public filings, after having taken all such professional or other advice as it considers necessary or appropriate in the circumstances and not in reliance on the information contained in the presentation. In making this presentation available, we give no advice and make no recommendation to buy, sell or otherwise deal in our shares or in any other securities or investments whatsoever. We do not warrant that the information is either complete or accurate, nor will we bear any liability for any damage or losses that may result from any use of the information.Neither this presentation nor any of the information contained herein constitute an offer to sell or the solicitation of an offer to buy any securities. No offering of securities shall be made in the United States except pursuant to registration under the U.S. Securities Act of 1933, as amended, or an exemption therefrom. No offering of securities shall be made in Israel except pursuant to an effective prospectus under the Israeli Securities Law, 1968 or an exemption from the prospectus requirements under such law. Historical facts and past operating results are not intended to mean that future performances or results for any period will necessarily match or exceed those of any prior year. This presentation and the information contained herein are the sole property of the company and cannot be published, circulated or otherwise used in any way without our express prior written consent.Information Relating to Forward-Looking Statements:This presentation contains forward-looking statements that involve substantial risks and uncertainties. All statements, other than statements of historical facts, included in this presentation regarding our plans and the objectives of management are forward-looking statements. Such forward looking statements include projected financial information. Such forward looking statements with respect to revenues, earnings, performance, strategies, prospects and other aspects of the businesses of the Company are based on current expectations that are subject to risks and uncertainties. The projections included in the presentation are based on the current government tariff and/or commercial agreements relating to each project and on the current licenses and permits of each project. The expected profit in connection with the sale of the Company's Italian PV portfolio is an unaudited and unreviewed estimate and the actual results may be different from this estimation. In addition, the details concerning projects that are under development or early stage development that are included in the presentation are based on the current internal assessments of the company’s management and there is no certainty or assurance as to the ability of the company to advance or complete these projects as the advancement of such projects requires, among other things, approvals, permits and financing. The use of certain words, including the words “estimate,” “project,” “intend,” “expect”, ”plan”, “believe” and similar expressions are intended to identify forward-looking statements within the meaning of the Private Securities Litigation Reform Act of 1995 and the Israeli Securities Law, 1968. We may not actually achieve the plans, intentions or expectations disclosed in our forward-looking statements and you should not place undue reliance on our forward-looking statements. Various important factors could cause actual results or events to differ materially from those that may be expressed or implied by our forward-looking statements, including changes in the regulation and climate, delays in the construction and commencement of operations of the Talasol project, limited scope of projects identified for future development, delays in the development and construction of other projects under development and the impact of the COVID-19 pandemic on the Company’s operations and projects, including in connection with steps taken by authorities in countries in which the Company operates, regulatory changes, changes in the supply and prices of resources required for the operation of the Company’s facilities (such as waste and natural gas) and in the price of oil, changes in demand and technical and other disruptions in the operations or construction of the power plants owned by the Company. These and other risks and uncertainties associated with our business are described in greater detail in the filings we make from time to time with SEC, including our Annual Report on Form 20-F. The forward-looking statements are made as of this date and we do not undertake any obligation to update any forward-looking statements, whether as a result of new information, future events or otherwise. Disclaimers
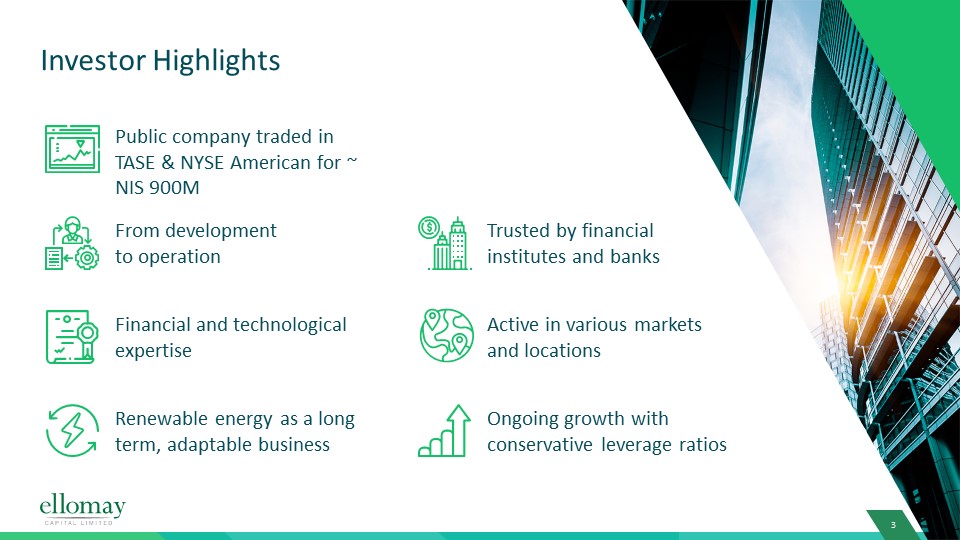
Investor Highlights Financial and technological expertise Active in various markets and locations From development to operation Trusted by financial institutes and banks Renewable energy as a long term, adaptable business Ongoing growth with conservative leverage ratios Public company traded in TASE & NYSE American for ~ NIS 900M
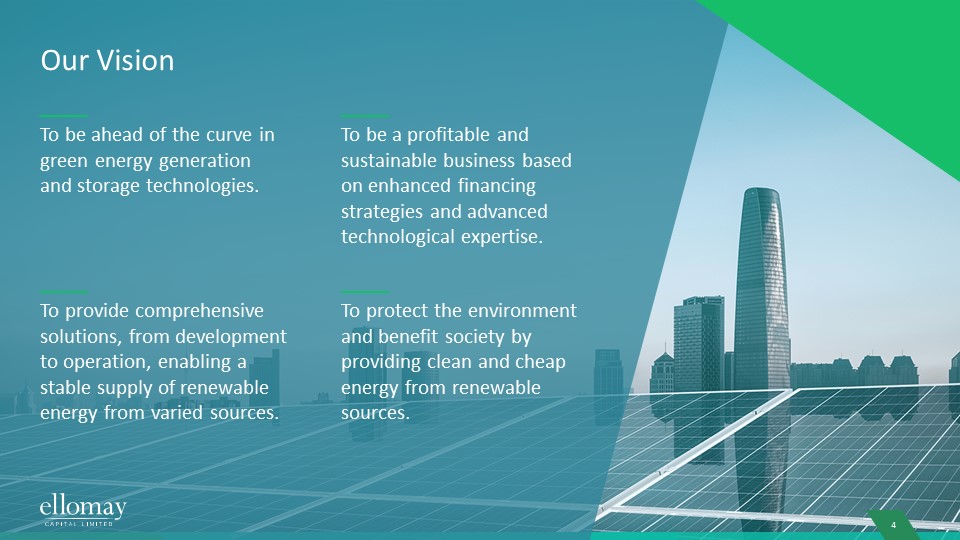
Our Vision To be ahead of the curve in green energy generation and storage technologies. To be a profitable and sustainable business based on enhanced financing strategies and advanced technological expertise. To provide comprehensive solutions, from development to operation, enabling a stable supply of renewable energy from varied sources. To protect the environment and benefit society by providing clean and cheap energy from renewable sources.

Growing our renewable energy and power generation activities – from development to operation – in Europe and Israel. Continuous growth Creating continuous cash flow from various assets in diverse renewable energy and energy storage applications. Constant cash flow Maintainingrelatively lowleverage ratios andmonetary strength. Monetary Policy Energy Revolution as a Long-Term, Profitable BusinessOur Objectives
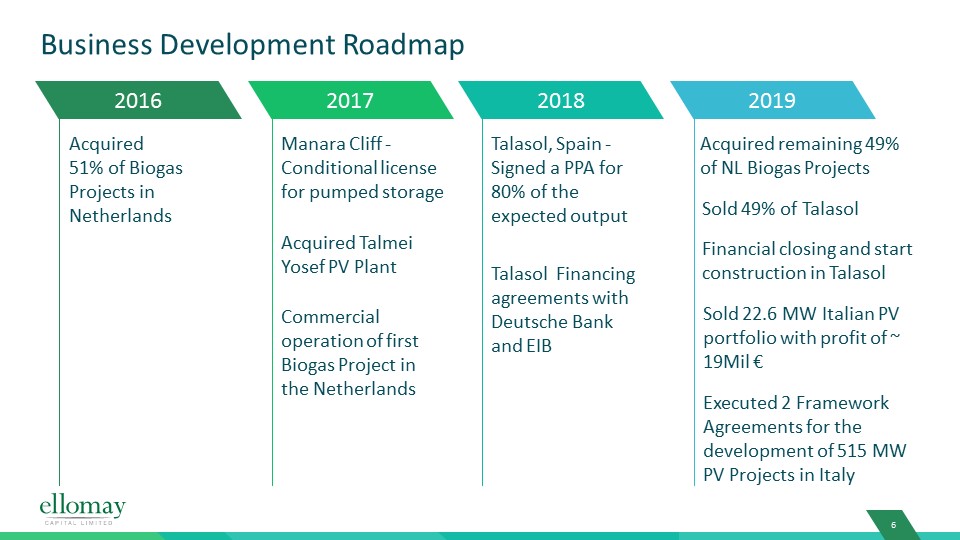
Business Development Roadmap Acquired51% of Biogas Projects in Netherlands Manara Cliff - Conditional license for pumped storage Talasol, Spain - Signed a PPA for 80% of the expected output Sold 49% of Talasol 2016 2017 2018 2019 Acquired Talmei Yosef PV Plant Commercial operation of first Biogas Project in the Netherlands Talasol Financing agreements with Deutsche Bank and EIB Financial closing and start construction in Talasol Sold 22.6 MW Italian PV portfolio with profit of ~ 19Mil € Executed 2 Framework Agreements for the development of 515 MW PV Projects in Italy Acquired remaining 49% of NL Biogas Projects
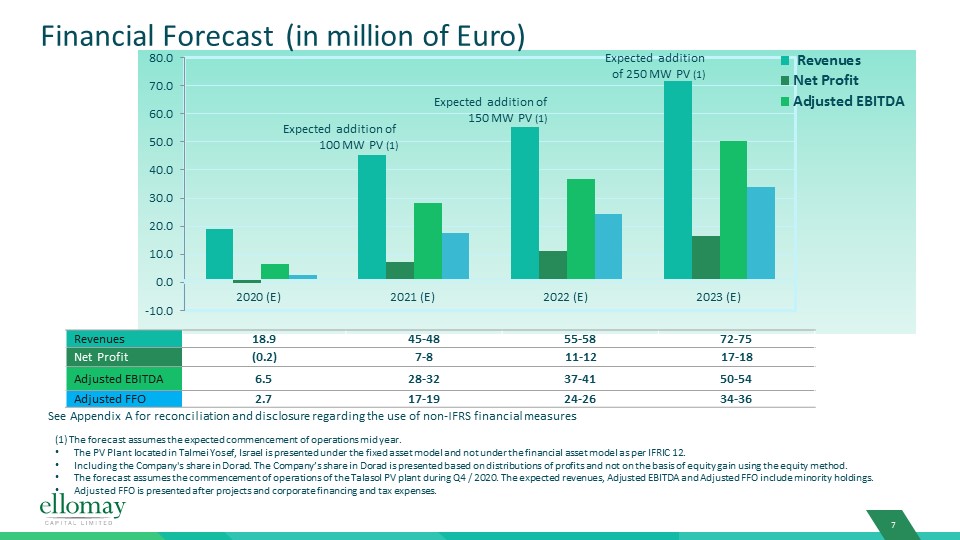
Financial Forecast (in million of Euro) (1) The forecast assumes the expected commencement of operations mid year.The PV Plant located in Talmei Yosef, Israel is presented under the fixed asset model and not under the financial asset model as per IFRIC 12. Including the Company's share in Dorad. The Company’s share in Dorad is presented based on distributions of profits and not on the basis of equity gain using the equity method.The forecast assumes the commencement of operations of the Talasol PV plant during Q4 / 2020. The expected revenues, Adjusted EBITDA and Adjusted FFO include minority holdings.Adjusted FFO is presented after projects and corporate financing and tax expenses. See Appendix A for reconciliation and disclosure regarding the use of non-IFRS financial measures Revenues 18.9 45-48 55-58 72-75 Net Profit (0.2) 7-8 11-12 17-18 Adjusted EBITDA 6.5 28-32 37-41 50-54 Adjusted FFO 2.7 17-19 24-26 34-36 Expected addition of 100 MW PV (1) Expected addition of 150 MW PV (1) Expected addition of 250 MW PV (1)
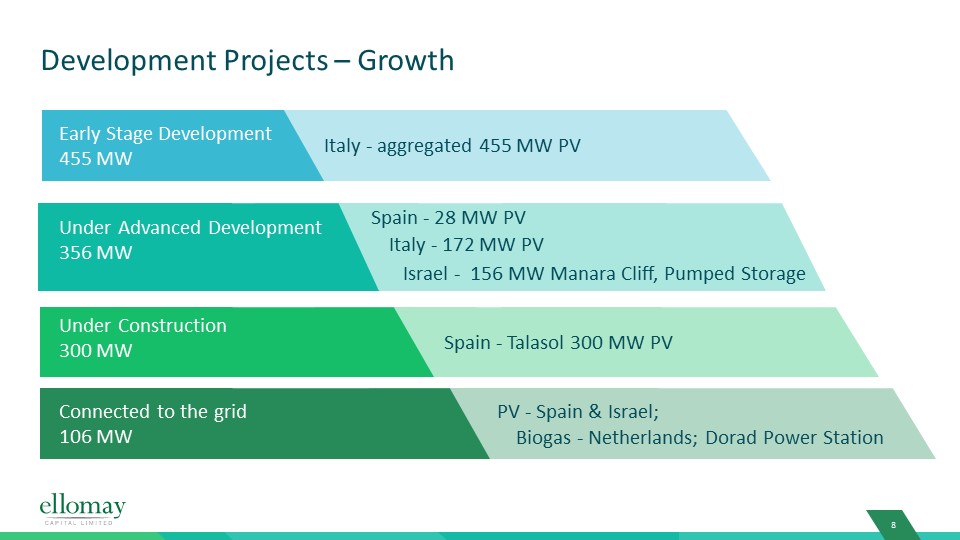
Development Projects – Growth Early Stage Development455 MW Under Advanced Development356 MW Under Construction300 MW Connected to the grid 106 MW Spain - Talasol 300 MW PV Spain - 28 MW PV Italy - aggregated 455 MW PV Italy - 172 MW PV PV - Spain & Israel; Biogas - Netherlands; Dorad Power Station Israel - 156 MW Manara Cliff, Pumped Storage
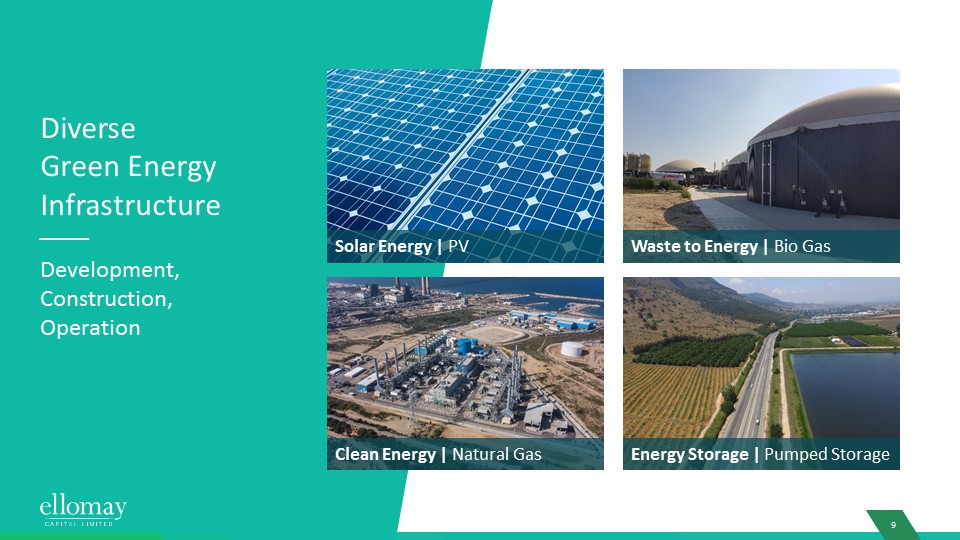
DiverseGreen Energy Infrastructure Development, Construction, Operation Solar Energy | PV Waste to Energy | Bio Gas Clean Energy | Natural Gas Energy Storage | Pumped Storage 9

Projects Summary (EUR Millions) Projects % Ownership License MW Expected Distribution in 2020 Expected Annual Revenues in 2020 Expected Annual Adjusted EBITDA in 2020 Expected Adjusted Annual FFO in 2020 Expected Debt as of December 31, 2020 Expected interest on bank loans payment in 2020 Expected Cash flow 2020 Connected to the grid and operating Italy – 12 PV 100% 2031 22.6 MW 9.4 7.9 6.3 31.2 0.64 3.04 Spain – 4 PV 100% 2041 7.9 MW 2.8 2.2 1.5 15 0.5 0.7 Israel – Talmei Yosef (1) 100% 2033 9 MW 4.2 3.7 2.8 18 0.9 1.0 The Netherlands 100% 2031 9 MW base load equal to 850 m3/h gas production 6.5 2.2 2.0 8 0.3 1.4 Israel – Dorad (based on 2019 reports) (2) ~9.4% 2034 860 MW (of which the company’s share is ~ 80 MW) 3.0 60 12 - - - 3.0 Total Installed 105.9 MW (1) The PV Plant located in Talmei Yosef, Israel is presented under the fixed asset model and not under the financial asset model as per IFRIC 12 (2) The figures represent the Company’s share SOLD See Appendix A for reconciliation and disclosure regarding the use of non-IFRS financial measures
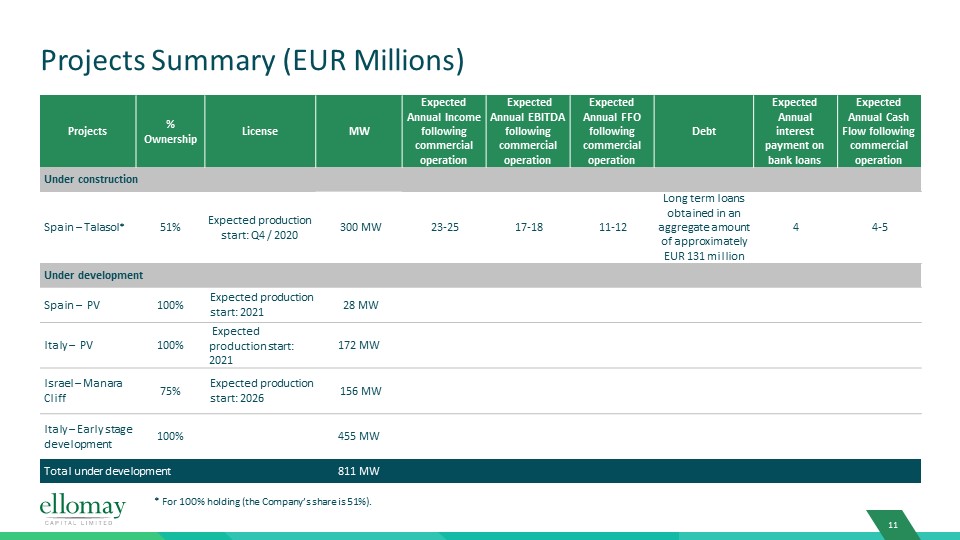
Projects Summary (EUR Millions) Projects % Ownership License MW Expected Annual Income following commercial operation Expected Annual EBITDA following commercial operation Expected Annual FFO following commercial operation Debt Expected Annual interest payment on bank loans Expected Annual Cash Flow following commercial operation Under construction Spain – Talasol* 51% Expected production start: Q4 / 2020 300 MW 23-25 17-18 11-12 Long term loans obtained in an aggregate amount of approximately EUR 131 million 4 4-5 Under development Spain – PV 100% Expected production start: 2021 28 MW Italy – PV 100% Expected production start: 2021 172 MW Israel – Manara Cliff 75% Expected production start: 2026 156 MW Italy – Early stage development 100% 455 MW Total under development 811 MW * For 100% holding (the Company’s share is 51%).
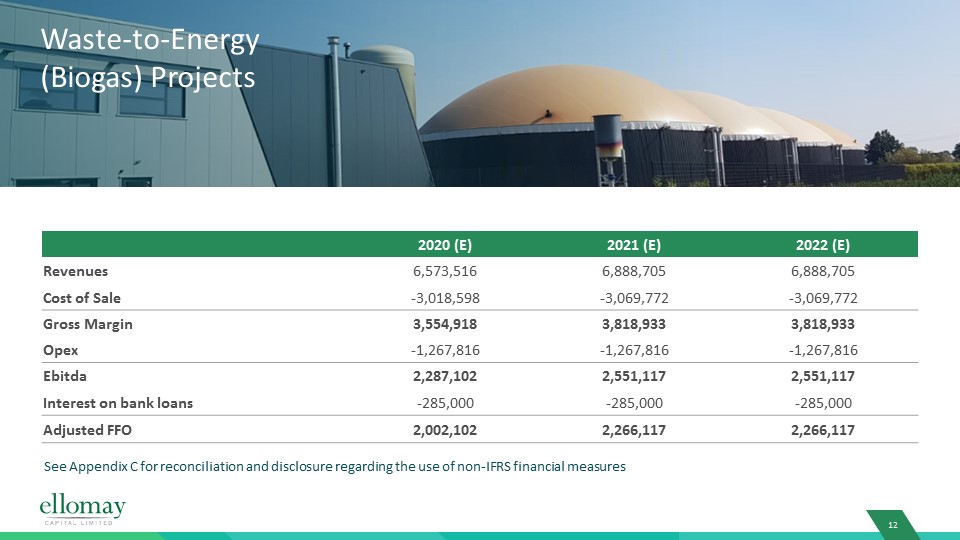
Waste-to-Energy(Biogas) Projects 2020 (E) 2021 (E) 2022 (E) Revenues 6,573,516 6,888,705 6,888,705 Cost of Sale -3,018,598 -3,069,772 -3,069,772 Gross Margin 3,554,918 3,818,933 3,818,933 Opex -1,267,816 -1,267,816 -1,267,816 Ebitda 2,287,102 2,551,117 2,551,117 Interest on bank loans -285,000 -285,000 -285,000 Adjusted FFO 2,002,102 2,266,117 2,266,117 See Appendix C for reconciliation and disclosure regarding the use of non-IFRS financial measures
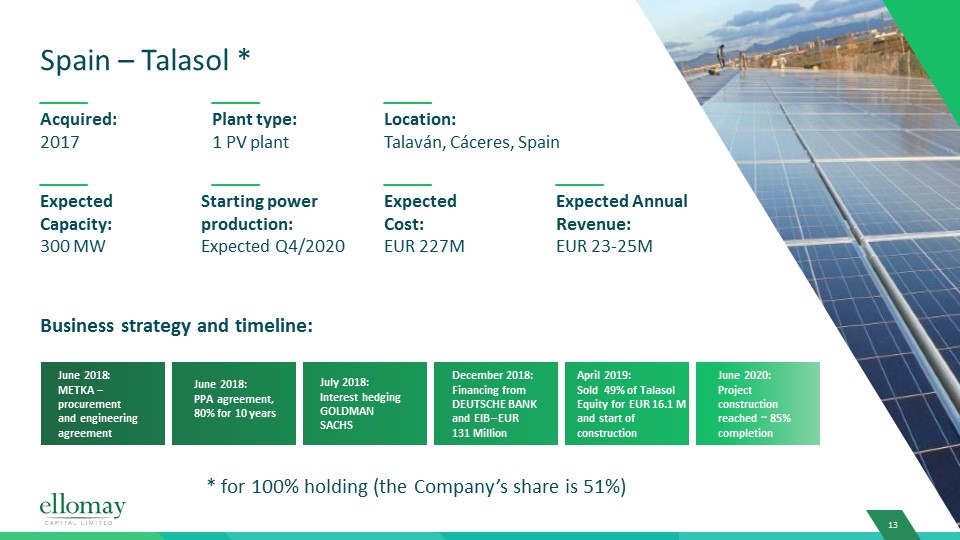
Spain – Talasol * Business strategy and timeline: Acquired:2017 Expected Capacity:300 MW Plant type:1 PV plant Starting power production:Expected Q4/2020 Location:Talaván, Cáceres, Spain ExpectedCost:EUR 227M Expected Annual Revenue:EUR 23-25M June 2018:METKA –procurement and engineering agreement June 2018:PPA agreement, 80% for 10 years July 2018:Interest hedgingGOLDMAN SACHS December 2018:Financing from DEUTSCHE BANK and EIB– EUR 131 Million April 2019:Sold 49% of Talasol Equity for EUR 16.1 M and start of construction June 2020: Project construction reached ~ 85% completion * for 100% holding (the Company’s share is 51%)
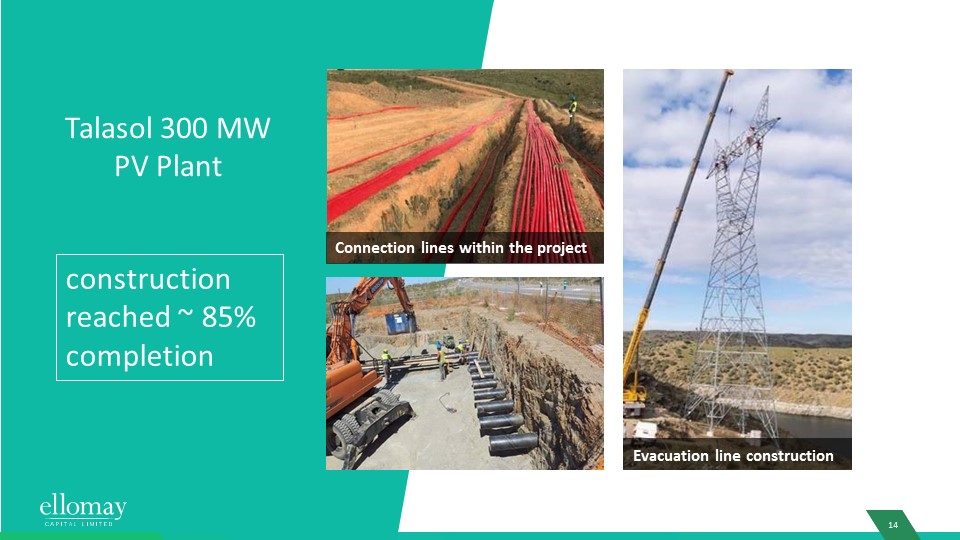
Talasol 300 MW PV Plant Connection lines within the project 14 Evacuation line construction construction reached ~ 85% completion
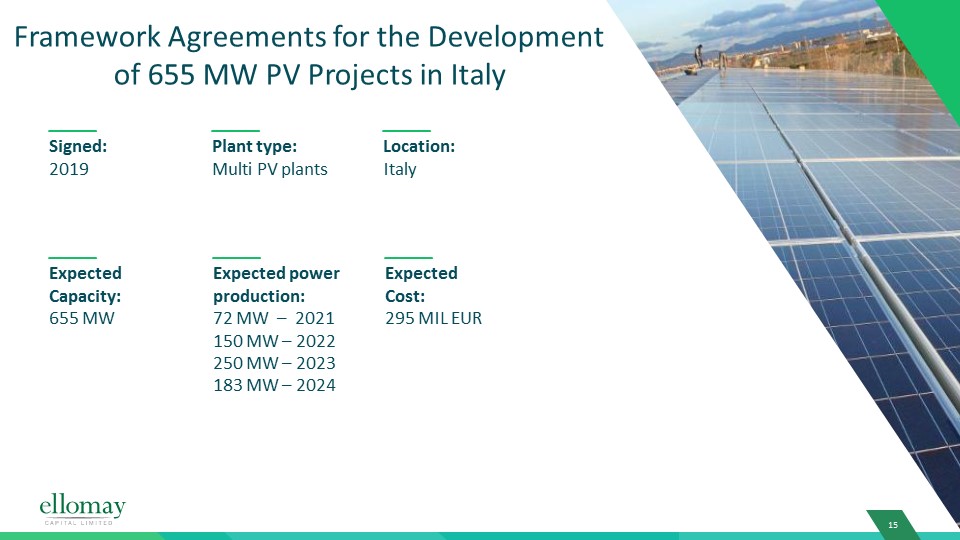
Framework Agreements for the Development of 655 MW PV Projects in Italy Expected Capacity:655 MW Expected power production:72 MW – 2021150 MW – 2022250 MW – 2023183 MW – 2024 Location:Italy ExpectedCost:295 MIL EUR Signed:2019 Plant type:Multi PV plants
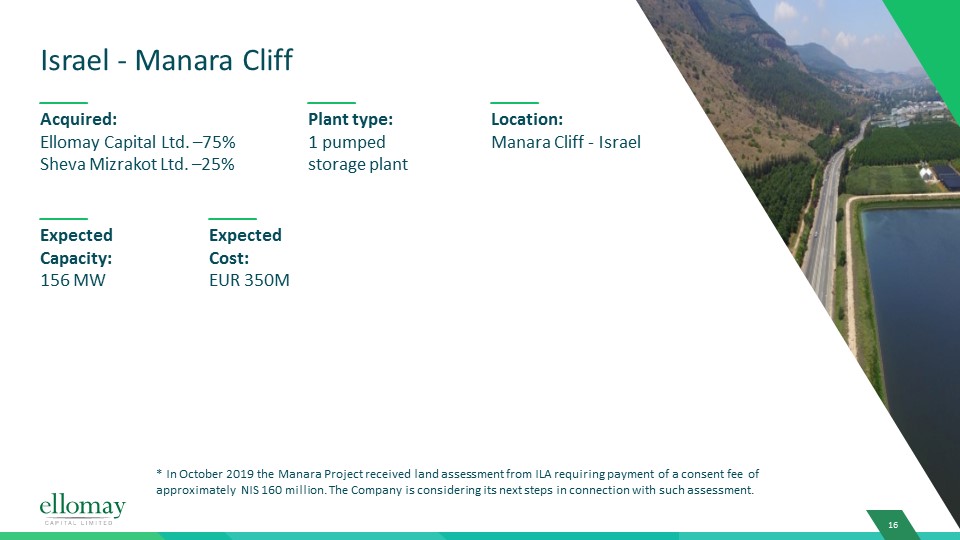
Israel - Manara Cliff Expected Capacity:156 MW Location:Manara Cliff - Israel ExpectedCost:EUR 350M Acquired:Ellomay Capital Ltd. –75% Sheva Mizrakot Ltd. –25% Plant type:1 pumped storage plant * In October 2019 the Manara Project received land assessment from ILA requiring payment of a consent fee of approximately NIS 160 million. The Company is considering its next steps in connection with such assessment.
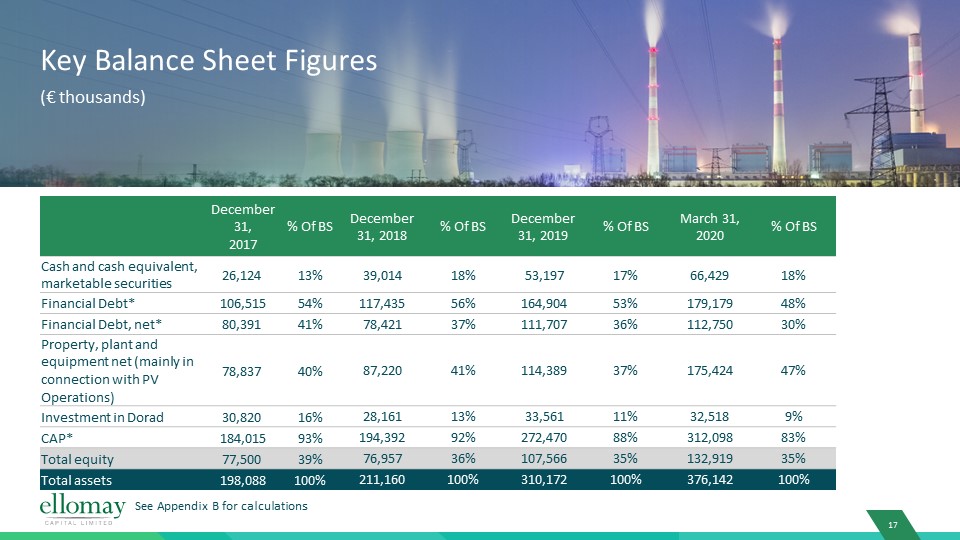
Key Balance Sheet Figures December 31, 2017 % Of BS December 31, 2018 % Of BS December 31, 2019 % Of BS March 31, 2020 % Of BS Cash and cash equivalent, marketable securities 26,124 13% 39,014 18% 53,197 17% 66,429 18% Financial Debt* 106,515 54% 117,435 56% 164,904 53% 179,179 48% Financial Debt, net* 80,391 41% 78,421 37% 111,707 36% 112,750 30% Property, plant and equipment net (mainly in connection with PV Operations) 78,837 40% 87,220 41% 114,389 37% 175,424 47% Investment in Dorad 30,820 16% 28,161 13% 33,561 11% 32,518 9% CAP* 184,015 93% 194,392 92% 272,470 88% 312,098 83% Total equity 77,500 39% 76,957 36% 107,566 35% 132,919 35% Total assets 198,088 100% 211,160 100% 310,172 100% 376,142 100% See Appendix B for calculations (€ thousands)

Key Financial Ratios Financial Debt to CAP * 58% 60% 61% 57% Financial Debt, net to CAP * 44% 40% 41% 36% See Appendix B for calculations Strong Balance Sheet, Sufficient Liquidity December 31 , 2017 December 31 , 2018 March 31, 2020 December 31, 2019
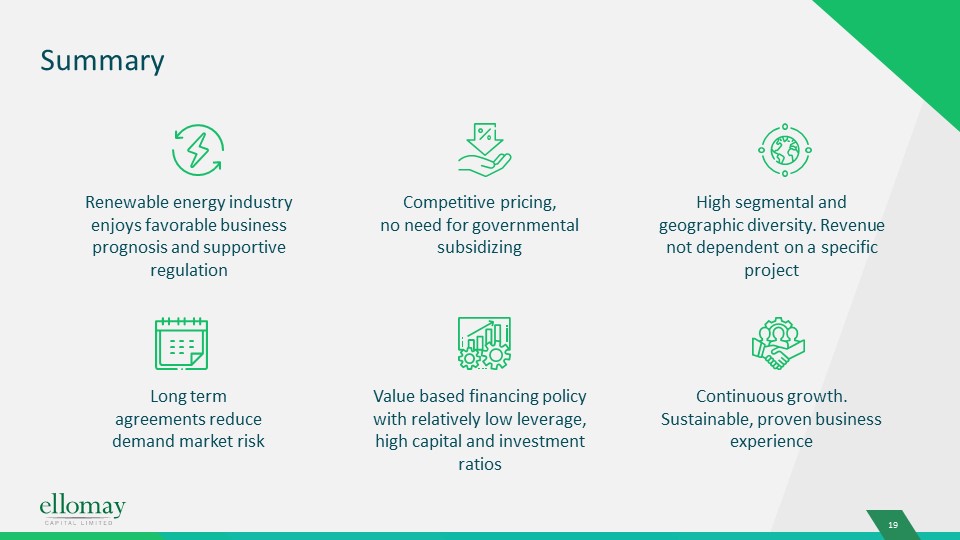
Summary Renewable energy industry enjoys favorable business prognosis and supportive regulation Competitive pricing,no need for governmental subsidizing High segmental and geographic diversity. Revenue not dependent on a specific project Long termagreements reducedemand market risk Value based financing policy with relatively low leverage, high capital and investment ratios Continuous growth. Sustainable, proven business experience 19
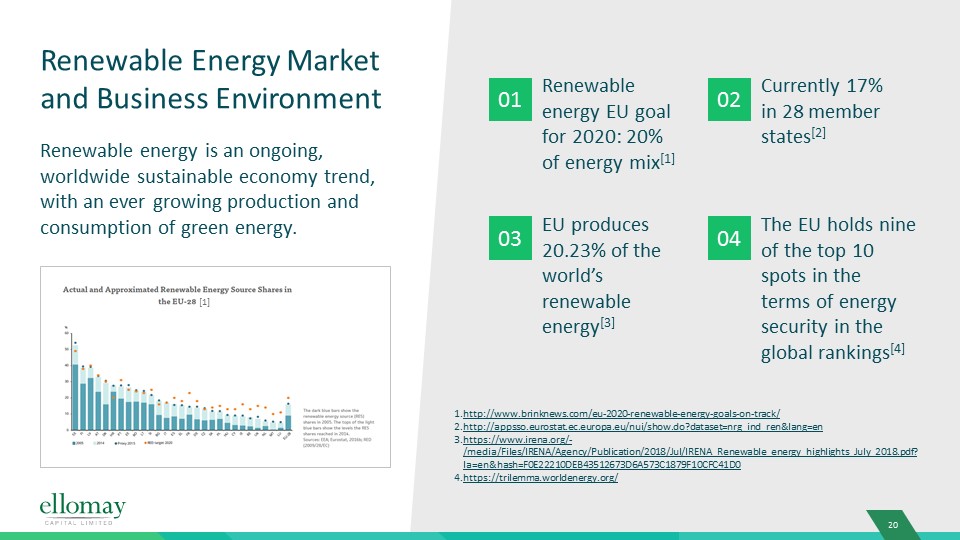
Renewable energy is an ongoing, worldwide sustainable economy trend, with an ever growing production and consumption of green energy. Renewable Energy Market and Business Environment http://www.brinknews.com/eu-2020-renewable-energy-goals-on-track/ http://appsso.eurostat.ec.europa.eu/nui/show.do?dataset=nrg_ind_ren&lang=enhttps://www.irena.org/-/media/Files/IRENA/Agency/Publication/2018/Jul/IRENA_Renewable_energy_highlights_July_2018.pdf?la=en&hash=F0E22210DEB43512673D6A573C1879F10CFC41D0https://trilemma.worldenergy.org/ [1] 20 01 Renewable energy EU goal for 2020: 20% of energy mix[1] 03 EU produces 20.23% of the world’s renewable energy[3] 02 Currently 17% in 28 member states[2] 04 The EU holds nine of the top 10 spots in the terms of energy security in the global rankings[4]

Israel - Renewable Energy Production Goals https://www.gov.il/he/Departments/General/renewable_energyhttps://www.evm.co.il/israel/אנרגיות-מתחדשות-הפוטנציאל-הלא-ממומש-ש/ https://www.gov.il/he/Departments/news/re_171119 2.26%Actually produced Expected to be increased to 25-30% by 2030
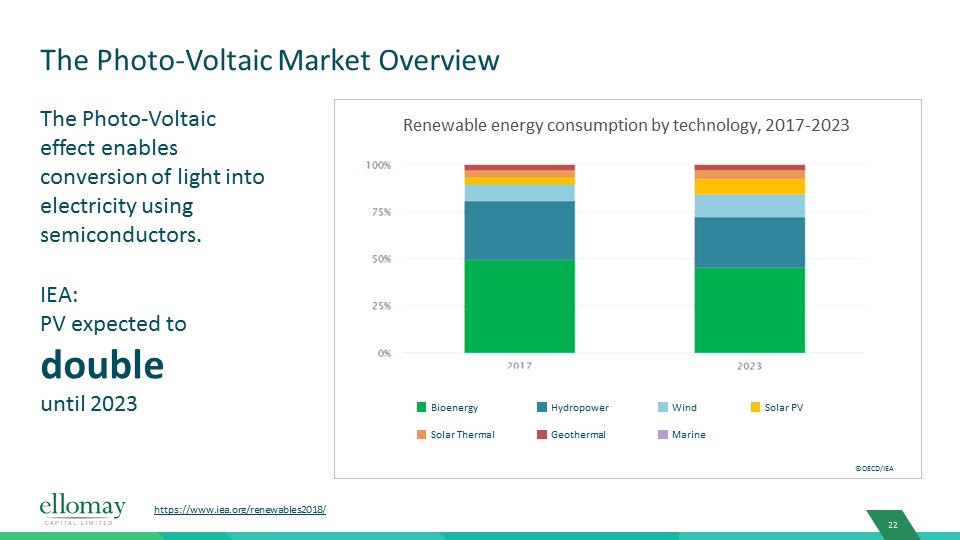
The Photo-Voltaic effect enables conversion of light into electricity using semiconductors.IEA:PV expected todoubleuntil 2023 The Photo-Voltaic Market Overview https://www.iea.org/renewables2018/ ©OECD/IEA Bioenergy Solar Thermal Hydropower Geothermal Wind Marine Solar PV Renewable energy consumption by technology, 2017-2023

Waste-to-Energy Market Overview Biogas is a renewable energy source, produced by fermentation of organic matter. Expected CAGR 2018-2024 is 6%* Number of biogas plants per 1 Mio capita in European countries in 2017 * https://www.statista.com/statistics/480452/market-value-of-waste-to-energy-globally-projection/ http://european-biogas.eu/2019/02/01/eba-annual-report-2019/ 136.1 53 5.8 25.9 19.9 11.1 4.2 8.0 8.2 12
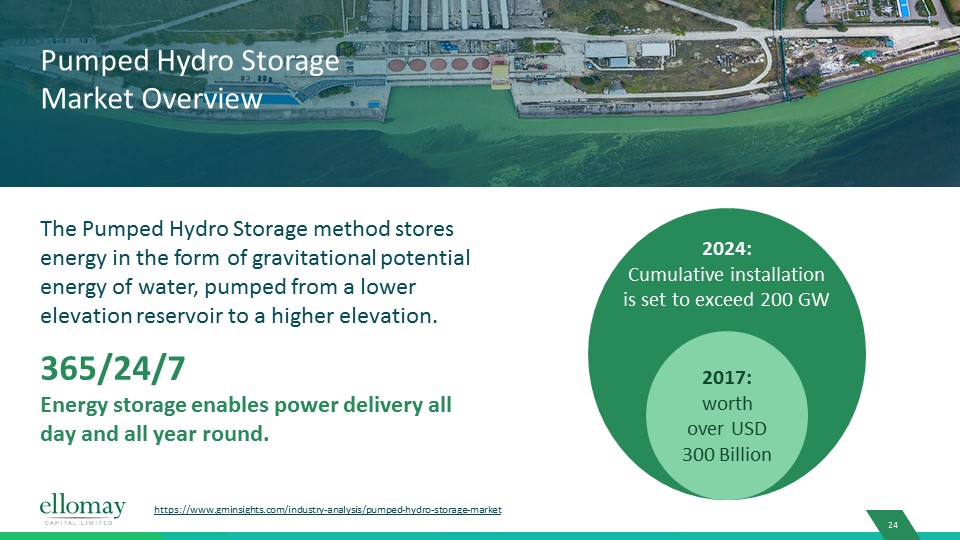
The Pumped Hydro Storage method stores energy in the form of gravitational potential energy of water, pumped from a lower elevation reservoir to a higher elevation.365/24/7Energy storage enables power delivery all day and all year round. Pumped Hydro Storage Market Overview https://www.gminsights.com/industry-analysis/pumped-hydro-storage-market 24 2017:worth over USD 300 Billion 2024:Cumulative installation is set to exceed 200 GW
THANK YOUFor further Info:Ran Fridrich, CEO: ranf@ellomay.comKalia Weintraub, CFO: kaliaw@ellomay.com www.ellomay.com

Appendix A – Adjusted EBITDA and Adjusted FFO Adjusted EBITDA and Adjusted FFO are non-IFRS measures. EBITDA is defined as earnings before financial expenses, net, taxes, depreciation and amortization and FFO (funds from operations) is calculated by adding tax and financing expenses to EBITDA. The Company uses the terms “Adjusted EBITDA” and “Adjusted FFO” to highlight the fact that the Company presents the revenues from the Talmei Yosef PV plant under the fixed asset mode and not under IFRIC 12, presents its share in Dorad based on distributions of profit and not on the basis of equity gain using the equity method and deducts the profit from the sale of its Italian PV portfolio in the calculation of Adjusted EBITDA. The Company presents these measures in order to enhance the understanding of the Company’s operating performance and to enable comparability between periods. While the Company considers these non-IFRS measures to be important measures of comparative operating performance, these non-IFRS measures should not be considered in isolation or as a substitute for net income or other statement of operations or cash flow data prepared in accordance with IFRS as a measure of profitability or liquidity. These non-IFRS measures do not take into account our commitments, including capital expenditures and restricted cash and, accordingly, are not necessarily indicative of amounts that may be available for discretionary uses. In addition, Adjusted FFO does not represent and is not an alternative to cash flow from operations as defined by IFRS and is not an indication of cash available to fund all cash flow needs, including the ability to make distributions. Not all companies calculate Adjusted EBITDA or Adjusted FFO in the same manner, and the measures as presented may not be comparable to similarly-titled measures presented by other companies. Our actual Adjusted EBITDA and Adjusted FFO may not be indicative of our historic operating results; nor is it meant to be predictive of potential future results. The Company uses these measures internally as performance measures and believes that when these measures are combined with IFRS measures they add useful information concerning the Company’s operating performance. A reconciliation between measures on an IFRS and non-IFRS basis is provided in this slide. Use of NON-IFRS Financial Measures Reconciliation of Net Income (loss) to Adjusted EBITDA & Adjusted FFO (in € millions) 2020 (E) 2021 (E) 2022 (E) 2023 (E) Net income (loss) for the period, adjusted as set forth in the notes below (0.2) 7-8 11-12 17-18 Interest on bank loans and others 3.7 10-11 12-13 13-14 Taxes on income 0.1 1-2 1-2 3-4 Depreciation 2.9 10-11 13-14 17-18 Adjusted EBITDA 6.5�� 28-32 37-41 50-54 Interest on bank loans and others (3.7) (10-11) (12-13) (13-14) Taxes on income (0.1) (1-2) (1-2) (3-4) Adjusted FFO 2.7 17-19 24-26 34-36 The PV Plant located in Talmei Yosef, Israel is presented under the fixed asset model and not under the financial asset model as per IFRIC 12. The company’s share in Dorad is presented based on distributions of profits and not on the basis of equity gain using the equity method The forecast assumes the commencement of operations of the Talasol PV plant during Q4/ 2020. The expected revenues, Adjusted EBITDA and FFO include minority holdings. Adjusted FFO is presented after projects and corporate financing and tax expenses.
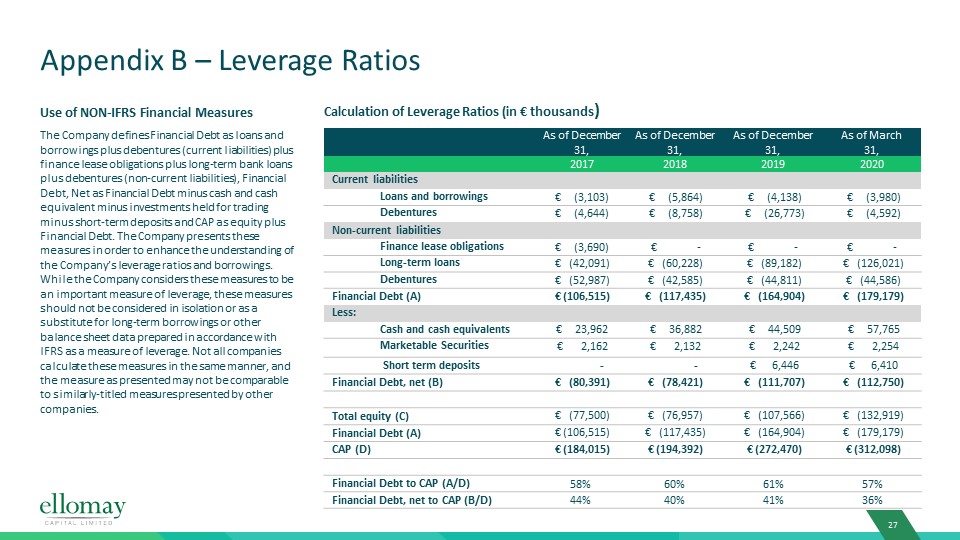
As of December 31, As of December 31, As of December 31, As of March 31, 2017 2018 2019 2020 Current liabilities Loans and borrowings € (3,103) € (5,864) € (4,138) € (3,980) Debentures € (4,644) € (8,758) € (26,773) € (4,592) Non-current liabilities Finance lease obligations € (3,690) € - € - € - Long-term loans € (42,091) € (60,228) € (89,182) € (126,021) Debentures € (52,987) € (42,585) € (44,811) € (44,586) Financial Debt (A) € (106,515) € (117,435) € (164,904) € (179,179) Less: Cash and cash equivalents € 23,962 € 36,882 € 44,509 € 57,765 Marketable Securities € 2,162 € 2,132 € 2,242 € 2,254 Short term deposits - - € 6,446 € 6,410 Financial Debt, net (B) € (80,391) € (78,421) € (111,707) € (112,750) Total equity (C) € (77,500) € (76,957) € (107,566) € (132,919) Financial Debt (A) € (106,515) € (117,435) € (164,904) € (179,179) CAP (D) € (184,015) € (194,392) € (272,470) € (312,098) Financial Debt to CAP (A/D) 58% 60% 61% 57% Financial Debt, net to CAP (B/D) 44% 40% 41% 36% Appendix B – Leverage Ratios The Company defines Financial Debt as loans and borrowings plus debentures (current liabilities) plus finance lease obligations plus long-term bank loans plus debentures (non-current liabilities), Financial Debt, Net as Financial Debt minus cash and cash equivalent minus investments held for trading minus short-term deposits and CAP as equity plus Financial Debt. The Company presents these measures in order to enhance the understanding of the Company’s leverage ratios and borrowings. While the Company considers these measures to be an important measure of leverage, these measures should not be considered in isolation or as a substitute for long-term borrowings or other balance sheet data prepared in accordance with IFRS as a measure of leverage. Not all companies calculate these measures in the same manner, and the measure as presented may not be comparable to similarly-titled measures presented by other companies. Use of NON-IFRS Financial Measures Calculation of Leverage Ratios (in € thousands)
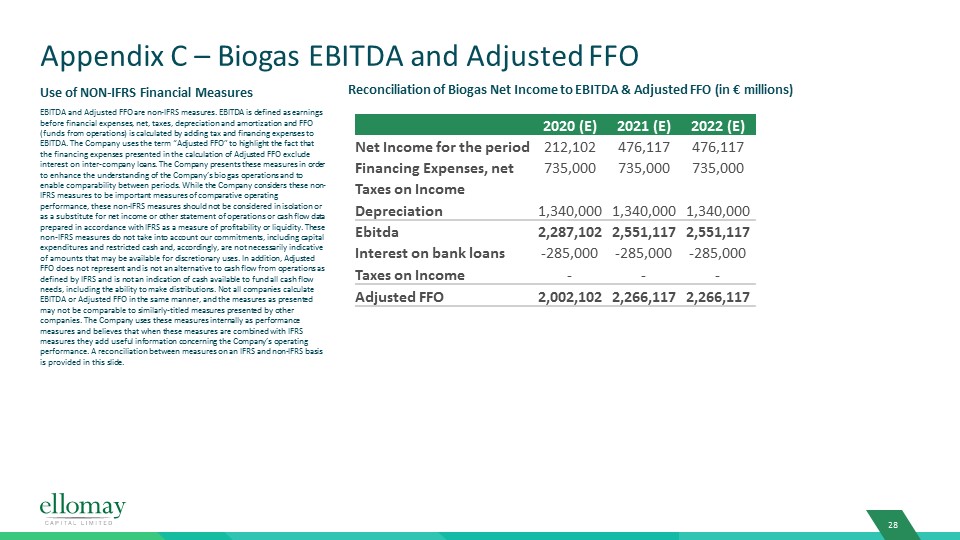
Appendix C – Biogas EBITDA and Adjusted FFO EBITDA and Adjusted FFO are non-IFRS measures. EBITDA is defined as earnings before financial expenses, net, taxes, depreciation and amortization and FFO (funds from operations) is calculated by adding tax and financing expenses to EBITDA. The Company uses the term “Adjusted FFO” to highlight the fact that the financing expenses presented in the calculation of Adjusted FFO exclude interest on inter-company loans. The Company presents these measures in order to enhance the understanding of the Company’s bio gas operations and to enable comparability between periods. While the Company considers these non-IFRS measures to be important measures of comparative operating performance, these non-IFRS measures should not be considered in isolation or as a substitute for net income or other statement of operations or cash flow data prepared in accordance with IFRS as a measure of profitability or liquidity. These non-IFRS measures do not take into account our commitments, including capital expenditures and restricted cash and, accordingly, are not necessarily indicative of amounts that may be available for discretionary uses. In addition, Adjusted FFO does not represent and is not an alternative to cash flow from operations as defined by IFRS and is not an indication of cash available to fund all cash flow needs, including the ability to make distributions. Not all companies calculate EBITDA or Adjusted FFO in the same manner, and the measures as presented may not be comparable to similarly-titled measures presented by other companies. The Company uses these measures internally as performance measures and believes that when these measures are combined with IFRS measures they add useful information concerning the Company’s operating performance. A reconciliation between measures on an IFRS and non-IFRS basis is provided in this slide. Use of NON-IFRS Financial Measures Reconciliation of Biogas Net Income to EBITDA & Adjusted FFO (in € millions) 2020 (E) 2021 (E) 2022 (E) Net Income for the period 212,102 476,117 476,117 Financing Expenses, net 735,000 735,000 735,000 Taxes on Income Depreciation 1,340,000 1,340,000 1,340,000 Ebitda 2,287,102 2,551,117 2,551,117 Interest on bank loans -285,000 -285,000 -285,000 Taxes on Income - - - Adjusted FFO 2,002,102 2,266,117 2,266,117