Exhibit 99.1

Integrated Developer, Owner and Operator of Renewable Energy Projects Investors Presentation – November 2021

General:The information contained in this presentation is subject to, and must be read in conjunction with, all other publically available information, including our Annual Report on Form 20-F for the year ended December 31, 2020, and other filings that we make from time to time with the SEC. Any person at any time acquiring securities must do so only on the basis of such person’s own judgment as to the merits or the suitability of the securities for its purpose and only based on such information as is contained in such public filings, after having taken all such professional or other advice as it considers necessary or appropriate in the circumstances and not in reliance on the information contained in the presentation. In making this presentation available, we give no advice and make no recommendation to buy, sell or otherwise deal in our shares or in any other securities or investments whatsoever. We do not warrant that the information is either complete or accurate, nor will we bear any liability for any damage or losses that may result from any use of the information.Neither this presentation nor any of the information contained herein constitute an offer to sell or the solicitation of an offer to buy any securities. No offering of securities shall be made in the United States except pursuant to registration under the U.S. Securities Act of 1933, as amended, or an exemption therefrom. No offering of securities shall be made in Israel except pursuant to an effective prospectus under the Israeli Securities Law, 1968 or an exemption from the prospectus requirements under such law.Historical facts and past operating results are not intended to mean that future performances or results for any period will necessarily match or exceed those of any prior year.This presentation and the information contained herein are the sole property of the Company and cannot be published, circulated or otherwise used in any way without our express prior written consent.Information Relating to Forward-Looking Statements:This presentation contains forward-looking statements that involve substantial risks and uncertainties. All statements, other than statements of historical facts, included in this presentation regarding our plans, the objectives of management and projections of results are forward-looking statements. Such forward looking statements include projected financial information. Such forward looking statements with respect to revenues, earnings, performance, strategies, prospects and other aspects of the business of the Company are based on current expectations that are subject to risks and uncertainties, including risks relating to the ability to procure financing for such projects, delays in construction, inability to obtain permits, timely or at all and are based on the current government tariff and/or commercial agreements relating to each project and on the current or expected licenses and permits of each project. In addition, the details, including projections, concerning projects that are under development or early stage development that are included in the presentation are based on the current internal assessments of the Company’s management and there is no certainty or assurance as to the ability of the Company to advance or complete these projects as the advancement of such projects requires, among other things, approvals, land rights, permits and financing (both equity and project financing). The use of certain words, including the words “estimate,” “project,” “intend,” “expect”, ”plan”, “believe,” “will” and similar expressions are intended to identify forward-looking statements within the meaning of the Private Securities Litigation Reform Act of 1995 and the Israeli Securities Law, 1968. We may not actually achieve the plans, intentions or expectations disclosed in our forward-looking statements and you should not place undue reliance on our forward-looking statements. Various important factors could cause actual results or events to differ materially from those that may be expressed or implied by our forward-looking statements, including changes in the regulation and climate, inability to obtain financing required for the development and construction of projects, delays in the commencement of operations of the projects under development, limited scope of projects identified for future development, our inability to reach the milestones required under the conditional license of the Manara project, delays in the development and construction of other projects under development and the impact of the Covid-19 pandemic on the Company’s operations and projects, including in connection with steps taken by authorities in countries in which the Company operates, changes in the market prices of electricity and in demand, regulatory changes, changes in the supply and prices of resources required for the operation of the Company’s facilities (such as waste and natural gas) and in the price of oil, technical and other disruptions in the operations or construction of the power plants owned by the Company. These and other risks and uncertainties associated with our business are described in greater detail in the filings we make from time to time with SEC, including our Annual Report on Form 20-F. The forward-looking statements are made as of this date and we do not undertake any obligation to update any forward-looking statements, whether as a result of new information, future events or otherwise. 2 Disclaimers

Investor Highlights Financial and technological expertiseRenewable energy as a long term, adaptable business 3 Trusted by financial institutes and banks From development to operation Active in various markets and locations Ongoing growth with conservative leverage ratios Public company traded in TASE & NYSE American for 1,277M NIS as of November 16, 2021
Our Vision To be ahead of the curve in green energy generation and storage technologies. To be a profitable and sustainable business based on enhanced financing strategies and advanced technological expertise. To provide comprehensive solutions, from development to operation, enabling a stable supply of renewable energy from varied sources. To protect the environment and benefit society by providing clean and cheap energy from renewable sources. 4

Continuous growthGrowing our renewable energy and power generation activities– from development tooperation – in Europe and Israel. Constant cash flowCreating continuous cash flow from various assets in diverse renewable energy and energy storage applications. Monetary PolicyMaintaining conservative leverage ratios and monetary strength. Our ObjectivesEnergy Revolution as a Long-Term, Profitable Business 5

Business Development Roadmap Talasol, Spain – Signed a PPA for 80% of the expected output 6 Sold 49% of Talasol 2019 2020 Talasol entered into financing agreements with Deutsche Bank and EIB Commercial operation of second biogas project in the Netherlands Financial closing and start construction in Talasol Sold 22.6 MW Italian PV portfolio with profit of ~ 19Mil € Executed 2 Framework Agreements for the Development of 515 MW PV Projects in Italy Acquired remaining 49%of NL biogas projects Talasol connection tothe grid (December 2020) Won 20 MW PV + storage in a quota tender process published by the Israeli Electricity Authority Project includes:40 MWH DC power80 MWH battery storage Acquired Gelderland biogas project in the Netherlands, with a permit to produce~ 7.5 million Nm3 per year and actual production capacity of ~ 9.5 million Nm3 per year 2018 2021 Financial closing Manara Pumped Storage Project ((PSP) (February 2021 Manara PSP, Notice to proceed to the EPC (contractor (April 2021 28 MW PV project, SpainNotice to proceed (June 7, 2021) 20 MW PV in Italy expected to be ready for construction by end of year439 MW PV in Italy in advanced development stage

Financial Forecast (in million of Euro) 2021 (E) 2022 (E) 2023 (E) 2024 (E) 7 Revenues 46-49 55-58 75-77 85-89 Adjusted EBITDA from projects 30-31 38-39 53-55 60-62 Adjusted EBITDA 25-26 33-34 48-50 55-57 Adjusted FFO from projects 21-22 28-29 39-40 44-45 Adjusted FFO 13-14 19-20 30-31 35-36 Net Profit 0 3 8 10 The PV Plant located in Talmei Yosef, Israel is presented under the fixed asset model and not under the financial asset model as per IFRIC 12. Including the Company's share in Dorad. The Company’s share in Dorad is presented based on expected distributions of profits and not on the basis of equity gain using the equity method.The Talasol PV plant’s expected revenues, Adjusted EBITDA and Adjusted FFO include minority holdings.Adjusted FFO is presented after projects and corporate financing and tax expenses. See Appendix A for reconciliation and disclosure regarding the use of non-IFRS financial measures • • Expected construction 332 MW PV * There may be a transition of approximately 70 MW from 2022 to 2021 • •

Development Projects – Growth 8 Early Stage Development 850 MW Under Advanced Development 479 MW Italy+ Spain - aggregated 850 MW PV Israel - 40 MW PV + Storage Under / Ready for Construction 204 MW Connected to the grid 416 MW Dorad Power Station Manara Cliff, Pumped Storage - 156 MW Italy - 439 MW PV Italy - 20 MW PV Spain - 28 MW PV Biogas - Netherlands PV - Spain & Israel For 100% holding (other than Dorad for which only the Company’s share is presented).
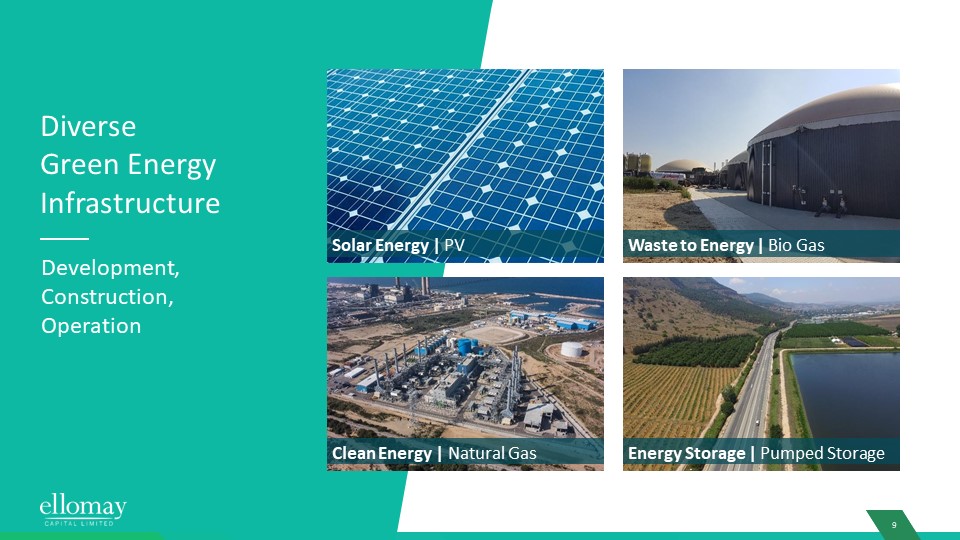
Diverse Green Energy Infrastructure Development, Construction, Operation Solar Energy | PV 9 Waste to Energy | Bio Gas Clean Energy | Natural Gas Energy Storage | Pumped Storage

10 Projects Summary (EUR Millions) Projects %Ownership License MW Expected Distribution in 2021 Expected Annual Revenues in 2021 Expected Annual Adjusted EBITDA in 2021 Expected Annual Adjusted FFO in 2021 Expected Debt as of December 31, 2021 Expected interest on bank loans in 2021 Expected Cash flow in 2021 Connected to the grid and operating Spain – Talasol PV 51% 300 MW 23-25 (*) 17-18 (*) 11 (*) 130 (*) 3.7 (*) 4.0 (*) Spain – 4 PV 100% 2041 7.9 MW 2.9 2.0 1.5 14.4 0.4 0.5 Israel – Talmei Yosef PV(1) 100% 2033 9 MW 4.2 3.6 2.8 16 0.8 1.0 The Netherlands-Biogas 100% 2031 19 MW baseload equal to 1,800 m3/h gas production 13 4.0 3.6 14 0.4 2.0 Israel – Dorad (based on 2020reports) (2) ~9.4% 2034 860 MW (the company’s share is ~ 80 MW) 3.0 57 13 - - - 3.0 Total Installed 416 MW (1) The PV Plant located in Talmei Yosef, Israel is presented under the fixed asset model and not under the financial asset model as per IFRIC 12(2) The figures represent the Company’s share See Appendix A for reconciliation and disclosure regarding the use of non-IFRS financial measures * For 100% holding. The Company’s share is 51%
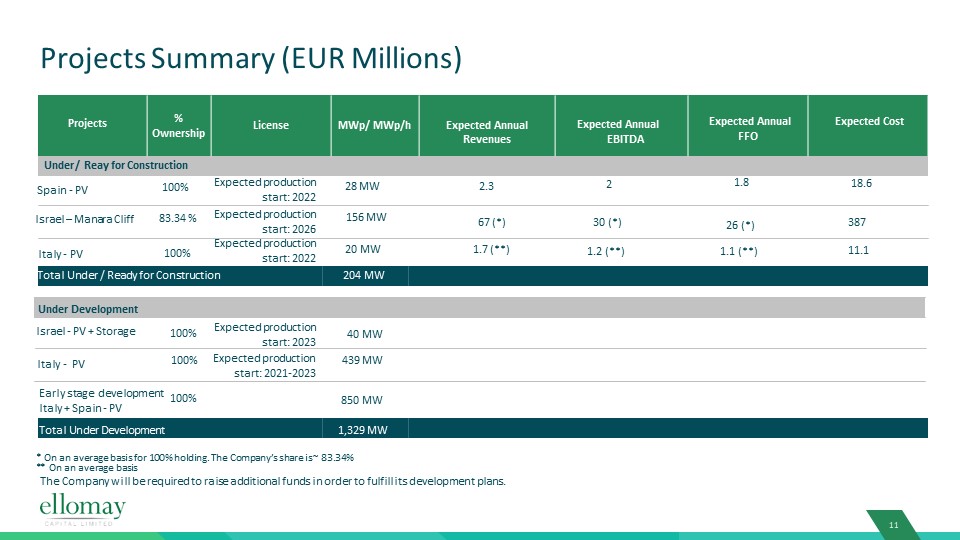
Projects Summary (EUR Millions) %Ownership License MWp/ MWp/h Expected Annual Revenues Under / Reay for Construction Spain -PV 11 100% Expected production start: 2022 28 MW Israel – Manara Cliff 83.34 % Expected production start: 2026 156 MW Under Development Israel - PV + Storage 100% Expected production start: 2023 40 MW Italy - PV 100% Expected productionstart: 2021-2023 439 MW Early stage development Italy + Spain - PV 100% 850 MW Total Under Development 1,329 MW * On an average basis for 100% holding. The Company’s share is ~ 83.34% Projects Expected Annual EBITDA 2.3 67 (*) 30 (*) 2 204 MW Total Under / Ready for Construction Italy - PV 100% Expected production start: 2022 20 MW 1.7 (**) 1.2 (**) The Company will be required to raise additional funds in order to fulfill its development plans. ** On an average basis Expected Annual FFO Expected Cost 1.8 18.6 1.1 (**) 26 (*) 387 11.1

12 G.G.GELDERLAND Acquired December 2020 Production License : 7.5 MIL M3 gas Per/year

Waste-to-Energy (Biogas) Projects 13 EUR Millions 2021 (E) 2022 (E) 2023 (E) Revenues 15 15 Cost of Sale -6.8 -6.8 Gross Margin 8.2 8.5 Opex -3.1 -3 Ebitda 4 5.1 5.3 Interest on bank loans -0.4 -0.4 -0.4 Taxes on income - - - Adjusted FFO 4.7 4.9 See Appendix C for reconciliation and disclosure regarding the use of non-IFRS financial measures 13 -6.4 6.6 -2.6 3.6
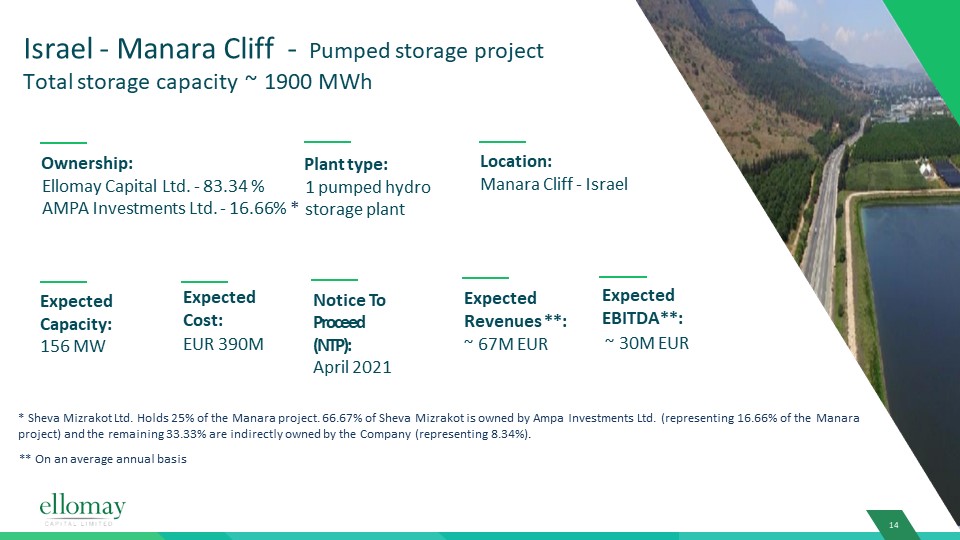
Israel - Manara Cliff- Pumped storage projectTotal storage capacity ~ 1900 MWh Expected Capacity: 156 MW Location:Manara Cliff - Israel Expected Cost:EUR 390M Ownership:Ellomay Capital Ltd. - 83.34 % AMPA Investments Ltd. - 16.66% * Plant type:1 pumped hydro storage plant Notice To Proceed (NTP):April 2021 14 Expected EBITDA**: 30M EUR ~ Expected Revenues **: 67M EUR ~ * Sheva Mizrakot Ltd. Holds 25% of the Manara project. 66.67% of Sheva Mizrakot is owned by Ampa Investments Ltd. (representing 16.66% of the Manara project) and the remaining 33.33% are indirectly owned by the Company (representing 8.34%). ** On an average annual basis
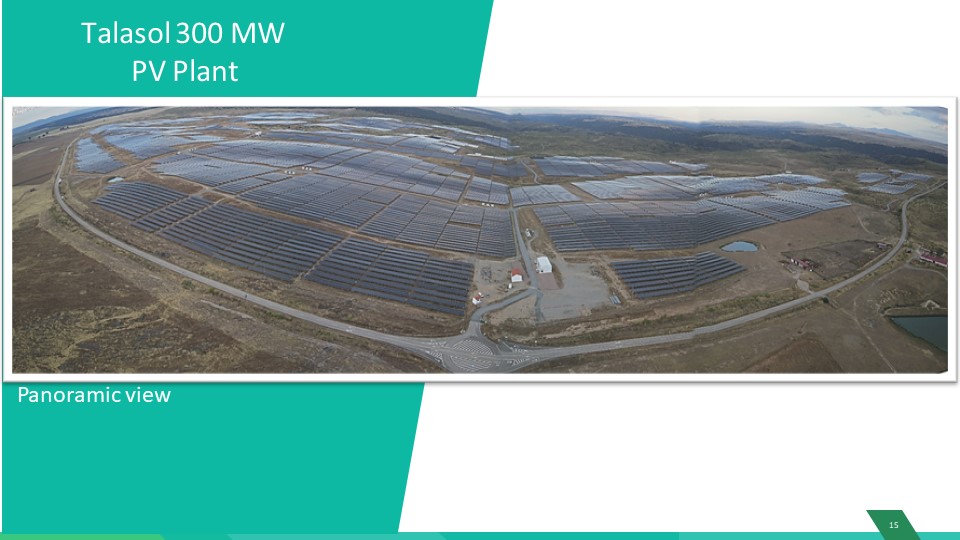
15 Talasol 300 MW PV Plant Panoramic view

Spain – Talasol Business strategy and timeline: Acquired:2017 Capacity:300 MW Plant type:1 PV plant Starting power production: December 2020 Location:Talaván, Cáceres, Spain Final Cost: 227M EUR Expected Annual Revenue:EUR 23-25M June 2018: METKA –procurement and engineering agreement June 2018:PPA agreement, 80% for 10 years July 2018: Interest hedging GOLDMAN SACHS December 2018: Financing from DEUTSCHE BANK and EIB –EUR 131 Million April 2019:Sold 49% of Talasol Equity for EUR 16.1 M and start of construction December 2020: Connection to the gridPreliminary Acceptance Certificate (PAC) January 27, 2021 16 * Forecast is provided for 100% holding (the Company’s share is 51%)
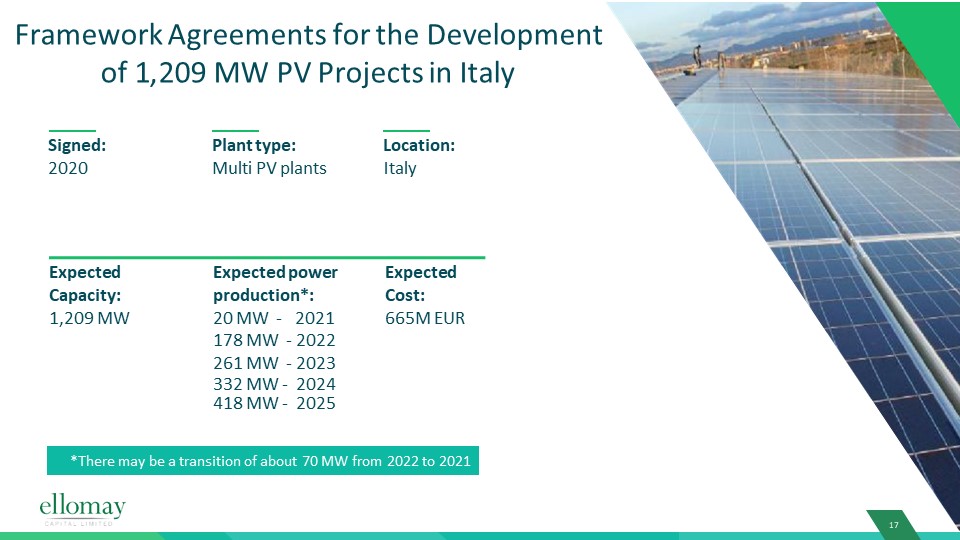
Framework Agreements for the Development of 1209, MW PV Projects in Italy Expected Capacity: Expected power production*: Expected Cost: 1,209 MW 20 MW - 2021 665M EUR 178 MW - 2022 261 MW - 2023 332 MW - 2024418 MW - 2025 Location:Italy Signed:2020 Plant type:Multi PV plants 17 *There may be a transition of about 70 MW from 2022 to 2021
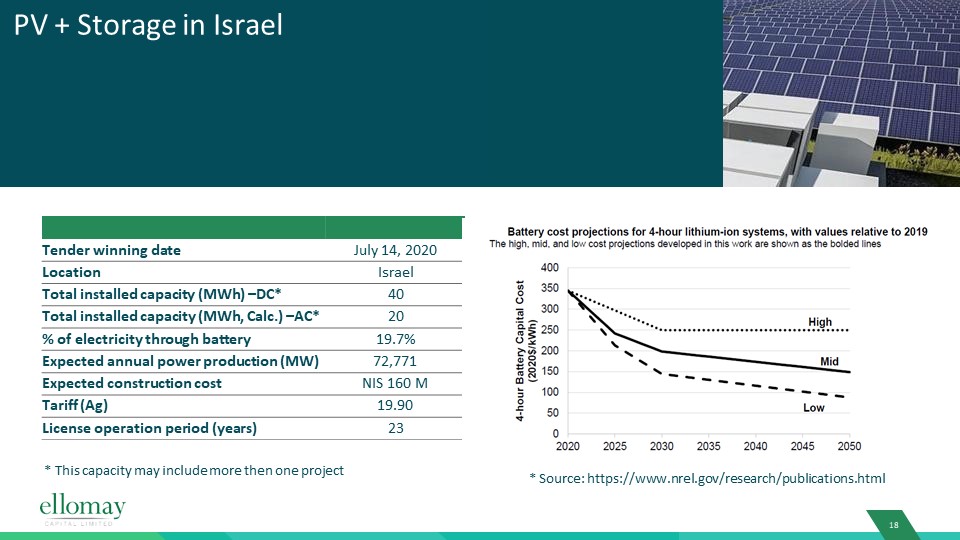
Tender winning date July 14, 2020 Location Israel Total installed capacity (MWh) –DC* 40 Total installed capacity (MWh, Calc.) –AC* 20 % of electricity through battery 19.7% Expected annual power production (MW) 72,771 Expected construction cost NIS 160 M Tariff (Ag) 19.90 License operation period (years) 23 * This capacity may include more then one project * Source: https://www.nrel.gov/research/publications.html PV + Storage in Israel 18

Key Balance Sheet Figures 19 December 31,2017 % Of BS December 31,2018 % Of BS December 31,2019 % Of BS December 31,2020 % Of BS Cash and cash equivalent, deposits and marketable securities 26,124 13% 39,014 18% 53,197 17% 76,719 17% Financial Debt* 106,515 54% 117,435 56% 164,904 53% 280,893 61% Financial Debt, net* 80,391 41% 78,421 37% 111,707 36% 204,174 44% Property, plant and equipment net (mainly in connection with PV Operations) 78,837 40% 87,220 41% 114,389 37% 264,095 57% Investment in Dorad 30,820 16% 28,161 13% 33,561 11% 32,234 7% CAP* 184,015 93% 194,392 92% 272,470 88% 405,919 88% Total equity 77,500 39% 76,957 36% 107,566 35% 125,026 27% Total assets 198,088 100% 211,160 100% 310,172 100% 460,172 100% * See Appendix B for calculations (EUR thousands)
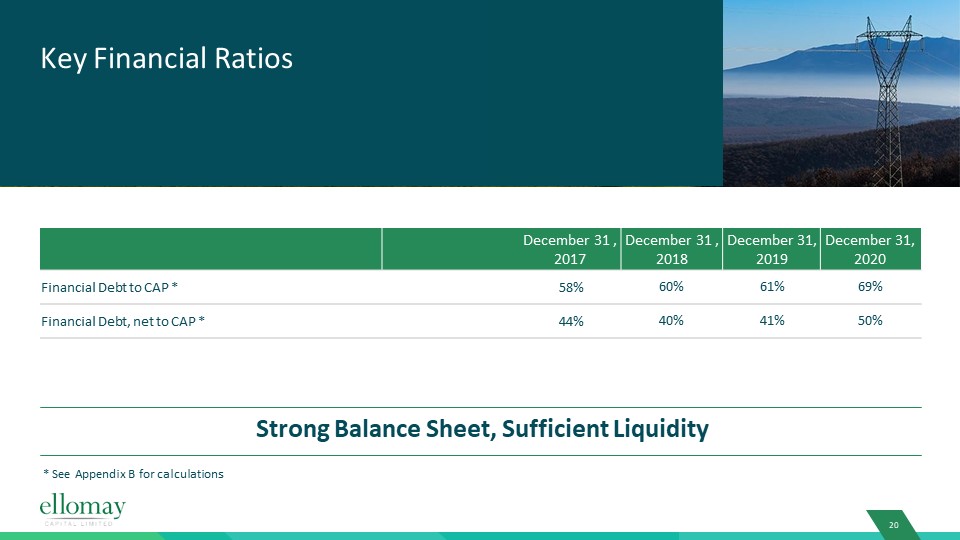
Key Financial Ratios December 31 ,2017 December 31 ,2018 December 31,2019 December 31,2020 Financial Debt to CAP * 58% 60% 61% 69% Financial Debt, net to CAP * 44% 40% 41% 50% * See Appendix B for calculations Strong Balance Sheet, Sufficient Liquidity 20
Summary Renewable energy industry enjoys favorable business prognosis and supportive regulation Competitive pricing, no need for governmentalsubsidizing High segmental and geographic diversity. Revenue not dependent on a specific project Long term agreements reduce demand market risk Value based financing policy with conservative leverage, high capital and investment ratios Continuous growth. Sustainable, proven business experience 21

22 Israel - Renewable Energy Production Goals 5.00% 10% 20% 30% 35.00%30.00%25.00%20.00%15.00%10.00%5.00%0.00% 2025 2030 2.26%Actually produced Expected to increase to 25-30% by 2030 2020 2014

The Photo-Voltaic effect enables conversion of light into electricity using semiconductors. IEA:PV expected todoubleuntil 2023 The Photo-Voltaic Market Overview https://www.iea.org/renewables2018/ ©OECD/IEA Bioenergy Solar Thermal 23 Hydropower Geothermal Wind Marine Solar PV Renewable energy consumption by technology, 2017-2023

Waste-to-Energy Market Overview Biogas is a renewable energy source, produced by fermentation of organic matter. Expected CAGR 2018-2024 is 6%* Number of biogas plants per 1 Mio capita in European countries in 2017 28.43 30.14 31.95 33.87 35.9 38.05 40.33 2017 2018 2019 2020 2021 2022 2023 136.1 24 53 5.8 19.9 11.1 4.2 8.0 8.2 25.912 * https://www.statista.com/statistics/480452/market-value-of-waste-to-energy-globally-projection/ http://european-biogas.eu/2019/02/01/eba-annual-report-2019/
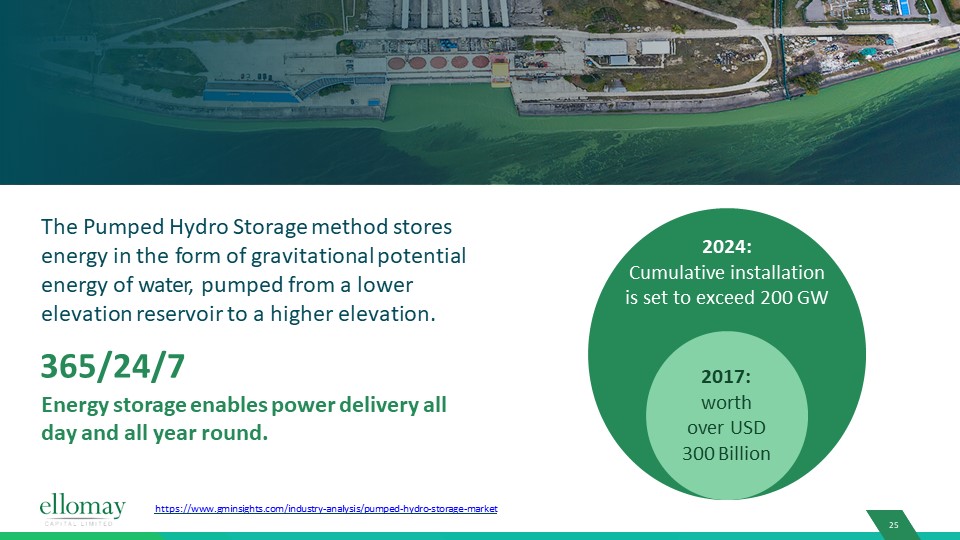
The Pumped Hydro Storage method stores energy in the form of gravitational potential energy of water, pumped from a lower elevation reservoir to a higher elevation. 365/24/7Energy storage enables power delivery all day and all year round. Pumped Hydro Storage Market Overview https://www.gminsights.com/industry-analysis/pumped-hydro-storage-market 2017:worth over USD 300 Billion 25 2024:Cumulative installationis set to exceed 200 GW
THANK YOU For further Info:Ran Fridrich, CEO: ranf@ellomay.comKalia Rubenbach, CFO: kaliaw@ellomay.comwww.ellomay.com

Appendix A – Adjusted EBITDA and Adjusted FFO 27 Use of NON-IFRS Financial MeasuresAdjusted EBITDA and Adjusted FFO are non-IFRS measures. EBITDA is defined as earnings before financial expenses, net, taxes, depreciation and amortization and FFO (funds from operations) is calculated by adding tax and financing expenses to EBITDA. The Company uses the terms “Adjusted EBITDA” and “Adjusted FFO” to highlight the fact that the Company presents the revenues from the Talmei Yosef PV plant under the fixed asset model and not under IFRIC 12 and presents its share in Dorad based on distributions of profit and not on the basis of equity gain using the equity method in the calculation of Adjusted EBITDA. The Company presents these measures in order to enhance the understanding of the Company’s operating performance and to enable comparability between periods. While the Company considers these non-IFRS measures to be important measures of comparative operating performance, these non-IFRS measures should not be considered in isolation or as a substitute for net income or other statement of operations or cash flow data prepared in accordance with IFRS as a measure of profitability or liquidity. These non-IFRS measures do not take into account our commitments, including capital expenditures and restricted cash and, accordingly, are not necessarily indicative of amounts that may be available for discretionary uses. In addition, Adjusted FFO does not represent and is not an alternative to cash flow from operations as defined by IFRS and is not an indication of cash available to fund all cash flow needs, including the ability to make distributions. Not all companies calculate Adjusted EBITDA or Adjusted FFO in the same manner, and the measures as presented may not be comparable to similarly-titled measures presented by other companies. Our actual Adjusted EBITDA and Adjusted FFO may not be indicative of our historic operating results; nor is it meant to be predictive of potential future results. The Company uses these measures internally as performance measures and believes that when these measures are combined with IFRS measures they add useful information concerning the Company’s operating performance. A reconciliation between measures on an IFRS and non-IFRS basis is provided in this slide. Reconciliation of Net Income to Adjusted EBITDA & Adjusted FFO (in € millions) 2021 (E) 2022 (E) 2023 (E) 2024 (E) Net income for the period, adjusted as set forth in the notes below 0 3 8 10 Interest on bank loans, debentures and others 12 13 15-16 16-17 Taxes on income 0 ~ 1 3 4 Depreciation 13-14 16-17 22-23 25-26 Adjusted EBITDA 25-26 33-34 48-50 55-57 Interest on bank loans, debentures and others (12) (13) (15-16) (16-17) Taxes on income (0 ~) (1) (3) (4) Adjusted FFO 13-14 19-20 30-31 35-36 The PV Plant located in Talmei Yosef, Israel is presented under the fixed asset model and not under the financial asset model as per IFRIC 12.The company’s share in Dorad is presented based on distributions of profits and not on the basis of equity gain using the equity method.The expected revenues, Adjusted EBITDA and FFO of the Talasol PV plant include minority holdings.Adjusted FFO is presented after projects and corporate financing and tax expenses. • • • • Adjusted EBITDA 25-26 33-34 48-50 55-57 G&A corporate and project development costs 5 5 5 5 Adjusted EBITDA from projects 30-31 38-39 53-55 60-62 Adjusted FFO 13-14 19-20 30-31 35-36 G&A corporate and project development costs 5 5 5 5 Interest on debentures 3 4 4 4 Adjusted FFO from projects 21-22 28-29 39-40 44-45
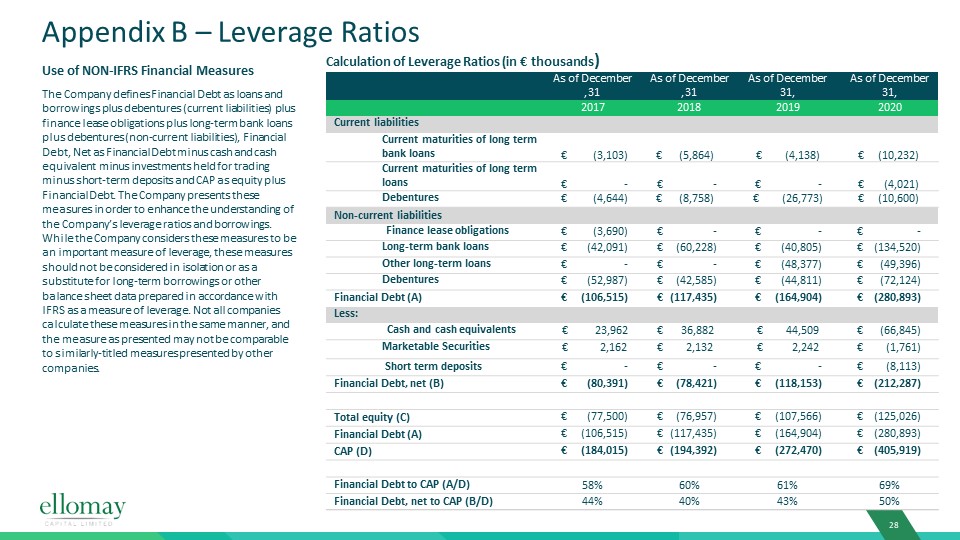
As of December31, As of December31, As of December31, As of December31, 2017 2018 2019 2020 Current liabilities Current maturities of long term bank loans € (3,103) € (5,864) € (4,138) € (10,232) Current maturities of long term loans € - € - € - € (4,021) Debentures € (4,644) € (8,758) € (26,773) € (10,600) Non-current liabilities Finance lease obligations € (3,690) € - € - € - Long-term bank loans € (42,091) € (60,228) € (40,805) € (134,520) Other long-term loans € - € - € (48,377) € (49,396) Debentures € (52,987) € (42,585) € (44,811) € (72,124) Financial Debt (A) € (106,515) € (117,435) € (164,904) € (280,893) Less: Cash and cash equivalents € 23,962 € 36,882 € 44,509 € (66,845) Marketable Securities € 2,162 € 2,132 € 2,242 € (1,761) Short term deposits € - € - € - € (8,113) Financial Debt, net (B) € (80,391) € (78,421) € (118,153) € (212,287) Total equity (C) € (77,500) € (76,957) € (107,566) € (125,026) Financial Debt (A) € (106,515) € (117,435) € (164,904) € (280,893) CAP (D) € (184,015) € (194,392) € (272,470) € (405,919) Financial Debt to CAP (A/D) 58% 60% 61% 69% Financial Debt, net to CAP (B/D) 44% 40% 43% 50% 28 Appendix B – Leverage Ratios Use of NON-IFRS Financial MeasuresThe Company defines Financial Debt as loans and borrowings plus debentures (current liabilities) plus finance lease obligations plus long-term bank loans plus debentures (non-current liabilities), Financial Debt, Net as Financial Debt minus cash and cash equivalent minus investments held for trading minus short-term deposits and CAP as equity plus Financial Debt. The Company presents these measures in order to enhance the understanding of the Company’s leverage ratios and borrowings.While the Company considers these measures to be an important measure of leverage, these measures should not be considered in isolation or as a substitute for long-term borrowings or other balance sheet data prepared in accordance with IFRS as a measure of leverage. Not all companies calculate these measures in the same manner, and the measure as presented may not be comparable to similarly-titled measures presented by other companies. Calculation of Leverage Ratios (in € thousands)

Appendix C – Biogas EBITDA and Adjusted FFO 29 Use of NON-IFRS Financial MeasuresEBITDA and Adjusted FFO are non-IFRS measures. EBITDA is defined as earnings before financial expenses, net, taxes, depreciation and amortization and FFO (funds from operations) is calculated by adding tax and financing expenses to EBITDA. The Company uses the term “Adjusted FFO” to highlight the fact that the financing expenses presented in the calculation of Adjusted FFO exclude interest on inter-company loans. The Company presents these measures in order to enhance the understanding of the Company’s bio gas operations and to enable comparability between periods. While the Company considers these non- IFRS measures to be important measures of comparative operating performance, these non-IFRS measures should not be considered in isolation or as a substitute for net income or other statement of operations or cash flow data prepared in accordance with IFRS as a measure of profitability or liquidity. These non-IFRS measures do not take into account our commitments, including capital expenditures and restricted cash and, accordingly, are not necessarily indicative of amounts that may be available for discretionary uses. In addition, Adjusted FFO does not represent and is not an alternative to cash flow from operations as defined by IFRS and is not an indication of cash available to fund all cash flow needs, including the ability to make distributions. Not all companies calculate EBITDA or Adjusted FFO in the same manner, and the measures as presented may not be comparable to similarly-titled measures presented by other companies. The Company uses these measures internally as performance measures and believes that when these measures are combined with IFRS measures they add useful information concerning the Company’s operating performance. A reconciliation between measures on an IFRS and non-IFRS basis is provided in this slide. Reconciliation of Biogas Net Income to EBITDA & Adjusted FFO (in € millions) 2021 (E) 2022 (E) 2023 (E) Net Income for the period 0.4 1.4 1.6 Financing Expenses, net 1.3 1.3 1.3 Taxes on Income - - - Depreciation 2.3 2.4 2.4 Ebitda 4 5.1 5.3 Interest on bank loans -0.4 -0.4 -0.4 Taxes on Income - - - Adjusted FFO 3.6 3.8 4