Table of Contents
Page
INTRODUCTION
The following is the Report on Form 20-F of Ellomay Capital Ltd., or the Report. Unless the context in which such terms are used would require a different meaning, all references to “Ellomay,” “us,” “we,” “our” or the “Company” refer to Ellomay Capital Ltd. and its consolidated subsidiaries.
All references to “€,” “euro” or “EUR” are to the legal currency of the European Union, or EU, all references to “NIS” or “New Israeli Shekel” are to the legal currency of Israel and all references to “$,” “dollar,” “US$,” “USD” or “U.S. dollar” are to the legal currency of the United States of America. Other than as specifically noted, all amounts translated into a different currency were translated based on the relevant exchange rate as of December 31, 2021.
We prepare our consolidated financial statements in accordance with International Financial Reporting Standards, or IFRS, as issued by the International Accounting Standards Board, or IASB.
All trademarks, service marks, trade names and registered marks used in this Report are trademarks, trade names or registered marks of their respective owners.
Statements made in this Report concerning the contents of any agreement, contract or other document are summaries of such agreements, contracts or documents and are not complete description of all of their terms. If we filed any of these agreements, contracts or documents as exhibits to this report or to any previous filing with the Securities and Exchange Commission, or SEC, you may read the document itself for a complete understanding of its terms.
FORWARD-LOOKING STATEMENTS
In addition to historical information, this report on Form 20-F contains forward-looking statements within the meaning of Section 27A of the Securities Act of 1933, as amended, or the Securities Act and Section 21E of the Securities Exchange Act of 1934, as amended, or the Exchange Act. Some of the statements under “Item 3.D: Risk Factors,” “Item 4: Information on Ellomay,” “Item 5: Operating and Financial Review and Prospects” and elsewhere in this Report, constitute forward-looking statements. Forward-looking statements reflect our current view about future plans, intentions or expectations. These statements relate to future events or other future financial performance, plans strategies and prospects, and are identified by terminology such as “may,” “will,” “should,” “expect,” “scheduled,” “plan,” “intend,” “anticipate,” “believe,” “estimate,” “aim,” “potential,” or “continue” or the negative of those terms or other comparable terminology, but the absence of these words does not mean that a statement is not forward-looking.
The forward-looking statements contained in this Report are based on current expectations and beliefs concerning future developments and the potential effects on our business. There can be no assurance that future developments actually affecting us will be those anticipated. These forward-looking statements involve a number of risks, uncertainties or other assumptions that may cause actual results or performance to be materially different from those expressed or implied by these forward-looking statements, including the following:
| • | risks related to projects that are in the development stage, among other issues due to the inability to obtain or maintain licenses or project finance and to regulatory requirements; |
| • | our EPC contractors’ technical, professional and financial ability to construct, install, test and commission a renewable energy plant; |
| • | changes in the prices of electricity; |
| • | our contractors’ technical, professional and financial ability to deliver on and comply with their operation and maintenance, or O&M, undertakings in connection with the operation of our renewable energy plants; |
| • | the effects of the Covid-19 pandemic on the development, construction and operation of projects, including in connection with actions taken by governments and authorities, delays in construction due to quarantine and other measures, changes in regulation, changes in the price of electricity and in the consumption of electricity; |
| • | dependency on the availability of financial incentives and government subsidies and on governmental regulations for our operating renewable energy projects and the potential reduction or elimination, including retroactive amendments, of the government subsidies and economic incentives applicable to, or amendments to regulations governing the, renewable energy markets in which we operate or to which we may in the future enter; |
| • | defects in the components of the renewable energy plants we operate; |
| • | risks relating to operations in foreign countries, including cross currency movements, payment cycles and tax issues; |
| • | changes in the prices of the components or raw materials required for the production of renewable energy; |
| • | the market, economic and political factors in the countries in which we operate; |
| • | weather conditions and various meteorological and geographic factors; |
| • | our ability to maintain and gain expertise in the energy market, and to track, monitor and manage the projects which we have undertaken; |
| • | our ability to meet our undertakings under various financing agreements, including to our debenture holders, and our ability to raise additional equity or debt financing in the future; |
| • | future disagreements with our partners who own a portion of the renewable energy plants; |
| • | the risks we are exposed to due to our holdings in U. Dori Energy Infrastructures Ltd. and Dorad Energy Ltd.; |
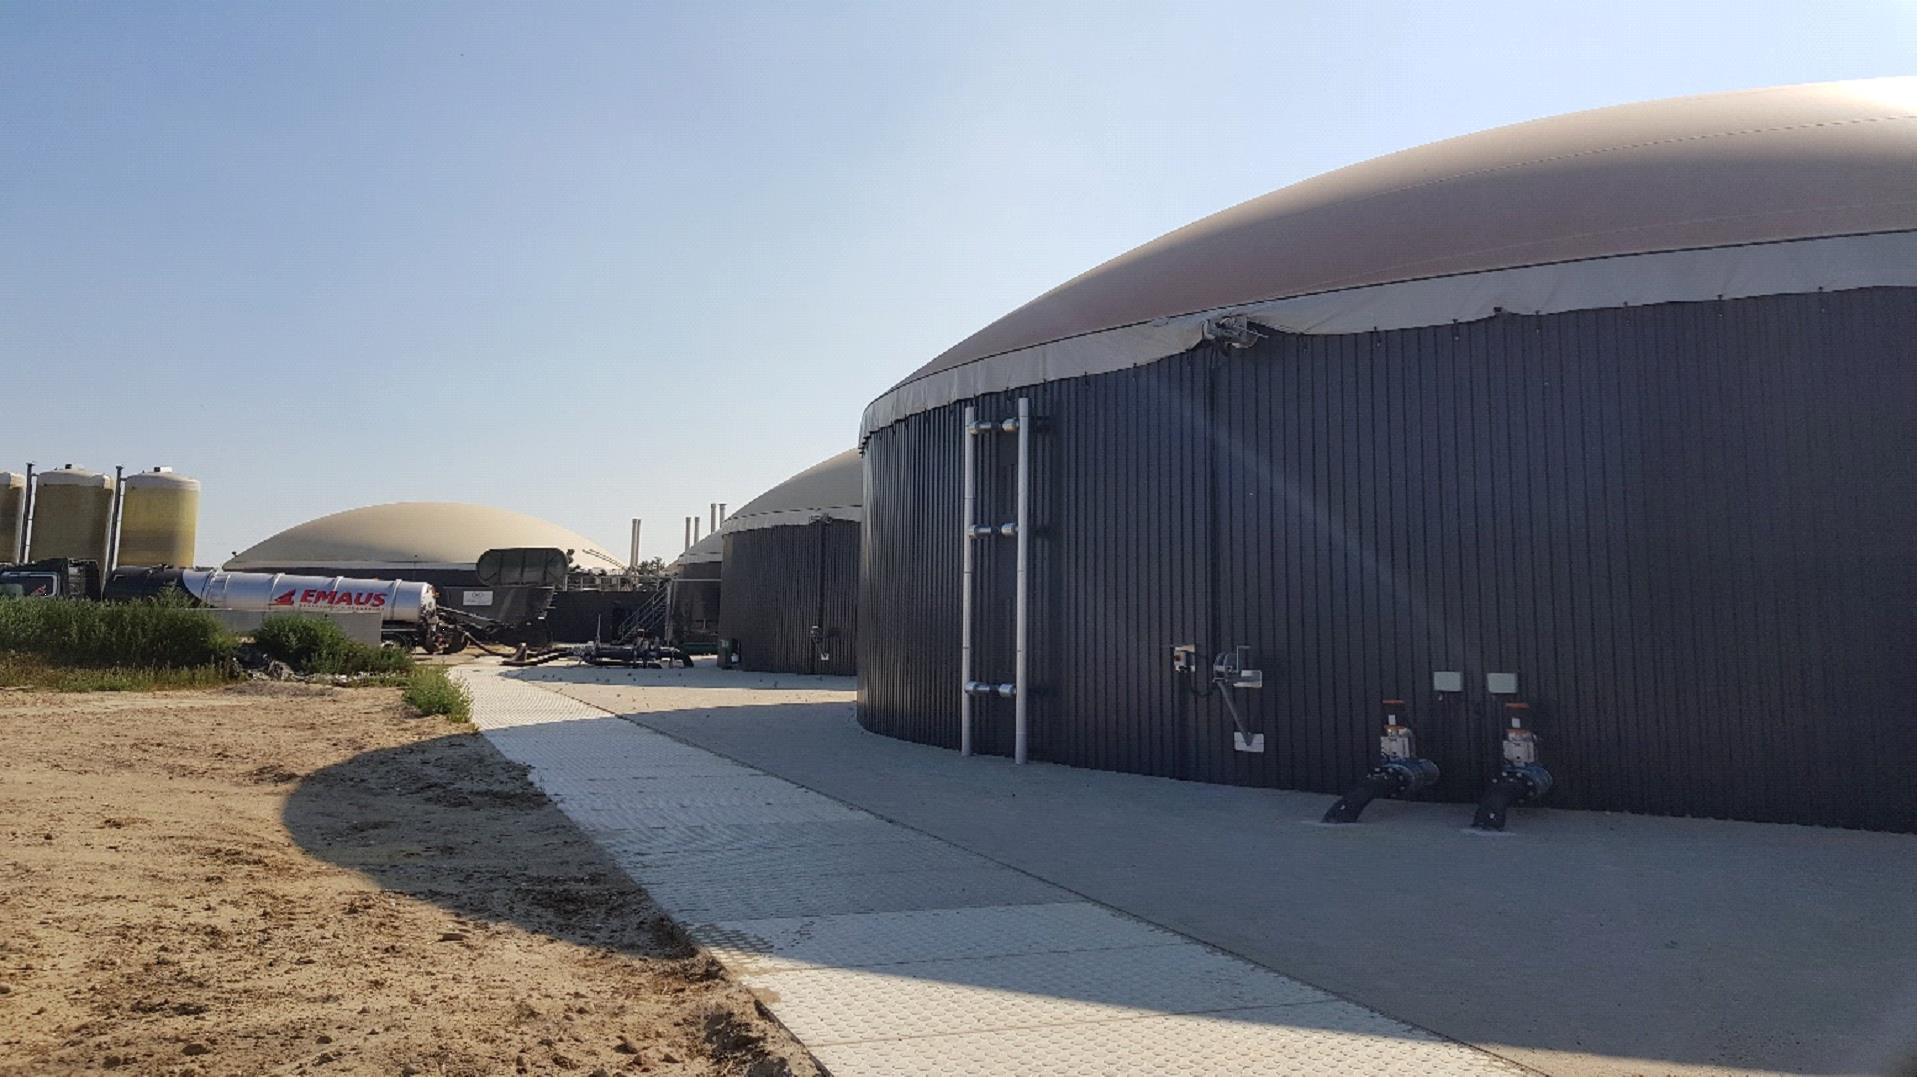
| • | the risks we are exposed to due to our involvement in Waste-to-Energy, or WtE, projects in the Netherlands; |
| • | fluctuations in the value of currency and interest rates; |
| • | the price and market liquidity of our ordinary shares; |
| • | the fact that we may be deemed to be an “investment company” under the Investment Company Act of 1940 under certain circumstances (including due to the investments of assets following the sale of our business), and the risk that we may be required to take certain actions with respect to the investment of our assets or the distribution of cash to shareholders in order to avoid being deemed an “investment company”; and |
| • | our plans with respect to the management of our financial and other assets and our ability to identify, evaluate and consummate additional suitable business opportunities and strategic alternatives. |
Assumptions relating to the foregoing involve judgment with respect to, among other things, future economic, competitive and market conditions, and future business decisions, all of which are difficult or impossible to predict accurately and many of which are beyond our control. In light of the significant uncertainties inherent in the forward-looking information included herein, the inclusion of such information should not be regarded as a representation by us or any other person that our objectives or plans will be achieved. Factors that could cause actual results to differ from our expectations or projections include the risks and uncertainties relating to our business described in this Report under “Item 3.D: Risk Factors,” “Item 4: Information on Ellomay,” “Item 5: Operating and Financial Review and Prospects” and elsewhere in this Report. In addition, new factors emerge from time to time, and it is not possible for management to predict all such factors, nor assess the impact of any such factor on our business or the extent to which any factor, or combination of factors, may cause results to differ materially from those contained in any forward-looking statements. Readers are cautioned not to place undue reliance on these forward-looking statements, which reflect management’s analysis as of the date hereof. We undertake no obligation to publicly revise these forward-looking statements to reflect events or circumstances that arise after the date hereof, except as required by applicable law. In addition to the disclosure contained herein, readers should carefully review any disclosure of risks and uncertainties contained in other documents that we file from time to time with the SEC.
To the extent that this Report contains forward-looking statements (as distinct from historical information), we desire to take advantage of the safe harbor provisions of the Private Securities Litigation Reform Act of 1995 and we are therefore including this statement for the express purpose of availing ourselves of the protections of the safe harbor with respect to all forward-looking statements.
PART I
ITEM 1: Identity of Directors, Senior Management and Advisers
Not Applicable.
ITEM 2: Offer Statistics and Expected Timetable
Not Applicable.
ITEM 3: Key Information
A. [Reserved]
B. Capitalization and Indebtedness
Not Applicable.
C. Reasons for the Offer and Use of Proceeds
Not Applicable.
D. Risk Factors
Investing in our securities involves significant risk and uncertainty. You should carefully consider the risks and uncertainties described below as well as the other information contained in this Report before making an investment decision with respect to our securities. If any of the following risks actually occurs, our business, financial condition, prospects, results of operations and cash flows could be harmed and could therefore have a negative effect on the trading price of our securities.
The risks described below are the material risks we face. Additional risks and uncertainties not currently known to us or that we currently deem to be immaterial may also materially adversely affect our business, financial condition or results of operations in the future.
Risks Related to our Business
Risks Related to our Renewable Energy Operations
In recent years, we entered the development and entrepreneurship renewable energy market. These operations are exposed to regulatory and other development risks that may cause such projects not to enter into the construction phase and other risks that may cause damages, delays and interruptions during the construction phase, and thereby cause the total or partial loss of the project development funds invested in the project. We are currently active in several projects in various development and construction stages, including the construction of a 156 MW pumped storage project in the Manara Cliff in Israel, or the Manara PSP, and the development of various PV projects in Italy, Israel and Spain. Projects in the development stages are exposed to various risks, including the inability to obtain or maintain regulatory permits and approvals, the inability to obtain project finance, upon terms economically beneficial or at all, and the inability to secure the project’s income through a PPA or a hedging agreement supported by a government or a corporation with sufficient financial capabilities. Projects in the construction stage are exposed to various risks, including delays in the construction, interferences from third parties such as adjacent plot owners, residents living in the vicinity, governmental, municipal, environmental and other authorities, malfunctions in construction equipment, shortage in equipment or personnel required for the construction and damage caused by weather conditions and other factors that we cannot control. All projects in the development and construction stages are subject to additional risks, including changes to existing regulation reducing the potential profitability of such projects, potential disagreements and conflicts with partners, dependency on technical consultants and surveys and risks associated with operations in foreign countries, as applicable. If any of these risks materialize, the entire project may be delayed or cancelled altogether, causing the loss of all part of the funds invested in the project development efforts. Even if we succeed in selling our rights in a project to third parties, the return of our project development expenses will likely be conditioned upon the continued development of the project by such third parties.
Existing regulations, and changes to such regulations, may present technical, regulatory and economic barriers and restrictions to the construction and operation of renewable energy plants, which may adversely affect our operations. The installation and operation of renewable energy plants is subject to oversight and regulation in accordance with international, European (to the extent applicable), national and local ordinances, building codes, zoning (or permitting), environmental protection regulation, including waste disposal regulations, utility interconnection requirements, security requirements and other rules and regulations. Any changes in applicable regulations that increases the burdens or restrictions on the operation of our renewable energy plants, such as a change in regulations governing the disposal of anaerobic digestion produced by our WtE plants, reduction of remuneration received on electricity produced, as the reduction mechanism for excess remuneration resulting from the high price of natural gas on international markets introduced by the Spanish government during 2021, could increase our costs of operation and, as a result, adversely affect our results of operations. In addition, various governmental, municipal and other regulatory entities require the issuance and continued effectiveness of relevant permits, licenses and authorizations for the construction and operation of renewable energy plants. If such permits, licenses and authorizations are not issued on a timely basis, this could result in the interruption, cessation or abandonment of a newly constructed renewable energy plant, or may require making significant changes to such renewable energy plant, any of which may cause severe losses. In addition, if issued, these licenses and permits may be revoked by the authorities following their issuance in the event the authorities discover irregularities or deviations from the scope of the license or permit. Any revocation of existing licenses may obligate us to cease constructing or operating the relevant renewable energy plant for the period required in order to renew the relevant license or indefinitely and therefore will adversely affect our business and results of operations.
A drop in the price of energy may negatively impact our results of operations. The revenue from the sale of energy produced by renewable energy plants is based on proceeds from the sale of electricity and gas produced in the electricity and gas market at market price and sometimes also includes incentives in the form of governmental subsidies or fixed tariffs. Previous revisions to the governmental subsidies regime in several countries, including Spain, Italy and Israel, which reduced or eliminated the scope of the incentives paid by governments, increased the dependency of renewable energy plants on market prices or on tariffs determined in a public bid process. A decrease in the price of electricity and gas, particularly in the countries in which we operate and in which some of our revenues are based on the market price of electricity and gas, may negatively impact our profitability and our ability or interest to expand our renewable energy operations.
The success of our renewable energy plants, from their construction through their commissioning and ongoing commercial operation, depends to a large extent on the cooperation, reliability, solvency, and proper performance of the contractors we engage for the construction, operation and maintenance of our renewable energy plants, or the Contractors, and of the other third parties involved in the construction and operation of the plants, including subcontractors, local advisors, financing entities, land owners, suppliers of feedstock, the energy grid regulator, governmental agencies and potential purchasers of electricity. The construction and operation of a renewable energy plant requires timely input, often of a highly specialized technical nature, from several parties, including the suppliers of the various system components (such as solar panels or CHP engine) and plant operators, other suppliers of relevant parts and materials (including replacement parts), feedstock suppliers, land owners, subcontractors, electricity brokers, financing entities and governmental and related agencies (as subsidizers and as regulators). In addition, as we use Contractors to construct and thereafter operate and maintain our renewable energy plants, we depend on the Contractors’ expertise and experience, representations, warranties and undertakings regarding, inter alia: the construction quality, schedule of construction, operation, maintenance and performance of each of the plants, the use of high-quality materials, strict compliance with applicable legal requirements and the Contractors’ financial stability. If the Contractors’ representations or warranties are inaccurate or untrue, or if any of the Contractors or other entities fail to perform their obligations properly, this could result in the interruption or cessation of construction or operations or abandonment of the relevant plant, or may require significant expenses to mitigate the damages or repair them, any of which may cause us severe losses.
The performance of our renewable energy plants depends on the quality of the equipment installed in such plants and on the reliability of the suppliers of spare and replacement parts. The performance of our renewable energy plants depends on the quality of the components of the plants and the equipment installed in the plants. Any defects or deterioration in the quality of such components and equipment could harm our results of operations, and if we will not be able to quickly locate quality replacement parts or perform repairs, our results of operations could be adversely affected for a long period of time. For example, the performance of our photovoltaic plants, or the PV Plants, depends on the quality of the solar panels installed. Degradation in the performance of the solar panels above a certain level is guaranteed by the panel suppliers and we generally receive undertakings from the Contractors with respect to minimum performances. Therefore, one of the critical factors in the success of our PV Plants is the existence of reliable solar panel suppliers, who guarantee the performance and quality of the solar panels supplied and their ability to provide us with replacement and spare parts that are of sufficient quality. If the suppliers of solar panels will not meet their undertakings under the guarantees and no replacement panels will be available at a reasonable price, this could result in the interruption, cessation or abandonment of the relevant PV Plant, or may require significant expenses to mitigate the damages or repair them, any of which may cause us severe losses.
In the event we are unable to comply with the obligations and undertakings, including with respect to financial covenants, which we undertook in connection with the project financing of our renewable energy plants, our results of operations may be adversely affected. In connection with the financing of our PV Plants, our WtE plants, and the Manara PSP, we entered into long-term agreements with various financing entities and may in the future enter into additional project finance agreements in connection with our other projects, for example, the projects currently under development in Italy. The agreements that govern the provision of financing include, and future project finance agreements are expected to include, inter alia, undertakings and financial covenants, the majority of which are based on the ongoing income derived from the relevant plant, which may be adversely affected by the various risks detailed herein. If we fail to comply with any of these undertakings and covenants, we may be subject to penalties, future financing requirements, and the acceleration of the repayment of debt. These occurrences would have an adverse effect on our financial position and results of operations and on our ability to obtain outside financing for other projects.
As a substantial part of our business is currently located in Europe, we are subject to additional risks that may negatively impact our operations. We currently have substantial PV operations in Spain and WtE operations in the Netherlands, all of which are held by our Luxembourg subsidiary, and may make additional investments in projects located in Europe, such as the development and construction of additional PV plants in Spain and Italy. Due to these existing operations and any additional future investments, we are subject to special considerations or risks associated with companies operating in other jurisdictions, including rules and regulations, cross currency movements, different payment cycles, tax issues, such as tax law changes and variations in tax laws as compared to Israel, cultural and language differences, crime, strikes, riots, civil disturbances, terrorist attacks and wars and deterioration of political and economic relations with Israel. Our European operations subject us to a number of these risks, as well as the requirement to comply with the local laws, such as the Spanish, Dutch and EU laws.
On January 31, 2020 the United Kingdom due to the Brexit referendum stopped being a member of the EU. Brexit has created significant uncertainty about the future relationship between the United Kingdom and the EU, and given rise for the governments of other EU member states to consider withdrawal. Our regulatory risk could increase if there were to be future divergence with the EU regime.
These developments, or the perception that any of them could occur, could have a material adverse effect on global economic conditions and the stability of global financial markets, and could significantly reduce global market liquidity and future growth. Asset valuations, currency exchange rates and credit ratings may be especially subject to increased market volatility. We cannot assure you that we would be able to adequately address some or all of these additional risks. If we were unable to do so, our operations might suffer.
The continued global crisis resulting from the current novel strain of coronavirus (Covid-19) and any other pandemic, epidemic or outbreak of an infectious disease may adversely affect our operations. If a pandemic, epidemic or outbreak of an infectious disease occurs in Europe, Israel or elsewhere, our business may be adversely affected. Following the outbreak of the Coronavirus (Covid-19) in December 2019, this virus and its variants spread globally to over 180 countries, including European countries and Israel. The spread of Covid-19 has resulted in the World Health Organization declaring the outbreak of Covid-19 as a “pandemic.” Due to the spread of Covid-19 and the measures taken by governments in order to control the spread, there was a decrease in economic activity in many areas around the world, including Israel and Europe since March 2020. The spread of the virus has led, inter alia, to a disruption in the supply chain, a decrease in global transportation, restrictions on travel, mass gatherings, commerce and work that were announced by the State of Israel and other countries around the world and a decrease in the value of financial assets and commodities on the markets in Israel and the world. Although our operations have not thus far been materially adversely affected by the restrictions imposed by local governments and authorities in the countries in which we operate, in the event the restrictions continue, or new restrictions are imposed, our operations, including the projects under construction and development, may be adversely affected. The spread of Covid-19 and its implications may also indirectly affect our operations, for example through changes in the prices of oil resulting in a decrease in the electricity prices, and through reduction in demand for electricity, delays in construction of projects due to curtailment of work, limited availability of components required in order to operate or construct new projects, regulatory changes by countries affected by the virus, including changes in subsidies, collection delays, delays in obtaining permits, limited availability or changes in terms of financing for future projects, limited availability or changes in terms of financing for future projects or corporate financing and lower returns on potential future investments. As a result, our business and operating results could be negatively affected. The extent to which the Covid-19 pandemic or any other widely-spread health crisis impacts our business will depend on future developments, which are highly uncertain and cannot be predicted, including new information which may emerge concerning the severity of Covid-19, the resurgence of new variants or mutations of the virus and the actions to contain Covid-19 or treat its impact, among others.
Our business is affected by the availability of financial incentives. The reduction or elimination of government subsidies and economic incentives could reduce our profitability and our revenues. Many countries, such as Spain, Italy, the Netherlands and Israel, introduced in the past substantial incentives to offset the cost of renewable energy production, including photovoltaic power systems and WtE technologies in the form of Feed-in-Tariff, or FiT, or other incentives aimed at promoting the use of clean energy (including solar energy and biogas) and reducing dependence on other forms of energy. In addition, several countries encourage manufacturers and farmers to choose waste management methods that are more environmentally-friendly, either by establishing fines on non-environmentally friendly waste management methods or by payment of incentives. Certain of these government incentives were reduced or eliminated in the past years (for example with respect to photovoltaic installations in Italy and Spain) and the remaining incentives could potentially be reduced or eliminated in the future. If the governments in the countries in which we operate elect to revise the existing incentive schemes, it may adversely affect our profitability from projects that enjoy incentives. Any retroactive or prospective changes in the incentive schemes may affect our business plan and potential future projects we may be interested in developing or acquiring. In general, uncertainty about the introduction of, reduction in, or elimination of, incentives or delays or interruptions in the implementation of favorable laws could affect our profitability.
Natural disasters, terrorist attacks, or other catastrophic events could harm our operations. Our worldwide operations could be subject to natural disasters terrorist attacks, public health events and other business disruptions, which could harm our future revenue and financial condition and increase our costs and expenses. Among others, floods, storms, seismic turbulence and earth movements may damage our projects in operation or under construction. The insurance coverage we have for a portion of such risks may not cover the damage in full because these circumstances are sometimes deemed “acts of god.” In the event that an earthquake, fire, tsunami, typhoon, terrorist attack, or other natural, manmade or technical catastrophe were to damage or destroy any part of our plants or those of manufacturers on which we rely, destroy or disrupt vital infrastructure systems or interrupt our operations or services for any extended period of time, our business, financial condition and results of operations would be materially and adversely affected.
An increase in the prices of components of a renewable energy plant may adversely affect our projects under development, our future growth and our business. Installations of renewable energy plants have substantially increased over the past few years. The increased demand led to fluctuations in the prices of the components of the plants resulting from oversupply and undersupply. For example, the increased demand for solar panels resulted in substantial investments in solar panels production facilities, creating oversupply and a sharp continuing decrease in the prices of solar panels. The Covid-19 pandemic and its effects on global supply chains, since 2020, halted years of solar panel price cost reductions. The Covid-19 pandemic has put pressure on global supply chains with factory closures, import tariffs, shortages of raw materials, and shipping bottlenecks creating supply chain shortages and delays. It may take several years until solar module prices stabilize and such conditions increase the costs of replacing components in our existing plants and the costs of constructing new plants, could potentially delay the commencement or completion of construction of new projects and may impact the profitability of constructing plants and our ability to expand our business. Also, shortage or delays to deliveries of vital components can result in construction and installations delays.
The market for renewable energy is intensely competitive and rapidly evolving. The market for renewable energy attracts many initiatives and therefore is intensely competitive. For example, in recent years the Israeli Electricity Authority commenced issuing licenses to photovoltaic installations in tender processes resulting in a substantial decrease in prices per KWh in the newly issued licenses. Our competitors who strive to construct new renewable energy plants and acquire existing plants may offer lower prices per KWh in future tender process, may have established more prominent market positions, may have greater resources and may have more experience in this field. Extensive competition may adversely affect our ability to continue to acquire and develop new plants.
Our success depends in part on our senior management team and other key employees and our ability to attract, integrate and retain key personnel and qualified individuals. We depend on the expertise of our senior management team and other key employees to help us meet our strategic objectives. The inability to maintain our senior management team and other key employees or to attract highly skilled personnel, may materially adversely affect the implementation of our development business plan and could ultimately adversely impact our business.
We do not wholly-own a few of our operating projects and projects under development. Although we currently control these projects, disagreements with our partners could cause delays in the construction or development of the projects or affect decisions made in connection with operating plants. We wholly-own all of our operating PV plants and the Netherlands’ WtE plants, except the 300 MW photovoltaic plant in the municipality of Talaván, Cáceres, Spain, which was connected to the Spanish national grid in December 2020, or the Talasol PV Plant, of which we hold 51%. We also own 83.333% of the Manara PSP and may in the future enter into projects that we do not wholly-own or introduce additional partners to the Manara PSP or other projects under development or to our operating plants. Although we control both the Talasol PV Plant and the Manara PSP, any disagreements with our partners could delay the development or construction of the Manara PSP, affect decisions made in connection with the Talasol PV Plant and require management resources and attention. Any delays or damages caused due to such disagreements could adversely affect our business plans and results of operations.
We may be subject to disruptions or failures in information technology, telecommunication systems and network infrastructures that could have a material adverse effect on our business and financial condition. Our renewable energy business relies, among other things, on information technology and on telecommunication services as we remotely monitor and control our assets and interface with regulatory agencies and wholesale power markets. Disruptions or failures in such systems may result due to various causes, including internal malfunctions in our systems or in the systems of third parties such as suppliers, governmental authorities, from employee error, theft or misuse, malfeasance, power disruptions, natural disasters or accidents and may also result from cyber-attacks or other breaches of information technology security. Such disruptions and failures could have an adverse effect on our business operations, financial reporting, financial condition and results of operations.
Risks Related to our PV Plants
The revenues derived from several of our PV Plants mainly depend on payments received from governmental entities. Any future deterioration in the financial position of the local governments or regulated entities, resulting in partial or no payment or in regulatory changes may adversely affect the results of our operations. The revenues derived by several of our PV Plants are based mainly on payments received from governmental or regulated entities. In Spain (except with respect to the Talasol PV Plant), our revenues are primarily based on payments from governmental entities in accordance with a specific remuneration incentive scheme. In Israel, all of our income is based on a fixed tariff from the Israel Electric Company, or the IEC, a governmental company that controls the Israeli electricity market. We cannot assure you that there will not be changes to the governments’ photovoltaic energy incentive schemes or in the financial stability of the governments or relevant governmental agencies or companies. Any changes in the financial stability of the governmental entities paying all or a portion of our PV revenues and any resulting change in the regulation may directly or indirectly affect the payments we receive and, therefore, our operations and revenues.
We are exposed to the possibility of damages to, or theft of, the various components of our PV Plants. Such occurrences may cause disruptions in the production of electricity and additional costs. Our PV Plants may suffer damages and disruption in the production of electricity due to theft of panels and other components, or due to bad weather and land conditions. Although such damages are generally covered by the PV Plants’ insurance policies, under certain circumstances such occurrences may not be covered or may only be partially covered by the insurance and, if covered, utilization of the insurance may cause an increase in the premiums paid to our insurance companies, all of which may adversely affect our results of operations and profitability.
Our ability to produce solar power depends upon the magnitude and duration of sunlight as well as other meteorological and geographic factors. Solar power production has a seasonal cycle, and adverse meteorological conditions can materially impact the output of photovoltaic plants and result in production of electricity below expected output, which in turn could adversely affect our profitability. For example, 2018 was characterized with relatively low levels of radiation, which resulted in a decrease in our PV-related revenues for that year. Lower electricity output due to changes in meteorological conditions and other geographic factors may adversely affect our profitability.
Risks Related to our WtE (Biogas) Plants
In addition to the risks involved in the construction and operation of, and the regulatory risks applicable to, renewable energy plants in general, WtE plants are exposed to risks specific to this industry. In addition to the risks detailed above under “Risks Related to our Renewable Energy Operations,” WtE plants are exposed to additional risks specific to this industry, including:
| • | As the raw materials used to produce energy in the WtE market are not freely available (as is the case with wind and solar energies), the success of a WtE plant depends, among other things, on the prices of feedstock required in order to maintain the optimal mix of feedstock necessary to maximize performance of the plants and meet a certain of range of energy (gas, electricity or heat) production levels. In order to ensure continuous supply of raw materials, both in terms of the quantity and the quality and composition of the raw materials, a WtE plant is required to enter into supply relationships with several feedstock suppliers, such as farmers, food manufacturers and other specialized feedstock suppliers and to continuously monitor the proposed transactions in order to locate the most efficient and beneficial offers. Any increase in the price of feedstock or shortage in the type or quality of feedstock required to produce the desired energy levels with the technology used by the plant could slow down or halt operations, causing a material adverse effect on the results of operations. The price and quality of the feedstock mix might also increase the plant’s operating costs, either due to the need to purchase a more expensive feedstock mix in order to meet the desired energy production levels, or due to an increase in residues and the resulting increase of surplus quantities that require removal. In addition to the impact of the quality of the feedstock on the production levels, maintaining and monitoring the feedstock quality is crucial for preventing malfunctions in the process, for example due to high levels of certain chemicals that might harm the CHP engines. Additionally, a wrong feedstock mix and/or low feedstock quality might create biology problems such as lower bacteria population, which directly adversely impacts the biogas production. Therefore, any shortage of quality feedstock and changes in the feedstock mix available for use could have a material adverse effect on the results of operations of our WtE plants. |
| • | The WtE industry is subject to many laws and regulations which govern the protection of the environment, quality control standards, health and safety requirements, and the management, transportation and disposal of different types of waste. Environmental laws and regulations may require removal or remediation of pollutants and may impose civil and criminal penalties for violations. The costs arising from compliance with environmental laws and regulations may increase operating costs for our WtE plants and we may be exposed to penalties for failure to comply with such laws and regulations. In addition, existing regulation governing waste management and waste disposal provide incentives to feedstock suppliers to use waste management solutions such as the provision of feedstock to WtE plants. Any regulatory changes that impose additional environmental restrictions on the WtE industry or that relieve feedstock suppliers from the stringent regulation concerning waste management and disposal could increase our operating costs, limit or change the cost of the feedstock available to us, and adversely affect our results of operations. |
Risks Related to our Israeli Operations
The electricity sector in Israel is highly regulated. Any changes in the tariffs, system charges or applicable regulations may adversely affect our operations and results of operations. In addition, failure to obtain and maintain electricity production and supply licenses from the regulator could materially adversely affect our operations and results of operations. The Israeli electricity sector is subject to various laws and regulations, such as the tariffs charged by the IEC, including a resolution to charge private manufacturers, such as Dorad Energy Ltd., or Dorad, in which we indirectly hold 9.375%, for the IEC’s system operation services, and the licensing requirement. The prices paid by Dorad to the IEC for system operation services provided to Dorad and the fees received by Dorad and by our PV Plant located in Talmei Yosef, Israel, or the Talmei Yosef PV Plant, from the IEC for electricity sold to the IEC and for providing the IEC with energy availability, are all based on tariffs determined by the Israeli regulator. The updates and changes to the regulation and tariffs required to be paid to the IEC by Dorad may not necessarily involve negotiations or consultations with Dorad and may be unilaterally imposed on it. Any changes in the tariffs, system charges or applicable regulations may adversely affect our operations and results of operations. In addition, a manufacturer of energy in Israel is required to initially hold a conditional license and thereafter hold a permanent license, issued by the Israeli Electricity Authority, which include ongoing milestones and conditions. Failure to maintain such licenses could adversely affect our development efforts and our results of operations.
The electricity sector in Israel is highly centralized. The IEC controls and operates the electricity system and all stages of the transmission of electricity. The electricity sector in Israel is dominated by the IEC, which controls and operates the electricity system in Israel, including the delivery and transmission of electricity, and also manufactures the substantial majority of electricity in Israel. The IEC is also the only customer of the Talmei Yosef PV Plant and is subject to the requirement to pay a fixed tariff for the electricity manufactured by such plant. Similarly, it is currently expected that the sole customer of the Manara PSP will be the IEC, who will be required to pay the Manara PSP for availability and electricity produced. The ability of the IEC to pay the renewable energy manufacturers could be affected by financial instability of the IEC. The inability of the IEC to pay Dorad, Talmei Yosef, the Manara PSP or any energy project we may be involved in in Israel, may adversely affect our plan of operations and could have a material adverse effect on our profitability.
The Talmei Yosef PV Plant and the Dorad Power Plant are located in the southern part of Israel, in proximity to the Gaza Strip and within range of missile and mortar bombs launched from the Gaza Strip. The Manara PSP is located the northern part of Israel, in proximity to the border with Lebanon. The Talmei Yosef Project is located near the Gaza Strip border and the Dorad Power Plant is located in Ashkelon, a town in the southern part of Israel, in proximity to the Gaza Strip. In recent years, there has been an escalation in violence and missile attacks from the Gaza Strip to Southern and Central Israel. The Manara PSP is constructed in close proximity to Israel’s border with Lebanon, in an area that has also been attacked by missiles in the past. Certain measures were taken to protect the Dorad Power Plant from missile attacks. However, any such further attacks to the area surrounding the Gaza Strip or to the area in close proximity to the northern border of Israel or any direct damage to the location of these plants may damage the relevant plants and disrupt the operations of the projects and thereafter their operations, and may cause losses and delays.
Risks Related to our Investment in Dori Energy
We have joint control in U. Dori Energy Infrastructures Ltd., or Dori Energy, who, in turn, holds a minority stake in Dorad. Therefore, we do not control the operations and actions of Dorad. We currently hold 50% of the equity of Dori Energy who, in turn, holds 18.75% of Dorad and accordingly our indirect interest in Dorad is 9.375%. Although we entered into a shareholders’ agreement, or the Dori Energy Shareholders Agreement, with Dori Energy and the other shareholder of Dori Energy, Amos Luzon Entrepreneurship and Energy Group Ltd. (f/k/a U. Dori Group Ltd.), or the Luzon Group, providing us with joint control of Dori Energy, should differences of opinion as to the management, prospects and operations of Dori Energy arise, such differences may limit our ability to direct the operations of Dori Energy. Moreover, Dori Energy holds a minority stake in Dorad and as of the date hereof is entitled to nominate only one director in Dorad, which, according to the Dori Energy Shareholders Agreement, we are entitled to nominate. As we have one representative on the Dorad board of directors, which has a total of seven directors, we do not control Dorad’s operations. Therefore, as we have joint control over Dori Energy and limited control over Dorad, we may be unable to prevent certain developments that may adversely affect their business and results of operations. Since July 2015, several of Dorad’s direct and indirect shareholders, including Ellomay Clean Energy Ltd., or Ellomay Energy, our wholly-owned subsidiary that holds Dori Energy’s shares, are involved in various legal proceedings, all as more fully described in “Item 4.B: Business Overview” below. In addition, to the extent our interest in Dori Energy is deemed an investment security, as defined in the Investment Company Act of 1940, or the Investment Company Act, we could be deemed to be an investment company under the Investment Company Act, depending on the value of our other assets. Please see “We may be deemed to be an “investment company” under the Investment Company Act of 1940, which could subject us to material adverse consequences” below.
The Dori Energy Shareholders Agreement contains restrictions on our right to transfer our holdings in Dori Energy, which may make it difficult for us to terminate our involvement with Dori Energy. The Dori Energy Shareholders Agreement contains several restrictions on our ability to transfer our holdings in Dori Energy, including a right of first refusal. The aforesaid restrictions may make it difficult for us to terminate our involvement with Dori Energy should we elect to do so and may adversely affect the return on our investment in Dori Energy.
Dorad, which is currently the only substantial asset held by Dori Energy, operates the Dorad Power Plant, whose successful operations and profitability depends on a variety of factors, some of which are not within Dorad’s control. Dorad’s only substantial asset is the Dorad Power Plant, situated on the premises of the Eilat-Ashkelon Pipeline Company, or EAPC, located south of Ashkelon, Israel. The Dorad Power Plant is subject to various complex agreements with third parties (the IEC, the operations and maintenance contractor, suppliers, private customers, etc.) and to regulatory restrictions and guidelines in connection with, among other issues, the tariffs to be paid by the IEC to Dorad for the energy it produces. Various factors and events may materially adversely affect Dorad’s results of operations and profitability and, in turn, have a material adverse effect on Dori Energy’s and on our results of operations and profitability. These factors and events include:
| • | The operation of the Dorad Power Plant is highly complex and depends upon the continued ability: (i) to operate the various turbines, and (ii) to turn the turbines on and shut them down quickly based on demand. The profitability of Dorad also depends on the accuracy of the proprietary forecasting system used by Dorad. Any defects or disruptions, or inaccuracies in forecasts, may result in an inability to provide the amount of electricity required by Dorad’s customers or in over-production, both of which could have a material adverse effect on Dorad’s operations and profitability. |
| • | Dorad’s operations depend upon the expertise and success of its operations and maintenance contractor, who is responsible for the day-to-day operations of the Dorad Power Plant. If the services provided by such contractor will cause delays in the production of energy or any other damage to the Dorad Power Plant or to Dorad’s customers, Dorad may be subject to claims for damages and to additional expenses and losses and therefore Dorad’s profitability could be adversely affected. |
| • | Significant equipment failures may limit Dorad’s production of energy. Although such damages are generally covered by insurance policies, any such failures may cause disruption in the production, may not all be covered by the insurance and the correction of such failures may involve a considerable amount of resources and investment and could therefore adversely affect Dorad’s profitability. |
| • | The construction of the Dorad Power Plant was mainly financed by a consortium of financing entities pursuant to a long-term credit facility and such credit facility provides for pre-approval by the consortium of certain of Dorad’s actions and contracts with third parties. Changes in the credit ratings of Dorad and its shareholders, non-compliance with financing and other covenants, delays in provision of required pre-approvals or disagreements with the financial entities and additional factors may adversely affect Dorad’s operations and profitability. |
| • | Dorad entered into a long-term natural gas supply agreement with the partners in the “Tamar” license, or Tamar, located in the Mediterranean Sea off the coast of Israel. This agreement includes a “take or pay” mechanism, subject to certain restrictions and conditions that may result in Dorad paying for natural gas not actually required for its operations. In addition, Tamar is currently (until the agreement regarding the acquisition of natural gas from Energean Israel Ltd., or Energean, becomes effective) Dorad’s sole supplier of natural gas and has undertaken to supply natural gas to various customers and is permitted to export a certain amount of the natural gas to customers outside of Israel. Dorad’s operations depend on the timely, continuous and uninterrupted supply of natural gas from Tamar and on the existence of sufficient reserves throughout the term of the agreement with Tamar. In addition, the price of natural gas under the supply agreement with Tamar is linked to production tariffs determined by the Israeli Electricity Authority but cannot be lower than the “final floor price” included in the agreement. In the event of future reductions in the fuel and energy prices and the production tariff, the price of gas may reach the “floor price” and thereafter will not be further reduced. Any delays, disruptions, increases in the price of natural gas under the agreement, or shortages in the gas supply from Tamar will adversely affect Dorad’s results of operations. |
| • | The Dorad power plant is subject to environmental regulations, aimed at increasing the protection of the environment and reducing environmental hazards, including by way of imposing restrictions regarding noise, harmful emissions to the environment and handling of hazardous materials. Currently the costs of compliance with the foregoing requirements are not material. Any breach or other noncompliance with the applicable laws may cause Dorad to incur additional costs due to penalties and fines and expenses incurred in order to regain compliance with the applicable laws, all of which may have an adverse effect on Dorad’s profitability and results of operations. |
| • | Due to the agreements with contractors of the Dorad Power Plant and the indexation included in the gas supply agreement, Dorad is exposed to changes in the exchange rates of the U.S. dollar against the NIS. To minimize this exposure Dorad executed forward transactions to purchase U.S. dollars against the NIS. In addition, due to the indexing to the Israeli consumer price index under Dorad’s credit facility, it is exposed to fluctuations in the Israeli CPI, which may adversely affect its results of operations and profitability. Dorad’s profitability might be adversely affected due to future changes in exchange rates or in the Israeli consumer price index. |
| • | Dorad is involved in several arbitration and court proceedings initiated by Dorad’s shareholders, including Dori Energy. Disagreements and disputes among shareholders may interfere with Dorad’s operations and specifically with Dorad’s business plan and potential growth. |
| • | The Covid-19 crisis affects Dorad’s customers (which include hotels and other industrial customers), and therefore any decrease in electricity consumption by Dorad’s customers and in Israel generally (affecting the amount of electricity purchased by the IEC from Dorad), may affect Dorad’s financial results. In its financial statements for the year ended December 31, 2021, Dorad reported a certain decrease in consumption of electricity by its customers and by the IEC due to the Covid-19 crisis, which according to Dorad’s financial statements did not have a material impact on Dorad as of December 31, 2021, and it is continuously examining the options available to it in the event of a material impact on in its income as a result of the spread of Covid-19. |
Risks Related to the Manara PSP
The Manara PSP currently holds a conditional license. Such conditional license may be revoked for various reasons, such as non-compliance with milestones stipulated in the conditional license. The Manara PSP currently holds a conditional license for the construction of a 156 MW pumped storage project, or the Manara PSP Conditional License, issued to it on June 17, 2020. Conditional licenses issued by the Israeli Electricity Authority include several milestones, and deadlines for completing such milestones, including the completion of the construction works of the pumped storage power plant. The Israeli Electricity Authority could revoke the Manara PSP Conditional License if Ellomay Pumped Storage (2014) Ltd., the project company of the Manara PSP, or Ellomay PS, does not timely meet the milestones included in it. Any such attempted revocation is subject to a written notice from the Israeli Electricity Authority, which is required to include the reasons for the proposed revocation, and to a hearing of Ellomay PS before the Israeli Electricity Authority. If the Manara PSP Conditional License will be revoked in the future, that could prevent the completion of the Manara PSP, resulting in a loss of some or all the funds invested in the Manara PSP.
The construction of the Manara PSP is a complex and unique engineering challenge. The construction process of the Manara PSP includes planning and conducting of a comprehensive investigation to characterize the variety of soils and rocks at the construction sites. In accordance with the infrastructure characteristics and the seismic risks that exist on site, stability calculations need to be performed on the basis of which instructions are given for the planning and execution of the reservoirs. Any complications during the construction period of the Manara PSP could cause delays in the construction and could expose the Manara PSP to non-compliance with the terms of the Manara PSP Conditional License issued to it by the Israeli Electricity Authority and could otherwise materially adversely affect our results of operations in connection with the Manara PSP.
Risks Related to our Operations and Ownership Structure
Our ability to leverage our operations and increase our operations depends, inter alia, on our ability to obtain attractive project and corporate financing from financial entities. Our ability to obtain attractive financing and the terms of such financing, including interest rates, equity to debt ratio requirement and timing of debt availability will significantly impact our ability to leverage our investments and enhance our operations and to fulfill our development plans. Although we have financing agreements with respect to several of our PV Plants, WtE Plants and the Manara PSP and although we raised significant funds in Israel through the issuance of debentures, there is no assurance we will be able to procure additional project financing for projects under development or any operations we will acquire or projects we wish to advance in the future, or to obtain additional corporate financing, on terms favorable to us or at all. Our inability to obtain additional financing on favorable terms, or at all, may adversely affect our ability to leverage our investments and to procure the equity required in order to increase and further develop our operations and execute our business plan.
Our ability to freely operate our business is limited due to certain restrictive covenants contained in the deeds of trust of our Debentures. The deeds of trust governing our Series C Debentures and our Series D Convertible Debentures, or the Deeds of Trust and the Debentures, respectively, contain restrictive covenants that limit our operating and financial flexibility. These covenants include, among other things, a “negative pledge” with respect to a floating pledge on all of our assets. The Deeds of Trust also contain covenants regarding maintaining certain levels of financial ratios and criteria, including as a condition to the distribution of dividends, as a trigger for an obligation to pay additional interest and as a cause for immediate repayment, and other customary immediate repayment conditions, including, under certain circumstances, in the event of a change of control, a default under the deed of trust of the other debentures issued by us, a change in our field of operations or a disposition of a substantial amount of assets. Our ability to continue to comply with these and other obligations depends in part on the future performance of our business. Such obligations may hinder our ability to finance our future operations or the manner in which we operate our business. In particular, any non-compliance with performance-related covenants and other undertakings of the Debentures could result in increased interest payments for some or all of the Debentures or a demand for immediate repayment of the outstanding amount under the Debentures and restrict our ability to obtain additional funds, which could have a material adverse effect on our business, financial condition or results of operations.
Our debt increases our exposure to market risks, may limit our ability to incur additional debt that may be necessary to fund our operations and could adversely affect our financial stability. As of December 31, 2021, our total indebtedness in connection with corporate and project financing (including the Talasol PV Plant, of which we hold 51%) was approximately €363 million, including principal and interest expected repayments, financing related swap transactions and excluding any related capitalized costs. The Deeds of Trust permit us to incur additional indebtedness, including by issuing additional debentures of the existing series of Debentures and issuing additional series of debentures, subject to maintaining certain financial ratios and covenants. Our debt, including the Debentures, and any additional debt we may incur, could adversely affect our financial condition by, among other things:
| • | increasing our vulnerability to adverse economic, industry or business conditions and cross currency movements and limiting our flexibility in planning for, or reacting to, changes in our industry and the economy in general; |
| • | requiring us to dedicate a substantial portion of our cash flow from operations to service our debt, thus reducing the funds available for operations and future business development; and |
| • | limiting our ability to obtain additional financing to operate, develop and expand our business. |
We may incur significant additional amounts of debt, which could further exacerbate the risks associated with our substantial indebtedness. We may be able to incur substantial additional indebtedness, including additional issuances of debentures and secured indebtedness, in the future. Although the Deeds of Trust governing our Debentures contain conditions that may affect our ability to incur additional debt, mainly through the issuance of additional debentures of the existing series of the Debentures, these conditions are limited and we will be able to incur additional debt and enter into leveraged transactions, so long as we do not breach the financial covenants and meet these conditions. If new debt is added to our existing debt levels, the related risks that we face would intensify and we may not be able to meet all our debt obligations, including the obligations in connection with repayment of the Debentures.
We cannot assure you that our business will generate cash flow from operations or future borrowings from other sources in an amount sufficient to enable us to service our indebtedness, including the Debentures, or to fund our other liquidity needs. To service our indebtedness, we require a significant amount of cash. Our ability to make payments on, and to refinance our indebtedness, including the Debentures, to fund planned capital expenditures and to maintain sufficient working capital depends on our ability to generate cash in the future. This, to a certain extent, is subject to general economic, financial, competitive, legislative, regulatory and other factors that are beyond our control. As such, we may not be able to generate sufficient cash to service the Debentures or our other indebtedness, and may be forced to take other actions to satisfy our obligations under our indebtedness, such as reduce or delay capital expenditures, sell assets, seek additional capital or restructure or refinance all or a portion of our indebtedness, including the Debentures, on or before the maturity thereof, which may not be successful and could have a material adverse effect on our operations. We cannot assure you that we will be able to refinance any of our indebtedness, including the Debentures, on commercially reasonable terms or at all, or that the terms of that indebtedness will allow any of the above alternative measures or that these measures would satisfy our scheduled debt service obligations. If we are unable to generate sufficient cash flow to repay or refinance our debt on favorable terms, it could significantly adversely affect our financial condition, the value of our outstanding debt, including the Debentures, and our ability to make any required cash payments under our indebtedness, including the Debentures. Our ability to restructure or refinance our debt will depend on the condition of the capital markets and our financial condition at that time. Any refinancing of our debt could be at higher interest rates and may require us to comply with more onerous covenants, which could further restrict our business operations.
Our business results may be affected by currency and interest rate fluctuations and the hedging transactions we enter into in order to manage currency and interest rate related risks. We hold cash and cash equivalents, restricted cash and marketable securities mainly in euro and NIS. Our holdings in our PV Plants located in Spain and in the WtE Plants located in the Netherlands are denominated in euro and our holdings in the Talmei Yosef PV Plant and in Dori Energy are denominated in NIS. Our Debentures and the project finance obtained in connection with the Talmei Yosef PV Plant and the Manara PSP are denominated in NIS and the interest and principal payments are to be made in NIS. The financing for several of our PV Plants bears interest based on EURIBOR rate. Therefore our repayment obligations and undertakings may be affected by adverse movements in the exchange and interest rates. Although we attempt to manage these risks by entering into various swap interest and currency transactions as more fully explained in “Item 11: Quantitative and Qualitative Disclosures About Market Risk” below, we cannot ensure we will succeed in eliminating these risks in their entirety. These swap transactions may also impact the results of our operations due to fluctuations in their value based on changes in the relevant exchange or interest rate.
Our inability to effectively hedge interest rate, currency and other market-related risks may adversely affect our profitability. We use hedging instruments in an attempt to manage interest rate, currency and other market-related risks. If any of the variety of instruments we use to hedge our exposure to these various types of risk is not effective, we may incur losses, which may have an adverse effect on our financial condition. The majority of our derivative contracts are OTC derivatives, i.e., derivative contracts that are not transacted on an exchange. These derivatives are entered into under ISDA Master Agreements. If a counterparty defaults on these contracts, the underlying exposure would no longer be effectively hedged, which could result in losses. In addition, there can be no assurance that we will continue to be able to hedge risks related to current or future assets or liabilities in an efficient manner or at all. Disruptions such as market crises and economic recessions may put a strain on the availability and effectiveness of hedging instruments. For example, the expected transition away from LIBOR and similar benchmark rates may have a different impact on the hedged item and the hedging instrument, which could cause some of our hedge to become ineffective, resulting in potential losses.
If we do not conduct an adequate due diligence investigation of a target project or if certain events beyond our control occur, we may be required to subsequently take write-downs or write-offs, restructuring, and impairment or other charges that could have a significant negative effect on our financial condition, results of operations and our stock price. We must conduct a due diligence investigation of target projects that we intend to acquire or purchase an interest in. Intensive due diligence is time consuming and expensive due to the cost of the technical, accounting, finance and legal professionals involved in the due diligence process. Even if we conduct extensive due diligence on a target business, we cannot assure you that this due diligence will reveal all material issues that may affect a particular target project, or that factors outside the control of the target project and outside of our control will not later arise. If our due diligence review fails to identify issues specific to a target project, industry or the environment in which the target project operates, or if certain events or circumstances occur that are beyond our control, we may be forced to later write-down or write-off assets, restructure our operations, or incur impairment or other charges that could result in losses. Even though these charges may be non-cash items and may not have an immediate impact on our liquidity, the fact that we report charges of this nature could contribute to negative market perceptions about us or our ordinary shares.
We are currently operating in a period of economic uncertainty and capital markets disruption, which has been significantly impacted by geopolitical instability due to the ongoing military conflict between Russia and Ukraine. Our business, financial condition and results of operations may be materially and adversely affected by any negative impact on the global economy and capital markets resulting from the conflict in Ukraine or any other geopolitical tensions.
U.S. and global markets are experiencing volatility and disruption following the escalation of geopolitical tensions and the start of the military conflict between Russia and Ukraine. On February 24, 2022, a full-scale military invasion of Ukraine by Russian troops was reported. Although the length and impact of the ongoing military conflict is highly unpredictable, the conflict in Ukraine could lead to market disruptions, including significant volatility in commodity prices, credit and capital markets, as well as supply chain interruptions. We are continuing to monitor the situation in Ukraine and globally and assessing its potential impact on our business.
Additionally, Russia’s prior annexation of Crimea, recent recognition of two separatist republics in the Donetsk and Luhansk regions of Ukraine and subsequent military interventions in Ukraine have led to sanctions and other penalties being levied by the United States, European Union and other countries against Russia, Belarus, the Crimea Region of Ukraine, the so-called Donetsk People’s Republic, and the so-called Luhansk People’s Republic, including agreements to remove certain Russian financial institutions from the Society for Worldwide Interbank Financial Telecommunication payment system. Additional potential sanctions and penalties have also been proposed and/or threatened. Russian military actions and the resulting sanctions could adversely affect the global economy and financial markets and lead to instability and lack of liquidity in capital markets, potentially making it more difficult for us to obtain additional funds.
Any of the abovementioned factors could affect our business, prospects, financial condition, and operating results. The extent and duration of the military action, sanctions and resulting market disruptions are impossible to predict, but could be substantial. Any such disruptions may also magnify the impact of other risks described in this Form 20-F.
We may be deemed to be an “investment company” under the Investment Company Act of 1940, which could subject us to material adverse consequences. We could be deemed to be an “investment company” under the Investment Company Act if we invest more than 40% of our assets in “investment securities,” as defined in the Investment Company Act. Investments in securities of majority owned subsidiaries (defined for these purposes as companies in which we control 50% or more of the voting securities) are not “investment securities” for purposes of this definition. As our interest in Dori Energy is not considered an investment in majority owned securities, unless we maintain the required portion of our assets under our control, limit the nature of the requisite portion of our investments of our cash assets to cash and cash equivalents (which are generally not “investment securities”), succeed in making additional strategic “controlling” investments and continue to monitor our investment in Dori Energy, we may be deemed to be an “investment company.” We do not believe that our holdings in the Spanish PV Plants or the WtE Plants would be considered “investment securities,” as we control the PV Plants (other than the Talasol PV Plant) and the WtE Plants via wholly-owned subsidiaries. In addition, despite minority holder protective rights granted to the minority shareholders of the Talasol PV Plant and the Manara PSP, including several rights which effectively require the unanimous consent of all shareholders, we believe that our interests in the Talasol PV Plant and the Manara PSP do not constitute “investment securities” given, among other things, our majority shareholder and board membership status in the project companies. We do not believe that the current fair value of our holdings in Dori Energy (all as more fully set forth under “Business” below) and other relevant assets, all of which may be deemed to be “investment securities,” would result in our being deemed to be an “investment company.” If we were deemed to be an “investment company,” we would not be permitted to register under the Investment Company Act without an order from the SEC permitting us to register because we are incorporated outside of the United States and, prior to being permitted to register, we would not be permitted to publicly offer or promote our securities in the United States. Even if we were permitted to register, it would subject us to additional commitments and regulatory compliance. Investments in cash and cash equivalents might not be as favorable to us as other investments we might make if we were not potentially subject to regulation under the Investment Company Act. We seek to conduct our operations, including by way of investing our cash and cash equivalents, to the extent possible, so as not to become subject to regulation under the Investment Company Act. In addition, because we are actively engaged in exploring and considering strategic investments and business opportunities, and in fact the majority of our investments to date (mainly in the Italian, Spanish and Israeli photovoltaic power plants markets and in the Netherlands’ WtE market) were made through a controlling investment, we do not believe that we are currently engaged in “investment company” activities or business. These strategies may force us to pursue less than optimal business strategies or forego business arrangements and to forgo certain cash management strategies that could have been financially advantageous to us and to our financial situation and business prospect.
We may be characterized as a passive foreign investment company. Our U.S. Holders may suffer adverse tax consequences. Under the passive foreign investment company or “PFIC” rules, for any taxable year that our passive income or our assets that produce passive income exceeds specified levels, we will be characterized as a PFIC for U.S. federal income tax purposes. This characterization could result in adverse U.S. tax consequences for our U.S. Holders (as defined below), which may include having certain distributions on our ordinary shares and gains realized on the sale of our ordinary shares treated as ordinary income, rather than as capital gains income, and having potentially punitive interest charges apply to the proceeds of sales of our ordinary shares and certain distributions.
Certain elections may be made to reduce or eliminate the adverse impact of the PFIC rules for our U.S. Holders, but these elections may be detrimental to such U.S. Holders under certain circumstances. The PFIC rules are extremely complex and U.S. Holders are urged to consult independent tax advisers regarding the potential consequences to them of our classification as a PFIC.
Based on our income and/or assets, we believe that we were a PFIC with respect to any U.S. Holder that held our shares in 2008 through 2012. We also believe, based on our income and assets, that it is likely that we were not a PFIC with respect to U.S. Holders that initially acquired our ordinary shares in 2013-2021. However, the Internal Revenue Service may disagree with our determinations regarding our prior or present PFIC status and, depending on future events, we could become a PFIC in future years.
For a more detailed discussion of the consequences of our being classified as a PFIC, see “Item 10.E: Taxation” below under the caption “U.S. Tax Considerations Regarding Ordinary Shares.”
Risks Relating to our Ordinary Shares
You may have difficulty enforcing U.S. judgments against us in Israel. We are organized under the laws of Israel and our headquarters are in Israel. All of our officers and directors reside outside of the United States. Therefore, it may be difficult to effect service of process upon us or any of these persons within the United States. In addition, you may not be able to enforce any judgment obtained in the U.S. against us or any of such persons in Israel and in any event will be required to file a request with an Israeli court for recognition or enforcement of any non-Israeli judgment. Subject to certain time limitations, executory judgments of a United States court for liquidated damages in civil matters may be enforced by an Israeli court, provided that: (i) the judgment was obtained after due process before a court of competent jurisdiction, that recognizes and enforces similar judgments of Israeli courts and according to the rules of private international law currently prevailing in Israel, (ii) adequate service of process was effected and the defendant had a reasonable opportunity to be heard, (iii) the judgment and its enforcement are not contrary to the law, public policy, security or sovereignty of the State of Israel, (iv) the judgment was not obtained by fraud and does not conflict with any other valid judgment in the same matter between the same parties, (v) the judgment is no longer appealable, and (vi) an action between the same parties in the same matter is not pending in any Israeli court at the time the lawsuit is instituted in the foreign court. If a foreign judgment is enforced by an Israeli court, it will be payable in Israeli currency. You may not be able to enforce civil actions under U.S. securities laws if you file a lawsuit in Israel.
We may rely on certain Israeli “home country” corporate governance practices which may not afford shareholders the same protection afforded to stockholders of U.S. companies. As a foreign private issuer for purposes of U.S. securities laws, NYSE American LLC rules allow us to follow certain Israeli “home country” corporate governance practices in lieu of the corresponding NYSE American LLC corporate governance rules. Such home country practices may not afford shareholders the same level of rights or protections in certain matters as those of stockholders of U.S. domestic companies. To the extent we are entitled to elect to follow Israeli law and practice rather than corresponding U.S. law or practice, such as with regard to the requirement for shareholder approval of changes to option plans, our shareholders may not be afforded the same level of rights they would have under U.S. practice.
The rights and responsibilities of our shareholders are governed by Israeli law and differ in some respects from the rights and responsibilities of shareholders under U.S. law. We are incorporated under Israeli law. The rights and responsibilities of holders of our ordinary shares are governed by our memorandum and articles of association and Israeli law. These rights and responsibilities differ in some respects from the rights and responsibilities of shareholders in typical U.S. corporations. In particular, each shareholder of an Israeli company has a duty to act in good faith in exercising his or her rights and fulfilling his or her obligations toward the company and other shareholders and to refrain from abusing his power in the company, including, among other things, in voting at the general meeting of shareholders on certain matters. Israeli law provides that these duties are applicable in shareholder votes on, among other things, amendments to a company’s articles of association, increases in a company’s authorized share capital, mergers and interested party transactions requiring shareholder approval. In addition, a controlling shareholder of an Israeli company or a shareholder who knows that it possesses the power to determine the outcome of a shareholder vote or who has the power to appoint or prevent the appointment of a director or officer in the company has a duty of fairness toward the company. However, Israeli law does not define the substance of this duty of fairness. Because Israeli corporate law has undergone extensive revisions in recent years, there is little case law available to assist in understanding the implications of these provisions that govern shareholder behavior.
You may be diluted by the future issuance of additional ordinary shares, among other reasons, for purposes of carrying out future acquisitions, financing needs, and also as a result of our incentive and compensation plans. In the past three years we issued 2,143,750 ordinary shares in private placements including through exercise of warrants. In addition, on October 26, 2020, we issued a new series of options (the Series 1 Options), tradable on the Tel Aviv Stock Exchange, to purchase an aggregate of 385,000 ordinary shares at an exercise price per share of NIS 150 (subject to adjustments upon customary terms) and on February 23, 2021 we issued our Series D Convertible Debentures, which are convertible into an aggregate of 375,757 ordinary shares at a conversion price per share of NIS 165 (subject to adjustments upon customary terms). In the event some or all of our Series 1 Options are exercised, or some or all of our Series D Convertible Debentures are converted, you may experience dilution of your percentage of holdings in our ordinary shares. We may also choose to raise additional equity capital in the future for various reasons and purposes. The issuance of any additional ordinary shares in the future, or any securities that are exercisable for or convertible into our ordinary shares, will have a dilutive effect on our shareholders as a consequence of the reduction in the percentage ownership.
Tax audits may result in an obligation to make material payments to tax authorities at the conclusion of these audits. We conduct our business globally (currently in Israel, Luxembourg, Italy, Spain and The Netherlands). Our domestic and international tax liabilities are subject to the allocation of revenues and expenses in different jurisdictions and the timing of recognizing revenues and expenses. Additionally, the amount of income taxes paid is subject to our interpretation of applicable laws in the jurisdictions in which we file. Not all of the tax returns of our operations in other countries and in Israel are final and we may be subject to further audit and assessment by the applicable tax authorities. For example, during 2018, following a tax inspection and a final settlement reached with the tax authorities, we reduced our carry forward tax losses by approximately €20 million. Such audits often result in proposed assessments and any estimation of the potential outcome of an uncertain tax issue is a matter for judgment, which can be subjective and highly complex. While we believe we comply with applicable tax laws and that we provided adequately for any reasonably foreseeable outcomes related to the tax audit, there can be no assurance that a governing tax authority will not have a different interpretation of the law and assess us with additional taxes, as a result of which our future results may be adversely affected. Although we believe our estimates to be reasonable, the ultimate outcome of such audits, and of any related litigation, could differ materially from our provisions for taxes, which may have a material adverse effect on our consolidated financial statements.
We are controlled by a small number of shareholders, who may make decisions with which you may disagree and which may also prevent a change of control via purchases in the market. Currently, a group of investors comprised of Kanir Joint Investments (2005) Limited Partnership, or Kanir, and S. Nechama Investments (2008) Ltd., or Nechama Investments, hold an aggregate of 44.6% of our outstanding ordinary shares. Shlomo Nehama, our Chairman of the Board who controls Nechama Investments holds directly an additional 3.6% of our outstanding ordinary shares and the estate of Mr. Hemi Raphael, which holds a majority of the outstanding shares of Kanir Investments Ltd., or Kanir Ltd., the general partner of Kanir, holds an additional 2% of our outstanding ordinary shares. Therefore, acting together, these shareholders could exercise significant influence over our business, including with respect to the election of our directors and the approval of change in control and other material transactions. This concentration of control may have the effect of delaying or preventing changes in control or changes in management, or limiting the ability of our other shareholders to approve transactions that they may deem to be in their best interest. In addition, due to this concentration of control, we are deemed a “controlled company” for purposes of NYSE American LLC rules and as such we are not subject to certain NYSE American LLC corporate governance rules. Moreover, our Second Amended and Restated Articles includes the casting vote provided to our Chairman of the Board under certain circumstances and the ability of members of our Board to demand that certain issues be approved by our shareholders, requiring a special majority, all as more fully described in “Memorandum of Association and Second Amended and Restated Articles” below may have the effect of delaying or preventing certain changes and corporate actions that would otherwise benefit our shareholders.
Our failure to maintain effective internal controls over financial reporting could materially adversely affect our reported financial information and the market price of our ordinary shares. We are characterized as an “accelerated filer” under the US Securities Law. Among other things, this characterization imposes a requirement that our registered public accounting firm issue an attestation report as to our internal control over financial reporting in connection with the filing of the Annual Report on Form 20-F for each fiscal year. Our efforts to comply with the requirements of Section 404 of the Sarbanes-Oxley Act of 2002 have resulted in increased general and administrative expenses and a diversion of management time and attention, and we expect these efforts to require the continued commitment of resources. We cannot predict the outcome of our testing in future periods. If we fail to maintain the adequacy of our internal controls, we may not be able to ensure that we or our registered public accounting firm can conclude on an ongoing basis that we have effective internal controls over financial reporting. Failure to maintain effective internal controls over financial reporting could result in investigation or sanctions by regulatory authorities, and could have a material adverse effect on our operating results, investor confidence in our reported financial information, and the market price of our ordinary shares.
Our ordinary shares are listed in two markets and this may result in price variations that could affect the trading price of our ordinary shares. Our ordinary shares are listed on the NYSE American LLC and on the Tel Aviv Stock Exchange, or TASE, both under the symbol “ELLO.” Trading in our ordinary shares on these markets is made in different currencies (U.S. dollars on the NYSE American LLC and New Israeli Shekels on the TASE), and at different times (due to the different time zones, different trading days and different public holidays in the United States and Israel). The trading prices of our ordinary shares on these two markets may differ due to these and other factors. Any decrease in the trading price of our ordinary shares on one of these markets could cause a decrease in the trading price of our ordinary shares on the other market.
We have not paid a cash dividend or executed a buyback of a substantial number of shares since 2016 and there is no assurance we will do so in the future. We have not paid any cash dividends or announced a share buyback plan since 2016. Future dividends or future share buyback plans will depend on our earnings, if any, capital requirements, general financial condition and applicable legal and contractual constraints in connection with distribution of profits, and will be within the discretion of our then-board of directors. There can be no assurance that any additional dividends will be paid or share buyback programs adopted, as to the timing or the amount of the dividends or share buyback programs, or as to whether our Board of Directors will elect to distribute our profits by means of share repurchases or a distribution of a cash or other dividend. In addition, the terms of the deeds of trust governing our Debentures restrict our ability to made “distributions” (as such term is defined in the Israeli Companies Law, 1999, as amended, or the Companies Law, which includes cash dividends and repurchase of shares). For more information see “Item 5.B: Liquidity and Capital Resources” and “Item 8.A: Financial Information; Consolidated Statements and Other Financial Information; Dividends” below.
Our stock price has been very volatile in the past and may in the future be volatile, which could adversely affect the market liquidity of our ordinary shares and our ability to raise additional funds. The market liquidity and analyst coverage of our ordinary shares is limited. Our ordinary shares have experienced substantial price volatility in the past, particularly during periods of very limited volume of trading in our ordinary shares resulting in every transaction performed significantly influencing the market price. Although our ordinary shares are listed both on the NYSE American LLC and on the TASE, there is still limited liquidity, and combined with the general economic and political conditions, these circumstances cause the market price for our ordinary shares to continue to be volatile. The continuance of such factors and other factors relating to our business may materially adversely affect the market price of our ordinary shares in the future and could result in lower prices for our ordinary shares than might otherwise prevail and in larger spreads between the bid and asked prices for our ordinary shares. These issues could materially impair our ability to raise funds through the issuance of our ordinary shares in the securities markets.
Provisions of Israeli law may delay, prevent or make difficult an acquisition of Ellomay or a controlling position in Ellomay, which could prevent a change of control and, therefore, depress the price of our shares. Israeli corporate law regulates mergers, requires tender offers for acquisitions of shares above specified thresholds, requires special approvals for transactions involving directors, officers or significant shareholders and regulates other matters that may be relevant to these types of transactions. Furthermore, Israeli tax considerations may make potential transactions unappealing to us or to some of our shareholders. These provisions of Israeli law may delay, prevent or make difficult an acquisition of Ellomay, which could prevent a change of control and therefore depress the price of our shares.
ITEM 4: Information on Ellomay
A. History and Development of Ellomay
Our legal and commercial name is Ellomay Capital Ltd. Our office is located at 18 Rothschild Boulevard, 1st floor, Tel-Aviv 6688121, Israel, and our telephone number is +972-3-7971111. Our registered agent in the United States is CT Corporation System, 111 Eight Avenue, New York, New York 10011.
We were incorporated as an Israeli corporation under the name Nur Advertisement Industries 1987 Ltd. on July 29, 1987. On August 1, 1993, we changed our name to NUR Advanced Technologies Ltd., on November 16, 1997 we again changed our name to NUR Macroprinters Ltd. and on April 7, 2008, in connection with the closing of the sale of our business to HP, we again changed our name to Ellomay Capital Ltd. Our corporate governance is controlled by the Companies Law.
Our ordinary shares are currently listed on the NYSE American LLC and are also listed on the Tel Aviv Stock Exchange under the trading symbol “ELLO” pursuant to the Israeli regulatory “dual listing” regime that provides companies whose securities are listed both in the NYSE American LLC and the TASE certain reporting leniencies.
Recent Developments
The Talasol PV Plant
Achievement of PAC
The Talasol PV Plant reached mechanical completion in September 2020 and was connected to the electricity grid and electricity production commenced at the end of December 2020. In parallel to the connection to the grid, hot commissioning tests have been initiated by the EPC contractor. On January 27, 2021, the EPC finalized the performance tests and the Provisional Acceptance Certificate (PAC) was signed.
Refinancing of Talasol Project Finance
In January 2022, Talasol achieved financial closing of a Facilities Agreement in the aggregate amount of €175 million provided by European institutional lenders, or the Talasol New Financing. The Talasol New Financing provides for the provision of a term loan facility in two tranches: (i) a term loan in the amount of €155 million of which the final maturity date is June 30, 2044, and (ii) a term loan in the amount of €20 million of which the final maturity date is December 31, 2042. The weighted average life of the Talasol New Financing is approximately 11.5 years, compared to an original weighted average life of 5.5 years of the original project finance of Talasol, or the Talasol Previous Financing. The Talasol New Financing bears a fixed annual interest rate at a weighted average of approximately 3%, compared to a variable interest rate that was fixed at an average of approximately 3% by an interest rate swap contract in the Talasol Previous Financing.
The uses of the Talasol New Financing amount are as follows: (1) prepayment of the outstanding €121 million amount of the Talasol Previous Financing; (2) deposit of €6.9 million in Talasol’s bank account as a debt service fund; (3) deposit of €10 million in Talasol’s bank account as security for a letter of credit to the PPA provider, or the Talasol PPA Security Fund, (4) unwinding the interest rate SWAP entered into in connection with the Previous Financing in an amount of €3.29 million; (5) transaction costs in an amount of approximately €3 million; and (6) an expected special dividend to Talasol’s shareholders in an amount of approximately €30 million.
The Talasol PPA Security Fund will be reduced by €1 million every year, up to a minimum amount of €3.5 million, which will be released at the expiration of the PPA.
Ellomay Solar
We are promoting the construction, through an indirectly wholly-owned subsidiary, Ellomay Solar S.L.U., or Ellomay Solar, of a PV plant in a plot adjacent to the land on which the Talasol PV Plant is located, or the Ellomay Solar Project. This PV plant is planned to have a capacity of 28 MW and Ellomay Solar received a grid connection permit and executed a land lease agreement.
The early works under the EPC agreement commenced on March 1, 2021 and the Notice to Proceed was granted on June 7, 2021. The Ellomay Solar project is waiting for final permits and the achievement of PAC (preliminary acceptance certificate) of the photovoltaic plant held by Ellomay Solar is expected by the end of April 2022.
The Manara PSP
On February 14, 2021, we announced the fulfillment of conditions precedent under the Manara PSP Conditional License, including financial closing and execution of EPC and O&M Agreements.
In April 2021, a notice to commence was issued to Electra Infrastructures Ltd., the EPC contractor of the Manara PSP, and construction of the Manara PSP commenced. The construction period of the Manara PSP is expected to be approximately 62.5 months.
For more information, see “Item 4.B: Business Overview” under the heading “Pumped Storage Project in the Manara Cliff in Israel.”
The construction of the Manara PSP and the connection of this project to the grid are subject to risks and uncertainties. For more information concerning these and other risks see under “Item 3.D: Risk Factors - Risks Related to our Business.”
PV Projects under Development
As of December 31, 2021, we had additional photovoltaic projects under various development stages as follows: (i) under advanced development stages – 439 MW in Italy and 40 MW plus storage in Israel; and (ii) in early development stages – 850 MW in Italy and Spain. In February 2022, EPC agreements were executed with respect to the first two projects in Italy that are in advanced development stages (with an aggregate capacity of approximately 20 MW) and construction of such projects commenced during January 2022. Construction of another adjacent project (15MW) is currently expected to commence during the second quarter of 2022.
We continue promoting the development of these and other new projects. Due to the travel restrictions imposed in connection with Covid-19, the works is mainly performed through conference calls and other telecommunication measures. We have local managers in each of our countries of operations (Spain, Italy and the Netherlands) that continue advancing the ongoing operations under the guidance of the business development team located in Israel.
The advancement and development of these and other projects are subject to the projects reaching several milestones, including receipt of regulatory approvals and authorizations, procurement of land rights, obtaining financing, commencement and completion of construction and connection to the grid, and to various risks and uncertainties applicable to projects under development as more fully set forth under “Item 3.D: Risk Factors” above.
There can be no assurance as to how many projects, if any, will reach the final stage of connection to the grid and operational status. We may advance some or all of the projects with partners and therefore we may not wholly-own such projects in the future.
Additional Series C Debentures Offering in Israel
On February 23, 2021, we issued additional Series C Debentures in a public offering in Israel in an aggregate principal amount of NIS 100.939 million (approximately €29 million). For additional information concerning the Series C Debentures see “Item 5.B: Liquidity and Capital Resources” and “Item 10.C: Material Contracts.”
Series D Convertible Debentures Offering in Israel
On February 23, 2021, we issued new Series D Convertible Debentures in a public offering in Israel in the aggregate principal amount of NIS 62 million (approximately €17.6 million). For additional information concerning the Series D Convertible Debentures see “Item 5.B: Liquidity and Capital Resources” and “Item 10.C: Material Contracts.”
Additional Series C Debentures Offering in Israel
On October 25, 2021, we issued additional Series C Debentures in a private offering in Israel to Israeli classified investors in an aggregate principal amount of NIS 120 million (approximately €34.1 million).
Our Debentures are listed for trading on the TASE. However, our Debentures are not registered under the Securities Act, and may not be offered or sold in the United States or to U.S. Persons (as defined in Regulation “S” promulgated under the Securities Act) without registration under the Securities Act or an exemption from the registration requirements of the Securities Act.
Early Repayment of Series B Debentures
On March 18, 2021, our Series B Debentures were repaid in full. Pursuant to the terms of the deed of trust governing the Series B Debentures, the early repayment consisted of a principal payment in the amount of approximately NIS 86.3 million (approximately €21.5 million), accrued interest in the amount of approximately NIS 0.7 million (approximately €0.16 million) and a prepayment charge of approximately NIS 3.4 million (approximately €0.86 million), amounting to an aggregate repayment amount of approximately NIS 90.4 million (approximately €22.5 million).
Exercise of Warrants to Purchase Ordinary Shares
During January and February 2021, Israeli institutional investors who purchased our ordinary shares and warrants in a private placement consummated in February 2020, exercised all of the warrants issued to them in such private placement. As a result, we issued an aggregate of 178,750 ordinary shares, at a price per ordinary share of NIS 80 (approximately $24.6 based on the Dollar/NIS exchange rate at that time), and received gross proceeds of NIS 14.3 million (approximately $4.4 million).
Principal Capital Expenditures and Divestitures
From 2017 through March 1, 2022, we made aggregate capital expenditures of approximately €250 million in connection with our operating Spanish PV Plants. Our aggregate capital expenditures in connection with the acquisition of the Talmei Yosef PV Plant was approximately €11.9 million. Our aggregate capital expenditures in connection with PV Plants under development in Europe and Israel was approximately €5.5 million. The aggregate capital expenditures in connection with the Manara PSP through March 1, 2022, including amounts recorded in the general and administrative expense, were approximately €95 million. From 2017 through March 1, 2022, capital expenditures incurred by the project companies in connection with the Waste-to-Energy Projects in the Netherlands were approximately €34.5 million.
For further information on our financing activities please refer to “Item 4.B: Business Overview” and “Item 5: Operating and Financial Review and Prospects.”
The SEC maintains an Internet site (http://www.sec.gov) that contains reports, proxy and information statements and other information regarding registrants that we file electronically with the SEC. These SEC filings are also available to the public from commercial document retrieval services. Our website is http://www.ellomay.com. The information on our website is not incorporated by reference into this annual report.
B. Business Overview
We are involved in the production of renewable and clean energy. We own six PV Plants that are operating and connected to their respective national grids as follows: (i) four photovoltaic plants in Spain with an aggregate installed capacity of approximately 7.9 MW, (ii) 51% of Talasol, which owns a photovoltaic plant with installed capacity of 300 MW in the municipality of Talaván, Cáceres, Spain that was connected to the Spanish electricity grid in the end of December 2020, and (iii) one photovoltaic plant in Israel with an installed capacity of approximately 9 MW. In addition, we indirectly own: (i) 9.375% of Dorad, which owns an approximate 860 MWp dual-fuel operated power plant in the vicinity of Ashkelon, Israel, (ii) 83.333% of Ellomay PS, which is constructing the Manara PSP, (iii) Ellomay Solar S.L.U. that is constructing a photovoltaic plant with installed capacity of 28MW in the municipality of Talaván, Cáceres, Spain, and (iv) Groen Gas Goor B.V., Groen Gas Oude-Tonge B.V. and Groen Gas Gelderland B.V., project companies operating anaerobic digestion plants in the Netherlands, with a green gas production capacity of approximately 3 million, 3.8 million and 9.5 million (with a license to produce 7.5 million) Nm3 per year, respectively.
Photovoltaic Industry Background
Clean electricity generation accounts for a growing share of electric power. While a majority of the world’s current electricity supply is still generated from fossil fuels such as coal, oil and natural gas, these traditional energy sources face a number of challenges including fluctuating prices, security concerns over dependence on imports from a limited number of countries, and growing environmental concerns over the climate change risks associated with power generation using fossil fuels. As a result of these and other challenges facing traditional energy sources, governments, businesses and consumers are increasingly supporting the development of alternative energy sources, including solar energy, the fastest-growing source of renewable energy.
By extracting energy directly from the sun and converting it into an immediately usable form, either as heat or electricity, intermediate steps are eliminated.
Global trends in the industry
Solar PV power in the European Union has shown strong resilience despite Covid-19 negatively impacting everyone’s life in many aspects. Surprisingly, demand for solar power technology in the European Union did not decrease but rather increased notably. EU members states installed 18.2 GW of solar power capacity in 2020, an 11% improvement over the 16.2 GW deployed in the previous year.
For the next 2 years, SolarPower Europe projects 27.4 in 2022 and 30.8 GW in 2023, translating into 15% and 18% higher deployments than in their EMO 2019. And in 2024, SolarPower Europe sees demand crossing the 35 GW level, bringing total installed solar PV capacity to 253 GW.
The Asia-Pacific (APAC) is projected to lead the PV market from 2020 to 2025. The market growth can be attributed to the presence of key players such as JinkoSolar (China), JA Solar (China), Trina Solar (China), and LONGi (China) in APAC. The growing adoption of PV modules in countries such as China, Japan, and India is fueling the growth of the market. These countries are among the top 5 players in the photovoltaic market in APAC with a cumulative installed photovoltaic capacity of ~300 GW as of 2019. Moreover, the region is the largest producer and consumer of PV modules and related PV components. Various initiatives and favorable policies launched by governments of different countries in APAC to promote the use of solar energy are expected to propel the demand for PV systems in the region during the forecast period.
At the end of 2020, Israel’s total installed renewable energy capacity, as per the Report on the State of the Electricity Sector of the Israeli Electricity Authority, was 2.5 GW, constituting 13% of the total capacity in the Israeli electricity market, with solar contributing 2.2 GW (1.4 GW from dual-use photovoltaic systems and 0.8 GW from land photovoltaic systems).In October 2020, the Israeli government approved a plan to deploy around 15 GW more solar capacity to help raise the 2030 target for the proportion of national electricity drawn from renewables from 17% to 30%. The Israeli Electricity Authority forecasted in its 2020 report that the total installed renewable energy capacity at the end of 2025 will be 9.8 MW (of which 4.2 GW will be in dual-use photovoltaic systems and 3.7 GW will be from land photovoltaic systems), which is expected to constitute 35% of the total capacity expected in Israel at that time. The original renewable energy directive (2009/28/EC) establishes an overall policy for the production and promotion of energy from renewable sources in the EU. It requires the EU to fulfil at least 20% of its total energy needs with renewables by 2020 – to be achieved through the attainment of individual national targets. All EU countries must ensure that at least 10% of their transport fuels come from renewable sources by 2020.
In December 2018, the revised renewable energy directive 2018/2001/EU entered into force, as part of the clean energy for all Europeans package, aimed at keeping the EU a global leader in renewables and, more broadly, helping the EU to meet its emissions reduction commitments under the Paris Agreement.
The new directive establishes a new binding renewable energy target for the EU for 2030 of at least 32%, with a clause for a possible upwards revision by 2023.
Anatomy of a Solar Power Plant
Solar power systems convert the energy in sunlight directly into electrical energy within solar cells based on the photovoltaic effect. Multiple solar cells, which produce DC power, are electrically interconnected into solar panels. A typical solar panel may have several dozens of individual solar cells. Multiple solar panels are electrically wired together and are electrically wired to an inverter, which converts the power from DC to AC and interconnects with the utility grid.
Solar electric cells convert light energy into electricity at the atomic level. The conversion efficiency of a solar electric cell is defined as the ratio of the sunlight energy that hits the cell divided by the electrical energy that is produced by the cell. In recent years, effort in the industry has been directed towards the development of solar cell technology that reduces per watt costs and increases conversion efficiency. Solar electric cells today are getting better at converting sunlight to electricity, but commercial panels still harvest only part of the radiation they are exposed to. Scientists are working to improve solar panels’ efficiency using various methods.
Solar electric panels are composed of multiple solar cells, along with the necessary internal wiring, aluminum and glass framework, and external electrical connections.
Inverters convert the DC power from solar panels to the AC power distributed by the electricity grid. Grid-tie inverters synchronize to utility voltage and frequency and only operate when utility power is stable (in the case of a power failure these grid-tie inverters shut down to safeguard utility personnel from possible harm during repairs). Inverters also operate to maximize the power extracted from the solar panels, regulating the voltage and current output of the solar array based on sun intensity.
Monitoring. There are two basic approaches to access information on the performance of a solar power system. The most accurate and reliable approach is to collect the solar power performance data locally from the counters and the inverter with a hard-wired connection and then transmit that data via the internet to a centralized database. Data on the performance of a system can then be accessed from any device with a web browser, including personal computers and cell phones. As an alternative to web-based remote monitoring, most commercial inverters have a digital display on the inverter itself that shows performance data and can also display this data on a nearby personal computer with a hard-wired or wireless connection.
Tracker Technology vs. Fixed Technology
Some of our PV Plants use fixed solar panels while others use panels equipped with single or dual axis tracking technology. Tracking technology is used to minimize the angle of incidence between the incoming light and a photovoltaic panel. As photovoltaic panels accept direct and diffuse light energy and panels using tracking technology always gather the available direct light, the amount of energy produced by such panels, compared to panels with a fixed amount of installed power generating capacity, is higher. As the double axis trackers allow the photovoltaic production to stay closer to maximum capacity for many additional hours, an increase of approximately 20% (single) - 30% (dual) of the photovoltaic modules plane irradiation can be estimated. On the other hand, tracker technology requires more complex and expensive operations and maintenance and, as this is a more sophisticated technology, it is exposed to more defects.
Energy Storage Solutions
According to a new study published by the European Commission, innovative energy storage solutions will play an important role in ensuring the integration of renewable energy sources into the grid in the EU at the lowest cost. This will help the EU reach its 2050 de-carbonization objectives under the European Green Deal while ensuring Europe’s security of energy supply. This independent study, titled “Energy Storage Study - Contribution to the security of electricity supply in Europe”, analyzes the different flexibility energy storage options that will be needed to reap the full potential of the large share of variable energy sources in the power system. This study notes that the main energy storage reservoir in the EU at the moment is pumped hydro storage. However, as prices fall, new battery technology projects are emerging - such as lithium-ion batteries and behind-the-meter storage.
Solar Power Benefits
The direct conversion of light into energy offers the following benefits compared to conventional energy sources:
| • | Reliability - Solar energy production does not require fossil fuels and is therefore less dependent on this limited natural resource with volatile prices. Although there is variability in the amount and timing of sunlight over the day, season and year, a properly sized and configured system can be designed to be highly reliable while providing long-term, fixed price electricity supply. |
| • | Convenience - Solar power systems can be installed on a wide range of sites, including small residential roofs, the ground, covered parking structures and large industrial buildings. Most solar power systems also have few, if any, moving parts and are generally guaranteed to operate for 20-25 years, resulting in low maintenance and operating costs and reliability compared to other forms of power generation. |
| • | Cost-effectiveness - While solar power has historically been more expensive than fossil fuels, there are continual advancements in solar panel technology which increase the efficiency and lower the cost of production, thus making the production of solar energy even more cost effective. |
| • | Environmental - Solar power is one of the cleanest electric generation sources, capable of generating electricity without air or water emissions, noise, vibration, habitat impact or waste generation. In particular, solar power does not generate greenhouse gases that contribute to global climate change or other air pollutants, as power generation based on fossil fuel combustion does, and does not generate radioactive or other wastes as nuclear power and coal combustion do. It is anticipated that environmental protection agencies will limit the use of fossil fuel based electric generation and increase the attractiveness of solar power as a renewable electricity source. |
| • | Security - Producing solar power improves energy security both on an international level (by reducing fossil energy purchases from hostile countries) and a local level (by reducing power strains on local electrical transmission and distribution systems). |
These benefits impacted our decision to enter into the solar photovoltaic market. We believe the fluctuations in fuel costs, environmental concerns and energy security make it likely that the demand for solar power production will continue to grow. Many countries, including Italy and Spain, have put incentive programs in place to spur the installation of grid-tied solar power systems. For further information please see “Material Effects of Government Regulations on the PV Plants.”
Measuring the Performance of Solar Power Plants
One of the main factors for measuring the efficiency and quality of a power plant is the performance ratio (PR). The performance ratio is stated as percent and describes the relationship between the actual and theoretical energy outputs of the PV plant. This calculation provides the proportion of the energy that is actually available for export to the electricity grid after deduction of any energy losses and of energy consumption for the operation of the PV plant. The performance ratio can be used to compare PV plants at different locations as the calculation is independent of the location of a PV plant. The closer the performance ratio is to 100%, the more efficient the relevant PV plant is operating, however a PV plant cannot reach a performance ratio of 100% as there are inevitable losses and use of energy of the PV plant. High-performance PV plants can however reach a performance ratio higher than 80%.
There are several risk factors associated with the photovoltaic market. See “Item 3.D: Risk Factors - Risks Related to our Business.”
Our Photovoltaic Plants
The following table includes information concerning our PV Plants:
| Installed Production / Capacity1
| | | | | Revenue in the year ended December 31, 2020 (in thousands)2
| Revenue in the year ended December 31, 2021 (in thousands)2
|
| “Rinconada II” | 2,275 kWp | Municipality of Córdoba, Andalusia, Spain | PV – Fixed Panels | July 2010 | N/A | €732 | €698 |
| “Rodríguez I” | 1,675 kWp | Province of Murcia, Spain | PV – Fixed Panels | November 2011 | N/A | €531 | €550 |
| “Rodríguez II” | 2,691 kWp | Province of Murcia, Spain | PV – Fixed Panels | November 2011 | N/A | €882 | €907 |
| “Fuente Librilla” | 1,248 kWp | Province of Murcia, Spain | PV – Fixed Panels | June 2011 | N/A | €432 | €432 |
| “Talmei Yosef” | 9,000 kWp | Talmei Yosef, Israel | PV – Fixed Panels | November 2013 | 0.98573 (NIS/kWh) | €1,066 | €1,016 |
| “Talasol” | 300,000 kWp | Talaván, Cáceres, Spain | PV – Fixed Panels | December 2020 | N/A | --5 | €28,494 |
| 1. | The actual capacity of a photovoltaic plant is generally subject to a degradation of 0.5%-0.7% per year, depending on climate conditions and quality of the solar panels. |
| 2. | These results are not indicative of future results due to various factors, including changes in the climate and the degradation of the solar panels. |
| 3. | The tariff of NIS 0.9631/kWh is fixed for a period of 20 years and is updated once a year based on changes to the Israeli CPI of October 2011. The tariff increased from NIS 0.976/kWh in November 2013 to NIS 1.005/kWh in 2020 and decreased to NIS 0.9946/kWh on 2021. |
| 4. | As a result of the accounting treatment of the Talmei Yosef PV Plant as a financial asset, out of total proceeds from the sale of electricity of approximately €4.1 million and €4.3 million for the years ended December 31, 2020 and 2021, respectively, only revenues related to the ongoing operation of the plant in the amount of approximately €1million are recognized as revenues in each of 2020 and 2021. |
| 5. | The Talasol PV Plant is 51% owned by us and the revenues included in the table reflect 100% ownership. As the Talasol PV Plant was connected to the Spanish national grid at the end of December 2020 and achieved PAC in January 2021, no revenues were recorded in connection with this PV Plant for the year ended December 31, 2020 and until PAC was achieved in January 2021. Revenues generated prior to the achievement of PAC (in the amount of approximately €0.9 million) were capitalized to fixed assets. |
Photovoltaic Plants
The construction and operation of photovoltaic plants entail the engagement of Contractors, in order to build, assemble, install, test, commission, operate and maintain the photovoltaic power plants, for the benefit of our wholly-owned subsidiaries.
Each of the PV Plants is constructed and operates on the basis of the following main agreements:
| • | Development Agreement with a local experienced developer for the provision of development services with respect to photovoltaic greenfield projects from initial processing, obtaining of approvals and clearances with the aim of reaching “ready to build” status; |
| • | an Engineering, Procurement & Construction projects Contract, or an EPC Contract, which governs the installation, testing and commissioning of a photovoltaic plant by the respective Contractor; |
| • | an Operation and Maintenance (O&M) Agreement, which governs the operation and maintenance of the photovoltaic plant by the respective Contractor; |
| • | a number of ancillary agreements, including: |
| o | one or more “surface rights agreements” or “lease agreements” with the land owners, which provide the terms and conditions for the lease of land on which the photovoltaic plants are constructed and operated; |
| o | optionally, one or more “project financing agreements” with financing entities, as were already executed with respect to several of the PV Plants and as more fully described below, and as may be executed in the future with respect to one or more of the remaining PV Plants; and |
| o | a stock purchase agreement in the event we acquire an existing company that owns a photovoltaic plant that is under construction or is already constructed. |
With respect to our Spanish PV Plants –
| • | Standard “power distribution agreements” with the applicable Spanish power distribution grid company such as Endesa Distribución Eléctrica, S.L.U., or Endesa, or Iberdrola Distribución Eléctrica, S.A.U., or Iberdrola, regarding the rights and obligations of each party, concerning, inter alia, the evacuation of the power generated in the plant to the grid; |
| • | Standard “representation agreements” with an entity that will act as the energy sales agent of the PV Plant in the energy market, in accordance with Spanish Royal Decree 436/2004; and |
| • | Assignment Contract (“contrato de encargo de proyecto”) and the Technical Access Contract (“Contracto técnico de acceso a la red de transporte") with Red Eléctrica de España (the Spanish grid operator, or REE). |
With respect to our Israeli PV Plant:
| • | A power purchase agreement with the IEC for the purchase of electricity by the IEC with a term of 20 years commencing on the date of connection to the grid. |
With respect to Italian PV Plants to be developed or held in the future –
| • | one or more “power purchase agreements” with GSE, specifying the power output to be purchased by GSE for resale and the consideration in respect thereof or, alternatively, a “power purchase agreements” with a private energy broker, specifying the power output to be purchased for resale and the consideration in respect thereof; |
| • | one or more “interconnection agreements” with the Enel Distribuzione S.p.A, or ENEL, the Italian national electricity grid operator, which provide the terms and conditions for the connection to the Italian national grid; and |
| • | to the extent the FiT or any other incentive will be applicable - standard “incentive agreements” with GSE, Italy’s energy regulation agency responsible, inter alia, for incentivizing and developing renewable energy sources in Italy and purchasing energy and re-selling it on the electricity market. Under such agreements, it is anticipated that GSE will grant the applicable FiT governing the purchase of electricity (FiTs are further detailed in “Material Effects of Government Regulations on the Italian PV Plants”). |
All of our PV Plants are operational and the summaries below describe the material terms of the O&M Agreements executed in connection with such PV Plants.
Operation and Maintenance Agreements
General
As mentioned above, each of the PV Plants is operated and maintained by a local contractor pursuant to an O&M Agreement executed between such Contractor and our subsidiary that owns the PV Plant, or the PV Principal. Each O&M Agreement sets out the terms under which each of the Contractors is to operate and maintain the PV Plant once it becomes operational.
In our Talmei Yosef PV Plant and Talasol PV Plant, a technical adviser, or the Technical Advisor, was appointed by the Financing Entity, to monitor the performance of the services. Our current Technical Advisers in Spain and Israel is a leading technical firm which appears in the banks’ white list.
We expect that, if required, we could replace some or all of our current O&M Contractors with other contractors and service providers. However, we cannot ensure that if such replacement shall take place we will be able to receive the same terms and warranties from the new contractor. In addition, to the extent the relevant PV Plant received financing from a bank or other financing institution, the applicable financing agreement generally requires that we obtain the financing institution’s approval for the replacement of an O&M contractor.
The Services
Each O&M Agreement governs the provision of the following services: (i) Subscription Services, which include Preventive Maintenance Services (maintenance services such as cleaning of panels and taking care of vegetation, surveillance, remote supervision of operation and full operational status of the PV Plant) and Corrective Maintenance Services (services to correct incidents arising at the PV Plant or to remedy any anomaly in the operation of the PV Plant), and (ii) Non-Subscription Services, which are all services outside the scope of the Subscription Services. In some cases, certain engagement agreements are executed by us directly with service providers (such as internet, security services, etc.).
The Consideration
Based on the range of services offered by the Contractor, the annual consideration for the Subscription Services in our operating PV Plants, other than Talasol, varies from €12,800 to €20,700 per MWp (linked to the local Consumer Price Index) for each of the PV Plants, paid in the majority of the PV Plants on a quarterly basis. The annual consideration for the Talasol O&M services amounts to approximately €2 million, paid on a monthly basis. The Subscription Services fee is fixed and the Contractor is not entitled to request an increase in the price due to the occurrence of unforeseen circumstances. This annual consideration does not include the price of the insurance policies to be obtained by the PV Principal, including all risk insurance policies.
Contractor’s Obligations, Representations and Warranties
The Contractor’s obligations under the O&M Agreement include, inter alia, the duty to diligently perform the operation and maintenance services in compliance with the applicable law and permits in a workmanlike manner and using the most advanced technologies, to manage the spare parts and replenish the inventory as needed, and to assist the PV Principal and the Financing Entity in dealing with the authorities by providing the necessary information required by such authorities. The Contractor represents and warrants, inter alia, that it holds the necessary permits and authorizations, and that it has the necessary skills and experience to perform the services contemplated by the O&M Agreement.
Termination
Each party may terminate the O&M Agreement (to the extent applicable, after obtaining the approval of the financing entity) if the other is in breach of any of its obligations that remain uncured for 30 days following written notice thereof.
The O&M Agreement is terminated if the Contractor is liquidated or becomes bankrupt or insolvent, and on other similar grounds, unless the PV Principal is willing to continue the O&M Agreement.
The O&M Agreement also provides the parties the option to withdraw from the agreement other than in the event of a breach by the other party, subject to certain circumstances and advance notice requirements.
The Talasol PV Plant
In April 2017, we, through Ellomay Luxembourg, purchased 100% of the shares of Talasol for a purchase price of €10 million. An amount of €8 million out of such purchase price was deposited in escrow during May 2017. In October 2018, Ellomay Luxembourg paid €1 million as a down-payment based on an understanding reached with the sellers of the Talasol shares and in January 2019, following the fulfilment or waiver of the conditions subsequent, an additional amount of €7 million was paid to the sellers, thus releasing the €8 million escrow deposited in May 2017. An additional amount of €2 million was deposited in a trust account held in escrow and released to the sellers of Talasol in May 2020.
In June 2018, Talasol entered into an engineering, procurement & construction agreement, or the Talasol EPC Agreement, with METKA EGN Limited, or METKA EGN, following a tender process initiated by Talasol. The Talasol EPC Agreement provides a fixed and lump-sum amount of €192.5 million for the complete execution and performance of the works defined in the Talasol EPC Agreement. The works include the engineering, procurement and construction of the Talasol PV Plant and the ancillary facilities for injecting power into the grid, including a 400 kV step-up substation, the high voltage interconnection line to the point of connection to the grid and performance of two years of O&M services. METKA EGN is expected to complete the works under the EPC Agreement within a period of 16 months from the commencement date. The Talasol EPC Agreement includes additional standard provisions, including with respect to liquidated damages in connection with delays and performance, performance guarantees, suspension and termination.
In June 2018, Talasol executed a financial power swap, or the Talasol PPA, in respect of approximately 80% of the output of a prospective photovoltaic plant for a period of 10 years. The Talasol PPA was executed with a leading international energy company with a solid investment grade credit rating and a pan-European asset base, which is active in more than forty countries and has a proven track record in financial hedges. The power produced by the Talasol PV Plant is sold in the open market for the then current market power price. The Talasol PPA is expected to hedge the risks associated with fluctuating electricity market prices by allowing Talasol to secure a certain level of income for the power production included under the Talasol PPA. The hedging provides that if the market price goes below a price underpinned by the Talasol PPA, the Hedging Provider will pay Talasol the difference between the market price and the underpinned price, and if the market price is above the underpinned price, Talasol will pay the Hedging Provider the difference between the market price and the underpinned price. The hedge transaction became effective in March 2019.
In July 2018, Talasol executed a pre-hedge transaction with Goldman Sachs International in connection with the prospective project financing for the construction of a photovoltaic plant. The pre-hedge transaction is a fixed for floating interest rate swap intended to lock-in current market floating rates.
In April 2019, the Talasol PV Plant reached financial closing and we sold 49% of our holdings in Talasol to two entities and therefore our current ownership interest in the Talasol PV Plant is 51%.
As noted above, the Talasol PV Plant reached mechanical completion in September 2020 and was connected to the electricity grid and electricity production commenced at the end of December 2020. In parallel to the connection to the grid, hot commissioning tests have been initiated by the EPC contractor. PAC was achieved on January 27, 2021.
Agreements with Partners in Talasol
On April 17, 2019, Ellomay Luxembourg executed a Credit Facilities Assignment and Sale and Purchase of Shares Agreement, or the Talasol SPA, with GSE 3 UK Limited and Fond-ICO Infraestructuras II, FICC, or, together, the Talasol Partners, pursuant to which it agreed to sell to each of the Talasol Partners 24.5% of its holdings in Talasol.
The Talasol SPA further provided that Ellomay Luxembourg would assign to the Talasol Partners, in equal parts, 49% of its rights and obligations under the agreements executed in connection with the project finance obtained for the Talasol PV Plant. The Talasol SPA provided that the legal risks will be transferred to the Talasol Partners on the closing date and the economic yields and results of operations of Talasol’s business will be transferred to the Talasol Partners as from December 31, 2018.
The Talasol SPA included customary representations and warranties of Ellomay Luxembourg and the Talasol Partners and a mutual indemnification mechanism for breaches of representations and warranties or of undertakings, subject to time, minimum claims, minimum aggregate claims and maximum liability limitations, as a sole remedy, subject to customary exceptions. The consummation of the transactions contemplated by the Talasol SPA was subject to the fulfillment or waiver of several customary conditions precedent by June 30, 2019, including the fulfillment of all conditions precedent under the Talasol PV Plant’s project finance and the entry by the Talasol Partners into an equity support agreement.
The transactions contemplated under the Talasol SPA were consummated in April 2019. The aggregate purchase price paid by the Talasol Partners, in the amount of approximately €16.1 million, represented 49% of the amounts withdrawn and interests accrued from and by Talasol under its shareholder development costs credit facility in connection with the Talasol PV Plant’s financing as of the closing date of the Talasol SPA (approximately €4.9 million), plus a payment for 49% of Talasol’s shares (approximately €4.9 million) plus a premium of approximately €6.1 million. Of such aggregate purchase price, the payment of €1.4 million was deferred until the achievement of a preliminary acceptance certificate, or PAC, under the EPC agreement of the Talasol PV Plant. Following the achievement of PAC on January 27, 2021 the deferred payment amount of €1.4 million was received by Ellomay Luxembourg.
On the closing date of the Talasol SPA, Ellomay Luxembourg and the Talasol Partners entered into a Partners’ Agreement, or the Talasol PA, setting forth the relationship between the prospective shareholders of Talasol, the governance and management of Talasol, the funding and financing of Talasol and the mechanism for future transfers of Talasol’s shares. The Talasol PA provides that all matters brought for a vote at a partners’ meeting, other than specific reserved matters, will be adopted by the majorities set forth in the Spanish Companies Act. The Talasol PA includes minority rights for the Talasol Partners, and provides that we will appoint the majority of the board members and that all matters brought for a vote at a board of directors meeting will be adopted by a simple majority of the directors, other than specific matters.
The Talasol PA further provides that Ellomay Luxembourg will be entitled to receive a management fee from Talasol in consideration for the administrative, support and management services to be provided to Talasol by Ellomay Luxembourg. The Talasol PA includes restrictions on transfer of the shares of Talasol by Ellomay Luxembourg and any of the Talasol Partners, which is prohibited for a certain period (other than in connection with certain customary permitted transfers) and thereafter is subject to a right of first offer, tag along rights granted to the Talasol Partners on sales by Ellomay Luxembourg and a drag along right granted to Ellomay Luxembourg.
The Talasol PV Plant has entered into its operational stage, which entails several risks and uncertainties. For more information concerning these and other risks see under “Risk Factors - Risks Related to our Business.” The projected production, revenues and other future results and outcomes included herein are based on the current expectations and assumptions of the Company and its advisors and are subject to various conditions and circumstances.
Talasol PV Plant Project Finance
The Talasol PV Plant obtained project financing in connection with the commencement of its construction. During January 2022, Talasol refinanced the Talasol Previous Financing by entering into the Talasol New Financing. For more information concerning the Talasol New Financing, see “Item 4.A: History and Development of Ellomay; Recent Developments” and for more information concerning the Talasol Previous Financing see “Item 5.B: Liquidity and Capital Resources.”
Ellomay Solar
On February 26, 2021, Ellomay Solar entered into an engineering, procurement & construction agreement in connection with the Ellomay Solar Project with METKA EGN Spain S.L.U., a 100% indirect subsidiary of MYTILINEOS S.A., under the Renewables & Storage Development Business Unit.
The Ellomay Solar EPC Agreement provides a fixed and lump-sum amount of €15.82 million for the complete execution and performance of the works defined in the EPC Agreement. The works include the engineering, procurement and construction of the Ellomay Solar Project and the ancillary facilities for injecting power into the grid and performance of two years of O&M services. The EPC Agreement contains additional standard provisions, including liquidated damages in connection with delays and performance, performance guarantees, suspension and termination.
METKA EGN Spain is expected to complete the works under the EPC Agreement within a period of 9 months from receipt of the Notice to Proceed. The early works commenced on March 1, 2021 and the Notice to Proceed was granted on June 7, 2021. The Ellomay Solar project is waiting for final permits and the achievement of PAC (preliminary acceptance certificate) of the photovoltaic plant held by Ellomay Solar is expected by the end of April 2022.
Israeli Tender Process for PV plus Storage
On July 19, 2020, we were notified that we are one of the winners of a first-in-kind quota tender process published by the Israeli Electricity Authority for combined photovoltaic and electricity storage facilities in Israel. The tariff per kWh determined in the tender process is NIS 0.199 for a quota of 20 MW. This tariff is linked to the Israeli CPI and is valid for a period of 23 years commencing on the commercial operation of each relevant facility.
As noted, the tender process was for a quota and we are currently examining and expect to further examine potential sites for the construction of the facilities. With respect to each project we will be required to obtain approvals, if applicable, from the ILA in connection with the site for such project, and to take all other actions necessary for the promotion of such project. Pursuant to the terms of the tender, we are further required to receive approvals for connection to the electricity grid and a grid synchronization approval from the Israeli Electric Company within up to 37 months. Following the receipt of the notice from the Israeli Electricity Authority, we submitted a performance guarantee in an aggregate amount of NIS 12 million (approximately €3 million based on the euro/NIS exchange rate at that time).
The continued development and construction of the facilities depends upon various factors, including, but not limited to, the Company’s ability to locate sites for construction, enter into EPC agreements and obtain project finance and all other required approvals, all upon terms acceptable to us. Therefore, there is no assurance as to whether and when such process will be completed.
Framework Agreements for the Development of PV Projects in Italy
First Framework Agreement
In November 2019, Ellomay Luxembourg executed a Framework Agreement, or the First Framework Agreement, with an established and experienced European developer and contractor. Pursuant to the First Framework Agreement, the developer will scout and develop photovoltaic greenfield projects in Italy with the aim of reaching an aggregate authorized capacity of at least 250 MW over a three-year period.
The First Framework Agreement provides that each project will be presented to Ellomay Luxembourg when it becomes “ready to build”. Thereafter, if Ellomay Luxembourg accepts the project, the developer is obligated to transfer to Ellomay Luxembourg 100% of the share capital of the entity that holds the rights to the project. With respect to each project, subject to the conditions set forth in the First Framework Agreement, Ellomay Luxembourg will enter into engineering, procurement and construction, or EPC, and O&M contracts with the developer to construct and operate the projects.
The First Framework Agreement provides that when the first project under the First Framework Agreement achieves the positive environmental impact assessment, the parties will negotiate the terms of a model lump-sum, turnkey EPC contract and O&M contract that will be executed with the developer in connection with all projects acquired under the First Framework Agreement.
In connection with the execution of the First Framework Agreement, Ellomay Luxembourg paid the developer an advance payment of approximately €1.2 million, based on the target aggregate project capacity of 250 MW, and undertook to pay an additional advance payment per each project when the project submits its environmental impact assessment application. As of March 1, 2022 the additional advance payment paid amounted to approximately €0.3 million. In the event the target aggregate capacity is not achieved within a three-year period or in the event a project does not reach “ready to build” status, the advance payment will be proportionately refunded.
The advancement and development of projects that will become part of the First Framework Agreement is subject to various conditions, including receipt of regulatory approvals and authorizations and procurement of land rights. There can be no assurance as to the aggregate capacity of projects that will reach the “ready to build” status and as to the number and aggregate capacity of projects that Ellomay Luxembourg will decide to acquire, and any such future decision will be subject to the relevant circumstances existing at the time a project reaches the “ready to build” status under the First Framework Agreement.
Second Framework Agreement
In December 2019, Ellomay Luxembourg executed an additional Framework Agreement, or the Second Framework Agreement, with an established and experienced European developer. Pursuant to the Second Framework Agreement, the developer will provide Ellomay Luxembourg with development services with respect to photovoltaic greenfield projects in Italy in the scope of 350 MW with the aim of reaching an aggregate “ready to build” authorized capacity of at least 265 MW over a forty-one month period.
The Second Framework Agreement provides that the developer will offer all projects identified during the term of the Second Framework Agreement exclusively to Ellomay Luxembourg and that, with respect to each project acquired by Ellomay Luxembourg, the developer will be entitled to provide development services until it reaches the “ready to build” status. The parties agreed on a development budget including a monthly development service consideration, to be paid to the developer and all other payments for the tasks required to bring the projects to a ready to build. In addition, Ellomay Luxembourg undertook to pay a success fee to the developer with respect to each project that achieves a “ready to build” status. Currently development is progressing as planned.
In April 2021, the Second Framework Agreement was amended and the target of reaching an aggregate “ready to build” authorized capacity of at least 265 MW was increased to 365 MW.
In February 2022, EPC agreements were executed with respect to the first two projects in Italy that are in advanced development stages (with an aggregate capacity of approximately 20 MW) and construction of such projects commenced during January 2022. Construction of another adjacent project (15MW) is currently expected to commence during the second quarter of 2022.
The advancement and development of projects that will become part of the Second Framework Agreement is subject to various conditions, including receipt of regulatory approvals and authorizations and procurement of land rights. There can be no assurance as to the aggregate capacity of projects that will by identified by the developer and that will thereafter reach the “ready to build” status, and as to our decision and success in completing construction of any of such projects. Any future decision of the Company with respect to the continued development of projects will be subject to the relevant circumstances existing at the time such decision will be made. In addition, projects in the construction stage are exposed to several risks, including delays in supply of equipment and defaults by contractors. Covid-19’s impact on the manufacturing and supply chains worldwide, may delay or prevent construction of projects.
Sale of Italian PV Portfolio
On December 20, 2019, we sold ten Italian indirect wholly-owned subsidiaries, which own twelve photovoltaic plants with an aggregate nominal capacity of approximately 22.6 MW, or the Italian PV Portfolio, and sold the sale of the receivables arising from shareholder loans provided to such companies. The purchase price was €38.7 million (after approximately €2.3 million adjustments in connection with funds received by us from the Italian subsidiaries during 2019). The Sale and Purchase Agreement governing the sale of the subsidiaries and the receivables includes customary representations and warranties and indemnification mechanisms, including specific indemnification for existing risks for a limited time as follows: (i) indemnification in the amount of up to €0.25 million in connection with potential tax liabilities (until December 31, 2023), (ii) indemnification in the amount of up to €0.5 million in connection with potential incentive reduction under limited circumstances in one of the Italian subsidiaries sold (until December 31, 2023), and (iii) indemnification in the amount of up to €2.1 million in connection with potential incentive reduction under limited circumstances in one of the Italian subsidiaries sold until June 30, 2021. In connection with such indemnification undertakings, we recorded expenses in the amount of approximately €2.1 million following the announcement received from Gestore dei Servizi Elettrici, or GSE, Italy’s energy regulation agency, claiming alleged non-compliance of the installed modules with the required certifications under the applicable regulation and raising the need to examine incentive eligibility implications. In 2020, with the cooperation of the acquirer of the Italian subsidiaries, an appeal was submitted to GSE. Following the positive outcome of such appeal, the provision for the potential indemnification of approximately €2.1 million was cancelled.
Competition
Our competitors are mostly other entities that seek land and contractors to construct new power plants on their behalf or seek to purchase existing photovoltaic power plants. The competition in the Israeli photovoltaic sector concentrates on the ability to receive licenses from the Israeli Electricity Authority for the construction of new photovoltaic plants, which is subject to a quota as more fully described below and the ability to acquire existing plants that were already granted an electricity production license. The market for solar energy is intensely competitive and rapidly evolving, and many of our competitors who strive to construct new solar power plants have established more prominent market positions and are more experienced in this field. Our competitors in this market include Etrion Corporation (TSX, TO:ETX), Sunflower Sustainable Investments Ltd. (TASE:SNFL), Enlight Renewable Energy Ltd. (TASE:ENLT), Energixs Renewable Energies Ltd. (TASE:ENRG), Allerion Clean Power S.p.A. (ARN.MI), NextEra Energy Partners (NYSE:NEP), NRG Yield (NASD:NYLD), TransAlta Renewables (TSX:RNW), Pattern Energy Group (NASD:PEGI), Abengoa Yield PLC (NASD:ABY), NextEnergy Solar Fund Limited (LSE:NESF), Bluefield Solar Income Fund Limited (LSE:BSIF), Infinis Energy PLC (LSE:INFI), The Renewables Infrastructure Group Limited (LSE:TRIG) and TerraForm Power, Inc. (NASD:TERP). If we fail to attract and retain ongoing relationships with solar plants developers, we will be unable to reach additional agreements for the development and operation of additional solar plants, should we wish to do so.
Customers
The customers of our PV Plants are generally the local operators of the national grid and our PV Plants do not provide electricity or enter into power purchase agreements with private customers. The agreements with the customers include customary termination provisions, including in connection with breaches of the electricity producer and in the event the plant causes disruptions with the grid.
Seasonality
Solar power production has a seasonal cycle due to its dependency on the direct and indirect sunlight and the effect the amount of sunlight has on the output of energy produced. Although we received the technical calculation of the average production recorded in the area of each of our PV Plants from our technical advisors and incorporated such data into our financial models, adverse meteorological conditions can have a material impact on the PV Plants’ output and could result in production of electricity below expected output.
Sources and Availability of Components of the Solar Power Plant
As noted above, the construction of our PV Plants entails the assembly of solar panels and inverters purchased from third party suppliers. A critical factor in the success of our PV Plants is the existence of reliable panel suppliers, who guaranty the performance and quality of the panels supplied. Degradation in such performance above a certain minimum level, generally 90% during the initial ten year period and 80% during the following ten-fifteen year period, is guaranteed by the panel suppliers. However, if any supplier is unreliable or becomes insolvent, it may default on warranty obligations.
There are currently sufficient numbers of solar panel manufacturers at sufficient quality and we are not currently dependent on one or more specific suppliers.
In addition, silicon is a dominant component of the solar panels, and although manufacturing abilities have increased over-time, any shortage of silicon, or any other material component necessary for the manufacture of the solar panels, may adversely affect our business.
The COVID-19 pandemic has put pressure on global supply chains with factory closures, import tariffs, shortages of raw materials, and shipping bottlenecks creating supply chain shortages and delays. It may take several years until solar module prices stabilize.
Material Effects of Government Regulations on the PV Plants
The development, construction and operation of a photovoltaic plant is subject to complex legislation covering, inter alia, building permits, licenses, the governmental long-term incentive scheme and security considerations. The following is a brief summary of the regulations applicable to our PV Plants.
Material Effects of Government Regulations on the Italian PV Plants
The regulatory framework surrounding photovoltaic plants located in Italy consists of legislation at the Italian national and local level. Relevant European legislation has been incorporated into Italian legislation, as described below.
National Legislation
(i) Construction Authorizations
Construction of a photovoltaic plants is subject to receipt of appropriate construction authorizations, pursuant to Legislative Decree no. 380 of 2001, or Decree 380, and Legislative Decree 29 December 2003 no. 387, or Decree 387, the latter of which implements European Directive no. 77 of 2001 on the promotion of electricity produced from renewable energy sources in the internal electricity market.
Decree 387 aims to promote renewable energies, inter alia by simplifying the procedures required to commence constructions. In particular, it regulates the so-called Autorizzazione Unica, or AU, in relation to renewable energy plants. The AU is an authorization issued by the Region in which the construction is to take place, or by other local competent authorities, and which joins together all permits, authorizations and opinions that would otherwise be necessary to begin construction (such as, building licenses, landscape authorizations, permits for the interconnection facilities, etc.). The only authorization not included in the AU is the environmental impact assessment (valutazione di impatto ambientale, or VIA, see below), which needs to be obtained before the AU procedure is started. The AU is issued following a procedure called Conferenza di Servizi in which all relevant entities and authorities participate. Such procedure is expected to be completed within 180 days of the filing of the relevant application, but such term is not mandatory and cannot entirely be relied upon.
Decree 380, which is the general law on building administrative procedures, provided another track for obtaining the construction permit. Pursuant to this decree, the construction authorization can be obtained through a permesso di costruire, or the Building Permit, which is an express authorization granted by the competent municipality. Upon positive outcome of the municipality’s review, the Building Permit is granted. Works must start, under penalty of forfeiture of the Building Permit, within one year following the date of issuance, and must be completed within the following three years.
Decree 380 also regulates the so-called Dichiarazione di inizio attività, or DIA, procedure. DIA is a self-certification process whereby the applicant declares that the project in question complies with all relevant requirements and conditions. The competent authority can deny the authorization within 30 days of receipt of DIA; should such a denial not be issued within such term - which is mandatory - the authorization shall be deemed granted and the applicant is allowed to start the works. The DIA procedure can be used in relation to plants whose power is lower than 20 kW. Since the expected power output of the PV Plants exceeds 20kW, the DIA is not available for the PV Plants. With the entry into force of the Romani Decree on March 29, 2011, which implemented European applicable directives (in particular, directive no. 28 of 2009), the DIA procedure has been replaced, with respect to plants fed by renewable energy sources, by the so called procedura abilitativa semplificata, or PAS, according to which, very similarly to the DIA procedure, an applicant can start construction of a plant after 30 days of the filing of the application with the competent Municipality provided that the latter has in such time not raised objections and/or requested integrations. With respect to photovoltaic plants, under the Romani Decree the PAS applies to plants with a power up to 20 kWp, and regions can increase such threshold up to 1 MWp. Furthermore, Decree Law no. 76/2020 (“Decreto Semplificazioni”) has provided that also in relation to PV plants non-substantial modifications can be authorized through the so called dichiarazione di inizio lavori asseverata, i.e. a self-declaration confirmed by a qualified surveyor based on which the relevant works can start immediately.
Decree-Law no. 77/2021 (Decreto Semplificazioni bis) has introduced new provisions mainly aimed at further simplifying and harmonizing the authorization procedures, inter alia by reducing procedural and consultation schedules and providing that PAS procedure can apply also for big-size plants when they are located in specific areas (such as industrial or commercial areas, or former quarries or dumps). Furthermore, overcoming the previous prohibition, this Decree established that, subject to certain conditions, PV plants located on agricultural areas will be eligible for incentives.
In the past, Italian photovoltaic projects relied on three AUs, three DIAs and six Building Permits. Based on the current regulatory regime, a project to construct a photovoltaic plant in Italy requires the AU, subject to the terms and conditions included therein, or, for cases in which PAS applies, subject to the positive outcome of the relevant procedure.
(ii) Connection to the National Grid
The procedures for the connection to the national grid are provided by the Authority for Electric Energy and Gas, or AEEGSI. Currently, the procedure to be followed for the connection is regulated by the AEEGSI Resolution no. 99 of 2008 (Testo Integrato delle Connessioni Attive, or TICA) which replaces previous legislation and has subsequently been integrated and partially amended by AEEGSI Resolutions no. 124/2010 and 125/2010. According to TICA, an application for connection must be filed with the competent local grid operator, after which the latter notifies the applicant the estimated time for connection, or STMC. The STMC shall be accepted within 45 days of issuance. However, in order for the authorization to the connection to become definitive, all relevant authorization procedures (such as easements, ministerial nulla osta, etc.) must be successfully completed.
There are three alternative modalities to sell electricity:
| a. | by way of sale on the electricity market (Italian Power Exchange IPEX), the so called “Borsa Elettrica”; |
| b. | through bilateral contracts with wholesale dealers; and |
| c. | via the so-called “Dedicated Withdrawal” introduced by AEEGSI Resolution no. 280/07 and subsequent amendments. This is the most common way of selling electricity, as it affords direct and quick negotiations with the national energy handler (GSE), which will in turn deal with energy buyers on the market. |
The Incentive Tariff System for Photovoltaic Plants
The Italian government promotes renewable energies by providing certain incentives. In the past, these incentives were provided mainly through granting of a fixed FiT for a period of 20 years from connection of a photovoltaic plant. The FiT was determined with reference to the nominal power of the plant, the characteristics of the plant (plants are divided into non-integrated; partially integrated and architecturally integrated) and the year on which the plant has been connected to the grid.
On July 4, 2019, the Italian Ministry for Economic Development issued a decree setting out a new incentive scheme for renewable energy plants including PV (so called “FER1 Decree”).
With respect to PV, the FER1 Decree provides incentives the amount of which is mainly based on the plant capacity. Additional bonuses are granted to plants below 1 MWp installed as replacement of asbestos rooftops (inserted in a group called “A2”) and to plants with power below 100 kW installed on buildings provided that the amount of self-consumed energy is equal at least to 40% of the total net production (€10/MWh). Below is a table summarizing the amount of the applicable reference tariff:
Plant Type | Power level (kW) | Reference Tariff (€/MWh) | A2 plants Bonus (€/MWh) | Bonus for self-consumption (€/MWh) |
Group A | 20 <P ≤100 | 105 | - | 10 |
100 <P ≤1000 | 90 | - | - |
| P>1000 | 70 | - | - |
Group A2 | 20 <P ≤100 | 105 | 12 | 10 |
100 <P ≤1000 | 90 | 12 | - |
Incentives are awarded for a period of 20 years at the outcome of seven tenders held between September 2019 and September 2021 (with different procedures depending on whether the plant is below or above 1MWp), whereby the effective granted tariff will be equal to the reference tariff as reduced by the percentage reduction offered by the applicant.
Award of the incentive is based on a number of hierarchic criteria that differ for plants below or above 1MWp.
With respect to plants below 1MW, the first criterion is the installation of the plant in areas such as closed dumps or mines, or (for A2 plants) on public buildings such as schools or hospitals. This is aimed at giving preference to environment-friendly plants and therefore, for the avoidance of doubt, such plants will be preferred to other plants even if the tariff reduction set out in the application is lower.
With respect to plants above 1MW, the first criterion is instead the tariff percentage reduction.
For plants above 250KW, the incentive is paid by GSE as positive balance between the tariff and the energy price (i.e. the zonal hourly price); if the balance is negative, GSE is entitled to be returned the relevant amount by the producer. For plants below 250KW, the producer can also request that GSE pay the incentive as all-inclusive tariff (tariffa onnicompreensiva).
The incentives provided by the FER1 Decree cannot be cumulated with the ones provided under the various Conto Energia and are in any case subject to achievement of an overall cap equal to an annual medium cost for incentives of €5.8 billion per year.
Other Renewable Energy Incentives
Legislative Decree no. 79 of 1999 implements the so-called “priority of dispatch” principle to the marketing of renewable energies, which means that the demand for electricity must be first satisfied by renewable energies.
In other words, in light of the increasing demand of energy, the sale of the total output of power plants fueled by renewable sources is required by law, and the government must buy power from solar power plants that wish to sell to it, before it can buy the remainder of its power needs from fossil fuel energy resources.
Developments regarding the Italian incentive system and the electric energy sale price since 2013
(i) The so called “Fare 2” Decree
The Ministry of Economic Development issued a draft decree, or the Fare 2 Decree, which provided measures aimed at reducing the cost of energy for consumers.
Thereafter, such measures have been incorporated in a law proposal ancillary to the so called “Stability law” (i.e. the budget law to be approved on an annual basis to comply with EU financial requirements). The abovementioned Fare 2 Decree has been replaced by another decree named Destinazione Italia, which was approved as a Law Decree by the Government and converted into Law n. 9, dated February 21, 2014.
This decree does not differ from the Fare 2 Decree as to the matters set forth above, and provides, in particular:
| • | a measure consisting of granting the option to access a new revised incentive plan. This specific provision applies to producers of renewable energy and owners of plants to which the “all-inclusive tariff” (tariffa omnicomprensiva) or certain “Green Certificates” (certificati verdi) apply and provides an alternative incentive system for production of renewable energy, which can be activated voluntarily on demand of each producer. The latter must choose either to continue maintaining the same incentive regime for the remaining period of duration of the plan, or access a new plan, enforced for the remaining duration of the plan extended by 7 years, but with a correspondent reduction in the nominal amount of the incentive, in a percentage which varies based on, inter alia, the remaining duration of the plan and the type of energy source. |
| • | a replacement, starting from January 1, 2014, of the minimum guaranteed prices currently foreseen under the Italian mandatory purchase regime with the zonal hourly prices set out for each specific area (so called prezzi zonali orari, i.e. the average monthly price, correspondent to each hour, as resulting from the electric market price on the area where the PV plant is located). The replacement of minimum guaranteed prices with zonal prices applies to PV plants exceeding 100kWp. |
Based on the above mentioned provision, the minimum guaranteed prices for energy produced by renewable energy sources have been abolished and the prices that are awarded to such plants are equal to the hourly zonal prices.
On February 26, 2014, GSE published the following new rules regarding the conditions for access to the minimum prices for photovoltaic plants. Therefore, commencing January 1, 2014, the minimum prices as defined by AEEGSI, are equal to:
| • | For photovoltaic plants with an installed capacity of up to and including 100 kW that benefit from incentives and photovoltaic plants with an installed capacity of up to and including 1 MW that do not benefit from incentives – the minimum price, as defined by AEEGSI; and |
| • | For other photovoltaic plants – the hourly zonal price. |
(ii) Minimum Guaranteed Prices determined by AEEGSI
AEEGSI opinion n. 483/2013
In parallel with the above-described legislative procedure, on October 31, 2013, AEEGSI (i.e., the Italian authority for electric energy) issued a document whereby it started a consultation process aimed at re-determining the amount of the minimum guaranteed prices from which electric energy produced through renewable sources currently benefit under the mandatory purchase regime.
This document illustrates the current regime of minimum guaranteed prices and identifies possible issues with respect to which other interested entities may set forth their position.
In such document AEEGSI identifies (based on a quantification of standard operational costs) euro 0.0378/Kwh as the price that could be guaranteed to PV plants with nominal power higher than 20kWp, without any progressive diversification (as currently applying in 2013, from euro 0.106/Kwh for the first 3,750 Kwh annual production, through euro 0.0952/Kwh for annual production of electricity up to 25 MWh, and until euro 0.0806/Kwh for annual production of electricity up to 2,000 Mwh) and provided that should such price be lower than the zonal hourly price, the zonal hourly price shall apply.
AEEGSI Resolution n. 618/2013
On December 19, 2013, AEEGSI issued a new resolution, determining the new reduced minimum guaranteed prices applicable commencing January 1, 2014 (subject to an annual update), by means of the amendment of AEEGSI Resolution n. 280/2007.
(iii) AAEG resolution 36/E on depreciation of PV Plants
Resolution n. 36/E dated December 19, 2013, highlighted, that, in case of plants qualified as real estate (which is the case of all of our Italian PV Plants), the depreciation rate for tax purposes will be the same as the depreciation rate for “industry manufacturer” (i.e. 4%).
(iv) Imbalance costs under AEEGSI Resolution n. 281/2012
On January 1, 2013 AEEGSI Resolution n. 281/2012 (subsequently also implemented by Resolution n. 343/2012), or the AEEGSI Resolution, entered into force, aiming at charging the PV plant owners with the costs relating to the electric system (so called “imbalance costs”) that are the result of an inaccurate forecast of the production of electric energy, particularly in cases in which the owner is party to the mandatory purchase regime with GSE.
Such costs are mainly due to the fact that under the mandatory purchase regime GSE buys electric energy on the basis of a production forecast that may not be fully accurate; such circumstance causes the GSE to bear costs in connection with the re-sale of electric energy on the market; before Resolution n. 281/2012, such costs were borne by final consumers.
In order to transfer such costs to the owners of the PV plants, AEEGSI Resolution n. 281/2012 has mainly provided two types of measures:
| (i) | imbalance costs are to be borne by the owners of PV plants, in an amount calculated by multiplying the discrepancy of the production forecast by a fixed parameter;
|
| (ii) | in the case that the owner of the PV plant is party to the GSE mandatory purchase regime, administrative costs borne by GSE in connection with forecast services are to be charged on the owner. |
On June 24, 2013, the administrative Court of the Lombardia Region annulled the parts of AEEGSI Resolution 281/2012 relating to the imbalance costs as the AEEGSI Resolution 281/2012 should apply to programmable sources which should have a different treatment than non-programmable renewable energy sources, such as photovoltaic plants.
This judgment was challenged on September 11, 2013 by AEEGSI before the Consiglio di Stato (the Italian supreme administrative Court), which, on June 9, 2014, had rejected the appeal thus confirming the decision of the Court of Lombardia and the partial annulment of the AEEGSI Resolution no. 281/2012. Following said judgment, as of January 1, 2015, AEEGSI reviewed the provisions regarding imbalance costs for non-programmable renewable energy sources. In particular, AEEGSI considered it advisable to provide that beneficiaries of the dispatchment (i.e. of the management of the energy transferred into the national grid and its distribution) may choose, for each of the dispatchment points owned, between two different criteria for the determination of imbalancing costs:
| 1.
| application of the actual imbalancing (i.e., the difference, hour by hour, between the measurement of the energy delivered/withdrawn into the grid in one day and the final delivery/withdrawal program as a consequence of the closing of the Electrical Markets and the Dispatchment Services Market).
In other words, based on the first option, production units powered by non-programmable renewable energy are subject to the same criteria of determination of imbalancing (regolazione di valorizzazione degli sbilanciamenti) applicable to the programmable ones.
|
| 2.
| sum of three components, which are a result of the application: |
| • | to the actual imbalancing which falls within the tolerated thresholds of the price equal to that provided under section 40.3 of Resolution AEEGSI SI 111/06, as amended by Resolution 522/2014/R/eel; and |
| • | to the actual imbalancing exceeding the tolerated thresholds of the price equal to that provided under section 30.4(b) of Resolution AEEGSISI 111/06, as amended by Resolution 522/2014/R/eel. |
These two amounts must be calculated pursuant to specific technical formulas.
| • | to the actual imbalancing which falls within the tolerated thresholds, considered as an absolute value, of an imbalancing price equal to the area quota. The area quota must be intended as the ratio between the imbalancing costs which have not been allocated pursuant to the two aforementioned points and the sum of the absolute values of imbalancing costs, which fall within the tolerated thresholds. |
This second option, therefore, provides the application of tolerance thresholds to the amended and corrected binding program, which are differentiated by source (in particular, 31% of the program for solar energy), so that all imbalancing costs are allocated among producers of energy through non-programmable sources.
As in the previous regulation, AEEGSI provided that for both production units subject to the ritiro dedicato regime and those who applied to the fixed omni-comprihensive tariff, imbalancing costs and the counter-value deriving from participation in the daily market (“mercato infragiornaliero” or “MI”) are transferred from GSE to the same producers pursuant to the provisions defined by GSE under its Technical Rules.
A new resolution (no. 444 of 2016) was adopted by AEEGSI in July 2016 partly amending the previously applying modalities of payment of imbalancing. Such resolution established that, commencing January 2017 (for PV plants with a capacity lower than 10 MWp), the discrepancy between planned and effective energy input/withdrawn shall not exceed 7.5% (+/-). In the case that such threshold is exceeded, the price paid for positive imbalancing will be reduced in such measure as not to allow any profit to the producer in relation to the forecast in question. Prior to this resolution, distortive practices were often used by intentionally providing energy production forecasts materially different from the actual production in order to maximize revenues deriving from positive imbalancing payments. The provisions of resolution 444/2016 aim at incentivizing producers to keep imbalancing within said limits (+/- 7.5%).
(v) Law 116/2014 on the tariff cuts
In August 2014, law 116/2014 (so called “spalma incentivi”), providing for a decrease in the FiT guaranteed to existing photovoltaic plants with nominal capacity of more than 200 kW, or Law 116/2014, was approved by the Italian Parliament. Pursuant to Law 116/2014, operators of existing photovoltaic plants, which received a guaranteed 20-year FiT under current Italian legislation, were required to choose between the following four alternatives:
| (i) | a reduction of 8% in the FiT for photovoltaic plants with nominal capacity above 900 kW, a reduction of 7% in the FiT for photovoltaic plants with nominal capacity between 500 kW and 900 kW and a reduction of 6% in the FiT for photovoltaic plants with nominal capacity between 200 kW and 500 kW (i.e., out of the twelve Italian photovoltaic plants owned by us, eight would be subject to a reduction of 8% in the FiT and four would be subject to a reduction of 7% in the FiT); |
| (ii) | extending the 20-year term of the FiT to 24 years with a reduction in the FiT in a range of 17%-25%, depending on the time remaining on the term of the FiT for the relevant photovoltaic plant, with higher reductions applicable to photovoltaic plants that commenced operations earlier (based on the remaining years in the initial guaranteed FiT period of our existing Italian photovoltaic plants, the expected reduction in the FiT for the our photovoltaic plants would have been approximately 19%);
|
| (iii) | a rescheduling in the FiT so that during an initial period the FiT is reduced and during the second period the FiT is increased in the same amount of the reduction with the goal to guarantee an annual saving of at least €600 million by the Italian public between 2015 and 2019, assuming all photovoltaic operators opt for this alternative); or
|
| (iv) | the beneficiaries of FiT incentive schemes can sell up to 80% of the revenues deriving from the incentives generated by the photovoltaic plant to a selected buyer to be identified among the top EU banks. The selected buyer will become eligible to receive the original FiT and will not be subject to the changes set forth in alternatives (i) through (iii) above. |
The photovoltaic plant operators were required to make a choice by November 30, 2014, with effect commencing January 1, 2015. Operators that did not make a choice became automatically subject to the first option.
Interventions on operating plants and incentives
On May 1, 2015, GSE issued a regulation called “Documento Tecnico di Riferimento”, or DTR, setting out the conditions subject to which a PV plant can continue benefitting from incentives despite modifications made to the PV plant due to revamping interventions. The terms of the DTR cover a number of circumstances (such as moving of the plant, modification of the connection point, variation of the installation method, replacement of components, modification of the capacity, etc.). The DTR was criticized for being too restrictive by many operators and relevant associations and in July 2015 the effectiveness of the DTR was suspended by GSE partly due to the fact that relevant measures are addressed in the scheme of new Italian decree dedicated to renewables (Nuovo Decreto FER). The new decree was adopted and entered into force in June 2016.
Although Nuovo Decreto FER is mostly dedicated to other forms of renewable energy, it provides measures that apply also to photovoltaic plants. Such measures include:
A. Measures on revamping interventions, which provide in particular that in order for a plant to continue benefitting from incentives, such interventions:
| (i) | shall not entail an increase of more than 1% (5% for plants up to 20 kWp) of the nominal power of the plant or its single units;
|
| (ii) | shall use new or regenerated components, in the case of definitive replacements; and
|
| (iii) | shall be communicated to GSE within 60 days. |
further implementation measures on the procedures to be followed in case of revamping interventions (i.e., a new Documento Tecnico di Riferimento) were published in February 2017;
B. Measures on the so called “fake fractioning”, providing in particular that in the case that two or more plants are:
| (i) | fed by the same renewable source;
|
| (ii) | owned by the same entity or by entities belonging to the same group; and
|
| (iii) | built on the same plot or on bordering plots; |
such plants have to be considered as one plant with nominal power equal to the aggregate of the single plants’ respective powers. In such case, GSE will:
| (i) | re-determine the applicable tariff, if the procedures on tariff admission were complied with notwithstanding the fake fractioning; or
|
| (ii) | declare the retrospective forfeiture from the tariff, if the procedures on tariff admission were not complied with as a result of the fake fractioning. |
In terms of sanctions by the GSE, the Italian Budget Law for 2018 includes a provision aimed at limiting GSE’s powers (so called “Benamati Amendment”).
Whereas the current provisions allow GSE to declare retrospective forfeiture from the incentives also for minor or anyway rather formal authorization irregularities, the new legislation provides that GSE shall in such cases only reduce incentive to 20%-80% of the original value, depending on the type of breach. Furthermore, it is provided that if notice of the breach is provided to GSE by the producer (before an assessment procedure commences) the reduction will be further reduced by one third. However, the referred legislation does not eliminate the possibility for declaration of forfeiture of the entire amount of the incentives in the event of most material breaches. Law no. 128 dated November 2, 2019 has subsequently introduced an amendment to said provision aimed at further limiting GSE’s sanctions. According to the new provision, GSE’s sanctions shall be limited to a reduction only comprised between 10% and 50% of the original value and, if the notice of the breach is provided by the producer, the reduction shall be further reduced by 50%. Decree Law no. 76/2020 has further extended the scope of the above limitations and stressed the fact that GSE’s controls shall be carried out within a reasonable term, which has been set in twelve months by Decree-Law no. 77/2021 (Decreto Semplificazioni bis).
The cases in which the reduction of the incentive can be declared are to be defined by the Ministry of Economic Development.
Red II Decree
On November 8, 2021, Legislative Decree no. 199, or the Red II Decree, has been issued, implementing the EU RED II Directive (Renewable Energy Directive, no. 2018/2001, or RED II Directive) on the promotion of the use of energy from renewable sources.
The Red II Decree has set-up the framework for new incentives in the PV industry, which will have to be implemented through detailed legislation by August 2022. In particular, it has been provided that different incentives will be granted depending on the type of plant, and the main distinction is implemented between “small plants” (with capacity up to 1 MW) and “big plants” (with capacity higher than 1MW):
| • | as to small plants, incentives will be awarded: (i) through direct access to incentives, as to plants with market competitive generation costs and plants belonging to energy communities or self-consumption configurations; and (ii) through tender procedures, as to innovative plants and plants with higher generation costs; and |
| • | as to big plants, incentives will be awarded through downward auction procedures. |
Procedural simplifications and priority for the access to incentives are contemplated for suitable areas (aree idonee), such as areas where a plant is already installed, decontaminated areas, dumbs and quarries, and other areas for which criteria are to be defined by implementing legislation.
The amount of the incentives, as well as the financial commitment allocated thereto, shall be defined by future implementing decrees.
The Red II Decree has also set up an ad hoc definition of long term power purchase agreements (PPAs), defined as the contract by which a person or entity undertakes to purchase renewable sources electricity directly from an electricity producer. In that respect, the aim of the Red II Decree is to promote the utilization of PPAs, and in this respect, within 180 days of entry into force thereof, the following actions have been planned:
| • | the creation of an online information board with the aim to facilitate the alignment of demand and offer; |
| • | the setting-up of a platform for the conclusion of PPAs (as already provided in previous legislation); |
| • | the definition of tender schemes for the supply of renewable source energy to public administration through PPAs; and |
| • | issuance of an ad hoc regulation in order to inform final customers as to PPAs, also in order to facilitate use thereof by consumers in aggregate shape. |
Retention from Incentives for Panel Disposal
As part of the implementation of legislative decree 49/2014, in December 2015, GSE published the guidelines regarding disposal of PV panels that benefit from incentives. In particular, the decree had established that GSE was entitled to retain a certain amount from payment of incentives as a guarantee for the cost of disposal of the panels installed on PV plants and GSE set out the determination of such retention.
The guidelines provide that the retention shall start from the 11th year of incentive and shall be calculated, for plants with nominal capacity higher than 10 kWp, on the basis of the following formula:
[2 * (n – i + 1) / n * (n + 1)] * total quota
where “n” is equal to 10, “i” is the year in which the retention is applied, and “total quota” is n*number of panels (GSE has however reserved to amend the value of “n” after further assessment of disposal costs).
For example, for a plant with 100 panels, based on the above formula the retention is equal to €181.82 for the first year and an aggregate amount of €1,000 for a ten-year period (assuming a duration of the incentive of 20 years).
The retention will be held by GSE in an interest-bearing escrow account and is to be returned to producers after evidence is provided to GSE that the panels have been disposed correctly. If such evidence is not provided, GSE will proceed by itself to the disposal of the panels and not return the retention to the producer.
The guidelines clarify that the retention shall apply also in the case that the incentive-related receivables have been the object of assignment (as is applicable to our financed projects).
Fourth and Fifth Conto Energia PV plants (except for certain specific type of plants) are exempt from the retention provided that the relevant panel producers are enrolled with consortia/institutions listed in an ad hoc register held by GSE.
Furthermore, in 2021 GSE has provided that as an alternative to the retention PV plant owners can provide a financial guarantee for the dismantling by joining an ad hoc set-up collective system.
New provisions regarding determination of cadastral value and so called “super-depreciation”
Art. 21 of Law 208/2015 (2016 Italian Budget Law) set out new criteria concerning the determination of the cadastral value of immovable assets with so called special and particular destination (i.e., those belonging to cadastral categories “D” and “E”). PV plants fall within the scope of such provision. Following issuance of the law, on February 1, 2016, the Italian Tax Office (Agenzia delle Entrate) published official clarifications to the scope of said provision. In connection with ground PV plants, the Italian Tax Office pointed out that, on the basis of the new provision, modules and inverters shall not be accounted in the determination of the associated cadastral value, which should entail a significant reduction in the calculation of the related tax burden.
With circular dated March 30, 2017, the Italian Tax Office further clarified that PV plants can be characterized as movable assets and particularly, as a result, will be subject to the so called “super-depreciation”, which allows them to increase the actual cost of the investment in PV plants by 40%, with associated significant fiscal benefits. During subsequent years such fiscal benefit has been partly amended; for 2022 a tax credit equal to 6% of the capital expenditure (up to a maximum of 2 million euros) has been provided.
Capacity Market
At the beginning of February 2018, the EU Commission approved the scheme presented by the Italian government for the setting up of the so-called “capacity market”. This has been approved for a period of 10 years and will allow producers of electric energy (including from PV sources) to participate in auctions whereby they will obtain additional remuneration for providing availability to produce electric energy.
After consultation with the EU institutions and green light by the latter, the capacity market has been implemented through Decree dated June 28, 2019. However, the remuneration provided therein is not compatible with GSE incentives. Therefore, if a photovoltaic plant benefits from GSE incentives it cannot also benefit from incentives under the capacity market remuneration.
Material Effects of Government Regulations on the Spanish PV Plants
The Spanish general legal framework applicable to renewable energies
Law 24/2013, of December 27, 2013, of the Power Sector
The Spanish general legal framework applicable to renewable energies is contained in Law 24/2013, of December 27, 2013, of the Power Sector, or Law 24/2013, which sets forth the regulatory framework of the power sector with the objective of guaranteeing the electricity supply with an adequate level of quality, at the least possible cost, while ensuring the economic and financial sustainability of the system and pursuing effective competition in the power sector. At the same time, the principle of environmental sustainability is considered.
The economic and financial sustainability is the guiding principle for both the Spanish Public Administration and the agents acting under the scope of Law 24/2013, with a view to avoid the accumulation of new tariff deficits. According to Law 24/2013, incomes must be enough to cover expenses and, on the other hand, tariffs and charges must be automatically reviewed in case of overcoming certain established thresholds.
In accordance with Royal Decree-law 9/2013, dated July 12, 2013, which adopts several urgent measures in order to ensure the financial stability of the power system, or RDL 9/3013, Law 24/2013 regulates the new remuneration scheme of those renewable energy installations entitled to a regulated income, or the so called “Specific Remuneration,” in addition to the market price. Law 24/2013 sets forth the principle of reasonable profit for the sake of which the parameters to determine the regulated income are reviewed every six years.
In addition, Law 24/2013 establishes the priority access and dispatching of RES and high efficiency Combined Heat and Power in line with the EU Directives, and further develops the general criteria for access and dispatching by reinforcing the principles of objectivity and non- discrimination. Thereby, the reasons to refuse access are based on technical criteria exclusively.
Moreover, Law 24/2013 develops a specific regulatory framework for self-consumption. Law 24/2013 defines three different categories of self-consumption and obliges those installations connected to the grid to contribute to the costs and services of the system in the same conditions of the rest of customers. It also defines the activity of “recharging managers” (for electric vehicles).
Royal Decree Law 15/2018
The Spanish general legal framework applicable to renewable energies includes Royal Decree Law 15/2018, of October 5, 2018, or RDL 15/2018, of urgent measures for energy transition and consumer protection. RDL 15/2018 includes, among others, the following:
| (i) | It introduces three principles in the activity of self-consumption: (i) the right to self-consume electricity without charges; (ii) the right to shared self-consumption by one or more consumers to take advantage of economies of scale; and (iii) administrative and technical simplification. |
| (ii) | Any consumer – whether or not a direct consumer of the market – may acquire energy through bilateral contracting with a producer. |
| (iii) | Regarding access and connection permits: (i) the validity of the access and connection permissions granted prior to the entry into force of Law 24/2013 is extended and the aforementioned permits will expire if they have not obtained the authorization of exploitation, on the later of: (a) before March 31, 2020, or (b) five years from the obtaining of the right of access and connection; (ii) the guarantees to be placed for the access and connection permits are increased from €10/kW to €40/kW; (iii) with regards to the actions carried out in the transport or distribution networks by the owners of the access and connection permits which must be developed by the grid operator or distributor, the promoter must advance 10% of the total investment value to be undertaken within a period not exceeding 12 months. Once the aforementioned amount has been paid and the administrative authorization for the generation facility has been obtained, its holder shall, within four months, enter into an Assignment Contract with the transportation grid operator or distributor, otherwise, the validity of the access and connection permits will expire. |
Royal Decree-law 17/2019
On November 24, 2019, Royal Decree-law 17/2019, of November 22, or RDL 17/2019, enacted urgent measures for the necessary adaptation of remuneration parameters affecting the electricity system and responding to the process of cessation of activity of thermal generation plants. Among others, this new regulation updates the remuneration parameters of generation plants entitled to a specific remuneration for the regulatory period starting January 1, 2020, as further explained below.
New legislation applicable to renewable energies:
A. Royal Decree-law 23/2020
On June 25, 2020, Royal Decree-Law 23/2020 of June 23, 2020, or RD-law 23/2020, came into force, approving measures in the energy sector and other sectors for the reactivation of the economy and introducing a series of new provisions focused on overcoming the obstacles identified in the energy transition process and established an attractive framework for renewable energy investments in Spain.
As a novelty, and in connection with the expiry of access and connection to the grid permits, RD-law 23/2020 established certain permitting milestones to be achieved by the promoters. Failure to do so, will result in expiration of the permits (except when the environmental permit was not granted for reasons not attributable to the promoter). The milestones set up in RD-law 23/2020 were modified by Royal Decree-Law 29/2021, of December 21, 2021, or RD-law 29/2021, as further explained below.
B. Royal Decree-law 29/2021
On December 23, 2021, RD-law 29/2021 came into force, approving urgent measures in the energy field for the promotion of electric mobility, self-consumption, and the deployment of renewable energies.
As a novelty, and in connection with self-consumption, RD-law 29/2021 establishes that installations associated with a self-consumption modality with a surplus installed power not exceeding 100 kW are exempt from presenting the guarantee unless they are part of a group whose power exceeds 1 MW. Likewise, RD-Law 29/2021 adopts measures to facilitate collective or shared self-consumption - in which several self-consumers benefit from a single installation - and extends this possibility to high voltage.
As for tax measures, RD-law 29/2021 provides that the 7% Tax on the Value of Electricity Production (IVPEE) will remain suspended until March 31, 2022.
Finally, the RD-law 29/2021 modifies the milestones established in RD-law 23/2021. In this sense, the dates foreseen in RDL 23/2020 for the intermediate milestones related to the Environmental Impact Statement (EIS), the prior administrative authorization (PAA) and the construction authorization (CAA) have been extended for an additional nine months. All this, without extending the total period of five years for the final milestone of obtaining the administrative exploitation authorization.
Impact on the Talasol PV Plant
The exploitation authorization is required to be granted within five years from the entry into force of RD-law 23/2020 (i.e., by June 25, 2025) as modified by RD-law 29/2021 and was already granted.
Impact on the Ellomay Solar 28 MW Project The exploitation authorization is required to be granted within five years from the entry into force of RD-law 23/2020 (i.e., by June 25, 2025) as modified by RD-law 29/2021 and was granted on January 23, 2022.
Impact on Future PV projects in Spain
Until the moratorium (referred to below) is not released, it is not possible to request access and connection permits for this new project.
Once the access permit is granted to a project, the below milestones will apply (the starting date is the date the permit access was granted):
| • | Request of connection permit required in 6 months.
|
| • | Valid request of Prior Administrative Authorization required in 6 months.
|
| • | Obtention of environmental permit required in 31 months.
|
| • | Obtention of Prior Administrative Authorization required in 34 months.
|
| • | Obtention of Construction Administrative Authorization required in 37 months.
|
| • | Obtention of Exploitation Authorization required in 5 years. |
Impact on operating facilities
The above regulation does not affect our existing and operating facilities.
C. Royal Decree 1183/2020
Royal Decree-law 1183/2020, or RD 1183/2020, was approved on December 30, 2020 and entered into force on December 31, 2020. RD 1183/2020 regulates in detail the procedure for obtaining access and connection permits. RDL 23/2020 established a moratorium by virtue of which it is not possible to request new access and connection permits until the regulation establishing the procedure for obtaining these was approved. This moratorium has been further extended by RD 1183/2020 until the available capacities in accordance with the new criteria established by the Spanish National Commission on Markets and Competition (CNMC) Circular 1/2021 (as defined below) are published. Finally, the approval of RD 1183/2020 determines the entry into force of art. 33.8 of Law 24/2013, which sets a validity of five (5) years of the access and connection permits.
RD 1183/2020 also regulates the access capacity tenders in certain nodes of the transmission grid for the integration of renewable energies.
D. CNMC Circular 1/2021
The CNMC Circular 1/2021, or Circular 1/2021, establishing the methodology and conditions for access and connection to the electricity transmission and distribution networks, was published on January 22, 2021. Circular 1/2021 completes the regulation process related to access and connection to the electricity transmission and distribution networks. The regulation has been developed through the Resolution of May 20, 2021, explained further below.
| E. | Resolution of May 20, 2021, of the CNMC, which establishes the detailed specifications for the determination of the generation access capacity to the transmission network and distribution networks |
Resolution of May 20, 2021, contains the detailed specifications for the determination of the access capacity of generation to the transmission grid and distribution networks.
The purpose of the detailed specifications for the determination of the access capacity to the transmission grid for generation is to establish the particular aspects of criteria and methodology for the calculation of the access capacity to the transmission grid for generation or storage facilities, new or existing, which change their declared conditions, with direct connection to the transmission grid or with connection in distribution with influence on the transmission grid.
The detailed specifications for the determination of the generation access capacity to the distribution networks determine the criteria and methodology for the calculation of the access capacity to the distribution networks, the calculation of the access capacity to the distribution network in the processing of requests for access of generation or transmission requests for access of generation or storage facilities, whether new or existing that change their technical characteristics or existing facilities that change their significant technical characteristics.
| F. | Law 7/2021 of climate change and energy transition |
Law 7/2021 of May 20, 2021 on climate change and energy transition, or Law 7/2021, establishes objectives for 2030 which include the reduction of greenhouse gas emissions of the Spanish economy by at least 23% compared to 1990; the penetration of renewable energies in final energy consumption of at least 42%; achieving an electricity system with at least 74% of generation from renewable energies and reduction of primary energy consumption by at least 39.5%. It also establishes that Spain must achieve climate neutrality by 2050 at the latest. The energy transition promoted by Law 7/2021 enables the mobilization of more than 200 billion euros of investment over the decade 2021-2030.
| G. | Royal Decree-Law 17/2021, of September 14 |
Royal Decree-Law 17/2021, of September 14, or RD-law 17/2021, entered into force on September 16, 2021. From the entry into force of RD-law 17/2021, and until March 31, 2022, a temporary adjustment in the remuneration of certain generation facilities is foreseen, in proportion to the higher income obtained by such facilities due to the internalization in the price of electricity in the wholesale market of the increase in the price of natural gas in international markets by the marginal emitting technologies.
However, the following are excluded from the scope of application of RD-law 17/2021: (i) production facilities in the electricity systems of the non-peninsular territories, (ii) production facilities that have a recognized remunerative framework (installations under the specific remuneration regime and the economic regime for renewable from auctions) and (iii) production facilities with net power equal to or less than 10 MW, regardless of the date of commissioning.
In addition, the remuneration reduction mechanism will not apply to the part of the energy produced by generation facilities which is subject to a fixed price (physical or financial) PPA either: (i) entered before September 16, 2021 or (ii) entered into on or after September 16, 2021 if the PPA term is more than one year.
Producers likely to be affected by the reduction will have to submit to REE a responsible statement and supporting documentation on the energy covered by contracting instruments. The Talasol PV Plant is affected by this measure with respect to the portion of its revenues that is not covered by the PPA and has submitted the required statement and documentation every month since the entry into force of RD-law 17/2021.
Remuneration of Renewable Energy Plants
The remuneration of electricity generation activity includes the following concepts: (i) the electric energy negotiated through the daily and intraday markets, remunerated on the basis of the price resulting from the balance between the supply and the demand of electric energy offered in them (i.e., spot price), (ii) adjustment services, including non-frequency services and system balance services, necessary to ensure adequate supply to the consumer, (iii) where appropriate, the remuneration for capacity mechanism, (iv) where appropriate, the additional remuneration for the production of electric energy in the electrical systems of non-peninsular territories, which the government may apply to cover the difference between the investment and operational costs and the incomes of these plants, and (v) where appropriate, the specific remuneration for the production of electric energy from renewable energy sources, high efficiency cogeneration and waste.
The legal and regulatory framework applicable to the production of electricity from renewable energy sources in Spain was modified by RDL 9/2013, due to the adoption of several urgent measures in order to ensure the financial stability of the power system, eliminating the former “Special Regime” and feed-in-tariff established by Royal Decree 661/2007 and Royal Decree 1578/2008 and establishing the basis of the current remuneration scheme applicable to renewable energies called the “Specific Remuneration” regime.
Specific Remuneration includes two components to be paid in addition to the electricity market price: (i) an “investment retribution” sufficient to cover the investment costs of a so-called “standard facility” – provided that such costs are not fully recoverable through the sale of energy in the market, and (ii) an “operational retribution” sufficient to cover the difference, if any, between the operational income and costs of a standard plant that participates in the market.
The Specific Remuneration provides that commencing July 13, 2013 all PV plants currently in operation, including our Spanish PV Plants, were no longer entitled to receive the applicable feed-in-tariff for renewable installations but rather became entitled to receive the Specific Remuneration.
The basic concept of the Specific Remuneration contained in RDL 9/2013 was confirmed by the current Power Act (Law 24/2013) and further developed by the following regulations:
| 1. | Royal Decree 413/2014 which regulates electricity generation activity using renewable energy sources, cogeneration and waste, or RD 413/2014. |
| 2. | Order IET/1045/2014 approving the retribution parameters for certain types of generation facilities of electricity from renewable energy sources, cogeneration and waste facilities, or Order 1045/2014. |
| 3. | Order ETU/130/2017 updating the retribution parameters for certain types of generation facilities of electricity from renewable energy sources, cogeneration and waste facilities, for the purposes of their application to the Regulatory Semi-period beginning on January 1, 2017 and ending on December 31, 2019, or Order 130/2017. |
| 4. | RDL 17/2019, adopting urgent measures for the necessary adaptation of remuneration parameters affecting the electricity system and responding to the process of cessation of activity of thermal generation plants. |
| 5. | Order TED/171/2020, updating the retribution parameters for certain types of generation facilities of electricity from renewable energy sources, cogeneration and waste facilities, for the purposes of their application to the Regulatory Period beginning on January 1, 2020, or Order 171/2020. |
Pursuant to the above regulations, the calculation of the Specific Remuneration is performed as follows:
| a) | The Specific Remuneration is calculated by reference to a “standard facility” during its “useful regulatory life”. Order 1045/2014 characterized the existing renewable installations into different categories (referred to as IT-category). These categories were created taking into account the type of technology, the date of the operating license and the geographical location of renewable installations. |
The Specific Remuneration is not calculated independently for each power installation. It is calculated based on the inclusion of each existing installations in one of the formulated IT-categories and, as a result of such inclusion, is based on the retribution parameters assigned to that particular IT-category.
| b) | According to RD 413/2014, the calculation of the Specific Remuneration of each IT-category shall be performed taking into account the following parameters: |
| (i) | the standard revenues for the sale of energy production, valued at the production market prices (currently set at €54.42/MWh, €52.12/MWh and €48.82/MWh for 2020, 2021 and 2022, respectively); |
| (ii) | the standard exploitation costs; and |
| (iii) | the standard value of the initial investment. For this calculation, only those costs and investments that correspond exclusively to the electricity production activity will be taken into account. Furthermore, costs or investments determined by administrative rules or acts that do not apply throughout Spanish territory will not be taken into account. |
| c) | Order 1045/2014 established the relevant parameters applicable to each IT-category. Therefore, to ascertain the total amount of the Specific Remuneration applicable to a particular installation it is necessary to (i) identify the applicable IT-category and (ii) integrate in the Specific Remuneration formula set forth in RD 413/2014 the economic parameters established by Order 1045/2014 for the relevant IT-category and the relevant update regulation (i.e., Order 171/2020). |
| d) | The Specific Remuneration is calculated for regulatory periods of six years, each divided into two regulatory semi-periods of three years. The first Regulatory Period commenced July 14, 2013 and terminated on December 31, 2019. The second Regulatory Period commenced January 1, 2020 and terminates December 31, 2025 (the corresponding first Regulatory Semi-Period ends December 31, 2022). |
| e) | The Specific Remuneration is designed to ensure a “reasonable rate of return” or profitability that during the first regulatory period (i.e., until December 2019) shall be equivalent to a Spanish 10-year sovereign bond calculated as the average of stock price in the stock markets during the months of April, May and June 2013, increased by 300 basis points (7.398% for plants prior to RDL 9/2013). RDL 17/2019 has fixed the reasonable rate of return for the second Regulatory Period at 7.09%. However, for plants prior to RDL the reasonable rate of return will remain at 7.398% if the conditions set forth in RDL 17/2019 are met (mainly to withdraw from any arbitration procedure, or to renounce any compensation, in connection with the regulatory changes in Spain that modified the remuneration regime). |
| f) | Pursuant to RD 413/2014, the revenues from the Specific Remuneration are set based on the number of operating hours reached by the installation in a given year and adjusted to electricity market price deviations. Furthermore, the economic parameters of the Specific Remuneration might be reviewed by the Spanish government at the end of a regulatory period or semi-period, however the standard value of the initial investment and the useful regulatory life will remain unchanged for the entire Regulatory Useful Life of the installation, as determined by Order 1045/2014. |
The update of the Specific Remuneration is carried out by reference to the IT-categories with the sole exception of the adjustment of annual revenues from the Specific Remuneration as a result of the number of Equivalent Operating Hours. This update is made installation by installation by the National Markets and Competition Commission.
The Talasol PV Plant is a “merchant” facility, i.e., will not be entitled to feed-in-tariff, “specific remuneration” or other similar regulatory incentives.
The obligation to finance the tariff deficit
Pursuant to Law 24/2013, renewable installations are required to finance future tariff deficits whereas pursuant to the former Power Act, the tariff deficit was only financed by five vertically integrated companies (Iberdrola, Endesa, E.On, Gas Natural Fenosa and Hidrocantábrico). Therefore, in the event there is a temporary deviation between revenues and costs of the electricity system on any given monthly settlement, this deviation shall be borne by all the companies participating in the settlement system (including renewable facilities).
Taxation of the income from generation of electricity
In December 2012, the Spanish Parliament enacted the 15/2012 on fiscal measures for the sustainability of the energy sector, which entered into force on January 1, 2013. Law 15/2012 sets forth a tax on energy generation of 7% from the total amount received for the production of electricity. RDL 15/2018 suspended this tax with respect to the electricity produced and injected to the grid during a period of six months commencing October 6, 2018 through March 31, 2019. As explained above with respect to RD-law 29/2021, until March 31, 2022 the tax will be suspended.
Removal of the Generation Access Toll
The CNMC approved Circular 3/2020, which was published in the Official State Gazette on January 24, 2020, by which the electricity generators are exempted from paying the toll to access the grid. This means the removal of the €0.5/MWh access toll that was established for electricity generators under Royal Decree – Law 14/2010 of December 23, 2010.
Material Effects of Government Regulations on the Israeli PV Plant
The Israeli Electricity Market
The Israeli electricity market is dominated by the Israel Electric Corporation (IEC), which manufactures and sells most of the electricity consumed in Israel and by the Palestinian Authority and had an installed capacity of approximately 17.7 GW as at the end of 2019. According to the Israeli Electricity Authority’s report on the electricity sector, published in August 2020, in 2019 the installed capacity of the IEC represented 72% of the total installed capacity in the Israeli market, the actual electricity production of the IEC represented 66% of the actual electricity production in the Israeli market and the IEC’s market share in the supply segment represented 79% of the supply segment of the Israeli market, with the remainder represented by the independent power producers, or IPPs. The IEC controls both the transmission network (for long-distance transmittal of electricity) and the distribution network (for transmittal of electricity to the end users). In recent years, various private manufacturers received energy production licenses from the Israeli Electricity Authority. During 2015, Israel’s largest private power plant, Dalia Power Energies Ltd., was commissioned with installed capacity of approximately 900 MW.
Commencing January 2016, the Israeli Electricity Authority ceased being an independent authority and was merged into the Ministry of Energy pursuant to a government resolution approved in August 2016, which also noted that the Ministry of Energy will be responsible for determining the electricity market policy and for approving electricity manufacturing licenses.
Israeli Regulation
The regulatory framework applicable to the production of electricity by the private sector in Israel is provided under the Israeli Electricity Sector Law, 1996, or the Electricity Law, and the regulations promulgated thereunder, including the Electricity Market Regulations (Terms and procedures for the granting of a license and the duties of the Licensee), 1997, the Electricity Market Principles (Transactions with the supplier of an essential service), 2000, and the Electricity Market Regulations (Conventional Private Electricity Manufacturer), 2005, or the Electricity Market Regulations. In addition, standards, guidelines and other instructions published by the Israeli Electricity Authority (established pursuant to Section 21 of the Electricity Law) and\or by the Israeli Electric Company also apply to the production of electricity by the private sector in Israel. The operations of photovoltaic plants in Israel are also subject to various licensing, permitting and other regulations and requirements, issued and supervised by the relevant municipality, the Israeli Land Authority and various governmental entities including the Ministry of Energy, the Ministry of Agriculture, the Ministry of Interior and the Ministry of Defense.
In June 2018, the Israeli Government issued resolution no. 3859 for the reform of the electricity market and a structural change in the IEC. In July 2018, Amendment No. 16 to the Electricity Law was adopted. This amendment implements the reform of the Israeli electricity market and the reduction of the IEC’s monopolistic power by providing arrangements for the removal of the system management authorities from the IEC, maintaining the transmission and part of the distribution facilities with the IEC, increasing the competition in the production segment by forcing the IEC to sell some of the power plants it owns and opening up the supply segment to competition.
Renewable Energy in Israel
On August 6, 1998, the Israeli government approved the resolution of the Committee of Ministers for Environment and Hazardous Materials “to act to advance the development of technologies for efficient use of renewable energies in order to reduce the dependency on imported fuel and reduce the contamination of the environment.” Commencing in 2009, the Israeli government adopted a number of decisions intended to achieve the integration of renewable energies into the local electricity market, including the adoption of a roadmap for the market in July 2011 and setting targets for renewable energy manufacturing.
The current targets for manufacturing electricity from renewable sources were set by the Israeli government in September 2015, as follows: 10% in 2020, 13% in 2025 and 30% in 2030. These targets were set as part of the Israeli government’s efforts to reduce greenhouse gas emissions in Israel.
In August 2017, Amendment no. 14 to the Electricity Sector Law, or Amendment no. 14, was published. Amendment no. 14 is in effect until December 31, 2030. Amendment no. 14 requires that the Israeli Minister of Energy formulate a perennial work plan in connection with production of electricity from renewable energy, which will include action items per year in order to meet the targets for renewable energy manufacturing determined by the Israeli government. Amendment no. 14 further provides that an inter-ministerial committee will be established, which will be required to submit its recommendations to the Minister of Energy regarding the advancement of electricity manufacturing from renewable energy, including recommendation with respect to: (i) methods for minimizing or eliminating obstructions for manufacturing of electricity from renewable energy, including in connection with planning and financing and (ii) methods for minimizing or eliminating obstructions for the construction of facilities for manufacturing electricity from renewable energy. Amendment no. 14 also requires the general manager of the Ministry of Energy to provide an annual report to the Economic Committee of the Israeli parliament on meeting the targets for manufacturing electricity from renewable energy and with respect to the implementation of Amendment no. 14 and the perennial work plan.
Photovoltaic Plants
The Israeli Electricity Authority determines the quotas for various traditional and renewable energy manufacturers in Israel. In the past, the Israeli Electricity Authority determined quotas for photovoltaic installations. The previous quota of 300 MWp for medium installations, connected to the distribution grid, and 200 MWp for large installations, connected to the transmission grid, have been fully utilized.
Israeli government resolution no. 2117, approved in October 2014, provides for a shift of thermo-solar, wind and bio-gas quotas in aggregate of 340 megawatt to solar quotas to be equally divided between plants connected to the transmission network and plants connected to the distribution network and further providing that the total quotas will not exceed 114 megawatt per year.
On October 10, 2016, The Israeli Electricity Authority published a hearing concerning the development of new photovoltaic plants with a total capacity ranging between 800-1700 megawatts as will be determined by the Israeli Electricity Authority, or the Publication. According to the Publication, the licenses to construct new photovoltaic plants under the new quotas shall be granted on the basis of a competitive bidding process, in which the bidders shall propose the applicable tariffs they expect to be paid for each KW/h supplied to the electric grid. The Publication provides that bidders who submit the lowest proposals that collectively fall within the quota limits will be entitled to develop a photovoltaic plant and sell electricity to the grid at a price equal to the lowest tariff proposal amongst the unsuccessful bids. Consequently, all successful bidders shall eventually sell electricity at the same tariff.
The final tariff will be valid for a period of 23 years for plants connected to the distribution grid, and 22 years for plants connected to the transmission grid, starting from the date of commercial operation or upon receiving a permanent license to produce electricity and the commencement of commercial operation, as shall be determined in accordance with the then applicable licensing regulation.
In November 2017, the Minister approved an additional quota of 1,600 MWp for photovoltaic installations that will be allocated between small rooftop installations and medium installations.
During the years 2017-2019, several tenders were conducted. The results of the fourth tender related to land-mounted medium installations that were published in November 2019, set a price per KWh of NIS 0.1798 for an aggregate production capacity of 236 MWp to be constructed by the end of 2020. The results of the second tender related to rooftop and water reservoir mounted installations, also published in November 2019, set a price per KWh of NIS 0.2307 for an aggregate production capacity of 68 MWp. During 2020, the Israel Electricity Authority conducted additional tenders and on December 28, 2020 the results of the most recent tender were published, with an aggregate installed capacity allocated of 609 MW and price per KWh set at NIS 0.1745, which is 12% lower than the price set in the previous tender.
In addition, the Israeli Electricity Authority approved a quota of 200 MWp for tenders to be published in conjunction with the Israel Land Authority for the construction of photovoltaic installations, of which winners were announced in connection with 136 MWp.
Licensing
The Israeli Electricity Authority regulated the establishment of photovoltaic plants, in several categories as noted above. Medium photovoltaic plants, such as the Israeli PV Plant, are governed by the Israeli Electricity Authority’s decision no. 284, or Decision 284. Decision 284 provides that it will apply until the earlier of reaching a quota of 300 megawatt in Israel or until the end of 2017.
An entity wishing to construct and operate a photovoltaic plant in Israel is required to obtain a conditional license, subject to the fulfillment of several threshold conditions set forth in Decision 284. A conditional license is generally valid for 42 months and the licensee, after meeting the milestones included in the conditional license, may be granted a conditional tariff approval based on the prevailing tariff, which is valid until the earlier of: (i) 90 days following its issuance and (ii) receipt of financing for the construction of the photovoltaic plant. In the event the licensee obtains financing during the 90 day period, it is issued the conditional tariff becomes permanent and is linked to the Israeli Consumer Price Index for a period of 20 years commencing upon commercial operation of the plant. Thereafter, subject to fulfilment of certain conditions, a permanent production license is granted.
National Outline Plan and Permits
In December 2010, the Israeli National Committee for Planning and Construction approved National Outline Plan 10/d/10, or the Outline Plan, for regulating photovoltaic plants from small rooftop mounted installations through photovoltaic plants on land plots up to a size of 0.29 square miles. The Outline Plan provides for the construction of photovoltaic plants in two routes: permit and plan. Permits are available for rooftop mounted installations and for land installations on specific lands, depending on their designation in the National Outline Plan and a plan route requires the licensee to file a plan with the relevant planning authority and such a plan cannot be filed with respect to certain lands that are designated as forests, national parks or reservations. The Outline Plan provides that preference will be given to the construction of photovoltaic plants in areas designated for construction and development. The Outline Plan permits planning authorities to approve the construction of photovoltaic plants in certain areas in northern and southern Israel in larger scopes than other areas.
Transfer of Rights in a Photovoltaic Plant
Any change of control in a photovoltaic plant that received a production license from the Israeli Electricity Authority requires amending the license and the approval of the Israeli Electricity Authority. Therefore, in the event we execute an agreement to acquire or sell and Israeli PV plant, such acquisition or sale, among other things, will be conditioned upon receipt of these approvals and the amendment of the relevant license.
Dori Energy and the Dorad Power Plant
General
Dori Energy is an Israeli private company in which we currently hold 50%. The remaining 50% is currently held by the Luzon Group (f/k/a the Dori Group). The Luzon Group is an Israeli publicly traded company, whose shares are traded on the Tel Aviv Stock Exchange. Dori Energy’s main asset is its holdings of 18.75% of Dorad.
Dori Energy
On November 25, 2010, Ellomay Clean Energy Ltd., or Ellomay Energy, our wholly-owned subsidiary, entered into an Investment Agreement, or the Dori Investment Agreement, with the Dori Group and Dori Energy, with respect to an investment by Ellomay Energy in Dori Energy. Pursuant to the terms of the Dori Investment Agreement, Ellomay Energy invested a total amount of NIS 50 million (approximately €10 million) in Dori Energy, and received a 40% stake in Dori Energy’s share capital. The transaction contemplated by the Dori Investment Agreement, or the Dori Investment, was consummated in January 2011, or the Dori Closing Date. Following the Dori Closing Date, the holdings of Ellomay Energy in Dori Energy were transferred to Ellomay Clean Energy Limited Partnership, or Ellomay Energy LP, an Israeli limited partnership whose general partner is Ellomay Energy and whose sole limited partner is us. Ellomay Energy LP replaced Ellomay Energy with respect to the Dori Investment Agreement and the Dori Energy Shareholders Agreement.
Ellomay Energy was also granted an option to acquire additional shares of Dori Energy, or the Dori Option, which, if exercised, will increase Ellomay Energy’s percentage holding in Dori Energy to 49% and, subject to the obtainment of certain regulatory approvals – to 50%. The exercise price of the options is NIS 2.4 million for each 1% of Dori Energy’s issued and outstanding share capital (on a fully diluted basis). In May 2015, we exercised the first option and in May 2016, we exercised the second option, accordingly, we currently hold 50% of Dori Energy and our indirect ownership of Dorad is 9.375%. The aggregate amount paid in connection with the exercise of this option amounted to approximately NIS 2.8 million (approximately €0.7 million), including approximately NIS 0.4 million (approximately €0.1 million) required in order to realign the shareholders loans provided to Dori Energy by its shareholders with the new ownership structure.
Concurrently with the execution of the Dori Investment Agreement, Ellomay Energy, Dori Energy and Dori Group also entered into the Dori Energy Shareholders Agreement that became effective upon the Dori Closing Date. The Dori Energy Shareholders Agreement provides that each of Dori Group and Ellomay Energy is entitled to nominate two directors (out of a total of four directors) in Dori Energy. The Dori Energy Shareholders Agreement also grants each of Dori Group and Ellomay Energy with equal rights to nominate directors in Dorad, provided that in the event Dori Energy is entitled to nominate only one director in Dorad, such director shall be nominated by Ellomay Energy for so long as Ellomay Energy holds at least 30% of Dori Energy. The Dori Energy Shareholders Agreement further includes customary provisions with respect to restrictions on transfer of shares, a reciprocal right of first refusal, tag along, principles for the implementation of a BMBY separation mechanism, special majority rights, etc.
Dori Energy’s representative on Dorad’s board of directors is currently Mr. Ran Fridrich, who is also our CEO and a member of our Board of Directors.
The Dorad Power Plant
Other than information relating to Dori Energy, the disclosures contained herein concerning the Dorad Power Plant are based on information received from Dorad and other publicly available information.
Dorad currently operates the Dorad Power Plant, a combined cycle power plant based on natural gas, with a production capacity of approximately 860 MW, located south of Ashkelon. The Dorad Power Plant was constructed as a turnkey project, with the consideration denominated in US dollars, and commenced commercial operations in May 2014. Dorad executed a lease with respect to the land on which the Dorad Power Plant is located with EAPC for the construction period and for a period of 24 years and 11 months following the commencement of commercial operations of the Dorad Power Plant.
The electricity produced by the Dorad Power Plant is sold to end-users throughout Israel and to the Israeli National Electrical Grid. The transmission of electricity to the end-users is done via the existing transmission and distribution grid, in accordance with the provisions of the Electricity Sector Law and its Regulations, and the Standards and the tariffs determined by the Israeli Electricity Authority. The existing transmission and delivery lines are operated by the IEC, which is the only entity that holds a license to operate an electricity system in Israel. The Dorad Power Plant is based on combined cycle technology using natural gas. The combined cycle configuration is a modern technology to produce electricity, where gas turbines serve as the prime mover. After combustion in the gas turbine to produce electricity, the hot gases from the gas turbine exhaust are directed through an additional heat exchanger to produce steam. The steam powers a steam turbine connected to a generator, which produces additional electric energy. The Dorad Power Plant is comprised of twelve natural gas turbines, each with an installed capacity of 50 MWp and two steam turbines, each with an installed capacity of 100 MWp. These turbines can be turned on and off quickly, with no material losses in energy efficiency, which provides operational flexibility in accordance with the expected needs of customers and the IEC, calculated based on a proprietary forecasting system implemented by Dorad.
The other shareholders in Dorad are Eilat Ashkelon Infrastructure Services Ltd., or EAIS, (37.5%), and Edelcom Ltd., or Edelcom, (18.75%), both Israeli private companies, and Zorlu Enerji Elektrik Uretim A.S., or Zorlu, (25%), a publicly traded Turkish company. Dorad’s shareholders, including Dori Energy, are parties to a shareholders agreement that includes customary provisions, including a right of first refusal, arrangements in connection with the financing of Dorad’s operations, certain special shareholder majority requirements and the right of each shareholder holding 10% of Dorad’s shares to nominate one member to Dorad’s board of directors. As noted above, pursuant to the Dori Energy Shareholders Agreement, we are currently entitled to recommend the nomination of the Dorad board member on behalf of Dori Energy.
In June 2019, Dorad made the final repayment of shareholders loans in the aggregate amount of NIS 19 million, of which Dori Energy received approximately NIS 3.7 million (approximately €1 million).
Dorad entered into a credit facility agreement with a consortium led by Bank Hapoalim Ltd., or the Dorad Credit Facility, and financial closing of the Dorad Power Plant was reached in November 2010, with the first drawdown received in January 2011. The Dorad Credit Facility provides that the consortium will fund up to 80% of the cost of the project, with the remainder to be funded by Dorad’s shareholders. The funding is linked to the Israeli consumer price index and bears interest at a rate that is subject to updates every three years based on Dorad’s credit rating (Dorad received an “investment grade” rating, on a local scale). The current interest rate is approximately 5.1%. The funding is repaid (interest and principal) in semi-annual payments, commencing six months of the commencement of operations of the Dorad Power Plant and for a period of 17 years thereafter. The Dorad Credit Facility further includes customary provisions, including early repayment under certain circumstances, fixed charges on Dorad’s assets and rights in connection with the Dorad Power Plant and certain financial ratios, which Dorad is in compliance with as of December 31, 2021. Dorad’s senior loan facility is linked to the Israeli CPI. As the production tariff is partially linked to the Israeli CPI, the exposure is minimized. However, as the production tariff is published in delay with respect to the actual changes in the CPI, Dorad executed derivative transactions on the Israeli CPI. In connection with the Dorad Credit Facility, Dorad’s shareholders (including Dori Energy) undertook to provide guarantees to the IEC and to various suppliers and service provides of Dorad and also undertook to indemnify Dorad and the consortium in connection with certain expenses, including certain environmental hazards. The aggregate investment of Dorad in the construction of the Dorad Power Plant was approximately NIS 4.7 billion (equivalent to approximately €1.1 billion). The Dorad Credit Facility provides for the establishment of the project’s accounts and determines the distribution of the cash flows among the accounts. In addition, the Dorad Credit Facility includes terms and procedures for executing deposits and withdrawals from each account and determines the minimum balances in each of the capital reserves.
As of December 31, 2021, we provided guarantees to the Israeli Electricity Authority, to the IEC and to Israel Natural Gas Lines Ltd. in the aggregate amount of approximately NIS 16 million (approximately €4.5 million).
The Dorad Power Plant commenced operations in May 2014, following the receipt of the permanent production and supply licenses discussed under “Material Effects of Government Regulations on Dorad’s Operations” below.
Dorad previously entered into an operation and maintenance agreement with Eilat-Ashkelon Power Plant Services Ltd., or EAPPS, a wholly-owned subsidiary of Eilat Ashkelon Infrastructure Services Ltd., which holds 37.5% of Dorad. Certain of the obligations under such agreement were assigned to Zorlu, which holds 25% of Dorad. During 2013, EAPPS entered into an agreement with Ezom Ltd., or Ezom, which, to our knowledge, is 75% owned by the controlling shareholder of Edelcom (which holds 18.75% of Dorad) with the remainder held by a company controlled by Zorlu, for the provision of sub-contracting services to EAPPS. Despite the assignment and subcontracting agreement, EAPPS remained liable to Dorad for all obligations under the agreement. In December 2017, Dorad and Ezom executed an operation and maintenance agreement for the Dorad Power Plant, or the Dorad O&M Agreement, replacing EAPPS by Ezom as the O&M contractor of the Dorad Power Plant under the same terms. The Dorad O&M Agreement is for a period of 24 years and 11 months commencing upon receipt of a permanent license by Dorad, and in no event for a period that is longer than the period of the lease of the Dorad Power Plant premises.
Due to the location of the Dorad Power Plant, Dorad has implemented various security measures in order to enable continued operations of the Dorad Power Plant during attacks on its premises.
Dividends
On February 27, 2020, Dorad’s Board of Directors decided to distribute a dividend of NIS 120 million (approximately €31.6 million). In connection with such dividend distribution, Dori Energy received NIS 22.5 million (approximately €5.8 million) and repaid an amount of NIS 10.25 million (approximately €2.6 million) loan to us. On May 6, 2021, Dorad’s Board of Directors approved the distribution of a dividend in the amount of NIS 100 million (approximately €25.4 million) and such dividend was distributed during May 2021. In connection with such dividend distribution, Dori Energy received an amount of approximately NIS 18.8 million (approximately €4.5 million) and repaid an amount of approximately NIS 9 million (approximately €2.3 million) loan to us.
Legal Proceedings
We and Dori Energy, and several of the other shareholders of Dorad and their representatives and Dorad, are involved in various litigations as follows:
Petition to Approve a Derivative Claim filed by Dori Energy and Hemi Raphael
During April 2015, Dori Energy approached Dorad in writing, requesting that Dorad take legal steps to demand that Zorlu, Wood Group Gas Turbines Ltd., the engineering, procurement & construction contractor of the Dorad Power Plant, or Wood Group, and the representatives of Zorlu on the Dorad board of directors disclose details concerning the contractual relationship between Zorlu and Wood Group. In its letters, Dori Energy notes that if Dorad will not act as requested, Dori Energy intends to file a derivative suit in the matter.
Following this demand, in July 2015, Dori Energy and Dori Energy’s representative on Dorad’s board of directors, who is also a member of our Board of Directors, filed a petition, or the Petition, for approval of a derivative action on behalf of Dorad with the Economic Department of the Tel Aviv-Jaffa District Court. The Petition was filed against Zorlu, Zorlu’s current and past representatives on Dorad’s board of directors and Wood Group and several of its affiliates, all together, the Defendants. The petition requested, inter alia, that the court instruct the Defendants to disclose and provide to Dorad documents and information relating to the contractual relationship between Zorlu and Wood Group, which included the transfer of funds from Wood Group to Zorlu in connection with the EPC agreement of the Dorad Power Plant. For the sake of caution, Plaintiffs further requested to reserve their rights to demand, on behalf of Dorad, monetary damages in a separate complaint after Dorad receives the aforementioned information and documents.
In January 2016, Dori Energy filed a motion to amend the Petition to add Ori Edelsburg (a director in Dorad) and affiliated companies as additional respondents, to remove Zorlu’s representatives and to add several documents which were obtained by Dori Energy, after the Petition had been filed. Dorad and Wood Group filed their response to the motion to amend the Petition and Zorlu filed a motion for dismissal. During the hearing held in March 2016, Zorlu withdrew the motion for dismissal and is required to submit its response to the motion to amend the Petition by March 31, 2016.
At a hearing held in April 2016, the request submitted in January 2016 to amend the Dori Energy Petition to add Ori Edelsburg (a director in Dorad) and affiliated companies as additional respondents was approved. At the end of July 2016, the respondents filed their responses to the amended Dori Energy Petition. Dori Energy and Hemi Raphael had until December 19, 2016 to reply to the respondents’ response. Following the recusal of the judges in the Economic Department of the Tel Aviv-Jaffa District Court, in September 2016 the President of the Israeli Supreme Court instructed that the parties will inform the court as to the proper venue in which the petition should be heard and to update the court whether the parties reached an agreement as to the transfer of the dispute to an arbitration proceeding. During October 2016, Dori Energy notified the court that the parties have not yet reached an agreement and requested that the court determine which judges will decide on the petition and the respondents notified the court that the discussion concerning transferring the dispute to an arbitration process are advancing and an attempt will be made to reach an arbitration agreement during November 2016. On November 15, 2016, the President of the Israeli Supreme Court instructed that the parties will update the court on the proposed transfer of the proceeding to an arbitration process by early December 2016.
In December 2016, an arbitration agreement was executed pursuant to which this proceeding, as well as the petition to approve a derivative claim filed by Edelcom mentioned below will be arbitrated before Judge (retired) Hila Gerstel. In January 2017, the arbitrator ruled, among other things, that the statements of claim in the various proceedings will be submitted by February 19, 2017, the statements of defense will be submitted by April 4, 2017, discovery affidavits will be submitted by April 6, 2017, responses will be submitted by May 4, 2017 and a preliminary hearing will be held on May 10, 2017. These dates were extended with the agreement of the parties so that the statements of claim will be submitted by February 23, 2017 and the statements of defense will be submitted by April 9, 2017. Following the execution of the arbitration agreement, Dori Energy and Mr. Raphael requested the deletion of the proceeding and the request was approved. A statement of claim, or the Claim, was filed by Dori Energy and Mr. Raphael on behalf of Dorad against Zorlu, Mr. Edelsburg, Edelcom and Edeltech Holdings 2006 Ltd., or Edeltech, and, together with Mr. Edelsburg and Edelcom, the Edelsburg Group, on February 23, 2017 in which they repeated their claims included in the amended Petition and in which they required the arbitrator to obligate the defendants, jointly and severally, to pay an amount of $183,367,953 plus interest and linkage to Dorad. During March 2017, the respondents filed two motions with the arbitrator as follows: (i) to instruct the plaintiffs to resubmit the statement of claim filed in connection with the arbitration proceedings in a form that will be identical to the form of the statement of claim submitted to the court, with the addition of the monetary demand only or, alternatively, to instruct that several sections and exhibits will be deleted from the statement of claim and (ii) to postpone the date for filing their responses by 45 days from the date the motion set forth under (i) is decided upon. The plaintiffs filed their objection to both motions and some of the respondents filed their responses to the objection. In April 2017, the Defendants filed their statements of defense. Within the said statements of defense, Zorlu attached a third party notice against Dorad, Dori Energy and the Luzon Group, in the framework of which it repeated the claims on which its defense statement was based and claimed, among other claims, that if the plaintiffs’ claim against Zorlu was accepted and would negate Zorlu’s right receive compensation and profit from its agreement with Dorad and therefore Zorlu should be compensated in the amount of approximately NIS 906.4 million (approximately €218.3 million). Similarly, also within their statement of defense, Edelcom, Mr. Edelsburg and Edeltech filed a third party notice against Dori Energy claiming for breaches by Dori Energy of the duty to act in good faith in contract negotiations and that any amount ruled will constitute unlawful enrichment.
In October 2017, EAIS, which holds 37.5% of Dorad’s shares, filed a statement of claim in this arbitration proceeding. In its statement of claim, EAIS joins Dori Energy’s and Mr. Raphael’s request as set forth in the Claim and raises claims that are similar to the claims raised by Dori Energy and Mr. Raphael in the Claim.
In November 2017, Dori Energy and Mr. Raphael filed their responses to the defendants’ statements of defense and in December 2017, Dori Energy, Mr. Raphael and EAIS filed their statements of defense to the third party notices submitted by the defendants. In December 2017, Zorlu filed a request in connection with the Dori Energy statement of claim to the extent it is directed at board members serving on behalf of Zorlu and in January 2018 the arbitrator provided its ruling that the legal validity of the actions or inactions of board members of Dorad will be attributed to the entities that are shareholders of Dorad on whose behalf the relevant board member acted and the legal determinations, if any, will be directed only towards the shareholders of Dorad. During January 2018, Mr. Edelsburg, Edelcom and Zorlu filed their statement of defense in connection with the claim filed by EAIS and also filed third party notices against EAIS, Dori Energy and the Luzon Group claiming that EAIS and the Luzon Group enriched themselves at Dorad’s account without providing disclosure to the other shareholders and requesting that, should the position of Dori Energy and EAIS be accepted in the main proceeding, the arbitrator, among other things, obligate EAIS to refund to Dorad all of the rent paid to date and determine that Dorad is not required to pay any rent in the future or determine that the rent fees be reduced to their market value and refund Dorad the excess amounts paid by it to EAIS, to determine that the board members that represent EAIS and Dori Energy breached their fiduciary duties towards Dorad and obligate EAIS and Dori Energy to pay the amount of $140 million, plus interest in the amount of $43 million, which is the amount Zorlu received for the sale of its rights under the Dorad EPC agreement, and to rule that in connection with the engineering and construction works performed by the Luzon Group, the Luzon Group and Dori Energy are required to refund to Dorad or compensate the defendants in an amount of $24 million, plus interest and linkage and, alternatively, to determine that Mr. Edelsburg, Edelcom and Zorlu are entitled to indemnification from the third parties for the entire amount they will be required to pay.
In May 2019, a new arbitrator was appointed and dates were set for the discovery process. The evidentiary hearings were scheduled during March-June 2020 and commencing August 2020. Due to the COVID-19 crisis, several evidentiary hearings scheduled during the period commencing March 2020 were cancelled. Evidentiary hearings were held during June, August, September, October and November 2020 and during February and March 2021 and the parties filed several motions in connection with the discovery process, the evidentiary hearings and expert opinions. On February 15, 2021 the arbitrator approved replacing the late Mr. Hemi Raphael as the claimant with Mr. Ran Fridrich. The parties filed several motions in connection with the discovery process, the evidentiary hearings and expert opinions. Additional evidentiary hearings were held in March-May 2021. Following the parties’ request for approval of a procedural arrangement regarding the submission of written summaries and the possible supplemental oral argument in all proceedings subject to arbitration, the arbitrator approved the various dates for submitting summaries, ending in May 2022.
For more information see Note 6 to our annual financial statements included elsewhere in this Report.
Petition to Approve a Derivative Claim filed by Edelcom
In February 2016 the representatives of Edelcom Ltd., which holds 18.75% of Dorad, or Edelcom, and Ori Edelsburg sent a letter to Dorad requesting that Dorad file a claim against Ellomay Energy, our wholly-owned subsidiary that holds Dori Energy’s shares, the Luzon Group and Dori Energy referring to an entrepreneurship agreement that was signed in November 2010 between Dorad and the Luzon Group, pursuant to which the Luzon Group received payment in the amount of approximately NIS 49.4 million (approximately €11.9 million) in consideration for management and entrepreneurship services. Pursuant to this agreement, the Luzon Group undertook to continue holding, directly or indirectly, at least 10% of Dorad’s share capital for a period of 12 months from the date the Dorad Power Plant is handed over to Dorad by the construction contractor. The Edelcom Letter claims that as a consequence of the management rights and the options to acquire additional shares of Dori Energy granted to us pursuant to the Dori Investment Agreement, the holdings of the Dori Group in Dorad have fallen below 10% upon execution of the Dori Investment Agreement. The Edelcom Letter therefore claims that Dori Group breached its commitment according to entrepreneurship agreement. The Edelcom Letter requests that Dorad take all legal actions possible against the Dori Group, Dori Energy, Ellomay Energy and Mr. Hemi Raphael to recover the amounts it paid in accordance with the entrepreneurship agreement and also notify Dori Energy that, until recovery of the entrepreneurship fee, Dorad shall withhold the relevant amount from any amount Dori Energy is entitled to receive from Dorad, including repayments of shareholders’ loans and dividend distributions. In July 2016, Edelcom filed a petition for approval of a derivative action against Ellomay Energy, the Luzon Group, Dori Energy and Dorad. In November 2016, Ellomay Energy and Dori Energy filed a joint petition requesting that this application be transferred to the same judges who will be adjudicating the petition filed by Dori Energy and Hemi Raphael mentioned above and in November 2016, Edelcom filed an objection to this request. As noted above, in December 2016, an arbitration agreement was executed pursuant to which this proceeding, as well as the proceeding mentioned above and below will be arbitrated before Judge (retired) Hila Gerstel and the proceeding before the court was deleted. On February 23, 2017, Edelcom submitted the petition to approve the derivative claim to the arbitrator. On April 30, 2017, Ellomay Energy filed its response to the petition and on May 1, 2017 the Luzon Group filed its response to the petition. For more information see above and see Note 6 to our annual financial statements included elsewhere in this Report.
Opening Motion filed by Zorlu
On April 8, 2019, Zorlu filed an opening motion with the District Court in Tel Aviv against Dorad and the directors serving on Dorad’s board on behalf of Dori Energy and EAIS. In the opening motion, Zorlu asked the court to instruct Dorad to convene a shareholders meeting and to include on the agenda of this meeting a discussion and a vote on the planning and construction of an additional power plant adjacent to the existing power plant, or the Dorad 2 Project. Zorlu claimed that although the articles of association of Dorad provides that the planning and construction of an additional power plant requires a unanimous consent of the Dorad shareholders, and while Zorlu and Edelcom are opposed to this project, including due to the current disagreements among Dorad’s shareholders, Dorad continued taking actions to advance the project, which include spending substantial amounts our of Dorad’s funds. Zorlu further claims that the representatives of Dori Energy and EAIS on the Dorad board have acted to prevent the convening of a shareholders meeting as requested by Zorlu. On April 16, 2019, Edelcom submitted a request to join the opening motion as an additional respondent as Edelcom claims that it is another shareholder in Dorad that opposes the advancement of the project at this stage. In addition, Edelcom joined Dori Energy and EAIS as additional respondents to its request, claiming that these entities are required to be part of the proceeding in order to reach a complete and efficient resolution. All parties agreed to the joining of Edelcom, Dori Energy and EAIS to the proceeding. On June 15, 2019, Edelcom filed its response to the petition, requesting that the court accept the petition. On August 13, 2019, Dorad, EAIS and the Dorad board members submitted their responses and requested that the petition be dismissed. On December 8, 2019 an evidentiary hearing was held. The parties filed their summations in writing during June and July 2020. On August 27, 2020, Dorad informed the District Court that the National Infrastructure Committee resolved, inter alia, to approve the presentation of the plan submitted by Dorad in connection with the additional power plant to the District Committee’s and the public’s comments, subject to amendments. On September 9, 2020, Eilat-Ashkelon Infrastructure Services Ltd., one of the shareholders of Dorad, and its representatives on the Dorad board of directors submitted a response to the notice, claiming that the information included in the notice supports a rejection of the opening motion. Zorlu and Edelcom each filed a response on September 13, 2020 asking to remove the notice provided by Dorad from the District Court’s file. On September 17, 2020, the District Court ruled that the notice will not be removed from the file. On June 28, 2021, a ruling was handed in which the court ordered Dorad to convene a special shareholders meeting, on whose agenda will be the planning and construction of the “Dorad 2 Project”. Following the said ruling, Dorad’s board resolved that Dorad's management will continue to examine the feasibility of the “Dorad 2 Project” and its implications, and bring its decisions to the board's approval. Dorad’s board of directors further resolved that to the extent it will approve the Dorad 2 Project, the decision will be presented to Dorad’s shareholders for approval. On July 27, 2021, a shareholders meeting of Dorad was held. In accordance with the court ruling, the agenda for such meeting included two resolutions (1) the planning and construction of the Dorad 2 Project – a resolution that Dori Energy and EAIS supported and Edelcom and Zorlu rejected; and (2) approval of the aforementioned resolution of the Dorad board of directors – a resolution which Dori Energy and EAIS supported and with respect to which Edelcom and Zorlu abstained. Following such shareholders meeting, correspondence was exchanged between Dorad and Edelcom concerning, among other issues, the implications of the aforementioned resolutions. Dorad estimates (after consulting with legal counsel) that by convening the aforementioned shareholders meeting Dorad complied with the court ruling and therefore the opening motion process ended. To our knowledge, the Dorad 2 Project is currently under initial internal examination by Dorad. On July 13, 2020, Dorad submitted to the National Infrastructure Committee, or NIC, plans for public objections, on January 11, 2021, the NIC decided to postpone the final decision and on December 27, 2021, the NIC decided to conditionally raise the construction of another power plant to a government decision. There can be no assurance as to if, when and under what terms it will be advanced or promoted by Dorad.
Competition
Dorad competes with the IEC and other private electricity manufacturers with respect to sales to potential customers directly.
Dorad’s position is that the current regulation and structure of the Israeli electricity market provide IEC with a competitive advantage over the private electricity manufacturers. However, as long as the regulation remains unchanged, as the IEC controls the transmission and delivery lines and the connection of the private power plants to the Israeli national grid, Dorad and the other private manufacturers are dependent on the IEC for their operations and may also be subject to unilateral actions on the part of IEC’s employees. For example, the approval of Dorad’s permanent licenses was delayed due to ongoing disputes between the IEC and its employees. For more information, see “Material Effects of Government Regulations on Dorad’s Operations” below.
Customers
Dorad entered into electricity supply agreements with various commercial consumers for an aggregate of approximately 95% of the production capacity of the Dorad Power Plant. The end-users include the Israeli Ministry of Defense, Mekorot (Israel’s water utility and supply company), Israeli food manufacturers (Ossem and Strauss), Israeli hotel chains (Isrotel and Fattal), and others. The electricity supply agreements are, mainly, based on a reduced rate compared to the rate applicable to electricity consumers in the general market, as determined by the Israeli Electricity Authority.
In addition to the provision of electricity to specific commercial consumers, the agreement between Dorad and the IEC, which governs the provision of services and electricity from the IEC to Dorad, provides that Dorad will supply availability and energy to the IEC based on a production plan determined by the Israeli Electricity Authority, on IEC’s requirements and on the tariffs determined by the Israeli Electricity Authority.
The Covid-19 crisis affects Dorad’s customers (which, as noted above, include hotels and other industrial customers), and during 2020 Dorad reported a certain decrease in consumption of electricity by its customers and by the IEC due to the Covid-19 crisis and its implications on the tourism industry, the industrial entities and electricity consumption in general.
Sources and Availability of Raw Materials for the Operations of the Dorad Power Plant
The Dorad Power Plant is a dual-fuel plant, using natural gas as the main fuel and diesel oil in the event of an emergency. Pursuant to publications of the Israeli Ministry of Energy, natural gas is currently being used for the production of approximately 50% of the electricity produced in Israel.
Agreement with Tamar
On October 15, 2012, Dorad entered into the Tamar Agreement with Tamar, which is one of the suppliers of natural gas for the Israeli electricity market. Pursuant to information received from Dorad, Dorad purchases natural gas from Tamar for purposes of operating the Dorad Power Plant and the main terms of the Tamar Agreement are as follows:
| a. | Tamar has committed to supply natural gas to Dorad in an aggregate quantity of up to approximately 11.2 billion cubic meters (BCM), or the Total Contract Quantity, in accordance with the conditions set forth in the Tamar Agreement. |
| b. | The Tamar Agreement will terminate on the earlier to occur of: (i) sixteen (16) years following the commencement of delivery of natural gas to the Dorad power plant or (ii) the date on which Dorad will consume the Total Contract Quantity in its entirety. Each of the parties to the Tamar Agreement has the right to extend the Tamar Agreement until the earlier of: (i) an additional year provided certain conditions set forth in the Tamar Agreement were met, or (ii) the date upon which Dorad consumes the Total Contract Quantity in its entirety. |
| c. | Dorad has committed to purchase or pay for (“take or pay”) a minimum annual quantity of natural gas in a scope and in accordance with a mechanism set forth in the Tamar Agreement. The Tamar Agreement provides that if Dorad did not use the minimum quantity of gas as committed, it shall be entitled to consume this quantity every year during the three following years and this is in addition to the minimum quantity of gas Dorad is committed to. |
| d. | The Tamar Agreement grants Dorad the option to reduce the minimum annual quantity so that it will not exceed 50% of the average annual gas quantity that Dorad will actually consume in the three years preceding the notice of exercise of the option, subject to adjustments set forth in the Tamar Agreement. The reduction of the minimum annual quantity will be followed by a reduction of the other contractual quantities set forth in the Tamar Agreement. The option described herein is exercisable during the period commencing as of the later of: (i) the end of the fifth year after the commencement of delivery of natural gas to Dorad in accordance with the Tamar Agreement or (ii) January 1, 2020, and ending on the later of: (i) the end of the seventh year after the commencement of delivery of natural gas to Dorad in accordance with the Tamar Agreement or (ii) December 31, 2022. In the event Dorad exercises this option, the quantity will be reduced at the end of a one year period from the date of the notice and until the termination of the Tamar Agreement. |
| e. | The natural gas price set forth in the Tamar Agreement is linked to the production tariff as determined from time to time by the Israeli Electricity Authority, which includes a “final floor price.” Following the decreases in the price of fuel and electricity during 2015, the Israeli Electricity Authority reduced the rate of electricity production, and as a result the natural gas price under the Tamar Agreement reached the “final floor price” in March 2016. Commencing January 1, 2020, the production component rate was decreased by approximately 7.9%, resulting in a decrease of the gas price under the Tamar Agreement to the final floor price and therefore will not be further reduced in the future. Commencing January 1, 2020, the production component rate was decreased by approximately 4.5%, however due to the floor price arrangement, the gas price was not reduced. Any delays, disruptions, increases in the price of natural gas under the agreement, or shortages in the gas supply from Tamar will adversely affect Dorad’s results of operations. In addition, as future reductions in the production tariff will not affect the price of natural gas under the agreement with Tamar, Dorad’s profitability may be adversely affected. |
| f. | Dorad may be required to provide Tamar with guarantees or securities in the amounts and subject to the conditions set forth in the Tamar Agreement. |
| g. | The Tamar Agreement includes additional provisions and undertakings as customary in agreements of this type such as compensation mechanisms in the event of shortage in supply, the quality of the natural gas, limitation of liability, etc. |
As a result of the indexation included in the gas supply agreement, Dorad is exposed to changes in exchange rates of the U.S. dollar against the NIS. To minimize this exposure Dorad executed forward transactions to purchase U.S. dollars against the NIS.
On April 2, 2019, Dorad entered into an addendum to the Tamar Agreement according to which the gas quantities specified in the addendum to the Tamar Agreement that Dorad purchases from Tamar will not be included for the purpose of calculating the quantities of gas at the time of the reduction of the purchases from Tamar, in accordance with the instructions of the Tamar Agreement.
On March 22, 2021, Dorad entered into an addendum to the Tamar Agreement according to which the parties agreed on the amount of gas that Dorad will purchase from Tamar commencing January 1, 2022. This addendum also provides that Dorad will be entitled to compensation in the amount specified in the addendum.
On April 5, 2021, Dorad entered into an additional gas purchase agreement with Tamar, or the Additional Tamar Agreement, pursuant to which Dorad is entitled to purchase additional quantities of gas from Tamar during a period of four years ending on April 5, 2025. As part of the Additional Tamar Agreement, Dorad will receive a grant that depends, among other things, on the amount of gas consumption quantities determined in the Additional Tamar Agreement. Dorad received 50% of the grant in the first half of 2022 and expects to receive the remainder on the date of termination of the Additional Dorad Agreement pursuant to the conditions set forth therein.
The addendums to the Tamar Agreement and the Additional Tamar Agreement were subject to certain conditions precedent that were met on July 14, 2021.
Agreement with Alon Gat
On March 6, 2019, Dorad signed a memorandum of understanding with Alon Energy Centers LP, or Alon Gat, which is constructing a private power plant for the production of electricity in Kiryat Gat, Israel, with a capacity of approximately 73 MW. On November 11, 2019, Dorad signed an addendum to this memorandum of understanding. In the framework of the memorandum of understanding and the addendum, Alon Gat will serve as a producer who will provide Dorad with the full availability of the aforementioned power plant and will sell the electricity produced at the power plant to Dorad, which will serve as supplier. In addition, Alon Gat, who holds the production license, will be responsible for operating the Alon Gat power plant and generating electricity at the plant and will bear all costs related to operating the Alon Gat power plant, the availability and the power generation. Dorad will be responsible for all activities related to the power supply sales to the customers and the IEC. On November 12, 2019, commercial operation of the Alon Gat power plant began and the implementation of the memorandum of understanding became effective. The memorandum of understanding and addendum contain termination provisions, including in the event of regulatory changes that materially impair the implementation of the understandings between the parties. Following the hearing scheduled by the Israeli Electricity Authority in August 2019 and the resolution published by the Israeli Electricity Authority in January 2020 regarding the amendments to the standards on consumption plan anomalies, which may affect the financial feasibility of the understandings with Alon Gat, on August 12, 2021, Dorad signed an amendment to the addendum and memorandum of understanding that includes addressing consumption plan anomalies. As part of the amendment, Dorad will examine the economic viability following the resolution in respect of a change in the production tariff and a material change in the demand hours cluster. which constitutes a regulatory change as defined in the memorandum of understanding and addendum and may affect the financial feasibility of the arrangement with Alon Gat. For more information concerning the resolution of the Israeli Electricity Authority see “Consumption Plans and Deviations” under “Material Effects of Government Regulations on Dorad’s Operations” below.
Dorad is also a party to a natural gas transmission agreement and to a diesel oil warehousing agreement.
Natural Gas Purchase Agreement with Energean
On October 30, 2017, Dorad signed an agreement with Energean regarding the acquisition of natural gas, in a cumulative volume of approximately 6 BCM over a period of 14 years, from the Karish and Tanin reserves held by them and whose completion is expected to be by the second half of 2021. Dorad will purchase about half of the gas required to operate the Dorad Power Plant and the rest of the demand will continue to be supplied by Tamar. According to the agreement with Energean, if Dorad does not actually consume the minimum quantity it has undertaken, it will be forced to consume this quantity. On November 2018, all the suspending conditions included in the agreement with Energean were fulfilled. On February 5, 2020, Energean informed Dorad that due to the Coronavirus (Covid-19) spread in China, the Chinese government issued restrictions on travel and transportation including to an area where portions of Energean gas production facilities are manufactured and therefore a delay is expected in the construction of production facilities and in the gas supply to Dorad. On April 22, 2020, Energean informed Dorad that it took several steps in order to overcome the impact of the Covid-19 crisis in order to decrease the expected delay in the provision of natural gas to Dorad and on September 10, 2020 Energean updated the date in which it expects to start providing the natural gas from the first half of 2021 to the second half of 2021. On January 21, 2021, Energean updated the forecast date for the initial gas flow to the end of 2021 or the second quarter of 2022. On May 24, 2021, Energean updated the forecast date for the initial gas flow to the second half of 2022. On January 20, 2022, Energean updated the forecast date for the initial gas flow to the fourth quarter of 2022. Due to these delays, Dorad notes that it may continue to purchase gas from Tamar at a higher price than the price set in the agreement with Energean.
Material Effects of Government Regulations on Dorad’s Operations
As noted above under “Material Effects of Government Regulations on the Israeli PV Plant,” the regulatory framework applicable to the production of electricity by the private sector in Israel is provided under the Electricity Law, regulations promulgated thereunder, and other standards, guidelines and instructions published by the Israeli Electricity Authority and the IEC.
Licenses
In April 2014, the Israeli Electricity Authority resolved to grant Dorad a generation license for a period of twenty years and a supply license for a period of one year. In August 2014, Dorad filed a request to extend the supply license for an additional period of nineteen years and the long-term supply license was executed in July 2015.
Tariffs
The Israeli Electricity Authority determined the method and tariffs for the provision of availability and electricity by private electricity manufacturers to the IEC in the event not all of the capacity of such manufacturers was sold directly to customers. The Israeli Electricity Authority’s decision provides that the IEC will pay for the availability even in the event electricity was not actually used by end customers depending on the amount of electricity made available to the IEC.
In September 2010, Dorad received a tariff approval from the Israeli Electricity Authority that sets forth the tariffs applicable to the Dorad Power Plant throughout the period of its operation, and in October 2013, Dorad received a revised tariff approval pursuant to the Tamar Agreement.
As noted above, the transmission and distribution lines used by the Dorad Power Plant are managed by the IEC, and the IEC is solely licensed to operate electricity systems (i.e. to oversee and manage the production and transmission of electricity) in Israel.
On December 24, 2018, the Israeli Electricity Authority published its decision to increase the 2019 electricity rate by approximately 3.3%.
On December 23, 2019, the Israeli Electricity Authority published a decision regarding “Annual Electricity Rate Update 2020,” which, among other things, averaged a 7.9% decrease in the production component as of January 1, 2020, and will remain in effect to the end of 2020.
On December 27, 2020, the Israeli Electricity Authority published a decision regarding “2021 Annual Update to the Electricity Rate,” which, among other things, provided for a decrease of approximately 5.7% in the average production component commencing January 1, 2021 and effective throughout 2021.
On January 30, 2022, the Israeli Electricity Authority published a decision regarding “Electricity Rates for Customers of IEC in 2022” which provided for an increase in the average production component of approximately 13.5% from February 1, 2022 that will remain in effect through the end of 2022.
On February 27, 2022, the Israeli Electricity Authority published a hearing regarding “Electricity Rates for Customers of IEC in 2022” which provided for a decrease in the average production component of approximately 3.7% from April 1, 2022 that will remain in effect through the end of 2022.
Consumption Plans and Deviations
In August 2019, the Israeli Electricity Authority published a proposed resolution that is subject to a public hearing concerning an amendment to the standards governing deviations from consumption plans. These standards regulate the accounting mechanism in the event the actual consumer consumption is different than the consumption plan submitted by the electricity manufacturers (such as Dorad), and include a mechanism protecting the manufacturers from random deviations in actual consumption volumes. Based on the Israeli Electricity Authority’s publication, which includes a call for public comments (the hearing process), the Israeli Electricity Authority proposed revoking the protections included in the aforementioned standards, claiming that the manufacturers are misusing the protections and regularly submit plans and forecasts that deviate from the actual expected consumption, and also seeks to impose financial sanctions on the manufacturers, which may be in material amounts upon the occurrence of certain deviation events. On January 27, 2020, the Israeli Electricity Authority issued a resolution amending the standards and imposing financial sanctions in cases of certain extraordinary events that may add up to significant sums. The resolution entered into effect commencing September 1, 2020. Based on Dorad’s financial statements, included elsewhere in this Report, Dorad is preparing to reduce the implications of the resolution and the implementation of the resolution does not have a material effect on the financial results of Dorad.
On November 22, 2020, the IEC filed a third-party notice against Dorad in connection with a class action submitted against the IEC claiming that the IEC was negligent in overseeing the private electricity manufacturers thereby damaging the electricity consumers. The claim against the IEC alleges that the private electricity manufacturers provided false reports in the consumption plans they submitted to the system manager in the IEC, based on the standards set by the Israeli Electricity Authority. On October 31, 2021, a hearing was held on the request to send notices to third parties, but no decision has yet been given on the request. At this point, based on the advice of legal counsel, Dorad cannot estimate the outcome of this legal proceeding.
Permits and Environmental Laws
Dorad is required to obtain and maintain various licenses and permits from local and municipal authorities for its operations.
The Dorad Power Plant is subject to a variety of Israeli environmental laws and regulations, including limitations concerning noise, emissions of pollutants and handling hazardous materials.
Waste-to-Energy (Biogas) Projects
| Installed/ production Capacity | | | Revenue in the year ended December 31, 2020 (in thousands) | Revenue in the year ended December 31, 2021 (in thousands) |
| | | | | |
| 3.8 million Nm3 per year, | Oude-Tonge, the Netherlands | | | |
| 7.5 million Nm3 per year1 | Gelderland, the Netherlands | | | |
| 1. | This plant’s permit enables it to produce approximately 7.5 million Nm3 per year, however the actual production capacity of the plant is approximately 9.5 million Nm3 per year. |
| 2. | This plant was acquired in December 1, 2020, therefore revenues for the period prior to the acquisition are not reflected herein. |
Agreement with Ludan in connection with Netherlands Waste-to-Energy Projects
In July 2016, we, through Ellomay Luxembourg, entered into an agreement, or the Ludan Agreement, with Ludan Energy Overseas B.V., or Ludan Energy (an indirectly wholly-owned subsidiary of Ludan Engineering Company Ltd. (TASE: LUDN), or Ludan) in connection with WtE (specifically Gasification and Bio-Gas (anaerobic digestion)) projects in the Netherlands.
Pursuant to the Ludan Agreement, subject to the fulfillment of certain conditions, we, through Ellomay Luxembourg, were to acquire at least 51% of each project company and Ludan will own the remaining 49%. The Ludan Agreement provided that Ludan Energy, by itself or through its affiliates, will act as the engineering, procurement and construction contractor and as the O&M contractor for the projects, based on specific agreements.
Pursuant to the Ludan Agreement, we acquired 51% of Groen Gas Goor B.V., or Groen Goor, a project company developing an anaerobic digestion plant, with a green gas production capacity of approximately 375 Nm3/h, in Goor, the Netherlands, or the Goor Project in December 2016 and 51% of the Oude Tonge Project in May 2017.
In March 2019, we executed the Ludan Acquisition Agreement with Ludan and several entities affiliated with Ludan, for the acquisition by Ellomay Luxembourg of 49% of the companies that own the Goor Project and the Oude Tonge Project and of the shareholders’ loans provided by Ludan affiliates to such companies. The Ludan Acquisition Agreement also provides for the immediate (and unconditional) termination of the operations and maintenance arrangement of the WtE Plants with Ludan’s affiliates effective as of January 27, 2019. The acquisition was consummated during 2019 and we currently indirectly own 100% of these projects and the Ludan Agreement terminated upon consummation of the transactions contemplated by the Ludan Acquisition Agreement.
Following consummation of the acquisition, we exchanged letters with Ludan and several of its subsidiaries in which Ludan made several immaterial claims for payments regarding the Goor and Oude Tonge WtE Plants, and we and several of our subsidiaries made several immaterial counter claims against Ludan with respect to the same projects, in amounts exceeding Ludan’s claims. During 2020 we and Ludan settled the claims and each party waived all claims against the other party.
The Goor Plant
General
Further to the Ludan Agreement, during 2016 we entered into loan agreements with Ludan whereby we provided approximately €2.1 million to Ludan, or the Ludan Loans, for purposes of the acquisition of the rights in Groen Gas Goor B.V., or Groen Goor, a project company developing an anaerobic digestion plant, with a green gas production capacity of approximately 375 Nm3/h, in Goor, the Netherlands, or the Goor Project and the land on which the Goor Project will be constructed. Ellomay Luxembourg was issued shares representing a 51% interest in Groen Goor. The Groen Goor Loans converted into Ellomay Luxembourg shareholder’s loans to Groen Goor upon the financial closing of the Goor Project, which occurred in December 2016.
Groen Goor EPC and O&M Agreements
During November 2016, Groen Goor entered into an EPC agreement in connection with the Goor Project, or the EPC Agreement, of an anaerobic digestion plant in Goor, the Netherlands, with Ludan. The Goor Project commenced operations in December 2017. The overall capital expenditure in connection with the Goor Project was approximately €10.8 million, including bank financing.
During September 2016, Ellomay Luxembourg entered into a MOU with Ludan, setting forth the agreed material principles and understandings with respect to the Goor Project’s O&M agreement, or the O&M Agreement, which included customary O&M terms.
As noted above, effective January 27, 2019, Ludan’s performance of O&M services for the Goor Project was terminated. The Goor Project is currently operated by Groen Goor, who recruited experienced employees for this purpose and the senior management provide services both to the Goor Project and to the Oude Tonge Project. In addition, following the consummation of the Ludan Acquisition Agreement, we currently indirectly hold 100% of the share capital of Groen Goor. During 2019 we added a centrifuge decanter and a dry silo system for the Goor Project.
In October 2016, Groen Goor executed offtake agreements for selling its produced gas, electricity, green gas certificates and green electricity certificates.
The Oude Tonge Plant
Further to the Ludan Agreement, during April 2017 – June 2017 we, through Ellomay Luxembourg, entered into loan agreements with Groen Gas Oude–Tonge B.V., or Oude Tonge, which was then in the process of developing an anaerobic digestion plant, with a green gas production capacity of approximately 475 Nm3/h, in Oude Tonge, the Netherlands, whereby we provided shareholders loans in the aggregate amount of approximately €1.7 million. Ellomay Luxembourg was issued shares representing a 51% interest in Oude Tonge in April 2017. The Oude Tonge facility commenced operations in June 2018.
Oude Tonge EPC Agreement
The Oude Tonge Project executed an EPC agreement with an affiliate of Ludan, based on terms previously agreed to by us and Ludan. The Oude Tonge Project commenced operations in June 2018. The overall capital expenditure in connection with the Oude Tonge Project were approximately €8.2 million, including bank financing. Ludan initially provided O&M services to the Oude Tonge Project, however, as noted above, effective as of January 27, 2019, Ludan’s performance of O&M services for the Oude Tonge Project was terminated. The Oude Tonge Project is currently operated by Oude Tonge, who recruited experienced employees for this purpose and the senior management provide services both to the Oude Tonge Project and to the Goor Project. In addition, following the consummation of the Ludan Acquisition Agreement, we currently indirectly hold 100% of the share capital of Oude Tonge. During 2019 we added a centrifuge decanter for the Oude Tonge Project.
In May 2017, Oude Tonge executed offtake agreements for selling its produced gas and green gas certificates.
During 2020, we assessed the value in use of two cash generating Biogas plants in the Netherlands in the Biogas segment in light of operating losses suffered by these projects in previous years and lower results than forecasted for 2020. The examination was conducted based on projected cash flows that were discounted at a rate 6%. The examination concluded that the value in use of the plants is higher than the carrying value of the plants and therefore there is no need for a provision for impairment. The assumptions on which the examination was based could be affected by the Company’s inability to meet the budget in certain circumstances including, the prices of feedstock required in order to maintain the optimal mix of feedstock necessary to maximize performance of the plants, by technical malfunctions and by other circumstances that influence the operation of the plants.
The Gelderland Plant
On December 1, 2020, we acquired all issued and outstanding shares of GG Gelderland through our wholly-owned subsidiary, Ellomay Luxembourg. We paid €1.567 million for the shares and the repayment of shareholder loans. An additional shareholder loan of approximately €5.9 million was granted to GG Gelderland by Ellomay Luxembourg on December 1, 2020. The previous owners are entitled to receive an additional amount from the Dutch Government for subsidy payments. This amount is estimated at €0.493 million, but will be determined and paid before June 2021. We have no liability to compensate the previous owners if the Dutch government pays less than the estimated amount. GG Gelderland owns an operating anaerobic digestion plant in Gelderland, the Netherlands, with a permit that enables it to produce approximately 7.5 million Nm3 per year. The actual production capacity of the plant is approximately 9.5 million Nm3 per year.
Waste-to-Energy Technologies
The process of energy recovery from non-recyclable waste is often referred to as waste-to-energy or energy-from-waste. The waste-to-energy market includes various treatment processes and technologies used to generate a usable form of energy while reducing the volume of waste, including combustion, gasification, pyrolization, anaerobic digestion and landfill gas recovery. The resulting energy can be in the form of electricity, gas, heating and/or cooling, or conversion of the waste into a fuel for future use. The Ludan Agreement applies to project in which gasification and anaerobic digestion technologies are implemented.
Gasification in the waste-to-energy market is the process of converting organic carbonaceous materials into carbon monoxide, hydrogen and carbon dioxide (CO2) by reacting the material at high temperatures (>700 °C), without combustion, with a controlled amount of oxygen and/or steam. This process produces a gas mixture called synthetic gas or syngas or producer gas and is itself a fuel. The organic materials used in the gasification process are a variety of biomass and waste-derived feedstocks, including wood pellets and chips and waste wood.
Anaerobic digestion is a biological process that produces a gas (also known as biogas) principally composed of methane (CH4) and carbon dioxide (CO2). These gases are produced from organic waste such as livestock manure and food processing waste and from agro-residues. Depending on the type of feedstock used and the system design, biogas is typically 55%-75% pure methane. The biogas is emitted during the digestion process of the substrates by specific combinations of bacteria. As there is a relatively wide range of feedstock mix that can be used in the process, the plants in the Netherlands are designed to allow flexibility that is expected to reduce dependency on certain feedstock mix or the feedstock supplier. The biogas is used to produce green gas, or bio-methane, with properties close to natural gas that is injected into the natural gas grid.
The anaerobic digestion process leaves an organic residue, the digestate. The digestate can be used as a fertilizer and soil improver and the WtE plant is required to find solutions for the proper disposal of the digestate. The ability to dispose of digestate is subject to the relevant regulation in the target countries with respect to the amounts and timing of disposal of digestate as a fertilizer in such country. In the event restrictions and regulation does not permit disposal in a certain country, the WtE plant is required to dispose of the digestate in more distant locations or to store the digestate, which increase the costs of the disposal of digestate.
Benefits of Waste-to-Energy
Waste-to-energy generates clean, reliable energy from a renewable fuel source, thus expected to reduce dependency on “traditional” energy production methods, such as fossil fuels, oil and other similar raw materials that are less friendly to the environment. The use of waste assists in the on-going management of waste in a manner that is more environmentally-friendly than other waste management solutions, such as landfilling. We believe that by processing waste in waste-to-energy facilities, greenhouse gas emissions and the risk of contamination of ground water will be reduced.
Sources and Availability of Raw Materials for the Operations of the WtE Plants
As noted above, the anaerobic digestion process requires continuous input of raw materials such as: manure, glycerin, mix grain and corn, all of which are not freely available (as is the case with wind, solar and hydro energies).
The success of a WtE plant depends on its ability to procure and maintain sufficient levels of the waste applicable and suitable to the WtE technology the plant uses, in order to meet a certain of range of energy (gas, electricity or heat) production levels. Both Groen Goor and Oude Tonge initially executed long term feedstock agreements with feedstock suppliers. These agreements were terminated due to disagreements with the suppliers. In order to ensure continuous supply of raw materials, both in terms of the quantity and the quality and composition of the raw materials, the WtE Plants started working with a large number of waste suppliers, such as farmers, food manufacturers and other specialized waste suppliers in order to continuously monitor the proposed sales and try to locate the most efficient and beneficial offers.
The Netherlands Waste-to-Energy Market and Regulation
In June 2021 the EU established the ‘European Climate Law’, in which the previously adopted CO2 reduction goals are made legally binding. The European Climate Law includes the obligation for Europe’s economy and society to become climate-neutral by 2050 and also provides the intermediate target for a 55% cut in greenhouse gas emissions in 2030 compared to 1990 levels. In order to become climate-neutral in 2050, the EU has furthermore set out intermediate targets for 2030, including a production of 32% of the energy in the EU from renewable sources and a 32.5% improvement in energy efficiency. The target for the production rate of energy from renewable sources for the Netherlands imposed by the EU to be reached by the year 2030 is 27%. In addition, the Dutch government’s goal is to have at least 16% renewable energy by 2023 and a fully sustainable energy supply in 2050.
In close consultation with various stakeholders, the Dutch government defined its CO2 reduction goals initially in the national Energy Agreement (“Energieakkoord”) of September 2013. As a follow-up to the Energy Agreement and as an elaboration on the Paris Agreement, which the Dutch government signed in 2015, the national Climate Agreement (“Klimaatakkoord”) was adopted in June 2019. The Climate Agreement contains several stringent national climate goals, to be achieved through numerous national climate measures, but does not eliminate the renewable energy goals set out in the Energy Agreement. Due to the abovementioned European Climate Law, the CO2 emission reduction targets (49% by 2030 and 95% by 2050) in the Climate Agreement are currently outdated.
The aforementioned national climate goals are formally included in the national Climate Act (“Klimaatwet”). The CO2 reduction percentages in the Climate Act is expected to be adapted to the European Climate Law (55% by 2030 and climate-neutral by 2050). The Climate Act contains no direct obligations for citizens and businesses; it provides the national government with a framework to establish further legislation in order to reach the national climate goals. One example of this legislation is the abovementioned Climate Agreement. Furthermore, the Climate Act requires the Dutch government to draft a so-called climate plan (“klimaatplan”). The climate plan is prepared for a period of ten years, is adjusted every five years based on actual insights and contains the most important decisions and measures in the field of climate policy and energy saving management for the next five years. The first climate plan (“Integraal Nationaal Energie en Klimaatplan 2021-2030”, or INEK) was presented on November 1, 2019. The INEK mainly refers to the headlines and goals set in the aforementioned national Agreements as well as the Climate Act. It also provides an overview of the current and upcoming Dutch legislation in the field of climate policy.
In order to have a fully sustainable energy supply in 2050 (“circulaire economie”), the Dutch government drafted the Program Circular Energy (“Uitvoeringsprogramma circulaire energie”). This program is a policy document, but it provides information with respect to the type of measures that the Dutch government desires to implement in the upcoming years, including producing less CO2 and waste. Initially, the program focused on voluntary measures carried out by the market, but since the update in October 2021, the focus shifted to a use of levies and regulation, including standards. The update was published by the previous government and therefore the program contains no concrete legislative proposals.
On December 15, 2021, the newly elected Dutch government presented the coalition agreement (“Coalitieakkoord”). Pursuant to the agreement, the government is aiming for a CO2 reduction of 70% by 2035 and of 80% by 2040, compared to 1990 levels. Furthermore, the Dutch government mentions investments in research and innovation of climate neutral technology and emphasizes the importance of a sustainable energy supply.
Energy saving/supply
The Netherlands waste treatment is subject to strict regulatory obligations, requiring that approximately 10% of the market be processed. As a result, facilities that produce waste (such as farms) are expected to seek more appropriate solutions for waste management. As part of the national Climate Agreement, the Dutch government has intensified the enforcement of the legal obligation (set forth in the Dutch Environmental Protection Act (“Wet milieubeheer”) and the underlying Dutch Activity Decree (“Activiteitenbesluit”)) for facilities to take energy saving measures with a payback period of five years in case they use 50,000 kWh of electricity or 25,000 m³ of natural gas (or an equivalent) or more per year. In order to support this effort, the Dutch government has drafted and updated in April 2020 a so called ‘recognized measures’ list, intended to simplify compliance with the energy saving obligation. This list is available as annex 10 to the Dutch Activity Regulation (“Activiteitenregeling”). To further improve that compliance and to be able to monitor this, the Dutch Activity Decree (“Activiteitenbesluit”) also contains a duty of information. In practice, this entails that a facility is obligated to hand over every four years a report to the Dutch government, specifically to the Dutch Enterprise Agency (“RVO”), with a detailed overview of all the energy-saving measures taken on site. This information duty does not apply under certain circumstances, among others in case the environmental permit of a facility already stipulates certain energy saving obligations when it has an audit obligation under the European Energy Efficiency Directive (2012/27/EU; “EED”) or that facility participates in the Long-Term Agreements on energy efficiency with the Dutch government.
On January 1, 2022, the amended Chapter 9.7 of the Dutch Environmental Protection Act entered into force (along with the underlying amended Dutch Energy Transport Decree (“Besluit energie vervoer”) and Dutch Energy Transport Regulation (“Regeling energie Vervoer”)). These amendments are part of the implementation of the national Climate Agreement and the RED II Directive. In July 2021 the European Commission proposed an amendment of the RED II Directive, as part of the package to deliver on the European Green Deal. In short, the regulation in Chapter 9.7 of the Act holds the obligation of a fuel supplier to meet a certain reduction of non-sustainable fuels, by for example compensating their oil supply with sustainable biofuels (or electricity produced from renewable sources).
To accelerate the energy transition (from fossil to sustainable energy) in the Netherlands, the Dutch Electricity Act (“Elektriciteitswet”) obliges network operators to provide priority to facilities that produce renewable energy in the connection to the electricity grid. This Act also sets rules and requirements regarding the connection point’s allocation, the method of connection and the distribution of ‘connection costs’ between network operator and the facility’s operator. Due to a considerable growth of renewable energy developments (e.g., the rise of wind and solar power projects onshore), congestion on the electricity grid is becoming more and more an issue in several parts of the Netherlands, in particular in less densely populated areas with a less robust electricity grid. On January 1, 2021, the revised version of the Dutch investment plan and quality of electricity and gas Decree (“Besluit investeringsplan en kwaliteit elektriciteit en gas”) entered into force. This Decree determines among others that the reserve capacity of the high-voltage grid will be dedicated to energy generated by renewable energy sources. The Dutch government is preparing the Energy Act (“Energiewet”), which is supposed to substitute the Dutch Electricity Act and the Dutch Gas Act (“Gaswet”), offering a modern and updated regulatory framework that supports and stimulates the energy transition in the Netherlands and contributes to the goal of a clean energy supply that is safe, reliable, affordable and holds into account spatial planning. The Energy Act will retain the current ordering of the gas and electricity market, but at the same time contains adjustments to support the transition to a climate neutral energy supply. It implements the European ‘Clean Energy Package’ (the latest update (2019) in the European energy policy framework) as well and further elaborates the Climate Agreement. The consultation period for the Energy Act, during which the public could provide comments on the draft version, ended on February 11, 2021. In November 2021, the Dutch government adjusted the Energy Act based on those comments. This means that the legislative process in the Dutch Parliament can begin.
Subsidies
The current subsidy scheme for renewable energy in the Netherlands is called SDE++ (“Stimulering Duurzame Energieproductie en Klimaattransitie” or Stimulating Renewable Energy Production and Climate Transition). The SDE++ program stimulates the further rollout of renewable energy and focuses on stimulating CO2 emissions reducing techniques, by compensating the unprofitable top margin of these techniques. The SDE++ provides for various categories of biomass technologies under which subsidy can be requested, for example heat generation and gas extraction from biomass. Under the SDE++ subsidy program, subsidies are granted on the basis of the quantity of renewable energy that has been produced or prevented CO2 emissions. The subsidy is equal to the difference between the cost price of reduction of CO2 emissions or renewable energy, and the profits that have/will be made (‘unprofitable top margin’). Subsidy applications under the SDE++ program are handled on the basis of increasing maximum subsidy need per phase. Consequently, projects with a lower subsidy need shall be given priority when granting subsidies. The subsidy is granted for a period of 12 to 15 years. In most cases SDE++ allows ‘banking’. This means that in case less sustainable energy is produced than predicted, one can make up for this difference in the following years (forward banking). When, on the other hand, the production exceeds the subsidized annual production, one can counterbalance this in the following years (backward banking), though with a maximum of 25% of the subsidized annual energy production, except for the wind category.
The SDE++ program is determined annually, with a budget of €5 billion in 2021. The round of application for the SDE++ in 2021 was from October 5 until November 11. The total requested amount of subsidy was €12 billion and therefore significantly exceeded the available budget. The majority of the budget has been requested for PV projects (€2.2 billion) and for the capture and storage of CO2 (€6.1 billion). The applications are currently being assessed and the final results of the SDE++ 2021 are expected in the spring of 2022.
The SDE ++ program will continue in 2022. The budget will be increased by €3 billion, with the aim of contributing to sustainability with multiple technologies. Furthermore, the Minister of Climate and Energy announced some modifications in the subsidy allocation system for 2023, in order to stimulate certain techniques that are currently insufficiently addressed. The intention is to reserve a budget per specific field, and only when the budget within the relevant field is not fully used (because there are few applications), the remaining budget will transfer to another field. These fields are expected to be: (a) production of renewable electricity, (b) low-temperature heat, (c) high-temperature heat, (d) CO2 capture, storage or use and (e) molecules (including green gas, advanced renewable fuels and hydrogen production). The impact and exact details of this renewed system are currently investigated and are yet to be published.
In the abovementioned coalition agreement of December 15, 2021, the Dutch government announced the future introduction of a new climate and transition fund of €35 billion for the upcoming ten years, in addition to the SDE++ program. The fund is intended to stimulate, amongst others, the construction of necessary energy-infrastructure (electricity, heat, hydrogen an CO2) and to implement a ‘green industrial policy’.
Taxes
In January 2021, the Industry CO2 Tax (“Wet CO2-heffing industrie”) entered into force. The rationale behind this tax is that the big polluters, in general the larger industrial facilities such as industry falling under the European Emissions Trading System (“EU ETS”) and waste incineration plants, have to pay their fair share in reducing CO2 emissions in the Netherlands. Furthermore, the Industry CO2 Tax aims at ensuring that the reduction target for industry as agreed in the Climate Agreement is achieved, while the level playing field with neighboring countries is affected as little as possible. This tax is connected with the EU ETS system as provided for in the European Directive 2003/87/EC; if emission prices within that system rice, the Industry CO2 Tax falls and vice versa. Facilities are granted an exemption on part of the CO2 emissions, on which they do not have to pay any tax (dispensation rights). The exemption is determined by comparing the facility’s CO2 emissions with the most efficient facilities in the same industry in Europe. The more efficiently the facility produces, the less Industry CO2 Tax it pays on balance, because that tax is levied on the emitted CO2 that is in excess of the dispensation rights. The levy will increase in the coming years to encourage facilities to produce more efficiently, from €30 per ton CO2 in 2021 up to €125 in 2030. At the same time, the dispensation rights will be decreasing throughout the years.
Dutch tax laws provide for an Energy Investment Allowance (“EIA”), a tax advantage for companies in the Netherlands that invest in energy-efficient technology allowing a deduction of 45.5% (in 2022) of the investment costs from the corporate income, on top of the usual depreciation. The right to the EIA is declared with the tax return, provided the investment is timely reported to the Dutch Enterprise Agency. The net EIA benefit is about 11% of the investment costs. The EIA can be claimed for all assets included in the annual Energy List (as published by the Dutch Enterprise Agency). The Energy List 2022 in Dutch was published in December 2021. The EIA can also be claimed for customized investments that result in substantial energy savings, as far as these investments meet the saving standards of the EIA. The EIA budget has been relatively stable over the last few years (€147 million in 2019 and 2020, and €149 million in 2021 and 2022). The coalition agreement of 15 December 2022 mentions an increasement of the EIA budget for the upcoming years. In the Dutch Energy Agreement it has been agreed that the EIA program will primarily be focused on energy-efficiency investments. A renewable energy project that is eligible for an SDE++ subsidy is not eligible for the EIA tax advantage (the latter only relates to new projects and projects that have already obtained rights to tax advantages). The EIA program has been extended until January 2024.
Permits
A permit under the Dutch Environmental Permitting Act (“Wet algemene bepalingen omgevingsrecht”) is required to operate a waste treatment facility in the Netherlands. In addition to this permit, other permits, such as a permit pursuant to the Dutch Water Act (“Waterwet”) and under local Ordinances (“Algemene Plaatselijke Verordening”), could be required too. The need for these permits depends on the (physical) scale of the waste treatment facility and its impact on the nearby environment. A permit is issued without a time limit. However, changing circumstances (new operational activities on-site or new developments nearby) may require the permit to be revised. To ensure compliance, the authorities may withdraw a permit in case of significant violations of attached restrictions and/or applicable environmental regulations.
Furthermore, the operation of a waste treatment facility must be in line with the designated use in the applicable zoning plan. In case the facility is not in line with the zoning plan, either the zoning plan has to be adapted or a permit has to be obtained under the Dutch Environmental Permitting Act (“Wet algemene bepalingen omgevingsrecht”), allowing deviation from the applicable designated use. New zoning plans may amend/delete the designated use that allows an existing facility. However, in that case it is obligatory under the Dutch Spatial Planning Act (“Wet ruimtelijke ordening”) to include transitory rules that allow continuation (but not expansion) of existing operations.
The foregoing will be continued under the planned Dutch Environment Law Act (“Omgevingswet”), which will replace (at least) fifteen existing laws on environment and spatial planning, including the Dutch Environmental Permitting Act (“Wet algemene bepalingen omgevingsrecht”), the Dutch Water Act (“Waterwet”) and the Dutch Spatial Planning Act (“Wet ruimtelijke ordening”). The Dutch Environment Law Act and the implementing legislation are both approved by the Dutch Parliament and the Dutch Senate and is scheduled to become effective January 1, 2023. The Act will not make any material changes in respect to the current Acts. Moreover, permit applications that have been submitted before the Dutch Environment Law Act enters into force, will be assessed in accordance with the former applicable Acts.
For the operation of a waste treatment facility in the Netherlands, a permit under the Dutch Nature Protection Act (“Wet natuurbescherming”) is required as well, as far as the facility may negatively affect designated Natura 2000-areas (“Natura 2000-gebieden”), by among others causing nitrogen to be deposited thereon. The Dutch Nature Protection Act will also be integrated in the Dutch Environment Law Act. Nonetheless, on July 1, 2021, the Dutch Nitrogen and Nature Improvement Act (“Wet stikstofreductie en natuurverbetering”) entered into force. This Act offers a more structural solution in regard to the nitrogen problems which the Netherlands endures since the highest Dutch administrative court in May 2019 revoked the so called ‘Integrated Approach to Nitrogen’ (“Programma Aanpak Stikstof”). This approach, which provided exemptions to the permit obligation and entailed the idea that through nature restoration measures and source-directed measures, a general autonomous reduction of nitrogen depositions/emissions could be created (only) in favor of (more) economic developments, proved to be invalid. The Dutch Nitrogen and Nature Improvement Act provide that the Dutch government will determine a Program for Nitrogen Reduction. Publication of this program is expected in 2022. The main goal of this Program is to determine which measures are necessary to achieve the reduction of nitrogen deposition on nitrogen-sensitive Natura 2000-areas (40% in 2025, 50% in 2030 and 74% in 2035). Furthermore, the Act obliges the Dutch government to legalize nitrogen reports and calculations, based on the abovementioned Integrated Approach to Nitrogen, via a ‘legalization program’. On November 10, 2021, a design of the legalization program has been made public, but the finalized version of this program has not been published yet. In the meantime in general it is more difficult to obtain a permit under the Dutch Nature Protection Act, as well for the operation of a (modified/new) waste treatment facility.
Pumped Storage Project in the Manara Cliff in Israel
The current ownership structure of Ellomay PS is as follows: (i) 75% is owned by Ellomay Water Plants Holdings (2014) Ltd., or Ellomay Water, which we wholly-own, and (ii) 25% is owned by Sheva Mizrakot Ltd., an Israeli private company, or Sheva Mizrakot. 66.667% of Sheva Mizrakot is owned by Ampa Investments Ltd., or Ampa, and the remaining 33.333% are owned by Ellomay Water. Accordingly, we hold (through our direct holdings in Ellomay PS and through our holdings in Sheva Mizrakot) 83.333% of the Manara PSP, and the remaining 16.667% of the Manara PSP are held by Ampa through its holdings in Sheva Mizrakot.
The Manara PSP is projected to cost approximately NIS 1.585 billion (excluding future indexation) (approximately €450 million based on the exchange rate as at December 31, 2021). This amount includes a reevaluation of the project CAPEX according to actual basket of indices applicable to such CAPEX for the period since financial close and until October 2021 when an updated financial model was submitted. On March 7, 2121, the Manara PSP received the approval of the Israeli Electricity Authority that the conditions for Financial Close under the applicable regulations were met. In April 2021, a notice to commence the construction works (NTC) was issued to Electra Infrastructures Ltd., the EPC contractor of the Manara PSP, and construction of the Manara PSP commenced. The construction period of the Manara PSP is expected to be 62.5 months from such date.
Manara PSP Project Finance
On February 11, 2021, we announced the financial closing of the project finance of the Manara PSP, or the Manara PSP Project Finance. The Manara PSP Project Finance is provided by a consortium of Israeli banks and institutional investors, arranged and led by Mizrahi-Tefahot Bank Ltd. The Manara PSP Project Finance is in the aggregate amount of NIS 1.22 billion (excluding future indexation) (approximately €350 million). This amount includes reevaluation to actual basket of indices similar to the CAPEX as described above.
For more information see “Item 5.B: Operating and Financial Review and Prospects – Liquidity and Capital Resources” and Note 6 to our annual financial statements included elsewhere in this Report.
Manara PSP EPC Agreement
On February 14, 2021, we also announced the execution of the EPC agreement for the construction of the Manara PSP, or the Manara PSP EPC Agreement, under a “turnkey” contract with Electra Infrastructure Ltd., or Electra Infrastructure, one of Israel’s largest construction companies. The aggregate consideration payable to Electra Infrastructure under the Manara PSP EPC Agreement is expected to be approximately NIS 1.17 billion (excluding future indexation) (approximately €332 million based on the exchange rate as at December 31, 2021). This amount includes reevaluation to the actual change in the index affecting the EPC contract price until October 2021. In accordance with the Manara PSP EPC Agreement Voith Hydro, the world’s leading manufacturer of hydroelectric turbines, or Voith Hydro, was nominated as the subcontractor that will be providing the electro-mechanical equipment to the Manara PSP.
Manara PSP O&M Agreement
In parallel to the execution of the Manara PSP EPC Agreement, Ellomay PS also executed an O&M agreement, or the Manara PSP O&M Agreement, with Mekorot Israel National Water Co., the Israeli national water company, or Mekorot (which is fully owned by the Israeli Government), Voith Hydro and Verbund Hydro, one of the largest hydroelectric companies in Europe with extensive expertise in the operation of hydroelectric power plants, or, together, the Manara PSP O&M Contractors. The Manara PSP O&M Agreement provides that the Manara PSP O&M Contractors will be involved in the construction process through a mobilization period and that O&M services will be provided for a twenty year period, during which Mekorot, Voith Hydro and Verbund will provide O&M services for the initial three years, with Mekorot providing O&M services exclusively for the remaining 17 years.
Background
The development of the Manara PSP began in 2007, and the Manara PSP, which was under different ownership at the time, was granted a conditional license in 2009 for a capacity of 200 MW, or the First Conditional License. The First Conditional License expired in 2011 and thereafter the previous owner applied for a new conditional license, but before the application was approved, the Israeli Electricity Authority rendered a decision, in 2012, prohibiting cross ownership in pumped storage projects (at the time, the then-owner of Manara PSP was also a shareholder in the Gilboa PSP), thus forcing the sale of Manara PSP to a new owner.
In January 2014, we entered into an agreement with Ortam Sahar Engineering Ltd., or Ortam, an Israeli publicly traded company, pursuant to which we acquired (a) Ortam’s holdings (24.75%) in Agira Sheuva Electra, L.P., or the Partnership, an Israeli limited partnership that had been promoting the Manara PSP; and (b) Ortam’s holdings: (i) in Chashgal Elyon Ltd., or the GP, an Israeli private company, which is the general partner in the Partnership (holding 25% in the Partnership), and (ii) in the engineering, procurement and construction contractor of the aforementioned project (50%). On May 20, 2014 our indirectly wholly-owned subsidiary, Ellomay Manara (2014) Ltd., or Ellomay Manara, entered into an agreement, or the Electra Agreement, with Electra Ltd., or Electra, an Israeli publicly traded company. Pursuant to the Electra Agreement, Ellomay Manara acquired Electra's holdings (24.75%) in the Partnership, as well as Electra’s holdings in the GP (25%).
In addition, we, Ellomay Manara and Electra agreed that: (i) on the closing date of the transactions contemplated under the Electra Agreement, Ellomay Manara shall transfer to subsidiaries of Electra all of its then holdings in the engineering, procurement and construction contractor of the aforementioned project, or the EPC, (50%), which will be acquired at closing by us from another partner in the Partnership pursuant to a conditional agreement we entered into, resulting in Electra’s subsidiaries holding 100% of the EPC; and (ii) each of Electra (through its subsidiaries) and us (together with Ellomay Manara) was granted an eighteen-month put option and call option, respectively, with respect to the entire holdings in the EPC.
In addition to the aforementioned agreements, on January 19, 2014 we entered into an agreement with Galilee Development Cooperative Ltd., an Israeli cooperative, or the Cooperative, pursuant to which, subject to the fulfillment of certain conditions, we shall acquire the Cooperative’s holdings (24.75%) in the Partnership as well as its holdings in: (i) the GP (25%), and (ii) the EPC (50%).
In November 2014, Ellomay Manara consummated the acquisition of 75% of the limited partnership rights in the Partnership, as well as 75% of the holdings in the GP, from Electra, Ortam and the Cooperative. The remaining 25% of the holdings in the Partnership and in the GP are held by Sheva Mizrakot. We and Ellomay Manara did not pay any consideration upon the acquisition. On the same date, Ellomay Manara acquired Ortam’s holdings (50%) in the EPC and, as set forth above, immediately transferred such holdings to a subsidiary of Electra, which, following such transfer now holds 100% of the EPC. According to the various agreements executed in connection with the Manara PSP, we and Ellomay Manara are liable, jointly and severally, to all the monetary obligations set forth in said agreements.
In December 2018, we executed a settlement agreement, or the A.R.Z. Settlement Agreement, with A.R.Z. Electricity Ltd., or A.R.Z Electricity, an Israeli private company that at the time held 33.33% of Sheva Mizrakot Ltd. The A.R.Z. Settlement Agreement resolves a claim made by A.R.Z. Electricity and Mr. Raanan Aloni against us and our affiliates, in connection with the Manara PSP, and other disputes between such parties concerning the Manara PSP. In connection with the Manara PSP Project Finance and based on the A.R.Z. Settlement Agreement, A.R.Z. Electricity was required to provide its indirect share of equity investment and financing to the Manara PSP. Due to the failure to provide the required funds, Ellomay Water Plants Holdings (2014) Ltd., the Company’s wholly-owned subsidiary that holds 75% of Ellomay PS, overtook A.R.Z. Electricity’s holdings in Sheva Mizrakot (33%) and, as a result, the Company’s indirect holdings in the Manara PSP increased from 75% to 83.333%.
As of December 31, 2021, we paid an amount of approximately NIS 8.7 million (approximately €2.5 million) on account of the consideration upon the acquisition and will be required to pay certain parties additional amounts in certain installments, which in the aggregate are not expected to exceed an amount of NIS 20.6 million (approximately €5.9 million).
Land Assessment from the Israel Land Authority
In December 2020, Ellomay PS received a land assessment from the ILA in connection with the Manara PSP and paid approximately NIS 66.7 million including VAT (approximately €18.9 million) in consideration for the ILA’s consent to the sublease of the land on which the Manara PSP is currently planned to be constructed. The amount paid includes an amount of approximately NIS 9.9 million (approximately €2.8 million), excluding VAT, for royalties related to excess ground removal to the ILA.
Tariff Approval
On December 31, 2020, Ellomay PS received the tariff approval for the Manara PSP from the Israeli Electricity Authority that regulates the tariffs and formulas for purchasing energy from a pumped storage manufacturer connected to the transmission network for a period of 20 years beginning on the date of receipt of the permanent production license. The tariff approval became effective following the financial closing of the Manara PSP in February 2021.
On February 11, 2021, the Manara PSP complied with the conditions precedent under the Manara PSP Conditional License following the financial closing of the Manara PSP Project Finance and the execution of the Manara PSP EPC and O&M Agreements. For more information see “Item 4.A: History and Development of Ellomay; Recent Developments.” The construction process of the Manara PSP is expected to be highly complex and includes various engineering and other challenges, includes planning and conducting of a comprehensive investigation to characterize the variety of soils and rocks at the construction sites. In accordance with the infrastructure characteristics and the seismic risks that exist on site, stability calculations need to be performed on the basis of which instructions are given for the planning and execution of the reservoirs
Pumped Storage Power Plants
Pumped storage is a form of renewable energy based on hydropower. A pumped storage power plant is capable of generating electric energy on demand, and is one of the most veteran and widely applied technologies used worldwide for energy storage. The technology has been in use for more than 100 years, providing over 100,000 MW around the world.
The technology allows storing available energy for later use. Pumped storage plants store electricity during low demand periods and release it back to the grid during peak demand periods, thereby utilizing the gap in production costs in order to stabilize the grid’s voltage and regulation.
The plant is a hydro-storage system comprised of upper and lower water reservoirs, connected by an underground water pressure pipe: during low demand – pumping water from the lower reservoir for energy storage, and during peak demand – releasing water from the upper reservoir for energy production. The technology utilizes excess electricity production capacity during low demand hours in order to increase supply during peak demand hours, thus providing available reserves to be used by the grid dispatcher during peak and low demand periods.
Pumped storage also allows optimal grid stability functionality by providing a combination of low latency, high power and high energy response (~90 sec).
The need for electricity storage solutions in the Israeli electricity market
The purpose of pumped storage systems is to stabilize the grid’s voltage and to create optimization in the management of the electricity grid. The demand for electricity, in the Israeli market as well as in other electricity markets, is influenced by many factors, including the weather, time of day and day of the week, and the rise in the standard of living in Israel.
In order to meet the growing electricity needs in Israel, and being able to provide electricity to consumers, the IEC constantly over-generates energy. The over-generation of energy is the result of using low flexibility energy sources (coal and gas). The demand curve is generally characterized by peak demand, usually in summer afternoons or winter evenings, and low demand during night times. During low demand periods, the majority of energy is produced by base-load plants at relatively cheap production costs, while at peak demand times, more expensive energy sources are added.
In recent years, the use of renewable, volatile energy sources has increased, thus increasing the grid’s volatility and the need for storing energy during low-demand hours as a way to create demand when renewable energy is produced and releasing it during peak-consumer demand hours.
The Manara PSP
Manara Cliff is located in Northern Israel, just south of the city of Kiryat Shmona. According to the construction plans of the Manara PSP, the plant will deploy water reservoirs built on agricultural land. The upper water reservoir will be located near Kibbutz Manara and the lower water reservoir will be based on an existing reservoir near Kiryat Shmona belonging to a local water cooperative.
Ellomay PS entered into land lease option agreements with the site holders, in order to secure land use rights for the duration of the construction phase and the commercial operation of the Manara PSP, and a water supply agreement with the Galil Elyon Water Association, in order to secure water supply for the project for the duration of the commercial operation.
Ellomay PS also holds detailed geological and hydrological surveys, and an environmental impact assessment.
Competition
According to the current applicable regulation, the Manara PSP cannot enter into electricity sale agreements with private customers, and will therefor provide 100% of its available capacity and energy to the System Manager (NOGA, formerly a business unit of IEC that was spun off from IEC according to government decision), pursuant to a power purchase agreement. The System Manager is obligated to purchase availability and energy from any power plant whose commercial operation was approved by the applicable regulation.
Material Effects of Government Regulations on the Manara PSP
The Manara PSP is subject to regulations applicable to energy producers and power plants in general, including the Electricity Market Regulations, and to pumped storage producers in particular. For more information concerning the Israeli electricity market and regulation see “The Israeli Electricity Market; Competition” and “Material Effects of Government Regulations on Dorad’s Operations” under “Dori Energy and the Dorad Power Plant” above.
The Manara PSP was announced by the Israeli Government as a national infrastructure project. National Infrastructure Plan 41A (which updated National Infrastructure Plan 41), which establishes the planning principles for the Manara PSP.
Licenses
The Manara PSP was initially granted a conditional license by the Israeli Electricity Authority for the construction of a pumped storage power plant with a capacity of 340 MW, or the Prior Conditional License. On December 4, 2017, the Israeli Electricity Authority announced the reduction of the capacity stipulated in the Prior Conditional License from 340 MW to 156 MW. The reduced capacity was based on the remaining portion of the quota for pumped storage projects in Israel as determined by the Israeli Government and implemented by the Israeli Electricity Authority, which is currently 800 MW, after deducting the capacity already allocated to two projects that were at the time in more advanced stages than the Manara PSP. On February 26, 2020, Ellomay PS retracted the Prior Conditional License issued to it, which was due to expire on February 28, 2020 because Ellomay PS did not reach financial closing by such date as was required under the milestones included in the Prior Conditional License. On the same date, Ellomay PS filed an application for a new similar conditional license for a pumped storage facility with a capacity of 156 MW.
On June 17, 2020, the Israeli Minister of Energy executed the Manara PSP Conditional License, following the retraction of the previous conditional license, which permits Ellomay PS to construct the Manara PSP. The Manara PSP Conditional License includes several conditions precedent to the entitlement of Ellomay PS to receive an electricity production license. The Manara PSP Conditional License is valid for a period of seventy two (72) months commencing from the date of its approval by the Minister of Energy, subject to compliance by Ellomay PS with the milestones set forth therein and subject to the other provisions set forth therein (including achieving financial closing, the provision of guarantees and the construction of the pumped storage hydro power plant). As noted above, on February 11, 2021, Ellomay PS complied with the project finance milestone under the Manara PSP Conditional License.
The licenses issued by the Israeli Electricity Authority include several milestones, which the license holder has to meet in a timely manner in order to be eligible for a permanent license to produce electricity. In the event the license holder does not meet the milestones within certain timeframes set out under applicable electricity regulations, the Israeli Electricity Authority has the authority to revoke the license.
The Israeli Water Authority granted to Ellomay PS a water plant license, and approved the water rationing needed for the preliminary filling of the reservoirs prior to commencement of commercial operation, and for the continued operation of the power plant. The water plant license was granted to Ellomay PS in August 2015 and was since renewed from time to time.
Tariffs
In November 2009, the Israeli Electricity Authority published the regulatory framework for pumped storage power plants, or the PS Regulatory Framework, which has since been amended a few times. The PS Regulatory Framework establishes the following principles:
| a. | Purchase of availability from a licensed private producer; |
| b. | Payment for availability, start-ups and dynamic benefits; |
| c. | The plant is required to be under the full control of the system manager (currently the IEC); |
| d. | Capital and operational tariff for availability – including exchange rate linkage, indexes and interests; |
| e. | During the first twenty years of its operation, the plant shall be entitled to capital and operational tariff set out in the tariff approval; |
| f. | Bonuses and fines mechanism, based on standard technical operational parameters. |
On December 31, 2020, the Manara PSP received a tariff approval from the Israeli Electricity Authority that regulates the tariffs and formulas for purchasing energy from a pumped storage manufacturer connected to the transmission network for a period of 20 years beginning on the date of receipt of the permanent production license. The tariff approval became effective following the financial closing of the Manara PSP in February 2021.
Material Effects of Government Regulations - General
Investment Company Act of 1940
Regulation under the Investment Company Act governs almost every aspect of a registered investment company’s operations and can be very onerous. The Investment Company Act, among other things, limits an investment company’s capital structure, borrowing practices and transactions between an investment company and its affiliates, and restricts the issuance of traditional options, warrants and incentive compensation arrangements, imposes requirements concerning the composition of an investment company’s board of directors and requires shareholder approval of certain policy changes. In addition, contracts made in violation of the Investment Company Act are void.
An investment company organized outside of the United States is not permitted to register under the Investment Company Act without an order from the SEC permitting it to register and, prior to being permitted to register, it is not permitted to publicly offer or promote its securities in the United States.
We do not believe that our current asset structure results in our being deemed to be an “investment company.” Specifically, we do not believe that our holdings in the PV Plants or the WtE Plants would be considered “investment securities,” as we control the PV Plants (other than the Talasol PV Plant) and the WtE Plants via wholly-owned subsidiaries. In addition, despite minority holder protective rights granted to the minority shareholders of the Talasol PV Plant and the Manara PSP, including several rights which effectively require the unanimous consent of all shareholders, we believe that our interests in the Talasol PV Plant and the Manara PSP do not constitute “investment securities” given, among other things, our majority shareholder and board membership status. The current fair value of our holdings in Dori Energy and other relevant assets do not in our judgment exceed 40% of our aggregate assets, excluding our assets held in cash and cash equivalents. If we were deemed to be an “investment company,” we would not be permitted to register under the Investment Company Act without an order from the SEC permitting us to register because we are incorporated outside of the United States and, prior to being permitted to register, we would not be permitted to publicly offer or promote our securities in the United States. Even if we were permitted to register, it would subject us to additional commitments and regulatory compliance. Investments in cash and cash equivalents or in other assets that are not deemed to be “investment securities” might not be as favorable to us as other investments we might make if we were not potentially subject to regulation under the Investment Company Act. We seek to conduct our operations, including by way of investing our cash and cash equivalents, to the extent possible, so as not to become subject to regulation under the Investment Company Act. In addition, because we are actively engaged in exploring and considering strategic investments and business opportunities, and in fact have entered the Italian and Spanish photovoltaic power plants markets through controlling investments, we do not believe that we are currently engaged in “investment company” activities or business.
Shell Company Status
Following the consummation of sale of our previous wide format printers business in 2008 and until we commenced our renewable energy business in 2010, we ceased conducting any operating activity and substantially all of our assets consisted of cash and cash equivalents. Accordingly, we may have been deemed to be a “shell company,” defined by Rule 12b-2 promulgated under the Securities Exchange Act of 1934 during such period as (1) a company that has no or nominal operations; and (2) either: (i) no or nominal assets; (ii) assets consisting solely of cash and cash equivalents; or (iii) assets consisting of any amount of cash and cash equivalents and nominal other assets.
Our characterization as a former “Shell Company” subjects us to various restrictions and requirements under the U.S. Securities Laws. For example, pursuant to the provisions of Rule 144(i) promulgated under the Securities Exchange Act of 1934, shares issued by us at the time we were deemed to be a “shell company” and thereafter can only be resold pursuant to the general provisions of Rule 144 subject to the additional conditions in Rule 144(i), including that we have filed all reports and other materials required to be filed by Section 13 or 15(d) of the Exchange Act, as applicable, during the twelve month period preceding the use of Rule 144 for resale of such shares. This continuing restriction may limit our ability to, among other things, raise capital via the private placement of our shares.
C. Organizational Structure
Our Spanish PV Plants are held by: (i) Rodríguez I Parque Solar, S.L., (ii) Rodríguez II Parque Solar, S.L., (iii) Seguisolar S.L. and (iv) Ellomay Spain S.L., all wholly-owned by Ellomay Luxembourg. The Talasol PV Plant is held by Talasol Solar S.L., of which 51% is owned by Ellomay Luxembourg Holdings S.àr.l.
Our Israeli PV Plant is held by Ellomay Talmei Yosef Ltd. (formerly Sun Team Talmei Yosef Ltd.), which is wholly-owned by Ellomay Sun Team Ltd. (formerly Sun Team Ltd.), which, in turn, is wholly-owned by Ellomay Holdings Talmei Yosef Ltd. (formerly Sun Team Group Ltd.), which is wholly-owned by us.
We hold the Dori Energy shares through Ellomay Clean Energy Limited Partnership, an Israeli limited partnership whose general partner is Ellomay Clean Energy Ltd., a company incorporated under the laws of the State of Israel and wholly-owned by us.
Our WtE Plants located in the Netherlands are held by: (i) Groen Gas Goor B.V., (ii) Groen Gas Oude–Tonge B.V. and (iii) Groen Gas Gelderland B.V., all wholly-owned by Ellomay Luxembourg.
We hold the rights in connection with the Manara PSP through our wholly-owned subsidiary, Ellomay Water Plants Holdings (2014) Ltd., which indirectly owns 75% of the rights in Ellomay PS and through our 33.333% holdings in Sheva Mizrakot, which owns 25% of Ellomay PS.
D. Property, Plants and Equipment
Our office space of approximately 360 square meters is located in Tel Aviv, Israel. This lease currently expires in February 2025. We sub-lease a small part of our office space to a company controlled by Mr. Shlomo Nehama, at a price per square meter based on the price that we pay under our leases. This sub-lease agreement was approved by our Board of Directors.
Our PV Plants are located in Spain and Israel. Pursuant to the building right agreements executed by our subsidiaries that are PV Principals in connection with the majority of our PV Plants, our subsidiaries own the PV Plants and received the right to maintain the PV Plants on the land on which they are located, or the Lands. The ownership of the Lands under the leasing agreements remains with the relevant owners of the Lands who are the grantors of the building rights under the respective building right agreements. The following table provides information with respect to the Lands and the PV Plants:
| PV Plant | Size of Property | Location | Owners of the PV Plants/Lands |
| | | | |
| “Rinconada II” | 81,103 m² | Municipality of Córdoba, Andalusia, Spain | PV Plant owned by Ellomay Spain S.L. Land held by owners and leased to Ellomay Spain S.L.
|
| “Rodríguez I” | 65,600 m2 | Lorca Municipality, Murcia Region, Spain | PV Plant owned by Rodríguez I Parque Solar, S.L. Lease Agreement executed between the owners and Rodríguez I Parque Solar, S.L.
|
| “Rodríguez II” | 50,300 m2 | Lorca Municipality, Murcia Region, Spain | PV Plant owned by Rodríguez II Parque Solar, S.L. Lease Agreement executed between the owners and Rodríguez II Parque Solar, S.L.
|
| “Fuente Librilla” | 64,000 m2 | Fuente Librilla Municipality, Murcia Region, Spain | PV Plant owned by Seguisolar S.L. Lease Agreement executed between owners and Seguisolar S.L.
|
| “Talasol” | 6,040,000 m2 | Talavan (Cáceres) – Extremadura Region, Spain | Lease Agreements executed with the Talavan Municipality, which owns the land
|
| “Talmei Yosef” | 164,000 m2 | Talmei Yosef, Israel | Lease Agreement executed with the entity that leased the property from the ILA. |
The land on which our WtE Plants are located is owned by the relevant project companies. The land on which the Manara PSP is being constructed is leased from various Israeli cooperatives. Manara PS also entered into a development agreement with the ILA in connection with the land.
For more information concerning the use of the properties in connection with the PV Plants, the WtE Plants and the Manara PSP, see “Item 4.A: History and Development of Ellomay” and “Item 4.B: Business Overview” above.
ITEM 4A: Unresolved Staff Comments
Not Applicable.
ITEM 5: Operating and Financial Review and Prospects
The following discussion and analysis is based on and should be read in conjunction with our consolidated financial statements, including the related notes, and the other financial information included in this Report. The following discussion contains forward-looking statements that reflect our current plans, estimates and beliefs and involve risks and uncertainties. Our actual results may differ materially from those discussed in the forward-looking statements. Factors that could cause or contribute to such differences include those discussed below and elsewhere in this Report. For discussion related to changes in financial condition and the results of operations comparing the years ended December 31, 2021 and 2020, refer to “Item 5. Operating and Financial Review and Prospects” in our Annual Report on Form 20-F for the year ended December 31, 2021, which was filed with the Securities and Exchange Commission on March 31, 2021.
General
We are involved in the production of renewable and clean energy. We own six PV Plants that are operating and connected to their respective national grids as follows: (i) four photovoltaic plants in Spain with an aggregate installed capacity of approximately 7.9 MWp, (ii) 51% of Talasol, which owns a photovoltaic plant with an installed capacity of 300 MW in the municipality of Talaván, Cáceres, Spain that was connected to the Spanish electricity grid in the end of December 2020, and (iii) one photovoltaic plant in Israel with an installed capacity of approximately 9 MWp. In addition, we indirectly own: (i) 9.375% of Dorad, which owns an approximate 860 MWp dual-fuel operated power plant in the vicinity of Ashkelon, Israel, (ii) 83.333% of Ellomay PS, which is promoting the Manara PSP, (iii) Ellomay Solar S.L.U. that is constructing a photovoltaic plant with an installed capacity of 28MW in the municipality of Talaván, Cáceres, Spain, and (iv) Groen Gas Goor B.V., Groen Gas Oude-Tonge B.V. and Groen Gas Gelderland B.V., project companies operating anaerobic digestion plants in the Netherlands, with a green gas production capacity of approximately 3 million, 3.8 million and 9.5 million (with a license to produce 7.5 million) Nm3 per year, respectively. See “Item 4.A: History and Development of Ellomay” and “Item 4.B: Business Overview” for more information.
The Talasol Refinancing
As noted under “Liquidity and Capital Resources” below, in January 2022, Talasol completed a refinancing of its project finance.
Although the Talasol New Financing achieved financial closing in January 2022, as the early repayment of the Talasol Previous Financing was highly probable to be completed, our financial results as of and for the year ended December 31, 2021 were impacted, mainly as follows: (i) the Talasol Previous Financing in the amount of approximately €121 million was presented as current liabilities, (ii) the fair value of the interest rate swap contract associated with the Talasol Previous Financing in the amount of approximately €3.3 million was recorded as a financing expense and presented as a current liability, (iii) the expected payment of dividend to Talasol’s minority shareholders in the amount of approximately €15 million was presented as a current liability, and (iv) we amortized the outstanding balance of expenses that were capitalized to the Talasol Previous Financing in the aggregate amount of approximately €12.2 million. In January, the proceeds on account of the Talasol New Financing were used to repay the outstanding balance of €121 million that was presented as a current liability and the Talasol New Financing was recorded as a long term liability.
A. Operating Results
Segments
Our reportable segments, which form our strategic business units, are as follows: (i) photovoltaic power plants presented per geographical areas (Spain and Israel and, for periods prior to the sale of our Italian PV Portfolio), (ii) 9.375% indirect interest in Dorad, (iii) anaerobic digestion plants (Biogas) in the Netherlands and (iv) pumped storage hydro power plant in Manara, Israel. For more information see Note 22 to our annual financial statements included elsewhere in this Report.
Results of Operations
As noted below, the results of operations included in our financial statements for the year ended December 31, 2020 do not yet include the results of the Talasol PV Plant and of the Gelderland biogas plant. Therefore, our past results are not indicative of our results in the future.
| | | For the year ended December 31, | |
| | | | | | | |
| | | € in thousands (except per share data) | |
| | | | |
| Revenues | | | 44,783 | | | | 9,645 | |
| Operating expenses | | | (17,524 | ) | | | (4,951 | ) |
| Depreciation and amortization expenses | | | | | | | | |
| Gross profit | | | 12,183 | | | | 1,719 | |
| Project development costs | | | (2,508 | ) | | | (3,491 | ) |
| General and administrative expenses | | | (5,661 | ) | | | (4,512 | ) |
| Share of profits of equity accounted investee | | | 117 | | | | 1,525 | |
| Other income, net | | | | | | | | |
| Operating profit (loss) | | | 4,131 | | | | (2,659 | ) |
| Financing income | | | 2,931 | | | | 2,134 | |
| Financing income (expenses) in connection with derivatives, net | | | (841 | ) | | | 1,094 | |
| Financing expenses | | | | | | | | |
| Financing expenses, net | | | (26,884 | ) | | | (3,634 | ) |
| Loss before taxes on income | | | (22,753 | ) | | | (6,293 | ) |
| Tax benefit | | | | | | | | |
| Loss for the year | | | | | | | | |
| Loss attributable to: | | | | | | | | |
| Owners of the Company | | | (15,408 | ) | | | (4,627 | ) |
| Non-controlling interests | | | | | | | | |
| Loss for the year | | | | | | | | |
| Other comprehensive income (loss) items | | | | | | | | |
| that after initial recognition in comprehensive income (loss) were or will be transferred to profit or loss: | | | | | | | | |
| Foreign currency translation differences for foreign operations | | | 12,284 | | | | (482 | ) |
| Effective portion of change in fair value of cash flow hedges | | | (13,429 | ) | | | 2,210 | |
| Net change in fair value of cash flow hedges transferred to profit or loss | | | | | | | | |
| Total other comprehensive income (loss), net of tax | | | | | | | | |
| | | | | | | | | |
| Total other comprehensive income (loss) attributable to: | | | | | | | | |
| Owners of the Company | | | 3,124 | | | | 881 | |
| Non-controlling interests | | | | | | | | |
| Total other comprehensive income (loss) | | | | | | | | |
| | | | | | | | | |
| Total comprehensive loss for the year | | | | | | | | |
| | | | | | | | | |
Total comprehensive loss for the year attributable to: | | | | | | | | |
| Owners of the Company | | | (12,284 | ) | | | (3,746 | ) |
| Non-controlling interests | | | | | | | | |
Total comprehensive loss for the year | | | | | | | | |
| | | | | | | | | |
| Loss per share | | | | | | | | |
| Basic loss per share | | | | | | | | |
| Diluted loss per share | | | | | | | | |
Year Ended December 31, 2021 Compared with Year Ended December 31, 2020
Revenues
Revenues were approximately €44.8 million for the year ended December 31, 2021, up 364% compared to approximately €9.6 million for the year ended December 31, 2020. This increase is mainly attributable to the achievement of PAC (preliminary acceptance certificate) of the Talasol PV Plant on January 27, 2021, upon which we commenced recognition of revenues. The increase is also attributable to the Gelderland biogas plant acquisition in December 2020 and to improved operational efficiency at our biogas plants in the Netherlands.
Revenues by Segments
| | �� | | | | | |
| (Euro in thousands) | | | | | | | | € | | | | |
| | | | | | | | | | | | | | |
| Spanish PV segment | | | 2,587 | | | | 2,577 | | | | 10 | | | | 0.4 | |
| Talasol PV Segment | | | 28,494 | | | | - | | | | 28,494 | | | | 100 | |
| Israeli PV segment | | | 4,255 | | | | 4,089 | | | | 166 | | | | 4.1 | |
| Dorad segment | | | 51,630 | | | | 57,495 | | | | (5,865 | ) | | | (10.2 | ) |
| Netherlands biogas segment | | | 12,686 | | | | 6,002 | | | | 6,684 | | | | 111.4 | |
Talasol PV Segment. Revenues from our Talasol PV segment were approximately €28.5 million for the year ended December 31, 2021, compared to 0 for the year ended December 31, 2020. The increase resulted from the achievement of PAC of the Talasol PV Plant on January 27, 2021, upon which we commenced recognition of revenues.
Spanish PV Segment. Revenues from our Spanish PV segment were approximately €2.6 million for each of the years ended December 31, 2021 and 2020.
Israeli PV Segment. The segment results for our PV Plant located in Israel are presented under the fixed asset model and not under the IFRIC 12 financial asset model as applied in our financial statements. Proceeds for electricity produced by our Israeli PV segment were approximately €4.3 million for the year ended December 31, 2021, compared to approximately €4.1 million for the year ended December 31, 2020. The increase in revenues resulted from slightly increased electricity production.
Dorad Segment. The segment results for Dorad are presented as our share in the results of Dorad in NIS translated into euro and not under the equity method (equity accounted investee) as applied in our financial statements. Our share in the revenues of Dorad was approximately €51.6 million (approximately NIS 197 million) for the year ended December 31, 2021, compared to approximately €57.5 million (approximately NIS 225.7 million) for the year ended December 31, 2020. The decrease in Dorad’s revenues is mainly due to a decrease in tariff and in the electricity sold to Dorad’s customers during the year ended December 31, 2021.
Netherlands Biogas Segment. Revenues from our Netherlands biogas segment were approximately €12.7 million for the year ended December 31, 2021, compared to approximately €6 million for the year ended December 31, 2020. The increase in revenues is mainly due to the acquisition of the Gelderland Biogas Plant in December 2020 and to improved operational efficiency at our other biogas plants in the Netherlands.
Operating Expenses and Depreciation Expenses
Operating expenses were approximately €17.5 million for the year ended December 31, 2021, compared to approximately €5 million for the year ended December 31, 2020. This increase is mainly attributable to the achievement of PAC of the Talasol PV Plant on January 27, 2021, and the Gelderland biogas plant acquisition in December 2020. Depreciation expenses were approximately €15.1 million for the year ended December 31, 2021, compared to approximately €3 million for the year ended December 31, 2020.
Operating Expenses by Segments
| | | | | | | |
| (Euro in thousands) | | | | | | | | | | | | |
| | | | | | | | | | | | | | |
| Spanish PV segment | | | 472 | | | | 463 | | | | 401 | | | | 86.6 | |
| Talasol Segment | | | 6,239 | | | | - | | | | 6,239 | | | | 100 | |
| Israeli PV segment | | | 367 | | | | 379 | | | | (12 | ) | | | (3.2 | ) |
| Dorad segment | | | 39,175 | | | | 44,489 | | | | (5,314 | ) | | | (11.9 | ) |
| Netherlands biogas segment | | | 10,446 | | | | 4,109 | | | | 6,337 | | | | 154.2 | |
Talasol PV Segment. Operating expenses in connection with the Talasol PV segment were approximately €6.2 for the year ended December 31, 2021, compared to 0 for the year ended December 31, 2020. The increase resulted from the achievement of PAC of the Talasol PV Plant on January 27, 2021, upon which we commenced recognition of revenues and operating expenses.
Spanish PV Segment. Operating expenses in connection with our Spanish PV segment were approximately €0.5 million for each of the years ended December 31, 2021 and 2020.
Israeli PV Segment. Operating expenses in connection with our Israeli PV segment were approximately €0.4 million for each of the years ended December 31, 2021 and 2020.
Dorad Segment. The segment results for Dorad are presented as our share in the results of Dorad in NIS translated into euro and not under the equity method (equity accounted investee) as applied in our financial statements. Operating expenses in connection with our Dorad segment were approximately €39.2 million (approximately NIS 149.7 million) for the year ended December 31, 2021, compared to approximately €44.5 million (approximately NIS 174.6 million) for the year ended December 31, 2020. The decrease in Dorad’s operating expenses is mainly due to a decrease in production and in gas prices.
Netherlands Biogas Segment. Operating expenses in connection with our Netherlands biogas segment were approximately €10.4 million for the year ended December 31, 2021, compared to approximately €4.1 million for the year ended December 31, 2020. The increase is mainly attributable to the acquisition of the Gelderland Biogas Plant in December 2020.
Project Development Costs
Project development costs were approximately €2.5 million for the year ended December 31, 2021, compared to approximately €3.5 million for the year ended December 31, 2020. The decrease in project development costs is mainly due to capitalization of expenses in connection with the Manara PSP commencing the fourth quarter of 2020.
General and Administrative Expenses
General and administrative expenses were approximately €5.7 million for the year ended December 31, 2021, compared to approximately €4.5 million for the year ended December 31, 2020. The increase is mostly due to increased D&O liability insurance costs, an increase in the management fee paid pursuant to the new Management Services Agreement (See “Item 6.B: Compensation”), as well as Talasol’s general and administrative expenses following the achievement of PAC of the Talasol PV Plant on January 27, 2021.
Share of Profits of Equity Accounted Investee
Our share of profits of equity accounted investee, after elimination of intercompany transactions, was approximately €0.12 million in the year ended December 31, 2021, compared to approximately €1.5 million in the year ended December 31, 2020. The decrease in our share of profit of equity accounted investee is mainly attributable to the decrease in revenues of Dorad and higher financing expenses incurred by Dorad as a result of the CPI indexation of loans from banks.
Other Income, Net
Other income, net, was 0 in the year ended December 31, 2021, compared to other income, net, of approximately €2.1 million in the year ended December 31, 2020. The other income recorded in 2020 was due to a cancellation of a provision for potential indemnification recorded in this amount during 2019 in connection with the sale of our Italian subsidiaries.
Financing Expenses
| | | For the year ended December 31 | |
| | | | | | | |
| | | | |
| | | | |
| Interest income and consumer price index in Israel in connection to concession project | | | 2,248 | | | | 1,423 | |
| Interest income | | | 276 | | | | 553 | |
| Consumer price index in Israel for loan | | | - | | | | 103 | |
| Swap interest | | | - | | | | 55 | |
| Profit from settlement of derivatives contract | | | 407 | | | | - | |
Change in fair value of derivatives, net
| | | (841 | ) | | | 1,094 | |
Debentures interest and related expenses
| | | (3,220 | ) | | | (2,155 | ) |
Interest and commissions related to projects finance
| | | (5,589 | ) | | | (1775 | ) |
Amortization of capitalized expenses related to projects finance
| | | (12,211 | ) | | | (48 | ) |
| Interest on minority shareholder loan | | | (2,055 | ) | | | (41 | ) |
| Bank charges and other commissions | | | (137 | ) | | | (230 | ) |
| Interest on lease liability | | | (367 | ) | | | (494 | ) |
Loss from exchange rate differences, net | | | | | | | | |
| Total financing income (expenses), net | | | | | | | | |
Financing expenses, net were approximately €26.9 million for the year ended December 31, 2021, compared to approximately €3.6 million for the year ended December 31, 2020. The increase in financing expenses, net, was mainly due to the following:
| • | Financing expenses include expenses in connection with the Talasol PV Plant, previously capitalized to fixed assets, are recognized in profit and loss starting from the PAC, consisting of (i) approximately €2.2 million of interest of bank loans, (ii) approximately €0.9 million of swap related payments, (iii) approximately €0.3 million of expenses in connection with Talasol’s project financing, and (iv) approximately €2.1 million of interest accrued on shareholder loans granted by the minority shareholders of Talasol; |
| • | An amount of approximately €15.5 million recorded as of December 31, 2021 in connection with the expected prepayment of the Talasol Previous Financing. Such expenses include approximately €3.3 million recorded in connection with the termination of an interest rate swap contract and €12.2 million in connection with the amortization of the outstanding balance of expenses that were capitalized to the Talasol Previous Financing; and |
| • | Approximately €0.9 million of expenses in connection with the early repayment of our Series B Debentures. |
Tax Benefit
Tax benefit was approximately €2.5 million in the year ended December 31, 2021, compared to a tax benefit of approximately €0.1 million in the year ended December 31, 2020. The increase in tax benefit was mainly due to the expenses recorded by the Talasol PV Plant in connection with the expected prepayment of the Talasol Previous Financing.
Net Loss
Net loss was approximately €20.3 million in the year ended December 31, 2021, compared to net loss of approximately €6.2 million for the year ended December 31, 2020.
Total Other Comprehensive Income / Loss
Total other comprehensive loss was approximately €4.5 million for the year ended December 31, 2021, compared to total other comprehensive income of approximately €2.3 million in the year ended December 31, 2020. The change was mainly due to changes in fair value of cash flow hedges and from foreign currency translation differences on NIS denominated operations, due to fluctuations in the euro/NIS exchange rates.
Total Comprehensive Loss
Total comprehensive loss was approximately €24.8 million in the year ended December 31, 2021, compared to total comprehensive loss of approximately €3.9 million in the year ended December 31, 2020.
EBITDA
EBITDA was approximately €19.2 million for the year ended December 31, 2021, compared to approximately €0.3 million in the year ended December 31, 2020.
EBITDA is a non-IFRS measure and is defined as earnings before financial expenses, net, taxes, depreciation and amortization. We present this measure to enhance the understanding of our historical financial performance and to enable comparability between periods. While we consider EBITDA to be an important measure of comparative operating performance, EBITDA should not be considered in isolation or as a substitute for net income or other statement of operations or cash flow data prepared in accordance with IFRS as a measure of profitability or liquidity. EBITDA does not take into account our commitments, including capital expenditures and restricted cash and, accordingly, is not necessarily indicative of amounts that may be available for discretionary uses. Not all companies calculate EBITDA in the same manner, and the measure as presented may not be comparable to similarly-titled measures presented by other companies. Our EBITDA may not be indicative of our historic operating results; nor is it meant to be predictive of potential future results.
Reconciliation of Loss to EBITDA
| | | | |
| (Euro in thousands) | | | | | | |
| | | | | | | |
| Loss for the year | | | (20,264 | ) | | | (6,168 | ) |
| Financing expenses (income), net | | | 26,884 | | | | 3,634 | |
| Taxes on income (tax benefit) | | | (2,489 | ) | | | (125 | ) |
| Depreciation and amortization | | | | | | | | |
| EBITDA | | | 19,207 | | | | 316 | |
Impact of Fluctuation of Currencies
We hold cash and cash equivalents, marketable securities and restricted cash in various currencies, mainly in euro and NIS. Our investments in our Spanish PV Plants, in the WtE Plants and in the Talasol PV Plant are denominated in euro and our investments in Dori Energy, in the Talmei Yosef PV Plant and in Manara PSP are denominated in NIS. Our Debentures are denominated in NIS and the interest and principal payments are made in NIS, the financing of the Talmei Yosef PV Plant and the Manara PSP is denominated in NIS and the financing we and Talasol have obtained in connection with our Spanish PV Plants is denominated in euro and bears interest that is based on EURIBOR rate and the Talasol New Financing is denominated in Euro. We therefore are affected by changes in the prevailing euro/NIS exchange rates and previously, prior to the change in our presentation currency were affected by changes in the prevailing euro/U.S. dollar and euro/NIS exchange rates. We entered into various swap transactions to minimize our currency risks. We cannot predict the rate of appreciation/depreciation of the NIS against the euro in the future, and whether these changes will have a material adverse effect on our finances and operations.
The table below sets forth the annual rates of appreciation (or devaluation) of the NIS against the euro.
| | | Year ended December 31, | |
| | | | | | | | | | |
| | | | | | | | | | |
| Appreciation (Devaluation) of the NIS against the euro | | | (10.8 | %) | | | 1.7 | % | | | (9.6 | %) |
The representative NIS/euro exchange rate was NIS 3.878 for one euro on December 31, 2019, NIS 3.944 for one euro on December 31, 2020 and NIS 3.520 for one euro on December 31, 2021. The average exchange rates for converting the NIS to euro during the years ended December 31, 2019, 2020 and 2021 were 3.993, 3.925 and 3.820 for one euro, respectively. The representative exchange rate as of March 1, 2022 was NIS 3.59 for one euro.
Our management determined that our functional currency is the euro and elected the euro as our reporting currency, effective December 31, 2017.
Items included in the financial statements of each of our subsidiaries and investees are measured using their functional currency. When a company’s functional currency differs from its parent’s functional currency that entity represents a foreign operation whose financial statements are translated so that they can be included in the consolidated financial statements as follows:
The assets and liabilities of foreign operations, including adjustments arising on acquisition, are translated at exchange rates at the reporting date. The income and expenses for each period presented in the statement of profit or loss and other comprehensive income (loss) are translated at average exchange rates for the presented periods; however, if exchange rates fluctuate significantly, income and expenses are translated at the exchange rates at the date of the transactions. Foreign currency differences are recognized in equity as a separate component of other comprehensive income (loss) under “foreign currency translation adjustments.”
For information concerning hedging transactions entered, see “Item 11: Quantitative and Qualitative Disclosures About Market Risk.”
Governmental Economic, Fiscal, Monetary or Political Policies or Factors that have Materially Affected or could Materially Affect our Operations or Investments by U.S. Shareholders
Governmental Regulations Affecting the Operations of our PV Plants and other Plants
Our PV Plants and other energy manufacturing plants are subject to comprehensive regulation and we sell the electricity and energy produced for rates determined by governmental legislation and to local governmental entities. Any change in the legislation that affects plants such as our plants could materially adversely affect our results of operations. An economic crisis in Europe and specifically in Spain, the Netherlands and Italy, whether related to the Covid-19 pandemic or otherwise or continued financial distress of the IEC could cause the applicable legislator to reduce benefits provided to operators of PV plants or other privately-owned energy manufacturing plants or to revise the incentive regimes that currently governs the sale of electricity in Spain, the Netherlands, Israel and Italy. For more information see “Item 3.D: Risk Factors - Risks Related to our Renewable Energy Operations,” “Item 3.D: Risk Factors - Risks Related to our Investment in Dori Energy,” “Item 3.D: Risk Factors - Risks Related to our Other Operations”, “Item 4.B: Material Effects of Government Regulations on the PV Plants,” “Item 4.B: Material Effects of Government Regulations on Dorad’s Operations,” “Item 4.B: The Netherlands Waste-to-Energy Market and Regulation” and “Item 4.B: Material Effects of Government Regulations on The Manara PSP.”
Effective Israeli Corporate Tax Rate
Israeli companies are generally subject to company tax on their taxable income. The Israeli corporate tax rate was reduced from 26.5% to 25% as of January 1, 2016. On January 4, 2016 the Knesset plenum passed the Law for the Amendment of the Income Tax Ordinance (Amendment 216) - 2016, by which, inter alia, the corporate tax rate would be reduced by 1.5% to a rate of 25% as from January 1, 2016. Furthermore, on December 22, 2016, the Knesset plenum passed the Economic Efficiency Law (Legislative Amendments for Achieving Budget Objectives in the Years 2017 and 2018), 2016, by which, inter alia, the corporate tax rate would be reduced from 25% to 23% in two steps. The first step was a rate of 24% as from January 2017 and the second step was a rate of 23% as from January 2018.
As of December 31, 2021, Ellomay Capital Ltd. had tax loss carry-forwards in the amount of approximately €13 million. Under current Israeli tax laws, tax loss carry-forwards do not expire and may be offset against future taxable income. The amount of tax loss carry-forwards is subject to tax inspections and final assessments of settlements with the tax authorities.
B. Liquidity and Capital Resources
General
As of March 10, 2022, we held approximately €78.8 million in cash and cash equivalents, approximately €1.9 million in marketable securities, €27.7 million in short term deposits and approximately €15.4 million in restricted short-term and long-term cash.
Although we now hold the aforementioned funds, we may need additional funds if we seek to acquire certain new businesses and operations and if we seek to implement our project development plans, including the plans and projects under development as set forth in “Item 4.B: Business Overview,” and to advance large development projects that require substantial funds. If we are unable to raise funds through public or private financing of debt or equity, we will be unable to fund certain projects, investments or business combinations that could have ultimately improved our financial results. We cannot ensure that additional financing will be available on commercially reasonable terms or at all.
We entered into various project finance agreements in connection with the financing of our PV Plants and the Manara PSP (all as more fully described below).
We may require additional funds in order to advance the projects that are currently under development or that will be developed in the future.
On July 17, 2019, we issued 800,000 ordinary shares to several Israeli qualified investors in a private placement undertaken in accordance with Regulation S. The price per share was NIS 39.20 and we received net proceeds of approximately NIS 31.1 million (approximately €50 million) (net of related expenses such as consultancy fee of approximately NIS 0.2 million).
On February 18, 2020, we issued 715,000 ordinary shares and warrants to purchase an additional 178,750 ordinary shares to several Israeli institutional investors in a private placement undertaken in accordance with Regulation S. The price per share was NIS 70. The warrants are exercisable for a period of one year, with an exercise price of NIS 80 per ordinary share. We received gross proceeds of NIS 50.05 million (approximately €13.5 million based on the Euro /NIS exchange rate at that time).
On July 20, 2020, we issued 450,000 ordinary shares to several Israeli qualified investors in a private placement undertaken in accordance with Regulation S. The price per share was NIS 70.5 (approximately €18 based on the Euro/NIS exchange rate at that time) and we received gross proceeds of approximately NIS 31.7 million (approximately €8.1 million based on the Euro/NIS exchange rate at that time).
On October 26, 2020, we completed a public offering in Israel of additional Series C Debentures and of a new series of options, tradable on the Tel Aviv Stock Exchange, to purchase the Company’s ordinary shares at an exercise price per share of NIS 150 (subject to adjustments upon customary terms), or the Series 1 Options. We issued an aggregate principal amount of NIS 154 million (approximately €38.5 million) of our Series C Debentures and 385,000 Series 1 Options.
On February 23, 2021, we completed public offerings in Israel of additional Series C Debentures and of the newly-issued Series D Convertible Debentures, convertible into our ordinary shares. In addition, during January and February 2021, Israeli institutional investors exercised warrants previously issued to them in a private placement.
On March 18, 2021, we performed an early repayment, in full, of our Series B Debentures and entered into the Manara PSP Project Finance.
On October 25, 2021, we issued additional Series C Debentures in a private offering in Israel to Israeli classified investors in an aggregate principal amount of NIS 120 million (approximately €32.1 million) for an aggregate gross consideration of approximately NIS 121.6 million (approximately €32.5 million).
For more information see “Item 4.A: History and Development of Ellomay” under “Recent Developments,” “Item 4.B: Business Overview” and “Item 10.C: Material Contracts.”
As of December 31, 2021, we had a working capital deficiency of approximately €121.4 million, compared to working capital of approximately €45.3 million as of December 31, 2020. The working capital deficiency as of December 31, 2021 resulted from the classification of the Talasol Previous Financing, in the amount of approximately €121 million, as a short-term liability as well as the related interest rate swap in the amount of approximately €3.3 million, in light of its expected prepayment in connection with the Talasol New Financing. The proceeds of the Talasol New Financing will partially be used to perform a special distribution to Talasol’s shareholders. The amount expected to be distributed to the minority shareholders of Talasol (approximately €15 million) was recorded under Current maturities of long term loans and the amount expected to be distributed to us (approximately €15 million) is not reflected in the cash as of December 31, 2021, thus also increasing the working capital deficiency. The Talasol New Financing was withdrawn, and the Talasol Previous Financing was repaid, during January 2022. Taking into account these developments that occurred after the balance sheet date, in our opinion, our working capital is sufficient for our present requirements.
We currently invest our excess cash in cash and cash equivalents that are highly liquid and in short term deposits and marketable securities.
As of December 31, 2021, we had approximately €41.2 million of cash and cash equivalents, compared with approximately €66.8 million of cash and cash equivalents at December 31, 2020 and approximately €44.5 million of cash and cash equivalents at December 31, 2019. The decrease in cash during the year ended December 31, 2021 was mainly due to our investments in the development and construction of renewable energy facilities, including the Manara PSP and the Ellomay Solar PV Plant and the repayment of our Series B Debentures in March 2021, partially offset by the issuances of our Series C Debentures in February and October 2021 and of our Series D Convertible Debentures in February 2021.
Project Finance
We are currently party to project finance agreements in connection with our Spanish and Israeli PV Plants, our WtE Plants and the Manara PSP. We may in the future enter into additional project finance agreements with respect to one or more of our other current or future plants. The following is a brief description of the project finance agreements that existed during the year ended December 31, 2021. For more information, see Note 11 to our annual financial statements included elsewhere in this Report.
PV Project Finance
Talasol PV Plant Finance
On April 30, 2019, the Talasol PV Plant reached financial closing, or the Talasol PV Plant Finance. The Talasol PV Plant Finance included several facilities in the aggregate amount of approximately €158.5 million.
In December 2021, Talasol entered into the Talasol New Financing in the aggregate amount of €175 million. The Talasol New Financing achieved financial closing in January 2022 and amounts withdrawn were partially used to repay the Talasol Previous Financing. As of December 31, 2021, the total outstanding balance of the Talasol Project Finance in the amount of approximately €121 million was presented under short term liabilities as current maturities.
In January 2022, Talasol reached financial closing of the Talasol New Financing and repaid the Talasol PV Plant Finance. For more information, see “Item 4.A: History and Development of Ellomay; Recent Developments” and Note 11.A to our annual financial statements included elsewhere in this Report.
We own 51% of Talasol and consolidate its results in our financial statements included elsewhere in this Report.
Rinconada II, Rodríguez I, Rodríguez II and Fuente Librilla Project Finance
On March 12, 2019, four of our Spanish indirect wholly-owned subsidiaries, Rodríguez I Parque Solar, S.L.U., Rodríguez II Parque Solar, S.L.U., Seguisolar, S.L.U. and Ellomay Spain, S.L., or, together, the Spanish Subsidiaries, entered into a facility agreement governing the procurement of project financing in the aggregate amount of approximately €18.4 million with Bankinter, S.A., or the Facility Agreement.
The Facility Agreement amount consists of the following tranches:
| a. | in an amount of approximately €3.6 million, granted to Rodríguez I Parque Solar, S.L.U.; |
| b. | in an amount of approximately €6 million, granted to Rodríguez II Parque Solar, S.L.U.; |
| c. | in an amount of approximately €3 million, granted to Seguisolar, S.L.U.; |
| d. | in an amount of approximately €5 million, granted to Ellomay Spain, S.L.; and |
| e. | a revolving credit facility to attend the debt service if needed, for a maximum amount of €0.8 million granted to any of the Spanish Subsidiaries. |
The termination date of the Facility Agreement is December 31, 2037 and an annual interest at the rate of Euribor 6 months plus a margin of 2% (with a zero interest floor) is repaid semi-annually on June 20 and December 20. The principal is repaid on a semi-annual basis based on a pre-determined sculptured repayment schedule.
The Spanish Subsidiaries entered into the swap agreements on March 12, 2019 with respect to approximately €17.6 million (with a decreasing notional principal amount based on the amortization table) until December 2037, replacing the Euribor 6 month rate with a fixed 6 month rate of approximately 1%, resulting in a fixed annual interest rate of approximately 3%.
As of December 31, 2021, the outstanding amounts under the Project Finance were approximately €15.4 million. This aggregate outstanding loan balance is netted with an amount of approximately €0.2 million debt issuance costs to be amortized over the length of the underlying loan.
Talmei Yosef Project Finance
The construction of the Talmei Yosef PV Plant was financed by two bank loans as follows:
| a. | a loan in the aggregate amount of approximately NIS 80 million provided during 2013 through 2014, linked to the Israeli CPI and bearing an average annual interest of approximately 4.65%. This loan is payable (principal and interest) every six months commencing June 30, 2014. The final maturity date is December 31, 2031; and |
| b. | a loan in the aggregate amount of approximately NIS 25 million provided during 2014, linked to the Israeli CPI and bearing an annual interest of approximately 4.52%. This loan is payable (principal and interest) every six months commencing June 30, 2015 through June 30, 2028. |
As of December 31, 2021, the outstanding amount under the Talmei Yosef Project Finance was approximately NIS 62.7 million (approximately €17.8 million). This aggregate outstanding loan balance is netted with an amount of approximately NIS 0.54 million (approximately €0.155 million) debt issuance costs to be amortized over the length of the underlying loan.
The Project Finance documents also require the Talmei Yosef project company to deposit funds for the renewal of equipment (approximately NIS 5.2 million as of December 31, 2021) as well as funds sufficient to cover its debt service required level which consists of six months payment of principal and interest (approximately NIS 1.6 million as of December 31, 2021).
WtE Plants Finance
Groen Goor Project Finance
Groen Goor, Independent Power Plant B.V. (the entity that holds the permits and subsidies in connection with the Goor Project and is wholly-owned by Groen Goor), or GIPP, Ludan, and Ellomay Luxembourg entered into a senior project finance agreement documents, or the Goor Loan Agreement, with Coöperatieve Rabobank U.A., or Rabobank, that includes the following tranches: (i) two loans with principal amounts of €3.51 million (with a fixed interest rate of 3% for the first five years) and €2.09 million (with a fixed interest rate of 2.5% for the first five years), for a period of 12.25 years, repayable in equal monthly installments commencing three months following the connection of the Goor Project’s facility to the grid and (ii) an on-call credit facility of €370,000 with variable interest.
In addition, Ellomay Luxembourg, our wholly-owned subsidiary: (i) provided the following undertakings to Rabobank: (a) that Groen Goor will not make distributions to its shareholders for a period of two years following the execution of the Loan Agreement, (b) that Groen Goor will not make distributions or repurchase its shares so long as the ratio of Groen Goor’s and GIIP’s equity and liabilities to shareholders to their balance sheet minus certain reserves and intangible assets is less than 40%, and (c) that in the event the aforementioned ratio is below 40%, its shareholders will invest the equity required in order to increase this ratio to 40%, pro rata to their holdings in Groen Goor and up to a maximum of €1.2 million, and (ii) provided pledges on its rights in connection with the shareholders loans provided to Groen Goor, which loans shall also be subordinated by Ellomay Luxembourg in the favor of Rabobank. Shortages in liquidity as a result of exceeding the construction budget and/or extension of start-up costs of the Goor Project shall be provided by Ellomay Luxembourg and not financed by Rabobank. In addition, we provided a guarantee to Rabobank for the fulfillment of Ellomay Luxembourg’s undertakings set forth above.
As of December 31, 2021, the outstanding amount under the Groen Goor Project Finance was approximately €4.5 million.
Oude Tonge Project Finance
On May 3, 2017, Oude Tonge, Oude Tonge Holdings B.V. (the entity that holds the permits and subsidies in connection with the Oude Tonge Project and is wholly-owned by Oude Tonge), or OTH, Ludan and Ellomay Luxembourg entered into senior project finance agreement documents, or the Oude Tonge Loan Agreement, with Rabobank. In June 2017, the financial closing occurred with respect to the project finance that includes the following tranches: (i) two loans with principal amounts of €3.15 million and €1.7 million, each with a fixed annual interest rate of 3.1% for the first five years, for a period of 12.25 years, repayable in equal monthly installments commencing three months following the connection of the Oude Tonge Project to the grid and (ii) an on-call credit facility of €100,000 with variable interest.
In connection with the Oude Tonge Loan Agreement, Ellomay Luxembourg, our wholly-owned subsidiary: (i) provided the following undertakings to Rabobank: (a) that Oude Tonge will not make distributions to its shareholders for a period of two years following the execution of the Loan Agreement, (b) that Oude Tonge will not make distributions or repurchase its shares so long as the ratio of Oude Tonge’s and OTH’s equity and liabilities to shareholders to their balance sheet minus certain reserves and intangible assets is less than 40%, (c) that in the event the aforementioned ratio is below 40%, its shareholders will invest the equity required in order to increase this ratio to 40%, pro rata to their holdings in Oude Tonge and up to a maximum of €1 million, and (d) that they will provide the equity required for the completion of the Goor Project and (ii) provided pledges on its rights in connection with the shareholders loans provided to Oude Tonge, which loans shall also be subordinated by Ellomay Luxembourg in the favor of Rabobank. Shortages in liquidity as a result of exceeding the construction budget and/or extension of start-up costs of the Goor Project shall be provided by Ellomay Luxembourg and not financed by Rabobank. In addition, we provided a guarantee to Rabobank for the fulfillment of Ellomay Luxembourg’s undertakings set forth above.
As of December 31, 2021, the outstanding amount under the Oude Tonge Project Finance was approximately €3.5 million.
Groen Gas Gelderland Project Finance
GG Gelderland entered into a senior project finance agreement, or the Gelderland Loan Agreement, with Rabobank, that includes the following tranches: (i) four loans with principal amounts of (a) approximately €2.5 million (with a fixed interest rate of 3.6% for the first five years), (b) €1.2 million (with a fixed interest rate of 4.5% for the first five years), (c) €0.4 million (with a fixed interest rate of 3.55% for the first five years) and (d) approximately €2.8 million (with a fixed interest rate of 4.5% for the first five years), for a period of 12 years (144 monthly payments), repayable in equal monthly installments and (ii) an on-call credit facility of €0.75 million with variable interest. An aggregate amount of approximately €6.9 million was withdrawn in 2015, 2016 and 2018 on account of these loans. On November 30, 2020, GG Gelderland replaced the loan set forth in (i)(a) above which as of that date had an outstanding principal amount of €1.89 million, with another loan from Rabobank with a fixed interest rate of 3.1% per year, repayable in 56 payments monthly, with a repayment of principal in one payment on August 2025. On the same date, the interest for the other loans bearing a fixed interest rate of 4.5% per year for 5 years was reduced to 3.5% per year for the next 5 years, commencing December 2020.
As of December 31, 2021, the outstanding amount under the Gelderland Loan Agreement was approximately €4.8 million.
GG Gelderland entered into a loan agreement in the end of November 2020, with Ontwikkelingsnaatscgappij Oost-Nederland N.V., or Oost, as a benefit created in connection with the Covid-19 pandemic. The loan is with a principal amount of €0.75 million with a fixed interest rate of 3% per year for 3 years. The interest and the principle will be fully repaid in one single amount after 3 years. According to the agreement with Oost, the loan term may be prolonged up to 5 years.
As of December 31, 2021, the outstanding amount under the agreement with Oost was approximately €0.75 million.
Manara PSP Project Finance
The financial closing of the Manara PSP Project Finance occurred in February 2021. The Manara PSP Project Finance is provided by a consortium of Israeli banks and institutional investors, arranged and led by Mizrahi-Tefahot Bank Ltd., in the aggregate amount of NIS 1.22 billion (excluding future indexation. approximately €350 million). This amount includes reevaluation to actual basket of indices, and includes: (i) a senior secured tranche at a fixed rate of interest (with base interest rate equal to the yield to maturity of Israeli treasury bonds with like duration of the loan), linked to the Israeli Consumer Price Index and to be repaid over a period of 19.5 years from the commercial operation date; and (ii) a subordinated secured tranche at a floating rate of interest (Bank of Israel rate plus spread) with a slightly shorter maturity. The weighted average annual interest rate spread of the Manara PSP Project Finance is approximately 3.3% during the construction phase and approximately 2.5% during the commercial operation phase. The Manara PSP Project Finance includes customary terms in connection with early prepayment, acceleration of payments upon certain breaches and limitations on distributions. The Manara PSP Project Finance also includes ancillary facilities such as Standby, VAT, Guarantees and Debt Service Reserve facilities.
Sheva Mizrakot and Ellomay Water undertook to provide aggregate financing of approximately NIS 364 million (approximately €103 million), pro rata to their holdings in the Manara PSP. Following a publication of the Israeli Electricity Authority regarding calculation methods that may reduce coverage ratios during the operations of the Manara PSP, the owners of the Manara PSP agreed to provide the lenders with certain undertakings to inject additional equity to the Manara PSP in certain scenarios, subject to a cap which is currently estimated by the owners of the Manara Project PSP to be approximately NIS 37 million (approximately €10.5 million).
We and Ampa provided certain sponsor support undertakings towards the lenders commensurate with the size and complexity of the project and the length of the construction period, including a standby equity guarantee in the aggregate amount of approximately NIS 12.5 million (approximately €3.5 million), pro rata to our holdings in the Manara PSP. This standby equity guarantee is linked and adjusted in the same manner and timing as the long term facilities, as described above.
In addition, we undertook in connection with the Manara PSP Project Finance to maintain control over the Manara PSP and to provide customary pledges on the assets of and rights in the project. The shareholders of Ellomay PS provided pledges over their shares, the shareholders’ loans and the shareholders’ mezzanine loan.
On January 26, 2022, Ellomay PS completed all the preliminary conditions for first withdrawal of the funding for the Manara PSP and the first withdrawal, in the amount of NIS 75 million occurred on January 31, 2022.
Other Financing Activities
As of December 31, 2021, we had an aggregate principal amount of approximately NIS 429.6 million outstanding Series C Debentures and approximately NIS 62 million outstanding Series D Debentures. On March 18, 2021, we performed an early repayment of all of our Series B Debentures as noted below.
Series B Debentures
On March 14, 2017, we issued approximately NIS 123.2 million (approximately €31.7 million, as of the issuance date) of unsecured non-convertible Series B Debentures due June 30, 2024 through a public offering in Israel. The gross proceeds of the offering were approximately NIS 123.2 million and the net proceeds of the offering, net of related expenses such as consultancy fee and commissions, were approximately NIS 121.4 million (approximately €31.2 million). For more information see Note 12.B to our annual financial statements included elsewhere in this Report.
On February 28, 2021, we announced that we will fully repay our Series B Debentures on March 18, 2021 and on such date our Series B Debentures were repaid in full. Pursuant to the terms of the deed of trust governing the Series B Debentures, the early repayment amount consisted of a principal payment in the amount of approximately NIS 86.3 million (approximately €21.5 million), accrued interest in the amount of approximately NIS 0.7 million (approximately €0.16 million) and a prepayment charge of approximately NIS 3.4 million (approximately €0.86 million), amounting to an aggregate repayment amount of approximately NIS 90.4 million (approximately €22.5 million).
Series C Debentures
On July 25, 2019, we issued approximately NIS 89.1 million (approximately €22.7 million, as of the issuance date) of unsecured non-convertible Series C Debentures due June 30, 2025 through a public offering in Israel. The gross proceeds of the offering were approximately NIS 89.1 million and the net proceeds of the offering, net of related expenses such as consultancy fee and commissions, were approximately NIS 87.6 million (approximately €22.3 million). During 2020 and 2021, we issued additional Series C Debentures in an aggregate principal amount of NIS 374.939 million for aggregate gross proceeds of approximately NIS 388.2 million and aggregate net proceeds of approximately NIS 385.1 million.
The Series C Debentures are traded on the TASE.
The principal amount of Series C Debentures is repayable in five (5) unequal annual installments as follows: on June 30, 2021 10% of the principal was paid, on June 30 of each of the years 2022 and 2023 15% of the principal shall be paid, and on June 30 of each of the years 2024 and 2025 30% of the principal shall be paid. The Series C Debentures bear a fixed interest at the rate of 3.3% per year (that is not linked to the Israeli CPI or otherwise), payable semi-annually on June 30 and December 31 commencing December 31, 2019 through June 30, 2025 (inclusive).
The Series C Deed of Trust includes customary provisions, including (i) a negative pledge such that we may not place a floating charge on all of our assets, subject to certain exceptions and (ii) an obligation to pay additional interest for failure to maintain certain financial covenants, with an increase of 0.25% in the annual interest rate for the period in which we do not meet each standard and up to an increase of 0.5% in the annual interest rate. The Series C Deed of Trust does not restrict our ability to issue any new series of debt instruments, other than in certain specific circumstances, and enables us to expand the Series C Debentures provided that: (i) we are not in default of any of the immediate repayment provisions included in the Series C Deed of Trust or in breach of any of our material obligations to the holders of the Series C Debentures pursuant to the terms of the Series C Deed of Trust, (ii) the expansion will not harm our compliance with the financial covenants included in the distribution undertaking Series C Deed of Trust and (iii) to the extent the Series C Debentures are rated at the time of the expansion, the expansion will not harm the rating of the existing Series C Debentures.
The Series C Deed of Trust includes a number of customary causes for immediate repayment, including a default with certain financial covenants for two consecutive financial quarters, and includes a mechanism for the update of the annual interest rate of the Series C Debentures in the event we do not meet certain financial covenants. The financial covenants are as follows:
| a. | Our balance sheet equity, on a consolidated basis, shall not be less than €50 million for purposes of the immediate repayment provision and shall not be less than €60 for purposes of the update of the annual interest provision; |
| b. | The ratio of (a) the short-term and long-term debt from banks, in addition to the debt to holders of debentures issued by us and any other interest-bearing financial obligations, net of cash and cash equivalents and short-term investments and net of financing of projects, including hedging transactions in connection with such financing, of our subsidiaries, or, together, the Net Financial Debt, to (b) our equity (which we calculate in line with the definition of Balance Sheet Equity in the Series C Deed of Trust), on a consolidated basis, plus the Net Financial Debt, or our CAP, Net, to which we refer herein as the Ratio of Net Financial Debt to CAP, Net, shall not exceed the rate of 67.5% for purposes of the immediate repayment provision and shall not exceed a rate of 60% for purposes of the updated of the annual interest provision; and |
| c. | The ratio of (a) our Net Financial Debt, to (b) our earnings before financial expenses, net, taxes, depreciation and amortization, where the revenues from our operations, such as the Talmei Yosef project, are calculated based on the fixed asset model and not based on the financial asset model (IFRIC 12), and before share-based payments, based on the aggregate four preceding quarters, or our Adjusted EBITDA, to which we refer to herein as the Ratio of Net Financial Debt to Adjusted EBITDA, shall not be higher than 12 for purposes of the immediate repayment provision and shall not be higher than 10 for purposes of the update of the annual interest provision. |
The Series C Deed of Trust further provides that we may make distributions (as such term is defined in the Companies Law, e.g. dividends), to our shareholders, provided that: (a) we will not distribute more than 75% of the distributable profit, (b) we will not distribute dividends based on profit due to revaluation (for the removal of doubt, negative goodwill will not be considered a revaluation profit), (c) we are in compliance with all of our material undertakings to the holders of the Series C Debentures and (d) on the date of distribution and after the distribution no cause for immediate repayment exists. We are also required to maintain the following financial ratios (which are calculated based on the same definitions applicable to the financial covenants set forth above) after the distribution: (i) balance sheet equity not lower than €70 million, (ii) Ratio of Net Financial Debt to CAP, Net not to exceed 60%, and (iii) Ratio of Net Financial Debt to Adjusted EBITDA, shall not be higher than 8, and not to make distributions if we do not meet all of our material obligations to the holders of the Series C Debentures and if on the date of distribution and after the distribution a cause for immediate repayment exists.
As of December 31, 2021, the outstanding amount under the Series C Debentures, net of capitalized expenses, was approximately NIS 428 million (approximately €121.6 million).
For further information concerning the Series C Deed of Trust, see “Item 10.C: Material Contracts” and the Series C Deed of Trust included as Exhibit 4.15 under “Item 19: Exhibits.”
Series D Convertible Debentures
On February 23, 2021, we issued NIS 62 million (approximately €15.6 million, as of the issuance date) of unsecured convertible Series D Convertible Debentures due December 31, 2026 through a public offering in Israel. The gross proceeds of the offering were approximately NIS 62.6 million and the net proceeds of the offering, net of related expenses such as consultancy fee and commissions, were approximately NIS 61.8 million (approximately €15.6 million).
The Series D Convertible Debentures are traded on the TASE.
The principal amount of Series D Convertible Debentures is repayable one installment on December 31, 2026. The Series D Convertible Debentures bear a fixed interest at the rate of 1.2% per year (that is not linked to the Israeli CPI or otherwise), payable semi-annually on June 30 and December 31 commencing June 30, 2021 through December 31, 2026 (inclusive). The Series D Convertible Debentures are convertible into the Company’s ordinary shares, NIS 10.00 par value per share, at a conversion price of NIS 165 (approximately $50.55, as of the issuance date), subject to adjustments upon customary terms.
The Series D Deed of Trust includes customary provisions, including (i) a negative pledge such that we may not place a floating charge on all of our assets, subject to certain exceptions and (ii) an obligation to pay additional interest for failure to maintain certain financial covenants, with an increase of 0.25% in the annual interest rate for the period in which we do not meet each standard and up to an increase of 0.75% in the annual interest rate. The Series D Deed of Trust does not restrict our ability to issue any new series of debt instruments, other than in certain specific circumstances, and enables us to expand the Series D Convertible Debentures up to an aggregate par value of NIS 200 million provided that: (i) we are not in default of any of the immediate repayment provisions included in the Series D Deed of Trust or in breach of any of our material obligations to the holders of the Series D Convertible Debentures pursuant to the terms of the Series D Deed of Trust, (ii) the expansion will not harm our compliance with the financial covenants included in the distribution undertaking Series D Deed of Trust and (iii) to the extent the Series D Convertible Debentures are rated at the time of the expansion, the expansion will not harm the rating of the existing Series D Convertible Debentures.
The Series D Deed of Trust includes a number of customary causes for immediate repayment, including a default with certain financial covenants for the applicable period, and includes a mechanism for the update of the annual interest rate of the Series D Convertible Debentures in the event we do not meet certain financial covenants. The financial covenants are as follows:
| a. | Our Adjusted Balance Sheet Equity (as such term is defined in the Series D Deed of Trust), on a consolidated basis, shall not be less than €70 million for two consecutive quarters for purposes of the immediate repayment provision and shall not be less than €75 for purposes of the updated of the annual interest provision; |
| b. | The ratio of (a) the short-term and long-term debt from banks, in addition to the debt to holders of debentures issued by us and any other interest-bearing financial obligations provided by entities who are in the business of lending money (excluding financing of projects and other exclusions as set forth in the Series D Deed of Trust), net of cash and cash equivalents, short-term investments, deposits, financial funds and negotiable securities, to the extent that these are not restricted (with the exception of a restriction for the purpose of securing any financial debt according to this definition), or, together, the Series D Net Financial Debt, to (b) our Adjusted Balance Sheet Equity, on a consolidated basis, plus the Series D Net Financial Debt, or our CAP, Net, to which we refer herein as the Series D Ratio of Net Financial Debt to CAP, Net, shall not exceed the rate of 68% for three consecutive quarters for purposes of the immediate repayment provision and shall not exceed a rate of 60% for purposes of the updated of the annual interest provision; and |
| c. | The ratio of (a) our Series D Net Financial Debt, to (b) our earnings before financial expenses, net, taxes, depreciation and amortization, where the revenues from our operations, such as the Talmei Yosef project, are calculated based on the fixed asset model and not based on the financial asset model (IFRIC 12), and before share-based payments, when the data of assets or projects whose Commercial Operation Date occurred in the four quarters that preceded the test date will be calculated based on Annual Gross Up (as such terms are defined in the Series D Deed of Trust), based on the aggregate four preceding quarters, or our Series D Adjusted EBITDA, to which we refer to herein as the Ratio of Net Financial Debt to Series D Adjusted EBITDA, shall not be higher than 14 for purposes of the immediate repayment provision and shall not be higher than 12 for purposes of the updated of the annual interest provision. |
The Series D Deed of Trust includes similar conditions to our ability to make distributions (as such term is defined in the Companies Law, e.g. dividends), to our shareholders as are included in the Series C Deed of Trust and set forth above. We are also required to maintain the following financial ratios (which are calculated based on the same definitions applicable to the financial covenants set forth above) after the distribution: (i) Adjusted Balance Sheet Equity not lower than €85 million, (ii) Ratio of Series D Net Financial Debt to CAP, Net not to exceed 60%, and (iii) Ratio of Series D Net Financial Debt to Series D Adjusted EBITDA, shall not be higher than 9, and not to make distributions if we do not meet all of our material obligations to the holders of the Series D Convertible Debentures and if on the date of distribution and after the distribution a cause for immediate repayment exists.
As of December 31, 2021, the outstanding amount under the Series D Convertible Debentures was approximately NIS 56.6 million, net of capitalized expenses, (approximately €16.1 million).
For further information concerning the Series D Deed of Trust, see “Item 10.C: Material Contracts” and the Series D Deed of Trust included as Exhibit 4.17 under “Item 19: Exhibits.”
In connection with the issuance of our Debentures, we undertook to comply with the “hybrid model disclosure requirements” as determined by the Israeli Securities Authority and as described in the prospectuses published in connection with the public offering of our Debentures. This model provides that in the event certain financial “warning signs” exist in our consolidated financial results or statements, and for as long as they exist, we will be subject to certain disclosure obligations towards the holders of our Debentures.
One possible “warning sign” is the existence of a working capital deficiency in the event the board of directors of the company does not determine that the working capital deficiency is not an indication of a liquidity problem. In examining the existence of warning signs as of December 31, 2021, our Board of Directors noted the working capital deficiency as of December 31, 2021. Our board of directors reviewed our financial position, outstanding debt obligations and our existing and anticipated cash resources and uses and determined that the existence of a working capital deficiency as of December 31, 2021 does not indicate a liquidity problem. In making such determination, our board of directors noted the following: (i) the deficiency in working capital resulted from the classification of the Talasol Previous Financing and related payments as short-term liabilities in the aggregate amount of approximately €139.3 million in light of its expected prepayment in connection with the Talasol New Financing, (ii) in January 2022, the Talasol New Financing, in the amount of €175 million, was withdrawn and the Talasol Previous Financing was repaid, therefore the deficiency in working capital was eliminated in early 2022, and (iii) our operating subsidiaries generated a positive cash flow during the year ended December 31, 2021.
Cash flows
The following table summarizes our cash flows for the periods presented:
| | | Year ended December 31, | |
| | | | | | | |
| | | | |
| | | | |
| Net cash provided by (used in) operating activities | | | 15,240 | | | | (5,826 | ) |
| Net cash used in investing activities | | | (107,422 | ) | | | (112,135 | ) |
| Net cash provided by financing activities | | | 54,196 | | | | 141,637 | |
| Effect of exchange rate fluctuations on cash and cash equivalents | | | 12,370 | | | | (1,340 | ) |
| Increase in cash and cash equivalents | | | (25,616 | ) | | | 22,336 | |
| Cash and cash equivalents at the beginning of the year | | | 66,845 | | | | 44,509 | |
| Cash and cash equivalents at the end of the year | | | 41,229 | | | | 66,845 | |
* Convenience translation into USD based on an exchange rate of euro 1 = US$1.132.
Operating activities
In the year ended December 31, 2021, we had net loss of approximately €20.3 million, primarily due to increased financing expenses in connection with the Talasol PV Plant refinancing. Net cash provided by operating activities was approximately €15.2 million.
In the year ended December 31, 2020, we had net loss of approximately €6.2 million, primarily due to the sale of our Italian PV Portfolio in December 2019 and project development costs. Net cash used in operating activities was approximately €5.8 million.
Investing activities
Net cash used in investing activities was approximately €107.4 million in the year ended December 31, 2021, primarily attributable to investments in the development and construction of renewable energy facilities, including the Manara PSP Project and the Ellomay Solar PV Plant.
Net cash used in investing activities was approximately €112.1 million in the year ended December 31, 2020, primarily attributable to investments in the Talasol PV Plant.
Financing activities
Net cash provided by financing activities in the year ended December 31, 2021 was approximately €54.2 million, derived primarily from financing received on account of loans granted in connection with the Talasol PV Plant and the Manara PSP, the issuance of additional Series C Debentures in a public offering in Israel and private placement in Israel and the issuance of Series D Convertible Debentures in a public offering in Israel, partially offset by the early repayment of Series B Debentures on March 18, 2021.
Net cash provided by financing activities in the year ended December 31, 2020 was approximately €141.6 million, derived primarily from loan amounts withdrawn on account of the Talasol PV Plant Finance, the issuance of additional Series C Debentures and the private placement of our ordinary shares, partially offset by the early repayment of the Series A Debentures on January 5, 2020.
For more information concerning hedging transactions undertaken in connection with financings granted at EURIBOR linked interest, in connection with our Debentures, and in connection with our exposure to changes in fair value of our other loans and borrowings, as a result of changes in the interest rates, see “Item 11: Quantitative and Qualitative Disclosures About Market Risk.”
During 2021, we issued additional Series C Debentures in a public offering in Israel and a private placement in Israel and issued Series D Convertible Debentures in a public offering in Israel. For more information see “General,” “Series C Debentures” and “Series D Convertible Debentures” under “Other Financing Activities” and “Project Finance” above and Notes 11, 12 and 16 to our financial statements included in this Report.
During 2020, we issued additional Series C Debentures and issued ordinary shares in a private placement and withdrew funds under the project finance facilities of the Talasol PV Plant. For more information see “General” and “Series C Debentures” under “Other Financing Activities” and “Project Finance” above and Notes 11, 12 and 16 to our financial statements included in this Report.
As of December 31, 2021, we were not in default under any financial covenants pursuant to the agreements set forth above.
As of December 31, 2021, our total current assets amounted to approximately €83.9 million, of which approximately €41.2 million was in cash and cash equivalents and approximately €2 million was in marketable securities, compared with total current liabilities of approximately €205.2 million.
As of December 31, 2020, our total current assets amounted to approximately €88 million, of which approximately €66.8 million was in cash and cash equivalents and approximately €1.8 million was in marketable securities, compared with total current liabilities of approximately €42.7 million.
The decrease in our cash and marketable securities balance is mainly attributable to the investments in the development and construction of renewable energy facilities, including the Manara PSP and the Ellomay Solar PV Plant, the repayment of loans and early repayment of our Series B Debentures and general and administrative expenses, partially offset by cash received in connection with our operations and from the issuance of additional Series C Debentures and of the Series D Convertible Debentures.
Outstanding Options
As of March 1, 2022, we had 385,000 Series 1 Options outstanding. Each Series 1 Option is exercisable into one Ordinary Share, at an exercise price of NIS 150 (subject to adjustments upon customary terms) by no later than October 15, 2024.
During January and February 2021, Israeli institutional investors exercised warrants to purchase an aggregate of 178,750 Ordinary Shares, issued to them in a private placement of our ordinary shares and warrants consummated on February 18, 2020. The exercise price per share was NIS 80 (approximately $20.3 based on the USD/NIS exchange rate on January 31, 2021) and the aggregate gross proceeds received in connection with the exercise of the warrants was approximately NIS 14.3 million (approximately €3.6 million).
C. Research and Development, Patents and Licenses, etc.
We did not conduct any research and development activities in the years ended December 31, 2019, 2020 and 2021.
D. Trend Information
We operate in the Spanish and Italian photovoltaic markets, in the Netherlands waste-to-energy market and in the Israeli energy market through our four PV Plants in Spain, the Talasol PV Plant (of which we own 51%), our PV Plant in Israel, three WtE Plants in the Netherlands, our ownership of 50% of the issued and outstanding shares of Dori Energy, our ownership of 83.333% of the Manara PSP and through several other projects under development in Italy and in Spain. Our operating PV Plants are all fully operational and connected to the relevant national grids. However, as the Gelderland plant was acquired on December 1, 2020 and the Talasol PV Plant was connected to the Spanish national grid on December 26, 2020 and received PAC on January 27, 2021, our results for 2019-2021 do not reflect a full three-years of operations of such projects. In addition, as we sold our Italian PV Portfolio on December 20, 2019, our results for 2019, which include the revenues from such plants, are not indicative of our future results.
Our business and revenue growth from the markets in which we operate depends, among other factors, on payments received in accordance with applicable regulation and from the sale of the electricity produced by our plants and on seasonality and availability of raw materials. Revenue derived from our PV operations tends to be lower in the winter, primarily because of adverse weather conditions. The growth of our renewable energy business in Spain, the Netherlands, Israel and elsewhere and our other operations are affected significantly by government subsidies and economic incentives. In addition, our ability to continue to leverage the investment in these markets, may affect the profitability of past and future transactions. Dorad’s revenues are also dependent to an extent on regulation and seasonality. For more information see “Item 3.D: Risk Factors - Risks Related to our Renewable Energy Operations,” “Item 3.D: Risk Factors - Risks Related to our Investment in Dori Energy,” and “Item 4.B: Business Overview.”
E. Critical Accounting Estimates
Our financial statements have been prepared in accordance with International Financial Reporting Standards, or IFRS, as issued by the IASB, which differ in certain significant respects from U.S. Generally Accepted Accounting Principles, or U.S. GAAP.
Certain accounting principles require us to make certain estimates, judgments and assumptions that affect the reported amounts recognized in the financial statements. However, uncertainty about these assumptions and estimates could result in outcomes that require a material adjustment to the carrying amount of the asset or liability affected in future periods. Estimates and underlying assumptions are reviewed on an ongoing basis. The changes in accounting estimates are recognized in the period of the change in estimate. Our significant accounting policies are more fully described in Note 2 and 3 to our consolidated financial statements included elsewhere in this Report. The key assumptions made in the financial statements concerning uncertainties at the balance sheet date and the critical estimates that may cause a material adjustment to the carrying amounts of assets and liabilities within the next financial year are the following:
Fair value measurement of non-trading derivatives
Within the scope of the valuation of financial assets and derivatives not traded on an active market, management makes assumptions about inputs used in the valuation models. For information on a sensitivity analysis of levels 2 and 3 financial instruments carried at fair value see Note 21 to our annual financial statements included elsewhere in this Report.
Recognition of deferred tax asset in respect of tax losses
The probability that in the future there will be taxable profits against which carried forward losses can be utilized. See Note 19 to our annual financial statements included elsewhere in this Report regarding taxes on income and deferred tax.
Recoverable amount of cash generating unit
The Company examines at the end of each reporting year whether there have been any events or changes in circumstances that indicate impairment of fixed assets. When indication of impairment revealed the company checks whether the carrying amount of the fixed assets is recoverable.
Business combination
Fair value of assets and liabilities acquired in a business combination. See Note 6 regarding subsidiaries to our annual financial statements included elsewhere in this Report.
ITEM 6: Directors, Senior Management and Employees
A. Directors and Senior Management
Directors and Senior Management
The following table sets forth certain information with respect to our directors and senior management, as of March 1, 2022:
| Name | Age | Position with Ellomay |
| | | |
Shlomo Nehama(1)(2) | 67 | Chairman of the Board of Directors |
Ran Fridrich(1)(2) | 69 | Director and Chief Executive Officer |
Anita Leviant(1)(3)(4) | 67 | Director |
Ehud Gil(1) | 47 | Director |
Dr. Michael J. Anghel(3)(4)(5) | 83 | Director |
Daniel Vaknin(3)(4)(5) | 66 | Director |
| 43 | Chief Financial Officer |
| Ori Rosenzweig | 45 | Chief Investment Officer |
| Yehuda Saban | 43 | Director of Operations for Israel and EVP of Business Development |
______________________
| (1) | Election supported by certain of our major shareholders pursuant to the Shareholders Agreement, dated as of March 24, 2008, between S. Nechama Investments(2008) Ltd. and Kanir Joint Investments (2005) Limited Partnership (See “Item 7.A: Major Shareholders”). |
| (2) | Provides management services to the Company pursuant to the Management Services Agreement (See “Item 6.B: Compensation”). |
| (3) | Independent Director pursuant to the NYSE American LLC rules. |
| (4) | Member of our Audit and Compensation Committees. |
| (5) | External Director pursuant to the Companies Law. |
The address of each of our executive officers and directors is c/o Ellomay Capital Ltd., 18 Rothschild Boulevard, 1st floor, Tel Aviv 6688121, Israel.
Shlomo Nehama has served as a director and Chairman of the Board of Ellomay since March 2008. From 1998 to 2007, Mr. Nehama served as the Chairman of the Board of Bank Hapoalim B.M., one of the largest Israeli banks. In 1997, together with the late Ted Arison, he organized a group of American and Israeli investors who purchased Bank Hapoalim from the State of Israel. From 1992 to 2006, Mr. Nehama served as the Chief Executive Officer of Arison Investments. From 1982 to 1992, Mr. Nehama was a partner and joint managing director of Eshed Engineers, a management consulting firm. He also serves as a director in several philanthropic academic institutions, on a voluntary basis. Mr. Nehama is a graduate of the Technion - Institute of Technology in Haifa, Israel, where he earned a degree in Industrial Management and Engineering. Mr. Nehama received an honorary doctorate from the Technion for his contribution to the strengthening of the Israeli economy.
Ran Fridrich has served as a director of Ellomay since March 2008, as our interim chief executive officer since January 2009, and as our chief executive officer since December 2009. Mr. Fridrich is the co-founder and executive director of Oristan, Investment Manager, an investment manager of CDO Equity and Mezzanine Funds and a Distress Fund, established in June 2004. In January 2001 Mr. Fridrich founded the Proprietary Investment Advisory, an entity focused on fixed income securities, CDO investments and credit default swap transactions, and served as its investment advisor through January 2004. Prior to that, Mr. Fridrich served as the chief executive officer of two packaging and printing Israeli companies, Lito Ziv, a public company, from 1999 until 2001 and Mirkam Packaging Ltd. from 1983 until 1999. Mr. Fridrich also serves as a director of Cargal Ltd. since September 2002 and since 2007 as a director in Plastosac. Mr. Fridrich is a graduate of the Senior Executive Program of Tel Aviv University.
Anita Leviant has served as a director of Ellomay since March 2008. Ms. Leviant heads LA Global Consulting, a practice specializing in representing and consulting global oriented companies in IPO process. LAGC represents and consults investors and corporations on business and regulatory issues, in Fintech and Cyber investments, in cross border and financial transactions, banking and capital markets. LAGC provides through its Tel Aviv head office and its London based subsidiary soft lending for overseas l business in Israel and in the UK. For a period of twenty years, until 2006, Ms. Leviant held several senior positions with Hapoalim Banking group including EVP Deputy Head of Hapoalim Europe and Global Private Banking and EVP General Global Counsel of the group, and served as a director in the overseas subsidiaries of Bank Hapoalim. Prior to that, Ms. Leviant was an associate in GAFNI & CO. Law Offices in Tel Aviv where she specialized in Liquidation, Receivership and Commercial Law and was also a Research Assistant to the Law School Dean in the Tel Aviv University specialized in Private International Law. Ms. Leviant holds a LL.B degree from Tel Aviv University Law School and is a member of both the Israeli and the New York State Bars. Ms. Leviant currently also serves as President of the Israel-British Chamber of Commerce, Council Member of the UK- Israel Tech Council, Board Member of the Federation of Bi-Lateral Chambers of Commerce and a Co-Founder of the Center for Arbitration and Dispute Resolutions Ltd. Ms. Leviant is a certified mediator.
Ehud Gil has served as a director of Ellomay since November 12, 2020. Mr. Gil has been an entrepreneur in the intersection of security and technology, and a consultant to the Israeli Ministry of Defense. In 2018, Mr. Gil retired from the Israeli Defense Forces, or IDF, at the rank of Lieutenant-Colonel. Prior to his retirement from the IDF, Mr. Gil held various key managerial positions in the IDF and the Israeli Ministry of Defense, including Head of Planning and Control Branch, Head of Training Branch in the General Headquarters of the IDF, and Director of Projects for the IDF. Mr. Gil holds an M.Ed. (with honors) in Management and Organization of Education Systems from the University of Haifa and a B.Sc. in Materials Engineering from the Ben-Gurion University of the Negev. As indicated below, Mr. Gil is the brother of Ms. Anat Raphael.
Dr. Michael J. Anghel has served as an external director of Ellomay since January 24, 2019. From 1977 to 1999, Dr. Anghel led the Discount Investment Corporation Ltd. (one of the major Israeli industrial holding groups) activities in the fields of technology and communications. Dr. Anghel was instrumental in founding Tevel, one of the first Israeli cable television operators and later in personally managing the founding of Cellcom Israel Ltd. (NYSE; TASE: CEL), the largest cellular operator in Israel. In 1999 he founded CAP Ventuwasteres - a technology venture company. From 2004 to 2005, Dr. Anghel served as CEO of DCM, the investment banking arm of the Israel Discount Bank. He led and took part in founding various technology enterprises and has served on the board of directors of various major Israeli corporations and financial institutions including: Elron Electronic Industries Ltd., Elbit Systems Ltd., Nice Ltd., Gilat Satellite Networks Ltd., American Israeli Paper Mills Ltd., Maalot (the Israeli affiliate of Standard and Poor’s), Hapoalim Capital Markets Ltd., Syneron Medical Ltd., Dan Hotels Ltd., the Strauss Group Ltd. and Partner Communications Company Ltd. He also served until recently as the Chairman of the Israeli Center for Educational Technology (Matach). Dr. Anghel currently serves on the board of directors of InMode Ltd. (NASDAQ: INMD) and BiolineRx Ltd. (NASDAQ; TASE: BLRX). On all boards of directors of the publicly traded companies he served as member or chairman of the audit committees. Prior to launching his business career, Dr. Anghel was a full-time member of the Recanati Graduate School of Business Administration of the Tel Aviv University, where he taught finance and corporate strategy. He currently serves as Chairman of the Tel Aviv University’s Executive Program. Dr. Anghel holds a B.A. in economics from the Hebrew University in Jerusalem and an M.B.A. and Ph.D. in finance, both from Columbia University in New York.
Daniel Vaknin, has served as an external director of Ellomay since December 20, 2020. Mr. Vaknin is a financial consultant. Mr. Vaknin currently serves on the Board of Directors of Clal Insurance Company Ltd., Ilex Medical Ltd. (TASE: ILX), Arad Ltd. (TASE: ARD) and Kardan Israel Ltd. (TASE: KRDI) and served on the Board of Directors of Global Wings Leasing Ltd. (TASE: GKL) until 2020. From 2007 to 2011 Mr. Vaknin served as Chief Executive Officer of Israel Financial Levers Ltd. From 2005 to 2007 Mr. Vaknin served as the Chief Executive Officer of Phoenix Investments and Finance Ltd. From 2004 to 2005 Mr. Vaknin served as the Vice Chief Executive Officer of I.D.B Development Company Ltd. Prior to that Mr. Vaknin was a Senior Partner at Kesselman & Kesselman C.P.A.s, a member firm of PricewaterhouseCoopers International Limited. Mr. Vaknin is a CPA and holds a BA in Economics and Accounting from the Hebrew University in Jerusalem.
Kalia (Weintraub) Rubenbach has served as our chief financial officer since January 2009. Prior to her appointment as our chief financial officer, Ms. Rubenbach served as our corporate controller from January 2007 and was responsible, among her other duties, for the preparation of all financial reports. Prior to joining Ellomay, she worked as a certified public accountant in the AABS High-Tech practice division of the Israeli accounting firm of Kost Forer Gabbay & Kasierer, an affiliate of the international public accounting firm Ernst & Young, from 2005 through 2007 and in the audit division of the Israeli accounting firm of Brightman Almagor Zohar, an affiliate of the international public accounting firm Deloitte, from 2003 to 2004. Ms. Rubenbach holds a B.A. in Economics and Accounting and an M.B.A. from the Tel Aviv University and is licensed as a CPA in Israel.
Ori Rosenzweig has served as our Chief Investment Officer since November 2014. Prior to joining Ellomay, Mr. Rosenzweig was the head of Cash Management at Bank Leumi Le-Israel B.M. (TASE: LUMI), one of Israel’s largest banks, from 2013 through 2014, the VP Finance at AFI Investments, one of the largest international real-estate developers in Israel (TASE: AFIL) from 2009 through 2013 and a senior manager at GSE financial consulting from 2002 through 2008. Mr. Rosenzweig holds a MBA degree from the Tel Aviv University and a BA degree in business and international relations from the Hebrew University.
Yehuda Saban has served as our Director of Operations for Israel and EVP of Business Development since April 2019. Mr. Saban served between 2011- mid 2015 as Executive Vice President Economics & Regulation at Delek Drilling, the biggest oil and gas company in Israel. Previously, Mr. Saban served over six years in various capacities with the budget department of the Israeli Ministry of Finance as Manager of the Telecommunications and Tourism unit, Manager of the Budget and Macroeconomics unit and as an economist in the Energy unit. During those years, Mr. Saban was also an active partner in a number of committees and authorities in the energy, telecommunications and infrastructure fields. Mr. Saban serves as a member of the board of directors of Partner Communications Ltd. (NASDAQ and TASE: PTNR, one of the biggest telecommunication companies in Israel) and served till 2021 on the board of Israel Opportunity Energy Resources LP (TASE: ISOP) and as chairman of its compensation and audit committee since June 2015. Prior to joining Ellomay, Mr. Saban managed projects and business development for Hutchinson Water between the years 2015-2017. Mr. Saban holds a B.A. in Economics & Business Management (graduated with great honors) and an M.B.A specializing in Financing, both from the Hebrew University in Jerusalem.
There are no family relationships among any of the directors or members of senior management named above. Mr. Gil is the brother of Ms. Anat Rafael, who is one of the board members of Kanir Ltd., the general partner of Kanir Joint Investments (2005) Limited Partnership, and the widow of the late Mr. Raphael, a former member of our Board of Directors.
B. Compensation
General
Salaries, fees, commissions, share compensation and bonuses paid or accrued with respect to all of our directors and senior management as a group in the fiscal year ended December 31, 2021 was approximately €1.45 million, including an amount of approximately €61 million related to pension, retirement and other similar benefits. These figures do not include the compensation of Messrs. Shlomo Nehama, or Chairman of the Board, and Ran Fridrich, our Chief Executive Officer and a member of our Board, who are both compensated pursuant to the Management Services Agreement (see “Item 7.B: Related Party Transactions” below) and have, in connection with such agreement, waived their right to receive the compensation, including options, paid to our other directors.
The table below reflects the terms of service and employment of our five most highly compensated “office holders” (as such term is defined in the Companies Law) during or with respect to the year ended December 31, 2021. All amounts reported in the table below are as recognized in our financial statements for the year ended December 31, 2021.
| | | | | Management/Consulting Fees | | | | | | | | | | |
| | | |
| | | | |
Shlomo Nehama, Chairman of the Board | | | - | | | | 212 | (3) | | | - | | | | - | | | | 212 | (3) |
Ran Fridrich, CEO and Director | | | - | | | | 268 | (3) | | | - | | | | - | | | | 268 | (3) |
Yehuda Saban, Director of Operations for Israel and EVP of Business Development | | | - | | | | 269 | | | | - | | | | 3 | | | | 272 | |
Kalia Rubenbach, Chief Financial Officer | | | 252 | | | | - | | | | 36 | | | | 3 | | | | 291 | |
Ori Rosenzweig, Chief Investment Officer | | | 267 | | | | - | | | | - | | | | 3 | | | | 270 | |
_____________________________
| 1. | Salary and related benefits are paid to our executive officers in NIS. Salary as reported herein includes the recipient’s gross salary plus payment of social and other benefits made by us to or on behalf of the recipient. Such benefits may include, to the extent applicable, payments, contributions and/or allocations for education funds, pension funds, managers’ insurance, severance, risk insurances (e.g., life, or work disability insurance), social security, tax gross-up payments, vacation, car, phone, convalescence pay and other benefits and perquisites consistent with our policies. |
| 2. | Represents the share-based compensation expenses recorded in our consolidated financial statements for the year ended December 31, 2021, based on the Share-based Compensation fair value, calculated in accordance with accounting guidance for share-based compensation. For a discussion of the assumptions used in reaching this valuation, see Note 1 to our annual financial statements. |
| 3. | Such amounts are paid pursuant to the terms of the Management Services Agreement. For additional information, see “Management Services Agreement” below. |
For more information concerning option grants to office holders see “Item 6.E: Share Ownership.”
Management Services Agreement
In December 2008, following the approval of our Audit Committee, Board of Directors and shareholders, we entered into a Management Services Agreement, or the Prior Management Services Agreement, with Kanir and with Meisaf Blue & White Holdings Ltd., or Meisaf, a private company controlled by Shlomo Nehama, effective as of March 31, 2008, the date of appointment of Messrs. Fridrich and Nehama as members of our Board. The initial aggregate annual consideration paid to Kanir and Meisaf pursuant to the Prior Management Services Agreement was an amount of $250,000 plus value added tax pursuant to applicable law, paid in equal parts. This aggregate annual amount was increased to $400,000 in 2013.
As our annual shareholders meeting held on August 12, 2021, or the 2021 Shareholders Meeting, our shareholders approved, following the approval by our Audit and Compensation Committee and Board of Directors, an Amended and Restated Management Services Agreement, effective July 1, 2021, which provides, among other things, for the payment of NIS 1.386 million (approximately €0.39 million) per year to Meisaf in consideration for the services provided by Meisaf, including the service of Mr. Nehama as our Chairman of the Board in no less than a 77% position and the payment of NIS 1.8 million (approximately €0.51 million) per year to Kanir and Keystone R.P. Holdings and Investments Ltd., a private company wholly-owned by Mr. Ran Fridrich, or Keystone (in an initial allocation of NIS 0.66 million to Kanir and NIS 1.14 million to Keystone) in consideration for service provided by these entities, including the service of Mr. Fridrich as our Chief Executive Officer. For more information see “Item 7.B: Related Party Transactions.”
Compensation of Non-Executive Directors
As approved by our shareholders, we pay our non-executive directors (Anita Leviant, Dr. Michael J. Anghel, Daniel Vaknin and Ehud Gil) remuneration for their services as directors. These directors are paid in accordance with the Companies Regulations (Rules for Compensation and Expenses of External Directors), 5760-2000, or the Compensation Regulations. The Compensation Regulations set forth a range of fees that may be paid by Israeli public companies to their external directors, depending upon each company’s equity based on the most recent financial statements. The current cash amounts paid to our external directors pursuant to the Compensation Regulations, as approved by our shareholders, are an annual fee of NIS 54,000 (equivalent to approximately €15,341) and an attendance fee of NIS 1,910 (equivalent to approximately €542.6) per meeting (board or committee). These amounts are updated once a year based on increases in the Israeli Consumer Price Index. According to the Compensation Regulations, which we apply to all our non-executive directors, the directors are entitled to 60% of the meeting fee if they participated at the meeting by teleconference and not in person, and to 50% of the meeting fee if resolutions were approved in writing, without convening a meeting.
Each of these non-executive directors also receives an annual grant of options to purchase 1,000 ordinary shares under the terms and conditions set forth in our 1998 Share Option Plan for Non-Employee Directors, or the 1998 Plan. The 1998 Plan provides for grants of options to purchase ordinary shares to our non-employee directors. The 1998 Plan, as amended, is administered, subject to Board approval, by the Compensation Committee and our Board. An aggregate amount of not more than 75,000 ordinary shares is reserved for grants under the 1998 Plan. The term of the 1998 Plan has been extended to December 8, 2028, unless earlier terminated by our Board.
Under the 1998 Plan, each non-employee director that served on the 1998 “Grant Date,” as defined below, automatically received an option to purchase 1,000 ordinary shares on such Grant Date and will receive an option to purchase an additional 1,000 ordinary shares on each subsequent Grant Date thereafter, provided that he or she is a non-employee director on the Grant Date and has remained a non-employee director for the entire period since the previous Grant Date. The “Grant Date” means, with respect to 1998, October 26, 1998, and with respect to each subsequent year, August 1 of such year. Directors first elected or appointed after the 1998 Grant Date, will automatically receive on such director’s first day as a director an option to purchase up to 1,000 ordinary shares pro-rated based on the number of full months of service between the prior Grant Date and the next Grant Date. Each such non-employee director would also automatically receive, on each subsequent Grant Date, an option to purchase 1,000 ordinary shares provided that he or she is a non-employee director on the Grant Date and has served as a non-employee director for the entire period since his or her previous Grant Date.
The exercise price of the option shares under the 1998 Plan is 100% of the fair market of such ordinary shares at the applicable Grant Date. The exercise price is required to be paid in cash.
The term of each option granted under the 1998 Plan is 10 years from the applicable date of grant and such options may be terminated earlier upon certain circumstances, such as the expiration of three months from the date of the director’s termination of service on our Board (subject to extension and certain exceptions pursuant to the terms of the 1998 Plan). Currently, the options granted to non-employee directors vest in one installment on the first anniversary of the grant date of the options.
The options granted are subject to restrictions on transfer, sale or hypothecation. All options and ordinary shares issuable upon the exercise of options granted to our non-employee directors could be withheld until the payment of taxes due (if any) with respect to the grant and exercise of such options.
For more information concerning our share option plans and options granted to directors and an executive officer see “Item 6.E: Share Ownership.”
Compensation Policy and Approval Process of Directors’ and Officers’ Terms of Service and Employment
The Companies Law regulates the approval process of arrangements with “office holders” as to their terms of service or employment, including the grant of an exemption, insurance, undertaking to indemnify or indemnification, retirement bonuses and any other benefit, payment or undertaking to pay any such amounts, given due to service or employment, or together, the Terms of Service and Employment. An “office holder” is defined under the Companies Law as a general manager, chief business manager, vice general manager, any other person assuming the responsibilities of any of the foregoing positions without regard to such person’s title, and a director, or manager directly subordinate to the general manager. Each person identified as a director or member of our senior management in the first table in this Item is an office holder.
Compensation Policy
The Companies Law requires the board of directors of a public company to adopt a policy with respect to the Terms of Service and Employment of office holders, after taking into consideration the recommendations of the compensation committee. The Companies Law further provides for the approval of the compensation policy by the company’s shareholders with a “special majority” requirement, i.e. the affirmative vote of the holders of a majority of the shares present, in person or by proxy, and voting on the matter provided that at least one of the following conditions is met: (i) the shares voting in favor of the matter include at least a majority of the shares voted by shareholders who are not controlling shareholders and who do not have a personal interest in the approval of the compensation policy (or the transaction, as the case may be) or (ii) the total number of shares voted against the compensation policy by shareholders referenced under (i) does not exceed 2% of the company’s outstanding voting rights.
A compensation policy for a period exceeding three years is required to go through the complete approval process once every three years. In addition, the board of directors is required to periodically examine the compensation policy and the need for adjustments based on the considerations in determining a compensation policy in the event of a material change in the circumstances prevailing during the adoption of the compensation policy or for other reasons.
At the 2021 Shareholders Meeting, our shareholders approved our amended compensation policy, or the Compensation Policy.
Our Compensation Policy is designed to support the achievement of our long term work plan goals and ensure that: (i) officer’s interests are as closely as possible aligned with the interests of our shareholders; (ii) the correlation between pay and performance will be enhanced; (iii) we will be able to recruit and retain top level senior managers capable of leading us to further business success and facing the challenges ahead; (iv) officers will be motivated to achieve a high level of business performance without taking unreasonable risks; and (v) an appropriate balance will be established between different compensation elements – fixed vs. variable, short term vs. long term and cash payments vs. equity based compensation. Our Compensation Policy is filed by us as Exhibit 4.5 under “Item 19: Exhibits.”
Approval Process of Terms of Service and Employment of Office Holders
The Companies Law provides that the process for approval of Terms of Service and Employment of office holders, that are required to be for the benefit of the company, is as follows:
| a. | With respect to our chief executive officer, a controlling shareholder or a relative of a controlling shareholder, approval is required by the (i) compensation committee, (ii) board of directors and (iii) company’s shareholders with the “special majority” described above (in that order). Subject to certain conditions, the Israeli Companies Law provides an exemption from the shareholder approval requirement in connection with the approval of the Terms of Service and Employment of a CEO candidate. |
| b. | With respect to a director, approval is required by the (i) compensation committee, (ii) board of directors and (iii) company’s shareholders with a regular majority (in that order). |
| c. | With respect to any other office holder, approval is required by the compensation committee and the board of directors (in that order); however, in the event of an update of existing Terms of Service and Employment, which the Compensation Committee confirms is not material, the approval of the compensation committee is sufficient. |
In the event the transaction with any office holder is not in accordance with the compensation policy, the approval of the company’s shareholders, by “special majority,” is also required. In the event the company’s shareholders do not approve the compensation of the CEO or other office holders (who are not directors, controlling shareholders or relatives of the controlling shareholders), the compensation committee and board of directors may, in special situations, approve the transaction, subject to their providing detailed reasons and after discussion and examination of the rejection by the company’s shareholders. The Companies Regulations (Relief in Related Party Transactions), 2000, promulgated under the Companies Law, or the Relief Regulations, provide additional temporary or permanent relief from the shareholder approval requirement under certain circumstances.
C. Board Practices
We are a “controlled company” as defined in Section 801 of the NYSE American LLC Company Guide. As a result, we are exempt from certain of the NYSE American LLC corporate governance requirements, including the requirement that a majority of the board of directors be independent, the requirement applicable to the nomination process of directors and the requirements applicable to the determination or recommendation of executive compensation by a committee comprised of independent directors or by a majority of the independent directors and the additional requirements concerning compensation committee independence, compensation advisor engagement and independence. If the “controlled company” exemption would cease to be available to us under the NYSE American LLC Company Guide, we may instead elect to follow Israeli law (“home country law”), which we currently follow, with respect to these matters. For more information see “Item 16.G: Corporate Governance.”
According to the provisions of our Second Amended and Restated Articles, or the Articles, and the Companies Law, our Board convenes in accordance with our requirements, and is required to convene at least once every three months. Furthermore, the Companies Law provides that the board of directors may also adopt resolutions without actually convening, provided that all the directors entitled to participate in the discussion and vote on a matter that is brought for resolution agree not to convene for discussion of the matter.
Our chief executive officer serves at the discretion of the board of directors.
Terms of Directors
Our Board currently consists of six members, including two external directors. Pursuant to our Articles, unless otherwise prescribed by resolution adopted at a general meeting of our shareholders, our Board shall consist of not less than four (4) nor more than eight (8) directors (including the external directors). Except for our two external directors, the members of our Board are elected annually at our annual shareholders’ meeting and remain in office until the next annual shareholders’ meeting, unless the director has previously resigned, vacated his office, or was removed in accordance with the Articles. Our most recent annual meeting (the 2021 Shareholders Meeting), was held on August 12, 2021 and an extraordinary meeting of our shareholders was held on January 20, 2022. Our Board, by unanimous approval of all directors then in office, may at any time appoint any person to serve as director as replacement for a vacated office or in order to increase the number of directors, subject to the condition that the number of directors shall not exceed the maximum established in the Articles. Any so appointed director shall remain in office until the next Annual Meeting, at which he may be reelected.
The members of our Board do not receive additional remuneration upon termination of their services as directors.
External Directors
We are subject to the provisions of the Companies Law, which requires that we, as a public company, have at least two external directors.
Under the Companies Law, a person may not be appointed as an external director if he or his relative, partner, employer or any entity under his control has or had during the two years preceding the date of appointment any affiliation with the company, any entity controlling the company or any entity controlled by the company or by this controlling entity or, in a company that does not have a controlling shareholder, in the event that he has affiliation, at the time of his appointment, to the chairman of the board, chief executive officer, a 5% shareholder or the highest ranking officer in the financial field. The term “affiliation” includes: an employment relationship, a business or professional relationship maintained on a regular basis, control, and service as an office holder. No person can serve as an external director if the person’s position or other business creates, or may create, conflicts of interest with the person’s responsibilities as an external director, or if the person is an employee of the Israel Securities Authority or of an Israeli stock exchange. In addition, an individual may not be appointed as an external director if she or he, or her or his relative, partner, employer, supervisor, or an entity she or he controls, has other than negligible business or professional relations with any of the persons with which the external director may not be affiliated, even if such relations are not routine, or if she or he received any consideration, directly or indirectly, in addition to the remuneration to which she or he are entitled and to reimbursement of expenses, for acting as a director in the company. The Compensation Regulations set the range of compensation and the terms of other compensation that may be paid to statutory external directors.
Pursuant to the Companies Law, the election of an external director for the initial term requires the affirmative vote of a majority of the shares present, in person or by proxy, and voting on the matter, provided that either: (i) at least a majority of the shares of non-controlling shareholders and shareholders who do not have a personal interest in the resolution (excluding a personal interest that is not related to a relationship with the controlling shareholders) are voted in favor of the election of the external director, or (ii) the total number of shares of non-controlling shareholders and of shareholders who do not have a personal interest in the resolution (excluding a personal interest that is not related to a relationship with the controlling shareholders) voted against the election of the external director does not exceed two percent of the outstanding voting power in the company.
The initial term of an external director is three years. An external director may be re-elected to serve for two additional three-year terms in one of the two following methods: (i) the board of directors proposed the nomination of the external director for an additional term and her or his appointment is approved by the shareholders in the manner required to appoint external directors for an initial term as set forth above, or (ii) in the event a shareholder holding 1% or more of the voting rights nominates the external director for an additional term or in the event the external director nominates himself or herself for an additional term, the nomination is required to be approved by a majority of the votes cast by the shareholders of the company; provided that: (x) the votes of controlling shareholders, the votes of shareholders who have a personal interest in the approval of the appointment of the external director, other than a personal interest that is not as a result of such shareholder’s connections to the controlling shareholder, and abstaining votes are excluded from the counting of votes and (y) the aggregate votes cast by shareholders in favor of the nomination that are counted for purposes of calculating the majority exceeds two percent of the voting rights in the company. The external director nominated by shareholders may not be a related or competing shareholder or a relative of such shareholder at the date of appointment and may not have an affiliation to a related or competing shareholder at the date of appointment or for the two-year period prior to the appointment. A “related or competing shareholder” is defined by the Companies Law as the shareholder that proposed the nomination or a significant shareholder (a shareholder holding five percent or more of the outstanding shares of a company or of the voting rights in a company), provided that at the date of appointment of the external director such shareholder, its controlling shareholder or a corporation controlled by either of them, have business connections with the company or are competitors of the company. The term “affiliation” is defined as set forth above. In addition, Israeli companies listed on certain stock exchanges outside Israel, including the NYSE American LLC, such as our company, may appoint an external director for additional terms of not more than three years each subject to certain conditions. Such conditions include the determination by the audit committee and board of directors, that in view of the external director’s professional expertise and special contribution to the company’s board of directors and its committees, the appointment of the external director for an additional term is in the best interest of the company.
All of the external directors of a company must be members of its audit committee and compensation committee and at least one external director is required to serve on every committee authorized to exercise any of the powers of the board of directors. Our external directors are currently Dr. Michael J. Anghel and Daniel Vaknin.
Under the Companies Law an external director cannot be dismissed from office unless: (i) the board of directors determines that the external director no longer meets the statutory requirements for holding the office, or that the external director is in breach of the external director’s fiduciary duties and the shareholders vote, by the same majority required for the appointment, to remove the external director after the external director has been given the opportunity to present his or her position; (ii) a court determines, upon a request of a director or a shareholder, that the external director no longer meets the statutory requirements of an external director or that the external director is in breach of his or her fiduciary duties to the company; or (iii) a court determines, upon a request of the company or a director, shareholder or creditor of the company, that the external director is unable to fulfill his or her duty or has been convicted of specified crimes. For a period of two years following the termination of services as an external director, the company, its controlling shareholder and any entity the controlling shareholder controls may not provide any benefit to such former external director, directly or indirectly. The prohibited benefits include the appointment as an office holder in the company or the controlled entity, employment of, or receipt of professional services from, the former external director for compensation, including through an entity such former external director controls. The same prohibition applies to the former external director’s spouse and child for the same two-year period and to other relatives of the external director for a period of one year following the termination of services as an external director.
The Companies Law requires that at least one of the external directors have “Accounting and Financial Expertise” and the other external directors have “Professional Competence.” Under the applicable regulations, a director having accounting and financial expertise is a person who, due to his or her education, experience and talents is highly skilled in respect of, and understands, business-accounting matters and financial reports in a manner that enables him or her to understand in depth the company’s financial statements and to stimulate discussion regarding the manner in which the financial data is presented. Under the applicable regulations, a director having professional competence is a person who has an academic degree in either economics, business administration, accounting, law or public administration or an academic degree in an area relevant to the company’s business, or has at least five years’ experience in a senior position in the business management of a corporation with a substantial scope of business, in a senior position in the public service or a senior position in the field of the company’s main business. Our Board determined that both Dr. Michael J. Anghel and Daniel Vaknin have the requisite accounting and financial expertise.
Our Board further determined that at least two directors out of the whole Board shall be required to have accounting and financial expertise pursuant to the requirements of the Companies Law and previously determined that Shlomo Nehama shall be designated as an additional accounting and financial expert.
Independent Directors Pursuant to the Companies Law
In addition to the external director, the Companies Law includes another category of directors, which is the “independent” director. An independent director is either an external director or a director appointed or classified as such who meets the same non-affiliation criteria as an external director, as determined by the company’s audit committee, and who has not served as a director of the company for more than nine consecutive years (subject to the right granted to certain companies, including companies whose shares are listed on the NYSE American LLC, to permit independent directors to serve as such for periods exceeding nine years). For these purposes, ceasing to serve as a director for a period of two years or less would not be deemed to sever the consecutive nature of such director’s service.
Pursuant to the Companies Law, we, as a public company, may include in our articles of association a provision providing that a specified number of our directors be independent directors or may adopt a standard provision providing that a majority of our directors be independent directors or, if there is a controlling shareholder or a 25% or more shareholder, that at least one-third of our directors be independent directors. We have not included a provision requiring that a certain percentage of the members of our Board be independent directors.
Independent Directors pursuant to the NYSE American LLC Requirements
In general, the NYSE American LLC Company Guide requires that a NYSE American LLC listed company have a majority of independent directors, as defined under the NYSE American LLC Company Guide, on its board of directors. Because we are a “controlled company” as defined in Section 801 of the NYSE American LLC Company Guide, we are exempt from this requirement. If the “controlled company” exemption would cease to be available to us under the NYSE American LLC Company Guide, we may instead elect to continue to follow Israeli law.
Our Board determined that three of the members of our Board, Dr. Anghel, Ms. Leviant and Mr. Vaknin, are “independent” within the meaning of Section 803A of the NYSE American LLC Company Guide.
Alternate Directors
Our Articles provide that, subject to the Board’s approval, a director may appoint an individual, by written notice to us, to serve as an alternate director. The following persons may not be appointed nor serve as an alternate director: (i) a person not qualified to be appointed as a director, (ii) an actual director, or (iii) another alternate director. Any alternate director shall have all of the rights and obligations of the director appointing him or her, except the power to appoint an alternate (unless the instrument appointing him or her expressly provides otherwise). The alternate director may not act at any meeting at which the director appointing him or her is present. Unless the appointing director limits the time period or scope of any such appointment, such appointment is effective for all purposes and for an indefinite time, but will expire upon the expiration of the appointing director’s term. There are currently no alternate directors.
Duties of Office Holders and Approval of Certain Actions and Transactions under the Companies Law
The Companies Law codifies the duty of care and fiduciary duties that an office holder has to our company.
The duty of care requires an office holder to act at a level of care that a reasonable office holder in the same position would employ under the same circumstances. This includes the duty to utilize reasonable means to obtain (i) information regarding the appropriateness of a given action brought for his or her approval or performed by the office holder by virtue of his or her position and (ii) all other information of importance pertaining to the foregoing actions.
The duty of loyalty includes avoiding any conflict of interest between the office holder’s position in the company and his or her personal affairs or other positions, avoiding any competition with the company, avoiding exploiting any business opportunity of the company in order to receive personal gain for himself or herself or for others, and disclosing to the company any information or documents relating to the company’s affairs which the office holder has received due to his or her position as such. A company can approve actions by an office holder that could be deemed to be in breach of his or her duty of loyalty provided that: (i) the office holder acted in good faith and the action or its approval do not prejudice the company’s interests, and (ii) the office holder disclosed to the company, a reasonable time prior to the discussion of the approval, the nature of his or her personal interest in the action, including any material fact or document. The approval of such actions is obtained based on the requirements for approval of transactions in which an office holder has a personal interest. The Companies Law provides that for purposes of determining the approval process, “actions” (defined as any legal action or inaction) are treated as “transactions” and “material actions” (defined as an action that may materially affect the company’s profitability, assets or liabilities) are treated as “extraordinary transactions.” An “extraordinary transaction” is defined as a transaction that is not in the ordinary course of business, not on market terms, or that is likely to have a material impact on the company’s profitability, assets or liabilities. One of the roles of the audit committee under the Companies Law is to determine whether a transaction is or is not an extraordinary transaction. These transactions and extraordinary transactions are required to be for the benefit of the company and are subject to a special approval process as set forth below. The Companies Law requires that an office holder of a company promptly disclose to the company’s board of directors any personal interest that he or she may have, and all related material information known to him or her in connection with any existing or proposed transaction by the company. This disclosure must be made by the office holder, whether orally or in writing, no later than the first meeting of the company’s board of directors which discusses the particular transaction.
An office holder is deemed to have a “personal interest” if he has a personal interest in an act or transaction of a company, including a personal interest of his relative or of a corporation in which such office holder or his relative are a 5% or greater shareholder, but excluding a personal interest stemming from the fact of a shareholding in the company. The term “personal interest” also includes a personal interest of a person voting pursuant to a proxy provided to him from another person even if such other person does not have a personal interest and the vote of a person that received a proxy from a shareholder that has a personal interest is viewed as a vote of the shareholder with the personal interest, all whether the discretion with respect to the voting is held by the person voting or not.
Any transaction or action, whether material or extraordinary or not, cannot be approved unless they are not adverse to the company’s interests. In the case of a transaction that is not an extraordinary transaction or an action that is not a material action, after the office holder complies with the above disclosure requirements, only board approval is required. In the case of an extraordinary transaction or a material action, the company’s audit committee and board of directors, and, under certain circumstances, the shareholders of the company, must approve the action or transaction, in addition to any approval stipulated by the articles of the company.
For a discussion concerning the determination whether an action is material or not an whether a transaction is extraordinary or not and for a review on the approval process for the terms of services of officers, see “Committees of the Board of Directors – Audit Committee” below.
A director who has a personal interest in a matter that is considered at a meeting of the board of directors or the audit committee may not be present at this meeting or vote on this matter, provided that an office holder who has a personal interest may be present for the presentation of the transaction in the event the chairman of the audit committee or the chairman of the board, as the case may be, determine that she or he are required for the presentation of the transaction, unless a majority of the members of the board of directors or audit committee, as the case may be, have a personal interest in the matter, in which case they may all be present and vote. In the event a majority of the members of the board of directors have a personal interest in a matter, such matter must be also approved by the shareholders of the company.
Committees of the Board of Directors
Audit Committee
Under the Companies Law, we, as a public company, are required to have an audit committee. The Audit Committee must be comprised of at least three members of the Board, including all of the external directors. In addition, the Companies Law requires that the majority of the members of the audit committee be “independent” (as such term is defined under the Israeli Companies Law) and that the chairman of the audit committee be an external director. The Companies Law further provides that the following may not be members of the audit committee: (a) the chairman of the board of directors; (b) any director employed by or providing services on an ongoing basis to the company, to a controlling shareholder of the company or an entity controlled by a controlling shareholder of the company; (c) a director who derives most of its income from a controlling shareholder; and (d) a controlling shareholder or any relative of a controlling shareholder.
Our Audit Committee, acting pursuant to a written charter adopted based on the requirements of the Companies Law, the rules promulgated under the Exchange Act and the NYSE American LLC Company Guide, currently consists of Dr. Michael Anghel, who is also the chairman of the Audit Committee, Daniel Vaknin and Anita Leviant. The members of our Audit Committee satisfy the respective “independence” requirements of the Securities and Exchange Commission, NYSE American LLC and Israeli law for audit committee members. During 2021, our Audit Committee met at least once each quarter.
The Companies Law provides that the roles of an audit committee are as follows: (i) monitoring deficiencies in the business management of a company, including by consulting with the internal auditor or independent accountants and suggesting methods of correction of such deficiencies to the board of directors, (ii) determining whether or not certain related party actions and transactions and actions taken by office holders that are “material actions” or “extraordinary transactions” in connection with their approval procedures as more fully described above, (iii) determining in connection with transactions with the controlling shareholder or with a third party in which the controlling shareholder has a personal interest (event if they are not extraordinary transactions) and in connection with transactions with the controlling shareholder or its relative, directly or indirectly, for the receipt of services or in connection with terms of employment or service, a duty to conduct a competitive process, supervised by the audit committee or anyone else appointed by the audit committee and based on criteria determined by the audit committee, or to determine that other procedures determined by the audit committee will be conducted, prior to execution of such transactions, all based on the type of the transaction (the audit committee is permitted to determine criteria for this matter once a year in advance), (iv) determining whether to approve actions and transactions that require audit committee approval under the Companies Law, (v) determining the method of approval of non-negligible transactions (i.e. transactions of a company with a controlling shareholder or with a third party in which the controlling shareholder has a personal interest that the audit committee determined are not extraordinary but are non-negligible), including to determine types of such transactions that will require the approval of the audit committee (the audit committee is permitted to determine a classification of transactions as non-negligible based on criteria determined once a year in advance), (vi) in a company in which the work plan of the internal auditor is approved by the board – examining the work plan before it is submitted to the board and suggesting revisions, (vii) assessing the company’s internal audit system and the performance of its internal auditor and whether the internal auditor has the resources and tools required to it for the performance of its role, taking into account, among others, the special needs and size of the company, (viii) examining the scope of work and compensation of the company’s independent auditor and (ix) setting procedures in connection with the method of dealing with complaints of employees regarding defects in the management of the company’s business and with the protection that will be provided to employees who have complained.
The actions and transactions that require audit committee approval pursuant to the Companies Law are: (i) proposed extraordinary transactions to which we intend to be a party in which an office holder has a direct or indirect personal interest, (ii) actions or arrangements which may otherwise be deemed to constitute a breach of fiduciary duty or of the duty of care of an office holder to us, (iii) certain transactions and extraordinary transaction of the company in which a “controlling shareholder,” that is, a shareholder holding the ability to direct the actions of the company, other than by virtue of being a director or holding a position with the company, including a shareholder holding twenty five percent or more of the voting rights of the company if there is no other shareholder holding over fifty percent of the voting rights of the company, has a personal interest, including certain transactions with a relative of the controlling shareholder and (iv) certain private placements of the company’s shares. In certain circumstances, some of the matters referred to above may also require shareholder approval. For more information concerning the approvals required in connection with transactions in which a controlling shareholder has a personal interest, see “Item 10.B: Memorandum of Association and Second Amended and Restated Articles.”
An audit committee may not approve an action or transaction with a controlling shareholder or with an office holder or in which they have a personal interest unless at the time of approval its composition is as required by the Companies Law.
Our Audit Committee assists our Board in fulfilling its legal and fiduciary obligations in matters involving our accounting, auditing, financial reporting, internal control and legal compliance functions by approving the services performed by our independent accountants and reviewing their reports regarding our accounting practices and systems of internal accounting controls. Under the Sarbanes-Oxley Act of 2002, the Audit Committee is also responsible for the appointment, compensation, retention and oversight of our independent accountants and takes those actions as it deems necessary to satisfy itself that the accountants are independent of management. However, under the Companies Law the appointment of independent auditors requires the approval of our shareholders, accordingly, the appointment of the independent auditors is approved and recommended to the shareholders by our Audit Committee and Board and ratified by the shareholders. Furthermore, pursuant to our Articles, our shareholders have the authority to determine the compensation of the independent auditors (or empower the Board to establish their remuneration, as they have in the 2021 Shareholders Meeting) and such compensation is approved by our Board following a recommendation of the Audit Committee.
The Audit Committee discussed with the independent registered public accounting firm the matters covered by Statement on Auditing Standards No. 114, as well as their independence, and was satisfied as to the independent registered public accounting firm’s compliance with said standards.
Compensation Committee
The Companies Law requires the board of directors of a public company to appoint a compensation committee that shall consist of no less than three members, that will include all of external directors (which will constitute a majority of its members of the committee), and that the remainder of the members of the compensation committee be directors whose terms of service and employment were determined pursuant to the Compensation Regulations. In addition, the Companies Law imposes the same restrictions on the actions and membership in the compensation committee as are discussed above under “Audit Committee” with respect to, among other things, the requirement that an external director serve as the chairman of the committee and the list of persons who may not serve on the committee. Our Compensation Committee currently consists of Dr. Michael J. Anghel, who is also the chairman of the Compensation Committee, Daniel Vaknin and Anita Leviant.
The Companies Law sets forth the roles of the compensation committee as follows: (i) to recommend to the board on a compensation policy for office holders and to recommend to the board, once every three years, on the approval of the continued validity of the compensation policy for a period that was determined for a period exceeding three years; (ii) to recommend to the board to update the compensation policy from time to time and to examine its implementation; (iii) to determine whether to approve the Terms of Service and Employment of office holders that require the committee’s approval; and (iv) to exempt a transaction from the requirement for shareholders approval (as more fully described below).
In February 2016, the Companies Law was amended to provide that an audit committee that meets the criteria for the composition of a compensation committee, such as our Audit Committee, can also act as the compensation committee.
Indemnification, Exemption and Insurance of Executive Officers and Directors
Consistent with and subject to the provisions of the Companies Law, our Articles permit us to procure insurance coverage for our office holders, exempt them from certain liabilities and indemnify them, to the fullest extent permitted by law.
The Israeli Securities Law, 5728-1968, or the Securities Law, and the Companies Law, authorize the Israeli Securities Authority to impose administrative sanctions against companies and their office holders for certain violations of the Israeli Securities Law or the Companies Law. These sanctions include monetary sanctions and certain restrictions on serving as a director or senior officer of a public company for certain periods of time. The maximum amount of the monetary sanctions that could be imposed upon individuals is a fine of NIS 1 million (equivalent to approximately €0.25 million), plus payments to persons who suffered damages as a result of the violation in an amount equal to the higher of: (i) compensation for damages suffered by all injured persons, up to 20% of the fine imposed on the violator, or (ii) the amount of profits earned or losses avoided by the violator as a result of the violation, up to the amount of the applicable monetary sanction.
The aforementioned provisions of the Companies Law and the Securities Law generally provide that a company cannot indemnify or provide liability insurance to cover monetary sanctions. However, these provisions do permit reimbursement by indemnification and insurance of specific liabilities. Specifically, legal expenses (including attorneys’ fees) incurred by an individual in the applicable administrative enforcement proceeding and any compensation payable to injured parties for damages suffered by them as described in clause (i) of the immediately preceding paragraph are permitted to be reimbursed via indemnification or insurance, provided that such reimbursements are permitted by the company’s articles of association.
Indemnification
As permitted by the Companies Law, our Articles provide that we may indemnify an office holder in respect of a liability or expense which is imposed on him or incurred by him as a result of an action taken in his capacity as an office holder of the Company in connection with the following:
| a. | monetary liability imposed on the office holder in favor of a third party by a judgment, including a settlement or a decision of an arbitrator which is given the force of a judgment by court order; |
| b. | reasonable litigation expenses, including legal fees, incurred by the office holder as a result of an investigation or proceeding instituted against such office holder by a competent authority, which investigation or proceeding has ended without the filing of an indictment or in the imposition of financial liability in lieu of a criminal proceeding, or has ended in the imposition of a financial obligation in lieu of a criminal proceeding for an offence that does not require proof of criminal intent (the phrases “proceeding that has ended without the filing of an indictment” and “financial obligation in lieu of a criminal proceeding” shall have the meanings ascribed to such phrases in Section 260(a)(1a) of the Companies Law) or in connection with an administrative enforcement proceeding or a financial sanction. Without derogating from the generality of the foregoing, such expenses will include a payment imposed on the office holder in favor of an injured party as set forth in Section 52[54](a)(1)(a) of the Securities Law, and expenses that the office holder incurred in connection with a proceeding under Chapters H’3, H’4 or I’1 of the Securities Law or in connection with Article D of Chapter Four of Part Nine of the Companies Law, including reasonable legal expenses, which term includes attorney fees; |
| c. | reasonable litigation expenses, including legal fees, which the office holder has incurred or is obliged to pay by the court in proceedings commenced against him by the Company or in its name or by any other person, or pursuant to criminal charges of which he is acquitted or criminal charges pursuant to which he is convicted of an offence which does not require proof of criminal intent; and |
| d. | Expenses, including reasonable legal fees, including attorney fees, incurred by the office holder with respect to a proceeding in accordance with the Restrictive Trade Practices Law, 1988, as amended, or the Restrictive Trade Practices Law. |
Our Articles authorize us, from time to time and subject to any provision of the law, to undertake in advance to indemnify an office holder for any of the following: (i) any liability as set out in (a) above, provided that the undertaking to indemnify is limited to the classes of events which in the opinion of our Board can be anticipated in light of our activities at the time of giving the indemnification undertaking, and for an amount and/or criteria which our Board has determined are reasonable in the circumstances and, the events and the amounts or criteria that our Board deem reasonable in the circumstances at the time of giving of the undertaking are stated in the undertaking; (ii) any liability stated in (b) through (d) above; and any matter permitted by applicable law. Our Articles also authorize us to indemnify an office holder after the occurrence of the event which is the subject of the indemnity and with respect to any matter permitted by applicable law.
At our annual shareholders meeting held on June 21, 2018, or the 2018 Shareholders Meeting, our shareholders authorized us to revise the indemnification, insurance and exemption provisions of our Articles and further authorized us, following the approval of our Compensation Committee and Board of Directors, to provide amended indemnification undertakings and exemption to each of our current and future office holders. At our 2021 Shareholders Meeting, our shareholders approved, with the requisite special majority, the grant and extension of indemnification undertakings to our office holders who may be deemed to be “controlling shareholders” (currently Messrs. Nehama and Fridrich).
The indemnification undertakings provided by us are limited to certain categories of events and the aggregate indemnification amount that we shall pay (in addition to sums payable by insurance companies) for monetary liabilities imposed on, or incurred by, the director or officer pursuant to all the indemnification undertakings issued by us to our directors and officers is also limited. Under the indemnification undertakings provided by us prior to the 2018 Shareholders Meeting, the aggregate indemnification amount payable by us for monetary liabilities may not exceed an amount equal to the higher of: (i) fifty percent (50%) of our net equity at the time of indemnification, as reflected on our most recent financial statements at such time, or (ii) our annual revenue in the year prior to the time of indemnification. Under the indemnification undertakings provided by us subsequent to the 2018 Shareholders Meeting and in line with the limitation currently included in our Compensation Policy, the aggregate indemnification amount payable by us for monetary liabilities, shall not exceed an amount equal to 25% of our shareholders’ equity according to the latest reviewed or audited consolidated financial statements approved by our Board of Directors prior to the date on which the indemnification amount is paid. Our previous form of indemnification undertaking is attached hereto as Exhibit 4.3 and our current form of indemnification undertaking and exemption, granted to office holders commencing the 2018 Shareholders Meeting, is attached hereto as Exhibit 4.4, both under “Item 19: Exhibits.”
In such indemnification undertakings, we also, among other things, undertake to (i) produce collateral, security, bond or any other guarantee that the director or officer may be required to produce as a result of any interim legal procedure (other than criminal procedures involving the proof of criminal thought), all up to the maximum indemnification amount set forth above; and (ii) maintain a liability insurance policy with a reputable insurer to the extent permitted by the Companies Law, for all of our directors and officers, in a total amount of not less than $10 million during the period the recipient of the indemnity undertaking serves as a member of our board of directors or as an officer and for a period of seven years thereafter.
Based on the previous approvals of our Audit and Compensation Committee, Board and shareholders, we granted indemnification undertakings as explained above to each of our office holders and expect that we will provide them to our future office holders.
Exemption
Under the Companies Law, an Israeli company may not exempt an office holder from liability for a breach of his duty of loyalty, but may exempt in advance an office holder from his liability to the company, in whole or in part, for a breach of his duty of care, provided that in no event shall a director be exempt from any liability for damages caused as a result of a breach of his duty of care to the company in the event of a “distribution” (as defined in the Companies Law). Our Articles authorize us to, subject to the provisions of the Companies Law, exempt an office holder from all or part of such office holder’s responsibility or liability for damages caused to us due to any breach of such office holder’s duty of care towards us.
At our 2018 Shareholders Meeting, our shareholders authorized an amendment to our Articles, in line with the limitation currently included in our Compensation Policy, providing that we may not, subsequent to the 2018 Shareholders Meeting, grant exemption letters to office holders for an action or transaction in which a controlling shareholder (as such term is defined in the Companies Law) or any other office holder (including an office holder who is not the office holder we have undertaken to exempt) has a personal interest (as such term is defined in the Companies Law). At our 2018 Shareholders Meeting, our shareholders also approved a new form of Indemnification Undertaking and Exemption to be granted to all of our current and future office holders, which includes the foregoing limitation and further provides that no exemption will be granted in respect of any counterclaim of the Company filed against the office holder in response to a claim filed by the office holder against the Company, except if the office holder’s claim relates to his or her labor law rights and/or his or her individual employment agreement with the Company or any of its subsidiaries.
As noted above, we granted the new form of Indemnification Undertaking and Exemption to all our current directors and officers and intend to provide it to our future directors and officers.
Insurance
As permitted by the Companies Law, our Articles provide that we may enter into an agreement for the insurance of the liability of an office holder, in whole or in part, with respect to any liability which may imposed upon such office holder as a result of an act performed by same office holder in his capacity as an office holder of the Company, for any of the following: (a) a breach of a cautionary duty toward the Company or toward another person; (b) a breach of a fiduciary duty toward the Company, provided the office holder acted in good faith and has had reasonable ground to assume that the act would not be detrimental to the Company; (c) a monetary liability imposed upon an office holder toward another; (d) reasonable litigation expenses, including attorney fees, incurred by the office holder as a result of an administrative enforcement proceeding instituted against him (without derogating from the generality of the foregoing, such expenses will include a payment imposed on the office holder in favor of an injured party as set forth in Section 52[54](a)(1)(a) of the Securities Law and expenses that the office holder incurred in connection with a proceeding under Chapters H’3, H’4 or I’1 of the Securities Law or in connection with Article D of Chapter Four of Part Nine of the Companies Law, including reasonable legal expenses, which term includes attorney fees); and (e) expenses, including reasonable litigation expenses, including attorney fees, incurred by the office holder with respect to a proceeding in accordance with the Restrictive Trade Practices Law. Our Articles further permit us to enter into such an agreement with respect to any other matter in respect of which it is permitted or will be permitted under applicable law to insure the liability of an office holder in the Company.
As stated above, in the indemnification undertakings approved by our Audit and Compensation Committee, Board and shareholders and provided to our directors and officers, we have undertaken to maintain a liability insurance policy with a reputable insurer to the fullest extent currently permitted by the Companies Law and our Articles, for all of our directors and officers, in a total amount of not less than $10 million during the period the recipient of the indemnity undertaking serves as a member of our board of directors or as an officer, and for a period of seven years thereafter.
The current coverage of our directors’ and officers’ liability insurance policy is $15 million. At our 2020 Annual Meeting, our shareholders approved and ratified, following the approval of our Compensation Committee and Board, the terms and conditions for the purchase, renewal, extension and/or replacement, from time to time, of our directors’ and officers’ liability insurance policy for all current and future directors and officers (including office holders who may be deemed to be controlling shareholders, within the meaning of the Companies Law) as follows: (i) the coverage limit per claim and in the aggregate under the policy may not exceed $15 million; (ii) the premium paid for such policy may be up to $800,000 per year, and (iii) our Compensation Committee is and will be authorized to increase coverage and/or premiums above the maximums set forth in the resolution by up to 30% in any year, as compared to the previous year, or cumulatively for a number of years, without additional shareholders’ approval. Based on these approvals, we have obtained directors’ and officers’ liability insurance covering our directors and officers. Our Compensation Policy provides that our office holders will be covered by a Directors and Officers insurance liability policy, to be periodically purchased us, subject to the requisite approvals under the Companies Law, including run-off insurance for a period of up to seven years, and that the coverage limit per claim and in the aggregate under the policy may not exceed $15 million and our Compensation Committee is and will be authorized to increase coverage by up to 30% in any year, as compared to the previous year.
In addition, the Relief Regulations provide that in the event the compensation committee and board of an Israeli public company determine that the insurance provided to our office holders who are deemed to be controlling shareholders or to the chief executive officer is: (i) upon terms identical to those provided to the company’s other officers and directors, (ii) on market conditions, and (iii) not likely to materially affect the company’s profitability, assets or liabilities, the approval of shareholders for the provision of liability insurance to such office holders is not required.
Limitations on Indemnification, Exemption and Insurance
The Companies Law provides that a company may not exempt or indemnify an office holder nor enter into an insurance contract which would provide coverage for liability incurred as a result of any of the following: (a) a breach by the office holder of his or her duty of loyalty (however, a company may insure and indemnify against such breach if the office acted in good faith and had reasonable cause to assume that his act would not prejudice the company’s interests); (b) a breach by the office holder of his or her duty of care if the breach was done intentionally or recklessly, unless made in negligence only; (c) any act or omission done with the intent to derive an illegal personal benefit; or (d) any fine, civil fine, monetary sanction or penalty levied against the office holder. According to the Securities Law, a company cannot insure or indemnify an office holder for an Administrative Enforcement procedure, regarding payments to victims of the infringement or for expenses expended by the officer with respect to certain proceedings held concerning him or her, including reasonable litigation expenses and legal fees.
Internal Auditor
Under the Companies Law, our Board is required to appoint an internal auditor proposed by the Audit Committee. The role of the internal auditor is to examine, among other things, whether our activities comply with the law and orderly business procedure. The internal auditor may not be an interested party or office holder, or a relative of any interested party or office holder, and may not be a member of our independent auditor firm. The Companies Law defines the term “interested party” to include a person who holds 5% or more of the company’s outstanding share capital or voting rights, a person who has the right to appoint one or more directors or the general manager, or any person who serves as a director or as the general manager. Pursuant to our Articles, our Audit Committee reviews and approves the work program of our internal auditor. Mr. Doron Cohen of Fahn, Kanne & Co., an Israeli accounting firm, serves as our internal auditor.
D. Employees
As of December 31, 2021 we had 20 employees, as of December 31, 2020 we had 18 employees and as of December 31, 2019 we had 11 employees. As of December 31, 2021, 11 employees were located in Israel, all in management, finance and administration positions, one employee, serving as project manager, was located in Spain and eight employees are located in the Netherlands, all engaged in the administration and operation of our WtE Plants.
All of our employees who have access to confidential information are required to sign a non-disclosure agreement covering all of our confidential information that they might possess or to which they might have access.
We believe our relations with employees are satisfactory. We have never experienced a strike or work stoppage. We believe our future success will depend, in part, on our ability to continue to attract, retain, motivate and develop highly qualified personnel.
Israeli labor laws and regulations are applicable to our employees located in Israel. Israeli labor laws govern, among other things, the length of the workday, minimum wages for employees, procedures for hiring and dismissing employees, annual leave and sick days. In addition, the Israeli Severance Pay Law, 1963, or the Severance Pay Law, generally requires the payment of severance pay equal to one month’s salary, based on the most recent salary, for each year of employment or a prorated portion thereof upon the termination of employment of an employee. Unless otherwise indicated in the employment agreement or otherwise required by applicable law and labor orders, the employee is not entitled to severance pay in the event she or he willingly resigns. In order to fund, or partially fund as hereinafter explained, any future liability in connection with severance pay, we make payments equal to 8.33% of the employee’s salary every month, to various managers’ insurance policies or similar financial instruments.
In the event the employment agreement with an employee provides that the provisions of Section 14 of the Severance Pay Law will apply, our contributions for severance pay are in lieu of our severance liability and the employee is entitled to receive such contributions whether her or his employment is terminated by us or she or he resigns. Therefore, upon fulfillment of our obligation to make a monthly contribution to the managers’ insurance policies or similar financial instruments in the amount of 8.33% of the employee’s monthly salary and of the other terms of the relevant permit with respect to this arrangement, no additional payments must later be made to the employee on account of severance pay upon termination of the employment relationship. As required by Israeli law, our employees are also provided with a contribution toward their retirement that amounts to 12.5% of wages, of which the employee contributes 6%. Furthermore, Israeli employees and employers are required to pay predetermined sums to the National Insurance Institute, which is similar to the United States Social Security Administration, and additional sums towards compulsory health insurance.
E. Share Ownership
Beneficial Ownership of Executive Officers and Directors
The following table sets forth certain information regarding the beneficial ownership of our ordinary shares as of March 1, 2022, of (i) each of our directors and (ii) each member of our senior management. All of the information with respect to beneficial ownership of the ordinary shares is given to the best of our knowledge and has been furnished in part by the respective directors and members of senior management.
| | Number of Shares
Beneficially Held (1) | | |
| | | | | |
Shlomo Nehama(2)(4) | | 3,588,577 | | 27.9% |
Ran Fridrich(3)(4) | | 2,605,845 | | 20.3% |
Ehud Gil(5) | | 666 | | * |
Anita Leviant(5) | | 3,000 | | * |
Dr. Michael J. Anghel(5) | | 2,500 | | * |
Daniel Vaknin(5) | | 583 | | * |
| | - | | - |
Ori Rosenzweig
| | - | | - |
| Yehuda Saban | | - | | - |
______________________________
* Less than one percent of the outstanding ordinary shares. See additional details below.
| 1. | As used in this table, “beneficial ownership” means the sole or shared power to vote or direct the voting or to dispose or direct the disposition of any security. For purposes of this table, a person is deemed to be the beneficial owner of securities that can be acquired within 60 days from March 1, 2022 through the exercise of any option or warrant. Ordinary shares subject to options or warrants that are currently exercisable or exercisable within 60 days are deemed outstanding for computing the ownership percentage of the person holding such options or warrants, but are not deemed outstanding for computing the ownership percentage of any other person. The amounts and percentages are based upon 12,849,295 ordinary shares outstanding as of March 1, 2022. This number of outstanding ordinary shares does not include a total of 258,046 ordinary shares held at that date as treasury shares under Israeli law, all of which were repurchased by us. For so long as such treasury shares are owned by us they have no rights and, accordingly, are neither eligible to participate in or receive any future dividends which may be paid to our shareholders nor are they entitled to participate in, be voted at or be counted as part of the quorum for, any meetings of our shareholders.
|
| 2. | According to information provided by the holders, the 3,588,577 ordinary shares beneficially owned by Mr. Nehama consist of: (i) 3,123,604 ordinary shares held by Nechama Investments, an Israeli company, which constitute approximately 24.3% of our outstanding ordinary shares, and (ii) 464,973 ordinary shares held directly by Mr. Nehama, which constitute approximately 3.6% of our outstanding ordinary shares. Mr. Nehama, as the sole officer, director and shareholder of Nechama Investments, may be deemed to indirectly beneficially own any ordinary shares beneficially owned by Nechama Investments, which constitute (together with the shares held directly by him) approximately 27.9% of our outstanding ordinary shares.
|
| 3. | The 2,605,845 ordinary shares beneficially owned by Mr. Fridrich consist of ordinary shares held by Kanir, which constitute approximately 20.3% of our outstanding share capital. Mr. Fridrich is one of two board members and a shareholder of Kanir Investments Ltd., or Kanir Ltd., the general partner in Kanir, and by virtue of his position with Kanir Ltd. may be deemed to indirectly beneficially own the ordinary shares beneficially owned by Kanir. Mr. Fridrich disclaims beneficial ownership of the shares held by Kanir, except to the extent of his pecuniary interest therein, if any.
|
| 4. | By virtue of the 2008 Shareholders Agreement between Nechama Investments and Kanir (see “Item 7.A: Major Shareholders”), Mr. Nehama, Nechama Investments, Kanir and Mr. Fridrich may be deemed to be members of a group that holds shared voting power with respect to 5,729,449 ordinary shares, which constitute approximately 44.6% of our outstanding ordinary shares, and holds shared dispositive power with respect to 5,232,201 ordinary shares, which constitute 40.7% of our outstanding ordinary shares. Accordingly, taking into account the shares directly held by Mr. Nehama, he may be deemed to beneficially own approximately 48.2% of our outstanding ordinary shares. Mr. Nehama and Nechama Investments both disclaim beneficial ownership of the ordinary shares beneficially owned by Kanir and Kanir Ltd., Kanir and Mr. Fridrich disclaim beneficial ownership of the shares held by Nechama Investments.
|
| 5. | (i) Ehud Gil holds currently exercisable options to purchase 666 ordinary shares with an expiration date of December 17, 2030 and an exercise price per share of $34.44, (ii) Anita Leviant holds currently exercisable options to purchase 2,000 ordinary shares with expiration dates ranging from August 1, 2028 to August 1, 2030 and exercise prices per share ranging between $8.95 - $26.63, (iii) Dr. Michael J. Anghel holds currently exercisable options to purchase 2,500 ordinary shares with an expiration dates ranging from January 24, 2029 to August 1, 2030 and exercise prices per share ranging between $8.41 - $26.63, and (iv) Daniel Vaknin holds currently exercisable options to purchase 583 ordinary shares with an expiration date of December 30, 2030 and an exercise price per share of $34.3. |
Our directors currently hold, in the aggregate, options to purchase 10,749 ordinary shares. The options have a weighted average exercise price of approximately $23.2 per share and have expiration dates until 2031. During the years ended December 31, 2019, 2020 and 2021 Anita Leviant, a member of our Board, was granted options to purchase 1,000 shares (on August 1 of each of such years) under the 1998 Plan. Dr. Michael J. Anghel, an external director, was granted options to purchase 500 shares upon his appointment as external director and additional awards of options to purchase 1,000 shares on each of August 1, 2019. 2020 and 2021. Daniel Vaknin, an external director, was granted options to purchase 583 shares upon his appointment as external director and Ehud Gil, a member of our Board, was granted options to purchase 666 shares on the date of our 2020 Extraordinary Meeting (calculated based on the date of his appointment as a member of our Board) and each received an additional grant of options to purchase 1,000 ordinary shares on August 1, 2021. The exercise price for the underlying shares of such options is the “Fair Market Value” (as defined in the 1998 Plan) of our ordinary shares at the date of grant. The options expire ten years after their grant date. As described above under “Compensation - Compensation of Non-Executive Directors”, the options granted to our directors vest on the first anniversary of the grant date, provided that the recipient is a member of our Board on such anniversary. Of the options held by our directors, options to purchase 6,749 ordinary shares are currently exercisable and options to purchase 4,000 ordinary shares will become exercisable on August 1, 2022.
During 2020 and 2021, Ms. Leviant and Mr. Bignitz (our former external director) exercised options to purchase 8,000 ordinary shares and 7,583 ordinary shares, respectively.
In June 2019, we granted options to purchase 9,869 ordinary shares to Mr. Ori Rosenzweig, our Chief Investment Officer. The options vest in equal installments on an annual basis over a period of three years and have an exercise price of $11.19 per ordinary share. In October 2019, Mr. Rosenzweig exercised the vested portion of these options. In November 2021, we granted each of Kalia Rubenbach, Ori Rosenzweig and Yehuda Saban (through the consulting company owned by him) options to purchase 9,000 ordinary shares. These options vest in equal installments on an annual basis over a period of three years and have an exercise price of $29.36 per ordinary share.
Outstanding Options
1998 Share Option Plan for Non-Employee Directors
For more information concerning our 1998 Share Option Plan for Non-Employee Directors see “Item 6.B: Compensation.”
As of January 1, 2021, December 31, 2021 and March 1, 2022, there were 29,667, 26,667 and 26,667 ordinary shares, respectively, available for future grants under the 1998 Plan.
2000 Stock Option Plan
In 2000, we adopted the 2000 Stock Option Plan, or the 2000 Plan, to provide for grants of service and non-employee options to purchase ordinary shares to our officers, employees, directors and consultants. The 2000 Plan provides that it may be administered by the Board, or by a committee appointed by the Board, and is currently administered by our Board.
As amended, the 2000 Plan provides for the issuance of 1,772,459 ordinary shares. During 2008 we repurchased options to acquire approximately 990,000 ordinary shares from employees and such options were canceled, decreasing the amount of shares reserved for issuance the 2000 Plan. The 2000 Plan, as amended, currently terminates on August 31, 2028.
Our Board has broad discretion to determine the persons entitled to receive options under the 2000 Plan, the terms and conditions on which options are granted, and the number of ordinary shares subject thereto. Our Board delegated to our management its authority to issue ordinary shares issuable upon exercise of options under the 2000 Plan. The exercise price of the options under the 2000 Plan is determined by our Stock Option and Compensation Committee, provided, however, that the exercise price of any option granted shall not be less than eighty percent (80%) of the stock value at the date of grant of such options. The stock value at any time is equal to the then current fair market value of our ordinary shares. For purposes of the 2000 Plan (as amended), the fair market value means, as of any date, the last reported closing price of the ordinary shares on such principal securities exchange on the most recent prior date on which a sale of the ordinary shares took place.
Our Board determines the term of each option granted under the 2000 Plan, including the vesting period; provided, however, that the term of an option shall not be for more than 10 years. Unless otherwise agreed by the parties, upon termination of employment, all unvested options lapse, and generally within three months from such termination all vested but not-exercised options shall lapse.
The options granted are subject to restrictions on transfer, sale or hypothecation. Options and ordinary shares issuable upon the exercise of options granted to our Israeli employees are held in a trust until the payment of all taxes due with respect to the grant and exercise (if any) of such options.
We have elected the benefits available under the “capital gains” alternative of Section 102 of the Israeli Income Tax Ordinance [New Version], 1961, or the Israeli Income Tax Ordinance. Pursuant to this election, capital gains derived by employees arising from the sale of shares acquired as a result of the exercise of options granted to them under Section 102, will be subject to a flat capital gains tax rate of 25% (instead of the gains being taxed as salary income at the employee’s marginal tax rate). However, as a result of this election, we will no longer be allowed to claim as an expense for tax purposes the amounts credited to such employees as a benefit when the related capital gains tax is payable by them, as we were previously entitled to do. We may change the election from time to time, as permitted by the Israeli Income Tax Ordinance. There are various conditions that must be met in order to qualify for these benefits, including registration of the options in the name of a trustee, or the Trustee, for each of the employees who is granted options. Each option, and any ordinary shares acquired upon the exercise of the option, must be held by the Trustee for a period commencing on the date of grant and ending no earlier than 24 months after the date of grant.
As of March 1, 2022, there were options to purchase 37,935 ordinary shares outstanding under the 2000 Plan. The number of additional ordinary shares available for issuance under the 2000 Plan, as of January 1, 2021, December 31, 2021 and March 1, 2022, was 580,206, 547,206 and 547,206.
ITEM 7: Major Shareholders and Related Party Transactions
A. Major Shareholders
The following table sets forth information regarding the beneficial ownership of our ordinary shares as of March 1, 2022, by each person known by us to be the beneficial owner of 5.0% or more of our ordinary shares. Each of our shareholders has identical voting rights with respect to its shares. All of the information with respect to beneficial ownership of the ordinary shares is given to the best of our knowledge based on public filings by the shareholders (and on information provided by them).
| | | Ordinary Shares
Beneficially Owned(1) | | | Percentage of Ordinary Shares Beneficially Owned | |
| | | | | | | |
Shlomo Nehama (2)(4)(5) | | | 3,588,577 | | | | 27.9 | % |
Kanir Joint Investments (2005) Limited Partnership (3)(4)(5) | | | 2,605,845 | | | | 20.3 | % |
Yelin Lapidot Holdings Management Ltd.(6) | | | 1,735,076 | | | | 13.5 | % |
Clal Insurance Enterprises Holdings Ltd.(7) | | | 1,309,752 | | | | 10.1 | % |
___________________________
| (1) | As used in this table, “beneficial ownership” means the sole or shared power to vote or direct the voting or to dispose or direct the disposition of any security as determined pursuant to Rule 13d-3 promulgated under the U.S. Securities Exchange Act of 1934, as amended. For purposes of this table, a person is deemed to be the beneficial owner of securities that can be acquired within 60 days from March 1, 2022 through the exercise of any option or warrant. Ordinary shares subject to options or warrants that are currently exercisable or exercisable within 60 days are deemed outstanding for computing the ownership percentage of the person holding such options or warrants, but are not deemed outstanding for computing the ownership percentage of any other person. The amounts and percentages are based on a total of 12,849,295 ordinary shares outstanding as of March 1, 2022. This number of outstanding ordinary shares does not include a total of 258,046 ordinary shares held at that date as treasury shares under Israeli law, all of which were repurchased by us. For so long as such treasury shares are owned by us they have no rights and, accordingly, are neither eligible to participate in or receive any future dividends which may be paid to our shareholders nor are they entitled to participate in, be voted at or be counted as part of the quorum for, any meetings of our shareholders. |
| (2) | The 3,588,577 ordinary shares beneficially owned by Mr. Nehama consist of: (i) 3,123,604 ordinary shares held by Nechama Investments, which constitute approximately 24.3% of our outstanding ordinary shares and (ii) 464,973 ordinary shares and held directly by Mr. Nehama, which constitute approximately 3.6% of our outstanding ordinary shares. Mr. Nehama, as the sole officer, director and shareholder of Nechama Investments, may be deemed to indirectly beneficially own any ordinary shares owned by Nechama Investments, which constitute (together with his shares) approximately 27.9% of our outstanding ordinary shares. |
| (3) | Kanir is an Israeli limited partnership. Kanir Ltd., in its capacity as the general partner of Kanir, has the voting and dispositive power over the ordinary shares directly beneficially owned by Kanir. As a result, Kanir Ltd. may be deemed to indirectly beneficially own the ordinary shares beneficially owned by Kanir. Mr. Ran Fridrich, who is a member of our Board of Directors and our Chief Executive Officer and Ms. Anat Raphael, the sister of Mr. Ehud Gil, who is a member of our Board of Directors, are the sole directors of Kanir Ltd. As a result, Mr. Fridrich and Ms. Raphael may be deemed to indirectly beneficially own the ordinary shares beneficially owned by Kanir. In addition, the estate of Mr. Raphael, who passed away in December 2020, is the majority shareholder of Kanir Ltd. and beneficially owns 254,524 ordinary shares, which constitute approximately 2% of our outstanding shares and which constitute, together with Kanir’s holdings, approximately 22.3% of our outstanding ordinary shares. Each of Kanir Ltd., Mr. Fridrich and Ms. Raphael disclaims beneficial ownership of such ordinary shares except to the extent of their respective pecuniary interest therein, if any. |
| (4) | By virtue of the 2008 Shareholders Agreement, Mr. Nehama, Nechama Investments, Kanir, Kanir Ltd., and Messrs. Fridrich and Gil may be deemed to be members of a group that holds shared voting power with respect to 5,729,449 ordinary shares, which constitute approximately 44.6% of our outstanding ordinary shares, and holds shared dispositive power with respect to 5,232,201 ordinary shares, which constitute 40.7% of our outstanding ordinary shares. Accordingly, taking into account the shares directly held by Mr. Nehama, he may be deemed to beneficially own approximately 48.2% of our outstanding ordinary shares. Each of Mr. Nehama and Nechama Investments disclaims beneficial ownership of the ordinary shares beneficially owned by Kanir. Each of Kanir, Kanir Ltd., Mr. Fridrich and Ms. Raphael disclaims beneficial ownership of the ordinary shares beneficially owned by Nechama Investments. A copy of the 2008 Shareholders Agreement was filed with the Securities and Exchange Commission, or the SEC, on March 31, 2008 as Exhibit 14 to an amendment to a Schedule 13D and is not incorporated by reference herein. |
| (5) | The information included in this table concerning the beneficial ownership of Nechama Investments, Kanir, Kanir Ltd., Messrs. Nehama and Fridrich, and Ms. Raphael is based on a Schedule 13D/A submitted on October 13, 2020 and on information provided by the shareholders. |
| (6) | Based on a Schedule 13G/A submitted on February 7, 2022 by Mr. Dov Yelin, Mr. Yair Lapidot, Yelin Lapidot Holdings Management Ltd., or Yelin Lapidot, and Yelin Lapidot Mutual Funds Management Ltd., or Yelin Lapidot Mutual. According to the Schedule 13G/A: (i) the securities reported therein are beneficially owned as follows: (a) 1,162,076 ordinary shares, which constitute approximately 9% of our outstanding ordinary shares, by mutual funds managed by Yelin Lapidot Mutual and (b) 573,000 ordinary shares, which constitute approximately 4.5% of our outstanding ordinary shares, by provident funds managed by Yelin Lapidot Provident Fund Management Ltd., or Yelin Lapidot Provident, (ii) both Yelin Lapidot Mutual and Yelin Lapidot Provident are wholly-owned subsidiaries of Yelin Lapidot and operate under independent management and make their own independent voting and investment decisions, and (iii) Messrs. Yelin and Lapidot each own 24.38% of the share capital and 25.004% of the voting rights of Yelin Lapidot, and are responsible for the day-to-day management of Yelin Lapidot. Pursuant to the Schedule 13G/A, any economic interest or beneficial ownership in any of the securities covered by the Schedule 13G/A is held for the benefit of the members of the provident funds or mutual funds, as the case may be, and each of Messrs. Yelin and Lapidot, Yelin Lapidot and wholly-owned subsidiaries of Yelin Lapidot, disclaims beneficial ownership of any such securities. |
| (7) | Based on a Schedule 13G/A submitted on February 10, 2022 by Clal Insurance Enterprises Holdings Ltd., or Clal. Based on the Schedule 13G/A, of the 1,309,752 ordinary shares reported as beneficially owned by Clal: (i) 118,390 ordinary shares, including 56,115 ordinary shares issuable upon the exercise of warrants to purchase ordinary shares that are exercisable within 60 days, are beneficially held for Clal’s own account and (ii) 1,191,362 ordinary shares are held for members of the public through, among others, provident funds and/or pension funds and/or insurance policies, which are managed by subsidiaries of Clal, which subsidiaries operate under independent management and make independent voting and investment decisions. Consequently, Clal notes in the Schedule 13G/A that the Schedule 13G/A will not constitute an admission that it is the beneficial owner of more than 118,390 ordinary shares. |
Significant Changes in the Ownership of Major Shareholders
On February 18, 2019, Mr. Itshak Sharon (Tshuva), Delek Group Ltd. and The Phoenix Holdings Ltd., or the Phoenix Reporting Persons, submitted a Schedule 13G to the SEC indicating that they beneficially own 895,618 ordinary shares, which at the time constituted approximately 8.39% of our outstanding ordinary shares. On February 18, 2020, the Phoenix Reporting Persons submitted an amendment to their Schedule 13G indicating that Mr. Sharon and Delek Group Ltd. no longer beneficially own any shares of our company and that The Phoenix Holdings Ltd., or The Phoenix, held, as of December 31, 2019, 750,314 ordinary shares, which at the time constituted approximately 6.5% of our outstanding ordinary shares. On February 18, 2020, we issued to The Phoenix and to an affiliated entity an aggregate of 75,000 ordinary shares and warrants to purchase an aggregated of 18,750 ordinary shares in connection with the February 2020 Private Placement. On October 14, 2020, The Phoenix submitted an amendment to its Schedule 13G indicating that it beneficially owned 630,053.49 ordinary shares, which at the time constituted approximately 4.98% of our outstanding ordinary shares. On January 25, 2021, The Phoenix submitted an amendment to its Schedule 13G indicating that it beneficially owned 642,163.49 ordinary shares, which at the time constituted approximately 5.07% of our outstanding ordinary shares. On February 3, 2021, The Phoenix submitted an amendment to its Schedule 13G indicating that it beneficially owned 460,517.49 ordinary shares, which at the time constituted approximately 3.64% of our outstanding ordinary shares. On July 22, 2021, The Phoenix submitted an amendment to its Schedule 13G indicating that it beneficially owned 659,156 ordinary shares, which at the time constituted approximately 5.13% of our outstanding ordinary shares. On December 6, 2021, The Phoenix submitted an amendment to its Schedule 13G indicating that it beneficially owned 579,253 ordinary shares, which at the time constituted approximately 4.51% of our outstanding ordinary shares.
On July 30, 2019, Mr. Dov Yelin, Mr. Yair Lapidot and Yelin Lapidot Holdings Management Ltd., or the Yelin Lapidot Reporting Persons, submitted a Schedule 13G to the SEC indicating that they beneficially own 642,318 ordinary shares, which at the time constituted approximately 5.6% of our outstanding ordinary shares. On January 9, 2020, the Yelin Lapidot Reporting Persons submitted an amendment to their Schedule 13G indicating that they beneficially own 1,168,953 ordinary shares, which at the time constituted approximately 10.2% of our outstanding ordinary shares. On February 2, 2021, the Yelin Lapidot Reporting Persons submitted an amendment to their Schedule 13G, indicating that as of December 31, 2020 they beneficially owned 1,456,332 ordinary shares, which at the time constituted approximately 11.51% of our outstanding ordinary shares. On February 7, 2022, the Yelin Lapidot Reporting Persons submitted an amendment to their Schedule 13G, indicating that as of December 31, 2021 they beneficially owned 1,735,076 ordinary shares, which at the time constituted approximately 13.5% of our outstanding ordinary shares.
On March 5, 2020, Clal submitted a Schedule 13G to the SEC indicating that they beneficially own 824,743 ordinary shares, which at the time constituted approximately 6.7% of our outstanding ordinary shares. On February 16, 2021, Clal submitted an amendment to its Schedule 13G indicating that on December 31, 2020 it beneficially owned 1,137,678 ordinary shares, which at the time constituted approximately 8.8% of our outstanding ordinary shares. On February 10, 2022, Clal submitted an amendment to its Schedule 13G indicating that on December 31, 2021 it beneficially owned 1,309,752 ordinary shares (including 56,115 ordinary shares underlying warrants that are exercisable within 60 days of December 31, 2021), which at the time constituted approximately 10.15% of our outstanding ordinary shares
On March 26, 2020, Harel Insurance Investments & Financial Services Ltd., or Harel, submitted a Schedule 13G to the SEC indicating that it beneficially owns 650,176 ordinary shares, which at the time constituted approximately 5.3% of our outstanding ordinary shares. On January 27, 2021 Harel submitted an amendment to its Schedule 13G, indicating that as of December 31, 2020 it beneficially owned 560,006 ordinary shares, which at the time constituted approximately 4.4% of our outstanding ordinary shares.
Based on information available to us and on an amendment to a Schedule 13D submitted to the SEC on November 13, 2019 by Kanir, Kanir Investments, Mr. Raphael, Mr. Fridrich, S. Nechama, Mr. Nehama, Bonstar Investments Ltd. or Bonstar, Mr. Joseph Mor and Mr. Ishay Mor, or the Kanir Reporting Persons, Kanir sold an aggregate of 180,552 ordinary shares, which represent 1.5% of our outstanding ordinary shares. Based on information available to us, during 2020, each of Messrs. Raphael and Fridrich sold 100,000 ordinary shares, which represent 0.8% of our outstanding ordinary shares. Based on an amendment to a Schedule 13D submitted by the Kanir Reporting Persons on October 13, 2020, Mr. Raphael sold an aggregate of 200,000 ordinary shares, Mr. Fridrich sold an aggregate of 116,787 ordinary shares and S. Nechama sold 428,265 ordinary shares. Based on information available to us, during 2021 Messrs. Mor sold an aggregate of 184,691 ordinary shares indirectly beneficially owned by them and Bonstar sold 148,567 ordinary shares held by it.
Record Holders
Based on a review of the information provided to us by our transfer agent, as of March 1, 2022, there were 28 record holders of ordinary shares, of which 9 represented United States* record holders holding approximately 54.6% of our outstanding ordinary shares (including approximately 54.5% of our outstanding ordinary shares held by the Depository Trust Company). This does not reflect persons or entities that hold ordinary shares in nominee or “street name” through various brokerage firms and does not reflect where the beneficial holders of our shares are located in part because the shares held by the Depository Trust Company include shares held for the Tel Aviv Stock Exchange Clearing House.
______________________
* Including the Depository Trust Company
2008 Shareholders Agreement
Pursuant to public filings made and information provided by Kanir and Nechama Investments and their affiliates, on March 24, 2008, Kanir and Nechama Investments entered into a shareholders agreement, or the 2008 Shareholders Agreement, with respect to their holdings of our ordinary shares. The following summary is based on public filings made by the parties to the 2008 Shareholders Agreement, which include a more detailed description of the 2008 Shareholders Agreement and a copy of such agreement and that are not incorporated by reference herein.
The parties to the 2008 Shareholders Agreement agreed to vote all our ordinary shares held by them as provided in the 2008 Shareholders Agreement. Where the 2008 Shareholders Agreement is silent as to a matter brought before our shareholders, the parties will agree in advance as to how they will vote. In the event that the parties do not reach an agreement regarding any such matter, they will vote all of their ordinary shares against such matter. In addition, the parties agreed to use their best efforts to amend our articles to require that, if so requested by at least two of our directors, certain matters, such as related party transactions and any material change in the scope of our business, will require the approval of a simple majority of the outstanding ordinary shares. At our annual shareholders meeting held on December 30, 2008, our shareholders approved the adoption of our Second Amended and Restated Articles, as requested by Kanir and Nechama Investments and that includes, among other things, the revisions contemplated in the 2008 Shareholders Agreement. For more information, see “Item 10.B: Memorandum of Association and Second Amended and Restated Articles.”
The parties to the 2008 Shareholders Agreement further agreed to use their best efforts to ensure that the composition of our Board will be in accordance with the agreements set forth therein.
The 2008 Shareholders Agreement also contains certain agreements with respect to the ordinary shares held by each party that constitute, from time to time, 25.05% of the outstanding ordinary shares and, in the aggregate, 50.1% of the outstanding ordinary shares (these shares are defined in the 2008 Shareholders Agreement as the Restricted Shares), including a lock-up period, right of first refusal, tag along and a buy/sell notice mechanism.
The parties to the 2008 Shareholders Agreement agreed not to enter into any additional voting or similar agreements with any of our other shareholders during the term of the 2008 Shareholders Agreement, which will be in effect so long as (i) the parties hold more than 50% of our outstanding ordinary shares or (ii) each of the parties holds all of its Restricted Shares (unless the lending bank of the parties to the 2008 Shareholders Agreement forecloses on its pledge on the Restricted Shares of either party, causing the immediate termination of the 2008 Shareholders Agreement).
Registration Rights
We previously executed various registration rights agreements with certain entities and individuals, including former controlling shareholders, in connection with private placements of our securities. Registration rights with respect to a majority of the ordinary shares held by our current controlling shareholders were assigned from certain holders of such registration rights to our controlling shareholders, subject to the undertaking of the assignees to be bound by and subject to the terms and conditions of the registration rights agreement. During 2014 we received a demand for registration from several shareholders, including our controlling shareholders, and filed a registration statement on Form F-3 with covering the resale of 6,421,545, or 52.7% of our ordinary shares, which became effective on November 17, 2014. During 2020, we received a second demand to maintain the registration statement effective pursuant to the terms of the registration rights agreement dated September 12, 2005. The registration of the shares included in this registration statement enable our controlling shareholders to sell a significant portion of our ordinary shares without restrictions, which could result in a change of control of Ellomay or in us ceasing to be a “controlled company” for purposes of the NYSE American LLC rules. For more information see “Item 16.G: Corporate Governance.”
B. Related Party Transactions
On December 30, 2008, following the approval of our Audit Committee, Board of Directors and shareholders, we entered into the Prior Management Services Agreement with Kanir and Meisaf, effective as of March 31, 2008, the date of appointment of Messrs. Fridrich and Nehama as members of our Board. The initial aggregate annual consideration paid to Kanir and Meisaf pursuant to the Prior Management Services Agreement was an amount of $250,000 plus value added tax pursuant to applicable law, paid in equal parts. This aggregate annual amount was increased to $400,000 in 2013.
The Prior Management Services Agreement was amended and extended at our annual shareholders meeting held on June 19, 2019, and was to remain in effect until the earlier of: (i) June 17, 2022, (ii) the termination of service of all of the Kanir and Nechama Investments nominees on our Board of Directors, (iii) a date that is six (6) months following the delivery of a written termination notice by Meisaf and Kanir to the Company or by the Company to Meisaf and Kanir, or (iv) the cessation of provision of Chairman and CEO services.
On November 12, 2020, Mr. Hemi Raphael, who provided Board services to us through Kanir pursuant to the Prior Management Services Agreement, resigned from our Board of Directors for personal reasons. Mr. Raphael passed away during December 2020. On March 29, 2021, our Audit and Compensation Committee discussed the materiality of the cessation of services previously provided by the late Mr. Raphael under the Prior Management Services Agreement through Kanir. The Audit and Compensation Committee resolved that in light of the change in scope of services from Kanir during the first quarter of 2021, the payment due to Kanir under the Prior Management Services Agreement at the end of the first quarter of 2021 will be reduced to 66%, taking into account the reduction in the scope of services and the continued provision of services by Mr. Fridrich during such period, including the appointment of Mr. Fridrich as a member of the Dorad Board of Directors, replacing late Mr. Raphael. The Audit and Compensation Committee further resolved that following receipt of a benchmark report regarding similar agreements and further discussions by the Audit and Compensation Committee, revisions to the Prior Management Services Agreement will be discussed and then presented for the approval of our shareholders. At a meeting held on June 22, 2021, our Audit Committee resolved to pay the reduced payment mentioned above also for the second quarter of 2021.
At our 2021 Shareholders Meeting, our shareholders approved the execution of the Management Services Agreement, among us, Kanir, Keystone and Meisaf, following the approvals of our Audit and Compensation Committee and our Board of Directors, effective July 1, 2021.
The Management Services Agreement provides, among other things, as follows:
| • | Meisaf, Kanir and Keystone, through their employees, officers and directors, will assist us in all aspects of the management of our company and advise as required from time to time by us; |
| • | The position of the CEO, held by Mr. Fridrich, is set at a full-time position and the position of the Chairman of the Board, held by Mr. Nehama, is set at no less than a 77% position; |
| • | The CEO services will be provided by Mr. Fridrich through Kanir and Keystone, and the Chairman services will be provided by Mr. Nehama through Meisaf; |
| • | Meisaf, Kanir and Keystone are entitled to receive reimbursement for reasonable out-of-pocket business expenses borne by them or any of their employees, directors or officers in connection with the provision of the services; |
| • | The management fees are as follows: (i) to Meisaf, an annual amount of NIS 1,386,000 (NIS 115,500 on a monthly basis) plus applicable VAT and (ii) to Kanir and Keystone, an aggregate annual amount of NIS 1,800,000 (NIS 150,000 on a monthly basis) plus applicable VAT, in an initial division of NIS 660,000 to Kanir and NIS 1,140,000 to Keystone or such other division as notified in writing to the Company by Kanir and Keystone. The management fee is the full and final compensation for the provision of the services and shall be in lieu of any and all payments that are due to the Service Providers as Board members, including the right to receive the options to purchase ordinary shares of the Company in accordance with the Company’s 1998 Share Option Plan for Non-Employee Directors; |
| • | The Management Services Agreement be in effect until the earlier of: (i) June 30, 2024, (ii) the termination of service of Messrs. Nehama and Fridrich on our Board of Directors, (iii) a date that is six (6) months following the delivery of a written termination notice by Meisaf, Kanir and Keystone to the Company or by the Company to Meisaf, Kanir and Keystone, or (iv) the cessation of provision of Chairman and CEO services. In the event only Meisaf ceases to provide services or only Keystone and Kanir cease to provide services, the Management Services Agreement will continue in full force and effect with respect to the other parties, mutatis mutandis; and |
| • | Kanir, Meisaf and Keystone serve as independent contractors of the Company and each of them is solely responsible to any payment it is required to pay its employees and representatives and undertake to indemnify the Company in the event the Company suffers any damage due to a determination that any of them or their affiliates are employees of the Company. |
For further information concerning the Management Services Agreement, see “Item 10.C: Material Contracts” and the Management Services Agreement included as Exhibit 4.18 under “Item 19: Exhibits.”
For a further discussion of transactions and balances with related parties see “Item 4.D: Property, Plants and Equipment” (with respect to the sublease of office space to a company controlled by Mr. Nehama), “Item 6.B: Compensation,” “Item 6.C: Board Practices” under “Indemnification, Exemption and Insurance of Executive Officers and Directors,” “Registration Rights” above and Note 15 to our consolidated financial statements, which are included elsewhere in this report.
C. Interests of Experts and Counsel
Not Applicable.
ITEM 8: Financial Information
A. Consolidated Statements and Other Financial Information.
Consolidated Statements
Our consolidated financial statements are set forth in Item 18.
Legal Proceedings
We may from time to time become a party to various legal proceedings in the ordinary course of our business. While the outcome of these matters cannot be predicted with certainty, we do not believe they will have a material effect on our consolidated financial position, results of operations, or cash flows. In addition, we are involved in various legal proceedings in connection with our holdings in Dori Energy and indirect holdings in Dorad. For more information see “Item 4.B: Business Overview” under “The Dorad Power Plant.”
Dividends
On March 18, 2015, our Board of Directors adopted a dividend distribution policy, or the Policy, pursuant to which we intend to distribute a dividend of up to 33% of our annual distributable profits each year, either by way of a cash dividend, a share buyback program or a combination of both. Distributions or the amount or method of the distribution pursuant to the Policy are not guaranteed and are subject to the specific approval of our Board of Directors, based on various factors they deem appropriate including, among others, our financial position, our outstanding liabilities and contractual obligations, prospective acquisitions, our business plan and the market conditions. In addition, as described herein, distributions are subject to the restrictions in the deeds of trust governing our Debentures. Our Board of Directors may, subject to the circumstances and conditions stated above, declare additional dividend distributions, change the rate of a specific distribution or cancel a distribution (either as a revision to the Policy or on a more temporary basis). In addition, our Board of Directors may, in its absolute discretion and at any time, revise, update or terminate the Policy. Prior to the adoption of the Policy, we did not have a dividend distribution policy or distribute cash dividends in the past.
In May 2015, our Board of Directors approved the repurchase of up to $3 million of our ordinary shares. The authorized repurchases will be made from time to time in the open market on the NYSE American LLC and Tel Aviv Stock Exchange or in privately negotiated transactions. The timing, volume and nature of share repurchases will be at the sole discretion of management and will be dependent on regulatory restrictions, market conditions, the price and availability of our ordinary shares, applicable securities laws and other factors, including compliance with the terms of our Debentures. No assurance can be given that any particular amount of ordinary shares will be repurchased. The buyback program does not obligate us to acquire a specific number of shares in any period, and it may be modified, suspended, extended or discontinued at any time, without prior notice. We repurchased 172,391 ordinary shares in the NYSE American LLC under this buyback program. On March 23, 2016, we announced the decision to distribute a cash dividend in the amount of $0.225 per share (an aggregate distribution of approximately $2.4 million). We distributed this dividend in April 2016. We did not declare or pay a cash dividend during 2017 and we did not repurchase any of our ordinary shares or declare or pay a cash dividend during 2018-2021.
The terms of the deeds of trust governing our Debentures restrict our ability to distribute dividends (for more information see “Item 5.B: Liquidity and Capital Resources” and “Item 10.C: Material Contracts”). In addition, under Israeli law, the payment of dividends is generally made from accumulated retained earnings or retained earnings accrued over a period of the last two years (after deducting prior dividends to the extent not already deducted from retained earnings), and in either case, provided there is no reasonable concern that the dividend will prevent the company from satisfying current or foreseeable obligations as they become due. Notwithstanding the foregoing, dividends may be paid with the approval of a court, provided that there is no reasonable concern that payment of the dividend will prevent us from satisfying our existing and foreseeable obligations as they become due.
B. Significant Changes
Except as otherwise disclosed in this Report, no significant changes have occurred since December 31, 2021.
ITEM 9: The Offer and Listing
A. Offer and Listing Details
Our ordinary shares are listed on the NYSE American LLC and the TASE under the symbol “ELLO.”
B. Plan of Distribution
Not Applicable.
C. Markets
Our ordinary shares have been listed on the NYSE American LLC since August 22, 2011. Our trading symbol is “ELLO.” On October 27, 2013, our ordinary shares were listed for trading on the Tel Aviv Stock Exchange under the symbol “ELLO.”
D. Selling Shareholders
Not Applicable.
E. Dilution
Not Applicable.
F. Expenses of the Issue
Not Applicable.
ITEM 10: Additional Information
A. Share Capital
Not Applicable.
B. Memorandum of Association and Second Amended and Restated Articles
Memorandum of Association and Second Amended and Restated Articles
Set forth below is a brief description of certain provisions contained in the Memorandum of Association, the Second Amended and Restated Articles, adopted by our shareholders at our general meeting held on December 30, 2008, as amended, as well as certain statutory provisions of Israeli law. The Memorandum of Association and the Articles are incorporated by reference herein. The description of certain provisions does not purport to be a complete summary of these provisions and is qualified in its entirety by reference to such exhibits and to Israeli law.
Authorized Share Capital
Our authorized share capital is one hundred seventy million (170,000,000) New Israeli Shekels, divided into seventeen million (17,000,000) ordinary shares, NIS 10.00 par value per share.
Due to the fact that we were incorporated prior to 1999, the year the Companies Law was enacted, a special majority of 75% of the shares voting on the matter is generally required in order to amend our Memorandum, however, pursuant to our Memorandum, changes to our capital structure, such as an increase in our authorized capital, only require the vote of a majority of the shares voting on the matter.
Purpose and Objective
We are a public company registered under the Companies Law as Ellomay Capital Ltd., registration number 52-003986-8. Pursuant to Article 3.1 of our Articles, our objective is to undertake any lawful activity, including any objective set forth in our Memorandum of Association. Pursuant to Article 3.2 of our Articles, our purpose is to operate in accordance with commercial considerations with the intentions of generating profits. In addition, we may contribute reasonable amounts for any suitable purpose even if such contributions do not fall within our business considerations. The Board may determine the amounts of the contributions, the purpose for which the contribution is to be made, and the recipients of any such contribution.
Board of Directors
Under the Companies Law, our Board is authorized to determine our strategy and supervise the performance of the duties and actions of our chief executive officer. Our Board may not delegate to a committee of the Board or the chief executive officer the right to decide on certain of the authorities vested in it, including determination of our strategy, distributions, certain issuances of securities and approval of financial reports. The powers conferred upon the Board are vested in the Board as a collective body and not in each one or more of the directors individually. Unless otherwise set forth in a resolution of the shareholders, our Articles provide that our Board shall consist of not less than four (4) nor more than eight (8) directors (including any external directors whose appointment is mandated under the Companies Law).
Pursuant to the Companies Law, publicly traded companies must appoint at least two external directors to serve on their board of directors and audit committee. For further information concerning external directors see “Item 6.C: Board Practices.”
The Companies Law codifies the fiduciary duties that an office holder has to a company. An office holder’s fiduciary duties consist of a duty of loyalty and a duty of care. For more information concerning these duties, the approval process of certain transactions and other board practices see “Item 6.C: Board Practices.”
Our directors cannot vote approve compensation to themselves or any members of their body without the approval of our compensation committee and our shareholders. For more details concerning the approval process of Terms of Service and Employment of office holders see “Item 6.C: Board Practices” under “Compensation Committee.” Borrowing powers exercisable by the directors are not specifically outlined in our Articles.
No person shall be disqualified to serve as a director by reason of his not holding our shares in. Additionally, our Articles do not provide for an age in which directors are required to retire.
Rights of Shareholders
No preemptive rights are granted to holders of our ordinary shares under the Articles or the Companies Law. Each ordinary share is entitled to one vote on all matters to be voted on by shareholders, including the election of directors.
The directors, other than external directors who are elected for three-year terms, are elected annually at a general meeting of shareholders and remain in office until the next annual meeting at which time they retire, unless their office is previously vacated as provided in the Articles. A retiring director may be reelected. If no directors are elected at the annual meeting, all of the retiring directors remain in office pending their replacement at a general meeting. Holders of the ordinary shares do not have cumulative voting rights in the election of directors. Consequently, the holders of ordinary shares in the aggregate conferring more than 50% of the voting power, represented in person or by proxy, will have the power to elect all the directors. On March 24, 2008, in connection with the purchase of a controlling interest of our ordinary shares, Nechama Investments and Kanir entered into the 2008 Shareholders Agreement. Under the 2008 Shareholders Agreement, both parties agreed to vote all of our shares held by them as provided in the agreement and, where the agreement is silent, as the parties shall agree prior to any meeting of our shareholders. In addition, the 2008 Shareholders Agreement provides that in the event the parties do not reach an agreement regarding certain resolution proposed to our shareholders meeting, the parties shall vote all of their shares against such proposed resolution. For further information with respect to the 2008 Shareholders Agreement, see “Item 7.A: Major Shareholders” under the caption “2008 Shareholders Agreement.”
Following the adoption of the Articles at our general meeting of shareholders held on December 30, 2008, Article 25.5 provides that for so long as the 2008 Shareholders Agreement is in effect, at the written request of any two directors with respect to any proposed action or transaction (including certain related party transactions, any amendments to our Memorandum of Association or Articles, any merger or consolidation of the Company, any material change in the scope of our business, the voluntary liquidation or dissolution of the Company, approval of annual budget or business plan and material deviations therefrom and any change in signatory rights on behalf of the Company), such action or transaction shall require the approval of our general meeting by a resolution supported by members present, in person or by proxy, vested with at least 50.1% of our outstanding shares, or by such higher approval threshold as may be required by Israeli law.
Chairman of the Board
Our Articles provide that our Chairman of the Board shall have no casting vote, unless (i) the Chairman of the Board is then Mr. Shlomo Nehama and (ii) Nechama Investments, together with any Affiliates (as defined in our Articles) thereof, then holds at least 25.05% of our outstanding shares. Our Articles further provide that, notwithstanding the foregoing, in case Mr. Shlomo Nehama elects to exercise his casting vote in respect of a specific resolution brought before our Board, or the Triggering Resolution, then (a) prior to such exercise, Nechama Investments shall be required to trigger the “Buy Me Buy You” mechanism set forth in the 2008 Shareholders Agreement as an Offering Party (as defined in the 2008 Shareholders Agreement), whereby the Triggering Resolution will be pending until the consummation of the sale of the Restricted Shares (as defined in the 2008 Shareholders Agreement) of one party to the 2008 Shareholders Agreement to the other party of the 2008 Shareholders Agreement in accordance with such “Buy Me Buy You” mechanism; and (b) in the event that three (3) of the members of our Board so require, the Triggering Resolution shall be conditioned upon the approval of our General Meeting pursuant to Article 25.1 of the Articles (requiring a special majority of 50.1% of our outstanding shares). Upon a transfer of the Restricted Shares by Kanir to third party in accordance with the terms of the 2008 Shareholders Agreement, the casting vote of the Chairman of the Board shall expire.
Dividends and Liquidation Rights
Our Board of Directors is authorized to declare dividends, subject to applicable law. Dividends may be paid only out of profits and other surplus, as defined in the Companies Law, as of the end of the most recent financial statements or as accrued over a period of two years, whichever is higher. Alternatively, if we do not have sufficient profits or other surplus, then permission to effect a distribution can be granted by order of an Israeli court. In any event, a distribution is permitted only if there is no reasonable concern that the distribution will prevent us from satisfying our existing and foreseeable obligations as they become due.
Upon recommendation by the Board, dividends may be paid, in whole or in part, by the distribution of certain of our specific assets, of our shares or debentures, or shares or debentures of any other company, or in any combination of such manners. Subject to special or restricted rights conferred upon the holders of shares as to dividends, if any, the dividends shall be distributed in accordance with our paid-up capital attributable to the shares for which the dividend has been declared. Our obligation to pay dividends or any other amount in respect of shares may be set-off against any indebtedness, however arising, liquidated or non-liquidated, of the person entitled to receive the dividend. Any dividend unclaimed within the period of seven years from the date stipulated for its payment shall be forfeited and returned to us, unless otherwise directed by our Board. In the event of the winding up of Ellomay, then, after satisfaction of liabilities to creditors and subject to provisions of any applicable law and to any special or restricted rights attached to a share, our assets in excess of our liabilities will be distributed among the shareholders in proportion to the paid-up capital attributable to the shares in respect of which the distribution is being made. Dividend and liquidation right may be affected by the grant of preferential dividends or distribution rights to the holders of a class of shares with preferential rights that may be authorized in the future.
For more information concerning our dividend distribution policy see “Item 8.A: Financial Information – Consolidated Statements and Other Financial information,” under the heading “Dividends.”
Redemption Provisions
We may, subject to any applicable law, issue redeemable securities and then redeem them.
Liability to Capital Calls
The liability of our shareholders for the indebtedness of the Company is limited to payment of the nominal value of the shares held by them.
Certain Transactions with Controlling Persons
No provision in the Articles discriminates against an existing or prospective holder of securities, as a result of such shareholder owning a substantial amount of shares. However, the Companies Law extends the disclosure requirements applicable to office holders as described in “Board Practices” under “Management” above, to a controlling shareholder in a public company. For purposes of the issues described in these paragraphs, the Companies Law defines a controlling shareholder a shareholder who can direct the activities of the company, including a presumption that a person who holds 25% or more of the voting rights at the company’s general meeting, provided there is no other person that holds more than 50% of the voting rights in such company, is a controlling shareholder. If two or more shareholders are interested parties in the same transaction, their shareholdings are combined for the purposes of calculating the percentages held by them. If two or more shareholders are parties to a voting agreement, their interests are also generally combined for the purposes of calculating percentages.
“Extraordinary Transactions” (as such term is defined by the Companies Law and as set forth in “Board Practices” under “Management” above) of a public company with its controlling shareholder or with another person if the controlling shareholder has a personal interest in such transaction, including certain private offering of securities in which the controlling shareholder has a personal interest, a transaction between a company and a controlling shareholder or her or his relative, directly or indirectly, including through a company controlled by her or him, relating to the receipt by the company of services from her or him, and, if such controlling shareholder or her or his relative are office holders, a transaction in connection with their Terms of Service and Employment or, if he or she is an employee of the company and not an office holder, a transaction of the company with such person in connection with his or her employment by the company, all are required to be for the benefit of the company and require the approval of the audit committee, the board of directors and the shareholders. The shareholders’ approval of such a transaction requires a simple majority approval and the fulfillment of one of the following conditions: (i) at least a majority of the votes cast by shareholders who have no personal interest in the transaction and who vote on the matter are voted in favor of the transaction, or (ii) the votes cast by shareholders who have no personal interest in the transaction voted against the transaction do not represent more than two percent of the voting rights in the company. In addition, any such transaction with a term that exceeds three years requires approval as described above every three years, unless (with respect only to extraordinary transactions and not to other transactions that require the special approval process) the audit committee approves that a longer term is reasonable under the circumstances. For more information concerning the roles of the audit committee in connection with related party transactions, including a recent amendment to the Companies Law, see “Item 6.C: Board Practices.” For more information concerning the approval process and requirements in connection with the Terms of Service and Employment of controlling shareholders and their relatives see “Item 6.B: Compensation.”
Pursuant to the Relief Regulations, certain extraordinary transactions between a company and its controlling shareholder(s), certain undertakings of a company to its directors in connection with their terms of service and certain transactions between a company and its controlling shareholder(s) or their relatives in their capacity as office holders or employees of the company may be approved, if the conditions set forth in such regulations are met, without the requirement to obtain shareholder approval. The Relief Regulations require that the company’s audit committee and board of directors determine that the conditions set forth in the Relief Regulations are met. One of the alternative conditions for approving an extraordinary transaction with a controlling shareholder is that such transaction only benefits the company. Another available condition is that the transaction is in the ordinary course of business, on market terms, and does not harm the company.
Changing Rights Attached to Shares
According to our Articles, in order to change the rights attached to any class of shares, unless otherwise provided by the terms of the class, such change must be adopted by a general meeting of the shareholders and by a separate general meeting of the holders of the affected class by the majority that is generally required for the amendment of the Articles or, if higher, the Memorandum. The provisions of the Articles relating to General Meetings of our shareholders shall apply, mutatis mutandis, to any separate General Meeting of the holders of the shares of a specific class; provided, however, that the requisite quorum at any such separate General Meeting shall be one or more members present in person or by proxy and holding not less than thirty three and one third percent (33 1/3%) of the issued shares of such class.
Pursuant to the Companies Law, the quorum requirement for General Meetings and for separate General Meetings for holders of a specific class may be satisfied with the presence of at least two members present in person or by proxy and holding not less than 25% of the outstanding shares, or the shares of such class, as the case may be.
Annual and Extraordinary Meetings of our Shareholders
Pursuant to the Companies Law, an annual meeting of shareholders must be held once in every calendar year at such time (within a period of not more than fifteen months after the preceding annual meeting) and at such place as may be determined by the board of directors. The board of directors may, at any time, convene extraordinary general meetings of shareholders, and shall be obligated to do so upon receipt of a requisition in writing from any of the following: (i) two directors or one quarter of the directors holding office; (ii) one or more shareholders holding at least 5% of the issued capital and at least 1% of the voting rights in the Company; or (iii) one or more shareholders holding at least 5% of the voting rights in the Company. A requisition must detail the objects for which the meeting must be convened and shall be signed by the persons requisitioning it and sent to the Company’s registered office. When the board of directors is required to convene a special meeting, it shall do so within 21 days of the requisition being submitted. In the event the board of directors does not convene the extraordinary meeting despite the receipt of a valid requisition, the persons requisitioning the meeting may convene the meeting themselves, provided that such meeting shall not be held more than three months following the delivery of the requisition and will be convened, to the extent possible, in the same manner as general meetings are convened by the board of directors.
Prior to any general meeting a written notice thereof shall be made public as required by Israeli law. The Articles provide that we shall not be required to deliver notice to each shareholder, except as may be specifically required by Israeli law. The Articles further provide that a notice by us of a general meeting that is published in one international wire service shall be deemed to have been duly given on the date of such publication.
Two or more members present in person or by proxy and holding shares conferring in the aggregate more than 25% of the total voting power attached to our shares shall constitute a quorum at general meetings. If a meeting is adjourned due to the lack of a quorum, any two shareholders, present in person or by proxy at the subsequent adjourned meeting, will constitute a quorum. Unless provided otherwise by the terms of issue of the shares, no member shall be entitled to be present or vote at a general meeting (or to be counted as part of the quorum) unless all amounts due as of the date designated for same general meeting with respect to his shares were paid. A resolution shall be deemed adopted if the requisite quorum is present and the resolution is supported by members present, in person or by proxy, vested with more than fifty percent (50%) of the total voting power attached to the shares whose holders were present, in person or by proxy, at such meeting and voted thereon, or such other percentage required by law or set forth in the Articles from time to time.
Limitations on the Rights to Own Securities in Our Company
Our Memorandum of Association and Articles and the laws of the State of Israel do not restrict in any way the ownership or voting of ordinary shares by non-residents, except that shares held by citizens of countries which are in a state of war with Israel will not confer any rights to their holders unless the Ministry of Finance consents otherwise.
Anti-takeover Provisions; Mergers and Acquisitions under Israeli Law
The Companies Law permits merger transactions with the approval of each party’s board of directors and generally requires shareholder approval as well. A merger with a wholly owned subsidiary does not require approval of the target company’s shareholders. A merger does not require approval of the surviving company’s shareholders if: (i) the merger does not require the adoption of amendments to the surviving company’s memorandum of association or articles and (ii) the surviving company does not issue more than 20% of its voting power in connection with the merger and as a result of the issuance no shareholder would become a controlling shareholder (for this purpose any securities convertible into shares of the surviving company that such person holds or that are issued to him in the course of the merger are deemed to have been converted or exercised). Shareholder approval of the surviving company would nevertheless be required if the other party to the merger, or a person holding more than 25% of the outstanding voting shares or means of appointing the board of directors of the other party to the merger, holds any shares of the surviving company. In accordance with the Companies Law, our Articles provide that a merger may be approved at a shareholders meeting by a majority of the voting power represented at the meeting, in person or by proxy, and voting on that resolution. The Companies Law provides that in determining whether the required majority has approved the merger, shares held by the other party to the merger, any person holding at least 25% of the outstanding voting shares or means of appointing the board of directors of the other party to the merger, or the relatives or companies controlled by these persons, are excluded from the vote. As described above, our Articles currently provide, under certain circumstances, including a merger of the Company, that two directors may require that, in addition to the majority prescribed by the Companies Law, a merger be approved by a resolution supported by shareholders present, in person or by proxy, vested with at least 50.1% of our outstanding shares. For additional voting requirements that may apply to us pursuant to Article 25.5 of our Articles in connection with a proposed merger see “Rights of Shareholders” above.
Under the Companies Law, a merging company must inform its creditors of the proposed merger. Any creditor of a party to the merger may seek a court order blocking the merger, if there is a reasonable concern that the surviving company will not be able to satisfy all of the obligations of the parties to the merger. Moreover, a merger may not be completed until at least 50 days have passed from the time that a merger proposal was filed with the Israeli Registrar of Companies and 30 days have passed from the shareholder approval of the merger in each merging company.
The Companies Law provides that an acquisition of shares in a public company must be made by means of a tender offer if as a result of the acquisition the purchaser would hold 25% or more of the voting rights in the company. This rule does not apply if there is already another holder of 25% or more of the voting rights in the company. Similarly, the Companies Law provides that an acquisition of shares in a public company must be made by means of a tender offer if as a result of the acquisition the purchaser would hold greater than 45% of the voting rights in the company, unless there is another shareholder holding more than 45% of the voting rights in the company. These requirements do not apply if, in general, the acquisition: (1) was made in a private placement that received shareholder approval as a private placement and was meant to grant the purchaser 25% or more of the voting rights of a company in which no other shareholder holds 25% or more of the voting rights, or to grant the purchaser more than 45% of the voting rights of a company in which no other shareholder holds more than 45% of the voting rights, (2) was from a holder of 25% or more of the voting rights in the company which resulted in the acquiror holding 25% or of the voting rights in the company, or (3) was from a shareholder holding more than 45% of the voting rights in the company which resulted in the acquiror becoming a holder of more than 45% voting rights in the company.
If, as a result of an acquisition of shares, the acquiror will hold more than 90% of a company’s outstanding shares, the acquisition must be made by means of a tender offer for all of the outstanding shares, or a full tender offer. A full tender offer is accepted if either: (i) holders of less than 5% of the outstanding shares do not accept the tender offer and more than half of the offerees who do not have a personal interest in accepting the tender offer accepted it, or (ii) holders of less than 2% of the outstanding shares do not accept the tender offer. If the full tender offer is not accepted, then the acquiror may not acquire shares in the tender offer that will cause his shareholding to exceed 90% of the outstanding shares.
The Companies Law provides for appraisal rights in the event a full tender offer is accepted if the shareholder files a request with the court within six months following the consummation of a full tender offer. The acquirer may provide in the tender offer documents that any shareholder that accepted the offer and tendered his shares will not be entitled to appraisal rights.
Duties of Shareholders and of Controlling Shareholders
Under the Companies Law, a shareholder has a duty to act in good faith towards the company and other shareholders and to refrain from abusing his or her power in the company including, among other things, when voting in a general meeting of shareholders or in a class meeting on the following matters:
| a. | any amendment to the articles; |
| b. | an increase in the company’s authorized share capital; |
| d. | approval of related party transactions that require shareholder approval. |
A shareholder also has a general duty to refrain from depriving any other shareholders of their rights as shareholders.
In addition, a duty to act with fairness towards the company is imposed on: (i) anyone who controls a company, i.e. a person that has the ability to direct the activity of a company, excluding an ability deriving merely from holding an officer or director or another office in the company (a person shall be presumed to control a corporation if he or she holds half or more of certain means of control, i.e. rights to vote at a general meeting and the right to appoint directors or general manager), (ii) any shareholder who knows that it possesses the power to determine the outcome of a shareholder vote and (iii) any shareholder who has the power to appoint or prevent the appointment of an office holder in the company. The Companies Law does not describe the substance of this duty of fairness.
C. Material Contracts
Management Services Agreement with Meisaf, Kanir and Keystone
For details concerning the Management Services Agreement, see “Item 7.B: Related Party Transactions.”
The description of the Management Services Agreement is only a summary and does not purport to be complete and is qualified by reference to the full text of the Management Services Agreement filed by us as Exhibit 4.18 under “Item 19: Exhibits.”
Agreements in connection with the Investment in Dori Energy
Summaries of the material agreements executed in connection with our investment in Dori Energy are included as Exhibits 4.7 and 4.8 under “Item 19: Exhibits.”
Series C Deed of Trust
For a description of our debt agreements, including the Series C Deed of Trust governing our Series C Debentures, see “Item 5.B: Operating and Financial Review and Prospects – Liquidity and Capital Resources.”
The descriptions of the Series C Deed of Trust is only a summary and does not purport to be complete and is qualified by reference to the convenience translation of the Series C Deed of Trust filed by us as Exhibit 4.15 under “Item 19: Exhibits.”
Series D Deed of Trust
For a description of our debt agreements, including the Series D Deed of Trust governing our Series D Convertible Debentures, see “Item 5.B: Operating and Financial Review and Prospects – Liquidity and Capital Resources.”
The descriptions of the Series D Deed of Trust is only a summary and does not purport to be complete and is qualified by reference to the convenience translation of the Series D Deed of Trust filed by us as Exhibit 4.17 under “Item 19: Exhibits.”
D. Exchange Controls
Dividends, if any, paid by us to the holders of our ordinary shares, and any amounts payable upon our dissolution, liquidation or winding up, as well as the proceeds of any sale in Israel of our ordinary shares to an Israeli resident, may be paid in non-Israeli currency. If these amounts are paid in Israeli currency, they may be converted into U.S. dollars at the rate of exchange prevailing at the time of conversion. However, legislation remains in effect pursuant to which currency controls can be imposed by administrative action at any time.
The State of Israel does not restrict in any way the ownership or voting of ordinary shares of Israeli entities by non-residents of Israel, except with respect to subjects of countries that are in a state of war with Israel. In addition, there are currently no limitations on our ability to import and export capital.
E. Taxation
Israeli Taxation
The following is a summary of the material Israeli tax consequences and Israeli foreign exchange regulations as they relate to our shareholders and us. To the extent that the discussion is based on new tax or other legislation that has not been subject to judicial or administrative interpretation, there can be no assurance that the views expressed in the discussion will be accepted by the tax or other authorities in question. The discussion is not intended, and should not be construed, as legal or professional tax advice and is not exhaustive of all possible tax considerations.
General Corporate Tax Structure
Israeli companies are generally subject to company tax on their taxable income. The Israeli corporate tax rate was 25% in 2013. The corporate tax rate increased to 26.5% in 2014 and 2015 and was reduced to 25% as of January 1, 2016. The Israeli Parliament on December 22, 2016, approved the Israeli Budgetary Law for 2017 and 2018, or the Budget Law. The Budget Law reduces the regular corporate tax rate from 25% to 24% in 2017 and to 23% in 2018.
Capital Gains Tax on Sales of Our Ordinary Shares
Israeli law generally imposes a capital gains tax on the sale of any capital assets by residents of Israel, as defined for Israeli tax purposes, and on the sale of capital assets by a non-resident of Israel if those assets (i) are located in Israel, (ii) are shares or a right to shares in an Israeli resident corporation, (iii) represent, directly or indirectly, rights to assets located in Israel, or (iv) are a right in a foreign resident corporation, which in its essence is the owner of a direct or indirect right to property located in Israel (with respect to the portion of the gain attributed to the property located in Israel), unless a specific exemption is available or unless a tax treaty between Israel and the shareholder’s country of residence provides otherwise. The law distinguishes between real gain and inflationary surplus. The inflationary surplus is a portion of the total capital gain, which is equivalent to the increase of the relevant asset’s purchase price, which is attributable to the increase in the Israeli consumer price index between the date of purchase and the date of sale. The real gain is the excess of the total capital gain over the inflationary surplus.
Taxation of Israeli Residents
The tax rate applicable to capital gains derived from the sale of shares, whether listed on a stock market or not, is the marginal tax rate according to Section 121 of the Israeli Income Tax Ordinance but up to 25% for Israeli individuals, unless such shareholder claims a deduction for financing expenses in connection with such shares, in which case the gain will generally be taxed at a rate of 30%. Additionally, if such shareholder is considered a “significant shareholder” at any time during the 12-month period preceding such sale (i.e., such shareholder holds directly or indirectly, including jointly with others, at least 10% of any means of control in the company) the tax rate will be 30%. However, different tax rates may apply to dealers in securities and shareholders who acquired their shares prior to an initial public offering. Israeli companies are subject to the corporate tax rate as specified in Section 126 of the Israeli Income Tax Ordinance on capital gains derived from the sale of shares.
Taxation of Non-Israeli Residents
Non-Israeli residents are generally exempt from Israeli capital gains tax on any gains derived from the sale of shares of Israeli companies publicly traded on a recognized stock market outside of Israel, provided such shareholders did not acquire their shares prior to the issuer’s initial public offering and that the gains did not derive from a permanent establishment of such shareholders in Israel and that such shareholders are not subject to the Inflationary Adjustments Law. However, non-Israeli corporations will not be entitled to such exemption if an Israeli resident (i) has a controlling interest of 25% or more in such non-Israeli corporation, or (ii) is the beneficiary or is entitled to 25% or more of the revenues or profits of such non-Israeli corporation, whether directly or indirectly as specified in Section 68A of the Israeli Income Tax Ordinance.
In addition, the sale, exchange or disposition of our ordinary shares by a shareholder who is a U.S. resident (for purposes of the U.S.-Israel Tax Treaty) holding ordinary shares as a capital asset is also exempt from Israeli capital gains tax under the U.S.-Israel Tax Treaty unless either (i) the shareholder holds, directly or indirectly, shares representing 10% or more of our voting power during any part of the 12-month period preceding such sale, (ii) the shareholder, if an individual, is present in Israel for more than 183 days during the taxable year, or (iii) the capital gains arising from such sale are attributable to a permanent establishment of the shareholder located in Israel. If the above conditions are not met, the U.S. resident would be subject to Israeli tax, to the extent applicable; however, under the U.S.-Israel Tax Treaty, the gain would be treated as foreign source income for United States foreign tax credit purposes.
Taxation on Dividends paid to a Shareholder
Taxation of Israeli Residents
Individuals who are Israeli residents are generally subject to Israeli income tax on the receipt of dividends paid on our ordinary shares at the rate of 25%, unless the recipient is a “significant” shareholder (as defined above) at any time during the 12-month period preceding the distribution, in which case the applicable tax rate is 30%. The company distributing the dividend is required to withhold tax at the rate of 25% (a different rate may apply to dividends paid on shares deriving from the exercise of stock options or other equity-based awards granted as compensation to employees or office holders of the company) or 30%, as applicable. For companies that are Israeli residents, dividends from another Israeli company will generally not be included in their taxable income, unless the source of such dividends is located outside of Israel, in which case tax will generally apply at the rate set forth in Section 126 of the Israeli Income Tax Ordinance.
Taxation of Non-Israeli Residents
Non-residents of Israel are generally subject to Israeli income tax on the receipt of dividends paid on our shares at the rate of 25% or 30%, if such person (including a non-Israeli corporation) is a substantial shareholder at the time of recipient of the dividend or on any date in the 12 months preceding such date, which tax will be withheld at the source, unless a different rate is provided in a tax treaty between Israel and the shareholder’s country of residence, subject to obtaining appropriate approval from the Israel Tax Authority in advance, to the extent granted. Under the U.S.-Israel Tax Treaty, the maximum rate of tax withheld in Israel on dividends paid to a holder of our ordinary shares who is a U.S. resident (for purposes of the U.S.-Israel Tax Treaty) is 25%.
U.S. Tax Considerations Regarding Ordinary Shares
The following is a general summary of the material United States federal income tax consequences relating to the acquisition, ownership and disposition of our ordinary shares by a U.S. Holder (as defined below) that holds those ordinary shares as capital assets within the meaning of Section 1221 of the Internal Revenue Code of 1986, as amended, or the Code. This summary is based on the tax laws of the United States, and existing final, temporary and proposed Treasury Regulations, administrative pronouncements and judicial decisions, as in effect on the date hereof, all of which are subject to prospective and retroactive changes, and to differing interpretations.
This summary does not address all federal income tax consequences that may be relevant to particular persons, and does not take into account the specific circumstances of any particular persons, including, but not limited to:
| a. | tax-exempt entities or any individual retirement account or Roth IRA;
|
| b. | banks and other financial institutions;
|
| d. | real estate investment trusts and regulated investment companies;
|
| f. | traders in securities that elect to use a mark-to-market method of accounting for their securities holdings;
|
| g. | persons liable for alternative minimum tax;
|
| h. | “U.S. shareholders” (as defined in Code Section 951(b), generally persons owning directly, indirectly or constructively at least 10% of our shares by vote or value);
|
| i. | persons that hold ordinary shares as part of a straddle, hedge, conversion transaction or other integrated transaction;
|
| k. | persons whose functional currency is not the U.S. dollar;
|
| l. | persons that are residents of or have a permanent establishment in a jurisdiction outside the United States or persons who are not U.S. Holders;
|
| m. | persons who acquired the shares pursuant to the exercise of any employee share option or otherwise as compensation; and
|
| n. | partnerships or a partner in a partnership. |
If a partnership (including for this purpose any entity treated as a partnership for U.S. tax purposes) is a beneficial owner of our ordinary shares, the U.S. tax treatment of a partner in the partnership will generally depend on the status of the partner and the activities of the partnership. A holder of our ordinary shares that is a partnership and partners in such partnership should consult their individual tax advisors about the U.S. federal income tax consequences of holding and disposing of our ordinary shares.
This summary does not address any aspect of United States federal gift or estate tax or state, local or foreign tax laws.
ACCORDINGLY, PERSONS CONSIDERING THE PURCHASE OF ORDINARY SHARES SHOULD CONSULT THEIR OWN TAX ADVISORS CONCERNING THE APPLICATION OF UNITED STATES FEDERAL TAX LAWS, AS WELL AS THE LAWS OF ANY STATE, LOCAL OR FOREIGN TAXING JURISDICTION, TO THEIR PARTICULAR SITUATIONS.
For purposes of this discussion, a “U.S. Holder” is any beneficial owner of our ordinary shares that, for U.S. federal income tax purposes, is:
| (1) | an individual citizen or resident of the United States; |
| (2) | a corporation or other entity taxable as a corporation for U.S. federal income tax purposes created or organized in or under the laws of the United States or any political subdivision thereof; |
| (3) | an estate the income of which is subject to U.S. federal income tax without regard to its source; or |
| (4) | a trust, if such trust was in existence on August 20, 1996 and has validly elected to be treated as a U.S. person for U.S. federal income tax purposes, or if (a) a court within the U.S. can exercise primary supervision over its administration and (b) one or more U.S. persons have the authority to control all of the substantial decisions of such trust. |
Taxation of U.S. Holders
Distributions on Ordinary Shares. Subject to the discussion in “Passive Foreign Investment Company” below, distributions made by us with respect to ordinary shares generally will constitute dividends for federal income tax purposes and will be taxable to a U.S. Holder as a dividend to the extent of our undistributed current or accumulated earnings and profits (as determined for United States federal income tax purposes). Distributions in excess of our current and accumulated earnings and profits will be treated first as a nontaxable return of capital reducing the U.S. Holder’s tax basis in the ordinary shares, thus increasing the amount of any gain (or reducing the amount of any loss) which might be realized by such U.S. Holder upon the sale or exchange of such ordinary shares. Any such distributions in excess of the U.S. Holder’s tax basis in the ordinary shares will be treated as gain from the sale or exchange of our ordinary shares. Dividends paid by us generally will not be eligible for the dividends received deduction available to certain corporate U.S. Holders.
With respect to non-corporate U.S. Holders, dividends may qualify as “qualified dividend income” which is eligible for reduced rates of taxation provided that (1) we are eligible for the benefits of the income tax treaty between the United States and Israel or with respect to any dividend paid on shares which are readily tradable on an established securities market in the United States; (2) we are not a PFIC (as defined below) for either the taxable year in which the dividend was paid or the preceding taxable year; (3) the U.S. Holder satisfies certain holding period requirements; and (4) the U.S. Holder is not under an obligation to make related payments with respect to positions in substantially similar or related property. A corporate U.S. Holder (and a non-corporate U.S. Holder that fails to satisfy the applicable holding period requirements) is taxable at ordinary rates on dividends received.
A dividend paid in New Israeli Shekel will be included in gross income in a U.S. dollar amount based on the NIS/U.S. dollar exchange rate in effect on the date the dividend is included in the income of the U.S. Holder, regardless of whether the payment, in fact, is converted into U.S. dollars. Generally, any gain or loss resulting from currency exchange fluctuations during the period from the date the dividend payment is included in the gross income of a U.S. Holder through the date that payment is converted into U.S. dollars (or otherwise disposed of) will be treated as U.S. source ordinary income or loss and will not be eligible for the special tax rate applicable to qualified dividend income.
Subject to certain conditions and limitations, any Israeli withholding tax imposed upon distributions which constitute dividends under United States federal income tax law will be eligible for credit against a U.S. Holder’s federal income tax liability. Alternatively, a U.S. Holder may claim a deduction for such amount, but only for a year in which a U.S. Holder elects to do so with respect to all foreign income taxes. The overall limitation on foreign taxes eligible for credit is calculated separately with respect to specific classes of income. For this purpose, dividends distributed with respect to our ordinary shares will generally constitute “passive income.”
Sale or Exchange of Ordinary Shares. Subject to the discussion in “Passive Foreign Investment Company” below, a U.S. Holder of ordinary shares generally will recognize capital gain or loss upon the sale or exchange of the ordinary shares measured by the difference between the amount realized and the U.S. Holder’s tax basis in the ordinary shares. Any such capital gain will be long-term capital gain or loss if the U.S. Holder’s holding period in our ordinary shares is more than one year. Subject to the discussion in “Medicare Tax” below, tax rates for the long-term capital gain to an individual U.S. Holder will be taxable at a maximum rate of 20%. Gain or loss will be computed separately for each block of ordinary shares sold (ordinary shares acquired separately at different times and prices). The deductibility of capital losses is restricted and generally may only be used to reduce capital gains to the extent thereof. However, individual taxpayers generally may deduct annually $3,000 of capital losses in excess of their capital gains.
Medicare Tax. Subject to specific requirements, certain U.S. Holders will be subject to a 3.8% Medicare tax (in addition to otherwise applicable federal income tax) on their investment income and gain, with limited exceptions. U.S. Holders should consult with their tax advisors regarding the effect, if any, of this tax on the ownership and disposition of our ordinary shares.
Passive Foreign Investment Company. A foreign corporation generally will be treated as a “passive foreign investment company,” or PFIC, if, after applying certain “look-through” rules, either (1) 75% or more of its gross income is passive income or (2) 50% or more of the average value of its assets is attributable to assets that produce or are held to produce passive income. Passive income for this purpose generally includes dividends, interest, rents, royalties and gains from securities and commodities transactions. The look-through rules require a foreign corporation that owns at least 25%, by value, of the stock of another corporation to treat a proportionate amount of assets and income of the other corporation as held or received directly by such foreign corporation. We must make a separate determination each year as to whether we are a PFIC. As a result, our PFIC status may change. The determination of whether or not we are a PFIC depends on the composition of our income and assets, including goodwill, from time to time.
Based on our income and/or assets, we believe that we were a PFIC from 2008 through 2012. Since PFIC shares are subject to the PFIC rules even in future years in which we are no longer a PFIC, our ordinary shares will be PFIC shares with respect to any U.S. Holder that held our ordinary shares in 2008 through 2012. Based on our income and assets, we do not believe that we were a PFIC from 2013 through 2021. However, because the determination of whether we are, or will be, a PFIC for a taxable year depends, in part, on the application of complex U.S. federal income tax rules, which are subject to various interpretations, there is a risk that the Internal Revenue Service may disagree with our determinations regarding our prior or present PFIC status. In addition, depending on future events, we could become a PFIC in future years.
U.S. Holders who own our ordinary shares during a taxable year in which we are a PFIC generally will be subject to increased U.S. tax liabilities and reporting requirements for that taxable year and all succeeding years, regardless of whether we continue to meet the income or asset test for PFIC status, although shareholder elections may apply in certain circumstances. U.S. Holders should consult their own tax advisors regarding our status as a PFIC and the consequences of investment in a PFIC.
If we are a PFIC for any taxable year during which U.S. Holders hold ordinary shares, such U.S. Holders will be subject to special tax rules with respect to any “excess distribution” that they receive and any gain that they realize from a sale or other disposition (including a pledge) of the ordinary shares, unless such U.S. Holders make a “mark-to-market” election as discussed below. Distributions that each U.S. Holder receives in a taxable year that are greater than 125% of the average annual distributions that such U.S. Holder received during the shorter of the three preceding taxable years or such U.S. Holder’s holding period for the ordinary shares will be treated as an excess distribution. Under these special tax rules:
| (1) | the excess distribution or gain will be allocated ratably over each U.S. Holder’s holding period for the ordinary shares; |
| (2) | the amount allocated to the current taxable year, and any taxable year prior to the first taxable year in which we were a PFIC, will be treated as ordinary income; and |
| (3) | the amount allocated to each other year will be subject to tax at the highest tax rate in effect for that year and the interest charge generally applicable to underpayments of tax will be imposed on the resulting tax attributable to each such year. |
The tax liability for amounts under (3) above that is allocated to years prior to the year of disposition or “excess distribution” cannot be offset by any net operating losses, and gains (but not losses) realized on the sale of the ordinary shares cannot be treated as capital, even if a U.S. Holder holds the ordinary shares as capital assets. The portion of any distributions that are not treated as excess distributions are taxable as ordinary income in the current taxable year under the normal tax rules of the Code.
A U.S. Holder may not avoid taxation under the rules described above by making a “qualified electing fund” election to include such U.S. Holder’s share of our income on a current basis because we do not presently intend to prepare or provide information necessary to make such election.
Alternatively, a U.S. Holder of “marketable stock” in a PFIC may make a mark-to-market election for stock of a PFIC to elect out of the tax treatment discussed three paragraphs above. If a U.S. Holder makes a mark-to-market election for the ordinary shares, such U.S. Holder will include in income each year an amount equal to the excess, if any, of the fair market value of the ordinary shares as of the close of such U.S. Holder’s taxable year over such U.S. Holder’s adjusted basis in such ordinary shares. A U.S. Holder is allowed a deduction for the excess, if any, of the adjusted basis of the ordinary shares over their fair market value as of the close of the taxable year. However, deductions are allowable only to the extent of any net mark-to-market gains on the stock included in a U.S. Holder’s income for prior taxable years. Amounts included in a U.S. Holder’s income under a mark-to-market election, as well as gain on the actual sale or other disposition of the ordinary shares, are treated as ordinary income. Ordinary loss treatment also applies to the deductible portion of any mark-to-market loss on the ordinary shares, as well as to any loss realized on the actual sale or disposition of the ordinary shares, to the extent that the amount of such loss does not exceed the net mark-to-market gains previously included for such ordinary shares, and any loss in excess of such amount is treated as capital loss. Each U.S. Holder’s basis in the ordinary shares will be adjusted to reflect any such income or loss amounts. The tax rules that apply to distributions by corporations which are not passive foreign investment companies generally would apply to distributions by us.
The mark-to-market election is available only for stock which is regularly traded on a national securities exchange that is registered with the Securities and Exchange Commission or on Nasdaq, or an exchange or market that the U.S. Secretary of the Treasury determines has rules sufficient to ensure that the market price represents a legitimate and sound fair market value. U.S. Holders should consult their tax advisors as to the availability of the mark-to-market election, based on the exchange on which we trade and the amount of trading of our ordinary shares, and the tax ramifications of such election (including the special rules that may apply to the gain realized in the year of the election).
Dividends paid by a PFIC (or by a company that was a PFIC in the year preceding the dividend) are not “qualified dividend income” for purposes of the preferential tax rate on dividends discussed above.
Special limitations may apply to the use of foreign tax credits arising in connection with distributions on PFIC shares as to which U.S. Holders should consult their tax advisors.
If a U.S. Holder holds ordinary shares in any year in which we are a PFIC, such U.S. Holder is generally required to file Internal Revenue Service Form 8621 every year. U.S. Holders should consult their tax advisors regarding their PFIC shareholder reporting obligation in connection with their investment.
U.S. Information and Backup Withholding. Dividends and proceeds from the sale or exchange of shares may be subject to information reporting to the Internal Revenue Service and possible U.S. backup withholding. Backup withholding will not apply, however, to a U.S. Holder who furnishes a correct taxpayer identification number on a properly completed Internal Revenue Service Form W-9 or otherwise properly establishes an exemption from backup withholding. U.S. Holders should consult their tax advisors regarding the application of the U.S. information reporting and backup withholding rules. Backup withholding is not an additional tax. Amounts withheld as backup withholding may be credited against a U.S. Holder’s U.S. federal income tax liability, if any, and such U.S. Holder may obtain a refund of any excess amounts withheld under the backup withholding rules by timely filing the appropriate claim for refund and furnishing any required information to the Internal Revenue Service.
Foreign Financial Asset Reporting. United States return disclosure obligations (and related penalties) are imposed on U.S. individuals who hold certain specified foreign financial assets in excess of certain dollar thresholds. The definition of specified foreign financial assets would include our ordinary shares, unless they are held in an account at a domestic financial institution. U.S. Holders should consult with their tax advisors regarding the requirements of filing IRS Form 8938 under these rules.
F. Dividends and Paying Agents
Not Applicable.
G. Statement by Experts
Not Applicable.
H. Documents on Display
We are subject to certain of the reporting requirements of the Exchange Act, as applicable to “foreign private issuers” as defined in Rule 3b-4 under the Exchange Act. As a foreign private issuer, we are exempt from certain provisions of the Exchange Act. Accordingly, our proxy solicitations are not subject to the disclosure and procedural requirements of Regulation 14A under the Exchange Act, and transactions in our equity securities by our officers and directors are exempt from reporting and the “short-swing” profit recovery provisions contained in Section 16 of the Exchange Act. In addition, we are not required under the Exchange Act to file periodic reports and financial statements as frequently or as promptly as U.S. companies whose securities are registered under the Exchange Act. However, we file with the Securities and Exchange Commission an annual report on Form 20-F containing financial statements audited by an independent accounting firm. We also submit to the Securities and Exchange Commission reports on Form 6-K containing (among other things) press releases and unaudited financial information. We post our annual report on Form 20-F on our website (http://www.ellomay.com) promptly following the filing of our annual report with the Securities and Exchange Commission. The information on our website is not incorporated by reference into this annual report.
Any statement in this Report about any of our contracts or other documents is not necessarily complete. If the contract or document is filed as an exhibit to this report or any of our annual reports or to a registration statement or other documents filed by us, the contract or document is deemed to modify the description contained in this Report. You must review the exhibits themselves for a complete description of the contract or document. In the event any of the documents that are filed as exhibits to our annual reports are not in English, the original language version is on file in our offices and is available upon request.
You may review a copy of our filings with the SEC, including exhibits and schedules, and obtain copies of such materials at the SEC’s public reference room at Room 1580, 100 F Street, N.E, Washington, D.C. 20549. You may call the SEC at 1-800-SEC-0330 for further information on the public reference room. The SEC maintains an Internet site (http://www.sec.gov) that contains reports, proxy and information statements and other information regarding registrants that we file electronically with the SEC. These SEC filings are also available to the public from commercial document retrieval services. Our filings commencing October 2013 may also be found at the TASE’s website at http://maya.tase.co.il and at the Israeli Securities Authority’s website at http://www.magna.isa.gov.il.
I. Subsidiary Information
Not applicable.
ITEM 11: Quantitative and Qualitative Disclosures About Market Risk
We are exposed to a variety of risks, including foreign currency fluctuations and changes in interest rates. We regularly assess currency and interest rate risks to minimize any adverse effects on our business as a result of those factors and periodically use hedging transactions in order to attempt to limit the impact of such changes.
We hold cash and cash equivalents, marketable securities and restricted cash in various currencies, including euro and NIS. Our holdings in our Spanish PV Plants and in the Dutch WtE Plants and in the Talasol PV Plant are denominated in euro and our holdings in the Talmei Yosef PV Plant, in Dori Energy and in the Manara PSP are denominated in NIS. The financing we have in connection with our Spanish PV Plants, the Dutch WtE Plants and the Talasol PV Plant is denominated in euro and the financing we have in connection with our Spanish PV Plants bears interest that is based on EURIBOR rate. Our Debentures and the project finance debt of the Talmei Yosef PV Plant and the Manara PSP are denominated in NIS and are to be repaid (principal and interest) in NIS.
Inflation and Fluctuation of Currencies
Until December 31, 2017, our presentation currency was the U.S. dollar, while the functional currency of us and a majority of our subsidiaries is the euro. This difference exposed our statements of financial position to the effects of presentation currency translation adjustments. In order to manage this foreign exchange exposure we previously executed several forward transactions, a majority of which we closed during 2017 and 2018 and of which euro/USD forward positions with an aggregate euro denominated principal of €12 million. For more information see “Item 5.A: Impact of Inflation and Fluctuation of Currencies.”
In order to manage the currency risk resulting from the Series C Debentures, which were denominated in NIS, we executed currency swap transactions in March 2021. We exchanged Series C Debentures NIS denominated notional principal in the aggregate amount of NIS 100 million with a euro notional principal (currency swap transactions). Such currency swap transactions qualify for hedge accounting.
Interest Rate
As noted under “Item 4.B: Business Overview,” we entered into various project finance agreements that are based on EURIBOR rate and therefore we may be affected by adverse movements in interest rates. We utilize interest rate swap derivatives to convert certain floating-rate debt to fixed-rate debt. Our interest rate swap derivatives involve an agreement to pay a fixed-rate interest and receive a floating-rate interest, at specified intervals, calculated on an agreed notional amount that matches the amount of the original loan and paid on the same installments and maturity dates. In the future, we may enter into additional interest rate swaps or other derivatives contracts to further hedge our exposure to fluctuations in interest rates.
In order to manage and limit the interest-rate risk resulting from financing secured or about to be secured from local financing institutions for our PV operations, we executed the following swap transactions as of December 31, 2021:
Interest rate swap in connection with the financing of four of our Spanish indirect wholly-owned subsidiaries- A €17.6 million interest swap transaction for a period of 18 years, payable semi-annually commencing on March 12, 2019, whereby we are the fixed rate payer (the fixed rate is set at 3%).
Interest rate swap in connection with the financing of the Talasol PV Plant (prior to refinancing)- The principal of the interest rate swap transaction is based on a pre-determined sculptured repayment schedule in the maximum amount of Euro 131 million for a period of 12 years, payable semi-annually commencing on April 30, 2019, whereby we are the fixed rate payer (the fixed rate is set at 2.92% - 3.69%). This interest rate swap was closed in January 2022 following the financial closing of the New Talasol Financing.
For more information concerning hedging transactions, including a sensitivity analysis, see Note 21 to our financial statements included elsewhere in this Report.
We do not otherwise believe the disclosure required by Item 11 of this report to be material to us.
ITEM 12: Description of Securities Other Than Equity Securities
Not Applicable (for a description of our Debentures see “Item 5.B: Operating and Financial Review and Prospects; Liquidity and Capital Resources” and “Item 10.C: Material Contracts”).
PART II
ITEM 13: Defaults, Dividend Arrearages and Delinquencies
Not Applicable.
ITEM 14: Material Modifications to the Rights of Security Holders and Use of Proceeds
Not applicable.
ITEM 15: Controls and Procedures
(a) Disclosure Controls and Procedures
Our chief executive officer and chief financial officer, after evaluating the effectiveness of our disclosure controls and procedures (as defined in Rules 13a-15(e) and 15d-15(e) of the Securities Exchange Act of 1934, as amended) as of the end of the period covered by this report, have concluded that, as of such date, our disclosure controls and procedures were effective to ensure that the information required in the reports that we file or submit under the Securities Exchange Act of 1934, as amended, is recorded, processed, summarized and reported, within the time periods specified in the SEC’s rules and forms, and such information is accumulated and communicated to our management, including our chief executive officer and chief financial officer, as appropriate to allow timely decisions regarding required disclosure.
(b) Management’s Annual Report on Internal Control over Financial Reporting
Our management is responsible for establishing and maintaining adequate internal control over financial reporting. Internal control over financial reporting is defined in Rule 13a-15(f) promulgated under the Securities Exchange Act of 1934, as amended, as a process designed to provide reasonable assurance regarding the reliability of financial reporting and the preparation of financial statements for external purposes in accordance with generally accepted accounting principles.
Because of its inherent limitations, internal control over financial reporting may not prevent or detect misstatements. Projections of any evaluation of effectiveness to future periods are subject to the risk that the controls may become inadequate because of changes in conditions, or that the degree of compliance with the policies or procedures may deteriorate.
Our management assessed the effectiveness of our internal control over financial reporting as of December 31, 2021. In making this assessment, our management used the criteria in Internal Control - Integrated Framework issued by the Committee of Sponsoring Organizations of the Treadway Commission 2013.
Based on this assessment, our Chief Executive Officer and Chief Financial Officer have concluded that, as of December 31, 2021, our internal control over financial reporting is effective based on those criteria.
(c) Attestation Report of the Registered Public Accounting Firm
Our independent registered accounting firm, Somekh Chaikin, a member firm of KPMG International, has issued an audit report on the effectiveness of our internal control over financial reporting. The report is included our audited consolidated financial statements set forth in “Item 18 - Financial Statements.”
(d) Changes in Internal Control over Financial Reporting
There were no changes in our internal control over financial reporting that occurred during the year ended December 31, 2021 that have materially affected, or are reasonably likely to materially affect, our internal control over financial reporting.
ITEM 16: [Reserved]
ITEM 16A: Audit Committee Financial Expert
Daniel Vaknin has been designated as the Audit Committee financial expert and was also determined to be “independent” under the applicable SEC and NYSE American LLC regulations.
ITEM 16B: Code of Ethics
We adopted a code of business conduct and ethics which is applicable to all of our officers, directors and employees, including our principal executive, financial and accounting officers and persons performing similar functions, or the Code of Ethics.
The Code of Ethics, in its current form, is posted on our website at the following web address: https://ellomay.com/wp-content/uploads/2020/03/Code_of_Business_Conduct_and_Ethics.pdf. We will provide a copy of the Code of Ethics to any person, without charge, upon written request addressed to our Chief Financial Officer at our office in Tel Aviv, Israel.
ITEM 16C: Principal Accountant Fees and Services
Fees paid to the Independent Registered Public Accounting Firm
Somekh Chaikin, an independent registered public accounting firm and a member firm of KPMG International, serves as our principal independent registered public accounting firm since December 2011.
The following table sets forth, for each of the years indicated, the aggregate fees paid for professional audit services and other services rendered by Somekh Chaikin and other KPMG member firms.
| | | | | | | |
| | | | |
| | | | |
Audit Fees(1) | | | 453 | | | | 317 | |
Audit-Related Fees(2) | | | 21 | | | | 35 | |
Tax Fees(3) | | | 49 | | | | 53 | |
| Total | | | | | | | | |
______________________
| a. | Professional services rendered by our independent registered public accounting firm for the audit of our annual financial statements or services that are normally provided by the accountants in connection with statutory and regulatory filings or engagements.
|
| b. | Including professional services related to due diligence investigations.
|
| c. | Professional services rendered by our independent registered public accounting firm for international and local tax compliance, tax advice services and tax planning performed during the fiscal year. |
Audit Committee’s pre-approval policies and procedures
Our Audit Committee nominates and engages our registered public accounting firm to audit our financial statements. See also the description under the heading in “Item 6.C: Board Practices.” In July 2003, our Audit Committee also adopted a policy requiring management to obtain the Audit Committee’s approval before engaging our independent auditors worldwide to provide any other audit or permitted non-audit services to us. Pursuant to this policy, which is designed to assure that such engagements do not impair the independence of our auditors, the Audit Committee pre-approves all specific audit and non-audit services and related fees in the categories audit service, audit-related service and tax services that may be performed by our independent auditors worldwide.
ITEM 16D: Exemptions from the Listing Standards for Audit Committees
Not Applicable.
ITEM 16E: Purchase of Equity Securities by the Company and Affiliated Purchasers
Not Applicable.
ITEM 16F: Change in Registrant’s Certifying Accountants
Not Applicable.
ITEM 16G: Corporate Governance
NYSE American LLC Company Guide and Home Country Laws
Section 110 of the NYSE American LLC Company Guide provides that the NYSE American LLC will consider the laws, customs and practices of an issuer’s country of domicile, to the extent not contrary to the federal securities laws, regarding such matters as: (i) the election and composition of the board of directors; (ii) the issuance of quarterly earnings statements; (iii) shareholder approval requirements; and (iv) quorum requirements for shareholder meetings. If we wish to seek relief under these provisions we are required to provide written certification from independent local counsel that the non-complying practice is not prohibited by our home country law.
Our corporate governance practices currently differ from those followed by U.S. companies listed on the NYSE American LLC in connection with the quorum required for shareholders meetings. While the NYSE American LLC Company Guide requires a quorum for shareholder meetings of at least 33-1/3% of our outstanding ordinary shares, our Articles, as permitted by the Companies Law, provide for a quorum of two or more shareholders holding more than 25% of the total voting power attached to our shares and for a quorum of any two shareholders, present in person or by proxy at the subsequent adjourned meeting. For more information concerning the quorum requirements for shareholders meetings and adjourned shareholders meetings see “Item 10.B: Memorandum of Association and Second Amended and Restated Articles.”
In addition, under the Companies Law we may not be required to obtain shareholder approval for certain issuances of shares in excess of 20% of our outstanding shares, as would be required in certain circumstances by the NYSE American LLC Company Guide. At this time, we do not have any intention to enter into any such transaction; however, we may in the future do so and opt to comply with the Companies Law, which may not require shareholder approval. Any such determination to follow the Companies Law’s requirements rather than the standards applicable to U.S. companies listed on NYSE American LLC will be made by us based on the circumstances existing at the time approval is required.
Controlled Company
By virtue of the 2008 Shareholders Agreement, we are a “controlled company” as defined in Section 801 of the NYSE American LLC Company Guide. As a result, we are exempt from certain of the NYSE American LLC corporate governance requirements, including the requirement that a majority of the board of directors be independent, the requirement applicable to the nomination process of directors and the requirements applicable to the determination or recommendation of executive compensation by a committee comprised of independent directors or by a majority of the independent directors. We follow the requirements of the Companies Law with respect to these issues, including the requirement that we appoint two external directors, all as more fully described in “Item 6.B: Compensation” and “Item 6.C: Board Practices.”
If the “controlled company” exemptions would cease to be available to us under the NYSE American LLC Company Guide, we may elect to follow “home country laws” (i.e. Israeli law) instead of some or all of the applicable NYSE American LLC Company Guide requirements as described above.
ITEM 16H: Mine Safety Disclosure
Not Applicable.
PART III
ITEM 17: Financial Statements
Not Applicable.
ITEM 18: Financial Statements
Our Financial Statements are included in pages F-1 – F-109 of this report.
The Financial statements of Dorad Energy Ltd. are included in pages FD-1 – FD-47 of this report.
ITEM 19: Exhibits
| |
| |
| |
| |
| |
| |
| |
| |
| |
| |
| |
| 101.INS** | XBRL Instance Document |
| 101.SCH** | XBRL Taxonomy Extension Schema Document |
| 101.CAL** | XBRL Taxonomy Calculation Linkbase Document |
| 101.DEF** | XBRL Taxonomy Extension Definition Linkbase Document |
| 101.LAB** | XBRL Taxonomy Label Linkbase Document |
| 101.PRE** | XBRL Taxonomy Presentation Linkbase Document |
| 104 | Cover Page Interactive Data File (formatted as inline XBRL and contained in Exhibit 101) |
_____________________________________
| * | The original language version is on file with the Registrant and is available upon request. |
| ** | Pursuant to Rule 406T of Regulation S-T, these interactive data files are deemed not filed or part of a registration statement or prospectus for purposes of Sections 11 or 12 of the Securities Act of 1933, as amended, are deemed not filed for the purposes of Section 18 of the Securities and Exchange Act of 1934, as amended, and otherwise are not subject to liability under those sections. |
| (1) | Previously filed with the Registrant’s Form 20-F for the year ended December 31, 2012 and incorporated by reference herein. |
| (2) | Previously filed with the Registrant’s Form 20-F for the year ended December 31, 2018 and incorporated by reference herein. |
| (3) | Previously filed with the Registrant’s Form 20-F for the year ended December 31, 2011 and incorporated by reference herein. |
| (4) | Previously filed with the Registrant’s Form 20-F for the year ended December 31, 2019 and incorporated by reference herein. |
| (5) | Included in the Registrant’s Form 6-K dated May 17, 2018 and incorporated by reference herein. |
| (6) | Included in the Registrant’s Form 6-K dated October 14, 2005 and incorporated by reference herein. |
| (7) | Previously filed with the Registrant’s Form 20-F for the year ended December 31, 2010 and incorporated by reference herein. |
| (8) | Previously filed with the Registrant’s Form 20-F for the year ended December 31, 2013 and incorporated by reference herein. |
| (9) | Previously filed with the Registrant’s Form 20-F for the year ended December 31, 2014 and incorporated by reference herein. |
| (10) | Previously filed with the Registrant’s Form 20-F for the year ended December 31, 2017 and incorporated by reference herein. |
| (11) | Included in the Registrant’s Form 6-K dated September 25, 2019 and incorporated by reference herein. |
| (12) | Previously filed with the Registrant’s Form 20-F for the year ended December 31, 2020 and incorporated by reference herein. |
| (13) | Included in the Registrant’s Form 6-K dated July 1, 2021 and incorporated by reference herein. |
SIGNATURES
The registrant hereby certifies that it meets all of the requirements for filing on Form 20-F and that it has duly caused and authorized the undersigned to sign this annual report on its behalf.
| Ellomay Capital Ltd.
By: /s/ Ran Fridrich
Ran Fridrich
Chief Executive Officer and Director
|
Dated: March 31, 2022
184