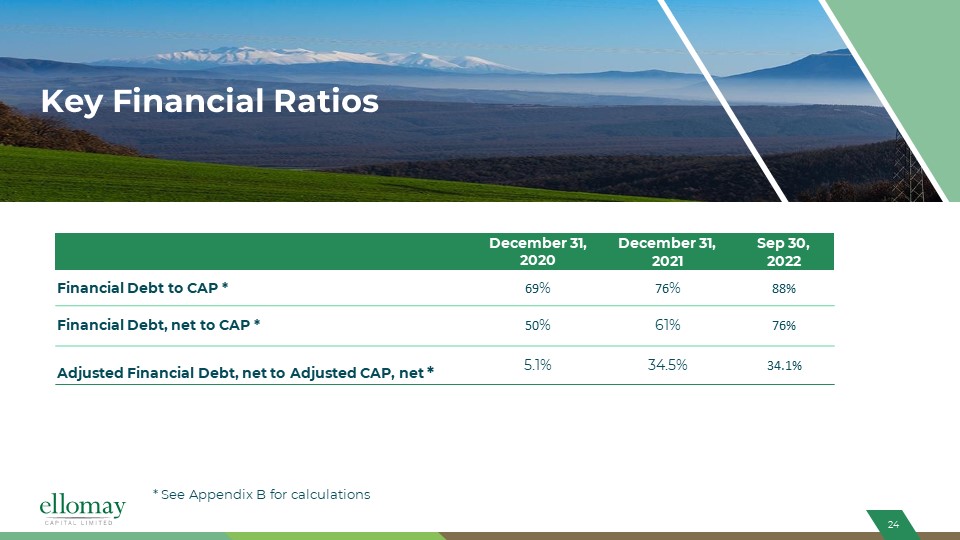
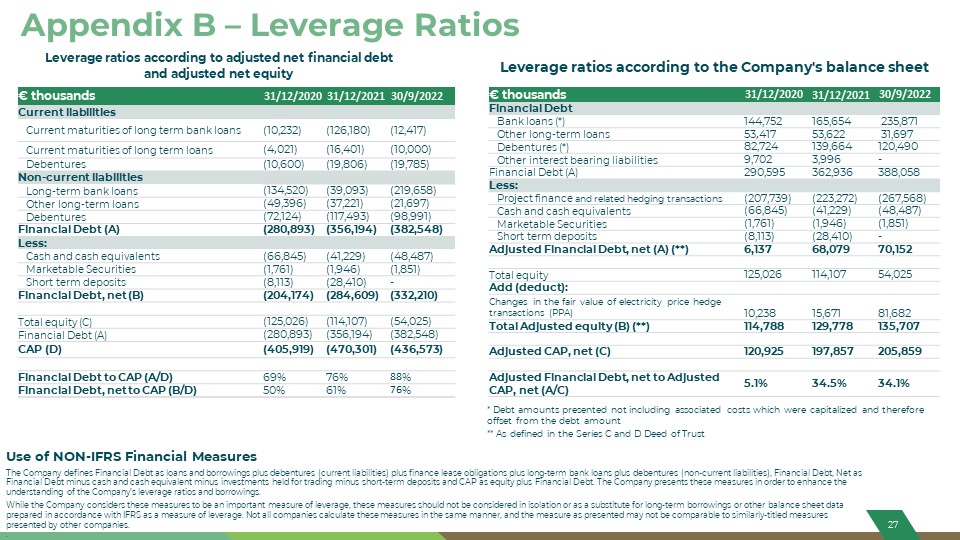
Appendix B – Leverage Ratios Use of NON-IFRS Financial Measures The Company defines Financial Debt as loans and borrowings plus debentures (current liabilities) plus finance lease obligations plus long-term bank loans plus debentures (non-current liabilities), Financial Debt, Net as Financial Debt minus cash and cash equivalent minus investments held for trading minus short-term deposits and CAP as equity plus Financial Debt. The Company presents these measures in order to enhance the understanding of the Company’s leverage ratios and borrowings. While the Company considers these measures to be an important measure of leverage, these measures should not be considered in isolation or as a substitute for long-term borrowings or other balance sheet data prepared in accordance with IFRS as a measure of leverage. Not all companies calculate these measures in the same manner, and the measure as presented may not be comparable to similarly-titled measures presented by other companies. . Leverage ratios according to adjusted net financial debt and adjusted net equity € thousands 31/12/2020 31/12/2021 30/9/2022 Current liabilities Current maturities of long term bank loans (10,232) (126,180) (12,417) Current maturities of long term loans (4,021) (16,401) (10,000) Debentures (10,600) (19,806) (19,785) Non-current liabilities Long-term bank loans (134,520) (39,093) (219,658) Other long-term loans (49,396) (37,221) (21,697) Debentures (72,124) (117,493) (98,991) Financial Debt (A) (280,893) (356,194) (382,548) Less: Cash and cash equivalents (66,845) (41,229) (48,487) Marketable Securities (1,761) (1,946) (1,851) Short term deposits (8,113) (28,410) - Financial Debt, net (B) (204,174) (284,609) (332,210) Total equity (C) (125,026) (114,107) (54,025) Financial Debt (A) (280,893) (356,194) (382,548) CAP (D) (405,919) (470,301) (436,573) Financial Debt to CAP (A/D) 69% 76% 88% Financial Debt, net to CAP (B/D) 50% 61% 76% € thousands 31/12/2020 31/12/2021 30/9/2022 Financial Debt Bank loans (*) 144,752 165,654 235,871 Other long-term loans 53,417 53,622 31,697 Debentures (*) 82,724 139,664 120,490 Other interest bearing liabilities 9,702 3,996 - Financial Debt (A) 290,595 362,936 388,058 Less: Project finance and related hedging transactions (207,739) (223,272) (267,568) Cash and cash equivalents (66,845) (41,229) (48,487) Marketable Securities (1,761) (1,946) (1,851) Short term deposits (8,113) (28,410) - Adjusted Financial Debt, net (A) (**) 6,137 68,079 70,152 Total equity 125,026 114,107 54,025 Add (deduct): Changes in the fair value of electricity price hedge transactions (PPA) 10,238 15,671 81,682 Total Adjusted equity (B) (**) 114,788 129,778 135,707 Adjusted CAP, net (C) 120,925 197,857 205,859 Adjusted Financial Debt, net to Adjusted CAP, net (A/C) 5.1% 34.5% 34.1% * Debt amounts presented not including associated costs which were capitalized and therefore offset from the debt amount ** As defined in the Series C and D Deed of Trust Leverage ratios according to the Company's balance sheet