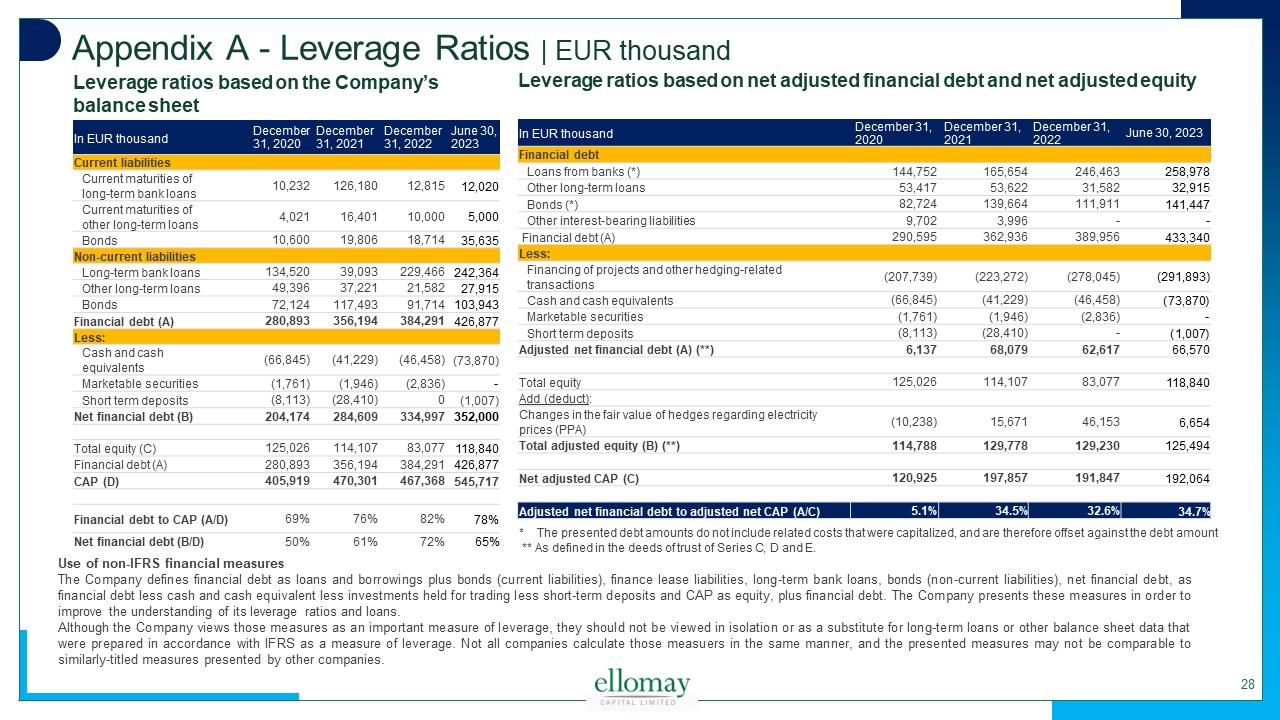
Appendix A - Leverage Ratios | EUR thousand Use of non-IFRS financial measures The Company defines financial debt as loans and borrowings plus bonds (current liabilities), finance lease liabilities, long-term bank loans, bonds (non-current liabilities), net financial debt, as financial debt less cash and cash equivalent less investments held for trading less short-term deposits and CAP as equity, plus financial debt. The Company presents these measures in order to improve the understanding of its leverage ratios and loans. Although the Company views those measures as an important measure of leverage, they should not be viewed in isolation or as a substitute for long-term loans or other balance sheet data that were prepared in accordance with IFRS as a measure of leverage. Not all companies calculate those measuers in the same manner, and the presented measures may not be comparable to similarly-titled measures presented by other companies. Leverage ratios based on the Company’s balance sheet * The presented debt amounts do not include related costs that were capitalized, and are therefore offset against the debt amount ** As defined in the deeds of trust of Series C, D and E. Leverage ratios based on net adjusted financial debt and net adjusted equity 28 In EUR thousand December 31, 2020 December 31, 2021 December 31, 2022 June 30, 2023 Current liabilities Current maturities of long-term bank loans 10,232 126,180 12,815 12,020 Current maturities of other long-term loans 4,021 16,401 10,000 5,000 Bonds 10,600 19,806 18,714 35,635 Non-current liabilities Long-term bank loans 134,520 39,093 229,466 242,364 Other long-term loans 49,396 37,221 21,582 27,915 Bonds 72,124 117,493 91,714 103,943 Financial debt (A) 280,893 356,194 384,291 426,877 Less: Cash and cash equivalents (66,845) (41,229) (46,458) (73,870) Marketable securities (1,761) (1,946) (2,836) - Short term deposits (8,113) (28,410) 0 (1,007) Net financial debt (B) 204,174 284,609 334,997 352,000 Total equity (C) 125,026 114,107 83,077 118,840 Financial debt (A) 280,893 356,194 384,291 426,877 CAP (D) 405,919 470,301 467,368 545,717 Financial debt to CAP (A/D) 69% 76% 82% 78% Net financial debt (B/D) 50% 61% 72% 65% In EUR thousand December 31, 2020 December 31, 2021 December 31, 2022 June 30, 2023 Financial debt Loans from banks (*) 144,752 165,654 246,463 258,978 Other long-term loans 53,417 53,622 31,582 32,915 Bonds (*) 82,724 139,664 111,911 141,447 Other interest-bearing liabilities 9,702 3,996 - - Financial debt (A) 290,595 362,936 389,956 433,340 Less: Financing of projects and other hedging-related transactions (207,739) (223,272) (278,045) (291,893) Cash and cash equivalents (66,845) (41,229) (46,458) (73,870) Marketable securities (1,761) (1,946) (2,836) - Short term deposits (8,113) (28,410) - (1,007) Adjusted net financial debt (A) (**) 6,137 68,079 62,617 66,570 Total equity 125,026 114,107 83,077 118,840 Add (deduct): Changes in the fair value of hedges regarding electricity prices (PPA) (10,238) 15,671 46,153 6,654 Total adjusted equity (B) (**) 114,788 129,778 129,230 125,494 Net adjusted CAP (C) 120,925 197,857 191,847 192,064 Adjusted net financial debt to adjusted net CAP (A/C) 5.1% 34.5% 32.6% 34.7%