Exhibit 99.2
Link to searchable text of slide shown above
Link to searchable text of slide shown above
Link to searchable text of slide shown above
Link to searchable text of slide shown above
Link to searchable text of slide shown above

Link to searchable text of slide shown above

Link to searchable text of slide shown above
Link to searchable text of slide shown above
Link to searchable text of slide shown above
Link to searchable text of slide shown above
Link to searchable text of slide shown above
Link to searchable text of slide shown above
Link to searchable text of slide shown above
Link to searchable text of slide shown above
Link to searchable text of slide shown above
Link to searchable text of slide shown above
Link to searchable text of slide shown above
Link to searchable text of slide shown above
Link to searchable text of slide shown above
Link to searchable text of slide shown above

Link to searchable text of slide shown above
Link to searchable text of slide shown above
Link to searchable text of slide shown above
Link to searchable text of slide shown above
Link to searchable text of slide shown above
Link to searchable text of slide shown above
Link to searchable text of slide shown above
Link to searchable text of slide shown above
Link to searchable text of slide shown above
Link to searchable text of slide shown above
Link to searchable text of slide shown above
Link to searchable text of slide shown above
Link to searchable text of slide shown above

Link to searchable text of slide shown above
Link to searchable text of slide shown above
Link to searchable text of slide shown above
Link to searchable text of slide shown above
Link to searchable text of slide shown above
Link to searchable text of slide shown above
Link to searchable text of slide shown above

Link to searchable text of slide shown above
Link to searchable text of slide shown above
Link to searchable text of slide shown above
Link to searchable text of slide shown above
Link to searchable text of slide shown above
Link to searchable text of slide shown above
Link to searchable text of slide shown above
Link to searchable text of slide shown above
Searchable text section of graphics shown above
Creating the Premier
Competitive Energy Company
Investor Presentation
December 19, 2005
1
Safe Harbor Language
This presentation includes “forward-looking statements” within the meaning of the Private Securities Litigation Reform Act of 1995. These forward-looking statements include, for example, statements regarding benefits of the proposed merger, the likelihood and timing of closing of the proposed merger, integration plans, expected synergies, anticipated future financial and operating performance and results, including estimates for growth. Any statements that express, or involve discussions as to expectations, beliefs, plans, objectives, assumptions or future events or performance (often, but not always, through the use of words or phrases such as “will likely result,” “are expected to,” “will continue,” “is anticipated,” “believe,” “could,” “estimated,” “may,” “plan,” “potential,” “projection,” “target,” “outlook”) are not statements of historical facts and may be forward-looking. There are a number of risks and uncertainties that could cause actual results to differ materially from the forward-looking statements made herein. These risks and uncertainties include, for example, the ability to obtain governmental approvals of the transaction on the proposed terms and schedule; the failure of FPL Group, Inc. (FPL Group) or Constellation Energy Group, Inc. (Constellation Energy) stockholders to approve the transaction; the risk that the businesses will not be integrated successfully or that anticipated synergies will not be achieved or will take longer to achieve than expected; disruption from the transaction making it more difficult to maintain relationships with customers, employees, suppliers or governmental entities; unexpected transaction costs or liabilities; economic conditions; and other specific factors discussed in documents filed with the Securities and Exchange Commission by both FPL Group and Constellation Energy. These risks, as well as other risks associated with the merger, will be more fully discussed in the joint proxy statement/prospectus that will be included in the Registration Statement on Form S-4 that Constellation Energy will file with the SEC in connection with the proposed merger. Readers are cautioned not to place undue reliance on these forward-looking statements, which speak only as of the date of this presentation. Neither Constellation Energy nor FPL Group undertakes any obligation to publicly release any revision to its forward-looking statements to reflect events or circumstances after the date of this presentation.
2
Use Of Non-GAAP Financial Measures
It is important to recognize that in certain instances in this presentation we have adjusted actual financial results, prepared in accordance with generally accepted accounting principles (GAAP), for certain items, including special items (which are defined as items not related to the ongoing, underlying business or which distort comparability of results) and certain economic, non-qualifying hedges. We have also provided earnings estimates in terms of adjusted earnings, excluding special items and certain economic, non-qualifying hedges. We believe that the resulting adjusted, non-GAAP information provides a picture of results that is comparable among periods since it excludes the impact of items, the size and nature of which can make period to period comparisons difficult and potentially confusing. However, investors should note that non-GAAP measures involve judgments by management. We note that such information is not in accordance with GAAP and should not be viewed as an alternative to GAAP information. A reconciliation of adjusted information to GAAP is included either on the slide where the information is appears or in the appendix to this presentation. These slides are only intended to be reviewed in conjunction with the oral presentation to which they relate.
3
Non-Solicitation
This communication is not a solicitation of a proxy from any security holder of FPL Group or Constellation Energy. Constellation Energy intends to file with the Securities and Exchange Commission a registration statement that will include a joint proxy statement/prospectus of Constellation Energy and FPL Group and other relevant documents to be mailed to security holders in connection with the proposed transaction. WE URGE INVESTORS TO READ THE JOINT PROXY STATEMENT/PROSPECTUS AND ANY OTHER RELEVANT DOCUMENTS WHEN THEY BECOME AVAILABLE, BECAUSE THEY WILL CONTAIN IMPORTANT INFORMATION ABOUT FPL GROUP, CONSTELLATION ENERGY, AND THE PROPOSED TRANSACTION. A definitive proxy statement will be sent to security holders of FPL Group and Constellation Energy seeking approval of the proposed transaction. Investors and security holders will be able to obtain these materials (when they are available) and other documents filed with the SEC free of charge at the SEC’s website, www.sec.gov. In addition, a copy of the joint proxy statement/prospectus (when it becomes available) may be obtained free of charge from Constellation Energy, Shareholder Services, 750 E. Pratt Street, Baltimore, MD 21201, or from FPL Group, Shareholder Services, P.O. Box 14000, 700 Universe Blvd., Juno Beach, Florida 33408-0420.
This communication shall not constitute an offer to sell or the solicitation of an offer to buy any securities, nor shall there be any sale of securities in any jurisdiction in which such offer, solicitation or sale would be unlawful prior to registration or qualification under the securities laws of such jurisdiction. No offering of securities shall be made except by means of a prospectus meeting the requirements of Section 10 of the Securities Act of 1933, as amended.
FPL Group, Constellation Energy, and their respective directors and executive officers of FPL Group and Constellation Energy and other persons may be deemed to be participants in the solicitation of proxies in respect of the proposed transaction. Information regarding FPL Group’s directors and executive officers is available in its proxy statement filed with the SEC by FPL Group on April 5, 2005, and information regarding Constellation Energy’s directors and executive officers is available in its proxy statement filed with the SEC by Constellation Energy on April 13, 2005. Information regarding J. Brian Ferguson, a director of FPL Group elected since the the date of the filing of the 2005 definitive proxy statement, can be found in the Company’s filing on Form 10-Q dated August 4, 2005. Other information regarding the participants in the proxy solicitation and a description of their direct and indirect interests, by security holdings or otherwise, will be contained in the joint proxy statement/prospectus and other relevant materials to be filed with the SEC when they become available.
4
Agenda
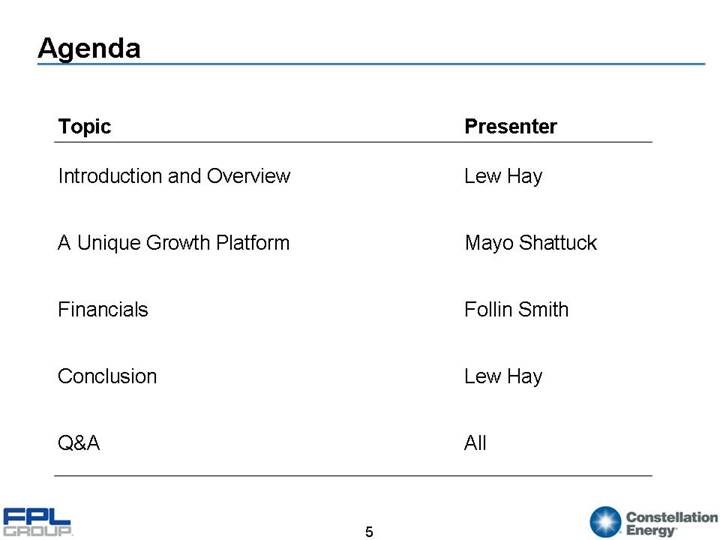
Topic | | Presenter |
| | |
Introduction and Overview | | Lew Hay |
| | |
A Unique Growth Platform | | Mayo Shattuck |
| | |
Financials | | Follin Smith |
| | |
Conclusion | | Lew Hay |
| | |
Q&A | | All |
5
Introduction and Overview
6
Today We Are Announcing Our Agreement To Merge Our Two Companies
| | [LOGO] => | | [LOGO] | | <= [LOGO] | |
| | | | | | | |
Regulated Electric Customers (millions) (1) | | 4.3 | | 5.5 | | 1.2 | |
| | | | | | | |
Generation – Owned Capacity (MWs) (2) | | 33,333 | | 45,194 | | 11,861 | |
| | | | | | | |
Nuclear (MWs) (2) | | 4,434 | | 8,228 | | 3,794 | |
| | | | | | | |
Fossil (MWs) | | 25,112 | | 32,722 | | 7,610 | |
| | | | | | | |
Wind (MWs) | | 3,211 | | 3,211 | | — | |
| | | | | | | |
Wholesale Competitive Supply (Peak MWs) (1) | | 2,000 | | 22,040 | | 20,040 | |
| | | | | | | |
Retail Competitive Supply (Peak MWs) (1) | | 1,000 | | 16,550 | | 15,550 | |
| | | | | | | |
Revenue (billions) (3) | | $ | 11.3 | | $ | 26.5 | | $ | 15.2 | |
| | | | | | | |
Adjusted Earnings (millions) (3) | | $ | 992 | | $ | 1,576 | | $ | 584 | |
| | | | | | | |
Market Capitalization (billions) (4) | | $ | 17.0 | | $ | 28.0 | | $ | 11.0 | |
| | | | | | | |
Enterprise Value (billions) (4) | | $ | 25.6 | | 40.6 | | $ | 15.0 | |
Note: Combined amounts exclude the effects of synergies, as well as purchase accounting, which are expected to be favorable
(1) As of 9/30/05
(2) Generation capacity as of 12/5/05 plus 419 MW for Duane Arnold, which is expected to close in the first quarter of 2006
(3) Trailing 12-months as of 9/30/05
(4) Source: Bloomberg as of 12/16/05
See appendix
7
Key Transaction Terms
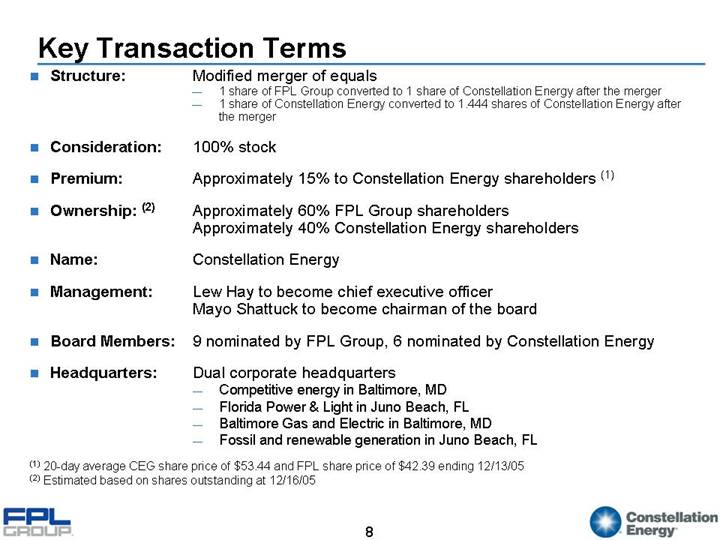
• Structure: | Modified merger of equals
• 1 share of FPL Group converted to 1 share of Constellation Energy after the merger
• 1 share of Constellation Energy converted to 1.444 shares of Constellation Energy after the merger |
| |
• Consideration: | 100% stock |
| |
• Premium: | Approximately 15% to Constellation Energy shareholders (1) |
| |
• Ownership: (2) | Approximately 60% FPL Group shareholders
Approximately 40% Constellation Energy shareholders |
| |
• Name: | Constellation Energy |
| |
• Management: | Lew Hay to become chief executive officer
Mayo Shattuck to become chairman of the board |
| |
• Board Members: | 9 nominated by FPL Group, 6 nominated by Constellation Energy |
| |
• Headquarters: | Dual corporate headquarters
• Competitive energy in Baltimore, MD
• Florida Power & Light in Juno Beach, FL
• Baltimore Gas and Electric in Baltimore, MD
• Fossil and renewable generation in Juno Beach, FL |
(1) 20-day average CEG share price of $53.44 and FPL share price of $42.39 ending 12/13/05
(2) Estimated based on shares outstanding at 12/16/05
8
Organizational Structure
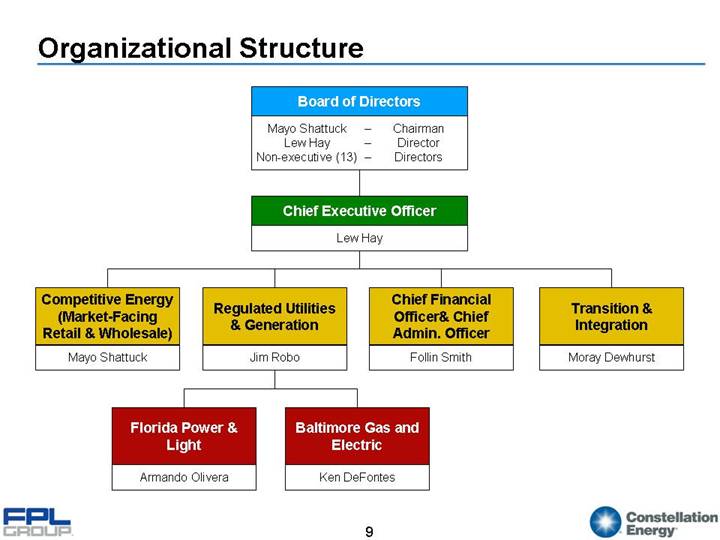
Board of Directors |
Mayo Shattuck | – | Chairman |
Lew Hay | – | Director |
Non-executive (13) | – | Directors |
| | |
Chief Executive Officer |
Lew Hay |
Competitive Energy
(Market-Facing
Retail & Wholesale) | Regulated Utilities
& Generation | Chief Financial
Officer& Chief
Admin. Officer | Transition &
Integration |
Mayo Shattuck | Jim Robo | Follin Smith | Moray Dewhurst |
Florida Power &
Light | Baltimore Gas and
Electric |
Armando Olivera | Ken DeFontes |
9
The New Entity: A Unique And Compelling Combination
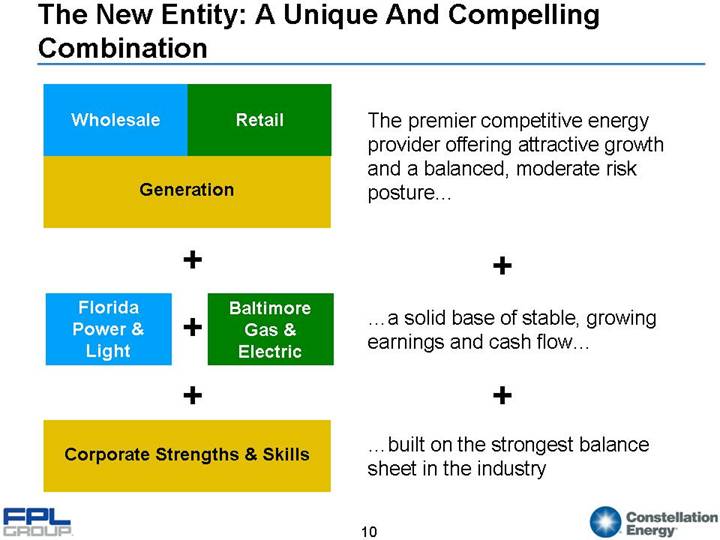
Wholesale | Retail | The premier competitive energy provider offering attractive growth and a balanced, moderate risk posture… |
| |
Generation | | |
| | | |
+ | + |
Florida
Power &
Light | + | Baltimore
Gas &
Electric | …a solid base of stable, growing earnings and cash flow… |
| | | |
+ | + |
| | | |
Corporate Strengths & Skills | …built on the strongest balance sheet in the industry |
| | | | |
10
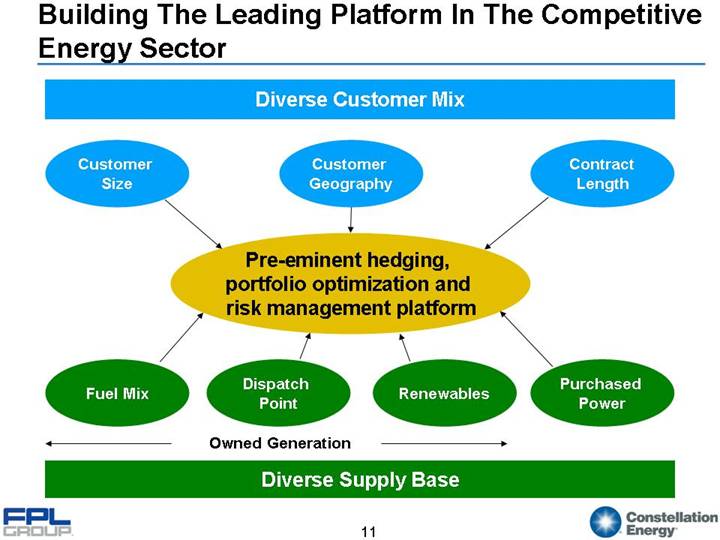
Building The Leading Platform In The Competitive Energy Sector
Diverse Customer Mix |
|
Customer
Size | Customer
Geography | Contract
Length |
| | |
Pre-eminent hedging,
portfolio optimization and
risk management platform |
| | |
Fuel Mix | Dispatch
Point | Renewables | Purchased
Power |
| | | |
Owned Generation | |
| |
Diverse Supply Base |
| | | | | |
11
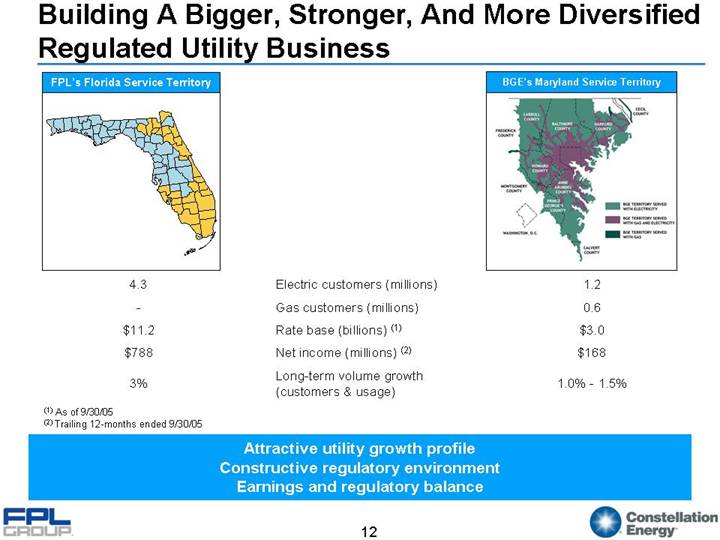
Building A Bigger, Stronger, And More Diversified Regulated Utility Business
FPL’s Florida Service Territory | | | | BGE’s Maryland Service Territory |
[GRAPHIC] | | | | [GRAPHIC] |
| | | | |
4.3 | | Electric customers (millions) | | 1.2 |
| | | | |
— | | Gas customers (millions) | | 0.6 |
| | | | |
$11.2 | | Rate base (billions) (1) | | $3.0 |
| | | | |
$788 | | Net income (millions) (2) | | $168 |
| | | | |
3% | | Long-term volume growth (customers & usage) | | 1.0% - 1.5% |
(1) As of 9/30/05
(2) Trailing 12-months ended 9/30/05
Attractive utility growth profile
Constructive regulatory environment
Earnings and regulatory balance
12
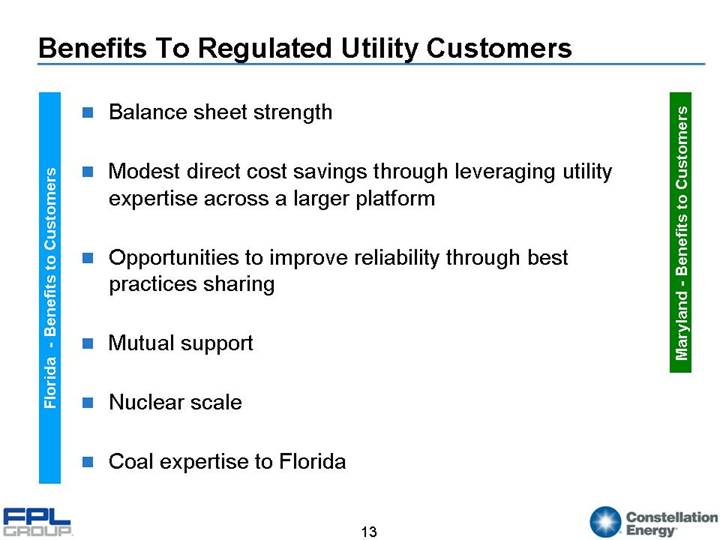
Benefits To Regulated Utility Customers
Florida - Benefits to Customers
• Balance sheet strength
• Modest direct cost savings through leveraging utility expertise across a larger platform
• Opportunities to improve reliability through best practices sharing
• Mutual support
• Nuclear scale
• Coal expertise to Florida
Maryland - Benefits to Customers
13
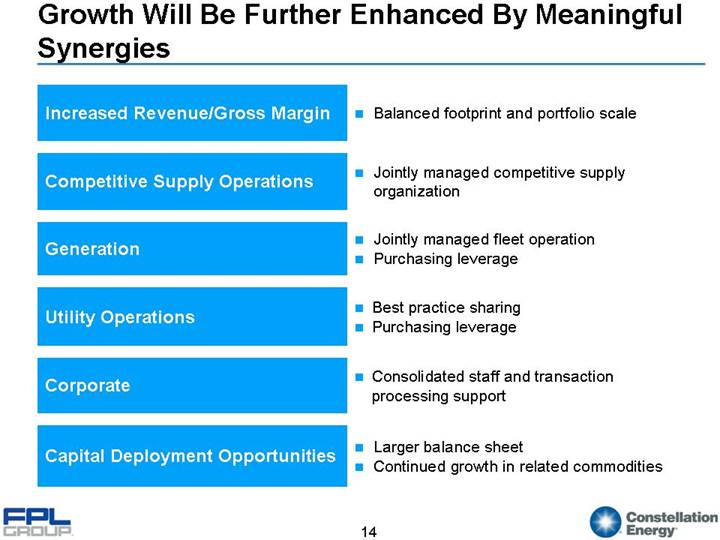
Growth Will Be Further Enhanced By Meaningful Synergies
Increased Revenue/Gross Margin | | • Balanced footprint and portfolio scale |
| | |
Competitive Supply Operations | | • Jointly managed competitive supply organization |
| | |
Generation | | • Jointly managed fleet operation
• Purchasing leverage |
| | |
Utility Operations | | • Best practice sharing
• Purchasing leverage |
| | |
Corporate | | • Consolidated staff and transaction processing support |
| | |
Capital Deployment Opportunities | | • Larger balance sheet
• Continued growth in related commodities |
14
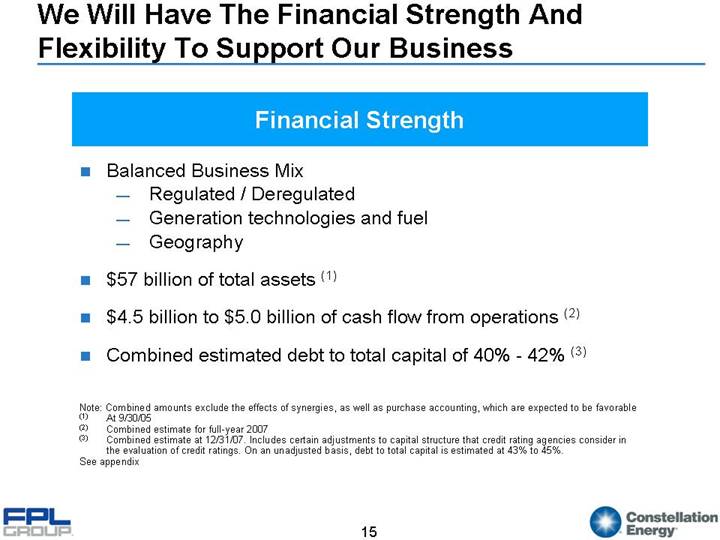
We Will Have The Financial Strength And Flexibility To Support Our Business
Financial Strength
• Balanced Business Mix
• Regulated / Deregulated
• Generation technologies and fuel
• Geography
• $57 billion of total assets (1)
• $4.5 billion to $5.0 billion of cash flow from operations (2)
• Combined estimated debt to total capital of 40% - 42% (3)
Note: Combined amounts exclude the effects of synergies, as well as purchase accounting, which are expected to be favorable
(1) At 9/30/05
(2) Combined estimate for full-year 2007
(3) Combined estimate at 12/31/07. Includes certain adjustments to capital structure that credit rating agencies consider in the evaluation of credit ratings. On an unadjusted basis, debt to total capital is estimated at 43% to 45%.
See appendix
15
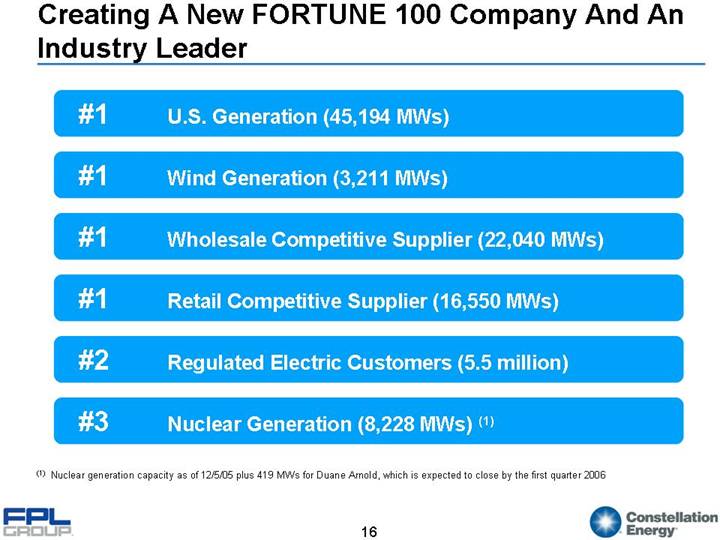
Creating A New FORTUNE 100 Company And An Industry Leader
#1 U.S. Generation (45,194 MWs)
#1 Wind Generation (3,211 MWs)
#1 Wholesale Competitive Supplier (22,040 MWs)
#1 Retail Competitive Supplier (16,550 MWs)
#2 Regulated Electric Customers (5.5 million)
#3 Nuclear Generation (8,228 MWs) (1)
(1) Nuclear generation capacity as of 12/5/05 plus 419 MWs for Duane Arnold, which is expected to close by the first quarter 2006
16
A Unique Growth Platform
17
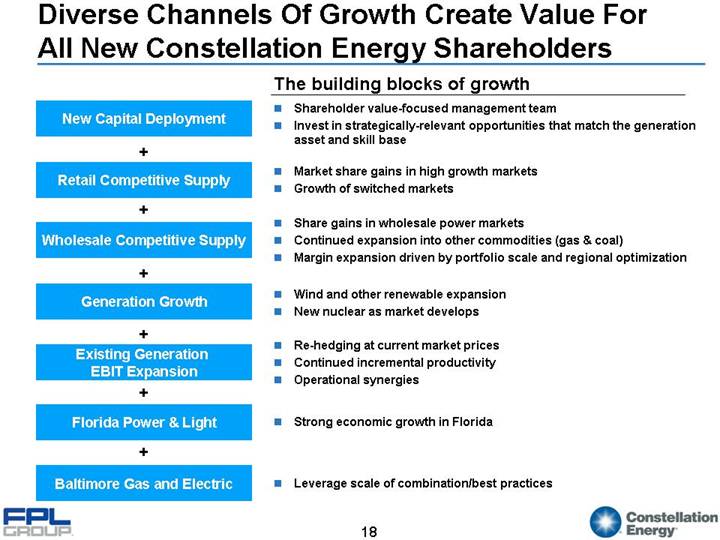
Diverse Channels Of Growth Create Value For All New Constellation Energy Shareholders
| | The building blocks of growth |
| | |
New Capital Deployment | | • Shareholder value-focused management team • Invest in strategically-relevant opportunities that match the generation asset and skill base |
+ | | |
Retail Competitive Supply | | • Market share gains in high growth markets
• Growth of switched markets |
+ | | |
Wholesale Competitive Supply | | • Share gains in wholesale power markets
• Continued expansion into other commodities (gas & coal)
• Margin expansion driven by portfolio scale and regional optimization |
+ | | |
Generation Growth | | • Wind and other renewable expansion
• New nuclear as market develops |
+ | | |
Existing Generation EBIT Expansion | | • Re-hedging at current market prices
• Continued incremental productivity
• Operational synergies |
+ | | |
Florida Power & Light | | • Strong economic growth in Florida |
+ | | |
Baltimore Gas and Electric | | • Leverage scale of combination/best practices |
18
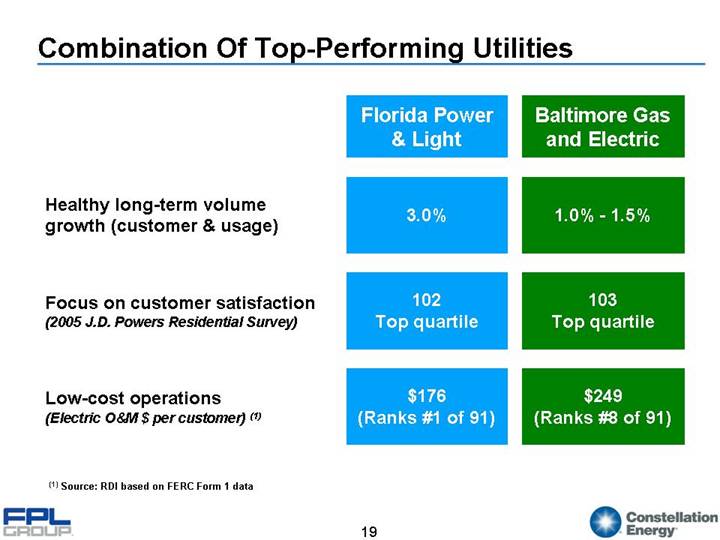
Combination Of Top-Performing Utilities
| | Florida Power
& Light | | Baltimore Gas
and Electric |
| | | | |
Healthy long-term volume growth (customer & usage) | | 3.0% | | 1.0% - 1.5% |
| | | | |
Focus on customer satisfaction (2005 J.D. Powers Residential Survey) | | 102
Top quartile | | 103
Top quartile |
| | | | |
Low-cost operations (Electric O&M $ per customer) (1) | | $176
(Ranks #1 of 91) | | $249
(Ranks #8 of 91) |
(1) Source: RDI based on FERC Form 1 data
19
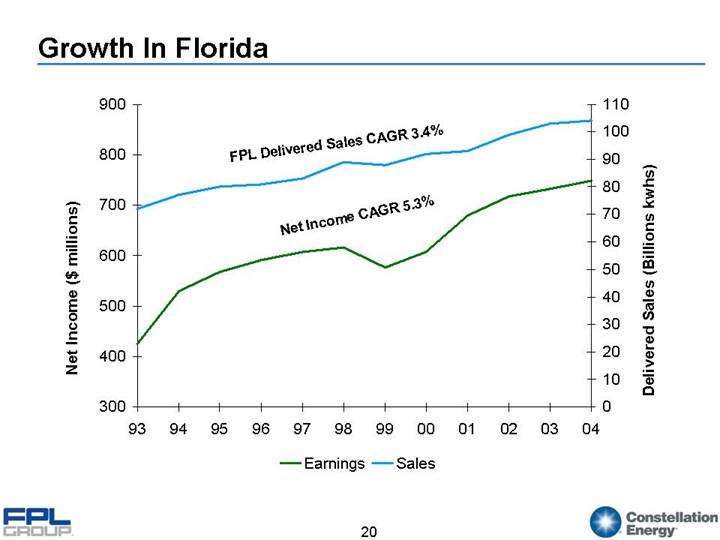
Growth In Florida
[CHART]
20
Generation Margin Expansion Before Synergies
Constellation Energy – Mid-Atlantic Fleet | FPL Energy – Merchant Generation |
| |
[CHART] | [CHART] |
• Other gross margin expansion opportunities
• Productivity initiatives to increase output
• Future PPA expirations
• | August 2009 | Nine Mile Point Unit 1 (620 MWs) |
• | November 2011 | Nine Mile Point Unit 2 (941 MWs) (1) |
• | February 2014 | Duane Arnold (419 MWs) (2) |
• | August 2014 | Ginna (498 MWs) (3) |
(1) A revenue sharing agreement with previous owners begins upon PPA expiration
(2) Expected to close in the first quarter of 2006
(3) Excludes planned uprate of 17% in 2006
See appendix
21
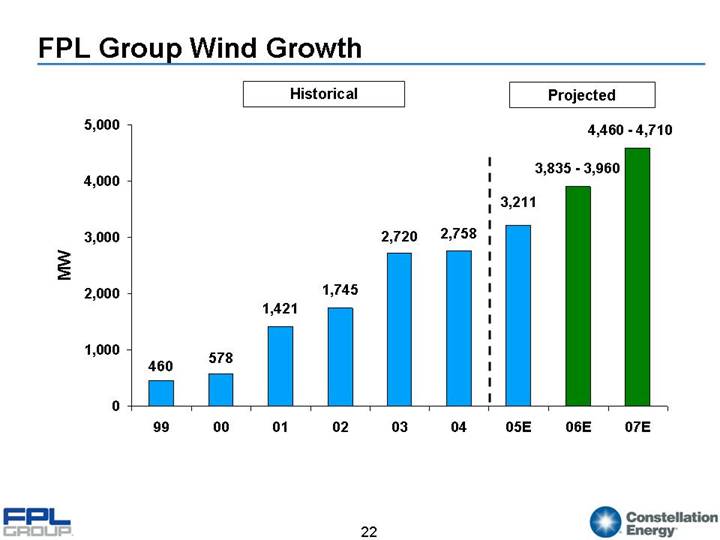
FPL Group Wind Growth
[CHART]
22
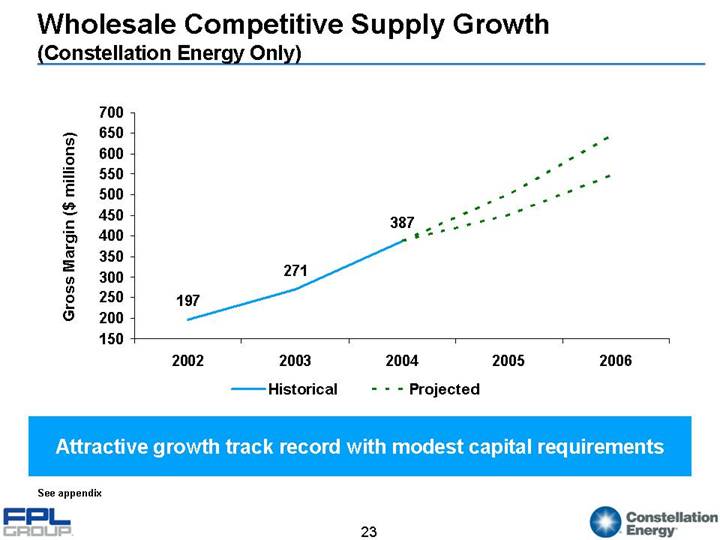
Wholesale Competitive Supply Growth
(Constellation Energy Only)
[CHART]
Attractive growth track record with modest capital requirements
See appendix
23
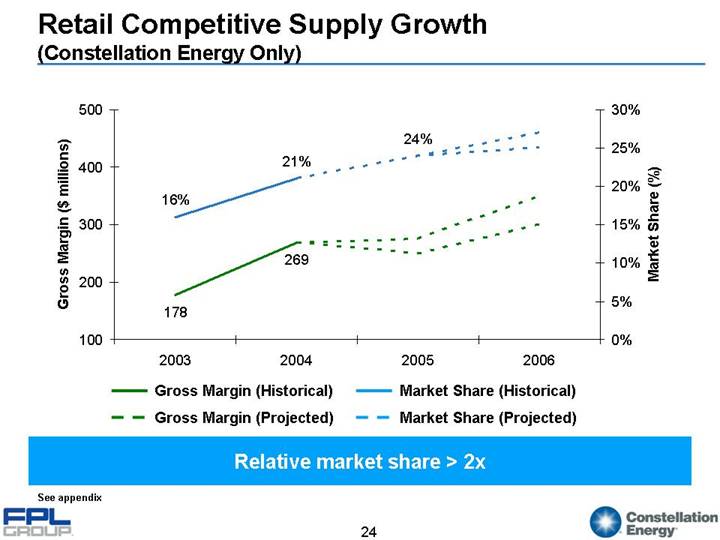
Retail Competitive Supply Growth
(Constellation Energy Only)
[CHART]
Relative market share > 2x
See appendix
24
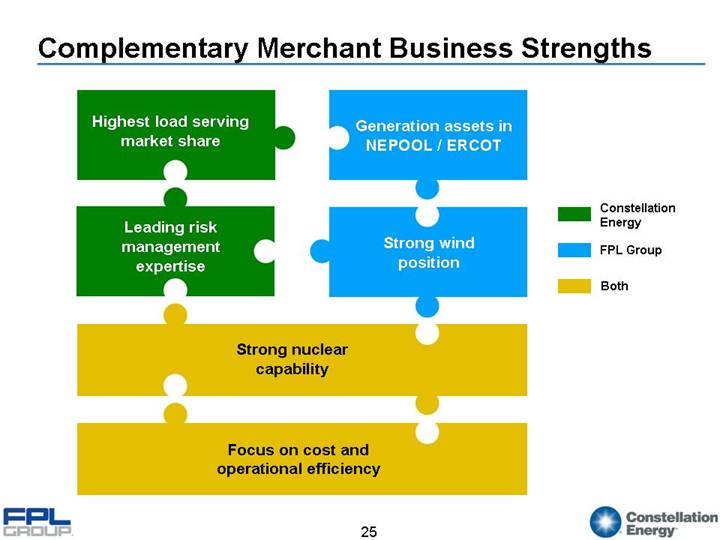
Complementary Merchant Business Strengths
* Highest load serving
market share | ^ Generation assets in
NEPOOL / ERCOT |
| |
* Leading risk
management
expertise | ^ Strong wind
position |
| |
** Strong nuclear
capability |
| |
** Focus on cost and
operational efficiency |
* Constellation Energy
^ FPL Group
** Both
25
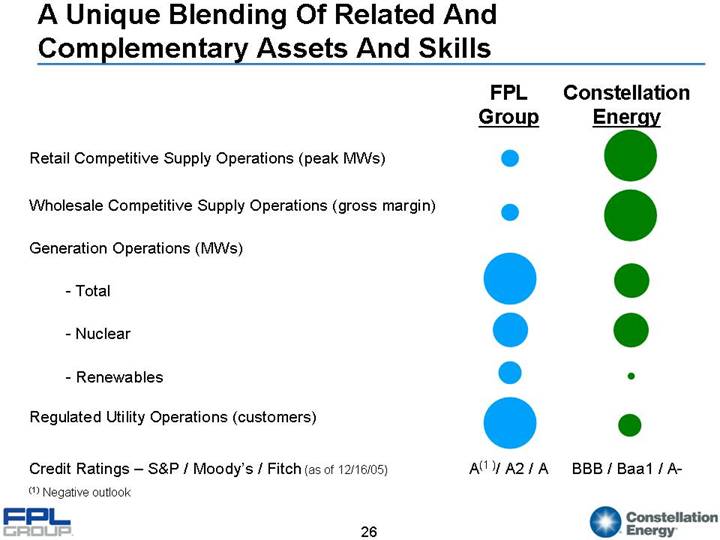
A Unique Blending Of Related And Complementary Assets And Skills
| | FPL
Group | | Constellation
Energy | |
| | | | | |
Retail Competitive Supply Operations (peak MWs) | | 
| | 
| |
| | | | | |
Wholesale Competitive Supply Operations (gross margin) | |
| | 
| |
| | | | | |
Generation Operations (MWs) | | | | | |
| | 
| | 
| |
- Total | | | | | |
| | | | | |
- Nuclear | | 
| | 
| |
| | | | | |
- Renewables | |
| | 
| |
| | | | | |
Regulated Utility Operations (customers) | |
| | 
| |
| | | | | |
Credit Ratings – S&P / Moody’s / Fitch (as of 12/16/05) | | A(1) / A2 / A | | BBB / Baa1 / A- | |
(1) Negative outlook
26
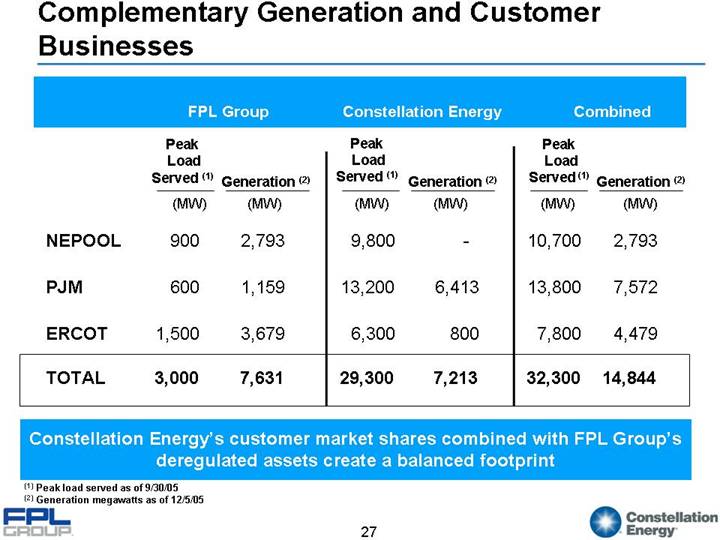
Complementary Generation and Customer Businesses
| | FPL Group | | Constellation Energy | | Combined | |
| | Peak | | | | Peak | | | | Peak | | | |
| | Load | | | | Load | | | | Load | | | |
| | Served (1) | | Generation (2) | | Served (1) | | Generation (2) | | Served (1) | | Generation (2) | |
| | (MW) | | (MW) | | (MW) | | (MW) | | (MW) | | (MW) | |
| | | | | | | | | | | | | |
NEPOOL | | 900 | | 2,793 | | 9,800 | | — | | 10,700 | | 2,793 | |
| | | | | | | | | | | | | |
PJM | | 600 | | 1,159 | | 13,200 | | 6,413 | | 13,800 | | 7,572 | |
| | | | | | | | | | | | | |
ERCOT | | 1,500 | | 3,679 | | 6,300 | | 800 | | 7,800 | | 4,479 | |
| | | | | | | | | | | | | |
TOTAL | | 3,000 | | 7,631 | | 29,300 | | 7,213 | | 32,300 | | 14,844 | |
Constellation Energy’s customer market shares combined with FPL Group’s deregulated assets create a balanced footprint
(1) Peak load served as of 9/30/05
(2) Generation megawatts as of 12/5/05
27
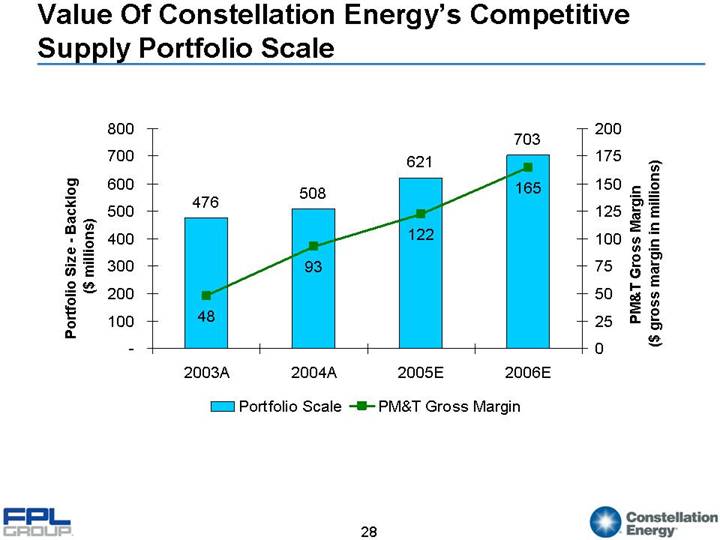
Value Of Constellation Energy’s Competitive Supply Portfolio Scale
[CHART]
28
Other Complementary Competitive Skills
• Pairing FPL Group’s leading wind business with Constellation Energy’s retail business
• Ability to market “green” products
• Applying FPL Group’s Qualifying Facility restructuring expertise to Constellation Energy’s Qualifying Facilities
• Marrying Constellation Energy’s gas expertise with FPL Group’s Texas and New England deregulated gas plants
29
Financials
30
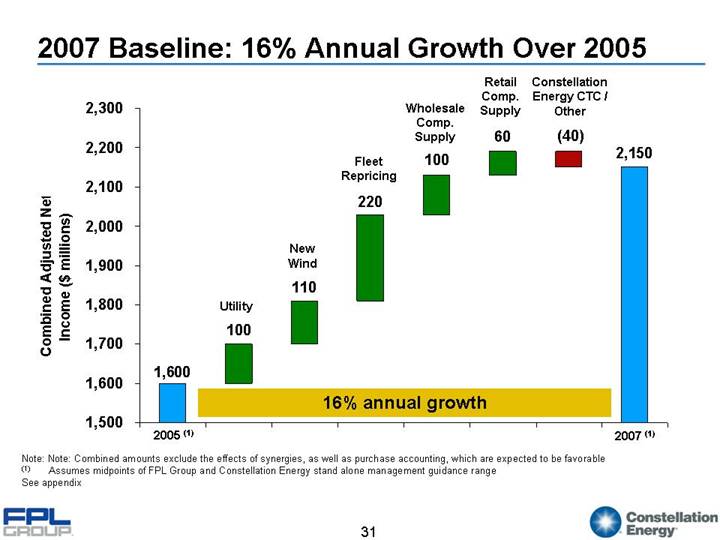
2007 Baseline: 16% Annual Growth Over 2005
[CHART]
Note: Note: Combined amounts exclude the effects of synergies, as well as purchase accounting, which are expected to be favorable
(1) Assumes midpoints of FPL Group and Constellation Energy stand alone management guidance range
See appendix
31
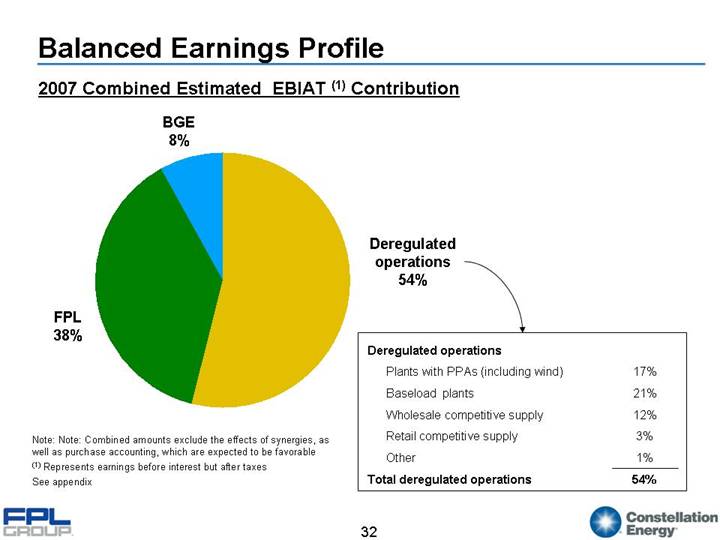
Balanced Earnings Profile
2007 Combined Estimated EBIAT (1) Contribution
[CHART]
Deregulated operations | | | |
| | | |
Plants with PPAs (including wind) | | 17 | % |
Baseload plants | | 21 | % |
Wholesale competitive supply | | 12 | % |
Retail competitive supply | | 3 | % |
Other | | 1 | % |
Total deregulated operations | | 54 | % |
Note: Note: Combined amounts exclude the effects of synergies, as well as purchase accounting, which are expected to be favorable
(1) Represents earnings before interest but after taxes
See appendix
32
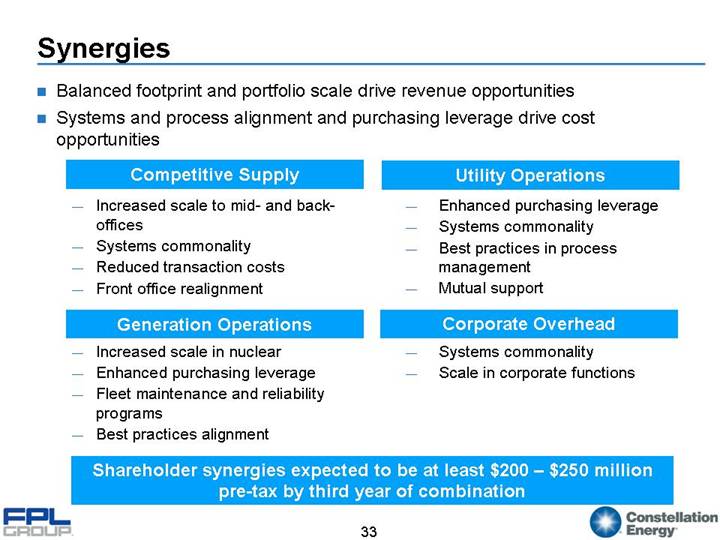
Synergies
• Balanced footprint and portfolio scale drive revenue opportunities
• Systems and process alignment and purchasing leverage drive cost opportunities
Competitive Supply | | Utility Operations |
| | |
• Increased scale to mid- and back-offices • Systems commonality • Reduced transaction costs • Front office realignment | | • Enhanced purchasing leverage • Systems commonality • Best practices in process management • Mutual support |
| | |
Generation Operations | | Corporate Overhead |
| | |
• Increased scale in nuclear • Enhanced purchasing leverage • Fleet maintenance and reliability programs • Best practices alignment | | • Systems commonality • Scale in corporate functions |
Shareholder synergies expected to be at least $200 – $250 million pre-tax by third year of combination
33
Growing Dividends
Current FPL Group 2005 dividend | | $ | 1.42 | |
| | | |
Current Constellation Energy 2005 dividend | | $ | 1.34 | |
| | | |
Exchange ratio | | 1.444 | |
| | | |
Effective Constellation Energy dividend increase (post-closing) (1) | | 53 | % |
Significant value to Constellation Energy shareholders through 53% dividend increase
(1) Dividends are based on current levels and do not contemplate changes that either board may consider prior to closing
34
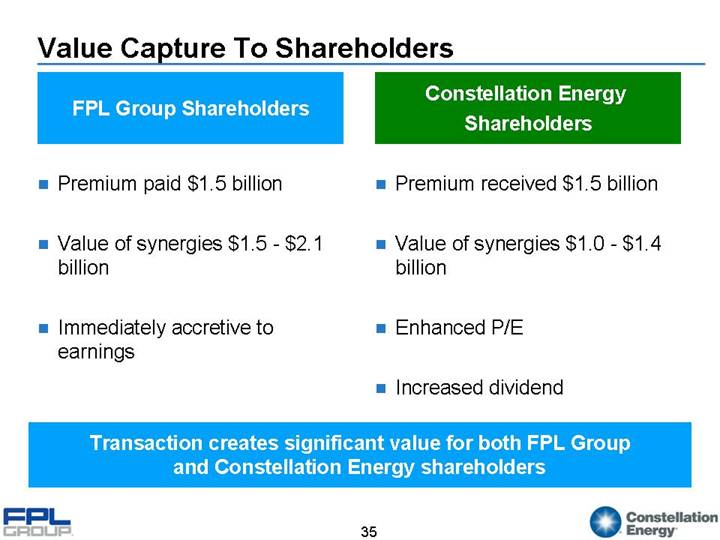
Value Capture To Shareholders
FPL Group Shareholders | | Constellation Energy Shareholders |
| | |
• Premium paid $1.5 billion | | • Premium received $1.5 billion |
| | |
• Value of synergies $1.5 - $2.1 billion | | • Value of synergies $1.0 - $1.4 billion |
| | |
• Immediately accretive to earnings | | • Enhanced P/E |
| | |
| | • Increased dividend |
Transaction creates significant value for both FPL Group and Constellation Energy shareholders
35
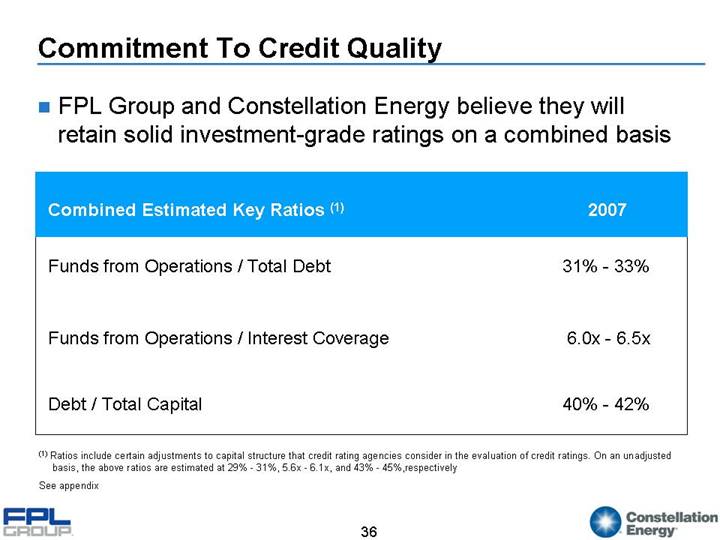
Commitment To Credit Quality
• FPL Group and Constellation Energy believe they will retain solid investment-grade ratings on a combined basis
Combined Estimated Key Ratios (1) | | 2007 | |
| | | |
Funds from Operations / Total Debt | | 31% - 33% | |
| | | |
Funds from Operations / Interest Coverage | | 6.0x - 6.5x | |
| | | |
Debt / Total Capital | | 40% - 42% | |
(1) Ratios include certain adjustments to capital structure that credit rating agencies consider in the evaluation of credit ratings. On an unadjusted basis, the above ratios are estimated at 29% - 31%, 5.6x - 6.1x, and 43% - 45%, respectively
See appendix
36
Conclusions
37
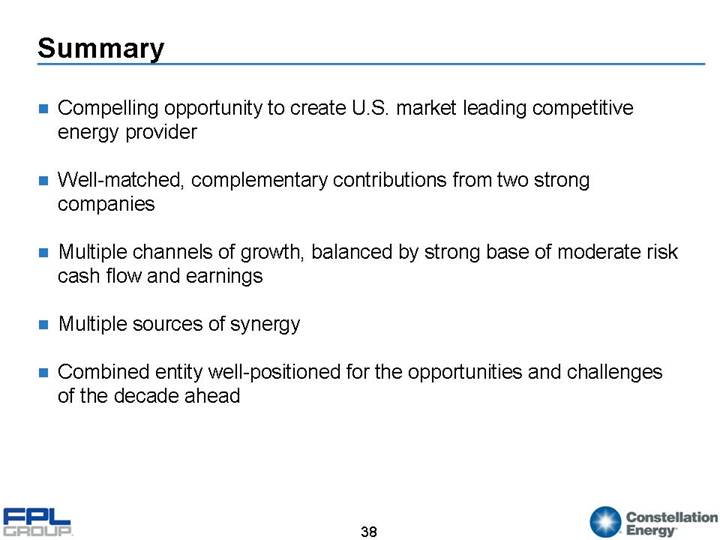
Summary
• Compelling opportunity to create U.S. market leading competitive energy provider
• Well-matched, complementary contributions from two strong companies
• Multiple channels of growth, balanced by strong base of moderate risk cash flow and earnings
• Multiple sources of synergy
• Combined entity well-positioned for the opportunities and challenges of the decade ahead
38
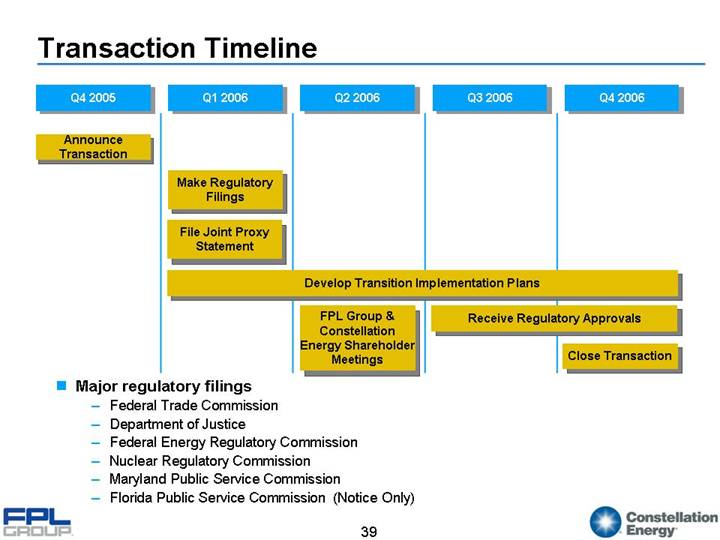
Transaction Timeline
Q4 2005 | | Q1 2006 | | Q2 2006 | | Q3 2006 | | Q4 2006 |
| | | | | | | | |
Announce Transaction | | | | | | | | |
| | | | | | | | |
| | Make Regulatory Filings | | | | | | |
| | | | | | | | |
| | File Joint Proxy Statement | | | | | | |
| | | | | | | | |
| | Develop Transition Implementation Plans |
| | | | | | | | |
| | | | FPL Group & | | Receive Regulatory Approvals |
| | | | Constellation
Energy Shareholder Meetings | | | | Close Transaction |
• Major regulatory filings
• Federal Trade Commission
• Department of Justice
• Federal Energy Regulatory Commission
• Nuclear Regulatory Commission
• Maryland Public Service Commission
• Florida Public Service Commission (Notice Only)
39
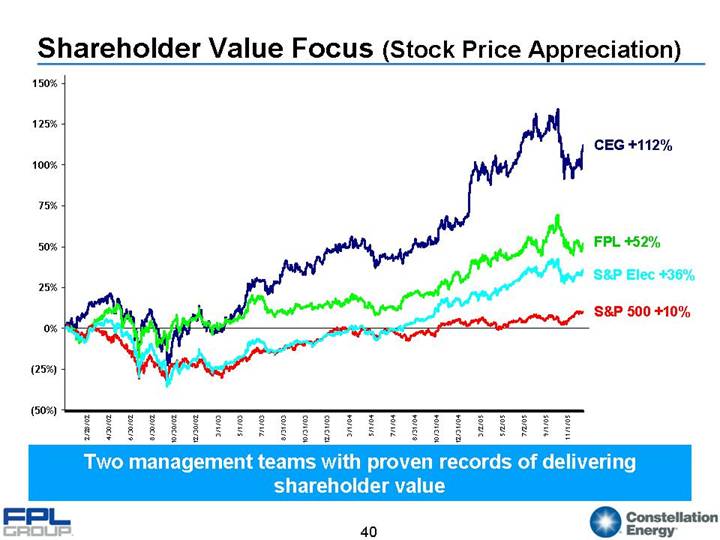
Shareholder Value Focus (Stock Price Appreciation)
[CHART]
Two management teams with proven records of delivering shareholder value
40
Appendix
41
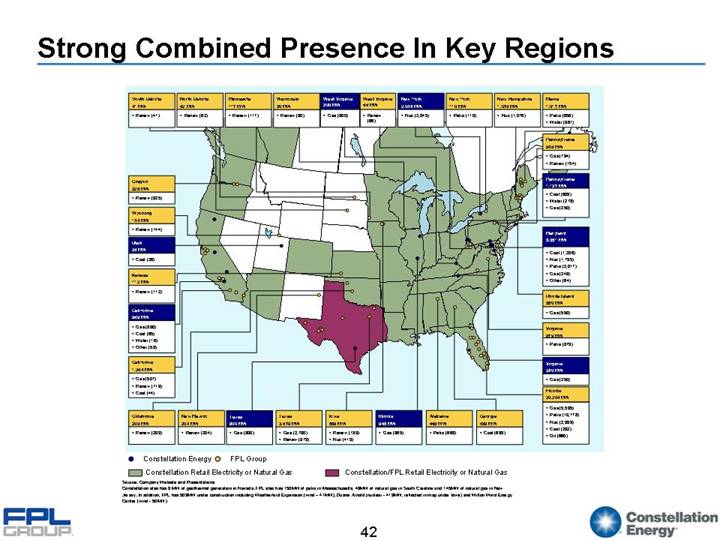
Strong Combined Presence In Key Regions
[GRAPHIC]
Source: Company Website and Presentations
Constellation also has 9 MW of geothermal generation in Nevada. FPL also has 150MW of petro in Massachusetts, 49MW of natural gas in South Carolina and 145MW of natural gas in New Jersey. In addition, FPL has 509MW under construction including Weatherford Expansion (wind – 41MW), Duane Arnold (nuclear - 419MW, reflected in map under Iowa) and Wilton Wind Energy Center (wind - 50MW)
42
Synergies
• Retained revenue and cost synergies of at least $200 - $250 million by year three
• Excludes costs to achieve
• Approximately one-third in year one and second third achieved in year two
• Accretive to both former Constellation Energy and FPL Group shareholders in first full year of combined operations, excluding costs to achieve and favorable effects of purchase accounting
• Estimate accretion of 6% - 8% after year one, excluding costs to achieve and favorable purchase accounting
43
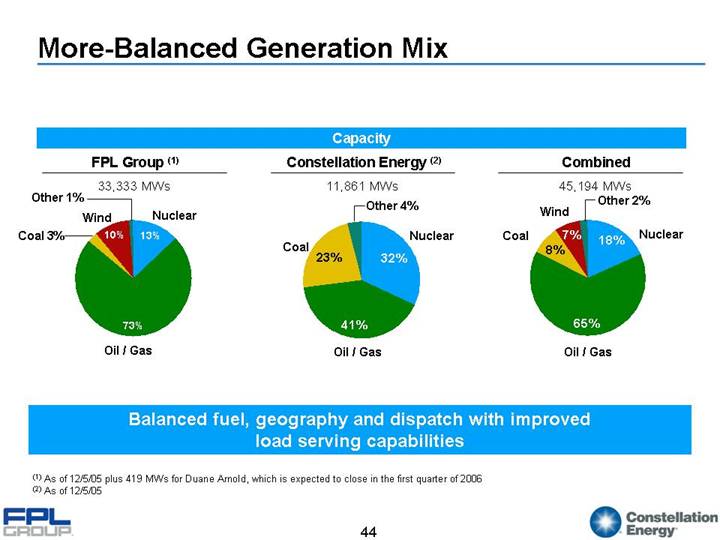
More-Balanced Generation Mix
Capacity |
| | | | |
FPL Group (1) | | Constellation Energy (2) | | Combined |
33,333 MWs | | 11,861 MWs | | 45,194 MWs |
| | | | |
[CHART] | | [CHART] | | [CHART] |
Balanced fuel, geography and dispatch with improved load serving capabilities
(1) As of 12/5/05 plus 419 MWs for Duane Arnold, which is expected to close in the first quarter of 2006
(2) As of 12/5/05
44
Non-GAAP Financial Measures
45
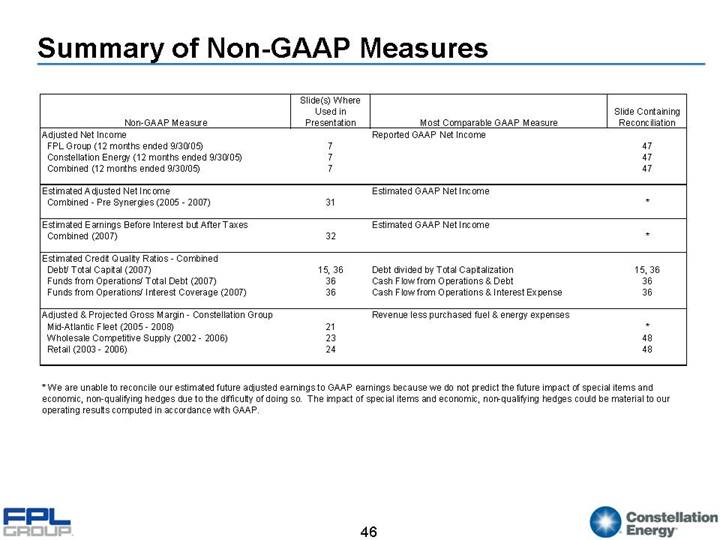
Summary of Non-GAAP Measures
| | Slide(s) Where | | | | | |
| | Used in | | | | Slide Containing | |
Non-GAAP Measure | | Presentation | | Most Comparable GAAP Measure | | Reconciliation | |
Adjusted Net Income | | | | Reported GAAP Net Income | | | |
FPL Group (12 months ended 9/30/05) | | 7 | | | | 47 | |
Constellation Energy (12 months ended 9/30/05) | | 7 | | | | 47 | |
Combined (12 months ended 9/30/05) | | 7 | | | | 47 | |
| | | | | | | |
Estimated Adjusted Net Income | | | | Estimated GAAP Net Income | | | |
Combined - Pre Synergies (2005 - 2007) | | 31 | | | | * | |
| | | | | | | |
Estimated Earnings Before Interest but After Taxes | | | | Estimated GAAP Net Income | | | |
Combined (2007) | | 32 | | | | * | |
| | | | | | | |
Estimated Credit Quality Ratios - Combined | | | | | | | |
Debt/ Total Capital (2007) | | 15, 36 | | Debt divided by Total Capitalization | | 15, 36 | |
Funds from Operations/ Total Debt (2007) | | 36 | | Cash Flow from Operations & Debt | | 36 | |
Funds from Operations/ Interest Coverage (2007) | | 36 | | Cash Flow from Operations & Interest Expense | | 36 | |
| | | | | | | |
Adjusted & Projected Gross Margin - Constellation Group | | | | Revenue less purchased fuel & energy expenses | | | |
Mid-Atlantic Fleet (2005 - 2008) | | 21 | | | | * | |
Wholesale Competitive Supply (2002 - 2006) | | 23 | | | | 48 | |
Retail (2003 - 2006) | | 24 | | | | 48 | |
* We are unable to reconcile our estimated future adjusted earnings to GAAP earnings because we do not predict the future impact of special items and economic, non-qualifying hedges due to the difficulty of doing so. The impact of special items and economic, non-qualifying hedges could be material to our operating results computed in accordance with GAAP.
46
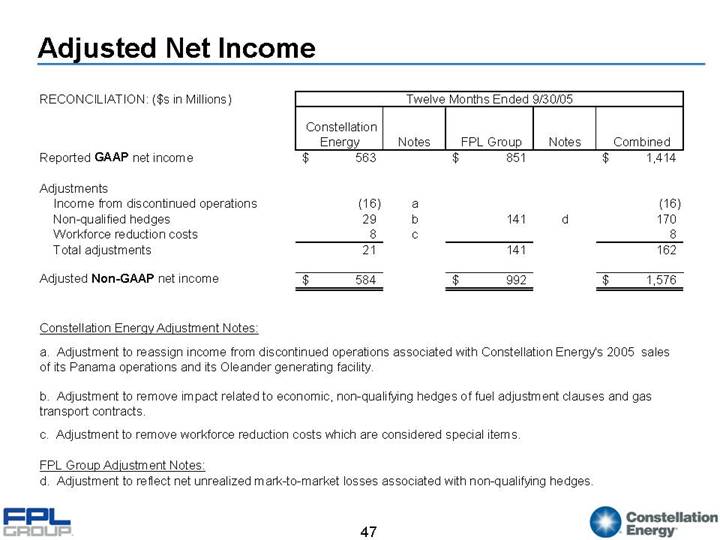
Adjusted Net Income
RECONCILIATION: ($s in Millions)
| | Twelve Months Ended 9/30/05 | |
| | Constellation | | | | | | | | | |
| | Energy | | Notes | | FPL Group | | Notes | | Combined | |
Reported GAAP net income | | $ | 563 | | | | $ | 851 | | | | $ | 1,414 | |
| | | | | | | | | | | |
Adjustments | | | | | | | | | | | |
Income from discontinued operations | | (16 | ) | a | | | | | | (16 | ) |
Non-qualified hedges | | 29 | | b | | 141 | | d | | 170 | |
Workforce reduction costs | | 8 | | c | | | | | | 8 | |
Total adjustments | | 21 | | | | 141 | | | | 162 | |
| | | | | | | | | | | |
Adjusted Non-GAAP net income | | $ | 584 | | | | $ | 992 | | | | $ | 1,576 | |
Constellation Energy Adjustment Notes:
a. Adjustment to reassign income from discontinued operations associated with Constellation Energy’s 2005 sales of its Panama operations and its Oleander generating facility.
b. Adjustment to remove impact related to economic, non-qualifying hedges of fuel adjustment clauses and gas transport contracts.
c. Adjustment to remove workforce reduction costs which are considered special items.
FPL Group Adjustment Notes:
d. Adjustment to reflect net unrealized mark-to-market losses associated with non-qualifying hedges.
47
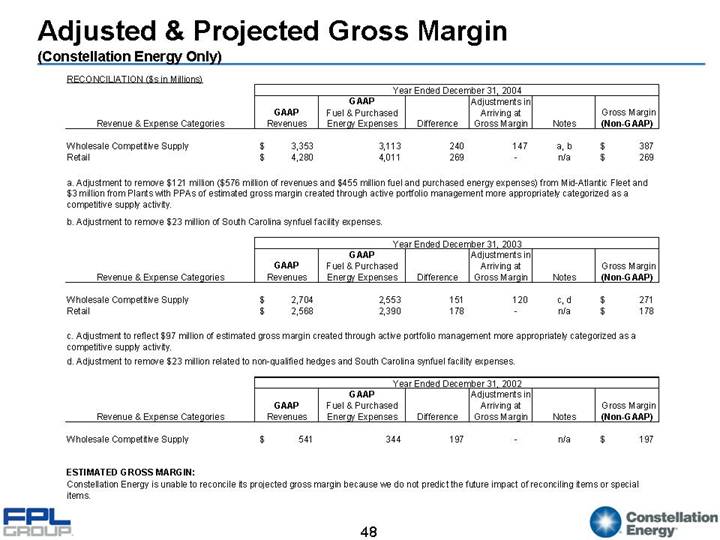
Adjusted & Projected Gross Margin
(Constellation Energy Only)
RECONCILIATION ($s in Millions)
| | Year Ended December 31, 2004 | |
| | | | GAAP | | | | Adjustments in | | | | | |
| | GAAP | | Fuel & Purchased | | | | Arriving at | | | | Gross Margin | |
Revenue & Expense Categories | | Revenues | | Energy Expenses | | Difference | | Gross Margin | | Notes | | (Non-GAAP) | |
| | | | | | | | | | | | | |
Wholesale Competitive Supply | | $ | 3,353 | | 3,113 | | 240 | | 147 | | a, b | | $ | 387 | |
Retail | | $ | 4,280 | | 4,011 | | 269 | | — | | n/a | | $ | 269 | |
a. Adjustment to remove $121 million ($576 million of revenues and $455 million fuel and purchased energy expenses) from Mid-Atlantic Fleet and $3 million from Plants with PPAs of estimated gross margin created through active portfolio management more appropriately categorized as a competitive supply activity.
b. Adjustment to remove $23 million of South Carolina synfuel facility expenses.
| | Year Ended December 31, 2003 | |
| | | | GAAP | | | | Adjustments in | | | | | |
| | GAAP | | Fuel & Purchased | | | | Arriving at | | | | Gross Margin | |
Revenue & Expense Categories | | Revenues | | Energy Expenses | | Difference | | Gross Margin | | Notes | | (Non-GAAP) | |
| | | | | | | | | | | | | |
Wholesale Competitive Supply | | $ | 2,704 | | 2,553 | | 151 | | 120 | | c, d | | $ | 271 | |
Retail | | $ | 2,568 | | 2,390 | | 178 | | — | | n/a | | $ | 178 | |
c. Adjustment to reflect $97 million of estimated gross margin created through active portfolio management more appropriately categorized as a competitive supply activity.
d. Adjustment to remove $23 million related to non-qualified hedges and South Carolina synfuel facility expenses.
| | Year Ended December 31, 2002 | |
| | | | GAAP | | | | Adjustments in | | | | | |
| | GAAP | | Fuel & Purchased | | | | Arriving at | | | | Gross Margin | |
Revenue & Expense Categories | | Revenues | | Energy Expenses | | Difference | | Gross Margin | | Notes | | (Non-GAAP) | |
| | | | | | | | | | | | | |
Wholesale Competitive Supply | | $ | 541 | | 344 | | 197 | | — | | n/a | | $ | 197 | |
| | | | | | | | | | | | | | | |
ESTIMATED GROSS MARGIN:
Constellation Energy is unable to reconcile its projected gross margin because we do not predict the future impact of reconciling items or special items.
48