UNITED STATES
SECURITIES AND EXCHANGE COMMISSION
WASHINGTON, D.C. 20549
FORM 10-K
(Mark One)
☒ ANNUAL REPORT PURSUANT TO SECTION 13 OR 15(d) OF THE SECURITIES EXCHANGE ACT OF 1934
For the fiscal year ended December 31, 2024
or
☐ TRANSITION REPORT PURSUANT TO SECTION 13 OR 15(d) OF THE SECURITIES EXCHANGE ACT OF 1934
Commission File Number 0-26850
PREMIER FINANCIAL CORP.
(Exact name of registrant as specified in its charter)
| | |
OHIO | | 34-1803915 |
(State or other jurisdiction of incorporation or organization) | | (I.R.S. Employer Identification Number) |
601 Clinton Street, Defiance, Ohio | | 43512 |
(Address of principal executive offices) | | (Zip code) |
Registrant’s telephone number, including area code: (419) 785-8700
Securities registered pursuant to Section 12(b) of the Act:
| | |
Common Stock, Par Value $0.01 Per Share | PFC | The NASDAQ Stock Market |
(Title of Class) | (Trading Symbol) | (Name of each exchange on which registered) |
Securities registered pursuant to Section 12(g) of the Act:
None
(Title of Class)
Indicate by check mark if the registrant is a well-known seasoned issuer, as defined in Rule 405 of the Securities Act. Yes ☐ No ☒
Indicate by check mark if the registrant is not required to file reports pursuant to Section 13 or Section 15(d) of the Exchange Act. Yes ☐ No ☒
Indicate by check mark whether the registrant (1) has filed all reports required to be filed by Section 13 or 15(d) of the Securities Exchange Act of 1934 during the preceding 12 months (or for such shorter period that the registrant was required to file such reports), and (2) has been subject to such filing requirements for the past 90 days. Yes ☒ No ☐
Indicate by check mark whether the registrant has submitted electronically every Interactive Data File required to be submitted pursuant to Rule 405 of Regulation S-T (§232.405 of this chapter) during the preceding 12 months (or for such shorter period that the registrant was required to submit such files). Yes ☒ No ☐
Indicate by check mark whether the registrant is a large accelerated filer, an accelerated filer, a non-accelerated filer, a smaller reporting company, or an emerging growth company. See the definitions of “large accelerated filer,” “accelerated filer,” “smaller reporting company,” and “emerging growth company” in Rule 12b-2 of the Exchange Act.
| | | | | | | | | | | | | |
Large accelerated filer | ☒ | | Accelerated filer | ☐ | | Non accelerated filer | ☐ | | Smaller reporting company | ☐ | | Emerging growth company | ☐ |
If an emerging growth company, indicate by check mark if the registrant has elected not to use the extended transition period for complying with any new or revised financial accounting standards provided pursuant to Section 13(a) of the Exchange Act. ☐
Indicate by check mark whether the registrant has filed a report on and attestation to its management’s assessment of the effectiveness of its internal control over financial reporting under Section 404(b) of the Sarbanes-Oxley Act (15 U.S.C. 7262(b)) by the registered public accounting firm that prepared or issued its audit report. ☐
If securities are registered pursuant to Section 12(b) of the Act, indicate by check mark whether the financial statements of the registrant included in the filing reflect the correction of an error to previously issued financial statements. ☐
Indicate by check mark whether any of those error corrections are restatements that required a recovery analysis of incentive-based compensation received by any of the registrant’s executive officers during the relevant recovery period pursuant to §240.10D-1(b). ☐
Indicate by check mark whether the registrant is a shell company (as defined in Rule 12b-2 of the Exchange Act). Yes ☐ No ☒
The aggregate market value of the voting stock held by non-affiliates of the registrant computed by reference to the closing price of such stock as of June 30, 2024, the last business day of the registrant's most recently completed second fiscal quarter, was approximately $717.2 million.
As of February 28, 2025, there were issued and outstanding 35,925,095 shares of the registrant’s common stock.
Documents Incorporated by Reference
None.
| | | | | |
Auditor Firm Id: | 173 | Auditor Name: | Crowe, LLP | Auditor Location: | Cleveland, OH USA |
Premier Financial Corp.
Annual Report on Form 10-K
Table of Contents
PART I
Item 1. Business
Premier Financial Corp. (“Premier” or the “Company”) is a financial holding company for its wholly-owned subsidiaries, Premier Bank (the "Bank"), PFC Risk Management Inc. (“PFC Risk Management”), PFC Capital, LLC (“PFC Capital”) and First Insurance Group of the Midwest, Inc. (“First Insurance”). All significant intercompany transactions and balances are eliminated in consolidation. Premier’s stock is traded on the NASDAQ Global Select Market under the ticker PFC.
The Company’s core business operations are conducted through its subsidiaries:
Premier Bank: The Bank is an Ohio state-chartered bank headquartered in Youngstown, Ohio. The Bank conducts operations through 73 full-service banking center offices, 9 loan offices and two wealth offices located in Ohio, Michigan, Indiana and Pennsylvania.
The Bank is primarily engaged in community banking. It attracts deposits from the general public through its offices and website, and uses those and other available sources of funds to originate residential real estate loans, commercial real estate loans, commercial loans, home improvement and home equity loans and consumer loans. In addition, the Bank invests in U.S. Treasury and federal government agency obligations, obligations of states and political subdivisions, mortgage-backed securities that are issued by federal agencies, including real estate mortgage investment conduits (“REMICs”) and residential collateralized mortgage obligations (“CMOs”), and corporate bonds. The Bank’s deposits are insured by the Federal Deposit Insurance Corporation (“FDIC”). The Bank is a member of the Federal Home Loan Bank (“FHLB”) System.
PFC Capital: PFC Capital provides mezzanine funding for customers of the Bank. Mezzanine loans are offered by PFC Capital to customers in the Company’s market area and are expected to be repaid from the cash flow from operations of the borrowing businesses.
First Insurance Group of the Midwest: First Insurance was an insurance agency that conducted business throughout Premier’s markets prior to July 1, 2023. First Insurance offered property and casualty insurance, life insurance and group health insurance. On June 30, 2023, the Company completed the sale of substantially all of the assets (including $24.7 million of goodwill and intangibles) of First Insurance to Risk Strategies Corporation (“Buyer”). Consideration included a combination of cash and a subordinated note resulting in net cash received of $47.4 million after certain transaction costs at closing, the assumption of certain leases, and contingent consideration subject to certain performance criteria by the Buyer to be determined after the year ended December 31, 2026. The Company recorded a pre-tax gain on sale of $36.3 million, transaction costs of $3.7 million and taxes of $8.5 million for a $24.1 million increase to equity in 2023.
PFC Risk Management: PFC Risk Management was a wholly-owned insurance company subsidiary of the Company that was formed to insure the Company and its subsidiaries against certain risks unique to the operations of the Company and for which insurance was not available or economically feasible in the insurance marketplace. PFC Risk Management pooled resources with several other similar insurance company subsidiaries of financial institutions to help minimize the risk allocable to each participating insurer. Due to pending changes in tax law, PFC Risk Management was dissolved and liquidated in December 2023.
On July 26, 2024, Premier and Wesbanco, Inc. (Nasdaq: WSBC) ("Wesbanco") announced the signing of a definitive merger agreement ("Merger Agreement") under which the parties propose that Premier will merge into Wesbanco in a stock-for-stock transaction (the "Merger"). Under the terms of the Merger Agreement, shareholders of Premier will receive 0.80 shares of Wesbanco common stock for each share of Premier common stock. Premier Bank, a wholly-owned subsidiary of Premier, will merge into Wesbanco Bank, Inc., a wholly-owned subsidiary of Wesbanco. Upon closing of the Merger, Premier shareholders will own approximately 30% of the combined company. In December 2024, the approval of shareholders of both Premier and Wesbanco was obtained. The transaction is expected to close on February 28, 2025. Premier believes that the Merger will create a combined company that values community level banking that is focused on performance. Further, the expanded reach of the combined company will serve as a catalyst for growth and increased investment in products and services that will benefit Premier’s stakeholders: customers, associates, shareholders, and the communities that Premier serves.
Premier’s website, www.yourpremierfincorp.com, contains a hyperlink under the Investor Relations section to EDGAR, where the annual report on Form 10-K, quarterly reports on Form 10-Q, current reports on Form 8-K and amendments to those reports filed or furnished pursuant to Section 13(a) or 15(d) of the Securities Exchange Act of 1934 are available free of charge as soon as reasonably practicable after Premier has filed the report with the U. S. Securities and Exchange Commission (“SEC”).
The Company’s principal executive offices are located at 601 Clinton Street, Defiance, Ohio 43512, and its telephone number is (419) 782-5015.
Business Strategy
Throughout 2024, Premier focused on being a high-performing, community-focused financial institution that was well regarded in its market areas. Premier believes that its “customer first” philosophy will continue after the Merger. The management teams of Wesbanco and Premier believe that the Merger will bring together two institutions that will create a community-focused, regional financial services
partner strongly positioned to serve the unique needs of both institutions’ communities. The combined institution will create a broader offering of banking and wealth management services for Premier’s customers.
The following discussion focuses on Premier’s business throughout 2024:
Commercial and Commercial Real Estate Lending - Commercial and commercial real estate lending have been an ongoing focus and a major component of the Company’s success. The Bank primarily provides commercial real estate and commercial business loans with an emphasis on owner-occupied commercial real estate and commercial business lending, including a focus on the deposit balances that accompany these relationships. The Bank’s client base tends to be small to middle market customers with annual gross revenues generally between $1 million and $50 million. These customers require the Bank to have a high degree of knowledge and understanding of their business in order to provide them with solutions for their financial needs. The Bank’s “customer first” philosophy and culture complement the needs of its clients. The Bank believes this personal service model differentiates the Bank from its competitors, particularly the larger regional institutions. The Bank offers a wide variety of products to support commercial clients including remote deposit capture and other cash management services. The Bank also believes that the small business customer is a strong market for the Bank and participates in many of the Small Business Administration lending programs. Maintaining a diversified portfolio with an emphasis on monitoring industry concentrations and reacting to changes in the credit characteristics of industries is an ongoing focus.
Consumer Banking - The Bank offers customers a full range of deposit products including demand, checking, money market, certificates of deposits, Certificate of Deposit Account Registry Service (“CDARS”) and savings accounts. The Bank offers a full range of investment products through the wealth management department and a wide variety of consumer loan products, including residential mortgage loans, home equity loans, and installment loans. The Bank also offers digital banking services, which include mobile banking, Zelle, online bill pay, and online account opening as well as the MoneyPass ATM Network offering access to our customers to over 40,000 ATMs nationwide without a surcharge fee.
Fee Income Development - Generation of fee income and the diversification of revenue sources are accomplished primarily through the mortgage banking operation and the wealth management department as Premier seeks to reduce reliance on retail transaction fee income.
Deposit Growth - The Bank’s focus has been to grow core deposits with an emphasis on total relationship banking for both our retail and commercial customers. The Bank’s pricing strategy considers the whole relationship of the customer. The Bank continues to focus on increasing its market share in the communities it serves by providing quality products with extraordinary customer service, business development strategies and branch expansion. The Bank will look to grow its footprint in areas believed to further complement its overall market share and complement its strategy of being a high-performing community bank.
Asset Quality - Maintaining a strong credit culture is of the utmost importance to the Bank. The Bank has maintained a strong credit approval and review process that has allowed the Company to maintain a credit quality standard that balances the return with the risks of industry concentrations and loan types. The Bank is primarily a collateral lender with an emphasis on cash flow performance, while obtaining additional support from personal guarantees and secondary sources of repayment. The Bank has directed its attention to loan types and markets that it knows well and in which it has historically been successful. The Bank strives to have loan relationships that are well diversified in both size and industry, and monitors the overall trends in the portfolio to maintain its industry and loan type concentration targets. The Bank maintains a problem loan remediation process that focuses on detection and resolution. The Bank maintains a strong process of internal control that subjects the loan portfolio to periodic internal reviews as well as independent third-party loan review.
Securities
During 2024, Premier’s securities portfolio was managed in accordance with a written policy adopted by the Board of Directors and administered by the Investment Committee. The Chief Executive Officer, Chief Financial Officer, Chief Credit Officer and Treasurer can each approve transactions up to $3.0 million. Two of the four officers are required to approve transactions between $3.0 million and $30.0 million. All transactions in excess of $30.0 million must be approved by the Bank’s Asset Liability Committee (“ALCO”).
Premier’s securities portfolio is classified as either “available-for-sale” or “held-to-maturity.” In addition, Premier held equity securities totaling $4.0 million at December 31, 2024, which must be marked to market through the income statement. Securities classified as “available-for-sale” may be sold prior to maturity due to changes in interest rates, prepayment risks, and availability of alternative investments, or to meet Premier’s liquidity needs.
The carrying value of securities at December 31, 2024, by contractual maturity is shown below. Expected maturities will differ from contractual maturities because issuers may have the right to call or prepay obligations with or without call or prepayment penalties.
| | | | | | | | | | | | | | | | | | | | | | | | | | | | | | | | | | | | | | | | |
| | Contractually Maturing | | | Total | |
| | | | | Weighted | | | | | | Weighted | | | | | | Weighted | | | | | | Weighted | | | | | | | |
| | Under 1 | | | Average | | | 1 - 5 | | | Average | | | 6-10 | | | Average | | | Over 10 | | | Average | | | | | | | |
| | Year | | | Yield % | | | Years | | | Yield % | | | Years | | | Yield % | | | Years | | | Yield % | | | Amount | | | Yield | |
| | (Dollars in Thousands) | |
Mortgage-backed securities | | $ | — | | | | 0.00 | % | | $ | 23,776 | | | | 4.74 | % | | $ | 26,399 | | | | 2.67 | % | | $ | 145,818 | | | | 1.92 | % | | $ | 195,993 | | | | 2.36 | % |
CMOs - residential | | | — | | | | 0.00 | % | | | 47,685 | | | | 4.28 | % | | | 18,228 | | | | 2.95 | % | | | 312,527 | | | | 2.64 | % | | $ | 378,440 | | | | 2.86 | % |
Obligations of U.S. government corporations and agencies | | | 5,041 | | | | 1.49 | % | | | 53,237 | | | | 1.37 | % | | | 94,508 | | | | 1.83 | % | | | 20,333 | | | | 2.11 | % | | $ | 173,119 | | | | 1.71 | % |
Asset-backed securities | | | — | | | | 0.00 | % | | | 330 | | | | 5.64 | % | | | 122,600 | | | | 5.50 | % | | | 132,118 | | | | 5.24 | % | | $ | 255,048 | | | | 5.37 | % |
Obligations of states and
political subdivisions | | | 1,243 | | | | 3.29 | % | | | 11,306 | | | | 2.20 | % | | | 72,114 | | | | 2.18 | % | | | 160,011 | | | | 2.10 | % | | $ | 244,674 | | | | 2.13 | % |
Corporate bonds | | | 4,280 | | | | 2.25 | % | | | 10,500 | | | | 7.49 | % | | | 56,004 | | | | 3.82 | % | | | — | | | | 0.00 | % | | | 70,784 | | | | 4.27 | % |
Total | | $ | 10,564 | | | | | | $ | 146,834 | | | | | | $ | 389,853 | | | | | | $ | 770,807 | | | | | | $ | 1,318,058 | | | | |
Unrealized loss on securities
available for sale | | | | | | | | | | | | | | | | | | | | | | | | | | | (161,490 | ) | | | |
Total | | | | | | | | | | | | | | | | | | | | | | | | | | $ | 1,156,568 | | | | |
The carrying value of investment securities is as follows:
| | | | | | | | | | | | |
| | December 31, | |
| | 2024 | | | 2023 | | | 2022 | |
| | (In Thousands) | |
Available-for-sale securities: | | | | | | | | | |
Obligations of U.S. government corporations and agencies | | $ | 147,812 | | | $ | 150,775 | | | $ | 144,107 | |
Obligations of states and political subdivisions | | | 198,442 | | | | 204,258 | | | | 221,594 | |
CMOs and mortgage-backed securities | | | 493,669 | | | | 392,275 | | | | 417,394 | |
Asset-backed securities | | | 250,900 | | | | 136,980 | | | | 192,504 | |
Corporate bonds | | | 65,745 | | | | 62,420 | | | | 64,482 | |
Total | | $ | 1,156,568 | | | $ | 946,708 | | | $ | 1,040,081 | |
For additional information regarding Premier’s investment portfolio, refer to Note 4 – Investment Securities in the Consolidated Financial Statements.
Residential Loan Servicing Activities
Servicing mortgage loans for investors involves a contractual right to receive a fee for processing and administering loan payments on mortgage loans that are not owned by the Company and are not included on the Company’s balance sheet. This processing involves collecting monthly mortgage payments on behalf of investors, reporting information to those investors on a monthly basis and maintaining custodial escrow accounts for the payment of principal and interest to investors and property taxes and insurance premiums on behalf of borrowers. At December 31, 2024, the Company serviced loans totaling $2.9 billion in principal. The vast majority of the loans serviced for others are fixed rate conventional mortgage loans. The Company primarily sells its loans to, and then services for, Freddie Mac, Fannie Mae and the FHLB.
As compensation for its mortgage servicing activities, the Company receives servicing fees, usually approximating 0.25% per annum of the loan balances serviced, plus any late charges collected from delinquent borrowers and other fees incidental to the services provided. In the event of a default by the borrower, the Company receives no servicing fees until the default is cured. Loan servicing fees decrease as the principal balance on the outstanding loan decreases and as the remaining time to maturity of the loan shortens.
Lending Activities
General – Financial institutions are limited in the amount of loans they may make to one borrower. At December 31, 2024, the Bank’s legal limit on loans-to-one borrower was $145.5 million.
Loan Portfolio Composition – Total loans, including undisbursed loan funds and deferred fees, decreased from the prior year by $338.5 million for 2024. The loan portfolio contains no foreign loans. The Company’s loan portfolio is concentrated geographically in northwest, northeast and central Ohio, northeast Indiana, Morgantown, West Virginia, western Pennsylvania and southeast Michigan market areas. Management has identified lending for multifamily properties within commercial real estate as an industry concentration. Total loans from multifamily property totaled $645.6 million at December 31, 2024, which represents 9.7% of the Company’s loan portfolio.
The following table sets forth the composition of the Company’s loan portfolio by type of loan at the dates indicated.
| | | | | | | | | | | | | | | | | | | | | | | | | | | | | | | | | | | | | | | | |
| | December 31, | |
| | 2024 | | | 2023 | | | 2022 | | | 2021 | | | 2020 | |
| | Amount | | | % | | | Amount | | | % | | | Amount | | | % | | | Amount | | | % | | | Amount | | | % | |
| | (Dollars in Thousands) | | | | |
Real estate: | | | | | | | | | | | | | | | | | | | | | | | | | | | | | | |
Residential real estate | | $ | 1,765,432 | | | | 26.5 | % | | $ | 1,810,265 | | | | 25.8 | % | | $ | 1,535,574 | | | | 21.6 | % | | $ | 1,167,466 | | | | 20.2 | % | | $ | 1,201,051 | | | | 20.5 | % |
Commercial real
estate | | | 2,895,356 | | | | 43.4 | % | | | 2,839,905 | | | | 40.5 | % | | | 2,762,311 | | | | 38.8 | % | | | 2,450,349 | | | | 42.5 | % | | | 2,383,001 | | | | 40.8 | % |
Construction | | | 596,681 | | | | 8.9 | % | | | 838,823 | | | | 12.0 | % | | | 1,278,255 | | | | 17.9 | % | | | 862,815 | | | | 15.0 | % | | | 667,649 | | | | 11.4 | % |
Total real estate loans | | | 5,257,469 | | | | 78.8 | % | | | 5,488,993 | | | | 78.3 | % | | | 5,576,140 | | | | 78.3 | % | | | 4,480,630 | | | | 77.7 | % | | | 4,251,701 | | | | 72.7 | % |
Other: | | | | | | | | | | | | | | | | | | | | | | | | | | | | | | |
Commercial | | | 957,588 | | | | 14.4 | % | | | 1,056,803 | | | | 15.1 | % | | | 1,055,180 | | | | 14.8 | % | | | 895,638 | | | | 15.5 | % | | | 1,202,353 | | | | 20.6 | % |
Home equity and
improvement | | | 274,340 | | | | 4.1 | % | | | 267,960 | | | | 3.8 | % | | | 277,613 | | | | 3.9 | % | | | 264,354 | | | | 4.6 | % | | | 272,701 | | | | 4.7 | % |
Consumer finance | | | 179,700 | | | | 2.7 | % | | | 193,830 | | | | 2.8 | % | | | 213,405 | | | | 3.0 | % | | | 126,417 | | | | 2.2 | % | | | 120,729 | | | | 2.1 | % |
| | | 1,411,628 | | | | 21.2 | % | | | 1,518,593 | | | | 21.7 | % | | | 1,546,198 | | | | 21.7 | % | | | 1,286,409 | | | | 22.3 | % | | | 1,595,783 | | | | 27.3 | % |
Total loans | | | 6,669,097 | | | | 100.0 | % | | | 7,007,586 | | | | 100.0 | % | | | 7,122,338 | | | | 100.0 | % | | | 5,767,039 | | | | 100.0 | % | | | 5,847,484 | | | | 100.0 | % |
Less: | | | | | | | | | | | | | | | | | | | | | | | | | | | | | | |
Undisbursed loan
funds | | | 205,980 | | | | | | | 281,466 | | | | | | | 672,775 | | | | | | | 477,890 | | | | | | | 355,065 | | | | |
Net deferred loan
origination fees | | | (13,510 | ) | | | | | | (13,267 | ) | | | | | | (11,057 | ) | | | | | | (7,019 | ) | | | | | | 1,179 | | | | |
Allowance for credit losses | | | 75,688 | | | | | | | 76,512 | | | | | | | 72,816 | | | | | | | 66,468 | | | | | | | 82,079 | | | | |
Net loans | | $ | 6,400,939 | | | | | | $ | 6,662,875 | | | | | | $ | 6,387,804 | | | | | | $ | 5,229,700 | | | | | | $ | 5,409,161 | | | | |
In addition to the loans reported above, Premier had $118.0 million, $145.6 million, $115.3 million, $162.9 million, and $221.6 million in loans classified as held for sale at December 31, 2024, 2023, 2022, 2021 and 2020, respectively.
Contractual Principal, Repayments and Interest Rates – The following table sets forth the dollar amount of gross loans due more than one year from December 31, 2024, which have fixed interest rates or which have floating or adjustable interest rates.
| | | | | | | | | | | | |
| | | | | Floating or | | | | |
| | Fixed | | | Adjustable | | | | |
| | Rates | | | Rates | | | Total | |
| | (In Thousands) | |
Real estate | | $ | 2,546,407 | | | $ | 1,694,222 | | | $ | 4,240,629 | |
Commercial | | | 308,501 | | | | 164,829 | | | | 473,330 | |
Other | | | 173,339 | | | | 686 | | | | 174,025 | |
| | $ | 3,028,247 | | | $ | 1,859,737 | | | $ | 4,887,984 | |
The following table shows the maturity distribution of loans outstanding as of December 31, 2024.
| | | | | | | | | | | | | | | | |
| | | | | | | | | | | |
| Within | | After one, but within | | After five, but within | | After | | | | |
| one year | | five years | | fifteen years | | fifteen years | | | Total (1) | |
| (In Thousands) | |
Real estate | $ | 1,110,493 | | $ | 1,784,796 | | $ | 1,049,766 | | $ | 1,406,067 | | | $ | 5,351,122 | |
Commercial | | 468,894 | | | 391,431 | | | 81,899 | | | — | | | | 942,224 | |
Other | | 9,256 | | | 96,141 | | | 77,884 | | | — | | | | 183,281 | |
| $ | 1,588,643 | | $ | 2,272,368 | | $ | 1,209,549 | | $ | 1,406,067 | | | $ | 6,476,627 | |
(1) Total loans are net of undisbursed loan funds and deferred fees and costs
Originations, Purchases and Sales of Loans – The lending activities of Premier are subject to the written, non-discriminatory underwriting standards and loan origination procedures established by the Board of Directors and management. Loan originations are obtained from a variety of sources, including referrals from existing customers, real estate brokers, developers and builders, newspaper, internet and radio advertising, and walk-in customers. The Bank’s loan approval process for all types of loans is intended to assess the borrower’s ability to repay the loan, the viability of the loan and the adequacy of the value of the collateral that will secure the loan.
The following table shows total loans originated, loan reductions, and the net increase (decrease) in the Company’s loans net of undisbursed loan funds and deferred fees and loans held for sale during the periods indicated:
| | | | | | | | | | | | |
| | Years Ended December 31, | |
| | 2024 | | | 2023 | | | 2022 | |
| | (In Thousands) | |
Loan originations: | | | | | | | | | |
Residential real estate | | $ | 234,691 | | | $ | 306,859 | | | $ | 729,083 | |
Commercial real estate | | | 174,447 | | | | 316,804 | | | | 476,635 | |
Construction | | | 284,603 | | | | 809,202 | | | | 919,829 | |
Commercial | | | 239,119 | | | | 253,949 | | | | 597,331 | |
Home equity and improvement | | | 110,408 | | | | 91,082 | | | | 144,731 | |
Consumer finance | | | 61,981 | | | | 55,558 | | | | 161,104 | |
Total loans originated | | | 1,105,249 | | | | 1,833,454 | | | | 3,028,713 | |
Loans acquired in acquisitions | | | — | | | | — | | | | — | |
Loans purchased | | | 1,929 | | | | — | | | | — | |
Loan payoffs, sales and repayments | | | (1,339,548 | ) | | | (1,524,297 | ) | | | (1,721,110 | ) |
Net increase (decrease) in loans net of undisbursed loan funds and deferred fees and loans held for sale | | $ | (232,370 | ) | | $ | 309,157 | | | $ | 1,307,603 | |
Asset Quality
Premier’s credit policy establishes guidelines to manage credit risk and asset quality. These guidelines include loan review and early identification of problem loans to ensure sound credit decisions. Premier’s credit policies and review procedures are meant to minimize the risks and uncertainties inherent in lending. In following the policies and procedures, management must rely on estimates, appraisals and evaluations of loans and the possibility that changes in these could occur because of changing economic conditions.
Delinquent Loans — The following table sets forth information concerning delinquent loans at December 31, 2024, in dollar amount and as a percentage of Premier’s total loan portfolio. The amounts presented represent the total outstanding principal balances of the related loans, rather than the actual payment amounts that are past due.
| | | | | | | | | | | | | | | | | | | | | | | | | | | | | | | | |
| | 30 to 59 Days | | | 60 to 89 Days | | | 90 Days and Over | | | Total | |
| | Amount | | | Percentage | | | Amount | | | Percentage | | | Amount | | | Percentage | | | Amount | | | Percentage | |
| | (Dollars in Thousands) | |
Residential real
estate | | $ | 559 | | | | 0.01 | % | | $ | 9,991 | | | | 0.15 | % | | $ | 14,206 | | | | 0.22 | % | | $ | 24,756 | | | | 0.38 | % |
Commercial real estate | | | 664 | | | | 0.01 | % | | | 8,856 | | | | 0.14 | % | | | 2,434 | | | | 0.04 | % | | | 11,954 | | | | 0.18 | % |
Construction | | | — | | | | 0.00 | % | | | — | | | | 0.00 | % | | | — | | | | 0.00 | % | | | — | | | | 0.00 | % |
Commercial | | | 425 | | | | 0.01 | % | | | 177 | | | | 0.00 | % | | | 3,901 | | | | 0.06 | % | | | 4,503 | | | | 0.07 | % |
Home equity and
improvement | | | 2,721 | | | | 0.04 | % | | | 744 | | | | 0.01 | % | | | 1,130 | | | | 0.02 | % | | | 4,595 | | | | 0.07 | % |
Consumer finance | | | 3,415 | | | | 0.05 | % | | | 1,404 | | | | 0.02 | % | | | 3,874 | | | | 0.06 | % | | | 8,693 | | | | 0.13 | % |
Purchase credit deteriorated
("PCD") | | | 121 | | | | 0.00 | % | | | 1,738 | | | | 0.03 | % | | | 796 | | | | 0.01 | % | | | 2,655 | | | | 0.04 | % |
Total Loans | | $ | 7,905 | | | | 0.12 | % | | $ | 22,910 | | | | 0.35 | % | | $ | 26,341 | | | | 0.41 | % | | $ | 57,156 | | | | 0.88 | % |
Overall, the level of delinquencies of 0.88% at December 31, 2024, increased from the levels at December 31, 2023, when Premier reported that 0.61% of its outstanding loans were at least 30 days delinquent. The level of total loans 90 or more days delinquent has increased to 0.41% at December 31, 2024, up from 0.30% at December 31, 2023. The level of total loans 60-89 days delinquent increased to 0.34% at December 31, 2024, up from 0.21% at December 31, 2023. The level of loans that were 30 to 59 days past due increased to 0.10% at December 31, 2024, up from 0.08% at December 31, 2023. Management has assessed the collectability of all loans that are 90 days or more delinquent as part of its procedures in establishing the allowance for credit losses.
Non-performing Assets – All loans are reviewed on a regular basis and are placed on non-accrual status when, in the opinion of management, the collectability of additional interest is not expected. Generally, Premier places all loans 90 days or more past due on non-accrual status. Premier also places loans on non-accrual status when the loan is paying as agreed but the Company believes the financial condition of the borrower is such that this classification is warranted. When a loan is placed on non-accrual status, total unpaid interest accrued to date is reversed. Subsequent payments are generally applied to the outstanding principal balance but may be recorded as interest income, depending on the assessment of the ultimate collectability of the loan. Premier considers a loan individually evaluated when, based on current information and events, it is probable that the Bank will be unable to collect all amounts due (both principal and interest) according to the contractual terms of the loan agreement. Premier measures impairment based on the present value of expected future cash flows discounted at the loan’s effective interest rate, the loan’s observable market price, or the fair value of the collateral, if collateral dependent. If the estimated recoverability of the individually evaluated loan is less than the recorded investment, Premier will recognize impairment by allocating a portion of the allowance for credit losses on cash flow dependent loans and by charging off the deficiency on collateral dependent loans. See Note 6 of the Notes to the Consolidated Financial Statements for additional information.
Real estate acquired by foreclosure is classified as real estate owned until such time as it is sold. Premier also repossesses other assets securing loans, consisting primarily of automobiles. When such property is acquired it is recorded at fair value less cost to sell. Costs relating to development and improvement of property are capitalized, whereas costs relating to holding the property are expensed. Valuations are periodically performed by management and a write-down of the value is recorded with a corresponding charge to operations if it is determined that the carrying value of property exceeds its estimated net realizable value. The balance of real estate owned at December 31, 2024, was $737,000. During 2024, there was $95,000 of expense related to write-downs in fair value of real estate acquired by foreclosure or acquisition. The balance of real estate owned at December 31, 2023 was $243,000. During 2023, there was $15,000 of expense related to write-downs in fair value of real estate acquired by foreclosure or acquisition.
As of December 31, 2024, Premier’s total non-performing loans amounted to $81.0 million or 1.26% of total loans (net of undisbursed loan funds and deferred fees and costs), compared to $35.5 million or 0.53% of total loans, at December 31, 2023. Non-performing loans are loans which are 90 days or more past due or on non-accrual.
The following table sets forth the amounts and categories of Premier’s non-performing assets (excluding individually evaluated loans not considered non-performing) at the dates indicated.
| | | | | | | | | | | | | | | | | | | | |
| | December 31, | |
| | 2024 | | | 2023 | | | 2022 | | | 2021 | | | 2020 | |
| | (Dollars in Thousands) | |
Non-performing loans: | | | | | | | | | | | | | | | |
Residential real estate | | $ | 16,675 | | | $ | 13,028 | | | $ | 7,724 | | | $ | 9,034 | | | $ | 10,178 | |
Commercial real estate | | | 18,917 | | | | 5,971 | | | | 13,396 | | | | 14,621 | | | | 11,980 | |
Construction | | | 1,171 | | | | — | | | | — | | | | — | | | | 806 | |
Commercial | | | 36,893 | | | | 8,649 | | | | 4,862 | | | | 11,531 | | | | 1,365 | |
Home equity and improvement | | | 1,626 | | | | 1,417 | | | | 1,637 | | | | 2,051 | | | | 1,537 | |
Consumer finance | | | 4,436 | | | | 3,433 | | | | 2,401 | | | | 1,873 | | | | 1,624 | |
Purchase Credit Deteriorated ("PCD") | | | 1,277 | | | | 2,993 | | | | 3,802 | | | | 8,904 | | | | 24,192 | |
Total non-performing loans | | | 80,995 | | | | 35,491 | | | | 33,822 | | | | 48,014 | | | | 51,682 | |
Real estate owned | | | 737 | | | | 243 | | | | 619 | | | | 171 | | | | 343 | |
Total repossessed assets | | | 737 | | | | 243 | | | | 619 | | | | 171 | | | | 343 | |
Total non-performing assets | | $ | 81,732 | | | $ | 35,734 | | | $ | 34,441 | | | $ | 48,185 | | | $ | 52,025 | |
Total non-performing assets as a percentage of
total assets | | | 0.95 | % | | | 0.41 | % | | | 0.41 | % | | | 0.64 | % | | | 0.72 | % |
Total non-performing loans as a percentage of
total loans* | | | 1.25 | % | | | 0.53 | % | | | 0.52 | % | | | 0.91 | % | | | 0.96 | % |
Total non-performing assets as a percentage of
total loans plus other real estate owned* | | | 1.26 | % | | | 0.53 | % | | | 0.53 | % | | | 0.91 | % | | | 0.96 | % |
Allowance for credit losses as a percent
of total non-performing assets | | | 92.61 | % | | | 214.12 | % | | | 211.42 | % | | | 137.94 | % | | | 157.77 | % |
* Total loans are net of undisbursed loan funds and deferred fees and costs.
Allowance for credit losses – Premier adopted the current expected credit losses ("CECL") accounting standard in 2020. As a result, credit loss and provision are not comparable to years prior to 2020 allowance for loan loss data. Premier maintains an allowance for credit losses to absorb current expected losses in the loan portfolio. The allowance for credit losses is made up of two components. The first is a general reserve, which is used to record credit loss reserves for groups of homogenous loans in which the Company estimates the current expected credit losses in the portfolio based on quantitative and qualitative factors.
The second component of the allowance for credit losses is the specific reserve in which the Company sets aside reserves based on the analysis of individual credits. In evaluating the adequacy of its allowance each quarter, management grades all loans in the commercial portfolio. See “Item 7 - Management’s Discussion and Analysis of Financial Condition and Results of Operations – Allowance for credit losses” for further discussion on management’s evaluation of the allowance for credit losses.
Loans are charged against the allowance when such loans meet the Company’s established policy on loan charge-offs and the allowance itself is adjusted quarterly by recording a provision for credit losses. As such, actual losses and losses provided for should be approximately the same if the overall quality, composition and size of the portfolio remained static along with a static economic environment. To the extent that the portfolio grows at a rapid rate or overall quality or the economic environment deteriorates, the provision generally will exceed charge-offs. However, in certain circumstances, net charge-offs may exceed the provision for credit losses when management determines that loans previously provided for in the allowance for credit losses are uncollectible and should be charged-off or as overall credit or the economic environment improves. Although management believes that it uses the best information available to make such determinations, future adjustments to the allowance may be necessary, and net earnings could be significantly affected, if circumstances differ substantially from the assumptions used in making the initial determinations.
At December 31, 2024, Premier’s allowance for credit losses totaled $75.7 million compared to $76.5 million at December 31, 2023. The following table sets forth the activity in Premier’s allowance for credit losses during the periods indicated.
| | | | | | | | | | | | | | | | | | | | |
| | Years Ended December 31, | |
| | 2024 | | | 2023 | | | 2022 | | | 2021 | | | 2020 | |
| | (Dollars in Thousands) | |
Allowance at beginning of year | | $ | 76,512 | | | $ | 72,816 | | | $ | 66,468 | | | $ | 82,079 | | | $ | 31,243 | |
Impact of ASC 326 Adoption | | | — | | | | — | | | | — | | | | — | | | | 2,354 | |
Acquisition related allowance for credit loss (PCD) | | | — | | | | — | | | | — | | | | — | | | | 7,698 | |
Provision (benefit) for credit losses | | | 3,890 | | | | 7,742 | | | | 12,503 | | | | (6,733 | ) | | | 43,154 | |
Charge-offs: | | | | | | | | | | | | | | | |
Residential real estate | | | (82 | ) | | | (320 | ) | | | (1,025 | ) | | | (110 | ) | | | (302 | ) |
Commercial real estate | | | (1,552 | ) | | | (2,319 | ) | | | (443 | ) | | | (3,776 | ) | | | (65 | ) |
Construction | | | — | | | | — | | | | (16 | ) | | | — | | | | (1 | ) |
Commercial | | | (1,995 | ) | | | (2,334 | ) | | | (5,341 | ) | | | (6,958 | ) | | | (687 | ) |
Home equity and improvement | | | (177 | ) | | | (160 | ) | | | (303 | ) | | | (63 | ) | | | (164 | ) |
Consumer finance | | | (2,051 | ) | | | (1,478 | ) | | | (963 | ) | | | (476 | ) | | | (279 | ) |
PCD | | | (105 | ) | | | (153 | ) | | | (440 | ) | | | (2 | ) | | | (4,854 | ) |
Total charge-offs | | | (5,962 | ) | | | (6,764 | ) | | | (8,531 | ) | | | (11,385 | ) | | | (6,352 | ) |
Recoveries | | | 1,248 | | | | 2,718 | | | | 2,376 | | | | 2,507 | | | | 3,982 | |
Net (charge-offs) recoveries | | | (4,714 | ) | | | (4,046 | ) | | | (6,155 | ) | | | (8,878 | ) | | | (2,370 | ) |
Ending allowance | | $ | 75,688 | | | $ | 76,512 | | | $ | 72,816 | | | $ | 66,468 | | | $ | 82,079 | |
Allowance for credit losses to total non-performing loans
at end of year | | | 93.45 | % | | | 215.58 | % | | | 215.29 | % | | | 138.43 | % | | | 158.82 | % |
Allowance for credit losses to total loans at end of year* | | | 1.17 | % | | | 1.14 | % | | | 1.13 | % | | | 1.26 | % | | | 1.49 | % |
Net charge-offs (recoveries) for the year to average loans | | | 0.10 | % | | | 0.06 | % | | | 0.10 | % | | | 0.16 | % | | | 0.05 | % |
* Total loans are net of undisbursed loan funds and deferred fees and costs.
The provision for credit losses decreased in 2024 primarily due to lower volume. Refer to Notes 2 and 6 to the Consolidated Financial Statements for additional information. Management feels that the level of the allowance for credit losses at December 31, 2024, is sufficient to cover losses that are expected over the lifetime of loans in the portfolio.
The following table sets forth information concerning the allocation of Premier’s allowance for credit losses by loan categories at the dates indicated. For information about the percent of total loans in each category to total loans, see “Lending Activities-Loan Portfolio Composition” above.
| | | | | | | | | | | | | | | | | | | | | | | | | | | | | | | | | | | | | | | | |
| | December 31, | |
| | 2024 | | | 2023 | | | 2022 | | | 2021 | | | 2020 | |
| | | | | Percent of | | | | | | Percent of | | | | | | Percent of | | | | | | Percent of | | | | | | Percent of | |
| | | | | total loans | | | | | | total loans | | | | | | total loans | | | | | | total loans | | | | | | total loans | |
| | Amount | | | by category | | | Amount | | | by category | | | Amount | | | by category | | | Amount | | | by category | | | Amount | | | by category | |
| | (Dollars in Thousands) | |
Residential real estate | | $ | 16,049 | | | | 26.5 | % | | $ | 17,215 | | | | 25.8 | % | | $ | 16,711 | | | | 21.6 | % | | $ | 12,029 | | | | 20.2 | % | | $ | 17,534 | | | | 20.5 | % |
Commercial real estate | | | 31,354 | | | | 43.4 | % | | | 36,053 | | | | 40.5 | % | | | 34,218 | | | | 38.8 | % | | | 32,399 | | | | 42.5 | % | | | 43,417 | | | | 40.8 | % |
Construction | | | 2,754 | | | | 8.9 | % | | | 3,159 | | | | 12.0 | % | | | 4,025 | | | | 17.9 | % | | | 3,004 | | | | 15.0 | % | | | 2,741 | | | | 11.4 | % |
Commercial loans | | | 20,851 | | | | 14.4 | % | | | 15,489 | | | | 15.1 | % | | | 11,769 | | | | 14.8 | % | | | 13,410 | | | | 15.5 | % | | | 11,665 | | | | 20.6 | % |
Home equity and
improvement loans | | | 2,235 | | | | 4.1 | % | | | 2,703 | | | | 3.8 | % | | | 4,044 | | | | 3.9 | % | | | 4,221 | | | | 4.6 | % | | | 4,739 | | | | 4.7 | % |
Consumer loans | | | 2,445 | | | | 2.7 | % | | | 1,893 | | | | 2.8 | % | | | 2,049 | | | | 3.0 | % | | | 1,405 | | | | 2.2 | % | | | 1,983 | | | | 2.1 | % |
| | $ | 75,688 | | | | 100.0 | % | | $ | 76,512 | | | | 100.0 | % | | $ | 72,816 | | | | 100.0 | % | | $ | 66,468 | | | | 100.0 | % | | $ | 82,079 | | | | 100.0 | % |
Sources of Funds
General – Deposits are the primary source of Premier’s funds for lending and other investment purposes. In addition to deposits, Premier derives funds from loan principal repayments. Loan repayments are a relatively stable source of funds, while deposit inflows and outflows are significantly influenced by general interest rates and other market conditions. Borrowings from the FHLB may be used on a short-term basis to compensate for reductions in the availability of funds from other sources. They may also be used on a longer-term basis for general business purposes.
Deposits – Premier’s deposits are attracted principally from within Premier’s primary market area through the offering of a broad selection of deposit instruments, including checking accounts, money market accounts, savings accounts, and term certificate accounts. Deposit account terms vary, with the principal differences being the minimum balance required, the time periods the funds must remain on deposit, and the interest rate.
To supplement its funding needs, Premier also has the ability to utilize the national market for certificates of deposit and syndicated brokered deposits. Premier has used these deposits in the past and could in the future if necessary. Premier had $54.7 million and $341.9 million in brokered deposits as of December 31, 2024 and 2023.
Deposits are backed by the federal government for at least $250,000 per depositor. At December 31, 2024 and 2023, the Bank had approximately $2.4 billion and $2.4 billion, respectively, in uninsured deposits.
Average balances and average rates paid on deposits are as follows:
| | | | | | | | | | | | | | | | | | | | | | | | |
| | Years Ended December 31, | |
| | 2024 | | | 2023 | | | 2022 | |
| | Amount | | | Rate | | | Amount | | | Rate | | | Amount | | | Rate | |
| | (Dollars in Thousands) | |
Noninterest-bearing demand deposits | | $ | 1,460,939 | | | | — | | | $ | 1,616,919 | | | | — | | | $ | 1,791,712 | | | | — | |
Interest-bearing demand deposits | | | 3,329,962 | | | | 2.95 | % | | | 3,120,290 | | | | 2.32 | % | | | 3,097,317 | | | | 0.55 | % |
Savings deposits | | | 636,404 | | | | 0.08 | % | | | 741,157 | | | | 0.02 | % | | | 822,813 | | | | 0.02 | % |
Time deposits | | | 1,372,870 | | | | 4.08 | % | | | 1,159,443 | | | | 2.99 | % | | | 787,896 | | | | 0.86 | % |
Brokered deposits | | | 305,123 | | | | 5.33 | % | | | 307,499 | | | | 5.13 | % | | | 33,802 | | | | 3.08 | % |
Totals | | $ | 7,105,298 | | | | 2.41 | % | | $ | 6,945,308 | | | | 1.77 | % | | $ | 6,533,539 | | | | 0.37 | % |
The following table sets forth the maturities of Premier’s retail certificates of deposit having principal amounts $250,000 or greater at December 31, 2024 (in thousands):
| | | | |
Retail certificates of deposit maturing in quarter ending: | | | |
March 31, 2025 | | $ | 205,708 | |
June 30, 2025 | | | 172,176 | |
September 30, 2025 | | | 97,050 | |
December 31, 2025 | | | 14,740 | |
After December 31, 2025 | | | 30,604 | |
Total retail certificates of deposit with balances $250,000 or greater | | $ | 520,278 | |
For additional information regarding Premier’s deposits see Note 10 to the Consolidated Financial Statements.
Borrowings – The FHLB system functions as a central reserve bank providing credit for its member institutions and certain other financial institutions. As a member in good standing of the FHLB, Premier is authorized to apply for advances, provided certain standards of creditworthiness have been met. At December 31, 2024, Premier could borrow up to $1.8 billion. The Bank had $507.0 million in advances outstanding at December 31, 2024 and $280.0 million in advances outstanding at December 31, 2023. For additional information regarding Premier’s FHLB advances and other debt, see Notes 11 and 13 to the Consolidated Financial Statements.
Subordinated Debentures – For information regarding the Company’s subordinated debentures see Note 12 to the Consolidated Financial Statements.
Effect of Environmental Regulation - Compliance with federal, state and local provisions regulating the discharge of materials into the environment, or otherwise relating to the protection of the environment, has not had a material effect upon the capital expenditures, earnings or competitive position of Premier or its subsidiaries. Premier believes the nature of the operations of its subsidiaries has little, if any, environmental impact. As a result, Premier anticipates no material capital expenditures for environmental control facilities for Premier’s current fiscal year or for the foreseeable future.
Premier believes its primary exposure to environmental risk is through the lending activities of the Bank. In cases where management believes environmental risk potentially exists, the Bank mitigates environmental risk exposures by requiring environmental site assessments at the time of loan origination to confirm collateral quality as to commercial real estate parcels posing higher than normal potential for environmental impact, as determined by reference to present and past uses of the subject property and adjacent sites. In addition, environmental assessments are typically required prior to any foreclosure activity involving non-residential real estate collateral.
Human Capital
Premier had 938 employees at December 31, 2024 (comprised of 94.7% full-time employees and 5.3% part-time employees). None of these employees are represented by a collective bargaining agent, and Premier believes that it maintains good relationships with its personnel. Premier’s talent acquisition processes are designed to attract top talent in the financial services industry and foster an inclusive, respectful and rewarding workplace. All employees receive training on the Company’s Mission, Vision and Core Values. The Company is committed to fostering an environment that encourages diverse viewpoints, backgrounds and experiences and continues to explore additional diversity, equity, and inclusion efforts. The Company offers a comprehensive compensation and benefits package to employees designed to attract, retain, motivate, and reward employees. The Company provides health benefits, including medical, dental and vision benefits, short- and long-term disability, and life insurance.
Competition
Competition in originating commercial real estate and commercial loans comes mainly from commercial banks with banking center offices in the Company’s market area. Competition for the origination of mortgage loans arises mainly from savings associations, commercial banks, and mortgage companies. The distinction among market participants is based on a combination of price, the quality of customer service and name recognition. The Company competes for loans by offering competitive interest rates and product types and by seeking to provide a higher level of personal service to borrowers than is furnished by competitors.
Management believes that the Bank’s most direct competition for deposits comes from local financial institutions. The distinction among market participants is based on price and the quality of customer service and name recognition. The Bank’s cost of funds fluctuates with general market interest rates. During certain interest rate environments, additional significant competition for deposits may be expected from corporate and governmental debt securities, as well as from money market mutual funds. The Bank competes for conventional deposits by emphasizing quality of service, extensive product lines and competitive pricing.
Regulation
General – Premier is subject to regulation, examination and oversight by the Federal Reserve Board (“Federal Reserve”). The Bank is subject to regulation, examination and oversight by the Ohio Division of Financial Institutions (“ODFI”). The Bank's primary federal regulator is the FDIC. In addition, the Bank is subject to regulations of the Consumer Financial Protection Bureau (“CFPB”) which was established by the 2010 Dodd-Frank Wall Street Reform and Consumer Protection Act, as amended (“Dodd-Frank Act”) and has broad powers to adopt and enforce consumer protection regulations.
Holding Company Regulation – Premier is subject to the requirements of the Bank Holding Company Act of 1956, as amended (“BHC Act”), and examination and regulation by the Federal Reserve. Premier elected to become a financial holding company in 2020. The Federal Reserve has extensive enforcement authority over bank holding companies and financial holding companies, including, among other things, the ability to assess civil money penalties, issue cease and desist or removal orders, and require that a bank holding company divest subsidiaries (including its banking subsidiaries). In general, the Federal Reserve may initiate enforcement action for violations of laws and regulations and unsafe or unsound practices.
A bank holding company is required by law and Federal Reserve policy to serve as a source of financial strength to each subsidiary bank and to commit resources to support those subsidiary banks. The Federal Reserve may require a bank holding company to contribute additional capital to an undercapitalized subsidiary bank and may disapprove of the payment of dividends to the shareholders of the bank holding company if the Federal Reserve believes the payment would be an unsafe or unsound practice. The Federal Reserve also requires bank holding companies to provide advance notification of planned dividends under certain circumstances.
The BHC Act requires the prior approval of the Federal Reserve in any case where a bank holding company proposes to: acquire direct or indirect ownership or control of more than 5% of the voting shares of any bank that is not already majority-owned by the bank holding company; acquire all or substantially all of the assets of another bank or bank holding company; or merge or consolidate with any other bank holding company.
In order to become a financial holding company, all of a bank holding company’s subsidiary depository institutions must be well capitalized and well managed under federal banking regulations, and such depository institutions must have received a rating of at least satisfactory under the Community Reinvestment Act (“CRA”). In addition, the holding company must be well managed and must be well capitalized.
Financial holding companies may engage in a wide variety of financial activities, including any activity that the Federal Reserve and the Treasury Department consider financial in nature or incidental to financial activities, and any activity that the Federal Reserve determines to be complementary to a financial activity and which does not pose a substantial safety and soundness risk. These activities include securities underwriting and dealing activities, insurance and underwriting activities and merchant banking/equity investment activities. Because it has authority to engage in a broad array of financial activities, a financial holding company may have several affiliates that are functionally regulated by financial regulators other than the Federal Reserve, such as the SEC and state insurance regulators.
If a financial holding company or a subsidiary bank fails to meet the requirements for the holding company to remain a financial holding company, the financial holding company must enter into a written agreement with the Federal Reserve within 45 days to comply with all applicable capital and management requirements. Until the Federal Reserve determines that the holding company and its subsidiary banks meet the requirements, the Federal Reserve may impose additional limitations or conditions on the conduct or activities of the financial holding company or any affiliate that the Federal Reserve finds to be appropriate or consistent with federal banking laws. If the deficiencies are not corrected within 180 days, the financial holding company may be required to divest ownership or control of all subsidiary banks. If restrictions are imposed on the activities of the holding company, such restrictions may not be made publicly available pursuant to confidentiality regulations of the banking regulators.
In April 2020, the Federal Reserve adopted a final rule to revise its regulations related to determinations of whether a company has the ability to exercise a controlling influence over another company for purposes of the BHC Act. The final rule expands and codifies the presumptions for use in such determinations. By codifying the presumptions, the final rule provides greater transparency on the types of relationships that the Federal Reserve generally views as supporting a facts-and-circumstances determination that one company controls another company. The Federal Reserve’s final rule applies to questions of control under the BHC Act, but does not extend to the Change in Bank Control Act.
Regulation of Ohio State-Chartered Banks – As an Ohio state-chartered bank, the Bank is supervised and regulated primarily by the ODFI and the FDIC. In addition, the Bank’s deposits are insured up to applicable limits by the FDIC, and the Bank will be subject to the applicable provisions of the Federal Deposit Insurance Act, as amended, and certain other regulations of the FDIC.
Various requirements and restrictions under the laws of the United States and the State of Ohio will affect the operations of the Bank, including requirements to maintain reserves against deposits, restrictions on the nature and amount of loans that may be made and the interest that may be charged thereon, restrictions relating to investments and other activities, limitations on credit exposure to correspondent banks, limitations on activities based on capital and surplus, limitations on payment of dividends, limitations on branching and increasingly extensive consumer protection laws and regulations.
Economic Growth, Regulatory Relief and Consumer Protection Act - On May 25, 2018, the Economic Growth, Regulatory Relief and Consumer Protection Act (the “Regulatory Relief Act”) was enacted, which repealed or modified certain provisions of the Dodd-Frank Act and eased regulations on all but the largest banks (those with consolidated assets in excess of $250 billion). Bank holding companies with consolidated assets of less than $100 billion, including Premier, are no longer subject to enhanced prudential standards. The Regulatory Relief Act also relieves bank holding companies and banks with consolidated assets of less than $100 billion, including Premier, from certain record-keeping, reporting and disclosure requirements. Certain other regulatory requirements applied only to banks with consolidated assets in excess of $50 billion and so did not apply to the Company even before the enactment of the Regulatory Relief Act.
Regulatory Capital Requirements and Prompt Corrective Action – The federal banking regulators have adopted risk-based capital guidelines for financial institutions and their holding companies. The guidelines provide a systematic analytical framework, which makes regulatory capital requirements sensitive to differences in risk profiles among banking organizations, takes off-balance sheet exposures expressly into account in evaluating capital adequacy and incentivizes holding liquid, low-risk assets. Capital levels as measured by these standards are also used to categorize financial institutions for purposes of certain prompt corrective action regulatory provisions.
The risk-based capital guidelines adopted by the federal banking agencies are based on the “International Convergence of Capital Measurement and Capital Standard,” published by the Basel Committee on Banking Supervision. Capital rules applicable to smaller banking organizations (the “Basel III Capital Rules”), which also implemented certain provisions of the Dodd-Frank Act became effective commencing on January 1, 2015. Compliance with the minimum capital requirements was effective January 1, 2015, whereas a capital conservation buffer and deductions from common equity capital phased in from January 1, 2016, through January 1, 2019, and most deductions from common equity tier 1 capital phased in from January 1, 2015 through January 1, 2019.
The Basel III Capital Rules include (i) a minimum common equity tier 1 (“CET1”) capital ratio of 4.5%, (ii) a minimum tier 1 capital ratio of 6.0%, (iii) a minimum total capital ratio of 8.0%, and (iv) a minimum leverage ratio of 4%.
Common equity for the CET1 capital ratio includes common stock (plus related surplus) and retained earnings, plus limited amounts of minority interests in the form of common stock, less the majority of certain regulatory deductions.
Tier 1 capital includes common equity as defined for the CET1 capital ratio, plus certain non-cumulative preferred stock and related surplus, cumulative preferred stock and related surplus, trust preferred securities that have been grandfathered (but which are not otherwise permitted), and limited amounts of minority interests in the form of additional tier 1 capital instruments, less certain deductions.
Tier 2 capital, which can be included in the total capital ratio, includes certain capital instruments (such as subordinated debentures) and limited amounts of the allowance for credit losses, subject to specified eligibility criteria, less applicable deductions.
The deductions from CET1 capital include goodwill and other intangibles, certain deferred tax assets, mortgage-servicing assets above certain levels, gains on sale in connection with a securitization, investments in a banking organization’s own capital instruments and investments in the capital of unconsolidated financial institutions (above certain levels).
Under the guidelines, capital is compared to the relative risk included in the balance sheet. To derive the risk included in the balance sheet, one of several risk weights is applied to different balance sheet and off-balance sheet assets, primarily based on the relative credit risk of the counterparty. The capital amounts and classification are also subject to qualitative judgments by the regulators about components, risk weightings and other factors.
The Basel III Capital Rules also place restrictions on the payment of capital distributions, including dividends, and certain discretionary bonus payments to executive officers if the company does not hold a capital conservation buffer of greater than 2.5% composed of CET1 capital above its minimum risk-based capital requirements, or if its eligible retained income is negative in that quarter and its capital conservation buffer ratio was less than 2.5% at the beginning of the quarter.
The federal banking agencies have established a system of “prompt corrective action” to resolve certain problems of undercapitalized banks. This system is based on five capital level categories for insured depository institutions: “well capitalized,” “adequately capitalized,” “undercapitalized,” “significantly undercapitalized” and “critically undercapitalized.” The federal banking agencies may (or in some cases must) take certain supervisory actions depending upon a bank's capital level. For example, the banking agencies must appoint a receiver or conservator for a bank within 90 days after it becomes "critically undercapitalized" unless the bank's primary regulator determines, with the concurrence of the FDIC, that other action would better achieve regulatory purposes. Banking operations otherwise may be significantly affected depending on a bank's capital category. For example, a bank that is not "well capitalized" generally is prohibited from accepting brokered deposits and offering interest rates on deposits higher than the prevailing rate in its market, and the holding company of any undercapitalized depository institution must guarantee, in part, specific aspects of the bank's capital plan for the plan to be acceptable.
In accordance with the Basel III Capital Rules, in order to be “well-capitalized” under the prompt corrective action guidelines, a financial institution must have a CET1 capital ratio of 6.5%, a total risk-based capital ratio of at least 10.0%, a tier 1 risk-based capital of at least 8.0% and a leverage ratio of at least 5.0%, and the institution must not be subject to any written agreement, order, capital directive or prompt corrective action directive to meet and maintain a specific capital level for any capital measure. As of December 31, 2024, the Bank met the capital ratio requirements to be deemed "well-capitalized" according to the guidelines described above. See Note 16 of the Notes to the Consolidated Financial Statements for additional information.
In December 2019, the federal banking agencies issued a final rule to address regulatory treatment of credit loss allowances under the CECL accounting standard. The rule revised the federal banking agencies’ regulatory capital rules to identify which credit loss allowances under the CECL model are eligible for inclusion in regulatory capital and to provide banking organizations the option to phase in over three years the day‑one adverse effects on regulatory capital that may result from the adoption of the CECL model. Concurrent with the enactment of the Coronavirus Aid, Relief, and Economic Security Act of 2020, as amended (the “CARES Act”), discussed below, federal banking agencies issued an interim final rule that delayed the estimated impact on regulatory capital resulting from the adoption of CECL. The interim final rule provided banking organizations that implemented CECL prior to the end of 2020 the option to delay for two years the estimated impact of CECL on regulatory capital relative to regulatory capital determined under the prior incurred loss methodology, followed by a three-year transition period to phase out the aggregate amount of capital benefit provided during the initial two-year delay. Premier adopted CECL on January 1, 2020.
Dividends – There are various legal limitations on the extent to which a subsidiary bank may finance or otherwise supply funds to its parent holding company. Under applicable federal and state laws, a subsidiary bank may not, subject to certain limited exceptions, make loans or extensions of credit to, or investments in the securities of, its parent holding company. A subsidiary bank is also subject to collateral security requirements for any loan or extension of credit permitted by such exceptions. The Bank paid $60 million in dividends in 2024 and paid $26.5 million in dividends and received $29.8 million in a cash contribution from Premier in 2023. First Insurance paid $1.0 million and $43.0 million in dividends to Premier in 2024 and 2023. Premier Risk Management did not pay dividends to Premier in 2023. PFC Capital did not pay dividends in 2024 or 2023.
Premier’s ability to pay dividends to its shareholders is primarily dependent on its receipt of dividends from the Subsidiaries. The Federal Reserve expects Premier to serve as a source of strength for the Bank and may require Premier to retain capital for further investment in the Bank, rather than pay dividends to Premier shareholders. Payment of dividends by Premier or the Bank may be restricted at any time at the discretion of its applicable regulatory authorities if they deem such dividends to constitute an unsafe or unsound practice. These provisions could have the effect of limiting Premier's ability to pay dividends on its common shares.
Deposit Insurance – The FDIC maintains the Deposit Insurance Fund (“DIF’), which insures the deposit accounts of the Bank to the maximum amount provided by law. The general insurance limit is $250,000 per separately insured depositor. This insurance is backed by the full faith and credit of the U. S. government.
As insurer, the FDIC is authorized to conduct examinations of, and to require reporting by, federally-insured institutions. It also may prohibit any federally-insured institution from engaging in any activity the FDIC determines by regulation or order to pose a serious threat to the DIF and it has the authority to take enforcement actions against insured institutions. Insurance of deposits may be terminated by the FDIC upon a finding that the institution has engaged or is engaging in unsafe or unsound practices, is in an unsafe or unsound condition to continue operations or has violated any applicable law, regulation, rule, order or condition imposed by the FDIC or written agreement entered into with the FDIC.
The Federal Deposit Insurance Act, as amended (“FDIA”) requires the FDIC's Board of Directors to set a target or Designated Reserve Ratio (“DRR”) for the DIF annually. The DRR is the total of the DIF divided by the total estimated insured deposits of the industry. Under the long-range plan, the FDIC set the DRR at 2.0% and set a schedule of assessment rates that would progressively decrease when the DRR reached 2.0% and 2.5%. The FDIC views the 2.0% DRR as a long-term goal and the minimum level needed to withstand future crises of the magnitude of past crises. Extraordinary growth in insured deposits during the first and second quarters of 2020 caused the DRR to decline below the statutory minimum of 1.35% as of June 30, 2020. In September 2020, the FDIC Board of Directors adopted a restoration plan to restore the DRR to at least 1.35% by 2028, absent extraordinary circumstances, as required by the FDIA. The restoration plan maintained the assessment rate schedules in place at the time and required the FDIC to update its analysis and projections for the DIF balance and DRR at least semiannually. In the semiannual update for the restoration plan in June 2022, the FDIC projected that the DRR was at risk of not reaching the statutory minimum of 1.35% by September 30, 2028, the statutory deadline to restore the DRR. Based on this update, the FDIC Board approved an amended restoration plan, and concurrently proposed an increase in initial base deposit insurance assessment rate schedules uniformly by two basis points, applicable to all insured depository institutions. In October 2022, the FDIC Board finalized the increase with an effective date of January, 1, 2023. The revised assessment rate schedules are intended to increase the likelihood that the DRR reaches the statutory minimum level of 1.35% by September 30, 2028.
Consumer Protection Laws and Regulations – Banks are subject to periodic examination to ensure compliance with federal statutes and regulations applicable to their business, including consumer protection statutes and implementing regulations. The Dodd-Frank Act established the CFPB, which has extensive regulatory and enforcement powers over consumer financial products and services. The CFPB has adopted numerous rules with respect to consumer protection laws and has commenced related enforcement actions. The following are just a few of the consumer protection laws applicable to the Bank:
Community Reinvestment Act of 1977 ("CRA"): imposes a continuing and affirmative obligation to fulfill the credit needs of its entire community, including low- and moderate-income neighborhoods.
Equal Credit Opportunity Act: prohibits discrimination in any credit transaction on the basis of any of various criteria.
Truth in Lending Act: requires that credit terms are disclosed in a manner that permits a consumer to understand and compare credit terms more readily and knowledgeably.
Fair Housing Act: makes it unlawful for a lender to discriminate in its housing-related lending activities against any person on the basis of any of certain criteria.
Home Mortgage Disclosure Act: requires financial institutions to collect data that enables regulatory agencies to determine whether the financial institutions are serving the housing credit needs of the communities in which they are located.
Real Estate Settlement Procedures Act: requires that lenders provide borrowers with disclosures regarding the nature and cost of real estate settlements and prohibits abusive practices that increase borrowers’ costs.
Privacy provisions of the Gramm-Leach-Bliley Act: requires financial institutions to establish policies and procedures to restrict the sharing of non-public customer data with non-affiliated parties and to protect customer information from unauthorized access.
The banking regulators also use their authority under the Federal Trade Commission Act to take supervisory or enforcement action with respect to unfair or deceptive acts or practices by banks that may not necessarily fall within the scope of specific banking or consumer finance law.
On July 22, 2020, the CFPB issued a final small dollar loan rule related to payday, vehicle title and certain high cost installment loans (the “Small Dollar Rule”) that modified a former rule that was issued in November 2013. Specifically, the Small Dollar Rule revokes provisions contained in the 2013 rule that: (i) provide that it is an unfair and abusive practice for a lender to make a covered short-term or longer-term balloon-payment loan, including payday and vehicle title loans, without reasonably determining that consumers have the ability to repay those loans according to their terms; (ii) prescribe mandatory underwriting requirements for making the ability-to-repay determination; (iii) exempt certain loans from mandatory underwriting requirements; and (iv) establish related definitions, reporting, and record keeping requirements. However, due to continuing appellate litigation regarding the constitutionality of the CPFB's funding structure, which stems, in part, from legal challenges to the Small Dollar Rule, the effective date for nationwide compliance with the Small Dollar Rule remains uncertain at this time.
Further, the federal bank regulatory agencies issued interagency guidance on May 20, 2020, to encourage banks, savings associations, and credit unions to offer responsible small-dollar loans to customers for consumer and small business purposes. The compliance date for the Small Dollar Rule is March 30, 2025.
Federal Reserve System - The Federal Reserve requires all depository institutions to maintain reserves at specified levels against their transaction accounts, primarily checking accounts. In response to the COVID-19 pandemic, the Federal Reserve reduced reserve requirement ratios to zero percent effective on March 26, 2020, to support lending to households and businesses. At December 31, 2024, the reserve requirement ratio remains at zero percent.
Transactions with Affiliates; Insider Loans - Sections 23A and 23B of the Federal Reserve Act and Federal Reserve Board Regulation W generally:
•limit the extent to which a bank or its subsidiaries may engage in “covered transactions” with any one affiliate to an amount equal to 10.0% of the bank's capital stock and surplus;
•limit the extent to which a bank or its subsidiaries may engage in “covered transactions” with all affiliates to an amount equal to 20.0% of the bank's capital stock and surplus; and
•require that all such transactions be on terms substantially the same, or at least as favorable to the bank or subsidiary, as those provided to a non-affiliate.
An affiliate of a bank is any company or entity that controls, is controlled by or is under common control with the bank. The term “covered transaction” includes the making of loans to the affiliate, the purchase of assets from the affiliate, the issuance of a guarantee on behalf of the affiliate, the purchase of securities issued by the affiliate and other similar types of transactions.
A bank’s authority to extend credit to executive officers, directors and greater than 10.0% shareholders, as well as entities such persons control, is subject to Sections 22(g) and 22(h) of the Federal Reserve Act and Regulation O promulgated thereunder by the Federal Reserve Board. Among other things, these loans must be made on terms (including interest rates charged and collateral required) substantially similar to those offered to unaffiliated individuals or be made as part of a benefit or compensation program on terms widely available to employees and must not involve a greater than normal risk of repayment. In addition, the amount of loans a bank may make to these persons is based, in part, on the bank’s capital position, and specified approval procedures must be followed in making loans which exceed specified amounts.
CRA - Under the CRA, every FDIC-insured institution is obligated, consistent with safe and sound banking practices, to help meet the credit needs of its entire community, including low- and moderate-income neighborhoods. The CRA requires the appropriate federal banking regulator, in connection with the examination of an insured institution, to assess the institution’s record of meeting the credit needs of its community and to consider this record in its evaluation of certain applications to banking regulators, such as an application for approval of a merger or the establishment of a branch. An unsatisfactory rating may be used as the basis for the denial of an application to acquire another financial institution or open a new branch. As of its last examination, the Bank received a CRA rating of “satisfactory.”
On October 24, 2023, the federal banking agencies, including the FDIC, issued a final rule designed to strengthen and modernize the regulations implementing the CRA. The changes are designed to encourage banks to expand access to credit, investment and banking services in low- and moderate-income communities, adapt to changes in the banking industry, including mobile and internet banking, provide greater clarity and consistency in the application of the CRA regulations and tailor CRA evaluations and data collection to bank size and type. The applicability date for the majority of the changes to the CRA regulations is January 1, 2026, and additional requirements will be applicable on January 1, 2027.
Patriot Act – In response to the terrorist events of September 11, 2001, the Uniting and Strengthening of America by Providing Appropriate Tools Required to Intercept and Obstruct Terrorism Act of 2001, as amended (the “Patriot Act”) was signed into law in October 2001. The Patriot Act gives the U.S. government powers to address terrorist threats through enhanced domestic security measures, expanded surveillance powers, increased information sharing and broadened anti-money laundering requirements. Title III of the Patriot Act and related regulations require regulated financial institutions to establish a program specifying procedures for obtaining identifying information from customers seeking to open new accounts and establish enhanced due diligence policies, procedures and controls designed to detect and report suspicious activity. The Bank has established policies and procedures that it considers to be in compliance with the requirements of the Patriot Act.
Volcker Rule – The Volcker Rule, which became effective under the Dodd-Frank Act in 2015, prohibits banks and their affiliates from engaging in proprietary trading and investing in and sponsoring hedge funds, otherwise known as “covered funds.” On July 9, 2019, the five federal agencies that adopted the Volcker Rule issued a final rule to exempt certain community banks, including the Bank, from such rule, consistent with the Regulatory Relief Act. Under the final rule, community banks with $10 billion or less in total consolidated assets and total trading assets and liabilities of 5.0% or less of total consolidated assets were excluded from the restrictions of the Volcker Rule. On June 25, 2020, the federal bank regulatory agencies also finalized a rule modifying the Volcker Rule’s prohibition on banking entities investing in or sponsoring covered funds. Such rule permits certain banking entities to offer financial services and engage in other activities that do not raise concerns that the Volcker Rule was originally intended to address. To the extent that the Bank engages in any of the trading activities or has any ownership interest in or relationship with any of the types of funds regulated by the Volcker Rule, Premier believes that its activities and relationships comply with such rule, as amended.
Office of Foreign Assets Control Regulation – The U.S. Treasury Department’s Office of Foreign Assets Control (“OFAC”) administers and enforces economic and trade sanctions against targeted foreign countries and regimes, under authority of various laws, including designated foreign countries, nationals and others. OFAC publishes lists of specially designated targets and countries. Premier is responsible for, among other things, blocking accounts of, and transactions with, such targets and countries, prohibiting unlicensed trade and financial transactions with them and reporting blocked transactions after their occurrence. Failure to comply with these sanctions could have serious financial, legal and reputational consequences, including causing applicable bank regulatory authorities not to approve merger or acquisition transactions when regulatory approval is required or to prohibit such transactions even if approval is not required. Regulatory authorities have imposed cease and desist orders and civil money penalties against institutions found to be violating these obligations. The Bank has established policies and procedures that it considers to be in compliance with OFAC requirements.
Cybersecurity – In March 2015, federal regulators issued two related statements regarding cybersecurity. One statement indicates that financial institutions should design multiple layers of security controls to establish several lines of defense and to ensure that their risk management processes also address the risk posed by compromised customer credentials, including security measures to reliably authenticate customers accessing Internet-based services of the financial institution. The other statement indicates that a financial institution’s management is expected to maintain sufficient business continuity planning processes to ensure the rapid recovery, resumption and maintenance of the financial institution’s operations after a cyber-attack involving destructive malware. A financial institution is also expected to develop appropriate processes to enable recovery of data and business operations and address rebuilding network capabilities and restoring data if the financial institution or its critical service providers fall victim to this type of cyber-attack. If Premier fails to observe the regulatory guidance, it could be subject to various regulatory sanctions, including financial penalties.
In November 2021, the OCC, the Federal Reserve and the FDIC issued a final rule that became effective in May 2022 requiring banking organizations that experience a computer-security incident to notify certain entities. A computer-security incident occurs when actual or potential harm to the confidentiality, integrity or availability of an information system or the information occurs, or there is a violation or imminent threat of a violation to banking security policies and procedures. The affected bank must notify its respective federal regulator of the computer-security incident as soon as possible and no later than 36 hours after the bank determines a computer-security incident that rises to the level of a notification incident has occurred. These notifications are intended to promote early awareness of threats to banking organizations and will help banks react to those threats before they manifest into larger incidents. This rule also requires bank service providers to notify their bank organization customers of a computer-security incident that has caused, or is reasonably likely to cause, a material service disruption or degradation for four or more hours.
Furthermore, once final rules are adopted, the Cyber Incident Reporting for Critical Infrastructure Act, enacted in March 2022, will require certain covered entities to report a covered cyber incident to the U.S. Department of Homeland Security’s Cybersecurity & Infrastructure Security Agency (“CISA”) within 72 hours after it reasonably believes an incident has occurred. Separate reporting to CISA will also be required within 24 hours, if a ransom payment is made as a result of a ransomware attack.
On July 26, 2023, the SEC adopted final rules that require public companies to promptly disclose material cybersecurity incidents in a Current Report on Form 8-K and detailed information regarding their cybersecurity risk management, strategy, and governance on an annual basis in an Annual Report on Form 10-K. Companies are required to report on Form 8-K any cybersecurity incident they determine to be material within four business days of making that determination. See “ITEM 1C CYBERSECURITY”. These SEC rules, and any other regulatory guidance, are in addition to notification and disclosure requirements under state and federal banking law and regulations.
State regulators have also been increasingly active in implementing privacy and cybersecurity standards and regulations. Recently, several states have adopted regulations requiring certain financial institutions to implement cybersecurity programs and providing detailed requirements with respect to these programs, including data encryption requirements. Many states have also recently implemented or modified their data breach notification and data privacy requirements. Premier expects this trend of state-level activity in those areas to continue and is continually monitoring developments in the states in which its customers are located.
Executive and Incentive Compensation – Public companies are required to adopt and implement "clawback" policies for incentive compensation payments and to disclose the details of the procedures which allow recovery of incentive compensation that was paid on the basis of erroneous financial information necessitating an accounting restatement due to material noncompliance with financial reporting requirements. This clawback policy is intended to apply to compensation paid within the three completed fiscal years immediately preceding the date the issuer is required to prepare a restatement a three-year look-back window of the restatement and would cover all executives (including former executives) who received incentive awards. Premier has implemented a clawback policy and it is posted under the "Overview – Governance Documents" tab of the "Investor Relations" page of Premier's Internet website.
Item 1A. Risk Factors
The risks listed below present risks that could have a material impact on the Company’s financial condition, results of operations, or business. The risks and uncertainties described below are not the only ones facing the Company. Additional risks and uncertainties that management is not aware of or that management currently deems immaterial may also impair the Company’s business operations.
Economic and Market Risks
Premier’s loan portfolio includes a concentration of commercial real estate loans and commercial loans, which involve risks specific to real estate value and the successful operations of these businesses.
At December 31, 2024, the Bank’s portfolio of commercial real estate loans totaled $2.9 billion, or approximately 43.4% of total loans. The Bank’s commercial real estate loans typically have higher principal amounts than residential real estate loans, and many of our commercial real estate borrowers have more than one loan outstanding. As a result, an adverse development on one loan can expose Premier to greater risk of loss on other loans. Additionally, repayment of the loans is generally dependent, in large part, on sufficient income from the properties securing the loans to cover operating expenses and debt service. Economic conditions and events outside of the control of the borrower or lender, including sustained inflation and rising interest rates, could negatively impact the future cash flows and market values of the affected properties.
At December 31, 2024, the Bank’s portfolio of commercial loans totaled $957.6 million, or approximately 14.4% of total loans. Commercial loans generally expose Premier to a greater risk of nonpayment and loss than commercial real estate or residential real estate loans since repayment of such loans often depends on the successful operations and income stream of the borrowers. The Bank’s commercial loans are primarily made based on the identified cash flow of the borrower and secondarily on the underlying collateral provided by the borrower such as accounts receivable, inventory, machinery or real estate. In the case of loans secured by accounts receivable, the availability of funds for the repayment of these loans may be substantially dependent on the ability of the borrower to collect amounts due from its customers. The collateral securing other loans may depreciate over time, may be difficult to appraise and may fluctuate in value based on the success of the business. Credit support provided by the borrower for most of these loans and the probability of repayment is based on the liquidation of the pledged collateral and enforcement of a personal guarantee, if any exists.
Premier targets its business lending towards small- and medium-sized businesses, many of which have fewer financial resources than larger companies and may be more susceptible to economic downturns. If general economic conditions negatively impact these businesses, Premier’s results of operations and financial condition may be adversely affected.
If Premier's actual credit losses exceed its allowance for credit losses, Premier's net income will decrease.
In accordance with U.S. generally accepted accounting principles (“GAAP”), Premier must maintain an allowance for credit losses that it believes is a reasonable estimate of the expected credit losses within the CECL model. Premier's allowance for credit losses is based upon a number of relevant factors, including, but not limited to, trends in the level of nonperforming assets and classified loans, current and projected economic conditions in the primary lending area, prior experience, possible losses arising from specific problem loans, and management's evaluation of the risks in the current portfolio. However, there are many factors that can result in actual credit losses exceeding the allowance.
For instance, in deciding whether to extend credit or enter into other transactions with customers and counterparties, Premier may rely on information provided to it by customers and counterparties, including financial statements and other financial information. Premier may also rely on representations of customers and counterparties as to the accuracy and completeness of that information and, with respect to financial statements, on reports of independent auditors. Such information may not turn out to be accurate. Further, Premier's loan customers may not repay their loans according to their terms, and the collateral securing the payment of these loans may be insufficient to pay any remaining loan balance. As a result, Premier may experience significant credit losses, which could have a material adverse effect on its operating results.
The amount of future losses also is susceptible to changes in economic, operating and other conditions, including changes in unemployment and interest rates that may be beyond management's control, and these losses may exceed current estimates. Further, federal regulatory agencies, as an integral part of their examination process, review Premier's loans and allowance for credit losses and may require that Premier increase its allowance. Moreover, the Financial Accounting Standards Board (“FASB”) has changed its requirements for establishing the allowance, which became effective for Premier in the first quarter of 2020. Under the CECL model, we are required to use historical information, current conditions and reasonable and supportable forecasts to estimate the expected credit losses. That accounting change exposes Premier to increased risk of failure to establish a sufficient allowance due to incorrect or inadequate methodologies and assumptions and the possibility that Premier will need to increase its allowance substantially through an increase to the provision for credit losses, which will adversely affect Premier's net income.
As a result of any of the above factors, Premier's allowance for credit losses may not be adequate to cover actual credit losses, and future provisions for credit losses could have a material adverse effect on Premier's operating results. There is no assurance that Premier will not further increase the allowance for credit losses. Either of these occurrences could have a material adverse effect on Premier's financial condition and results of operations.
Changes in interest rates can adversely affect Premier’s profitability.
Premier’s earnings and cash flows are largely dependent upon its net interest income, which is the difference between interest income earned on interest-earning assets such as loans and securities, and interest expense paid on interest-bearing liabilities such as deposits and borrowed funds. Interest rates are highly sensitive to many factors that are beyond Premier’s control, including general economic conditions and policies of various governmental and regulatory agencies and, in particular, the Federal Reserve. Changes in monetary
policy, including changes in interest rates, could influence not only the interest Premier receives on loans and securities and the amount of interest it pays on deposits and borrowings, but such changes could also affect Premier’s ability to originate loans and obtain deposits, the fair value of Premier’s financial assets and liabilities, and the average duration of certain assets and liabilities. If the interest rates paid on deposits and other borrowings increase at a faster rate than the interest rates received on loans and other investments, Premier’s net interest income, and therefore earnings, could be adversely affected. Earnings could also be adversely affected if the interest rates received on loans and other investments fall more quickly than the interest rates paid on deposits and other borrowings. While we generally invest in securities with limited credit risk, certain investment securities we hold possess higher credit risk, especially in light of the current economic landscape, since they represent beneficial interests in structured investments collateralized by residential mortgages. All investment securities are subject to changes in market value due to changing interest rates and implied credit spreads. Any substantial, unexpected, or prolonged change in market interest rates could have a material adverse effect on Premier’s results of operations and financial condition.
The Bank originates a significant amount of residential mortgage loans that it sells in the secondary market. The origination of residential mortgage loans is highly dependent on the local real estate market and the current interest rates. Increasing interest rates tend to reduce the origination of loans for sale and consequently fee income, which Premier reports as mortgage banking income. Conversely, decreasing interest rates have the effect of causing clients to refinance mortgage loans faster than anticipated. This causes the value of mortgage servicing rights on the loans sold to be lower than originally anticipated. If this happens, Premier may be required to write down the value of its mortgage servicing rights faster than anticipated, which will increase expense and lower earnings. Accelerated repayments on loans and mortgage-backed securities could result in the reinvestment of funds at lower rates than the loans or securities were paying.
Legal and Regulatory Risks
Laws, regulations and periodic regulatory reviews may affect Premier’s results of operations.
The financial services industry is extensively regulated. Premier is subject to extensive state and federal regulation, supervision and legislation that govern almost all aspects of its operations. Laws and regulations may change from time to time and are primarily intended for the protection of consumers, depositors, borrowers, the DIF and the banking system as a whole, and not to benefit Premier’s shareholders. Regulations affecting banks and financial services businesses are undergoing continuous changes, and management cannot predict the effect of these changes. The impact of any changes to laws and regulations or other actions by regulatory agencies may negatively impact Premier and its ability to increase the value of its business, possibly limiting the services it provides, increasing the potential for competition from non-banks, or requiring it to change the way it operates.
Regulatory authorities have extensive discretion in connection with their supervisory and enforcement activities, including the imposition of restrictions on the operation of an institution, the classification of assets held by an institution, the adequacy of an institution’s allowance for credit losses and the ability to complete acquisitions. Additionally, actions by regulatory agencies against Premier could cause it to devote significant time and resources to defending its business and may lead to penalties that materially affect Premier and its shareholders. Even the reduction of regulatory restrictions could have an adverse effect on Premier and its shareholders if such lessening of restrictions increases competition within Premier’s industry or market area.
In addition to laws, regulations and actions directed at the operations of banks, proposals to reform the housing finance market could negatively affect Premier’s ability to sell loans.
The laws and regulations applicable to the banking industry could change at any time. The potential exists for new laws and regulations, and bank regulatory agencies are expected to be active in responding to concerns and trends identified in examinations. Increased regulation could increase Premier’s cost of compliance and reduce its income to the extent that they limit the manner in which Premier may conduct business, including its ability to offer new products, charge fees for specific products and services, obtain financing, attract deposits, make loans and achieve satisfactory interest spreads.
Further, the combined company may face increased regulatory and compliance risks due to its expanded operations and market presence. The Merger may subject the combined company to additional regulatory scrutiny and compliance requirements, which could result in increased costs and potential legal liabilities. Additionally, the combined company may be required to obtain new licenses or approvals, or comply with different regulatory standards, in jurisdictions where it previously did not operate. Any failure to effectively manage these regulatory and compliance risks could adversely impact the combined company's business and financial performance.
Changes in tax laws could adversely affect Premier's financial condition and results of operations.
Premier is subject to extensive federal, state and local taxes, including income, excise, sales/use, payroll, franchise, withholding and ad valorem taxes. Changes to the tax laws could have a material adverse effect on Premier's results of operations. In addition, Premier's customers are subject to a wide variety of federal, state and local taxes. Changes in taxes paid by customers, including changes in the deductibility of mortgage loan related expenses, may adversely affect their ability to finance activities or purchase properties or consumer products, which could adversely affect their demand for Premier's loans and deposit products. In addition, such negative effects on Premier's customers could result in defaults on the loans already made and decrease the value of mortgage-backed securities in which Premier has invested.
Increasing scrutiny and evolving expectations from customers, regulators, investors, and other stakeholders with respect to our environmental, social and governance practices may impose additional costs on us or expose us to new or additional risks.
Companies are facing increasing scrutiny from customers, regulators, investors, and other stakeholders related to their environmental, social and governance (“ESG”) practices and disclosure. Investor advocacy groups, investment funds and influential investors are also increasingly focused on these practices, especially as they relate to the environment, health and safety, diversity, labor conditions and human rights. Increased ESG-related compliance costs for us as well as among our third party vendors and various other parties within our supply chain could result in increases to our overall operational costs. Failure to adapt to or comply with regulatory requirements or investor or stakeholder expectations and standards could negatively impact our reputation, ability to do business with certain partners, access to capital, and the price of our common shares.
Business and Operational Risks
Premier’s ability to meet cash flow needs on a timely basis at a reasonable cost may adversely affect net income.
Premier’s principal sources of liquidity are local deposits and wholesale funding sources such as FHLB advances, Federal Funds purchased, securities sold under repurchase agreements, and brokered or other out-of-market certificate of deposit purchases. Premier also maintains a portfolio of securities that can be used as a secondary source of liquidity. Premier’s access to funding sources in amounts adequate to finance or capitalize its activities or on terms that are acceptable could be impaired by factors that affect Premier directly or the financial services industry or economy in general, such as further disruptions in the financial markets or negative views and expectations about the prospects for the financial services industry.
Other possible sources of liquidity include the sale or securitization of loans, the issuance of additional collateralized borrowings beyond those currently utilized with the FHLB, the issuance of debt securities and the issuance of preferred or common securities in public or private transactions, or borrowings from a commercial bank.
Any decline in available funding could adversely impact our ability to originate loans, invest in securities, meet our expenses, pay dividends to our shareholders, or fulfill obligations such as repaying Premier’s borrowings or meeting deposit withdrawal demands, any of which could have a material adverse impact on our liquidity, business, results of operations and financial condition.
In addition, prior debt offerings could potentially have important consequences to Premier and its debt and equity investors, including:
•requiring a substantial portion of its cash flow from operations to make interest payments;
•making it more difficult to satisfy debt service and other obligations;
•increasing the risk of a future credit ratings downgrade of its debt, which could increase future debt costs and limit the future availability of debt financing;
•increasing its vulnerability to general adverse economic and industry conditions;
•reducing the cash flow available to fund capital expenditures and other corporate purposes and to grow its business;
•limiting its flexibility in planning for, or reacting to, changes in its business and the industry;
•placing it at a competitive disadvantage relative to its competitors that may not be as highly leveraged with debt; and
•limiting its ability to borrow additional funds as needed or to take advantage of business opportunities as they arise, pay cash dividends or repurchase securities.
We are continuing to evaluate these risks on an ongoing basis.
Competition affects Premier’s earnings.
Premier’s continued profitability depends on its ability to continue to effectively compete to originate loans and attract and retain deposits. Competition for both loans and deposits is intense in the financial services industry. The Company competes in its market area by offering superior service and competitive rates and products. The types of institutions Premier competes with include large regional commercial banks, smaller community banks, savings institutions, mortgage banking firms, credit unions, finance companies, brokerage firms, insurance agencies and mutual funds. As a result of their size and ability to achieve economies of scale, certain of Premier’s competitors can offer a broader range of products and services than the Company can offer. In addition, an inability to timely adapt to technological advances could pose a risk to the future success of our business operations. Digital or cryptocurrencies, blockchain, and other “fintech” technologies are designed to enhance transactional security and have the potential to disrupt the financial industry, change the way banks do business, and reduce the need for banks as financial deposit-keepers and intermediaries. Consumers may move money out of bank deposits in favor of other investments, including digital or cryptocurrency. Consumers can also shop for higher deposit interest rates at banks across the country, which may offer higher rates because they have few or no physical branches. To stay competitive in its market area, Premier may need to adjust the interest rates on its products to match rates of its competition, which could have a negative impact on net interest margin and results of operations.
Negative public opinion could damage our reputation and impact business operations and revenues.
As a financial institution, our earnings and capital are subject to risks associated with negative public opinion. Negative public opinion could result from our actual or alleged conduct in any number of activities, including lending practices, the failure of any product or service sold by us to meet our clients’ expectations or applicable regulatory requirements, corporate governance and acquisitions, social media and other marketing activities, the implementation of environmental, social, and governance practices, or from actions taken by government regulators and community organizations in response to any of the foregoing. Negative public opinion could affect our ability to attract or retain clients, could expose us to litigation and regulatory action, and could have a material adverse effect on our stock price or result in heightened volatility. Negative public opinion could also affect our ability to borrow funds in the unsecured wholesale debt markets.
The increasing complexity of Premier’s operations presents varied risks that could affect its earnings and financial condition.
Premier processes a large volume of transactions on a daily basis and is exposed to numerous types of risks related to internal processes, people and systems. These risks include, but are not limited to, the risk of fraud by persons inside or outside the Company, the execution of unauthorized transactions by employees, errors relating to transaction processing and systems, breaches of data security and our internal control system and compliance with a complex array of consumer and safety and soundness regulations. Premier could also experience additional loss as a result of potential legal actions that could arise as a result of operational deficiencies or as a result of noncompliance with applicable laws and regulations.
Premier has established and maintains a system of internal controls that provides management with information on a timely basis and allows for the monitoring of compliance with operational standards. These systems have been designed to manage operational risks at an appropriate, cost effective level. Procedures exist that are designed to ensure that policies relating to conduct, ethics, and business practices are followed. Losses from operational risks may still occur, however, including losses from the effects of operational errors.
Unauthorized disclosure of sensitive or confidential client or customer information or confidential trade secrets, whether through a breach of the Company’s computer systems or otherwise, could severely harm its business.
Potential misuse of funds or information by Premier’s employees or by third parties could result in damage to Premier’s customers for which Premier could be held liable, subject Premier to regulatory sanctions and otherwise adversely affect Premier’s financial condition and results of operations.
Premier’s employees handle a significant amount of funds, as well as financial and personal information. Premier also depends upon third-party vendors who have access to funds and personal information about customers. Cybersecurity breaches of other companies, such as the breach of the systems of a credit bureau, may result in criminals using personal information obtained from such other source to impersonate a customer of Premier and obtain funds from customer accounts. Further, Premier may be affected by data breaches at retailers and other third parties who participate in data interchanges with Premier’s customers that involve the theft of customer credit and debit card data, which may include the theft of debit card personal identification numbers and commercial card information used to make purchases at such retailers and other third parties. Such data breaches could result in Premier incurring significant expenses to reissue debit cards and cover losses, which could result in a material adverse effect on Premier’s results of operations.
Although Premier has implemented systems to minimize the risk of fraudulent taking or misuse of funds or information, there can be no assurance that such systems will be adequate or that a taking or misuse of funds or information by employees, by third parties who have authorized access to funds or information, or by third parties who are able to access funds or information without authorization will never occur. Premier could be held liable for such an event and could also be subject to regulatory sanctions. Premier could also incur the expense of developing additional controls and investing in additional equipment or contracts to prevent future such occurrences. Although Premier has insurance to cover such potential losses, Premier cannot provide assurance that such insurance will be adequate to meet any liability, and insurance premiums may rise substantially if Premier suffers such an event. In addition, any loss of trust or confidence placed in Premier by our customers could result in a loss of business, which could adversely affect our financial condition and results of operations, or result in a loss of investor confidence, adversely affecting Premier’s stock price and ability to acquire capital in the future. Premier could also lose revenue by the wrongful appropriation of confidential information about its business operations by competitors who use the information to compete with Premier.
Premier could suffer a material adverse impact from interruptions in the effective operation of, or security breaches affecting, Premier’s computer systems.
Premier relies heavily on its own information systems and those of vendors to conduct business and to process, record, and monitor transactions. Risks to the system could result from a variety of factors, including the potential for bad acts on the part of hackers, criminals, employees and others. As one example, some banks have experienced denial of service attacks in which individuals or organizations flood the bank’s website with extraordinarily high volumes of traffic, with the goal and effect of disrupting the ability of the bank to process transactions. Other businesses have been victims of a ransomware attack in which a business becomes unable to access its own information and is presented with a demand to pay a ransom in order to once again have access to its information. Premier is also at risk for the impact of natural disasters, terrorism and international hostilities on its systems or for the effects of outages or other
failures involving power or communications systems operated by others. These risks also arise from the same types of threats to businesses with which Premier deals.
Potential adverse consequences of attacks on Premier’s computer systems or other threats include damage to Premier’s reputation, loss of customer business, costs of incentives to customers or business partners in order to maintain their relationships, loss of investor confidence and a reduction in Premier’s stock price, litigation, increased regulatory scrutiny and potential enforcement actions, repairs of system damage, increased investments in cybersecurity (such as obtaining additional technology, making organizational changes, deploying additional personnel, training personnel and engaging consultants), and increased insurance premiums, all of which could result in financial loss and material adverse effects on Premier’s results of operations and financial condition.
If Premier forecloses on collateral property resulting in Premier’s ownership of the underlying real estate, Premier may be subject to the increased costs associated with the ownership of real property, resulting in reduced income.
A significant portion of Premier’s loan portfolio is secured by real property. During the ordinary course of business, Premier may foreclose on and take title to properties securing certain loans. In doing so, there is a risk that hazardous or toxic substances could be found on these properties. If hazardous or toxic substances are found, Premier may be liable for remediation costs, as well as for personal injury and property damage.
In addition, when Premier forecloses on real property, the amount Premier realizes after a default is dependent upon factors outside of Premier’s control, including, but not limited to, economic conditions, neighborhood real estate values, interest rates, real estate taxes, operating expenses of the mortgaged properties, zoning laws, governmental rules, regulations and fiscal policies, and acts of God. Certain expenditures associated with the ownership of real estate, principally real estate taxes and maintenance costs, may adversely affect the income from the real estate. Therefore, the cost of operating real property may exceed the rental income earned from such property, and Premier may have to sell the property at a loss. The foregoing expenditures could adversely affect Premier’s financial condition and results of operations.
The Bank’s ability to pay dividends is subject to regulatory limitations which, to the extent Premier requires such dividends in the future, may affect its ability to pay dividends or repurchase its stock.
Premier is a separate legal entity from the Bank and does not have significant operations of its own. Dividends from the Bank provide a significant source of capital for Premier. The availability of dividends from the Bank is limited by various statutes and regulations. The federal and state banking regulators require that insured financial institutions and their holding companies should generally only pay dividends out of current operating earnings. It is possible, depending upon the financial condition of the Bank and other factors, that the Bank’s primary regulator could assert that the payment of dividends or other payments by the Bank are an unsafe or unsound practice. In the event the Bank is unable to pay dividends to Premier, Premier may not be able to pay its obligations as they become due, repurchase its stock, or pay dividends on its common stock. Consequently, the potential inability to receive dividends from the Bank could adversely affect Premier’s business, financial condition, results of operations or prospects.
Failure to integrate or adopt new technology may undermine Premier’s ability to meet customer demands, leading to adverse effects on Premier’s financial condition and results of operations.
The financial services industry is continually undergoing rapid technological change with frequent introductions of new technology-driven products and services. The effective use of technology increases efficiency and enables financial institutions to better serve customers and to reduce costs. Premier’s future success depends, in part, upon its ability to address the needs of its customers by using technology to provide products and services that will satisfy customer demands, as well as to create additional efficiencies in operations. Digital or cryptocurrencies, blockchain, and other “fintech” technologies are being developed to change the way banks operate and are eliminating the need for banks as financial deposit-keepers and intermediaries. Premier may not be able to effectively implement or have the resources to implement new technology-driven products and services or be successful in marketing these products and services to its customers. Failure to successfully keep pace with technological change affecting the financial services industry could adversely affect Premier’s business, financial condition, or results of operations.
The Merger may create disruption and uncertainty for employees.
The announcement and pendency of the Merger may create uncertainty and disruption for Premier’s employees. This uncertainty may impair Premier’s ability to attract, retain, and motivate key personnel. Employees may experience concerns about their future roles within the combined company, which could lead to increased turnover, reduced productivity, and decreased morale. Additionally, the integration process may involve workforce reductions or changes in employee roles, which could further impact employee morale and retention. Any failure to effectively manage these employee-related issues could adversely affect Premier’s business operations and financial performance.
There may be challenges in integrating operations of the combined company.
Following the completion of the Merger, the combined company will face significant challenges in integrating the operations, systems, and cultures of the merging entities. The integration process may be more difficult, time-consuming, or costly than anticipated, and may divert management's attention from other important business matters. Potential difficulties in integrating the companies include, but are not limited to: incompatibility of business cultures and management philosophies, differences in operational processes and systems, challenges in consolidating financial reporting and internal control systems, and potential conflicts in business strategies and priorities. The failure to successfully integrate Premier and Wesbanco could result in the combined company not achieving the
anticipated benefits of the Merger, such as cost synergies, revenue growth, and enhanced competitive positioning. This could adversely affect the combined company's business, financial condition, and results of operations.
The Merger may result in the loss of key customers and business relationships.
The Merger may result in the loss of key customers, suppliers, or business partners who may have concerns about the combined company's future direction or their relationship with the new entity. Any significant loss of customers or business relationships could negatively impact the combined company's revenue and market position. Additionally, the combined company may face challenges in maintaining and expanding its customer base and business relationships in the face of increased competition and market dynamics.
General Risk Factors
Economic, political and financial market conditions may adversely affect Premier’s operations and financial condition.
Premier’s financial performance generally, and in particular the ability of borrowers to pay interest on and repay principal of outstanding loans and the value of collateral securing those loans, as well as demand for loans and other products and services Premier offers, is highly dependent upon the business environment in the markets where the Company operates, mainly in the State of Ohio, Northeast Indiana and Southeast Michigan. A favorable business environment is generally characterized by, among other factors, economic growth, efficient capital markets, low inflation, low unemployment, high business and investor confidence, and strong business earnings. Unfavorable or uncertain economic and market conditions can be caused by declines in economic growth, business activity or investor or business confidence; limitations on the availability of or increases in the cost of credit and capital; increases in inflation or interest rates; high unemployment, natural disasters; or a combination of these or other factors. Conditions such as inflation, recession, unemployment, changes in interest rates, fiscal and monetary policy, tariffs, a U.S. withdrawal from a significant renegotiation of trade agreements, trade wars, and other factors beyond Premier’s control may adversely affect its deposit levels and composition, the quality of its assets including investment securities available for purchase, demand for loans, the ability of its borrowers to repay their loans and the value of the collateral securing the loans it makes. Because Premier has a significant amount of real estate loans, decreases in real estate values could adversely affect the value of property used as collateral and Premier’s ability to sell the collateral upon foreclosure.
Premier is at risk of increased losses from fraud.
Criminals are committing fraud at an increasing rate and are using more sophisticated techniques. In some cases, these individuals are part of larger criminal rings, which allow them to be more effective. Such fraudulent activity has taken many forms, ranging from debit card fraud, check fraud, mechanical devices attached to ATM machines, social engineering and phishing attacks to obtain personal information, or impersonation of clients through the use of falsified or stolen credentials. Additionally, an individual or business entity may properly identify itself, yet seek to establish a business relationship for the purpose of perpetrating fraud. An emerging type of fraud even involves the creation of synthetic identification in which fraudsters "create" individuals for the purpose of perpetrating fraud. Further, in addition to fraud committed directly against it, Premier may suffer losses as a result of fraudulent activity committed against third parties. Increased deployment of technologies, such as chip card technology, defray and reduce certain aspects of fraud; however, criminals are turning to other sources to steal personally identifiable information, such as unaffiliated healthcare providers and government entities, in order to impersonate the consumer and thereby commit fraud.
Premier may be the subject of litigation, which would result in legal liability and damage to its business and reputation.
From time to time, Premier and its subsidiaries may be subject to claims or legal action from customers, employees or others, including as a result of entering into the Merger Agreement. Financial institutions like Premier are facing a growing number of significant class actions, including those based on the manner of calculation of interest on loans and the assessment of overdraft fees. Future litigation could include claims for substantial compensatory and/or punitive damages or claims for indeterminate amounts of damages. Premier is also involved from time to time in other reviews, investigations and proceedings (both formal and informal) by governmental and other agencies regarding its businesses. These matters also could result in adverse judgments, settlements, fines, penalties, injunctions or other relief. Like other financial institutions, Premier is also subject to risk from potential employee misconduct, including non-compliance with policies and improper use or disclosure of confidential information. Substantial legal liability or significant regulatory action against Premier could materially adversely affect its business, financial condition or results of operations and/or cause significant reputational harm to its business.
Climate change or other adverse external events could significantly impact the Company’s business.
Banking regulators and other supervisory authorities, investors and other stakeholders have increasingly viewed financial institutions as important in helping to address the risks related to climate change both directly and with respect to their customers, which may result in financial institutions coming under increased pressure regarding the disclosure and management of their climate risks and related lending and investment activities. Given that climate change could impose systemic risks upon the financial sector, either via disruptions in economic activity resulting from the physical impacts of climate change or changes in policies as the economy transitions to a less carbon‐intensive environment, we face regulatory risk of increasing focus on our resilience to climate‐related risks, including in the context of stress testing for various climate stress scenarios. Ongoing legislative or regulatory changes regarding climate risk management and practices may result in higher regulatory, compliance, credit and reputational risks and costs.
None.
Item 1C. Cybersecurity
Risk Management and Strategy
Premier’s risk management program is designed to identify, measure, prioritize, and manage risk, including information security and cybersecurity risk, in relation to the Company’s desired risk appetite established by its Board of Directors. Premier uses a risk-based approach to manage and mitigate threats to information technology resources. Periodic risks assessments are conducted to identify, assess, and reduce information security and cybersecurity risks to acceptable levels.
Premier maintains an active Information Security Policy (the “IS Policy”) and associated programs, procedures and standards (collectively with the IS Policy, the “ISPP”) in alignment with Federal Financial Institutions Examination Council and National Institute of Standards and Technology guidance to help in the mitigation of risks that may impact the Confidentiality, Integrity and Availability (aka “CIA Triad”) of systems and information. The components of the IS Program are reviewed and approved annually by senior management and the IS Policy is reviewed and approved annually by either the Risk Committee of the Board of Directors or the full Board of Directors. These annual reviews and approvals ensure the ISPP meets expectations to safeguard Premier and customer confidential information. The ISPP is subject to annual review by our auditors (both internal and external), the FDIC, and the ODFI to ensure it is in alignment with Premier’s internal risk management practices, government regulatory expectations and industry best practices. We use auditors and other third party resources, in addition to internal tools and resources, for security monitoring and testing.
Premier maintains an Information Technology Incident Response Policy and an Information Security Incident Response Playbook that together coordinate the identification, reporting and escalation, containment, and remediation responses of any potential information security incident. Each cybersecurity incident is reviewed by the Chief Information Security Officer (“CISO”) to determine if the matter needs escalated to the Company’s Information Response Team, Information Security Oversight Committee (“ISOC”), Enterprise Risk Management Committee (“ERMC”), or the Board of Directors or Board-level Risk Committee.
Premier addresses third-party risks as part of Premier’s Vendor Risk Management (“VRM”) Policy and Program. The purpose of the VRM is to provide a consistent framework to direct Premier in the assessment, measurement, monitoring and control of risks related to vendors and third parties with whom Premier does business. Premier assesses and monitors the cybersecurity controls of third party service providers and partners. As part of the initial and regular monitoring of the vendor, the Company reviews a vendors internal controls based on the COSO framework in alignment with their formal SOC II assessments. The focus of the review is on a vendor’s internal management and security practices including but not limited to, physical/systems security, business resiliency, application programming practices, systems security monitoring, and systems change control/authorization.
The VRM currently is managed under the direction of the CISO, with a goal of ensuring that vendors meet obligations associated with the confidentiality, integrity, and availability of Company and customer information. Beginning with the establishment of vendor relationships, vendors are risk rated based on their criticality to the operations of Premier and the sensitivity of the information such vendor has or utilizes to provide services to the Company. These assessments include, but are not limited to, a review of financial, operational and security aspects of the vendor. After the establishment of the vendor relationship, vendors are reevaluated on a regular basis based on their criticality and risk rating, with such reevaluations being conducted either annually, every two years or every three years.
Notwithstanding the focus Premier places on cybersecurity, Premier may not be successful in preventing or mitigating a cybersecurity incident that could have a material adverse effect on the Company. As of the date of this Form 10-K, the Company is not aware of any risks from cybersecurity threats that have materially affected or are reasonably likely to materially affect the Company, including its business strategy, results of operations, or financial condition that are required to be reported in this Form 10-K. For further discussion, please see Item 1A. “Risk Factors” for a discussion of cybersecurity risks.
Governance
The Premier Board of Directors has assigned to the Board Risk Committee (“BRC”), along with the ERMC, oversight of risk management, including risks associated with information security and cybersecurity. The BRC is comprised of independent directors of Premier with participation from Premier’s executive leadership and additional members of management. The ERMC is chaired by the Chief Risk Officer and, in addition to general oversight of risk management, is responsible for documenting all risks for the organization and reporting to the BRC issues of a critical nature. The ERMC meets monthly and is a cross-functional group comprised of all members of executive leadership and additional members of management from different areas of the Company. The ISOC is responsible for managing and mitigating information security and cybersecurity risks where appropriate and escalates issues to the ERMC. The ISOC is chaired by the CISO and includes select members of executive leadership and representatives from the Risk Management Department
and Information Technology Department. The ISOC meets at least monthly. Routine reporting of the status of cybersecurity risks and mitigation activities progress from the ISOC to ERMC and finally to BRC.
The information security and third-party risk management programs of the Company are managed by the CISO who is a member of the Company’s Risk Management Department, reporting directly to the Company’s Chief Risk Officer who reports directly to the Chief Executive Officer. The CISO’s responsibilities include: maintaining the information security risk assessment and related reports to management; monitoring reasonably foreseeable threats, internal and external, that could result in unauthorized disclosure, misuse, alteration or destruction of customer information or data systems; overseeing the development, implementation, enforcement and maintenance of the ISPP; implementing appropriate changes to the program in response to industry or regulatory mandates; monitoring the entire ISPP, reviewing it at least annually, and adjusting as necessary for changing regulation, technology, personnel, procedures and business arrangements; reporting the status of the ISPP periodically; ensuring information security awareness training is provided to all employees on a regular basis; ensuring the ISPP assessments are updated to include control changes for existing/new products, processes, and systems reflecting the associated changes to risk and mitigation methodology; providing guidance to management on emerging risks, cyber threats and regulatory changes; and maintaining information security program strategic goals in alignment with IT and PFC business strategy.
Item 2. Properties
At December 31, 2024, the Bank conducted its business from its main office at 275 West Federal St., Youngstown, Ohio, and 72 other full-service banking centers and 9 loan offices in Ohio, Indiana, Michigan, and Pennsylvania. Premier maintained its headquarters at 601 Clinton St., Defiance, Ohio. A portion of our back-office operation departments, including information technology, loan processing and underwriting, deposit processing, accounting and risk management are located in an operations center located at 25600 Elliott Rd., Defiance, Ohio. See Note 8 to the Consolidated Financial Statements for additional information. The Company owns its main office and headquarters, as well as the Defiance operations center. Premier considers its properties adequate for the operation of the business.
Item 3. Legal Proceedings
Premier and its subsidiaries are involved in various legal proceedings that arise in the ordinary course of its business. While the ultimate liability with respect to litigation matters and claims cannot be determined at this time, management believes any resulting liability and other amounts relating to pending matters are not likely to be material to the Company’s consolidated financial position or results of operations.
Item 4. Mine Safety Disclosures
Not applicable.
PART II
Item 5. Market for the Registrant’s Common Equity, Related Stockholder Matters and Issuer Purchases of Equity Securities
The Company’s common shares trade on The Nasdaq Global Select Market under the symbol “PFC.” As of February 28, 2025, the Company had approximately 6,289 shareholders of record.
The line graph below compares the yearly percentage change in cumulative total shareholder return on Premier common shares and the cumulative total return of the Nasdaq Composite Index, the SNL Nasdaq Bank Index and the SNL Midwest Bank Index. An investment of $100 on December 31, 2019, and the reinvestment of all dividends are assumed. The performance graph represents past performance and should not be considered to be an indication of future performance.
The payment of future cash dividends is at the discretion of our Board of Directors and subject to a number of factors, including results of operations, general business conditions, growth, financial condition, regulatory limitation and other factors deemed relevant by the Board. Further, our ability to pay future cash dividends is subject to certain regulatory requirements and restrictions discussed in the Regulation section in Item 1 above. For further information, see Note 16 to the Consolidated Financial Statements which is incorporated herein by reference.
| | | | | | | | | | | | | | | | | | | | | | | | |
| | Period Ending | |
Index | | 12/31/19 | | | 12/31/20 | | | 12/31/21 | | | 12/31/22 | | | 12/31/23 | | | 12/31/24 | |
Premier Financial Corp. | | | 100.00 | | | | 76.39 | | | | 106.24 | | | | 96.66 | | | | 92.11 | | | | 103.36 | |
Nasdaq Composite Index | | | 100.00 | | | | 144.92 | | | | 177.06 | | | | 119.45 | | | | 172.77 | | | | 223.87 | |
KBW Nasdaq Bank Index | | | 100.00 | | | | 89.69 | | | | 124.06 | | | | 97.52 | | | | 96.65 | | | | 132.60 | |
S&P U.S. BMI Banks - Midwest Region Index | | | 100.00 | | | | 85.98 | | | | 113.59 | | | | 98.03 | | | | 100.08 | | | | 122.10 | |
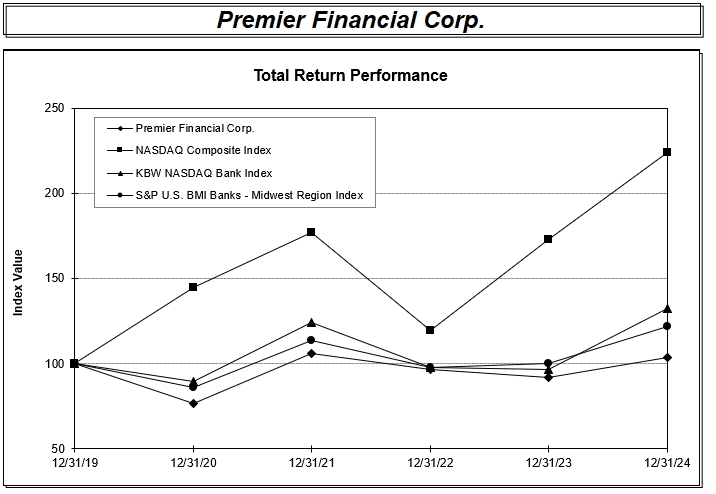
The following table provides information regarding Premier’s purchases of its common shares during the fourth quarter period ended December 31, 2024:
| | | | | | | | | | | | | | | | |
Period | | Total Number of
Shares Purchased (1) | | | Average Price Paid
Per Share | | | Total Number of
Shares Purchased
as Part of Publicly
Announced Plans
or Programs | | | Maximum Number
of Shares that May
Yet Be Purchased
Under the Plans
or Programs (2) | |
October 1 – October 31, 2024 | | | 1,228 | | | $ | 24.71 | | | | — | | | | 1,199,634 | |
November 1 – November 30, 2024 | | | — | | | | — | | | | — | | | | 1,199,634 | |
December 1 – December 31, 2024 | | | 2,512 | | | | 27.94 | | | | — | | | | 1,199,634 | |
Total | | | 3,740 | | | $ | 26.88 | | | | — | | | | 1,199,634 | |
(1)Of this amount, 3,740 shares were withheld by Premier in fulfillment of tax obligations from vesting of restricted stock compensation and were not part of the publicly announced repurchase program.
(2)On January 25, 2022, the Company announced that its Board of Directors approved an increase in the Company’s repurchasing authorization to up to 2,000,000 shares of outstanding common stock. There is no expiration date for the repurchase program.
Item 6. [Reserved]
Item 7. Management’s Discussion and Analysis of Financial Condition and Results of Operations
Forward-Looking Statements and Factors that Could Affect Future Results
This annual report, as well as other publicly available documents, including those incorporated herein by reference, may contain certain forward-looking statements within the meaning of Section 27A of the Securities Act of 1933, as amended, Section 21E of the Securities Exchange Act of 1934, as amended (the “Exchange Act”), and the Private Securities Litigation Reform Act of 1995. These statements may include, but are not limited to, statements regarding projections, forecasts, goals and plans of Premier and its management, and include statements related to the expected timing, completion and benefits of the Merger, future movements of interest rates, loan or deposit production levels, future credit quality ratios, future strength in the market area, and growth projections. These statements do not describe historical or current facts and may be identified by words such as “intend,” “intent,” “believe,” “expect,” “estimate,” “target,” “plan,” “anticipate,” or similar words or phrases, or future or conditional verbs such as “will,” “would,” “should,” “could,” “might,” “may,” “can,” or similar verbs. There can be no assurances that the forward-looking statements included in this Form 10-K will prove to be accurate. In light of the significant uncertainties in the forward-looking statements, the inclusion of such information should not be regarded as a representation by Premier or any other persons, that our objectives and plans will be achieved, including with respect to the Merger.
Forward-looking statements involve numerous risks and uncertainties, any one or more of which could affect Premier’s business and financial results in future periods and could cause actual results to differ materially from plans and projections. Factors that could cause or contribute to such differences include, but are not limited to: the businesses of Premier and Wesbanco may not be integrated successfully or such integration may take longer to accomplish than expected; the expected cost savings and any revenue synergies from the proposed Merger may not be fully realized within the expected time frames; disruption from the Merger may make it more difficult to maintain relationships with customers, associates, or suppliers; financial markets, our customers, and our business and results of operation; changes in interest rates; disruptions in the mortgage market; risks and uncertainties inherent in general and local banking, insurance and mortgage conditions; political uncertainty; uncertainty in U.S. fiscal or monetary policy, including interest rate policies of the Federal Reserve; uncertainty concerning or disruptions relating to tensions surrounding the current socioeconomic landscape; competitive factors specific to markets in which Premier and its subsidiaries operate; future interest rates and changes or volatility in interest rate levels; legislative or regulatory rulemaking or actions; capital market conditions; security breaches or unauthorized disclosure of confidential customer or Company information; interruptions in the effective operation of information and transaction processing systems of Premier or Premier’s vendors and service providers; failures or delays in integrating or adopting new technology; and other risks and uncertainties detailed from time to time in our Securities and Exchange Commission (“SEC”) filings, including this Annual Report on Form 10-K and our Quarterly Reports on Form 10-Q. Further information regarding additional factors that could affect the forward-looking statements can be found in the cautionary language included under the headings “Cautionary Note Regarding Forward-Looking Statements” (in the case of Premier), “Forward-Looking Statements” (in the case of Wesbanco), and “Risk Factors” in Premier’s and Wesbanco’s Annual Reports on Form 10-K, and other documents subsequently filed by Premier and Wesbanco with the SEC. These risks and uncertainties include other risks and uncertainties detailed from time to time in our SEC filings, including this Annual Report on Form 10-K and our Quarterly Reports on Form 10-Q and any further amendments thereto. All forward-looking statements made in this Form 10-K are based on information presently available to the management of Premier and speak only as of the date on which they are made. We assume no obligation to update any forward-looking statements, whether as a result of new information, future developments or otherwise, except as may be required by law.
This Item 7 presents information to assess the financial condition and results of operations of Premier. This item should be read in conjunction with the Consolidated Financial Statements and the supplemental financial data contained elsewhere in this Form 10-K.
Non-GAAP Financial Measures
In addition to results presented in accordance with accounting principles generally accepted in the United States (“GAAP”), this report includes non-GAAP financial measures. Management uses these non-GAAP financial measures as key measures in operating the business, making strategic decisions, and evaluating performance. The Company believes these non-GAAP financial measures provide investors with greater transparency into the metrics that management uses to monitor and assess in helping to understand the underlying performance and trends of the Company. The Company monitors the non-GAAP financial measures and the Company’s management believes such measures are helpful to investors because they provide an additional tool to use in evaluating the Company’s financial and business trends and operating results. In addition, the Company’s management uses these non-GAAP measures to compare the Company’s performance to that of prior periods for trend analysis and for budgeting and planning purposes.
Non-GAAP financial measures are intended to supplement, rather than replace, GAAP measures. Non-GAAP financial measures have inherent limitations, which are not required to be uniformly applied and are not audited. Readers should be aware of these limitations and should be cautious with respect to the use of such measures. To mitigate these limitations, the Company has practices in place to ensure that these measures are calculated using the appropriate GAAP or regulatory components in their entirety and to ensure that our performance is properly reflected to facilitate consistent period-to-period comparisons. The Company’s method of calculating these non-GAAP measures may differ from methods used by other companies. Although the Company believes the non-GAAP financial
measures disclosed in this report enhance investors' understanding of our business and performance, these non-GAAP measures should not be considered in isolation, or as a substitute for those financial measures prepared in accordance with GAAP.
Fully taxable-equivalent (“FTE”) is an adjustment to net interest income to reflect tax-exempt income on an equivalent before-tax basis. A reconciliation of these non-GAAP financial measures to the most directly comparable GAAP financial measures for the years ended December 31, 2024 and 2023 is provided below, and investors are encouraged to review the related GAAP measures along with the reconciliation. We encourage investors to review these reconciliations carefully.
Non-GAAP Financial Measures – Net Interest Income on an FTE basis, Net Interest Margin and Efficiency Ratio
| | | | | | | | |
| | Years Ended | |
(In Thousands) | | December 31,
2024 | | | December 31,
2023 | |
Net interest income (GAAP) | | $ | 201,269 | | | $ | 217,093 | |
Add: FTE adjustment | | | 314 | | | | 267 | |
Net interest income on a FTE basis (1) | | | 201,583 | | | | 217,360 | |
Noninterest income – less securities gains/(losses) (2) | | | 49,661 | | | | 91,265 | |
Noninterest expense (3) | | | 159,314 | | | | 163,231 | |
Average interest-earning assets (4) | | | 7,992,261 | | | | 7,912,651 | |
Ratios: | | | | | | |
Net interest margin (1) / (4) | | | 2.52 | % | | | 2.75 | % |
Efficiency ratio (3) / (1) + (2) | | | 63.41 | % | | | 52.89 | % |
Non-GAAP Financial Measures – Tangible Book Value
| | | | | | | | |
| | Years Ended | |
(In Thousands, except per share data) | | December 31,
2024 | | | December 31,
2023 | |
Total Shareholders’ Equity (GAAP) | | $ | 1,001,813 | | | $ | 975,627 | |
Less: Goodwill | | | (295,602 | ) | | | (295,602 | ) |
Intangible assets | | | (8,487 | ) | | | (12,186 | ) |
Tangible common equity (1) | | $ | 697,724 | | | $ | 667,839 | |
Common shares outstanding (2) | | | 35,844 | | | | 35,730 | |
Tangible book value per share (1) / (2) | | $ | 19.47 | | | $ | 18.69 | |
Strategic Merger
On July 26, 2024, Premier and Wesbanco announced the signing of the Merger Agreement under which Premier will merge into Wesbanco in a stock-for-stock transaction. Under the terms of the Merger Agreement, shareholders of Premier will receive 0.80 shares of Wesbanco common stock for each share of Premier common stock. Premier Bank, a wholly-owned subsidiary of Premier, will merge into Wesbanco Bank, Inc., a wholly-owned subsidiary of Wesbanco. Upon closing, Premier shareholders will own approximately 30% of the combined company. In December 2024, the approval of shareholders of both Premier and Wesbanco was obtained. On February 13, 2025, Wesbanco announced that it had received all regulatory approvals required for the consummation of the Merger. The Merger remains subject to the satisfaction or waiver of other customary closing conditions.
The Merger Agreement imposes restrictions on the Premier’s business and operations during the pendency of the Merger. While Premier does not believe those restrictions are unduly burdensome, they may delay or prevent Premier from taking actions it could otherwise take. Accordingly, Premier’s results of operations from before the Merger Agreement may not be comparable to results of operations since Premier entered into the Merger Agreement.
Financial Condition
Assets at December 31, 2024 totaled $8.58 billion compared to $8.63 billion at December 31, 2023, a decrease of $44.4 million, or 0.5%. The decrease in assets was primarily due to a decrease in loans offset by an increase in securities. Total liabilities decreased $70.6 million primarily due to a decrease in deposits offset by an increase in FHLB borrowings.
Securities
The available-for-sale securities portfolio, at fair value, increased $209.1 million, or 22.0%, to $1.16 billion at December 31, 2024. The portion of this increase not attributable to changes in market value was primarily funded by a $227.0 million increase in FHLB borrowings. For additional information regarding Premier’s investment securities, see Note 4 to the Consolidated Financial Statements.
Loans
Loans receivable, including undisbursed loan funds and deferred fees and costs, decreased $338.5 million, or 4.8%, to $6.67 billion at December 31, 2024. The decrease was mainly due to a decrease in volume of loans. For more details on the loan balances, see Note 6 – Loans to the Consolidated Financial Statements.
The majority of Premier’s commercial real estate and commercial loans are to small- and mid-sized businesses. The combined commercial and commercial real estate loan portfolios totaled $3.85 billion and $3.89 billion at December 31, 2024 and 2023, respectively, and accounted for approximately 57.8% and 55.6% of Premier’s loan portfolio at the end of those respective periods. Multi-family loans make up $645.6 million, or 16.8% of total commercial loans as of December 31, 2024 and $642.7 million, or 16.5% as of December 31, 2023. In addition, Manufacturing makes up $382.5 million, or 11.0% of total commercial loans as of December 31, 2024 and $427.7 million, or 11.0% as of December 31, 2023. Premier believes it has been able to establish itself as a leader in its market area in commercial and commercial real estate lending by hiring experienced lenders and providing a high level of customer service to its commercial lending clients.
The one-to-four family residential portfolio totaled $1.77 billion at December 31, 2024, compared with $1.81 billion at the end of 2023, as a result of selling more loans in the portfolio as opposed to retaining them. At the end of 2024, such loans comprised 26.5% of the total loan portfolio, an increase from 25.8% at December 31, 2023.
Construction loans, which include one-to-four residential family and commercial real estate properties, decreased to $596.7 million at December 31, 2024, compared to $838.8 million at December 31, 2023, as a result of completions exceeding new loan commitments. These loans accounted for approximately 8.9% and 12.0% of the total loan portfolio at December 31, 2024 and 2023, respectively.
Home equity and home improvement loans increased to $274.3 million at December 31, 2024, from $268.0 million at the end of 2023. At the end of 2024, those loans comprised 4.1% of the total loan portfolio, consistent with 3.8% at December 31, 2023.
Consumer finance loans were $179.7 million at December 31, 2024 down from $193.8 million at the end of 2023. These loans accounted for approximately 2.7% and 2.8% of the total loan portfolio at December 31, 2024 and 2023, respectively.
In order to properly assess the loans secured by real estate included in its loan portfolio, the Bank has established policies regarding the monitoring of the collateral underlying such loans. The Bank requires a recent appraisal or evaluation, depending on loan amount, for all new secured real estate loans, and generally all renewed secured real estate loans. The appraisal process is administered by the Bank’s Credit Department, which has contracted with independent Appraisal Management Companies (“AMCs”) to manage the ordering and review of appraisals. The AMCs order appraisals with licensed and qualified appraisers as the Bank selects engagements via a blind bidding process managed by the AMCs. The Bank generally does not require updated appraisals for performing loans during the term of the loan.
When a secured commercial real estate loan of $500,000 or more is downgraded to classified status, the Bank obtains an updated appraisal. Appraisals are received within approximately 60 days from the date ordered. If necessary, the Bank will use the existing appraisal on file taking into account age of the appraisal, market conditions or any other known facts to potentially apply a discount to the value until the updated appraisal is received. If the loan is considered impaired and collateral dependent the Bank assesses whether there is any collateral short fall, taking into consideration guarantor support and liquidity to determine if a charge-off or specific reserve is necessary. The Bank does not adjust any appraisals upward without written documentation of this valuation change from the appraiser. When setting reserves and charge-offs on classified loans, appraisal values may be discounted downward based upon the Bank’s experience with liquidating similar properties.
All loans 90 days or more past due and/or on non-accrual are classified as non-performing loans. Non-performing status automatically occurs in the month in which the 90-day delinquency occurs. The Bank has established policies to evaluate non-performing loans. This includes requirements for establishing current fair value of collateral and establishing reserves or charge-offs within specified time frames based on borrower segment and/or loan amount.
All properties that are moved into the Other Real Estate Owned (“OREO”) category are supported by current appraisals or evaluations, and the OREO is carried at the lower of cost or fair value, which is determined based on appraised value less the Bank’s estimate of the liquidation costs.
Any partially charged-off collateral dependent loans are considered non-performing, and as such, would need to show an extended period of time with satisfactory payment performance as well as documented cash flow coverage capacity before the Bank will consider an upgrade to performing status. The Bank may consider moving the loan to accruing status after approximately six months of satisfactory payment performance.
Allowance for Credit Losses (“ACL”)
The ACL represents management’s assessment of the estimated credit losses the Company will incur over the life of the loan. ACL requires a projection of credit losses over the contract lifetime of the credit adjusted for prepayment tendencies. Management analyzes the adequacy of the ACL regularly through reviews of the loan portfolio. Consideration is given to economic conditions, changes in interest rates and the effect of such changes on collateral values and borrowers’ ability to pay, changes in the composition of the loan portfolio and trends in past due and non-performing loan balances. The ACL is a material estimate that is susceptible to significant fluctuation and is established through a provision for credit losses based on management’s evaluation of the inherent risk in the loan
portfolio. In addition to extensive in-house loan monitoring procedures, the Company utilizes an outside party to conduct an independent loan review of commercial loan and commercial real estate loan relationships. The Company’s goal is to have 45-50% of the portfolio reviewed annually using a risk based approach. Management utilizes the results of this outside loan review to assess the effectiveness of its internal loan grading system as well as to assist in the assessment of the overall adequacy of the ACL associated with these types of loans.
The ACL is made up of two basic components. The first component is the specific reserve in which the Company sets aside reserves based on the analysis of individually analyzed credits. In establishing specific reserves, the Company analyzes all substandard, doubtful and loss graded loans quarterly and makes judgments about the risk of loss based on the cash flow of the borrower, the value of any collateral and the financial strength of any guarantors. If the loan is individually analyzed and cash flow dependent, then a specific reserve is established for the discount on the net present value of expected future cash flows. If the loan is individually analyzed and collateral dependent, then any shortfall is usually charged off. The Company also considers the impacts of any Small Business Administration (“SBA”) or Farm Service Agency (“FSA”) guarantees. The specific reserve portion of the ACL was $15.6 million at December 31, 2024, and $4.3 million at December 31, 2023.
The second component is a general reserve, which is used to record credit loss reserves for loans in which the Company estimates the potential losses over the contractual lifetime of the loan adjusted for prepayment tendencies. In addition, the future economic environment is incorporated in projections with loss expectations to revert to the long-run historical mean after such time as management can no longer make or obtain a reasonable and supportable forecast. For purposes of the general reserve analysis, the six loan portfolio segments are further segregated into fifteen different loan pools to allocate the ACL. Residential real estate is further segregated into owner occupied and nonowner occupied. Commercial real estate is split into owner occupied, nonowner occupied, multifamily, agriculture land and other commercial real estate. Commercial credits are comprised of commercial working capital, agriculture production, and other commercial credits. Construction is split out into construction residential and construction other. Consumer is further segregated into consumer direct, consumer indirect and home equity. The Company utilizes three different methodologies to analyze loan pools.
Discounted cash flows (“DCF”) was selected as the appropriate method for loan segments with longer average lives and regular payment structures. This method is applied to a majority of the Company’s real estate loans and consumer indirect. DCF generates cash flow projections at the instrument level where payment expectations are adjusted for prepayment and curtailment to produce an expected cash flow stream. This expected cash flow stream is compared to the contractual cash flows to establish a valuation account for these loans.
The probability of default/loss given default (“PD/LGD”) methodology was selected as most appropriate for loan segments with average lives of three years or less and/or irregular payment structures. This methodology was used for home equity and commercial portfolios. A loan is considered to default if one of the following is detected:
•Becomes 90 days or more past due;
•Is placed on nonaccrual;
•Is marked as a loan modification with financial difficulties; or
•Is partially or wholly charged-off.
The default rate is measured on the current life of the loan segment using a weighted average of the maximum possible quarters. The PD is then combined with a LGD derived from historical charge-off data to construct a default rate. This loss rate is then supplemented with adjustments for reasonable and supportable forecasts of relevant economic indicators, particularly the unemployment rate forecast from the Federal Open Market Committee's Summary of Economic Projections. LGD is determined on a dollar-ratio basis, measuring the ratio of net charged off principal to defaulted principal.
The consumer portfolio contains loans with many different payment structures, payment streams and collateral. The remaining life method was deemed most appropriate for the consumer direct loans, while the DCF method was deemed appropriate for the consumer indirect loans as stated above. The weighted average remaining life uses an annual charge-off rate over several vintages to estimate credit losses. The average annual charge-off rate is applied to the contractual term adjusted for prepayments.
Additionally, CECL requires a reasonable and supportable forecast when establishing the ACL. The Company estimates losses over an approximate one-year forecast period using Moody’s baseline economic forecasts, and then reverts to longer term historical loss experience over a three-year period.
The quantitative general allowance increased to $28.8 million at December 31, 2024, from $28.2 million at December 31, 2023, primarily due to higher quantitative factors, such as loss rates, prepayment speeds and risk migration.
In addition to the quantitative analysis, a qualitative analysis is performed each quarter to provide additional general reserves on the loan portfolios not individually analyzed for various factors. The overall qualitative factors are based on nine sub-factors. The nine sub-factors have been aggregated into three qualitative factors: economic, environment and risk.
ECONOMIC
1)Changes in international, national and local economic business conditions and developments, including the condition of various market segments.
2)Changes in the value of underlying collateral for collateral dependent loans.
ENVIRONMENT
3)Changes in the nature and volume in the loan portfolio.
4)The existence and effect of any concentrations of credit and changes in the level of such concentrations.
5)Changes in lending policies and procedures, including underwriting standards and collection, charge-off and recovery practices.
6)Changes in the quality and breadth of the loan review process.
7)Changes in the experience, ability and depth of lending management and staff.
RISK
8)Changes in the trends of the volume and severity of delinquent and classified loans, and changes in the volume of non-accrual loans and other loan modifications.
9)Changes in the political and regulatory environment.
The qualitative analysis indicated an additional general reserve of $31.3 million at December 31, 2024, compared to $44.1 million at December 31, 2023. The decrease was mainly due to a decline in loan balances and changes in the economic environment as a result of inflation, GDP growth and global conditions. Management reviewed the overall economic, environmental and risk factors and determined that it was appropriate to make adjustments to these sub-factors based on that review. The Company’s general reserve percentages for main loan segments, not otherwise classified, ranged from 0.3904% for construction loans to 1.1047% for commercial real estate ("CRE") owner occupied loans at December 31, 2024.
Under CECL, when loans are purchased with evidence of more than insignificant deterioration of credit, they are accounted for as purchase credit deteriorated (“PCD”). PCD loans acquired in a transaction are marked to fair value and a mark on yield is recorded. In addition, an adjustment is made to the ACL for the expected loss through retained earnings on the acquisition date. These loans are assessed on a regular basis and subsequent adjustments to the ACL are recorded on the income statement.
As a result of the quantitative and qualitative analyses, along with the changes in balances and specific reserves and the increase in net charge-offs during the year, the Company’s provision for credit losses on loans for the year ended December 31, 2024 was an expense of $3.9 million. This is compared to an expense of $7.7 million for the year ended December 31, 2023. The ACL was $75.7 million at December 31, 2024, and $76.5 million at December 31, 2023. The ACL represented 1.17% of loans, net of undisbursed loan funds and deferred fees and costs at December 31, 2024, and 1.14% at December 31, 2023. In management’s opinion, the overall ACL of $75.7 million as of December 31, 2024, was adequate to cover anticipated losses over the lifetime of the loans.
Management also assesses the value of OREO as of the end of each accounting period and recognizes write-downs to the value of that real estate in the income statement if conditions dictate. During the year ended December 31, 2024, there were $95,000 in write-downs of real estate held for sale. Management believes that the values recorded at December 31, 2024, for OREO and repossessed assets represent the realizable value of such assets.
Total classified loans increased to $129.3 million at December 31, 2024, compared to $ 69.7 million at December 31, 2023, an increase of $59.6 million, primarily due to several downgraded relationships.
The Company’s ratio of ACL to non-performing loans was 93.5% at December 31, 2024, compared to 215.6% at December 31, 2023. Management monitors collateral values of all loans included on the watch list that are collateral dependent and believes that allowances for such loans at December 31, 2024, were appropriate. Of the $81.0 million in non-accrual loans at December 31, 2024, $54.7 million, or 67.5%, were less than 90 days past due.
At December 31, 2024, the Company had total non-performing assets of $81.7 million, compared to $35.7 million at December 31, 2023. Non-performing assets include loans that are on non-accrual, OREO and other assets held for sale. The OREO balance was $737,000 and $243,000 as of December 31, 2024 and 2023, respectively.
The net charge-offs and non-accrual loan balances as a percentage of total are presented in the table below at December 31, 2024 and 2023.
| | | | | | | | | | | | | | | | |
| | For the Year Ended | | | As of December 31, | |
| | December 31, 2024 | | | 2024 | |
| | Net | | | % of Total Net | | | | | | | |
| | Charge-offs | | | Charge-offs | | | Non-accrual | | | % of Total Non- | |
| | (Recoveries) | | | (Recoveries) | | | Loans | | | Accrual Loans | |
| | (Dollars In Thousands) | |
Residential real estate | | $ | 31 | | | | 0.66 | % | | $ | 16,675 | | | | 20.59 | % |
Commercial real estate | | | 1,478 | | | | 31.35 | % | | | 18,917 | | | | 23.36 | % |
Construction | | | — | | | | 0.00 | % | | | 1,171 | | | | 1.45 | % |
Commercial | | | 1,529 | | | | 32.44 | % | | | 36,893 | | | | 45.55 | % |
Home equity and improvement | | | 76 | | | | 1.61 | % | | | 1,626 | | | | 2.01 | % |
Consumer finance | | | 1,432 | | | | 30.38 | % | | | 4,436 | | | | 5.48 | % |
PCD | | | 168 | | | | 3.56 | % | | | 1,277 | | | | 1.58 | % |
Total | | $ | 4,714 | | | | 100.00 | % | | $ | 80,995 | | | | 100.00 | % |
| | | | | | | | | | | | | | | | |
| | For the Year Ended | | | As of December 31, | |
| | December 31, 2023 | | | 2023 | |
| | Net | | | % of Total Net | | | | | | | |
| | Charge-offs | | | Charge-offs | | | Non-accrual | | | % of Total Non- | |
| | (Recoveries) | | | (Recoveries) | | | Loans | | | Accrual Loans | |
| | (Dollars In Thousands) | |
Residential | | $ | 235 | | | | 5.81 | % | | $ | 13,028 | | | | 36.71 | % |
Commercial real estate | | | 1,442 | | | | 35.64 | % | | | 5,971 | | | | 16.82 | % |
Construction | | | — | | | | 0.00 | % | | | — | | | | 0.00 | % |
Commercial | | | 925 | | | | 22.86 | % | | | 8,649 | | | | 24.37 | % |
Home equity and improvement | | | 46 | | | | 1.14 | % | | | 1,417 | | | | 3.99 | % |
Consumer finance | | | 1,262 | | | | 31.19 | % | | | 3,433 | | | | 9.67 | % |
PCD | | | 136 | | | | 3.36 | % | | | 2,993 | | | | 8.43 | % |
Total | | $ | 4,046 | | | | 100.00 | % | | $ | 35,491 | | | | 100.00 | % |
The following table sets forth information concerning the allocation of Premier’s allowance for credit losses by loan categories at December 31, 2024 and 2023.
| | | | | | | | | | | | | | | | |
| | December 31, 2024 | | | December 31, 2023 | |
| | | | | Percent of | | | | | | Percent of | |
| | | | | total | | | | | | total | |
| | Amount | | | by category | | | Amount | | | by category | |
| | (Dollars in Thousands) | |
Residential real estate | | $ | 16,049 | | | | 21.2 | % | | $ | 17,215 | | | | 25.8 | % |
Commercial real estate | | | 31,354 | | | | 41.4 | % | | | 36,053 | | | | 40.5 | % |
Construction | | | 2,754 | | | | 3.6 | % | | | 3,159 | | | | 12.0 | % |
Commercial loans | | | 20,851 | | | | 27.5 | % | | | 15,489 | | | | 15.1 | % |
Home equity and improvement loans | | | 2,235 | | | | 3.0 | % | | | 2,703 | | | | 3.8 | % |
Consumer loans | | | 2,445 | | | | 3.2 | % | | | 1,893 | | | | 2.8 | % |
| | $ | 75,688 | | | | 100.0 | % | | $ | 76,512 | | | | 100.0 | % |
Loans Acquired with Impairment
Under ASU Topic 326, when loans are purchased with evidence of more than insignificant deterioration of credit, they are accounted for as PCD. PCD loans acquired in a transaction are marked to fair value and a mark on yield is recorded. In addition, an adjustment is made to the ACL for the expected loss on the acquisition date. These loans are assessed on a regular basis and subsequent adjustments to the ACL are recorded on the income statement.
High Loan-to-Value Mortgage Loans
The majority of Premier’s mortgage loans are collateralized by one-to-four-family residential real estate, have loan-to-value ratios of 80% or less, and are made to borrowers in good credit standing. The Bank usually requires residential mortgage loan borrowers whose
loan-to-value is greater than 80% to purchase private mortgage insurance (“PMI”). Management also periodically reviews and monitors the financial viability of its PMI providers.
The Bank originates and retains a limited number of residential mortgage loans with loan-to-value ratios that exceed 80% where PMI is not required if the borrower possesses other demonstrable strengths. The loan-to-value ratios on these loans are generally limited to 85% and exceptions must be approved by the Director of Mortgage Operations or the Bank's Chief Credit Officer. The Bank maintains Portfolio Medical Professional and Portfolio CRA programs which allow up to 100% LTV with no PMI based on specific requirements.
Premier does not make interest-only, first-mortgage residential loans, nor does it have residential mortgage loan products or other consumer products that allow negative amortization.
Goodwill and Intangible Assets
Goodwill was $295.6 million at December 31, 2024 and December 31, 2023. Core deposit intangibles and other intangible assets decreased to $8.5 million at December 31, 2024, compared to $12.2 million at December 31, 2023, due to the recognition of $3.7 million of amortization . No impairment of goodwill was recorded in 2024 or 2023.
Deposits
Total deposits at December 31, 2024, were $6.85 billion compared to $7.14 billion at December 31, 2023, a decrease of $293.2 million, or 4.1%. Noninterest-bearing demand deposits decreased by $116.5 million, interest-bearing demand deposits and money market accounts increased by $212.2 million, savings decreased by $64.8 million, retail certificates of deposit decreased by $36.8 million and brokered deposits decreased $287.3 million. Management can utilize the national market for certificates of deposit to supplement its funding needs if necessary. For more details on the deposit balances in general see Note 10 – Deposits to the Consolidated Financial Statements.
Borrowings
Premier had $507.0 million in FHLB advances or securities sold with agreements to repurchase at December 31, 2024 compared to $280.0 million at December 31, 2023. The increase was primarily used to fund an increase in securities.
Subordinated Debentures
Subordinated debentures were $85.4 million at December 31, 2024, compared to $85.2 million at December 31, 2023. In 2020, the Company issued $50.0 million aggregate principal amount fixed-to-floating rate subordinated notes due in 2030 in a private offering exempt from the registration requirements under the Securities Act of 1933, as amended. These notes carry a fixed rate of 4.00% for five years then a floating rate equal to the three-month SOFR rate plus 388.5 basis points. The Company may, at its option, redeem the notes, in whole or part, from time to time, subject to certain conditions, beginning on September 30, 2025. The net proceeds of the sale were approximately $48.8 million, after deducting the offering expenses.
Equity
Total stockholders’ equity increased $26.2 million to $1.00 billion at December 31, 2024, compared to $975.6 million at December 31, 2023. The increase in stockholders’ equity was primarily the result of net income of $71.4 million partially offset by the payment of $44.4 million of common stock dividends.
Results of Operations
Summary
Premier reported net income of $71.4 million for the year ended December 31, 2024, compared to $111.3 million and $102.2 million for the years ended December 31, 2023 and 2022, respectively. On a diluted per common share basis, Premier earned $1.98 in 2024, $3.11 in 2023 and $2.85 in 2022. The results for 2023 include six months of income and expenses from First Insurance compared to twelve months in 2022 and none in 2024, as well as $36.3 million in gains, $3.7 million in transaction costs and $8.5 million in taxes all related to the sale of First Insurance. The results for 2024 include $5.0 million in pre-tax costs related to the Merger with Wesbanco.
Net Interest Income
Premier’s net interest income is determined by its interest rate spread (i.e., the difference between the yields on its interest-earning assets and the rates paid on its interest-bearing liabilities) and the relative amounts of average interest-earning assets and interest-bearing liabilities.
Net interest income was $201.3 million for the year ended December 31, 2024, compared to $217.1 million and $242.9 million for the years ended December 31, 2023 and 2022, respectively. The tax-equivalent net interest margin was 2.52%, 2.75% and 3.37% for the years ended December 31, 2024, 2023 and 2022, respectively. The margin decreased 23 basis points between 2024 and 2023 primarily due to the increase in interest rates and inversion of the yield curve which negatively impacted funding costs. Interest-earning asset
yields increased 30 basis points (to 4.92% in 2024 from 4.62% in 2023) while the cost of interest- bearing liabilities between the two periods increased 62 basis points (to 3.16% in 2024 from 2.54% in 2023).
Total interest income increased by $27.2 million, or 7.4%, to $392.7 million for the year ended December 31, 2024, from $365.5 million for the year ended December 31, 2023. This increase was primarily due to an increase in loan income. Interest income from loans increased to $351.2 million for 2024 compared to $332.2 million in 2023, which represents an increase of 5.7%. The average balance of loans receivable decreased $14.8 million to $6.68 billion for 2024, from $6.69 billion for 2023. The average yield on loans increased 30 basis points to 5.26% in 2024 from 4.96% in 2023.
During the same period, the average balance of investment securities (excluding valuation adjustments) increased to $1.25 billion in 2024 from $1.15 billion for the year ended December 31, 2023. Interest income from investment securities increased to $36.6 million in 2024 compared to $28.2 million in 2023.
Interest expense increased by $43.0 million to $191.4 million in 2024 compared to $148.4 million 2023. This increase was mainly due to a 56 basis point increase in the average cost of funds in 2024 and a $201.5 million increase in the average balance of interest-bearing liabilities. The average balance of interest-bearing deposits increased $316.0 million to $5.64 billion in 2024, from $5.33 billion in 2023. Interest expense related to interest-bearing deposits was $171.1 million in 2024 compared to $122.4 million in 2023.
Interest expense on FHLB advances was $15.7 million in 2024 and $21.5 million in 2023. The decrease in FHLB advances expense was primarily due to decreased utilization in 2024 as a result of decreased loans. Interest expense recognized by the Company related to subordinated debentures was $4.6 million in 2024 and $4.5 million in 2023, which increased due to variable rates.
Total interest income increased by $87.8 million, or 31.6%, to $365.5 million for the year ended December 31, 2023, from $277.7 million for the year ended December 31, 2022. This increase was primarily due to an increase in loan income. Interest income from loans increased to $332.2 million for 2023 compared to $249.6 million in 2022, which represents an increase of 33.1%. The average balance of loans receivable increased $806.7 million to $6.69 billion for 2023, from $5.89 billion for 2022. The average yield on loans increased 72 basis points to 4.96% in 2023 from 4.24% in 2022.
During the same period, the average balance of investment securities decreased to $1.15 billion in 2023 from $1.26 billion for the year ended December 31, 2022. Interest income from investment securities increased to $28.5 million in 2023 compared to $26.1 million in 2022.
Interest expense increased by $113.6 million to $148.4 million in 2023 compared to $34.8 million 2022. This increase was mainly due to a 148 basis point increase in the average cost of funds in 2023 and a $757.3 billion increase in the average balance of interest-bearing liabilities. The average balance of interest-bearing deposits increased $586.6 million to $5.33 billion in 2023, from $4.74 billion in 2022. Interest expense related to interest-bearing deposits was $122.4 million in 2023 compared to $24.9 million in 2022.
Interest expense on FHLB advances was $21.5 million in 2023 and $6.6 million in 2022. The increase in FHLB advances expense was due to increased utilization in 2023 as a result of increased loans. Interest expense recognized by the Company related to subordinated debentures was $4.5 million in 2023 and $3.3 million in 2022, which increased due to variable rates.
The following table shows an analysis of net interest margin on a tax equivalent basis for the years ended December 31, 2024, 2023 and 2022:
| | | | | | | | | | | | | | | | | | | | | | | | | | | | | | | | | | | | |
| | Year Ended December 31, | |
| | (Dollars In Thousands) | |
| | 2024 | | | 2023 | | | 2022 | |
| | Average
Balance | | | Interest(1) | | | Yield/
Rate | | | Average
Balance | | | Interest(1) | | | Yield/
Rate | | | Average
Balance | | | Interest(1) | | | Yield/
Rate | |
Interest-Earning Assets: | | | | | | | | | | | | | | | | | | | | | | | | | | | |
Loans receivable (4) | | $ | 6,677,881 | | | $ | 351,219 | | | | 5.26 | % | | $ | 6,692,631 | | | $ | 332,231 | | | | 4.96 | % | | $ | 5,885,969 | | | $ | 249,586 | | | | 4.24 | % |
Securities (5) | | | 1,251,487 | | | | 36,860 | | | | 2.95 | % | | | 1,150,966 | | | | 28,458 | | | | 2.47 | % | | | 1,258,901 | | | | 26,884 | | | | 2.14 | % |
Interest-earning deposits | | | 35,761 | | | | 2,502 | | | | 7.00 | % | | | 36,698 | | | | 2,478 | | | | 6.75 | % | | | 70,917 | | | | 831 | | | | 1.17 | % |
FHLB stock | | | 27,132 | | | | 2,401 | | | | 8.85 | % | | | 32,356 | | | | 2,610 | | | | 8.07 | % | | | 21,834 | | | | 1,225 | | | | 5.61 | % |
Total interest-earning assets | | | 7,992,261 | | | | 392,982 | | | | 4.92 | % | | | 7,912,651 | | | | 365,777 | | | | 4.62 | % | | | 7,237,621 | | | | 278,526 | | | | 3.85 | % |
Noninterest-earning assets | | | 648,701 | | | | | | | | | | 625,079 | | | | | | | | | | 694,777 | | | | | | | |
Total Assets | | $ | 8,640,962 | | | | | | | | | $ | 8,537,730 | | | | | | | | | $ | 7,932,398 | | | | | | | |
Interest-Bearing Liabilities: | | | | | | | | | | | | | | | | | | | | | | | | | | | |
Interest-bearing deposits | | $ | 5,644,359 | | | $ | 171,111 | | | | 3.03 | % | | $ | 5,328,389 | | | $ | 122,407 | | | | 2.30 | % | | $ | 4,741,827 | | | $ | 24,909 | | | | 0.53 | % |
FHLB advances | | | 319,820 | | | | 15,697 | | | | 4.91 | % | | | 434,389 | | | | 21,479 | | | | 4.94 | % | | | 263,551 | | | | 6,550 | | | | 2.49 | % |
Subordinated debentures | | | 85,290 | | | | 4,591 | | | | 5.38 | % | | | 85,163 | | | | 4,531 | | | | 5.32 | % | | | 85,036 | | | | 3,327 | | | | 3.91 | % |
Other borrowings | | | — | | | | — | | | | — | | | | 3 | | | | — | | | | — | | | | 183 | | | | 5 | | | | 2.73 | % |
Total interest-bearing
liabilities | | | 6,049,469 | | | | 191,399 | | | | 3.16 | % | | | 5,847,944 | | | | 148,417 | | | | 2.54 | % | | | 5,090,597 | | | | 34,791 | | | | 0.68 | % |
Noninterest-bearing
demand deposits | | | 1,460,939 | | | | — | | | | — | | | | 1,616,919 | | | | — | | | | — | | | | 1,791,712 | | | | — | | | | — | |
Total including non-
interest- bearing demand
deposits | | | 7,510,408 | | | | 191,399 | | | | 2.55 | % | | | 7,464,863 | | | | 148,417 | | | | 1.99 | % | | | 6,882,309 | | | | 34,791 | | | | 0.51 | % |
Other noninterest liabilities | | | 141,756 | | | | | | | | | | 149,413 | | | | | | | | | | 122,555 | | | | | | | |
Total Liabilities | | | 7,652,164 | | | | | | | | | | 7,614,276 | | | | | | | | | | 7,004,864 | | | | | | | |
Stockholders’ equity | | | 988,798 | | | | | | | | | | 923,454 | | | | | | | | | | 927,534 | | | | | | | |
Total liabilities and
stockholders’ equity | | $ | 8,640,962 | | | | | | | | | $ | 8,537,730 | | | | | | | | | $ | 7,932,398 | | | | | | | |
Net interest income;
interest rate spread (2) | | | | | $ | 201,583 | | | | 1.76 | % | | | | | $ | 217,360 | | | | 2.08 | % | | | | | $ | 243,735 | | | | 3.17 | % |
Net interest margin (3) | | | | | | | | | 2.52 | % | | | | | | | | | 2.75 | % | | | | | | | | | 3.37 | % |
Average interest-earning
assets to average interest-
bearing liabilities | | | | | | | | | 132.1 | % | | | | | | | | | 135.3 | % | | | | | | | | | 142.2 | % |
(1)Interest on certain tax-exempt loans and tax-exempt securities in 2024, 2023 and 2022 is not taxable for Federal income tax purposes. In order to compare the tax-exempt yields on these assets to taxable yields, the interest earned on these assets is adjusted to a pre-tax equivalent amount based on the marginal corporate federal income tax rate of 21%.
(2)Interest rate spread is the difference in the yield on interest-earning assets and the cost of interest-bearing liabilities.
(3)Net interest margin is net interest income divided by average interest-earning assets excluding average unrealized gains/losses. See Non-GAAP Financial Measures discussion above for further details.
(4)For the purpose of the computation for loans, non-accrual loans are included in the average loans outstanding.
(5)Securities yield = annualized interest income divided by the average balance of securities, excluding average unrealized gains/losses.
See Non-GAAP Financial Measure discussion above for further details.
The following table describes the extent to which changes in interest rates and changes in volume of interest-related assets and liabilities have affected Premier’s tax-equivalent interest income and interest expense during the periods indicated. For each category of interest-earning assets and interest-bearing liabilities, information is provided on changes attributable to (i) changes in volume (change in volume multiplied by prior year rate), (ii) change in rate (change in rate multiplied by prior year volume), and (iii) total change in rate and volume. The combined effect of changes in both rate and volume has been allocated proportionately to the change due to rate and the change due to volume.
| | | | | | | | | | | | | | | | | | | | | | | | |
| | Year Ended December 31, | |
| | (In Thousands) | |
| | 2024 vs. 2023 | | | 2023 vs. 2022 | |
| | Increase
(decrease)
due to rate | | | Increase
(decrease)
due to volume | | | Total
increase
(decrease) | | | Increase
(decrease)
due to rate | | | Increase
(decrease)
due to volume | | | Total
increase
(decrease) | |
Interest-Earning Assets | | | | | | | | | | | | | | | | | | |
Loans | | $ | 20,078 | | | $ | (1,090 | ) | | $ | 18,988 | | | $ | 42,379 | | | $ | 40,266 | | | $ | 82,645 | |
Securities | | | 5,525 | | | | 2,877 | | | | 8,402 | | | | 4,154 | | | | (2,580 | ) | | | 1,574 | |
Interest-earning deposits | | | 92 | | | | (68 | ) | | | 24 | | | | 3,957 | | | | (2,310 | ) | | | 1,647 | |
FHLB stock | | | 252 | | | | (461 | ) | | | (209 | ) | | | 537 | | | | 848 | | | | 1,385 | |
Total interest-earning assets | | $ | 25,947 | | | $ | 1,258 | | | $ | 27,205 | | | $ | 51,027 | | | $ | 36,224 | | | $ | 87,251 | |
Interest-Bearing Liabilities | | | | | | | | | | | | | | | | | | |
Deposits | | $ | 38,897 | | | $ | 9,807 | | | $ | 48,704 | | | $ | 83,930 | | | $ | 13,568 | | | $ | 97,498 | |
FHLB advances | | | (130 | ) | | | (5,652 | ) | | | (5,782 | ) | | | 6,457 | | | | 8,472 | | | | 14,929 | |
Subordinated Debentures | | | 51 | | | | 9 | | | | 60 | | | | 1,199 | | | | 5 | | | | 1,204 | |
Notes Payable | | | — | | | | — | | | | — | | | | — | | | | (5 | ) | | | (5 | ) |
Total interest- bearing liabilities | | $ | 38,818 | | | $ | 4,164 | | | $ | 42,982 | | | $ | 91,586 | | | $ | 22,040 | | | $ | 113,626 | |
Change in net interest income | | | | | | | | $ | (15,777 | ) | | | | | | | | $ | (26,375 | ) |
(1)The change in interest rates due to both rate and volume has been allocated between the factors in proportion to the relationship of the absolute dollar amounts of the change in each.
Provision for credit losses – Premier’s provision for credit losses was an expense of $2.5 million, an expense of $5.2 million and an expense of $14.3 million for the years ended December 31, 2024, 2023, and 2022, respectively. The decrease for 2024 was primarily due to a decline in loan volumes whereas the decrease in 2023 was primarily due to less loan growth in 2023 compared to 2022. Loans decreased $262.8 million in 2024 compared to an increase of $275.1 million in 2023 and an increase of $1.16 billion in 2022.
Provisions for credit losses are charged to earnings to bring the total allowance for credit losses to a level deemed appropriate by management to absorb anticipated losses over the life of the loan. Factors considered by management include identifiable risk in the portfolios, historical experience, the volume and type of lending conducted by Premier, the amount of non-performing loans, the amount of loans graded by management as substandard, doubtful, or loss, general economic conditions (particularly as they relate to Premier’s market areas) and other factors related to the collectability of Premier’s loan portfolio. See also Allowance for Credit Losses in this Management’s Discussion and Analysis and Note 6 to the Consolidated Financial Statements.
Noninterest Income – Noninterest income decreased by $40.6 million, or 44.7%, in 2024 to $50.2 million down from $90.8 million for the year ended December 31, 2023. Noninterest income increased by $28.7 million, or 46.2%, to $90.8 million in 2023. Both fluctuations are primarily due to a $36.3 million gain recognized on the sale of First Insurance in June 2023 partially offset by declines in insurance commissions.
Service fees and other charges increased to $28.8 million for the year ended December 31, 2024, from $27.3 million for 2023 and from $25.9 million in 2022. The increases are primarily due to increased customer activity for interchange and ATM/NSF charges.
Noninterest income also includes gains, losses and impairments on investment securities. In 2024, Premier recognized $550,000 of securities gains compared to $416,000 in securities losses in 2023 and $550,000 in securities losses in 2022. These amounts reflect both realized and unrealized gains and/or losses with no realized gains in 2024 and gains of $201,000 and $1.3 million realized in 2023 and 2022, respectively.
Mortgage banking income includes gains from the sale of mortgage loans, fees for servicing mortgage loans for others, an offset for amortization of mortgage servicing rights, and adjustments for changes in the value of mortgage servicing rights. Mortgage banking income totaled $7.4 million, $6.7 million and $9.9 million in 2024, 2023 and 2022, respectively. The $619,000 increase in mortgage servicing rights in 2024 from 2023 is primarily attributable to a positive valuation adjustment of $710,000 in 2024 compared to a negative valuation adjustment of $69,000 in 2023. The $3.1 million decrease in 2023 from 2022 is primarily attributable to a negative valuation adjustment of $69,000 in 2023 compared to a positive valuation adjustment of $2.0 million in 2022 along with a decrease in the gain on sale of loans of $1.4 million. Premier originated less residential mortgages for sale into the secondary market in 2023 compared with 2022 as long-term interest rates stabilized resulting in less refinance activity. The balance of the mortgage servicing right valuation allowance was $46,000 at the end of 2024 compared to $756,000 at the end of 2023.
Gains on the sale of non-mortgage loans, which include SBA and FSA loans, totaled $67,000 in 2024 compared to $165,000 in 2023 and $0 in 2022. Fluctuations in the volume of eligible SBA loans were the reasons for the difference in income year to year to year.
Insurance commission income decreased to $0 in 2024 and $8.9 million in 2023 from $16.2 million in 2022 as a result of recognizing six months of income in 2023 compared to 12 in 2022 and none in 2024 as First Insurance was sold in June 2023.
Income from bank owned life insurance (“BOLI”) was $5.4 million in 2024 compared to $5.0 million in 2023 and $3.9 million in 2022. Premier recognized $512,000, $875,000 and $0 in proceeds from claim gains in 2024, 2023 and 2022, respectively.
Wealth income increased $1.1 million to $7.4 million in 2024 from $6.3 million in 2023. Wealth income increased $494,000 to $6.3 million in 2023 from $5.8 million in 2022. Both increases are due to a combination of new business generation and improved capital markets.
Premier sold First Insurance to Risk Strategies Corporation in the second quarter of 2023 and recognized a gain on the sale of $36.3 million.
Other noninterest income increased to $635,000 in 2024 compared to $544,000 in 2023. Other noninterest income decreased to $544,000 in 2023 compared to $984,000 in 2022 as a result of six months income from First Insurance in 2023 compared to a full year of income in 2022.
Noninterest Expense – Total noninterest expense for 2024 was $159.3 million compared to $163.2 million for the year ended December 31, 2023, and $164.5 million for the year ended December 31, 2022.
Compensation and benefits decreased $6.3 million, or 6.8%, to $86.3 million in 2024 from $92.6 million in 2023. The decrease from 2023 is primarily due to the sale of First Insurance in the second quarter of 2023 and lower staffing levels in 2024. Premier recognized $5.0 million in transaction costs related to the Merger during 2024 and $3.7 million in transaction costs related to the sale of First Insurance in 2023. Data processing costs were $19.9 million in 2024, compared to $16.2 million in 2023 with the increase primarily due to a new digital platform launched in October 2023. FDIC insurance premiums decreased $0.8 million to $5.0 million in 2024 compared to $5.8 million in 2023 primarily due to a smaller balance sheet.
Compensation and benefits decreased $4.8 million, or 4.9%, to $92.6 million in 2023 from $97.4 million in 2022. The decrease from 2022 is primarily due to the sale of First Insurance and cost savings initiatives that began in the second quarter of 2023 partially offset by costs related to higher staffing levels from our 2022 growth initiatives and higher base compensation, including 2022 mid-year adjustments and 2023 annual adjustments. Premier recognized $3.7 million in transaction costs related to the sale of First Insurance in the second quarter of 2023. Data processing costs were $16.2 million in 2023, compared to $13.8 million in 2022 with the increase primarily due to year-over-year growth. FDIC insurance premiums increased $2.2 million to $5.8 million in 2023 compared to $3.6 million in 2022 primarily due to a two basis point increase in the base deposit insurance assessment in 2023.
Income Taxes – Income taxes totaled $18.3 million in 2024 compared to $28.2 million in 2023 and $24.1 million in 2022. The effective tax rates for those years were 20.4%, 20.2%, and 19.1%, respectively. The tax rate is lower than the statutory 21% tax rate for the Company mainly because of investments in tax-exempt securities. The earnings on bank owned life insurance and tax-exempt securities that are not subject to federal income tax. See Note 17 – Income Taxes to the Consolidated Financial Statements for further details.
Concentrations of Credit Risk
Financial institutions such as Premier generate income primarily through lending and investing activities. The risk of loss from lending and investing activities includes the possibility that losses may occur from the failure of another party to perform according to the terms of the loan or investment agreement. This possibility is known as credit risk.
Lending or investing activities that concentrate assets in a way that exposes the Company to a material loss from any single occurrence or group of occurrences increases credit risk. Diversifying loans and investments to prevent concentrations of risks is one way a financial institution can reduce potential losses due to credit risk. Examples of asset concentrations would include multiple loans made to a single borrower and loans of inappropriate size relative to the total capitalization of the institution. Management believes adherence to its loan and investment policies allows it to control its exposure to concentrations of credit risk at acceptable levels. As of December 31, 2024. Premier’s loan portfolio was concentrated geographically in its northeast, northwest and central Ohio, northeast Indiana, and southeast Michigan market areas. Management has also identified lending for multifamily properties within commercial real estate as an industry. Total loans from multifamily property totaled $645.6 million at December 31, 2024, which represents 9.7% of the Company’s loan portfolio. Management believes it has the skill and experience to manage any risks associated with this type of lending. Loans in this category are generally paying as agreed without any unusual or unexpected levels of delinquency. The delinquency rate in this category, which is any loan 30 days or more past due, was 1.2% at December 31, 2024. There are no other industry concentrations that exceed 10% of the Company’s loan portfolio.
Liquidity and Capital Resources
The Company’s primary source of liquidity is its core deposit base, raised through the Bank’s branch network, along with wholesale sources of funding and its capital base. These funds, along with investment securities, provide the ability to meet the needs of depositors while funding new loan demand and existing commitments.
Cash (used in) generated from operating activities was $92.3 million, $77.3 million and $180.1 million in 2024, 2023 and 2022, respectively. These fluctuations are mainly due to changes in the volume of loans sold from year to year and the sale of First Insurance in 2023. The adjustments to reconcile net income to cash provided by or used in operations during the periods presented consist primarily of proceeds from the sale of loans (less the origination of loans held for sale), the provision for credit losses, depreciation expense, the origination, amortization and impairment of mortgage servicing rights and increases and decreases in other assets and liabilities.
The primary investing activity of Premier is lending and the purchase of available-for-sale securities, which are funded with cash provided from operating and financing activities, as well as proceeds from payment on existing loans and proceeds from maturities of investment securities. The net cash Provided by (used in) investing activities was $31.9 million, $(124.7) million and $(1.2) billion in 2024, 2023 and 2022, respectively. These fluctuations are mainly due to the change in volume of loans and securities from one year to the next.
Principal financing activities include the gathering of deposits, the utilization of FHLB advances, and borrowings from other banks. The net cash (used in) provided by financing activities was $(117.5) million, $33.9 million and $993.4 million in 2024, 2023 and 2022, respectively. These fluctuations are mainly a result of changes in deposit balances and borrowings from FHLB year over year. For additional information about cash flows from Premier’s operating, investing and financing activities, see the Consolidated Statements of Cash Flows and related Notes included in the Consolidated Financial Statements.
At December 31, 2024, Premier had the following commitments to fund deposits, borrowing obligations, leases and post-retirement benefits:
| | | | | | | | | | | | | | | | | | | | |
| | Maturity Dates by Period at December 31, 2024 | |
Contractual Obligations | | Total | | | Less than
1 year | | | 1-3 years | | | 3-5 years | | | More than
5 years | |
| | (In Thousands) | |
Certificates of deposit | | $ | 1,279,195 | | | $ | 1,173,248 | | | $ | 90,687 | | | $ | 15,011 | | | | 249 | |
Brokered deposits | | | 54,688 | | | | 54,688 | | | | — | | | | — | | | | — | |
Subordinated debentures | | | 85,356 | | | | — | | | | — | | | | — | | | | 85,356 | |
FHLB advances | | | 507,000 | | | | 507,000 | | | | — | | | | — | | | | — | |
Lease obligations | | | 25,575 | | | | 3,478 | | | | 6,125 | | | | 5,255 | | | | 10,717 | |
Post-retirement benefits | | | 1,678 | | | | 192 | | | | 405 | | | | 366 | | | | 715 | |
Total contractual obligations | | $ | 1,953,492 | | | $ | 1,738,606 | | | $ | 97,217 | | | $ | 20,632 | | | $ | 97,037 | |
To meet its obligations, management can adjust the rate of savings certificates to retain deposits in changing interest rate environments; it can sell or securitize mortgage and non-mortgage loans; and it can turn to other sources of financing including FHLB advances, the Federal Reserve, and brokered certificates of deposit. At December 31, 2024, Premier had additional borrowing capacity of $900.4 million under its agreements with the FHLB.
The Bank is subject to various capital requirements. At December 31, 2024, the Bank had capital ratios that exceeded the standard to be considered “well capitalized.” For additional information about Premier and the Bank’s capital requirements, see Note 16 – Regulatory Matters to the Consolidated Financial Statements.
Critical Accounting Policies and Estimates
Premier has established various accounting policies that govern the application of GAAP in the preparation of its Consolidated Financial Statements. The significant accounting policies of Premier are described in the Notes to the Consolidated Financial Statements. Certain accounting policies involve significant judgments and assumptions by management, which have a material impact on the carrying value of certain assets and liabilities and management considers such accounting policies to be critical accounting policies. The estimates used in these accounting policies are subject to a significant level of uncertainty due to assumptions and external factors that can change over time. The judgments and assumptions used by management are based on historical experience and other factors, which are believed to be reasonable under the circumstances. Because of the nature of the judgments and assumptions made by management, actual results could differ from these judgments and estimates, which may materially impact the carrying value of assets and liabilities, as well as the results of operations, especially under changing market conditions.
Allowance for credit losses - Premier believes the allowance for credit losses is a critical accounting policy that requires the most significant judgments and estimates used in preparation of its Consolidated Financial Statements. In determining the appropriate estimate for the allowance for credit losses, management considers a number of factors relative to both specific credits in the loan portfolio and macro-economic factors relative to the economy of the U.S. as a whole and the economies of the areas in which the Company does business. ACL is subject to significant estimation uncertainty due to the unpredictability of future economic conditions and borrower-specific factors. ACL requires a projection of credit losses over the contract lifetime of the credit adjusted for prepayment tendencies. Management analyzes the adequacy of the ACL regularly through reviews of the loan portfolio. Consideration is given to economic conditions, changes in interest rates and the effect of such changes on collateral values and borrower’s ability to pay, changes in the composition of the loan portfolio and trends in past due and non-performing loan balances. The ACL is a material estimate that is susceptible to significant fluctuation and is established through a provision for credit losses based on management’s evaluation of the inherent risk in the loan portfolio.
Factors relative to specific credits that are considered include a customer’s payment history, a customer’s recent financial performance, an assessment of the value of collateral held, knowledge of the customer’s character, the financial strength and commitment of any guarantors, the existence of any customer or industry concentrations, changes in a customer’s competitive environment and any other issues that may impact a customer’s ability to meet his obligations.
Economic factors that are considered include levels of unemployment and inflation, changes in interest rates, GDP growth, Federal Reserve stimulus and broad global and national economic conditions. In particular, any significant downturns or upturns in economic conditions could materially alter these estimates.
In addition to the identification of specific customers who may be potential credit problems, management considers its historical losses, the results of independent loan reviews, an assessment of the adherence to underwriting standards, and other factors in providing for credit losses that have not been specifically classified. Management believes that the level of its allowance for credit losses is sufficient to cover the current expected credit losses. However, this estimate is sensitive to changes in both macroeconomic conditions and the credit performance of individual borrowers. Refer to Allowance for credit losses in this Management’s Discussion and Analysis and Note 2 - Statement of Accounting Policies for a further description of the Company’s estimation process and methodology related to the allowance for credit losses.
Goodwill and Intangibles - At December 31, 2024, Premier had goodwill of $295.6 million. The Company tests goodwill at least annually and, more frequently, if events or changes in circumstances indicate that it may be more likely than not that there is a possible impairment. Due to the Company’s signing of the Merger Agreement, the Company conducted a quantitative interim goodwill impairment assessment at September 30, 2024. Premier's goodwill impairment testing is subject to significant estimation uncertainty due to the inherent subjectivity in selecting key assumptions, including economic forecasts, growth rates, and discount rates. The impairment assessment compares the fair value of identified reporting unit with their carrying amount (including goodwill). If the carrying amount of a reporting unit exceeds its fair value, an impairment loss is recognized in an amount equal to the excess. The Company's interim assessment estimated fair value on income and market approaches. The income approach incorporated a discounted cash flow model that involves management assumptions and consideration of future economic forecasts available. The market approach incorporated a combination of price to book value and price to earnings, adjusted based on companies similar to the reporting unit and adjusted for selected multiples, along with a control premium based on a review of transactions in the banking industry. Significant assumptions in the assessments were employed and included, but were not limited to, prospective financial information, growth rates, terminal value, discount rates, control premiums and comparable multiples from publicly traded companies in our industry. Results of the interim assessment were a fair value of approximately $1.2 billion compared to a carrying amount of approximately $1.0 billion indicating no goodwill impairment as of September 30, 2024. Changes in the economic environment, operations of the reporting unit or other adverse events could result in goodwill impairment as a result of a future evaluation. Premier will continue to closely monitor these variables and their potential impact on future goodwill impairment assessments.
Premier has core deposit and other intangible assets resulting from acquisitions which are subject to amortization. Premier determines the amount of identifiable intangible assets based upon independent core deposit and customer relationship analyses at the time of the acquisition. Intangible assets with finite useful lives are evaluated for impairment whenever events or changes in circumstances indicate that their carrying amount may not be recoverable. No events or changes in circumstances that would indicate that the carrying amount of any identifiable intangible assets may not be recoverable had occurred during the years ended December 31, 2024 and 2023.
Item 7A. Quantitative and Qualitative Disclosures About Market Risk
Asset/Liability Management
A significant portion of the Company’s revenues and net income is derived from net interest income and, accordingly, the Company strives to manage its interest-earning assets and interest-bearing liabilities to generate an appropriate contribution from net interest
income. Asset and liability management seeks to control the volatility of the Company’s performance due to changes in interest rates. The Company attempts to achieve an appropriate relationship between rate sensitive assets and rate sensitive liabilities.
Premier monitors interest rate risk on a quarterly basis through simulation analysis that measures the impact changes in interest rates can have on net interest income. The simulation technique analyzes the effect of a presumed 100 basis point shift in interest rates (which is consistent with management’s estimate of the range of potential interest rate fluctuations) and takes into account prepayment speeds on amortizing financial instruments, loan and deposit volumes and rates, borrowings, derivative positions and non-maturity deposit assumptions and capital requirements. It should be noted that other areas of Premier’s income statement, such as gains from sales of mortgage loans and amortization of mortgage servicing rights are also impacted by fluctuations in interest rates, but are not considered in the simulation of net interest income. Sensitivity testing of these assumptions are performed to provide management with a greater understanding of how sensitivity results may differ should actual results vary from those assumed.
•Asset Prepayments: Prepayment assumptions are utilized for loan and investment portfolios and are the result of 3rd party model forecasts and/or historical studies. Generally, the constant prepayment rates assumed increase in lower rate scenarios and decrease in higher rate scenarios.
•Loan and Deposit Volumes and Rates: The simulation analysis assumes a static balance sheet with new asset and liability pricing assumptions determined by a review of recent production results per category.
•Deposit Beta: Dynamic deposit betas are assumed resulting from a 3rd party model incorporating historical experience and market rates to determine forecasted expectations.
The table below presents, for the twelve months subsequent to December 31, 2024, and December 31, 2023, an estimate of the change in net interest income that would result from an immediate (shock) change in interest rates, moving in a parallel fashion over the entire yield curve, relative to the measured base case scenario. Based on our net interest income simulation as of December 31, 2024, net interest income sensitivity to changes in interest rates for the twelve months subsequent to December 31, 2024, decreased in both the rising rate and falling rate environments compared to the sensitivity profile for the twelve months subsequent to December 31, 2023. The change in modeling results from the prior period shown is largely due to changes in re-pricing expectations on deposits which impacted liability sensitivity for the period.
| | | | | | | | |
| | Impact on Future Annual Net Interest Income | |
| | December 31, 2024 | | | December 31, 2023 | |
Immediate Change in Interest Rates | | | | | | |
+400 | | | (7.1 | )% | | | (9.9 | )% |
+300 | | | (5.0 | )% | | | (7.3 | )% |
+200 | | | (3.1 | )% | | | (4.7 | )% |
+100 | | | (1.3 | )% | | | (2.3 | )% |
-100 | | | 2.1 | % | | | 2.5 | % |
-200 | | | 4.0 | % | | | 5.0 | % |
-300 | | | 5.5 | % | | | 7.3 | % |
-400 | | | 6.3 | % | | | 9.2 | % |
To analyze the impact of changes in interest rates in a more realistic manner, non-parallel interest rate scenarios are also simulated. These non-parallel interest rate scenarios indicate that net interest income may increase from the base case scenario should the yield curve change by different increments on different points on the curve. The results of all the simulation scenarios are within the Board mandated guidelines as of December 31, 2024. Management reviews the Board policy limits in all scenarios to determine if they are adequate and if any changes should be made to Board mandated guidelines.
In addition to the simulation analysis, Premier also uses an economic value of equity (“EVE”) analysis to measure risk in the balance sheet incorporating all cash flows over the estimated remaining life of all balance sheet positions. The EVE analysis generally calculates the net present value of Premier’s assets and liabilities in rate shock environments that range from -400 basis points to +400 basis points. This analysis also incorporates key assumptions which can have material impacts to modeled results and are consistent with the methodologies used in the net interest income sensitivity analysis. Deposit decay (or attrition) is a key assumption in EVE analysis and is the result of the same dynamic model used to generate deposit beta assumptions. The results of this analysis are reflected in the following table.
| | | | | | | | |
| | December 31, 2024 | | | December 31, 2023 | |
Change in Rates | | % Change EVE | | | % Change EVE | |
| | | | | | |
+ 400 bp | | | (30.3 | )% | | | (30.7 | )% |
+ 300 bp | | | (22.1 | )% | | | (23.4 | )% |
+ 200 bp | | | (14.1 | )% | | | (15.7 | )% |
+ 100 bp | | | (6.4 | )% | | | (7.7 | )% |
0 bp | | | — | | | | — | |
- 100 bp | | | 5.5 | % | | | 7.1 | % |
- 200 bp | | | 9.6 | % | | | 12.4 | % |
- 300 bp | | | 11.4 | % | | | 16.3 | % |
- 400 bp | | | 7.5 | % | | | 12.9 | % |
In evaluating the Bank’s exposure to interest rate risk, certain shortcomings inherent in each of the methods of analysis presented must be considered. For example, although certain assets and liabilities may have similar maturities or periods to repricing, they may react in different degrees to changes in market interest rates. Also, the interest rates on certain types of assets and liabilities may fluctuate in advance of changes in market rates while interest rates on other types of financial instruments may lag behind current changes in market rates. Furthermore, in the event of changes in rates, prepayments and early withdrawal levels could differ significantly from the assumptions in calculating the table and the results therefore may differ from those presented.
Item 8. Financial Statements and Supplementary Data
Management’s Report on Internal Control Over Financial Reporting
The management of Premier Financial Corp. is responsible for establishing and maintaining adequate internal control over financial reporting. Internal control over financial reporting is defined in Rule 13a-15(f) promulgated under the Securities Exchange Act of 1934 as a process designed by, or under the supervision of our principal executive and principal financial officers and effected by the Board of Directors, management and other personnel, to provide reasonable assurance regarding the reliability of financial reporting and the preparation of financial statements for external purposes in accordance with U.S. generally accepted accounting principles ("U.S. GAAP") and includes those policies and procedures that:
1.Pertain to the maintenance of records that in reasonable detail accurately and fairly reflect the transactions and dispositions of our assets;
2.Provide reasonable assurance that transactions are recorded as necessary to permit preparation of financial statements in accordance with U.S. GAAP, and that our receipts and expenditures are being made only in accordance with authorizations of our management and directors; and
3.Provide reasonable assurance regarding prevention or timely detection of unauthorized acquisition, use or disposition of our assets that could have a material effect on the financial statements.
Because of its inherent limitations, internal control over financial reporting may not prevent or detect misstatements. Also, projections of any evaluation of effectiveness to future periods are subject to risk that controls may become inadequate because of changes in conditions, or that the degree of compliance with policies or procedures may deteriorate.
Based on our evaluation under the framework in the 2013 Internal Control – Integrated Framework, management concluded that our internal control over financial reporting was effective as of December 31, 2024 to provide reasonable assurance regarding the reliability of financial reporting and the preparation of consolidated financial statements for external reporting purposes in accordance with U.S. GAAP.
Crowe LLP, the independent registered public accounting firm that audited the consolidated financial statements of the Company included in this Annual Report on Form 10-K, has issued a report on the effectiveness of the Company’s internal control over financial reporting as of December 31, 2024. The report, which expresses an unqualified opinion on the effectiveness of the Company’s internal control over financial reporting as of December 31, 2024, is included in this Item 8.
| | |
/s/ Gary M. Small | | /s/ Paul Nungester |
Gary M. Small | | Paul Nungester |
President and Chief Executive Officer | | Executive Vice President and |
| | Chief Financial Officer |
REPORT OF INDEPENDENT REGISTERED PUBLIC ACCOUNTING FIRM
Stockholders and the Board of Directors of Premier Financial Corp.
Defiance, Ohio
Opinions on the Financial Statements and Internal Control over Financial Reporting
We have audited the accompanying consolidated statements of financial condition of Premier Financial Corp. (the "Company") as of December 31, 2024 and 2023, the related consolidated statements of income, comprehensive income, changes in stockholders’ equity, and cash flows for each of the years in the three-year period ended December 31, 2024, and the related notes (collectively referred to as the "financial statements"). We also have audited the Company’s internal control over financial reporting as of December 31, 2024, based on criteria established in Internal Control – Integrated Framework: (2013) issued by the Committee of Sponsoring Organizations of the Treadway Commission (COSO).
In our opinion, the financial statements referred to above present fairly, in all material respects, the financial position of the Company as of December 31, 2024 and 2023, and the results of its operations and its cash flows for each of the years in the three-year period ended December 31, 2024 in conformity with accounting principles generally accepted in the United States of America. Also in our opinion, the Company maintained, in all material respects, effective internal control over financial reporting as of December 31, 2024, based on criteria established in Internal Control – Integrated Framework: (2013) issued by COSO.
Basis for Opinions
The Company’s management is responsible for these financial statements, for maintaining effective internal control over financial reporting, and for its assessment of the effectiveness of internal control over financial reporting, included in the accompanying Management’s Report on Internal Control over Financial Reporting. Our responsibility is to express an opinion on the Company’s financial statements and an opinion on the Company’s internal control over financial reporting based on our audits. We are a public accounting firm registered with the Public Company Accounting Oversight Board (United States) ("PCAOB") and are required to be independent with respect to the Company in accordance with the U.S. federal securities laws and the applicable rules and regulations of the Securities and Exchange Commission and the PCAOB.
We conducted our audits in accordance with the standards of the PCAOB. Those standards require that we plan and perform the audits to obtain reasonable assurance about whether the financial statements are free of material misstatement, whether due to error or fraud, and whether effective internal control over financial reporting was maintained in all material respects.
Our audits of the financial statements included performing procedures to assess the risks of material misstatement of the financial statements, whether due to error or fraud, and performing procedures that respond to those risks. Such procedures included examining, on a test basis, evidence regarding the amounts and disclosures in the financial statements. Our audits also included evaluating the accounting principles used and significant estimates made by management, as well as evaluating the overall presentation of the financial statements. Our audit of internal control over financial reporting included obtaining an understanding of internal control over financial reporting, assessing the risk that a material weakness exists, and testing and evaluating the design and operating effectiveness of internal control based on the assessed risk. Our audits also included performing such other procedures as we considered necessary in the circumstances. We believe that our audits provide a reasonable basis for our opinions.
Definition and Limitations of Internal Control Over Financial Reporting
A company’s internal control over financial reporting is a process designed to provide reasonable assurance regarding the reliability of financial reporting and the preparation of financial statements for external purposes in accordance with generally accepted accounting principles. A company’s internal control over financial reporting includes those policies and procedures that (1) pertain to the maintenance of records that, in reasonable detail, accurately and fairly reflect the transactions and dispositions of the assets of the company; (2) provide reasonable assurance that transactions are recorded as necessary to permit preparation of financial statements in accordance with generally accepted accounting principles, and that receipts and expenditures of the company are being made only in accordance with authorizations of management and directors of the company; and (3) provide reasonable assurance regarding prevention or timely detection of unauthorized acquisition, use, or disposition of the company’s assets that could have a material effect on the financial statements.
Because of its inherent limitations, internal control over financial reporting may not prevent or detect misstatements. Also, projections of any evaluation of effectiveness to future periods are subject to the risk that controls may become inadequate because of changes in conditions, or that the degree of compliance with the policies or procedures may deteriorate.
Critical Audit Matters
The critical audit matters communicated below are matters arising from the current period audit of the consolidated financial statements that were communicated or required to be communicated to the audit committee and that: (1) relate to accounts or disclosures that are material to the consolidated financial statements and (2) involved our especially challenging, subjective, or complex judgments. The communication of critical audit matters does not alter in any way our opinion on the consolidated financial statements, taken as a whole, and we are not, by communicating the critical audit matters below, providing separate opinions on the critical audit matters or on the accounts or disclosures to which they relate.
Allowance for Credit Losses on Loans Receivable (“ACL”) – Qualitative Factors
As described in Notes 2 and 6 to the financial statements, the Company recognizes expected losses expected to be incurred over the contractual lives of financial assets carried at amortized cost, including loans receivable, using the Current Expected Credit Losses methodology. The ACL was $75,688,000 at December 31, 2024, and consists of two components: a specific reserve based on the analysis of individually evaluated loans, and a general reserve which represents current expected credit losses on loans sharing common risk characteristics (“general reserve”). The general reserve includes amounts from both a quantitative and a qualitative analysis. The Company has segregated the portfolio into segments with similar risk characteristics and generally uses two methodologies, discounted cash flow and probability of default/loss given default, to determine the quantitative factors.
Determination of the qualitative factors, which are added to the quantitative factors to adjust the general reserve for the current environment, incorporates subjective factors, including economic, environmental, and other risk factors. The incorporation of qualitative factors added $31,266,000 to the ACL as of December 31, 2024. We have identified auditing the qualitative factors as a critical audit matter as management’s determination of the qualitative factors is subjective and involves significant management judgments; and our audit procedures related to certain of the qualitative factors involved a high degree of auditor judgment and required significant audit effort, including the need to involve more experienced audit personnel.
The primary procedures we performed to address this critical audit matter included:
•Testing the design and operating effectiveness of controls that ensured the qualitative factors had a reasonable basis, including controls addressing:
oManagement’s review of the relevance and reliability of data inputs used as the basis for the qualitative factors.
oManagement’s review of the reasonableness of significant judgments and assumptions used to develop the qualitative factors.
oManagement’s review of the mathematical accuracy of the qualitative factors calculation.
•Substantively testing management’s determination of the qualitative factors, including evaluating their judgments and assumptions including:
oTesting management’s process for developing the qualitative factors and assessing the relevance and reliability of data used to develop the adjustments, including evaluating their significant judgments and assumptions for reasonableness. Among other procedures, our evaluation considered evidence from internal and external sources and whether significant judgments and assumptions were applied consistently from period to period.
oAnalytically evaluating the qualitative factors for directional consistency and reasonableness.
oTesting the mathematical accuracy of the qualitative factors used in the general reserve.
Goodwill Impairment Assessment as of September 30, 2024
As described in Notes 2 and 9 to the financial statements, the Company's goodwill balance totaled $295,602,000 as of December 31, 2024, which is allocated to the Company’s single reporting unit. The Company performs a goodwill impairment test annually as of November 30, or in between annual tests if events or changes in circumstances indicate that it is more likely than not that the fair value of the reporting unit is less than the carrying amount. The Company entered into a definitive agreement to be sold in July 2024. Due to the implied valuation of the merger consideration, management performed a quantitative assessment of goodwill for impairment as of
September 30, 2024, concluding goodwill was not impaired. The impairment assessment compared the fair value of the Company’s single reporting unit with its carrying amount (including goodwill). If the carrying amount of a reporting unit exceeds its fair value, an impairment loss is recognized in an amount equal to the excess. The Company's assessment estimated fair value using: 1) an income approach that incorporated a discounted cash flow model that involves management assumptions based upon future projections; and 2) a market approach that uses observable prices and other relevant information that is generated by transactions comparable to an acquisition of the Company.
We identified the auditing of the impairment assessment of goodwill as of September 30, 2024 as a critical audit matter due to the high degree of auditor judgment and subjectivity needed to evaluate the fair value of the reporting unit due to the judgments made by management in the estimation of the Company’s reporting unit fair value. In addition, the audit procedures involved the use of specialists to assist with the evaluation.
The primary procedures performed to address this critical audit matter included:
•Testing the design and operative effectiveness of management's review control over the appropriateness of the valuation methods, the completeness and accuracy of internal data, relevance and reliability of external data, and reasonableness of estimates and assumptions in the valuation.
•Evaluating the appropriateness of the valuation methods used to determine the fair value of the reporting unit.
•Testing the mathematical accuracy of the fair value computation including testing of the completeness and accuracy of the data used in the analysis to develop the estimate.
•Evaluating the reasonableness of the prospective financial information.
•Utilization of specialists to assist with the evaluation of the appropriateness of the valuation method, management assumptions, and overall reasonableness of the fair value of the reporting unit.
/s/Crowe LLP
Crowe LLP
We have served as the Company's auditor since 2005.
Cleveland, Ohio
February 28, 2025
PREMIER FINANCIAL CORP.
Consolidated Statements of Financial Condition
(Dollars in Thousands, except per share data)
| | | | | | | | |
| | December 31, | |
| | 2024 | | | 2023 | |
Assets | | | | | | |
Cash and cash equivalents: | | | | | | |
Cash and amounts due from depository institutions | | $ | 83,385 | | | $ | 81,973 | |
Interest-bearing deposits | | | 38,104 | | | | 32,783 | |
| | | 121,489 | | | | 114,756 | |
Securities available-for-sale, carried at fair value | | | 1,156,568 | | | | 946,708 | |
Equity securities, carried at fair value | | | 4,037 | | | | 5,773 | |
| | | 1,160,605 | | | | 952,481 | |
Loans held for sale, at fair value at December 31, 2024 | | | 117,964 | | | | 145,641 | |
Loans receivable, net of allowance for credit losses of $75,688 and $76,512 at December 31, 2024 and 2023, respectively | | | 6,400,939 | | | | 6,662,875 | |
Mortgage servicing rights | | | 17,196 | | | | 18,696 | |
Accrued interest receivable | | | 35,514 | | | | 33,446 | |
Federal Home Loan Bank (FHLB) stock | | | 31,585 | | | | 21,760 | |
Bank owned life insurance | | | 185,919 | | | | 181,544 | |
Premises and equipment | | | 53,683 | | | | 56,878 | |
Real estate and other assets held for sale (OREO) | | | 737 | | | | 243 | |
Goodwill | | | 295,602 | | | | 295,602 | |
Core deposit and other intangibles | | | 8,487 | | | | 12,186 | |
Other assets | | | 151,855 | | | | 129,841 | |
Total assets | | $ | 8,581,575 | | | $ | 8,625,949 | |
Liabilities and stockholders’ equity | | | | | | |
Liabilities: | | | | | | |
Deposits: | | | | | | |
Noninterest-bearing | | $ | 1,475,513 | | | $ | 1,591,979 | |
Interest-bearing | | | 5,319,598 | | | | 5,209,123 | |
Brokered deposits | | | 54,688 | | | | 341,944 | |
Total | | | 6,849,799 | | | | 7,143,046 | |
Advances from the Federal Home Loan Bank | | | 507,000 | | | | 280,000 | |
Subordinated debentures | | | 85,356 | | | | 85,229 | |
Advance payments by borrowers | | | 16,145 | | | | 23,277 | |
Reserve for credit losses - unfunded commitments | | | 2,906 | | | | 4,307 | |
Other liabilities | | | 118,556 | | | | 114,463 | |
Total liabilities | | | 7,579,762 | | | | 7,650,322 | |
Commitments and Contingent Liabilities (Note 5) | | | | | | |
Stockholders’ equity: | | | | | | |
Preferred stock, $.01 par value per share: 37,000 shares authorized; no shares issued | | | — | | | | — | |
Preferred stock, $.01 par value per share: 4,963,000 shares authorized; no shares
issued | | | — | | | | — | |
Common stock, $.01 par value per share: 50,000,000 shares authorized;
43,297,260 and 43,297,260 shares issued and 35,843,690 and 35,729,593
shares outstanding, respectively | | | 306 | | | | 306 | |
Additional paid-in capital | | | 690,946 | | | | 690,585 | |
Accumulated other comprehensive loss, net of tax of $(41,689) and $(40,862), respectively | | | (156,818 | ) | | | (153,719 | ) |
Retained earnings | | | 596,932 | | | | 569,937 | |
Treasury stock, at cost, 7,453,570 and 7,567,667 shares, respectively | | | (129,553 | ) | | | (131,482 | ) |
Total stockholders’ equity | | | 1,001,813 | | | | 975,627 | |
Total liabilities and stockholders’ equity | | $ | 8,581,575 | | | $ | 8,625,949 | |
See accompanying notes
PREMIER FINANCIAL CORP.
Consolidated Statements of Income
(Dollar Amounts in Thousands, except per share data)
| | | | | | | | | | | | |
| | Years Ended December 31, | |
| | 2024 | | | 2023 | | | 2022 | |
Interest Income | | | | | | | | | |
Loans | | $ | 351,182 | | | $ | 332,208 | | | $ | 249,561 | |
Investment securities: | | | | | | | | | |
Tax-exempt | | | 1,248 | | | | 2,383 | | | | 3,406 | |
Taxable | | | 35,335 | | | | 25,831 | | | | 22,689 | |
Interest-bearing deposits | | | 2,502 | | | | 2,478 | | | | 831 | |
FHLB stock dividends | | | 2,401 | | | | 2,610 | | | | 1,225 | |
Total interest income | | | 392,668 | | | | 365,510 | | | | 277,712 | |
Interest Expense | | | | | | | | | |
Deposits | | | 171,111 | | | | 122,407 | | | | 24,909 | |
Federal Home Loan Bank advances and other | | | 15,697 | | | | 21,479 | | | | 6,550 | |
Subordinated debentures | | | 4,591 | | | | 4,531 | | | | 3,327 | |
Notes payable | | | — | | | | — | | | | 5 | |
Total interest expense | | | 191,399 | | | | 148,417 | | | | 34,791 | |
Net interest income | | | 201,269 | | | | 217,093 | | | | 242,921 | |
Credit loss (benefit) expense - loans and leases | | | 3,890 | | | | 7,742 | | | | 12,503 | |
Credit loss (benefit) expense - unfunded commitments | | | (1,401 | ) | | | (2,508 | ) | | | 1,784 | |
Net interest income after provision for credit losses | | | 198,780 | | | | 211,859 | | | | 228,634 | |
Non-interest Income | | | | | | | | | |
Service fees and other charges | | | 28,755 | | | | 27,325 | | | | 25,853 | |
Mortgage banking income | | | 7,362 | | | | 6,743 | | | | 9,871 | |
Insurance commissions | | | — | | | | 8,856 | | | | 16,228 | |
Gain on sale of non-mortgage loans | | | 67 | | | | 165 | | | | — | |
Gain on sale of securities available for sale | | | — | | | | 37 | | | | 1 | |
Gain (Loss) on equity securities | | | 550 | | | | (453 | ) | | | (551 | ) |
Gain on sale of insurance agency | | | — | | | | 36,296 | | | | — | |
Wealth management income | | | 7,429 | | | | 6,322 | | | | 5,828 | |
Income from Bank Owned Life Insurance | | | 5,413 | | | | 5,014 | | | | 3,946 | |
Other non-interest income | | | 635 | | | | 544 | | | | 984 | |
Total non-interest income | | | 50,211 | | | | 90,849 | | | | 62,160 | |
Non-interest Expense | | | | | | | | | |
Compensation and benefits | | | 86,315 | | | | 92,609 | | | | 97,396 | |
Occupancy | | | 13,733 | | | | 13,358 | | | | 14,039 | |
FDIC insurance premium | | | 5,023 | | | | 5,803 | | | | 3,647 | |
Financial institutions tax | | | 3,851 | | | | 3,563 | | | | 4,110 | |
Data processing | | | 19,902 | | | | 16,191 | | | | 13,780 | |
Transaction costs | | | 4,969 | | | | 3,652 | | | | — | |
Amortization of intangibles | | | 3,699 | | | | 4,604 | | | | 5,450 | |
Other non-interest expense | | | 21,822 | | | | 23,451 | | | | 26,089 | |
Total non-interest expense | | | 159,314 | | | | 163,231 | | | | 164,511 | |
Income before income taxes | | | 89,677 | | | | 139,477 | | | | 126,283 | |
Federal income taxes | | | 18,273 | | | | 28,182 | | | | 24,096 | |
Net Income | | $ | 71,404 | | | $ | 111,295 | | | $ | 102,187 | |
Earnings per common share (Note 3) | | | | | | | | | |
Basic | | $ | 1.99 | | | $ | 3.11 | | | $ | 2.86 | |
Diluted | | $ | 1.98 | | | $ | 3.11 | | | $ | 2.85 | |
See accompanying notes
PREMIER FINANCIAL CORP.
Consolidated Statements of Comprehensive Income
(Dollar Amounts in Thousands)
| | | | | | | | | | | | |
| | For the Years Ended December 31, | |
| | 2024 | | | 2023 | | | 2022 | |
Net income | | $ | 71,404 | | | $ | 111,295 | | | $ | 102,187 | |
Change in securities available-for-sale (AFS): | | | | | | | | | |
Unrealized holding gains (losses) on available-for-sale securities
arising during the period | | | (688 | ) | | | 19,281 | | | | (174,953 | ) |
Reclassification adjustment for (gains) losses realized in income | | | — | | | | (37 | ) | | | 1 | |
Net unrealized gains (losses) | | | (688 | ) | | | 19,244 | | | | (174,952 | ) |
Income tax effect | | | 144 | | | | (4,041 | ) | | | 36,739 | |
Net of tax amount | | | (544 | ) | | | 15,203 | | | | (138,213 | ) |
Change in cash flow hedge derivatives: | | | | | | | | | |
Unrealized holding gains (losses) on balance sheet swap | | | (11,954 | ) | | | (3,626 | ) | | | (40,494 | ) |
Reclassification adjustment for cash flow hedge derivative (gains)
losses included in income | | | 8,560 | | | | 9,381 | | | | (392 | ) |
Net unrealized gains (losses) | | | (3,394 | ) | | | 5,755 | | | | (40,886 | ) |
Income tax effect | | | 713 | | | | (1,208 | ) | | | 8,586 | |
Net of tax amount | | | (2,681 | ) | | | 4,547 | | | | (32,300 | ) |
Change in unrealized gain/(loss) on postretirement benefit: | | | | | | | | | |
Net gain (loss) on defined benefit postretirement medical
plan realized during the period | | | 187 | | | | 11 | | | | 599 | |
Net amortization and deferral | | | (28 | ) | | | (23 | ) | | | 10 | |
Net gain (loss) activity during the period | | | 159 | | | | (12 | ) | | | 609 | |
Income tax effect | | | (33 | ) | | | 3 | | | | (128 | ) |
Net of tax amount | | | 126 | | | | (9 | ) | | | 481 | |
Total other comprehensive income (loss) | | | (3,099 | ) | | | 19,741 | | | | (170,032 | ) |
Comprehensive income (loss) | | $ | 68,305 | | | $ | 131,036 | | | $ | (67,845 | ) |
See accompanying notes
PREMIER FINANCIAL CORP.
Consolidated Statements of Changes in Stockholders’ Equity
(Dollar Amounts In Thousands, except number of shares)
| | | | | | | | | | | | | | | | | | | | | | | | | | | | | | | | |
| | Preferred
Stock | | | Common
Stock
Shares | | | Common
Stock | | | Additional
Paid-In
Capital | | | Accumulated
Other
Comprehensive
Income (Loss) | | | Retained
Earnings | | | Treasury
Stock | | | Total
Stockholder’s
Equity | |
Balance at December 31, 2021 | | $ | — | | | | 36,383,613 | | | $ | 306 | | | $ | 691,132 | | | $ | (3,428 | ) | | $ | 443,517 | | | $ | (108,031 | ) | | $ | 1,023,496 | |
Net income | | | | | | | | | | | | | | | | | | 102,187 | | | | | | | 102,187 | |
Other comprehensive loss | | | | | | | | | | | | | | | (170,032 | ) | | | | | | | | | (170,032 | ) |
Deferred compensation plan | | | | | | 9,933 | | | | | | | (57 | ) | | | | | | | | | 57 | | | | — | |
Stock based compensation expense | | | | | | | | | | | | 2,016 | | | | | | | | | | | | | 2,016 | |
Vesting of incentive plans | | | | | | 11,207 | | | | | | | (413 | ) | | | | | | | | | 413 | | | | — | |
Shares exercised under stock option plan, net | | | | | | 3,000 | | | | | | | | | | | | | | | | 53 | | | | 53 | |
Restricted share issuance | | | | | | 81,412 | | | | | | | (1,418 | ) | | | | | | | | | 1,418 | | | | — | |
Restricted share forfeitures | | | | | | (13,746 | ) | | | | | | 193 | | | | | | | | | | (527 | ) | | | (334 | ) |
Shares repurchased | | | | | | (884,142 | ) | | | | | | | | | | | | | | | (26,870 | ) | | | (26,870 | ) |
Common stock dividends paid ($1.20 per share) | | | | | | | | | | | | | | | | | | (42,795 | ) | | | | | | (42,795 | ) |
Balance at December 31, 2022 | | $ | — | | | | 35,591,277 | | | $ | 306 | | | $ | 691,453 | | | $ | (173,460 | ) | | $ | 502,909 | | | $ | (133,487 | ) | | $ | 887,721 | |
Net income | | | | | | | | | | | | | | | | | | 111,295 | | | | | | | 111,295 | |
Other comprehensive income | | | | | | | | | | | | | | | 19,741 | | | | | | | | | | 19,741 | |
Deferred compensation plan | | | | | | 9,196 | | | | | | | 36 | | | | | | | | | | (36 | ) | | | — | |
Stock based compensation expenses | | | | | | 4,114 | | | | | | | 1,508 | | | | | | | | | | 71 | | | | 1,579 | |
Vesting of incentive plans | | | | | | 66,780 | | | | | | | (1,159 | ) | | | | | | | | | 1,159 | | | | |
Shares issued under stock option plan | | | | | | 1,865 | | | | | | | (18 | ) | | | | | | | | | 33 | | | | 15 | |
Restricted share issuance | | | | | | 92,427 | | | | | | | (1,309 | ) | | | | | | | | | 1,605 | | | | 296 | |
Restricted share forfeitures | | | | | | (35,675 | ) | | | | | | 74 | | | | | | | | | | (816 | ) | | | (742 | ) |
Shares repurchased | | | | | | (391 | ) | | | | | | | | | | | | | | | (11 | ) | | | (11 | ) |
Common stock dividend payment ($1.24 per share) | | | | | | | | | | | | | | | | | | (44,267 | ) | | | | | | (44,267 | ) |
Balance at December 31, 2023 | | $ | — | | | | 35,729,593 | | | $ | 306 | | | $ | 690,585 | | | $ | (153,719 | ) | | $ | 569,937 | | | $ | (131,482 | ) | | $ | 975,627 | |
Net income | | | | | | | | | | | | | | | | | | 71,404 | | | | | | | 71,404 | |
Other comprehensive loss | | | | | | | | | | | | | | | (3,099 | ) | | | | | | | | | (3,099 | ) |
Deferred compensation plan | | | | | | | | | | | | (54 | ) | | | | | | | | | 54 | | | | — | |
Stock based compensation expenses | | | | | | | | | | | | 2,690 | | | | | | | | | | | | | 2,690 | |
Vesting of incentive plans | | | | | | 41,870 | | | | | | | (751 | ) | | | | | | | | | 725 | | | | (26 | ) |
Shares issued under stock option plan | | | | | | 6,000 | | | | | | | | | | | | | | | | 106 | | | | 106 | |
Restricted share issuance | | | | | | 94,080 | | | | | | | (1,636 | ) | | | | | | | | | 1,636 | | | | — | |
Restricted share forfeitures | | | | | | (27,853 | ) | | | | | | 112 | | | | | | | | | | (592 | ) | | | (480 | ) |
Common stock dividend payment ($1.24 per share) | | | | | | | | | | | | | | | | | | (44,409 | ) | | | | | | (44,409 | ) |
Balance at December 31, 2024 | | $ | — | | | | 35,843,690 | | | $ | 306 | | | $ | 690,946 | | | $ | (156,818 | ) | | $ | 596,932 | | | $ | (129,553 | ) | | $ | 1,001,813 | |
See accompanying notes
PREMIER FINANCIAL CORP.
Consolidated Statements of Cash Flows
(Dollar Amounts in Thousands)
| | | | | | | | | | | | |
| | Years Ended December 31, | |
| | 2024 | | | 2023 | | | 2022 | |
Operating Activities | | | | | | | | | |
Net income | | $ | 71,404 | | | $ | 111,295 | | | $ | 102,187 | |
Adjustments to reconcile net income to net cash provided by operating activities: | | | | | | | | | |
Provision for credit losses | | | 2,489 | | | | 5,234 | | | | 14,287 | |
Depreciation | | | 5,789 | | | | 5,334 | | | | 5,631 | |
Net amortization of premium and discounts on loans, securities, deposits and debt
obligations | | | 5,216 | | | | 5,677 | | | | 8,497 | |
Amortization of mortgage servicing rights, net of impairment charges/recoveries | | | 4,539 | | | | 5,113 | | | | 3,380 | |
Amortization of intangibles | | | 3,699 | | | | 4,604 | | | | 5,450 | |
Mortgage banking gain, net | | | (4,555 | ) | | | (4,429 | ) | | | (5,787 | ) |
Gain on sale of insurance agency, net | | | — | | | | (32,644 | ) | | | — | |
Loss (Gain) on sale / write-down of real estate and other assets held for sale | | | 187 | | | | 138 | | | | (58 | ) |
Gain on sale of available for sale securities | | | — | | | | (37 | ) | | | (1 | ) |
(Gain) loss on equity securities | | | (550 | ) | | | 453 | | | | 551 | |
Change in deferred taxes | | | (408 | ) | | | (2,934 | ) | | | (1,306 | ) |
Proceeds from sale of loans held for sale | | | 289,850 | | | | 255,809 | | | | 426,398 | |
Origination of loans held for sale | | | (260,657 | ) | | | (284,408 | ) | | | (377,928 | ) |
Stock based compensation expense | | | 2,664 | | | | 1,875 | | | | 2,016 | |
Restricted stock forfeits for taxes and option exercises | | | (480 | ) | | | (742 | ) | | | (334 | ) |
Income from bank owned life insurance | | | (4,901 | ) | | | (4,139 | ) | | | (3,946 | ) |
Changes in: | | | | | | | | | |
Accrued interest receivable and other assets | | | (22,850 | ) | | | (5,329 | ) | | | (8,072 | ) |
Other liabilities | | | 858 | | | | 16,465 | | | | 9,131 | |
Net cash provided by operating activities | | | 92,294 | | | | 77,335 | | | | 180,096 | |
Investing Activities | | | | | | | | | |
Proceeds from maturities, calls and paydowns of available-for-sale securities | | | 119,486 | | | | 92,683 | | | | 97,445 | |
Proceeds from sale of available-for-sale securities | | | — | | | | 25,300 | | | | 9,641 | |
Proceeds from sale of equity securities | | | 2,286 | | | | 1,606 | | | | 8,714 | |
Proceeds from sale of OREO | | | 1,336 | | | | 1,477 | | | | 638 | |
Purchases of available-for-sale securities | | | (334,475 | ) | | | (10,093 | ) | | | (122,456 | ) |
Purchases of equity securities | | | — | | | | — | | | | (3,000 | ) |
Purchases of office properties and equipment | | | (2,594 | ) | | | (7,113 | ) | | | (5,570 | ) |
Investment in bank owned life insurance | | | 526 | | | | (6,692 | ) | | | — | |
Net change in Federal Home Loan Bank stock | | | (9,825 | ) | | | 7,425 | | | | (17,600 | ) |
Net cash received in disposition (paid in acquisition) | | | — | | | | 47,354 | | | | (435 | ) |
Net decrease (increase) in loans receivable | | | 255,208 | | | | (276,597 | ) | | | (1,174,347 | ) |
Net cash provided by (used in) investing activities | | | 31,948 | | | | (124,650 | ) | | | (1,206,970 | ) |
Financing Activities | | | | | | | | | |
Net (decrease) increase in deposits and advance payments by borrowers | | | (300,206 | ) | | | 226,174 | | | | 635,080 | |
Net change in Federal Home Loan Bank advances | | | 227,000 | | | | (148,000 | ) | | | 428,000 | |
Cash dividends paid on common stock | | | (44,409 | ) | | | (44,267 | ) | | | (42,795 | ) |
Net cash paid for repurchase of common stock | | | — | | | | (11 | ) | | | (26,870 | ) |
Proceeds from exercise of stock options | | | 106 | | | | 15 | | | | 53 | |
Net cash (used in) provided by financing activities | | | (117,509 | ) | | | 33,911 | | | | 993,468 | |
Increase (decrease) in cash and cash equivalents | | | 6,733 | | | | (13,404 | ) | | | (33,406 | ) |
Cash and cash equivalents at beginning of period | | | 114,756 | | | | 128,160 | | | | 161,566 | |
Cash and cash equivalents at end of period | | $ | 121,489 | | | $ | 114,756 | | | $ | 128,160 | |
Supplemental cash flow information: | | | | | | | | | |
Interest paid | | $ | 196,316 | | | $ | 135,924 | | | $ | 32,730 | |
Income taxes paid | | | 13,649 | | | | 27,823 | | | | 17,540 | |
Transfers from loans to other real estate owned and other assets held for sale | | | — | | | | — | | | | — | |
Initial recognition of right-of-use asset | | | 9,928 | | | | 804 | | | | 680 | |
Initial recognition of lease liability | | | 9,928 | | | | 804 | | | | 680 | |
See accompanying notes.
Notes to the Consolidated Financial Statements
Premier Financial Corp. (“Premier” or the “Company”) is a financial holding company for its wholly-owned subsidiaries, Premier Bank (the "Bank"), and PFC Capital, LLC (“PFC Capital”). All significant intercompany transactions and balances are eliminated in consolidation. Premier’s stock is traded on the NASDAQ Global Select Market under the ticker PFC. On July 26, 2024, Premier and Wesbanco announced the signing of the definitive Merger Agreement under which Premier will merge into Wesbanco in a stock-for-stock transaction. Refer to Note 25.
The Bank is primarily engaged in community banking. It attracts deposits from the general public through its offices and website, and uses those and other available sources of funds to originate residential real estate loans, commercial real estate loans, commercial loans, home improvement and home equity loans and consumer loans. In addition, the Bank invests in U.S. Treasury and federal government agency obligations, obligations of states and political subdivisions, mortgage-backed securities ("MBS") that are issued by federal agencies, including real estate mortgage investment conduits (“REMICs”) and residential collateralized mortgage obligations (“CMOs”), and corporate bonds. The Bank’s deposits are insured by the Federal Deposit Insurance Corporation (“FDIC”). The Bank is a member of the Federal Home Loan Bank (“FHLB”) System.
PFC Capital was formed as an Ohio limited liability company in 2016 for the purpose of providing mezzanine funding for customers. Mezzanine loans are offered by PFC Capital to customers in the Company’s market area and are expected to be repaid from the cash flow from operations of the business.
First Insurance Group of the Midwest, Inc. ("First Insurance") is a wholly-owned subsidiary of Premier that conducted business as an insurance agency throughout Premier’s markets. First Insurance offered property and casualty insurance, life insurance and group health insurance. On June 30, 2023, the Company completed the sale of substantially all of the assets (including $24.7 million of goodwill and intangibles) of First Insurance to Risk Strategies Corporation (“Buyer”). Consideration included a combination of cash and a subordinated note resulting in net cash received of $47.4 million after certain transaction costs at closing, the assumption of certain leases, and contingent consideration subject to certain performance criteria by the Buyer to be determined after the year ended December 31, 2026. The Company recorded a pre-tax gain on sale of $36.3 million, transaction costs of $3.7 million and taxes of $8.5 million for a $24.1 million increase to equity in 2023.
Due to sustained inflation and elevated interest rates, business and consumer customers of the Bank are experiencing varying degrees of financial distress, which is expected to continue over the coming months and will likely adversely affect their ability to pay interest and principal on their loans. Further, value of the collateral securing their obligations may decline. These uncertainties may negatively impact the Statement of Financial Condition, the Statement of Income and the Statement of Cash Flows of the Company.
2.Statement of Accounting Policies
The preparation of consolidated financial statements in conformity with accounting principles generally accepted in the United States of America (“GAAP”) requires management to make estimates and assumptions that affect the amounts reported in the consolidated financial statements and accompanying notes. These estimates and assumptions affect the amounts reported in the financial statements and the disclosures provided, and actual results could differ.
Earnings Per Common Share
Basic earnings per common share is computed by dividing net income applicable to common shares (net income less dividend requirements for preferred stock, accretion of preferred stock discount and redemption of preferred stock) by the weighted average number of shares of common stock outstanding during the period. All outstanding unvested share-based payment awards that contain rights to nonforfeitable dividends are considered participating securities for the calculation. Diluted earnings per common share includes the dilutive effect of additional potential common shares issuable under stock options, warrants, restricted stock awards and stock grants. See also Note 3.
Comprehensive income consists of net income and other comprehensive income (loss). Other comprehensive income (loss) includes unrealized gains and losses on available-for-sale securities, unrealized gains and losses on cash flow hedges and the net unrecognized actuarial losses and unrecognized prior service costs associated with the Company’s Defined Benefit Postretirement Medical Plan. All items included in other comprehensive income are reported net of tax. See also Notes 4, 15 and 24 and the Consolidated Statements of Comprehensive Income.
Cash Flows
For purposes of the statement of Cash flows, Premier considers all highly liquid investments with a term of three months or less to be cash equivalents. Net cash flows are reported for loan and deposit transactions, interest-bearing deposits in other financial institutions and repurchase agreements.
Investment Securities
Securities are classified as held-to-maturity when Premier has the positive intent and ability to hold the securities to maturity and are reported at amortized cost, adjusted for premiums and discounts that are recognized in interest income using the interest method over the period to maturity. In addition, Premier may purchase equity securities for its portfolio. Equity securities are a separate category of investments as changes in market value must be run through earnings as a gain (loss) on equity securities.
Securities available‑for‑sale consists of those securities which might be sold prior to maturity due to changes in interest rates, prepayment risks, yield and availability of alternative investments, liquidity needs or other factors. Available-for-sale securities are stated at fair value, with the unrealized gains and losses, net of tax, reported in other comprehensive income (loss) until realized. Realized gains and losses are included in gains (losses) on securities or other-than-temporary impairment losses on securities. Realized gains and losses on securities sold are recognized on the trade date based on the specific identification method.
Interest income includes amortization of purchase premiums and discounts. Premiums and discounts are amortized on the level-yield method without anticipating prepayments, except for mortgage-backed securities where prepayments are expected.
Quarterly, the Company evaluates if any security has a fair value less than its amortized cost. Once these securities are identified, in order to determine whether a decline in fair value resulted from a credit loss or other factors, the Company performs further analysis. See to Footnote 4 - Investment Securities for further discussion.
These securities are reported at fair value utilizing Level 1 inputs where the Company obtains fair value measurement from a broker.
The Bank is a member of the FHLB system. Members are required to own a certain amount of stock based on the level of borrowings and other factors. FHLB stock is carried at cost, classified as a restricted security, and periodically evaluated for impairment based on ultimate recovery of par value. Both cash and stock dividends are reported as income. At December 31, 2024 and 2023, the Company held $31.6 million and $21.8 million, respectively, at the FHLB of Cincinnati.
Loans Receivable
Loans that management has the intent and ability to hold for the foreseeable future or until maturity or payoff are reported at the principal amount outstanding, net of deferred loan fees and costs, purchase premiums and discounts and the allowance for credit losses. Deferred fees net of deferred incremental loan origination costs, are amortized to interest income generally over the contractual life of the loan using the interest method without anticipating prepayments. The recorded investment in loans includes accrued interest receivable, unamortized premiums and discounts, and net deferred fees and costs and undisbursed loan amounts.
Mortgage loans originated and intended for sale in the secondary market are classified as loans held for sale and are carried at fair value, as determined by market pricing from investors. Net unrealized gains and losses are recorded as a part of mortgage banking income on the Consolidated Statement of Income. Mortgage loans held for sale are generally sold with servicing rights retained. The carrying value of mortgage loans sold is reduced by the amount allocated to the servicing right. Gains or losses on sales of mortgage loans are based on the difference between the selling price and the carrying value of the related loan sold.
The Company may incur losses pertaining to loans sold to Fannie Mae and Freddie Mac but repurchased due to underwriting issues. Repurchase losses are recognized when the Company determines they are probable and estimable.
Interest receivable is accrued on loans and credited to income as earned. The accrual of interest on loans 90 days delinquent or those loans individually analyzed is discontinued when, in management’s opinion, the borrower may be unable to meet payments as they become due. For these loans, interest accrual is only to the extent cash payments are received. The accrual of interest on these loans is generally resumed after a pattern of repayment has been established and the collection of principal and interest is reasonably assured.
Purchased Credit Deteriorated (“PCD”) Loans
The Company acquires loans individually and in groups or portfolios. At acquisition, the Company reviews each loan to determine whether there is evidence of more than insignificant deterioration of credit quality since origination. The Company determines whether each such loan is to be accounted for individually or whether such loans will be assembled into pools of loans based on common risk characteristics (loan type and date of origination).
PCD loans acquired in a transaction are marked to fair value and a mark on yield is recorded. In addition, an adjustment is made to the ACL for the expected loss on the acquisition date. These loans are assessed on a regular basis and subsequent adjustments to the ACL are recorded on the income statement.
Allowance for credit losses
Loans that management has the intent and ability to hold for the foreseeable future or until maturity or payoff are reported at amortized cost. Amortized cost is the principal balance outstanding, net of purchase premiums and discounts, adjustments, and deferred loan fees and costs. Accrued interest receivable is excluded from the estimate of credit losses.
Management estimates the allowance balance using relevant available information, from internal and external sources, relating to past events, current conditions, and reasonable and supportable forecasts. Historical credit loss experience provides the basis for the estimation of expected credit losses. Adjustments to historical loss information are made for differences in current loan-specific risk characteristics such as differences in underwriting standards, portfolio mix, delinquency level, nature or volume of the Company’s financial assets, changes in experience in staff, as well as changes in environmental conditions, such as changes in unemployment rates, property values and other external factors, such as regulatory, legal and technological environments.
The allowance for credit losses is measured on a collective pool basis when similar risk characteristics exist. Loans that do not share risk characteristics are evaluated on an individual basis and are not included in the collective evaluation. A loan is individually analyzed when, based on current information and events, it is probable that the Company will be unable to collect all amounts due according to the contractual terms of the loans agreement. The Company analyzes all substandard, doubtful and loss graded loans quarterly and make judgments about the risk of loss based on the cash flow of the borrower, the value of the collateral and the financial strength of the guarantors. When a loan is considered individually analyzed, an analysis of the net present value of estimated cash flows is performed and an allowance may be established based on the outcome of that analysis, or if the loan is deemed to be collateral dependent an allowance is established based on the fair value of collateral. If a loan is individually analyzed, a portion of the allowance is allocated so that the loan is reported net of the allowance allocation which is determined based on the present value of estimated future cash flows using the loan’s existing rate or at the fair value of collateral if repayment is expected solely from the collateral. Large groups of smaller balance homogeneous loans, such as consumer and residential real estate loans, are collectively evaluated, and accordingly, they are not separately identified for disclosure.
The Company estimates expected credit losses for off-balance sheet credit exposures over the contractual period in which the Company is exposed to credit risk via a contractual obligation to extend credit, unless that obligation is unconditionally cancellable by the Company. Adjustments to the allowance for off-balance sheet credit losses run through expense. The estimate includes consideration of the likelihood that funding will occur and an estimate of expected credit losses on commitments expected to be funded over its estimated life.
Servicing Rights
Servicing rights are recognized separately when they are acquired through sales of loans. Servicing rights are initially recorded at fair value with the income statement effect recorded in gains on sales of loans. Fair value is based on market prices for comparable mortgage servicing contracts, when available, or alternatively, is based on a valuation model that calculates the present value of estimated future net servicing income. The valuation model incorporates assumptions that market participants would use in estimating future net servicing income, such as the cost to service, the discount rate, the custodial earnings rate, an inflation rate, ancillary income, prepayment speeds and default rates and losses. The Company compares the valuation model inputs and results to published industry data in order to validate the model results and assumptions. All classes of servicing assets are subsequently measured using the amortization method which requires servicing rights to be amortized into noninterest income in proportion to, and over the period of, the estimated future net servicing income of the underlying loans, driven, generally, by changes in market interest rates.
Servicing assets are evaluated for impairment based upon the fair value of the rights as compared to carrying amount. Impairment is determined by stratifying rights into groupings based on predominant risk characteristics, such as interest rate, loan type, loan terms, year of origination and investor type. Impairment is recognized through a valuation allowance for an individual grouping, to the extent that fair value is less than the carrying amount. If the Company later determines that all or a portion of the impairment no longer exists for a particular grouping, a reduction of the allowance may be recorded as an increase to income. Changes in valuation allowances are reported within mortgage banking income on the income statement. The fair values of servicing rights are subject to significant fluctuations as a result of changes in estimated and actual prepayment speeds and default rates and losses.
Servicing fee income, which is reported on the income statement with mortgage banking income, is recorded for fees earned for servicing loans. The fees are based on a contractual percentage of the outstanding principal, or a fixed amount per loan, and are recorded as income when earned. The amortization of mortgage servicing rights is netted against loan servicing fee income. Servicing fees totaled $7.3 million, $7.4 million and $7.5 million for the years ended December 31, 2024, 2023 and 2022, respectively. Late fees and ancillary fees related to loan servicing are not material. See Note 7.
Bank Owned Life Insurance
The Company has purchased life insurance policies for certain key employees. Bank owned life insurance is recorded at the amount that can be realized under the insurance contract at the balance sheet date, which is the cash surrender value adjusted for other charges or other amounts due that are probable at settlement.
Premises and Equipment and Long Lived Assets
Land is carried at cost. Premises and equipment are carried at cost less accumulated depreciation and amortization computed principally by the straight-line method over the following estimated useful lives:
| | |
Buildings and improvements | | 20 to 50 years |
Furniture, fixtures and equipment | | 3 to 15 years |
Long-lived assets to be held and those to be disposed of and certain intangibles are periodically evaluated for impairment. See Note 8.
Goodwill and Other Intangibles
Goodwill resulting from business combinations after January 1, 2009, is generally determined as the excess of the fair value of the consideration transferred, plus the fair value of any non-controlling interests in the acquiree, over the fair value of the net assets acquired and liabilities assumed as of the acquisition date. Goodwill and intangible assets acquired in a purchase business combination and determined to have an indefinite useful life are not amortized, but tested for impairment at least annually. The Company tests goodwill at least annually and, more frequently, if events or changes in circumstances indicate that it may be more likely than not that there is a possible impairment. Due to the Company’s signing of the definitive agreement for the merger transaction with Wesbanco, the Company conducted a quantitative interim goodwill impairment assessment at September 30, 2024. Intangible assets with finite useful lives are amortized over their estimated useful lives to their estimated residual values. Goodwill is the only intangible asset with an indefinite life on Premier’s balance sheet.
Other intangible assets consist of core deposit and acquired customer relationship intangible assets arising from whole bank and branch acquisitions, as well as, wealth management and insurance agency acquisitions. They are initially recorded at fair value and then amortized on an accelerated basis over their estimated lives, which range from five years for non-compete agreements to 10 years for core deposit and customer relationship intangibles. See Note 9.
Real Estate and Other Assets Held for Sale
Real estate and other assets held for sale are comprised of properties or other assets acquired through foreclosure proceedings or acceptance of a deed in lieu of foreclosure. These assets are initially recorded at fair value less costs to sell when acquired, establishing a new cost basis. Losses arising from the acquisition of such property are charged against the allowance for credit losses at the time of acquisition. These properties are carried at the lower of cost or fair value, less estimated costs to dispose. If fair value declines subsequent to foreclosure, the property is written down against expense. Costs after acquisition are expensed.
Stock Compensation Plans
Compensation cost is recognized for stock options and restricted share awards issued to employees and directors, based on the fair value of these awards at the date of grant. A Black-Scholes model is utilized to estimate the fair value of stock options. Restricted shares awards are valued at the market value of Company stock at the date of the grant. Compensation cost is recognized over the required service period, generally defined as the vesting period. For awards with graded vesting, compensation cost is recognized on a straight-line basis over the requisite service period for the entire award. See Note 19.
Fair Value of Financial Instruments
Fair values of financial instruments are estimated using relevant market information and other assumptions, as more fully disclosed in Note 21. Fair value estimates involve uncertainties and matters of significant judgment regarding interest rates, credit risk, prepayments, and other factors, especially in the absence of broad markets for particular items. Changes in assumptions or in market conditions could significantly affect the estimates.
Transfers of Financial Assets
Transfers of financial assets are accounted for as sales, when control over the assets has been relinquished. Control over transferred assets is deemed to be surrendered when the assets have been isolated from the Company, the transferee obtains the right (free of conditions that constrain it from taking advantage of that right) to pledge or exchange the transferred assets and the Company does not maintain effective control over the transferred assets through an agreement to repurchase them before their maturity.
Mortgage Banking Derivatives
Commitments to fund mortgage loans (interest rate locks) to be sold into the secondary market and forward commitments for the future delivery of these mortgage loans are accounted for as free standing derivatives. Fair values of these mortgage derivatives are estimated based on changes in mortgage interest rates from the date the interest on the loan is locked. The Company enters into forward
commitments for the future delivery of mortgage loans when interest rate locks are entered into, in order to hedge the change in interest rates resulting from its commitments to fund the loans. Changes in fair values of these derivatives are included in mortgage banking income.
Interest Rate Swaps
The Company periodically enters into interest rate swap agreements with its commercial customers who desire a fixed rate loan term that is longer than the Company is willing to extend. The Company then enters into a reciprocal swap agreement with a third party that offsets the interest rate risk from the interest rate swap extended to the customer. The interest rate swaps are derivative instruments which are carried at fair value on the statement of financial condition. The Company uses an independent third party to perform a market valuation analysis for both swap positions.
The Company also enters into cash flow hedge derivative instruments to hedge the risk of variability in cash flows (future interest payments) attributable to changes in contractually specified SOFR benchmark interest rate on the Company's floating rate loan pool. the Company uses an independent third party to perform a market valuation analysis for the derivatives.
The Company may also periodically enter into derivatives contracts to hedge the risk of variability from changes in interest rates on the cash flows from and/or the fair value of certain Company assets and/or liabilities. The change in fair value of hedges designated as cash flow hedges are recorded to other comprehensive income while any changes in the fair value of hedges designated as fair value hedges are generally offset by the changes in valuation of the corresponding hedged item(s). The Company uses independent third parties to perform market valuation analysis, effectiveness testing, etc. for these derivatives.
Management considers the following factors in determining the need to disclose separate operating segments: (1) the nature of products and services, which are all financial in nature; (2) the type and class of customer for the products and services; in Premier’s case retail customers for retail bank and insurance products and commercial customers for commercial loan, deposit, life, health and property and casualty insurance needs; (3) the methods used to distribute products or provide services; such services are delivered through banking offices through bank customer contact representatives. Retail and commercial customers are frequently targets for banking; (4) the nature of the regulatory environment; the banking entity is subject to regulatory bodies and a number of specific regulations. Discrete financial information is not available other than on a Company-wide basis. Accordingly, all of the financial service operations are considered by management to be aggregated in one reportable segment.
Dividend Restriction
Banking regulations require maintaining certain capital levels and may limit the dividends paid by the Bank to Premier. See Note 16 for further details on restrictions.
Loan Commitments and Related Financial Instruments
Financial instruments include off‑balance sheet credit instruments, such as commitments to make loans and commercial letters of credit, issued to meet customer financing needs. The face amount for these items represents the exposure to loss, before considering customer collateral or ability to repay. Such financial instruments are recorded when they are funded.
Loss Contingencies
Loss contingencies, including claims and legal actions arising in the ordinary course of business, are recorded as liabilities when the likelihood of loss is probable and an amount or range of loss can be reasonably estimated. Management does not believe there are any such matters that will have a material effect on the financial statements.
Income Taxes
Income tax expense is the total of the current year income tax due or refundable and the change in deferred tax assets and liabilities. Deferred tax assets and liabilities are the expected future tax amounts for the temporary differences between carrying amounts and tax bases of assets and liabilities, computed using enacted tax rates. A valuation allowance, if needed, reduces deferred tax assets to the amount expected to be realized. Realization of deferred tax assets is dependent upon the generation of a sufficient level of future taxable income and recoverable taxes paid in prior years. Although realization is not assured, management believes it is more likely than not that all of the deferred tax assets will be realized. The Company recognizes interest and/or penalties related to income tax matters in income tax expense.
An effective tax rate of 21% is used to determine after-tax components of other comprehensive income (loss) included in the statement of change in stockholders’ equity. See Note 17.
A tax position is recognized as a benefit only if it is “more likely than not” that the tax position would be sustained in a tax examination, with a tax examination being presumed to occur. The amount recognized is the largest amount of tax benefit that is greater than 50% likely of being realized on examination. For tax positions not meeting the “more likely than not” test, no tax benefit is recorded.
Retirement Plans
Pension expense is the net of service and interest cost, return on plan assets and amortization of gains and losses not immediately recognized. Employee 401(k) plan expense is the amount of matching contributions. Deferred compensation and supplemental retirement plan expense allocates the benefits over years of service. See Notes 15 and 18.
Revenue Recognition
ASC 606, Revenue from Contracts with Customers (“ASC 606”), establishes principles for reporting information about the nature, amount, timing and uncertainty of revenue and cash flows arising from the entity's contracts to provide goods or services to customers. The core principle requires an entity to recognize revenue to depict the transfer of goods or services to customers in an amount that reflects the consideration that it expects to be entitled to receive in exchange for those goods or services recognized as performance obligations are satisfied.
The majority of the Company’s revenue-generating transactions are not subject to ASC 606, including revenue generated from financial instruments, such as loans, letters of credit, and investment securities, as well as revenue related to mortgage servicing activities, as these activities are subject to other GAAP discussed elsewhere within the Company’s disclosures. Descriptions of the Company’s revenue-generating activities that are within the scope of ASC 606, which are presented in the Company’s statement of income as components of noninterest income are as follows:
•Service charges on deposit accounts - these represent general service fees for monthly account maintenance and activity or transaction-based fees and consist of transaction-based revenue, time-based revenue (service period), item-based revenue or some other individual attribute-based revenue. Revenue is recognized when our performance obligation is completed which is generally monthly for account maintenance services or when a transaction has been completed (such as a wire transfer). Payment for such performance obligations are generally received at the time the performance obligations are satisfied. Service charges on deposit accounts that are within the scope of ASC 606 were $14.0 million in 2024, $13.3 million in 2023 and $12.8 million in 2022. Income from services charges on deposit accounts is included in service fees and other charges in noninterest income.
•Interchange income - this represents fees earned from debit and credit cardholder transactions. Interchange fees from cardholder transactions represent a percentage of the underlying transaction value and are recognized daily, concurrent with the transaction processing services provided to the cardholder. Interchange fees were $10.8 million in 2024, $11.1 million in 2023 and $10.8 million in 2022, which are reported net of network related charges. Interchange income is included in service fees and other charges in noninterest income.
•Wealth management income - this represents monthly fees due from wealth management customers as consideration for managing the customers’ assets. Wealth management and trust services include custody of assets, investment management, escrow services, and fees for trust services and similar fiduciary activities. Revenue is recognized when our performance obligation is completed each month, which is generally the time that payment is received. Also included are fees received from a third party broker-dealer as part of a revenue-sharing agreement for fees earned from customers that we refer to the third party. These fees are paid to us by the third party on a quarterly basis and recognized ratably throughout the quarter as our performance obligation is satisfied. Revenues from wealth management were $7.4 million, $6.3 million and $5.8 million in 2024, 2023 and 2022, respectively, and are included in in total noninterest income.
•Gain/loss on sales of other real estate owned (“OREO”) - the Company records a gain or loss from the sale of OREO when control of the property transfers to the buyer, which generally occurs at the time of an executed deed. When the Company finances the sale of OREO to the buyer, the Company assesses whether the buyer is committed to perform their obligations under the contract and whether collectability of the transaction price is probable. Once these criteria are met, the OREO asset is derecognized and the gain or loss on sale is recorded upon the transfer of control of the property to the buyer. In determining the gain or loss on the sale, the Company adjusts the transaction price and related gain or loss on sale if a significant financing component is present. Income from the gain/loss on sales of OREO were (loss) gains of $(95,000), $(118,000) and $66,000 in 2024, 2023 and 2022, respectively. Income from the gain or loss on sales of OREO is included in total noninterest income.
•Insurance commissions - this represents new commissions that were recognized when the Company sold insurance policies to customers. The Company was also entitled to renewal commissions and, in some cases, contingent commissions in the form of profit sharing which were recognized in subsequent periods. The initial commission was recognized when the insurance policy was sold to a customer. Renewal commission was variable consideration and was recognized in subsequent periods when the uncertainty around variable consideration was subsequently resolved (e.g., when customer renewed the policy). Contingent commission was also a variable consideration that was not recognized until the variability surrounding realization of revenue was resolved. Another source of variability was the ability of the policy holder to cancel the policy anytime and in such cases, the Company could be required, under the terms of the contract, to return part of the commission received. The variability related to cancellation of the policy was not deemed significant and thus, did not impact the amount of revenue recognized. In the event the policyholder chose to cancel the policy at any time, the revenue for amounts which qualified for claw-back were reversed in the period the cancellation occurred. Management viewed the income sources from
insurance commissions in two categories: (i) new/renewal commissions and (ii) contingent commissions. There were no insurance commissions in 2024 and in 2023, insurance commissions were only recognized through the first six months of the year as a result of the sale of First Insurance in June 2023. In 2023, insurance commissions were $8.8 million, of which $8.0 million were new/renewal commissions and $867,000 were contingent commissions. In 2022, insurance commissions were $16.2 million, of which $15.0 million were new/renewal commission and $1.2 million were contingent commissions.
Leases
Leases are classified as operating or finance leases at the commencement date. The Company leases certain locations and equipment. Premier records leases on the balance sheet in the form of a lease liability for the present value of future minimum payments under the lease terms as a right-of-use asset equal to the lease liability adjusted for items such as deferred or prepaid rent, lease incentive and any impairment of the right-of-use asset. The discount rate used in determining the lease liability is based upon the incremental borrowing rate the Company could obtain on the commencement or renewal date. The Company has elected to account for lease and related non-lease components as a single lease component. The Company also elected to not recognize right-of-use assets and lease liabilities arising from short-term leases, which are twelve months or less. See additional disclosures in Note 8.
Accounting Standards Updates
ASU No. 2020-04: Reference Rate Reform – Facilitation of the Effects of Reference Rate Reform on Financial Reporting (Topic 848): On March 12, 2020, the FASB issued Accounting Standards Update (ASU) 2020-4, "Reference Rate Reform (“ASC 848”): Facilitation of the Effects of Reference Rate Reform on Financial Reporting." ASC 848 contained optional expedients and exceptions for applying generally accepted accounting principles to contract modifications and hedging relationships, subject to meeting certain criteria, that referenced LIBOR or another reference rates expected to be discontinued. The Company formed a cross-functional project team to lead the transition from LIBOR to adoption of alternative reference rates which included Secured Overnight Financing Rate (“SOFR”). The Company identified outstanding loans with LIBOR-based rates and obtained updated reference rate language either at the time of renewal or through separate amendment, or otherwise established that an alternate reference rate would apply after June 30, 2023. Additionally, management utilized the timeline guidance published by the Alternative Reference Rates Committee to develop and achieve internal milestones during the transitional period. The Company adhered to the International Swaps and Derivatives Association 2020 IBOR Fallbacks Protocol that was released on October 23, 2020. The Company discontinued the use of new LIBOR-based loans by December 31, 2021, according to regulatory guidelines. On December 21, 2022, the FASB issued ASU 2022-06, "Reference Rare Reform (Topic 848): Deferral of the Sunset of Date of Topic 848," which extended the sunset date of ASC Topic 848, "Reference Rate Reform," to December 31, 2024.
ASU No. 2022-02, Troubled Debt Restructurings and Vintage Disclosures: On March 30, 2022, the FASB issued ASU 2022-02, "Troubled Debt Restructurings and Vintage Disclosures" which eliminated troubled debt restructuring ("TDR") accounting for entities that have adopted ASU 2016-13, the current expected credit loss ("CECL") model and added new vintage disclosures for gross write-offs. The elimination of TDR accounting could be adopted either prospectively for loan modifications or on a modified retrospective basis that could result in a cumulative effect adjustment to retained earnings in the period of adoption. The Company adopted ASU 2022-02 on January 1, 2023 on a modified retrospective basis. The adoption of this guidance did not have a material impact on the Company's consolidated financial statements.
ASU No. 2023-06, Disclosure Improvements – Codification Amendments in Response to the SEC’s Disclosure Update and Simplification Initiative: On October 9, 2023, the FASB issued ASU 2023-06 “Disclosure Improvements: Codification Amendments in Response to the SEC’s Disclosure Update and Simplification Initiative,” which incorporates 14 of the 27 disclosures referred by the SEC in Release No. 33-10532, “Disclosure Update and Simplification,” that was issued Aug. 17, 2018. The changes modify the disclosure or presentation requirements of a variety of topics including statement of cash flows, accounting changes and error corrections, earnings per share, interim reporting, commitments, debt, equity, derivatives and hedging, and secured borrowing and collateral. For entities subject to the SEC’s existing disclosure requirements and for entities required to file or furnish financial statements with or to the SEC in preparation for the sale of or for purposes of issuing securities that are not subject to contractual restrictions on transfer, the effective date for each amendment is the date on which the SEC removes that related disclosure from its rules. For all other entities, the amendments will be effective two years later. If the SEC has not removed the related disclosure from its regulations by June 30, 2027, the amendments will be removed from the codification and not become effective for any entity. This Update is not expected to have a material effect on the Company’s consolidated financial statements.
ASU No. 2023-07, Segment Reporting (Topic 280) – Improvements to Reportable Segment Disclosures: On November 27, 2023, the FASB issued ASU 2023-07 “Segment Reporting (Topic 820): Improvements to Reportable Segment Disclosure,” which requires public entities to disclose significant expense categories and amounts for each reportable segment, an amount for and description of the composition of “other segment items,” the title and position of the entity’s CODM and explanation of how the CODM uses the reported measures of profit or loss to assess segment performance, and – on an interim basis – certain segment-related disclosures that previously were required only on an annual basis. This Update clarifies that entities with a single reportable segment are subject to both new and existing segment reporting requirements and that an entity is permitted to disclose multiple measures of segment profit or loss, provided that certain criteria are met. The amendments are effective for fiscal years beginning after December 15, 2023, and interim periods within fiscal years beginning after December 15, 2024, with early adoption permitted. Entities must adopt the changes to the segment
reporting guidance on a retrospective basis. This update did not have a material effect on the Company’s consolidated financial statements.
ASU No. 2023-09, Income Taxes (Topic 740) – Improvements to Income Tax Disclosures: On December 14, 2023, the FASB issued ASU 2023-09 “Income Taxes (Topic 740): Improvements to Income Tax Disclosures,” to address requests for improved income tax disclosures from investors, lenders, creditors and other allocators of capital that use the financial statements to make capital allocation decisions. The Update is intended to improve the transparency of tax disclosures by requiring (1) consistent categories and greater disaggregation of information in the rate reconciliation and (2) income taxes paid disaggregated by jurisdiction, in addition to certain other amendments intended to improve the effectiveness of income tax disclosures. For public business entities, the Update is effective for annual periods beginning after December 15, 2024. For other entities, the Update is effective for annual periods beginning after December 15, 2025. Early adoption is permitted for annual financial statements that have not yet been issued or made available for issuance. This Update is not expected to have a material effect on the Company’s consolidated financial statements.
SEC Final Rules Not Yet Adopted
The Enhancement and Standardization of Climate-Related Disclosures for Investors: On March 6,2024, the SEC approved the final rule for these disclosures, requiring registrants to provide information about climate-related risks that materially impact or are reasonably likely to materially impact a registrant's strategy,results of operations, or financial condition. The rule applies to all SEC reporting companies and may significantly increase reporting costs and complexities, including increased data collection and development of significant internal processes and controls. The final rule includes a phased-in compliance period, effective for the Company for the fiscal year ending December 31, 2025. On March 15, 2024, the U.S. Court of Appeals granted an administrative stay of the climate-related disclosure rules recently adopted by the SEC.
3.Earnings Per Common Share
Basic earnings per share is calculated using the two-class method. The two-class method is an earnings allocation formula under which earnings per share is calculated from common stock and participating securities according to dividends declared and participation rights in undistributed earnings. Under this method, all earnings distributed and undistributed, are allocated to participating securities and common shares based on their respective rights to receive dividends. Unvested share-based payment awards that contain non-forfeitable rights to dividends are considered participating securities (i.e. unvested restricted stock), not subject to performance based measures.
The following table sets forth the computation of basic and diluted earnings per common share for the years ended December 31:
| | | | | | | | | | | | |
| | 2024 | | | 2023 | | | 2022 | |
| | (In Thousands, Except Per Share Amounts) | |
Basic Earnings Per Share: | | | | | | | | | |
Net income available to common shareholders | | $ | 71,404 | | | $ | 111,295 | | | $ | 102,187 | |
Less: Income allocated to participating securities | | | 371 | | | | 178 | | | | 103 | |
Net income allocated to common shareholders | | $ | 71,033 | | | $ | 111,117 | | | $ | 102,084 | |
Weighted average common shares outstanding Including participating
securities | | | 35,865 | | | | 35,750 | | | | 35,715 | |
Less: Participating securities | | | 186 | | | | 57 | | | | 36 | |
Average common shares | | | 35,679 | | | | 35,693 | | | | 35,679 | |
Basic earnings per common share | | $ | 1.99 | | | $ | 3.11 | | | $ | 2.86 | |
Diluted Earnings Per Share: | | | | | | | | | |
Net income allocated to common shareholders | | $ | 71,033 | | | $ | 111,117 | | | $ | 102,084 | |
Weighted average common shares outstanding for basic earnings per
common share | | | 35,679 | | | | 35,693 | | | | 35,679 | |
Add: Dilutive effects of stock options and restricted stock units | | | 167 | | | | 88 | | | | 130 | |
Average shares and dilutive potential common shares | | | 35,846 | | | | 35,781 | | | | 35,809 | |
Diluted earnings per common share | | $ | 1.98 | | | $ | 3.11 | | | $ | 2.85 | |
Shares subject to issue upon exercise of options and vesting requirements of restricted stock units of 32,897 in 2024, 110,233 in 2023 and 37,910 in 2022 were excluded from the diluted earnings per common share calculation as they were anti-dilutive.
The following tables summarize the amortized cost and fair value of available-for-sale securities at December 31, 2024 and 2023, and the corresponding amounts of gross unrealized and unrecognized gains and losses:
| | | | | | | | | | | | | | | | |
| | | | | Gross | | | Gross | | | | |
| | Amortized | | | Unrealized | | | Unrealized | | | Fair | |
| | Cost | | | Gains | | | Losses | | | Value | |
| | (In Thousands) | |
2024 | | | | | | | | | | | | |
Available-for-sale securities: | | | | | | | | | | | | |
Obligations of U.S. government corporations and agencies | | $ | 117,643 | | | $ | — | | | $ | (18,741 | ) | | $ | 98,902 | |
Mortgage-backed securities | | | 195,993 | | | | — | | | | (31,067 | ) | | | 164,926 | |
Collateralized mortgage obligations | | | 378,440 | | | | 398 | | | | (50,095 | ) | | | 328,743 | |
Asset-backed securities | | | 255,048 | | | | 205 | | | | (4,353 | ) | | | 250,900 | |
Corporate bonds | | | 70,784 | | | | — | | | | (5,039 | ) | | | 65,745 | |
Obligations of states and political subdivisions | | | 244,674 | | | | 2 | | | | (46,234 | ) | | | 198,442 | |
US Treasuries | | | 55,476 | | | | — | | | | (6,566 | ) | | | 48,910 | |
Total Available-for-sale securities | | $ | 1,318,058 | | | $ | 605 | | | $ | (162,095 | ) | | $ | 1,156,568 | |
| | | | | | | | | | | | | | | | |
| | | | | Gross | | | Gross | | | | |
| | Amortized | | | Unrealized | | | Unrealized | | | Fair | |
| | Cost | | | Gains | | | Losses | | | Value | |
| | (In Thousands) | |
2023 | | | | | | | | | | | | |
Available-for-sale securities: | | | | | | | | | | | | |
Obligations of U.S. government corporations and agencies | | $ | 120,398 | | | $ | — | | | $ | (18,800 | ) | | $ | 101,598 | |
Mortgage-backed securities | | | 185,675 | | | | — | | | | (29,167 | ) | | | 156,508 | |
Collateralized mortgage obligations | | | 285,194 | | | | 9 | | | | (49,436 | ) | | | 235,767 | |
Asset-backed securities | | | 142,215 | | | | 270 | | | | (5,505 | ) | | | 136,980 | |
Corporate bonds | | | 71,092 | | | | — | | | | (8,672 | ) | | | 62,420 | |
Obligations of states and political subdivisions | | | 247,204 | | | | 15 | | | | (42,961 | ) | | | 204,258 | |
US Treasuries | | | 55,732 | | | | — | | | | (6,555 | ) | | | 49,177 | |
Total Available-for-sale securities | | $ | 1,107,510 | | | $ | 294 | | | $ | (161,096 | ) | | $ | 946,708 | |
The amortized cost and fair value of the investment securities portfolio at December 31, 2024, is shown below by contractual maturity. Expected maturities will differ from contractual maturities if borrowers have the right to call or prepay obligations with or without call or prepayment penalties. For purposes of the maturity tables below, mortgage-backed securities, collateralized mortgage obligations, and asset-backed securities which are not due at a single maturity date, have not been allocated over maturity groupings.
| | | | | | | | |
| | Available-for-Sale | |
| | Amortized | | | Fair | |
| | Cost | | | Value | |
| | (In Thousands) | |
Available-for-sale securities: | | | | | | |
Due in one year or less | | $ | 10,564 | | | $ | 10,395 | |
Due after one year through five years | | | 75,043 | | | | 70,022 | |
Due after five years through ten years | | | 222,626 | | | | 193,667 | |
Due after ten years | | | 180,344 | | | | 137,915 | |
MBS/CMO/ABS | | | 829,481 | | | | 744,569 | |
Total | | $ | 1,318,058 | | | $ | 1,156,568 | |
Securities pledged at year-end 2024 and 2023 had a carrying amount of $595.5 million and $638.2 million, respectively, and were pledged against unrealized losses on balance sheet and mortgage hedges, and to secure public deposits and Federal Reserve Bank Discount Window capacity.
The following table summarizes Premier’s securities that were in an unrealized loss position at December 31, 2024, and December 31, 2023:
| | | | | | | | | | | | | | | | | | | | | | | | |
| | Duration of Unrealized Loss Position | | | | | | | |
| | Less than 12 Months | | | 12 Months or Longer | | | Total | |
| | | | | Gross | | | | | | Gross | | | | | | | |
| | Fair | | | Unrealized | | | Fair | | | Unrealized | | | Fair | | | Unrealized | |
| | Value | | | Loss | | | Value | | | Loss | | | Value | | | Losses | |
| | (In Thousands) | |
At December 31, 2024 | | | | | | | | | | | | | | | | | | |
Available-for-sale securities: | | | | | | | | | | | | | | | | | | |
Obligations of U.S. government corporations and agencies | | $ | 1,994 | | | $ | (6 | ) | | $ | 96,908 | | | $ | (18,735 | ) | | $ | 98,902 | | | $ | (18,741 | ) |
Mortgage-backed securities | | | 25,358 | | | | (198 | ) | | | 139,568 | | | | (30,869 | ) | | | 164,926 | | | | (31,067 | ) |
Collateralized mortgage obligations | | | 57,985 | | | | (428 | ) | | | 209,646 | | | | (49,667 | ) | | | 267,631 | | | | (50,095 | ) |
Asset-backed securities | | | 131,728 | | | | (628 | ) | | | 69,753 | | | | (3,725 | ) | | | 201,481 | | | | (4,353 | ) |
Corporate Bonds | | | — | | | | — | | | | 65,745 | | | | (5,039 | ) | | | 65,745 | | | | (5,039 | ) |
Obligations of states and political subdivisions | | | 4,954 | | | | (131 | ) | | | 191,646 | | | | (46,103 | ) | | | 196,600 | | | | (46,234 | ) |
US Treasuries | | | — | | | | — | | | | 48,910 | | | | (6,566 | ) | | | 48,910 | | | | (6,566 | ) |
Total temporarily impaired securities | | $ | 222,019 | | | $ | (1,391 | ) | | $ | 822,176 | | | $ | (160,704 | ) | | $ | 1,044,195 | | | $ | (162,095 | ) |
| | | | | | | | | | | | | | | | | | |
| | Duration of Unrealized Loss Position | | | | | | | |
| | Less than 12 Months | | | 12 Months or Longer | | | Total | |
| | | | | Gross | | | | | | Gross | | | | | | | |
| | Fair | | | Unrealized | | | Fair | | | Unrealized | | | Fair | | | Unrealized | |
| | Value | | | Loss | | | Value | | | Loss | | | Value | | | Losses | |
| | (In Thousands) | |
At December 31, 2023 | | | | | | | | | | | | | | | | | | |
Available-for-sale securities: | | | | | | | | | | | | | | | | | | |
Obligations of U.S. government corporations and agencies | | $ | 3,986 | | | $ | (9 | ) | | $ | 97,612 | | | $ | (18,791 | ) | | $ | 101,598 | | | $ | (18,800 | ) |
Mortgage-backed securities | | | — | | | | — | | | | 156,508 | | | | (29,167 | ) | | | 156,508 | | | | (29,167 | ) |
Collateralized mortgage obligations | | | — | | | | — | | | | 229,659 | | | | (49,436 | ) | | | 229,659 | | | | (49,436 | ) |
Asset-backed securities | | | — | | | | — | | | | 113,444 | | | | (5,505 | ) | | | 113,444 | | | | (5,505 | ) |
Corporate Bonds | | | — | | | | — | | | | 62,420 | | | | (8,672 | ) | | | 62,420 | | | | (8,672 | ) |
Obligations of states and political subdivisions | | | 10,595 | | | | (111 | ) | | | 188,896 | | | | (42,850 | ) | | | 199,491 | | | | (42,961 | ) |
US Treasuries | | | — | | | | — | | | | 49,177 | | | | (6,555 | ) | | | 49,177 | | | | (6,555 | ) |
Total temporarily impaired securities | | $ | 14,581 | | | $ | (120 | ) | | $ | 897,716 | | | $ | (160,976 | ) | | $ | 912,297 | | | $ | (161,096 | ) |
Quarterly, the Company evaluates if any security has a fair value less than its amortized cost. The Company did not recognize unrealized losses in income because it has the ability and the intent to hold and does not expect to be required to sell these securities until the recovery of their cost basis. Once these securities are identified, in order to determine whether a decline in fair value resulted from a credit loss or other factors, the Company performs further analysis as outlined below:
•Review the extent to which the fair value is less than the amortized cost and observe the security’s lowest credit rating as reported by third-party credit ratings companies.
•Any security that has a loss rate greater than 3% and a credit rating below investment grade or not rated by a third-party credit ratings company would be subjected to additional analysis that may include, but is not limited to: changes in market interest rates, changes in securities credit ratings, security type, service area economic factors, financial performance of the issuer/or obligor of the underlying issue and third-party guarantee.
•If the Company determines that a credit loss exists, the expected credit loss will be measured using a DCF analysis using the effective interest rate as of the security’s purchase date. The amount of credit loss the Company records will be limited to the amount by which the amortized cost exceeds the fair value. As of December 31, 2024, management had determined that no credit loss exists.
In 2024 and 2023, management determined no allowance for credit losses was required. There was no net realized gains from the sales of investment securities in 2024. Net realized gains from the sales of investment securities totaled $37,000 ($29,230 after tax) and $1,000 ($790 after tax) in 2023 and 2022, respectively.
The proceeds from sales of securities and the associated gains and losses for the years ended December 31 are listed below:
| | | | | | | | | | | | |
| | 2024 | | | 2023 | | | 2022 | |
| | (In Thousands) | |
Proceeds | | $ | — | | | $ | 25,300 | | | $ | 9,641 | |
Gross realized gains | | | — | | | | 158 | | | | 16 | |
Gross realized losses | | | — | | | | (121 | ) | | | (15 | ) |
At December 31, 2024, the Company also owned $4.0 million of equity securities. During 2024, the Company recognized a net gain of $550,000 for equity securities. At December 31, 2023, the Company owned $5.8 million of equity securities, and it recognized a net loss of $453,000 associated with the mark to market requirement for equity securities during 2023.
At year-end 2024 and 2023, there were no holdings of securities of any one issuer, other than the U.S. Government and its agencies, in an amount greater than 10% of shareholders' equity.
5.Commitments and Contingent Liabilities
Loan Commitments
Loan commitments are made to accommodate the financial needs of the Bank’s customers. Standby letters of credit commit the Company to make payments on behalf of customers when certain specified future events occur. They primarily are issued to facilitate customers’ trade transactions.
Both arrangements have credit risk, essentially the same as that involved in extending loans to customers, and are subject to the Company’s normal credit policies. Collateral (e.g., securities, receivables, inventory and equipment) is obtained based on management’s credit assessment of the customer.
The Company’s maximum obligation to extend credit for loan commitments (unfunded loans and unused lines of credit) and standby letters of credit outstanding on December 31 was as follows (in thousands):
| | | | | | | | | | | | | | | | |
| | 2024 | | | 2023 | |
| | Fixed Rate | | | Variable Rate | | | Fixed Rate | | | Variable Rate | |
Commitments to make loans | | $ | 221,855 | | | $ | 227,159 | | | $ | 256,737 | | | $ | 274,077 | |
Unused lines of credit | | | 67,901 | | | | 960,099 | | | | 46,017 | | | | 978,821 | |
Standby letters of credit | | | — | | | | 15,340 | | | | — | | | | 17,500 | |
Total | | $ | 289,756 | | | $ | 1,202,598 | | | $ | 302,754 | | | $ | 1,270,398 | |
Commitments to make loans are generally made for periods of 60 days or less. The fixed rate loan commitments at December 31, 2024, had interest rates ranging from 0.00% to 19.33% and maturities ranging from less than one year to 33 years.
Loans receivable consist of the following:
| | | | | | | | |
| | December 31, 2024 | | | December 31, 2023 | |
| | (In Thousands) | |
Real Estate: | | | | | | |
Residential | | $ | 1,765,432 | | | $ | 1,810,265 | |
Commercial | | | 2,895,356 | | | | 2,839,905 | |
Construction | | | 596,681 | | | | 838,823 | |
| | | 5,257,469 | | | | 5,488,993 | |
Other Loans: | | | | | | |
Commercial | | | 957,588 | | | | 1,056,803 | |
Home equity and improvement | | | 274,340 | | | | 267,960 | |
Consumer Finance | | | 179,700 | | | | 193,830 | |
| | | 1,411,628 | | | | 1,518,593 | |
Total loans | | | 6,669,097 | | | | 7,007,586 | |
Deduct: | | | | | | |
Undisbursed loan funds | | | (205,980 | ) | | | (281,466 | ) |
Net deferred loan origination fees and costs | | | 13,510 | | | | 13,267 | |
Allowance for credit loss | | | (75,688 | ) | | | (76,512 | ) |
Totals | | $ | 6,400,939 | | | $ | 6,662,875 | |
| | | | | | |
Loan segments have been identified by evaluating the portfolio based on collateral and credit risk characteristics.
The following table presents the amortized cost basis of collateral-dependent loans by class of loans and collateral type as of December 31, 2024 and 2023 (in thousands):
| | | | | | | | | | | | | | | | | | | | |
| | December 31, 2024 | |
| | Real Estate | | | Equipment and Machinery | | | Inventory and Receivables | | | Vehicles | | | Total | |
Real Estate: | | | | | | | | | | | | | | | |
Residential | | $ | — | | | $ | — | | | $ | — | | | $ | — | | | $ | — | |
Commercial | | | 18,004 | | | | | | | | | | | | | 18,004 | |
Construction | | | 1,171 | | | | | | | | | | | | | 1,171 | |
| | | | | | | | | | | | | | | |
Other Loans: | | | | | | | | | | | | | | | |
Commercial | | | 784 | | | | 27,837 | | | | 11,051 | | | | 46 | | | | 39,718 | |
Home equity and improvement | | | | | | | | | | | | | | | — | |
Consumer finance | | | | | | | | | | | | | | | — | |
| | | | | | | | | | | | | | | |
Total | | $ | 19,959 | | | $ | 27,837 | | | $ | 11,051 | | | $ | 46 | | | $ | 58,893 | |
| | | | | | | | | | | | | | | | | | | | |
| | December 31, 2023 | |
| | Real Estate | | | Equipment and Machinery | | | Inventory and Receivables | | | Vehicles | | | Total | |
Real Estate: | | | | | | | | | | | | | | | |
Residential | | $ | — | | | $ | — | | | $ | — | | | $ | — | | | $ | — | |
Commercial | | | 6,407 | | | | — | | | | — | | | | — | | | | 6,407 | |
Construction | | | — | | | | — | | | | — | | | | — | | | | — | |
| | | | | | | | | | | | | | | |
Other Loans: | | | | | | | | | | | | | | | |
Commercial | | | 1,297 | | | | 8,781 | | | | 2,309 | | | | 705 | | | | 13,092 | |
Home equity and improvement | | | — | | | | — | | | | — | | | | — | | | | — | |
Consumer finance | | | — | | | | — | | | | — | | | | — | | | | — | |
| | | | | | | | | | | | | | | |
Total | | $ | 7,704 | | | $ | 8,781 | | | $ | 2,309 | | | $ | 705 | | | $ | 19,499 | |
Non-performing loans include both smaller balance homogeneous loans that are collectively evaluated for impairment and individually analyzed loans. All loans 90 days and greater past due are placed on non-accrual status. The following table presents the current balance of the non-performing loans as of the dates indicated:
| | | | | | | | | | | | |
As of December 31, 2024 | | Non-accrual with no allocated allowance for credit losses | | | Non-accrual with allocated allowance for credit losses | | | Loans past due over 90 days still accruing | |
Residential real estate | | $ | 952 | | | $ | 15,723 | | | $ | — | |
Commercial real estate | | | 8,876 | | | | 10,041 | | | | — | |
Construction | | | — | | | | 1,171 | | | | — | |
Commercial | | | 2,822 | | | | 34,071 | | | | — | |
Home equity and improvement | | | — | | | | 1,626 | | | | — | |
Consumer finance | | | — | | | | 4,436 | | | | — | |
PCD | | | — | | | | 1,277 | | | | — | |
Total | | $ | 12,650 | | | $ | 68,345 | | | $ | — | |
| | | | | | | | | | | | |
As of December 31, 2023 | | Non-accrual with no allocated allowance for credit losses | | | Non-accrual with allocated allowance for credit losses | | | Loans past due over 90 days still accruing | |
Residential real estate | | $ | 572 | | | $ | 12,456 | | | $ | — | |
Commercial real estate | | | 196 | | | | 5,775 | | | | — | |
Construction | | | — | | | | — | | | | — | |
Commercial | | | 150 | | | | 8,499 | | | | — | |
Home equity and improvement | | | — | | | | 1,417 | | | | — | |
Consumer finance | | | — | | | | 3,433 | | | | — | |
PCD | | | — | | | | 2,993 | | | | — | |
Total | | $ | 918 | | | $ | 34,573 | | | $ | — | |
The following table presents the aging of the recorded investment in past due and non-accrual loans as of December 31, 2024, by class of loans (in thousands):
| | | | | | | | | | | | | | | | | | | | | | | | |
| | Current | | | 30-59 days | | | 60-89 days | | | 90+ days | | | Total
Past Due | | | Total Non
Accrual | |
Real Estate: | | | | | | | | | | | | | | | | | | |
Residential | | $ | 1,738,091 | | | $ | 559 | | | $ | 9,991 | | | $ | 14,206 | | | $ | 24,756 | | | $ | 16,675 | |
Commercial | | | 2,886,680 | | | | 664 | | | | 8,856 | | | | 2,434 | | | | 11,954 | | | | 18,917 | |
Construction | | | 390,701 | | | | — | | | | — | | | | — | | | | — | | | | 1,171 | |
| | | | | | | | | | | | | | | | | | |
Other Loans: | | | | | | | | | | | | | | | | | | |
Commercial | | | 951,112 | | | | 425 | | | | 177 | | | | 3,901 | | | | 4,503 | | | | 36,893 | |
Home equity and improvement | | | 268,483 | | | | 2,721 | | | | 744 | | | | 1,130 | | | | 4,595 | | | | 1,626 | |
Consumer finance | | | 173,217 | | | | 3,415 | | | | 1,404 | | | | 3,874 | | | | 8,693 | | | | 4,436 | |
PCD | | | 11,187 | | | | 121 | | | | 1,738 | | | | 796 | | | | 2,655 | | | | 1,277 | |
| | | | | | | | | | | | | | | | | | |
Total Loans | | $ | 6,419,471 | | | $ | 7,905 | | | $ | 22,910 | | | $ | 26,341 | | | $ | 57,156 | | | $ | 80,995 | |
The Company recognized $5.2 million of interest income on nonaccrual loans during the year ended December 31, 2024.
The following table presents the aging of the recorded investment in past due and non-accrual loans as of December 31, 2023, by class of loans (in thousands):
| | | | | | | | | | | | | | | | | | | | | | | | |
| | Current | | | 30-59 days | | | 60-89 days | | | 90+ days | | | Total
Past Due | | | Total Non
Accrual | |
Real Estate: | | | | | | | | | | | | | | | | | | |
Residential | | $ | 1,786,537 | | | $ | 152 | | | $ | 8,302 | | | $ | 11,216 | | | $ | 19,670 | | | $ | 13,028 | |
Commercial | | | 2,841,209 | | | | 163 | | | | 312 | | | | 1,275 | | | | 1,750 | | | | 5,971 | |
Construction | | | 557,249 | | | | — | | | | 108 | | | | — | | | | 108 | | | | — | |
| | | | | | | | | | | | | | | | | | |
Other Loans: | | | | | | | | | | | | | | | | | | |
Commercial | | | 1,051,034 | | | | 191 | | | | 2,446 | | | | 1,132 | | | | 3,769 | | | | 8,649 | |
Home equity and improvement | | | 262,404 | | | | 2,084 | | | | 635 | | | | 958 | | | | 3,677 | | | | 1,417 | |
Consumer finance | | | 187,624 | | | | 3,699 | | | | 1,681 | | | | 3,003 | | | | 8,383 | | | | 3,433 | |
PCD | | | 11,922 | | | | 211 | | | | 1,271 | | | | 2,569 | | | | 4,051 | | | | 2,993 | |
| | | | | | | | | | | | | | | | | | |
Total Loans | | $ | 6,697,979 | | | $ | 6,500 | | | $ | 14,755 | | | $ | 20,153 | | | $ | 41,408 | | | $ | 35,491 | |
The Company recognized $1.4 million of interest income on nonaccrual loans during the year ended December 31, 2023.
Loan Modifications
As of January 1, 2023, the Company adopted the modified retrospective method under ASU 2022-02, "Trouble Debt Restructurings and Vintage Disclosures" which eliminated trouble debt restructuring accounting for entities that have adopted ASU 2016-13, the current expected credit losses model.
Occasionally, the Company modifies loans by providing principal forgiveness on certain of its real estate loans. When principal forgiveness is provided, the amortized cost basis of the loan is written off against the allowance for credit losses. The amount of the principal forgiveness is deemed to be uncollectible; therefore, that portion of the loan is written off, resulting in a reduction of amortized cost basis and a corresponding adjustments to the allowance for credit losses. In some cases, the Company will modify a certain loan by providing multiple types of concessions. Typically, one type of concession, such as a term extension, is granted initially. If the borrower continues to experience financial difficulty, another concession, such as principal forgiveness or reduction of rate, may be granted.
Of the loans modified as of December 31, 2024 and 2023, $17.6 million and $4.3 million, respectively, were on non-accrual status and partial charge-offs have in some cases been taken against the outstanding balance. The allowance for credit losses incorporates an estimate of lifetime expected credit losses and is recorded on each loan upon loan origination or acquisition. The starting point for the estimate of the allowance for credit losses is historical loss information, which includes losses from modifications of loans to borrowers experiencing financial difficulty. The company uses probability of default/loss given default, discounted cash flows or remaining life method to determine the allowance for credit losses. An assessment of whether a borrower is experiencing financial difficulty is made on the date of a modification. Because the effect of most modifications made to borrowers experiencing financial difficulty is already included in the allowance for credit losses because of the measurement methodologies used to estimate the allowance, a change to the allowance for credit losses is generally not recorded upon modification.
The following table shows the amortized cost basis at the end of the reporting period of the loans modified to borrowers experiencing financial difficulty, disaggregated by loan category and type of modification granted during the years ended December 31, 2024 and 2023. The percentage of the amortized cost basis of loans that were modified to borrowers experiencing financial difficulty as compared to the amortized cost basis of each class of loan category is also presented below:
| | | | | | | | | | | | | | | | |
| | Loans Modifications Made to Borrowers Experiencing Financial Difficulty
December 31, 2024
(Dollars in Thousands) | | | Loans Modifications Made to Borrowers Experiencing Financial Difficulty
December 31, 2023
(Dollars in Thousands) | |
| | Term Extension | | | Term Extension | |
Loan Type | | Amortized Cost Basis | | | Percent of total loans by
category | | | Amortized Cost Basis | | | Percent of total loans by
category | |
Real Estate: | | | | | | | | | | | | |
Residential | | $ | — | | | | — | | | | 109 | | | | 0.01 | % |
Commercial | | | 17,116 | | | | 0.59 | % | | | 8,791 | | | | 0.31 | % |
Construction | | | — | | | | — | | | | — | | | | — | |
| | | | | | | | | | | | |
Other Loans: | | | | | | | | | | | | |
Commercial | | | 19,341 | | | | 2.02 | % | | | 4,140 | | | | 0.39 | % |
Home equity and improvement | | | — | | | | — | | | | — | | | | — | |
Consumer finance | | | — | | | | — | | | | — | | | | — | |
| | | | | | | | | | | | |
Total | | $ | 36,457 | | | | | | $ | 13,040 | | | | |
The following table describes the financial effect of the modifications made during 2024 to borrowers experiencing financial difficulty:
| | | |
| Term Extension |
Loan Type | Financial Effect |
Real Estate: | |
Commercial | -Term extended 6 months |
Other Loans: | |
Commercial | -Demand Line termed out to 10 year term
-Demand Line termed out to 5 year term
-Term extended 5 months |
| -Demand Line termed out to 192 months
-Term extended 189 months |
| -Term extended 6 months |
| -Term extended 11 months |
| -Term extended 5 years |
| -Term extended 6 months |
| | | |
| Rate Reduction |
Loan Type | Financial Effect |
Other Loans: | |
Commercial | -Interest rate reduction 10.5% to 8.5%
-Interest rate reduction 11% (tied to prime) to 8.25% fixed
-Interest rate reduction 13.5% to 8.5%
-Interest rate reduction 9.3% to 3.3% |
The following table describes the financial effect of the modifications made during 2023 to borrowers experiencing financial difficulty:
| | | |
| Term Extension |
Loan Type | Financial Effect |
Real Estate: | |
Residential | -Term extended from 7 year balloon to 30 years |
Commercial | -Added 12 months to the life of the loan, which reduced monthly payment amounts for the borrower.
-Term extension 10 yr term/ 20 yr am to 12 month interest only |
| | | |
Other Loans: | |
Commercial | -Added 84 months to the life of the loan to term out 2 year balloon, which reduced monthly payment amounts for the borrower.
-60 day extension |
| | | |
| Rate Reduction |
Loan Type | Financial Effect |
Real Estate: | |
Commercial | -Interest rate reduction 11.08% to 5.00%
-Interest rate reduction 10.65% to 5.00%
-Interest rate reduction 7.14% to 4.50% |
Upon the Company's determination that a modified loan (or portion of a loan) has subsequently been deemed uncollectible, the loan (or a portion of the loan) is written off. Therefore, the amortized cost basis of the loan is reduced by the uncollectible amount and the allowance for credit losses is adjusted by the same amount.
There was one loan modification that had a payment default during the years ended December 31, 2024 or 2023, and was modified in the twelve months prior to that default to borrowers experiencing financial difficulty.
The Company closely monitors the performance of the loans that were modified to borrowers experiencing financial difficulty to understand the effectiveness of its modification efforts. As of December 31, 2024, nine of the modified loans are current and six modified loans pertaining to three commercial relationships are on nonaccrual. As of December 31, 2023, six of the modified loans are current and four loans pertaining to one commercial relationship are on nonaccrual.
Credit Quality Indicators
Loans are categorized into risk categories based on relevant information about the ability of borrowers to service their debt such as: current financial information, historical payment experience, credit documentation, public information, and current economic trends, among other factors. Loans are analyzed individually by classifying the loans as to credit risk. This analysis includes all non-homogeneous loans, such as commercial and commercial real estate loans and certain homogenous mortgage, home equity and consumer loans. This analysis is performed on a quarterly basis. Premier uses the following definitions for risk ratings with loans not meeting such classifications being considered “unclassified”:
Special Mention. Loans designated as special mention have a potential weakness that deserves management's close attention. If left uncorrected, these potential weaknesses may result in deterioration of the repayment prospects for the loan or of the institution's credit position at some future date.
Substandard. Loans classified as substandard are inadequately protected by the current net worth and paying capacity of the obligor or of the collateral pledged, if any. Loans so classified have a well-defined weakness or weaknesses that jeopardize the liquidation of the debt. They are characterized by the distinct possibility that the institution will sustain some loss if the deficiencies are not corrected.
Doubtful. Loans classified as doubtful have all the weaknesses inherent in those classified as substandard, with the added characteristic that the weaknesses make collection or liquidation in full, on the basis of currently existing facts, conditions, and values, highly questionable and improbable.
Not Graded. Loans classified as not graded are generally smaller balance residential real estate, home equity and consumer installment loans which are originated primarily by using an automated underwriting system. These loans are monitored based on their delinquency status and are evaluated individually only if they are seriously delinquent.
Loans not meeting the criteria above that are analyzed individually as part of the above described process are considered to be pass rated loans.
As of December 31, 2024, and based on the most recent analysis performed, the risk category and recorded investment in loans is as follows (in thousands):
| | | | | | | | | | | | | | | | | | | | | | | | |
Class | | Unclassified | | | Special
Mention | | | Substandard | | | Doubtful | | | Total classified | | | Total | |
Real Estate: | | | | | | | | | | | | | | | | | | |
Residential | | $ | 1,744,114 | | | $ | 1,294 | | | $ | 17,439 | | | $ | — | | | $ | 17,439 | | | $ | 1,762,847 | |
Commercial | | | 2,788,296 | | | | 59,179 | | | | 51,159 | | | | — | | | | 51,159 | | | | 2,898,634 | |
Construction | | | 369,725 | | | | 19,805 | | | | 1,171 | | | | — | | | | 1,171 | | | | 390,701 | |
| | | | | | | | | | | | | | | | | | |
Other Loans: | | | | | | | | | | | | | | | | | | |
Commercial | | | 850,255 | | | | 53,325 | | | | 52,035 | | | | — | | | | 52,035 | | | | 955,615 | |
Home equity and improvement | | | 271,376 | | | | — | | | | 1,702 | | | | — | | | | 1,702 | | | | 273,078 | |
Consumer finance | | | 177,464 | | | | — | | | | 4,446 | | | | — | | | | 4,446 | | | | 181,910 | |
PCD | | | 12,103 | | | | 394 | | | | 1,345 | | | | — | | | | 1,345 | | | | 13,842 | |
| | | | | | | | | | | | | | | | | | |
Total Loans (1) | | $ | 6,213,333 | | | $ | 133,997 | | | $ | 129,297 | | | $ | — | | | $ | 129,297 | | | $ | 6,476,627 | |
(1) Total loans are net of undisbursed loan funds and deferred fees and costs
As of December 31, 2023, and based on the most recent analysis performed, the risk category of loans by class of loans is as follows (in thousands):
| | | | | | | | | | | | | | | | | | | | | | | | |
Class | | Unclassified | | | Special
Mention | | | Substandard | | | Doubtful | | | Total classified | | | Total | |
Real Estate: | | | | | | | | | | | | | | | | | | |
Residential | | $ | 1,791,663 | | | $ | 594 | | | $ | 13,950 | | | $ | — | | | $ | 13,950 | | | $ | 1,806,207 | |
Commercial | | | 2,765,898 | | | | 50,784 | | | | 26,277 | | | | — | | | | 26,277 | | | | 2,842,959 | |
Construction | | | 549,867 | | | | 7,490 | | | | — | | | | — | | | | — | | | | 557,357 | |
| | | | | | | | | | | | | | | | | | |
Other Loans: | | | | | | | | | | | | | | | | | | |
Commercial | | | 975,233 | | | | 57,634 | | | | 21,936 | | | | — | | | | 21,936 | | | | 1,054,803 | |
Home equity and improvement | | | 264,663 | | | | — | | | | 1,418 | | | | — | | | | 1,418 | | | | 266,081 | |
Consumer finance | | | 192,774 | | | | — | | | | 3,233 | | | | — | | | | 3,233 | | | | 196,007 | |
PCD | | | 12,899 | | | | 197 | | | | 2,877 | | | | — | | | | 2,877 | | | | 15,973 | |
| | | | | | | | | | | | | | | | | | |
Total Loans (1) | | $ | 6,552,997 | | | $ | 116,699 | | | $ | 69,691 | | | $ | — | | | $ | 69,691 | | | $ | 6,739,387 | |
(1) Total loans are net of undisbursed loan funds and deferred fees and cost
The tables below presents the amortized cost basis of loans by vintage, credit quality indicator and class of loans as of December 31, 2024 and 2023 (in thousands):
| | | | | | | | | | | | | | | | | | | | | | | | | | | | | | | |
| Term of loans by origination | |
| 2024 | | | 2023 | | | 2022 | | | 2021 | | | 2020 | | | Prior | | | Revolving Loans | | | Total | |
As of December 31, 2024 | | | | | | | | | | | | | | | | | | | | | | | |
| | | | | | | | | | | | | | | | | | | | | | | |
Real Estate | | | | | | | | | | | | | | | | | | | | | | | |
Residential: | | | | | | | | | | | | | | | | | | | | | | | |
Current-period gross charge-offs | $ | 6 | | | $ | 11 | | | $ | 14 | | | $ | 16 | | | $ | — | | | $ | 35 | | | $ | — | | | $ | 82 | |
Risk Rating | | | | | | | | | | | | | | | | | | | | | | | |
Unclassified | $ | 17,496 | | | $ | 148,599 | | | $ | 595,848 | | | $ | 376,482 | | | $ | 271,945 | | | $ | 332,800 | | | $ | 944 | | | $ | 1,744,114 | |
Special Mention | | — | | | | 299 | | | | 263 | | | | 14 | | | | 159 | | | | 559 | | | | — | | | | 1,294 | |
Substandard | | 371 | | | | 3,374 | | | | 4,612 | | | | 1,549 | | | | 2,468 | | | | 5,065 | | | | — | | | | 17,439 | |
Doubtful | | — | | | | — | | | | — | | | | — | | | | — | | | | — | | | | — | | | | — | |
Total | $ | 17,867 | | | $ | 152,272 | | | $ | 600,723 | | | $ | 378,045 | | | $ | 274,572 | | | $ | 338,424 | | | $ | 944 | | | $ | 1,762,847 | |
| | | | | | | | | | | | | | | | | | | | | | | |
Commercial: | | | | | | | | | | | | | | | | | | | | | | | |
Current-period gross charge-offs | | | | $ | — | | | $ | — | | | $ | — | | | $ | — | | | $ | 1,552 | | | $ | — | | | $ | 1,552 | |
Risk Rating | | | | | | | | | | | | | | | | | | | | | | | |
Unclassified | $ | 158,043 | | | $ | 183,685 | | | $ | 706,237 | | | $ | 505,426 | | | $ | 420,732 | | | $ | 798,751 | | | $ | 15,422 | | | $ | 2,788,296 | |
Special Mention | | — | | | | 1,323 | | | | 18,388 | | | | 19,391 | | | | 6,836 | | | | 12,563 | | | | 678 | | | | 59,179 | |
Substandard | | — | | | | — | | | | 8,885 | | | | 20,724 | | | | — | | | | 21,497 | | | | 53 | | | | 51,159 | |
Doubtful | | — | | | | — | | | | — | | | | — | | | | — | | | | — | | | | — | | | | — | |
Total | $ | 158,043 | | | $ | 185,008 | | | $ | 733,510 | | | $ | 545,541 | | | $ | 427,568 | | | $ | 832,811 | | | $ | 16,153 | | | $ | 2,898,634 | |
| | | | | | | | | | | | | | | | | | | | | | | |
Construction: | | | | | | | | | | | | | | | | | | | | | | | |
Current-period gross charge-offs | $ | — | | | $ | — | | | $ | — | | | $ | — | | | $ | — | | | $ | — | | | $ | — | | | $ | — | |
Risk Rating | | | | | | | | | | | | | | | | | | | | | | | |
Unclassified | $ | 56,977 | | | $ | 53,181 | | | $ | 217,820 | | | $ | 41,747 | | | $ | — | | | $ | — | | | $ | — | | | $ | 369,725 | |
Special Mention | | — | | | | — | | | | 7,500 | | | | 12,305 | | | | — | | | | — | | | | — | | | | 19,805 | |
Substandard | | — | | | | — | | | | 1,171 | | | | — | | | | — | | | | — | | | | — | | | | 1,171 | |
Doubtful | | — | | | | — | | | | — | | | | — | | | | — | | | | — | | | | — | | | | — | |
Total | $ | 56,977 | | | $ | 53,181 | | | $ | 226,491 | | | $ | 54,052 | | | $ | — | | | $ | — | | | $ | — | | | $ | 390,701 | |
| | | | | | | | | | | | | | | | | | | | | | | |
Other Loans | | | | | | | | | | | | | | | | | | | | | | | |
Commercial: | | | | | | | | | | | | | | | | | | | | | | | |
Current-period gross charge-offs | $ | — | | | $ | — | | | $ | — | | | $ | — | | | $ | 258 | | | $ | 1,687 | | | $ | 50 | | | $ | 1,995 | |
Risk Rating | | | | | | | | | | | | | | | | | | | | | | | |
Unclassified | $ | 103,567 | | | $ | 77,921 | | | $ | 165,434 | | | $ | 105,139 | | | $ | 31,153 | | | $ | 30,772 | | | $ | 336,269 | | | $ | 850,255 | |
Special Mention | | 2,620 | | | | 2,441 | | | | 13,148 | | | | 11,406 | | | | 8 | | | | 4,082 | | | | 19,620 | | | | 53,325 | |
Substandard | | 342 | | | | 6,731 | | | | 1,718 | | | | 11,606 | | | | 8,387 | | | | 3,494 | | | | 19,757 | | | | 52,035 | |
Doubtful | | — | | | | — | | | | — | | | | — | | | | — | | | | — | | | | — | | | | — | |
Total | $ | 106,529 | | | $ | 87,093 | | | $ | 180,300 | | | $ | 128,151 | | | $ | 39,548 | | | $ | 38,348 | | | $ | 375,646 | | | $ | 955,615 | |
| | | | | | | | | | | | | | | | | | | | | | | |
Home equity and Improvement: | | | | | | | | | | | | | | | | | | | | | | | |
Current-period gross charge-offs | $ | — | | | $ | — | | | $ | — | | | $ | — | | | $ | — | | | $ | 177 | | | $ | — | | | $ | 177 | |
Risk Rating | | | | | | | | | | | | | | | | | | | | | | | |
Unclassified | $ | 17,168 | | | $ | 15,591 | | | $ | 20,382 | | | $ | 15,381 | | | $ | 3,727 | | | $ | 24,476 | | | $ | 174,651 | | | $ | 271,376 | |
Special Mention | | — | | | | — | | | | — | | | | — | | | | — | | | | — | | | | — | | | | — | |
Substandard | | — | | | | 49 | | | | — | | | | 34 | | | | — | | | | 356 | | | | 1,263 | | | | 1,702 | |
Doubtful | | — | | | | — | | | | — | | | | — | | | | — | | | | — | | | | — | | | | — | |
Total | $ | 17,168 | | | $ | 15,640 | | | $ | 20,382 | | | $ | 15,415 | | | $ | 3,727 | | | $ | 24,832 | | | $ | 175,914 | | | $ | 273,078 | |
| | | | | | | | | | | | | | | | | | | | | | | |
Consumer Finance: | | | | | | | | | | | | | | | | | | | | | | | |
Current-period gross charge-offs | $ | 72 | | | $ | 213 | | | $ | 602 | | | $ | 136 | | | $ | 10 | | | $ | 1,018 | | | | | | $ | 2,051 | |
Risk Rating | | | | | | | | | | | | | | | | | | | | | | | |
Unclassified | $ | 49,545 | | | $ | 30,252 | | | $ | 67,877 | | | $ | 14,191 | | | $ | 6,388 | | | $ | 3,948 | | | $ | 5,263 | | | $ | 177,464 | |
Special Mention | | — | | | | — | | | | — | | | | — | | | | — | | | | — | | | | — | | | | — | |
Substandard | | 220 | | | | 899 | | | | 2,073 | | | | 608 | | | | 418 | | | | 218 | | | | 10 | | | | 4,446 | |
Doubtful | | — | | | | — | | | | — | | | | — | | | | — | | | | — | | | | — | | | | — | |
Total | $ | 49,765 | | | $ | 31,151 | | | $ | 69,950 | | | $ | 14,799 | | | $ | 6,806 | | | $ | 4,166 | | | $ | 5,273 | | | $ | 181,910 | |
| | | | | | | | | | | | | | | | | | | | | | | |
PCD: | | | | | | | | | | | | | | | | | | | | | | | |
Current-period gross charge-offs | $ | — | | | $ | — | | | $ | — | | | $ | — | | | $ | — | | | $ | 105 | | | $ | — | | | $ | 105 | |
Risk Rating | | | | | | | | | | | | | | | | | | | | | | | |
Unclassified | $ | — | | | $ | — | | | $ | — | | | $ | — | | | $ | — | | | $ | 11,368 | | | $ | 735 | | | $ | 12,103 | |
Special Mention | | — | | | | — | | | | — | | | | — | | | | — | | | | 144 | | | | 250 | | | | 394 | |
Substandard | | — | | | | — | | | | — | | | | — | | | | — | | | | 1,287 | | | | 58 | | | | 1,345 | |
Doubtful | | — | | | | — | | | | — | | | | — | | | | — | | | | — | | | | — | | | | — | |
Total | $ | — | | | $ | — | | | $ | — | | | $ | — | | | $ | — | | | $ | 12,799 | | | $ | 1,043 | | | $ | 13,842 | |
| | | | | | | | | | | | | | | | | | | | | | | | | | | | | | | |
| Term of loans by origination | |
| 2023 | | | 2022 | | | 2021 | | | 2020 | | | 2019 | | | Prior | | | Revolving Loans | | | Total | |
As of December 31, 2023 | | | | | | | | | | | | | | | | | | | | | | | |
| | | | | | | | | | | | | | | | | | | | | | | |
Real Estate | | | | | | | | | | | | | | | | | | | | | | | |
Residential: | | | | | | | | | | | | | | | | | | | | | | | |
Current-period gross charge-offs | $ | — | | | $ | 3 | | | $ | 218 | | | $ | — | | | $ | 6 | | | $ | 93 | | | $ | — | | | $ | 320 | |
Risk Rating | | | | | | | | | | | | | | | | | | | | | | | |
Unclassified | $ | 46,218 | | | $ | 625,993 | | | $ | 430,801 | | | $ | 305,077 | | | $ | 86,103 | | | $ | 296,317 | | | $ | 1,154 | | | $ | 1,791,663 | |
Special Mention | | — | | | | — | | | | — | | | | 170 | | | | 33 | | | | 391 | | | | — | | | | 594 | |
Substandard | | 431 | | | | 2,757 | | | | 2,267 | | | | 2,061 | | | | 1,031 | | | | 5,403 | | | | — | | | | 13,950 | |
Doubtful | | — | | | | — | | | | — | | | | — | | | | — | | | | — | | | | — | | | | — | |
Total | $ | 46,649 | | | $ | 628,750 | | | $ | 433,068 | | | $ | 307,308 | | | $ | 87,167 | | | $ | 302,111 | | | $ | 1,154 | | | $ | 1,806,207 | |
| | | | | | | | | | | | | | | | | | | | | | | |
Commercial: | | | | | | | | | | | | | | | | | | | | | | | |
Current-period gross charge-offs | $ | — | | | $ | — | | | $ | — | | | $ | 274 | | | $ | 399 | | | $ | 1,632 | | | $ | 14 | | | $ | 2,319 | |
Risk Rating | | | | | | | | | | | | | | | | | | | | | | | |
Unclassified | $ | 187,446 | | | $ | 619,860 | | | $ | 516,527 | | | $ | 470,751 | | | $ | 305,114 | | | $ | 647,079 | | | $ | 19,121 | | | $ | 2,765,898 | |
Special Mention | | — | | | | 10,361 | | | | 28,743 | | | | 3,324 | | | | 83 | | | | 8,124 | | | | 149 | | | | 50,784 | |
Substandard | | — | | | | 732 | | | | 3,489 | | | | 232 | | | | 1,751 | | | | 20,043 | | | | 30 | | | | 26,277 | |
Doubtful | | — | | | | — | | | | — | | | | — | | | | — | | | | — | | | | — | | | | — | |
Total | $ | 187,446 | | | $ | 630,953 | | | $ | 548,759 | | | $ | 474,307 | | | $ | 306,948 | | | $ | 675,246 | | | $ | 19,300 | | | $ | 2,842,959 | |
| | | | | | | | | | | | | | | | | | | | | | | |
Construction: | | | | | | | | | | | | | | | | | | | | | | | |
Current-period gross charge-offs | $ | — | | | $ | — | | | $ | — | | | $ | — | | | $ | — | | | $ | — | | | $ | — | | | $ | — | |
Risk Rating | | | | | | | | | | | | | | | | | | | | | | | |
Unclassified | $ | 51,807 | | | $ | 322,097 | | | $ | 125,035 | | | $ | 44,114 | | | $ | 6,814 | | | $ | — | | | $ | — | | | $ | 549,867 | |
Special Mention | | — | | | | 7,490 | | | | — | | | | — | | | | — | | | | — | | | | — | | | | 7,490 | |
Substandard | | — | | | | — | | | | — | | | | — | | | | — | | | | — | | | | — | | | | — | |
Doubtful | | — | | | | — | | | | — | | | | — | | | | — | | | | — | | | | — | | | | — | |
Total | $ | 51,807 | | | $ | 329,587 | | | $ | 125,035 | | | $ | 44,114 | | | $ | 6,814 | | | $ | — | | | $ | — | | | $ | 557,357 | |
| | | | | | | | | | | | | | | | | | | | | | | |
Other Loans | | | | | | | | | | | | | | | | | | | | | | | |
Commercial: | | | | | | | | | | | | | | | | | | | | | | | |
Current-period gross charge-offs | $ | — | | | $ | 57 | | | $ | — | | | $ | 1 | | | $ | 498 | | | $ | 65 | | | $ | 1,713 | | | $ | 2,334 | |
Risk Rating | | | | | | | | | | | | | | | | | | | | | | | |
Unclassified | $ | 121,527 | | | $ | 248,455 | | | $ | 148,220 | | | $ | 50,554 | | | $ | 28,427 | | | $ | 26,799 | | | $ | 351,251 | | | $ | 975,233 | |
Special Mention | | 9,551 | | | | 2,475 | | | | 14,625 | | | | 10,670 | | | | 1,607 | | | | 3,805 | | | | 14,901 | | | | 57,634 | |
Substandard | | — | | | | 929 | | | | 11,205 | | | | 767 | | | | 991 | | | | 1,170 | | | | 6,874 | | | | 21,936 | |
Doubtful | | — | | | | — | | | | — | | | | — | | | | — | | | | — | | | | — | | | | — | |
Total | $ | 131,078 | | | $ | 251,859 | | | $ | 174,050 | | | $ | 61,991 | | | $ | 31,025 | | | $ | 31,774 | | | $ | 373,026 | | | $ | 1,054,803 | |
| | | | | | | | | | | | | | | | | | | | | | | |
Home equity and Improvement: | | | | | | | | | | | | | | | | | | | | | | | |
Current-period gross charge-offs | $ | — | | | $ | — | | | $ | — | | | $ | — | | | $ | 7 | | | $ | 30 | | | $ | 123 | | | $ | 160 | |
Risk Rating | | | | | | | | | | | | | | | | | | | | | | | |
Unclassified | $ | 19,554 | | | $ | 24,870 | | | $ | 18,061 | | | $ | 4,405 | | | $ | 2,935 | | | $ | 26,904 | | | $ | 167,934 | | | $ | 264,663 | |
Special Mention | | — | | | | — | | | | — | | | | — | | | | — | | | | — | | | | — | | | | — | |
Substandard | | — | | | | 119 | | | | 14 | | | | — | | | | — | | | | 255 | | | | 1,030 | | | | 1,418 | |
Doubtful | | — | | | | — | | | | — | | | | — | | | | — | | | | — | | | | — | | | | — | |
Total | $ | 19,554 | | | $ | 24,989 | | | $ | 18,075 | | | $ | 4,405 | | | $ | 2,935 | | | $ | 27,159 | | | $ | 168,964 | | | $ | 266,081 | |
| | | | | | | | | | | | | | | | | | | | | | | |
Consumer Finance: | | | | | | | | | | | | | | | | | | | | | | | |
Current-period gross charge-offs | $ | — | | | $ | 437 | | | $ | 260 | | | $ | 185 | | | $ | 95 | | | $ | 450 | | | $ | 51 | | | $ | 1,478 | |
Risk Rating | | | | | | | | | | | | | | | | | | | | | | | |
Unclassified | $ | 44,735 | | | $ | 98,287 | | | $ | 22,588 | | | $ | 11,067 | | | $ | 7,337 | | | $ | 1,706 | | | $ | 7,054 | | | $ | 192,774 | |
Special Mention | | — | | | | — | | | | — | | | | — | | | | — | | | | — | | | | — | | | | — | |
Substandard | | 282 | | | | 1,476 | | | | 593 | | | | 505 | | | | 281 | | | | 93 | | | | 3 | | | | 3,233 | |
Doubtful | | — | | | | — | | | | — | | | | — | | | | — | | | | — | | | | — | | | | — | |
Total | $ | 45,017 | | | $ | 99,763 | | | $ | 23,181 | | | $ | 11,572 | | | $ | 7,618 | | | $ | 1,799 | | | $ | 7,057 | | | $ | 196,007 | |
| | | | | | | | | | | | | | | | | | | | | | | |
PCD: | | | | | | | | | | | | | | | | | | | | | | | |
Current-period gross charge-offs | $ | — | | | $ | — | | | $ | — | | | $ | — | | | $ | — | | | $ | 122 | | | $ | 31 | | | $ | 153 | |
Risk Rating | | | | | | | | | | | | | | | | | | | | | | | |
Unclassified | $ | — | | | $ | — | | | $ | — | | | $ | — | | | $ | 114 | | | $ | 12,264 | | | $ | 521 | | | $ | 12,899 | |
Special Mention | | — | | | | — | | | | — | | | | — | | | | — | | | | 197 | | | | — | | | | 197 | |
Substandard | | — | | | | — | | | | — | | | | — | | | | — | | | | 2,562 | | | | 315 | | | | 2,877 | |
Doubtful | | — | | | | — | | | | — | | | | — | | | | — | | | | — | | | | — | | | | — | |
Total | $ | — | | | $ | — | | | $ | — | | | $ | — | | | $ | 114 | | | $ | 15,023 | | | $ | 836 | | | $ | 15,973 | |
Allowance for Credit Losses (“ACL”)
The Company has adopted ASU 2016-13 (Topic 326 – Credit Losses) to calculate the ACL, which requires a projection of credit loss over the contract lifetime of the credit adjusted for prepayment tendencies. This valuation account is deducted from the loans amortized
cost basis to present the net amount expected to be collected on the loan. The ACL is adjusted through the provision for credit losses and reduced by net charge offs of loans.
The credit loss estimation process involves procedures that consider the unique characteristics of the Company’s portfolio segments. These segments are further disaggregated into the loan pools for monitoring. When computing allowance levels, a model of risk characteristics, such as loss history and delinquency status, along with current conditions and a supportable forecast is used to determine credit loss assumptions.
The Company is generally utilizing two methodologies to analyze loan pools: discounted cash flows (“DCF”) and probability of default/loss given default (“PD/LGD”).
A default can be triggered by one of several different asset quality factors including past due status, non-accrual status or if the loan has had a charge-off. The PD/LGD utilizes charge off data from the Federal Financial Institutions Examination Council to construct a default rate. The Company estimates losses over an approximate one-year forecast period using Moody’s baseline economic forecasts, and then reverts to longer term historical loss experience over a three-year period. This default rate is further segmented based on the risk of the credit assigning a higher default rate to riskier credits.
The DCF methodology was selected as the most appropriate for loan segments with longer average lives and regular payment structures. The DCF model has two key components, the loss driver analysis combined with a cash flow analysis. The contractual cash flow is adjusted for PD/LGD and prepayment speed to establish a reserve level. The prepayment studies are updated semi-annually by a third-party for each applicable pool.
The remaining life method was selected for the consumer direct loan segment since the pool contains loans with many different structures and payment streams and collateral. The weighted average remaining life uses an average annual charge-off rate applied to the contractual term, further adjusted for estimated prepayments to determine the unadjusted historical charge-off rate for the remaining balance of assets.
| | | | | | |
Portfolio Segments |
| Loan Pool |
| Methodology |
| Loss Drivers |
Residential real estate |
| 1-4 Family nonowner occupied |
| DCF |
| National unemployment |
|
| 1-4 Family owner occupied |
| DCF |
| National unemployment |
Commercial real estate |
| Commercial real estate nonowner occupied |
| DCF |
| National unemployment |
|
| Commercial real estate owner occupied |
| DCF |
| National unemployment |
|
| Multi Family |
| DCF |
| National unemployment |
|
| Agriculture Land |
| DCF |
| National unemployment |
|
| Other commercial real estate |
| DCF |
| National unemployment |
Construction secured by real estate |
| Construction Other |
| PD/LGD |
| Call report loss history |
|
| Construction Residential |
| PD/LGD |
| Call report loss history |
Commercial |
| Commercial working capital |
| PD/LGD |
| Call report loss history |
|
| Agriculture production |
| PD/LGD |
| Call report loss history |
|
| Other commercial |
| PD/LGD |
| Call report loss history |
Home equity and improvement |
| Home equity and improvement |
| PD/LGD |
| Call report loss history |
Consumer finance |
| Consumer direct |
| Remaining life |
| Call report loss history |
| | | | | | |
|
| Consumer indirect |
| DCF |
| National Unemployment |
According to the accounting standard an entity may make an accounting policy election not to measure an allowance for credit losses for accrued interest receivable if the entity writes off the applicable accrued interest receivable balance in a timely manner. The Company has made the accounting policy election not to measure an allowance for credit losses for accrued interest receivables for all loan segments. Current policy dictates that a loan will be placed on nonaccrual status, with the current accrued interest receivable balance being written off, upon the loan being 90 days delinquent or when the loan is deemed to be collateral dependent and the collateral analysis shows discounted collateral coverage less than policy requirement based on a current assessment of the value of the collateral.
In addition, ASC Topic 326 requires the Company to establish a liability for anticipated credit losses for unfunded commitments. To accomplish this, the company must first establish a loss expectation for extended (funded) commitments. This loss expectation, expressed as a ratio to the amortized cost basis, is then applied to the portion of unfunded commitments not considered unilaterally cancelable, and considered by the company’s management as likely to fund over the life of the instrument. At December 31, 2024, the Company had $1.2 billion in unfunded commitments and set aside $2.9 million in anticipated credit losses. This reserve is recorded in other liabilities as opposed to the ACL.
The determination of ACL is complex and the Company makes decisions on the effects of factors that are inherently uncertain. Evaluations of the loan portfolio and individual credits require certain estimates, assumptions and judgments as to the facts and circumstances related to particular situations or credits. There may be significant changes in the ACL in future periods determined by prevailing factors at that point in time along with future forecasts.
The following tables disclose the annual activity in the allowance for credit losses for the periods indicated by portfolio segment (in thousands):
| | | | | | | | | | | | | | | | | | | | | | | | | | | | |
Year ended December 31, 2024 | | Residential Real Estate | | | Commercial
Real
Estate | | | Construction | | | Commercial | | | Home
Equity
and
Improvement | | | Consumer
Finance | | | Total | |
Beginning Allowance | | $ | 17,215 | | | $ | 36,053 | | | $ | 3,159 | | | $ | 15,489 | | | $ | 2,703 | | | $ | 1,893 | | | $ | 76,512 | |
Charge-Offs | | | (82 | ) | | | (1,552 | ) | | | — | | | | (2,042 | ) | | | (177 | ) | | | (2,109 | ) | | | (5,962 | ) |
Recoveries | | | 50 | | | | 50 | | | | — | | | | 424 | | | 101 | | | 623 | | | | 1,248 | |
Provision expense (recovery) | | | (1,134 | ) | | | (3,197 | ) | | | (405 | ) | | | 6,980 | | | | (392 | ) | | | 2,038 | | | | 3,890 | |
Ending Allowance | | $ | 16,049 | | | $ | 31,354 | | | $ | 2,754 | | | $ | 20,851 | | | $ | 2,235 | | | $ | 2,445 | | | $ | 75,688 | |
| | | | | | | | | | | | | | | | | | | | | | | | | | | | |
Year ended December 31, 2023 | | Residential Real Estate | | | Commercial
Real
Estate | | | Construction | | | Commercial | | | Home
Equity
and
Improvement | | | Consumer
Finance | | | Total | |
Beginning Allowance | | $ | 16,711 | | | $ | 34,218 | | | $ | 4,025 | | | $ | 11,769 | | | $ | 4,044 | | | $ | 2,049 | | | $ | 72,816 | |
Charge-Offs | | | (342 | ) | | | (2,319 | ) | | | — | | | | (2,362 | ) | | | (259 | ) | | | (1,482 | ) | | | (6,764 | ) |
Recoveries | | | 87 | | | | 877 | | | | — | | | | 1,409 | | | 121 | | | 224 | | | | 2,718 | |
Provision expense (recovery) | | | 759 | | | | 3,277 | | | | (866 | ) | | | 4,673 | | | | (1,203 | ) | | | 1,102 | | | | 7,742 | |
Ending Allowance | | $ | 17,215 | | | $ | 36,053 | | | $ | 3,159 | | | $ | 15,489 | | | $ | 2,703 | | | $ | 1,893 | | | $ | 76,512 | |
| | | | | | | | | | | | | | | | | | | | | | | | | | | | |
Year ended December 31, 2022 | | Residential Real Estate | | | Commercial
Real
Estate | | | Construction | | | Commercial | | | Home
Equity
and
Improvement | | | Consumer
Finance | | | Total | |
Beginning Allowance | | $ | 12,029 | | | $ | 32,399 | | | $ | 3,004 | | | $ | 13,410 | | | $ | 4,221 | | | $ | 1,405 | | | $ | 66,468 | |
Charge-Offs | | | (1,052 | ) | | | (443 | ) | | | (16 | ) | | | (5,705 | ) | | | (344 | ) | | | (971 | ) | | | (8,531 | ) |
Recoveries | | | 867 | | | | 602 | | | | 3 | | | | 398 | | | 292 | | | 214 | | | | 2,376 | |
Provision expense (recovery) | | | 4,867 | | | | 1,660 | | | | 1,034 | | | | 3,666 | | | | (125 | ) | | | 1,401 | | | | 12,503 | |
Ending Allowance | | $ | 16,711 | | | $ | 34,218 | | | $ | 4,025 | | | $ | 11,769 | | | $ | 4,044 | | | $ | 2,049 | | | $ | 72,816 | |
Purchased Credit Deteriorated Loan
Under ASU Topic 326, when loans are purchased with evidence of more than insignificant deterioration of credit, they are accounted for as PCD. PCD loans acquired in a transaction are marked to fair value and a mark on yield is recorded. In addition, an adjustment is made to the ACL for the expected loss on the acquisition date. These loans are assessed on a regular basis and subsequent adjustments to the ACL are recorded on the income statement.
The outstanding balance and related allowance on these loans as of December 31, 2024 and December 31, 2023 is as follows (in thousands):
| | | | | | | | | | | | | | | | |
| | As of December 31, 2024 | | | As of December 31, 2023 | |
| | Loan Balance | | | ACL Balance | | | Loan Balance | | | ACL Balance | |
| | (Dollars In Thousands) | |
Real Estate: | | | | | | | | | | | | |
Residential | | $ | 8,895 | | | $ | 109 | | | $ | 9,882 | | | $ | 126 | |
Commercial | | | 1,628 | | | | 22 | | | | 2,040 | | | | 50 | |
Construction | | | | | | | | | — | | | | — | |
| | | 10,523 | | | | 131 | | | | 11,922 | | | | 176 | |
Other Loans: | | | | | | | | | | | | |
Commercial | | | 1,958 | | | | 81 | | | | 1,968 | | | | 351 | |
Home equity and improvement | | | 1,262 | | | | 26 | | | | 1,879 | | | | 54 | |
Consumer finance | | | 99 | | | | 4 | | | | 204 | | | | 5 | |
| | | 3,319 | | | | 111 | | | | 4,051 | | | | 410 | |
Total | | $ | 13,842 | | | $ | 242 | | | $ | 15,973 | | | $ | 586 | |
Loans to executive officers, directors, and their affiliates are as follows:
| | | | | | | | |
| | Years Ended December 31, | |
| | 2024 | | | 2023 | |
| | (Dollars In Thousands) | |
Beginning balance | | $ | 7,205 | | | $ | 20,836 | |
New loans | | | 3,161 | | | | 1,262 | |
Effect of changes in composition of related parties | | | — | | | | — | |
Repayments | | | (2,705 | ) | | | (14,893 | ) |
Ending Balance | | $ | 7,661 | | | $ | 7,205 | |
Foreclosure Proceedings
Consumer mortgage loans collateralized by residential real estate property that are in the process of foreclosure totaled $8.1 million as of December 31, 2024 and $7.9 million as of December 31, 2023.
Net revenues from the sales and servicing of mortgage loans consisted of the following:
| | | | | | | | | | | | |
| | For the Year Ended December 31, | |
| | 2024 | | | 2023 | | | 2022 | |
| | (In Thousands) | |
Gain from sale of mortgage loans | | $ | 4,555 | | | $ | 4,429 | | | $ | 5,787 | |
Mortgage loan servicing revenue (expense): | | | | | | | | | |
Mortgage loan servicing revenue | | | 7,346 | | | | 7,427 | | | | 7,464 | |
Amortization of mortgage servicing rights | | | (5,249 | ) | | | (5,044 | ) | | | (5,399 | ) |
Mortgage servicing rights valuation adjustments | | | 710 | | | | (69 | ) | | | 2,019 | |
| | | 2,807 | | | | 2,314 | | | | 4,084 | |
Net mortgage banking income | | $ | 7,362 | | | $ | 6,743 | | | $ | 9,871 | |
Activity for capitalized mortgage servicing rights (“MSRs”) and the related valuation allowance is as follows:
| | | | | | | | | | | | |
| | For the Year Ended December 31, | |
| | 2024 | | | 2023 | | | 2022 | |
| | (In Thousands) | |
Mortgage servicing assets: | | | | | | | | | |
Balance at beginning of period | | $ | 19,452 | | | $ | 21,858 | | | $ | 22,244 | |
Loans sold, servicing retained | | | 3,039 | | | | 2,638 | | | | 5,013 | |
Amortization | | | (5,249 | ) | | | (5,044 | ) | | | (5,399 | ) |
Carrying value before valuation allowance at end of period | | | 17,242 | | | | 19,452 | | | | 21,858 | |
Valuation allowance: | | | | | | | | | |
Balance at beginning of period | | | (756 | ) | | | (687 | ) | | | (2,706 | ) |
Impairment recovery (charges) | | | 710 | | | | (69 | ) | | | 2,019 | |
Balance at end of period | | | (46 | ) | | | (756 | ) | | | (687 | ) |
Net carrying value of MSRs at end of period | | $ | 17,196 | | | $ | 18,696 | | | $ | 21,171 | |
Fair value of MSRs at end of period | | $ | 25,858 | | | $ | 28,204 | | | $ | 27,382 | |
Amortization of mortgage servicing rights is computed based on payments and payoffs of the related mortgage loans serviced.
The Company had no actual losses from secondary market buy-backs in 2024, 2023 or 2022. No expense was recognized related to an accrual for the years ended December 31, 2024, 2023 or 2022.
The Company’s servicing portfolio is comprised of the following:
| | | | | | | | | | | | | | | | |
| | December 31, | |
| | 2024 | | | 2023 | |
| | Number of | | | Principal | | | Number of | | | Principal | |
Investor | | Loans | | | Outstanding | | | Loans | | | Outstanding | |
| | (Dollars In Thousands) | |
Fannie Mae | | | 7,455 | | | $ | 957,990 | | | | 7,297 | | | $ | 914,489 | |
Freddie Mac | | | 15,046 | | | | 1,847,710 | | | | 15,915 | | | | 1,959,546 | |
Federal Home Loan Bank | | | 178 | | | | 43,196 | | | | 104 | | | | 22,701 | |
Other | | | 32 | | | | 2,347 | | | | 38 | | | | 2,999 | |
Totals | | | 22,711 | | | $ | 2,851,243 | | | | 23,354 | | | $ | 2,899,735 | |
Custodial escrow balances maintained in connection with serviced loans were $31.5 million and $31.2 million at December 31, 2024 and 2023, respectively.
Significant assumptions at December 31, 2024, used in determining the value of MSRs include a weighted average prepayment speed assumption (“PSA”) of 151 and a weighted average discount rate of 9.04%. Significant assumptions at December 31, 2023, used in determining the value of MSRs include a weighted average prepayment rate of 117 PSA and a weighted average discount rate of 9.02%.
8.Premises and Equipment and Leases
Premises and equipment are summarized as follows:
| | | | | | | | |
| | December 31, | |
| | 2024 | | | 2023 | |
| | (In Thousands) | |
Cost: | | | | | | |
Land | | $ | 13,377 | | | $ | 14,138 | |
Land improvements | | | 2,088 | | | | 1,923 | |
Buildings | | | 60,626 | | | | 60,463 | |
Leasehold improvements | | | 3,219 | | | | 3,219 | |
Furniture, fixtures and equipment | | | 47,943 | | | | 44,424 | |
Construction in process | | | 1,679 | | | | 4,312 | |
| | | 128,932 | | | | 128,479 | |
Less allowances for depreciation and amortization | | | (75,249 | ) | | | (71,601 | ) |
| | $ | 53,683 | | | $ | 56,878 | |
Depreciation expense was $5.8 million, $5.3 million and $5.6 million for the years ended December 31, 2024, 2023 and 2022, respectively.
Leases
The Company’s operating lease agreements have maturity dates ranging from January 2025 to September 2044, some of which include options for multiple five and ten year extensions. The weighted average remaining life of the lease term for these leases was 12.17 and 13.27 years as of December 31, 2024 and 2023, respectively. The weighted average remaining life of the lease term for finance leases was 6.49 years at December 31, 2024 and 6.84 years as of December 31, 2023.
The discount rate used in determining the lease liability for each individual lease was the FHLB fixed advance rate or swap rate which corresponded with the remaining lease term as of January 1, 2019 for leases that existed at adoption and as of the lease commencement date for leases subsequently entered into. The weighted average discount rate for operating leases was 2.84% and 2.58% as of December 31, 2024 and 2023, respectively. The weighted average discount rate for finance leases was 4.54% as of December 31, 2024 and 4.81% as of December 31, 2023.
The total operating lease costs were $2.3 million for the year ended December 31, 2024 and $2.2 million for the year ended 2023. The ROU asset, included in other assets, was $21.1 million and $13.5 million at December 31, 2024 and 2023, respectively. The lease liabilities, included in other liabilities, were $21.7 million and $13.9 million as of December 31, 2024 and 2023, respectively.
Undiscounted cash flows included in lease liabilities have expected contractual payments at December 31, 2024 as follows (in thousands):
| | | | |
2025 | | $ | 3,478 | |
2026 | | | 3,163 | |
2027 | | | 2,962 | |
2028 | | | 2,687 | |
2029 | | | 2,568 | |
Thereafter | | | 10,717 | |
Total undiscounted minimum lease payments | | $ | 25,575 | |
Present value adjustment | | | (3,834 | ) |
Total lease liabilities | | $ | 21,741 | |
9.Goodwill and Intangible Assets
Goodwill
The change in the carrying amount of goodwill for the year is as follows:
| | | | | | | | |
| | December 31, | |
| | 2024 | | | 2023 | |
| | (In Thousands) | |
Beginning balance | | $ | 295,602 | | | $ | 317,988 | |
Goodwill from disposal | | | — | | | | (22,386 | ) |
Ending balance | | $ | 295,602 | | | $ | 295,602 | |
| | | | | | |
The Company tests goodwill at least annually and, more frequently, if events or changes in circumstances indicate that it may be more likely than not that there is a possible impairment. Due to the Company’s signing of the definitive agreement for the merger transaction with Wesbanco, the Company conducted a quantitative interim goodwill impairment assessment at September 30, 2024. The impairment assessment compares the fair value of identified reporting unit with their carrying amount (including goodwill). If the carrying amount of a reporting unit exceeds its fair value, an impairment loss is recognized in an amount equal to the excess. The Company's interim assessment estimated fair value on income and market approaches. The income approach incorporated a discounted cash flow model that involves management assumptions and consideration of future economic forecasts available. The market approach incorporated a combination of price to book value and price to earnings, adjusted based on companies similar to the reporting unit and adjusted for selected multiples, along with a control premium based on a review of transactions in the banking industry. Significant assumptions in the assessments were employed and included, but were not limited to, prospective financial information, growth rates, terminal value, discount rates, control premiums and comparable multiples from publicly traded companies in our industry. Results of the interim assessment was a fair value of approximately $1.2 billion compared to a carrying amount of approximately $1.0 billion indicating no goodwill impairment as of September 30, 2024. Changes in the economic environment, operations of the reporting unit or other adverse events could result in goodwill impairment as a result of a future evaluation.
Acquired Intangible Assets
Activity in intangible assets for the years ended December 31, 2024, 2023 and 2022, was as follows:
| | | | | | | | | | | | | | | | |
| | Gross
Carrying
Amount | | | | Accumulated
Amortization | | | | Net Value | |
| | (In Thousands) | |
Balance as of January 1, 2022 | | $ | 53,647 | | | | $ | (29,518 | ) | | | $ | 24,129 | |
Intangible assets acquired | | | 395 | | | | | — | | | | | 395 | |
Amortization of intangible assets | | | — | | | | | (5,450 | ) | | | | (5,450 | ) |
Balance as of December 31, 2022 | | | 54,042 | | | — | | | (34,968 | ) | | — | | | 19,074 | |
Intangible assets disposed in First Insurance sale | | | (2,284 | ) | | | | — | | | | | (2,284 | ) |
Amortization of intangible assets | | | — | | | | | (4,604 | ) | | | | (4,604 | ) |
Balance as of December 31, 2023 | | | 51,758 | | | — | | | (39,572 | ) | | — | | | 12,186 | |
Amortization of intangible assets | | | — | | | | | (3,699 | ) | | | | (3,699 | ) |
Balance as of December 31, 2024 | | $ | 51,758 | | | | $ | (43,271 | ) | | | $ | 8,487 | |
Estimated amortization expense for each of the next five years and thereafter is as follows (in thousands):
| | | | |
2025 | | | 3,004 | |
2026 | | | 2,313 | |
2027 | | | 1,645 | |
2028 | | | 1,052 | |
2029 | | | 462 | |
Thereafter | | | 11 | |
Total | | $ | 8,487 | |
The following schedule sets forth interest expense by type of deposit:
| | | | | | | | | | | | |
| | Years Ended December 31, | |
| | 2024 | | | 2023 | | | 2022 | |
| | (In Thousands) | |
Checking and money market accounts | | $ | 84,575 | | | $ | 62,295 | | | $ | 14,927 | |
Savings accounts | | | 479 | | | | 182 | | | | 174 | |
Certificates of deposit | | | 86,057 | | | | 59,930 | | | | 9,808 | |
Totals | | $ | 171,111 | | | $ | 122,407 | | | $ | 24,909 | |
A summary of deposit balances is as follows:
| | | | | | | | |
| | December 31, | |
| | 2024 | | | 2023 | |
| | (In Thousands) | |
Noninterest-bearing checking accounts | | $ | 1,475,513 | | | $ | 1,591,979 | |
Interest-bearing checking and money market accounts | | | 3,389,558 | | | | 3,177,369 | |
Savings deposits | | | 613,201 | | | | 678,076 | |
Retail certificates of deposit less than $250,000 | | | 796,561 | | | | 827,479 | |
Retail certificates of deposit greater than and equal to $250,000 | | | 520,278 | | | | 526,199 | |
Brokered deposits | | | 54,688 | | | | 341,944 | |
Totals | | $ | 6,849,799 | | | $ | 7,143,046 | |
Included in total deposits above are related-party deposits of $10.3 million and $7.7 million at December 31, 2024 and 2023, respectively.
Scheduled maturities of certificates of deposit and brokered deposits at December 31, 2024, are as follows (in thousands):
| | | | |
2025 | | | 1,264,622 | |
2026 | | | 76,371 | |
2027 | | | 15,274 | |
2028 | | | 8,020 | |
2029 | | | 6,991 | |
Thereafter | | | 249 | |
Total | | $ | 1,371,527 | |
11. Advances from Federal Home Loan Bank
The Bank has the ability to borrow funds from the FHLB. The Bank pledges its single-family residential mortgage loan portfolio, certain commercial real estate loans, and certain agriculture real estate loans as security for these advances. Advances secured by residential mortgages must have collateral of at least 152% of the borrowings. Advances secured by commercial real estate loans, and agriculture real estate loans must have collateral of at least 145% and 159% of the borrowings, respectively. Total loans pledged to the FHLB at December 31, 2024 and December 31, 2023 were $2.9 billion and $3.1 billion, respectively. The Bank could obtain advances of up to approximately $1.8 billion from the FHLB at December 31, 2024.
Each advance is payable at its maturity date, with a prepayment penalty for fixed rate advances. At December 31, 2023, the Bank had $280.0 million outstanding in FHLB advances. At December 31, 2024, advances from the FHLB were as follows (in thousands):
| | | | |
2025 | | $ | 507,000 | |
2026 | | | — | |
2027 | | | — | |
| | | |
2028 | | | — | |
2029 | | | — | |
Thereafter | | | — | |
Totals | | $ | 507,000 | |
The weighted average interest rate on advances from the FHLB is 4.48% at December 31, 2024.
12.Subordinated Debentures and Junior Subordinated Debentures Owed to Unconsolidated Subsidiary Trust
In September 2020, the Company completed the issuance of $50.0 million aggregate principal amount, fixed-to-floating rate subordinated notes due September 30, 2030 in a private offering exempt from the registration requirements under the Securities Act of 1933, as amended. The notes carry a fixed rate of 4.0% for five years at which time they will convert to a floating rate based on the secured overnight financing rate, plus a spread of 388.5 basis points. The Company may, at its option, beginning September 30, 2025, redeem the notes, in whole or in part, from time to time, subject to certain conditions. The net proceeds from the sale were approximately $48.7 million, after deducting the estimated offering expenses. The Company’s intent was to use the net proceeds for general corporate purposes, which may include, without limitation, providing capital to support its growth organically or through strategic acquisitions, repaying indebtedness, in financing investments, capital expenditures, repurchasing its common shares and for investments in the Bank as regulatory capital. The subordinated debentures are included in Total Capital under current regulatory guidelines and interpretations.
In March 2007, the Company sponsored an affiliated trust, Premier Statutory Trust II (“Trust Affiliate II”) that issued $15.0 million of Guaranteed Capital Trust Securities (Trust Preferred Securities). In connection with the transaction, the Company issued $15.5 million of Junior Subordinated Deferrable Interest Debentures (“Subordinated Debentures”) to Trust Affiliate II. The Company formed Trust Affiliate II for the purpose of issuing Trust Preferred Securities to third-party investors and investing the proceeds from the sale of these capital securities solely in Subordinated Debentures of the Company. The Subordinated Debentures held by Trust Affiliate II are the sole assets of that trust. The Company is not considered the primary beneficiary of this Trust (variable interest entity), therefore the trust is not consolidated in the Company’s financial statements, but rather the subordinated debentures are shown as a liability. Distributions on the Trust Preferred Securities issued by Trust Affiliate II are payable quarterly at a variable rate equal to the three-month LIBOR rate plus 1.5%. As a result of the discontinuation of LIBOR, beginning with the distribution on December 15, 2023, distributions will be calculated at a variable rate equal to the three-month SOFR rate plus 1.5%. The Coupon rate payable on the Trust Preferred Securities issued by Trust Affiliate II was 6.12% and 7.15% as of December 31, 2024 and 2023, respectively.
The Trust Preferred Securities issued by Trust Affiliate II are subject to mandatory redemption, in whole or part, upon repayment of the Subordinated Debentures. The Company has entered into an agreement that fully and unconditionally guarantees the Trust Preferred Securities subject to the terms of the guarantee. The Trust Preferred Securities and Subordinated Debentures mature on June 15, 2037, but can be redeemed at the Company’s option at any time now.
The Company also sponsors an affiliated trust, Premier Statutory Trust I (“Trust Affiliate I”) that issued $20.0 million of Trust Preferred Securities in 2005. In connection with this transaction, the Company issued $20.6 million of Subordinated Debentures to Trust Affiliate I. Trust Affiliate I was formed for the purpose of issuing Trust Preferred Securities to third-party investors and investing the proceeds from the sale of these capital securities solely in Subordinated Debentures of the Company. The Junior Debentures held by Trust Affiliate I are the sole assets of the trust. The Company is not considered the primary beneficiary of this Trust (variable interest entity), therefore the trust is not consolidated in the Company’s financial statements, but rather the subordinated debentures are shown as a liability. Distributions on the Trust Preferred Securities issued by Trust Affiliate I are payable quarterly at a variable rate equal to the three-month LIBOR rate plus 1.38%. As a result of the discontinuation of LIBOR, beginning with the distribution on December 15, 2023, distributions will be calculated at a variable rate equal to the three-month SOFR rate plus 1.38%. The Coupon rate payable on the Trust Preferred Securities issued by Trust Affiliate I was 6.00% and 7.03% as of December 31, 2024 and 2023, respectively.
The Trust Preferred Securities issued by Trust Affiliate I are subject to mandatory redemption, in whole or in part, upon repayment of the Subordinated Debentures. The Company has entered into an agreement that fully and unconditionally guarantees the Trust Preferred Securities subject to the terms of the guarantee. The Trust Preferred Securities and Subordinated Debentures mature on December 15, 2035, but can be redeemed at the Company’s option at any time now.
The Subordinated Debentures related to the Trust Preferred Securities may be included in tier 1 capital (with certain limitations applicable) under current regulatory guidelines and interpretations. Interest on both issues of Trust Preferred Securities may be deferred for a period of up to five years at the option of the issuer.
A summary of all junior subordinated debentures issued by the Company to affiliates and subordinated debentures follows. For the junior subordinated debentures, these amounts represent the par value of the obligations owed to these affiliates, including the Company’s equity interest in the trusts. For the subordinated debentures, these amounts represent the par value less remaining deferred offering expense associated with the issuance the debentures. Balances were as follows:
| | | | | | | | |
| | December 31, | |
| | 2024 | | | 2023 | |
| | (In Thousands) | |
First Defiance Statutory Trust I due December 2035 | | $ | 20,619 | | | $ | 20,619 | |
First Defiance Statutory Trust II due June 2037 | | | 15,464 | | | | 15,464 | |
Total junior subordinated debentures owed to unconsolidated subsidiary Trusts | | $ | 36,083 | | | $ | 36,083 | |
| | | | | | |
Subordinated debentures | | $ | 49,273 | | | $ | 49,146 | |
13.Securities Sold Under Agreements to Repurchase and Other Short Term Borrowings
The Company has utilized securities sold under agreements to repurchase in the past to facilitate the needs of our customers and to facilitate secured short-term funding needs. Securities sold under agreements to repurchase are stated at the amount of cash received in connection with the transaction. We monitor levels on a continuous basis. We may be required to provide additional collateral based on the fair value of the underlying securities. Securities pledged as collateral under repurchase agreements are maintained with our safekeeping agent.
The Company had no outstanding securities sold under agreement to repurchase at December 31, 2024 or December 31, 2023.
As of December 31, 2024 and 2023, the Company had the following undrawn lines of credit facilities available for short-term borrowing purposes:
A $20.0 million line of credit with First Horizon Bank with a maturity date of March 31, 2025. The rate on the line of credit is at three- month SOFR + 2.50%, with a floor of 2.50%, which floats quarterly. Additionally, this line requires a $1.0 million deposit with First Horizon. This line was undrawn upon as of December 31, 2024 and 2023.
A $50.0 million line of credit with U.S. Bank.. The rate on this line of credit is U.S. Bank’s federal funds rate, which floats daily. This line was undrawn upon as of December 31, 2024 and 2023.
A $645.3 million discount window for short-term or late day borrowing needs with the Federal Reserve Bank of Cleveland. The Company pledges loan collateral to maintain borrowing capacity. This line was undrawn upon as of December 31, 2024 and 2023.
14.Other Noninterest Expense
The following is a summary of other noninterest expense:
| | | | | | | | | | | | |
| | Years Ended December 31, | |
| | 2024 | | | 2023 | | | 2022 | |
| | (In Thousands) | |
Legal and other professional fees | | $ | 4,870 | | | $ | 6,743 | | | $ | 7,622 | |
Marketing | | | 2,131 | | | | 1,714 | | | | 2,160 | |
OREO expenses and write-downs | | | 151 | | | | 220 | | | | 150 | |
Printing and office supplies | | | 892 | | | | 917 | | | | 953 | |
Postage | | | 1,422 | | | | 1,359 | | | | 1,279 | |
Check charge-offs and fraud losses | | | 1,089 | | | | 1,937 | | | | 1,350 | |
Credit and collection expense | | | 525 | | | | 637 | | | | 584 | |
Other | | | 10,742 | | | | 9,924 | | | | 11,991 | |
Total other noninterest expense | | $ | 21,822 | | | $ | 23,451 | | | $ | 26,089 | |
15.Postretirement Benefits
The Company sponsors a defined benefit postretirement plan (the Plan) that is intended to supplement Medicare coverage for certain retirees. Plan eligibility and features differ depending on the date of hire, date of retirement, age, years of service, and other specific attributes, with additional variations applicable only to certain mortgage leaders.
For employees (1) hired by the Company before January 31, 2020, excluding employees of acquired businesses even though their original hire date by the prior business may precede January 31, 2020, (2) who retire after age 55, and (3) who have a combined age plus years of service of at least 75, the Plan benefit is the contribution by the Company of a specified percentage of $10,000 in a spending account which can be used toward reimbursement of any eligible health care expenses by the retiree and their spouse. The specified percentage is based on a combination of age plus years of service with a minimum combination of at least 75.
Retirees or active employees who were at least age 52 on January 1, 2003 (and either retired or actively employed on that date), and Executive Chairman Hileman and his spouse as of December 14, 2021, are eligible to receive medical, prescription, dental, and vision coverage for the retiree and their spouse:
•For employees who retired on or after April 1, 1997, the employee’s cost for coverage is based on the employee’s combined age and years of service at retirement per the Plan’s fee structure.
•For employees who retired before April 1, 1967 after 65 years of age and 20 years of service after age 40, the cost of coverage is paid in full by the Company. The surviving spouse pays 50% of the Plan’s Fee Structure beginning one year after the retiree’s death.
•For employees who retired before April 1, 1967 after 55 years of age and 15 years of service after age 40, the retiree and spouse pay 50% of the Plan’s Fee Structure.
Included in accumulated other comprehensive income at December 31, 2024, 2023 and 2022, are the following amounts that have not yet been recognized in net periodic benefit cost:
| | | | | | | | | | | | |
| | December 31, | |
| | 2024 | | | 2023 | | | 2022 | |
| | (In Thousands) | |
Unrecognized prior service cost | | $ | 34 | | | $ | 41 | | | $ | 47 | |
Unrecognized actuarial (gain) loss | | | (691 | ) | | | (538 | ) | | | (556 | ) |
Total (gain) loss recognized in Accumulated Other Comprehensive Income | | | (657 | ) | | | (497 | ) | | | (509 | ) |
Income tax effect | | | 138 | | | | 104 | | | | 107 | |
Net (gain) loss recognized in Accumulated Other Comprehensive Income | | $ | (519 | ) | | $ | (393 | ) | | $ | (402 | ) |
Reconciliation of Funded Status and Accumulated Benefit Obligation
The plan is not currently funded. The following table summarizes benefit obligation and plan asset activity for the plan measured as of December 31 each year:
| | | | | | | | |
| | December 31, | |
| | 2024 | | | 2023 | |
| | (In Thousands) | |
Change in benefit obligation: | | | | | | |
Benefit obligation at beginning of year | | $ | 2,054 | | | $ | 2,119 | |
Service cost | | | 23 | | | | 28 | |
Interest cost | | | 90 | | | | 101 | |
Participant contribution | | | 26 | | | | 27 | |
Actuarial (gains) / losses | | | (187 | ) | | | (11 | ) |
Benefits paid | | | (127 | ) | | | (210 | ) |
Benefit obligation at end of year | | | 1,879 | | | | 2,054 | |
Change in fair value of plan assets: | | | | | | |
Balance at beginning of year | | | — | | | | — | |
Employer contribution | | | 101 | | | | 183 | |
Participant contribution | | | 26 | | | | 27 | |
Benefits paid | | | (127 | ) | | | (210 | ) |
Balance at end of year | | | — | | | | — | |
Funded status at end of year | | $ | (1,879 | ) | | $ | (2,054 | ) |
Net periodic postretirement benefit cost includes the following components:
| | | | | | | | | | | | |
| | Years Ended December 31, | |
| | 2024 | | | 2023 | | | 2022 | |
| | (In Thousands) | |
Service cost-benefits attributable to service during the period | | $ | 23 | | | $ | 28 | | | $ | 52 | |
Interest cost on accumulated postretirement benefit obligation | | | 90 | | | | 101 | | | | 67 | |
Net amortization and deferral | | | (28 | ) | | | (23 | ) | | | 10 | |
Net periodic postretirement benefit cost | | | 85 | | | | 106 | | | | 129 | |
Net (gain) / loss during the year | | | (187 | ) | | | (11 | ) | | | (599 | ) |
Amortization of prior service cost and actuarial losses | | | 28 | | | | 23 | | | | (10 | ) |
Total recognized in comprehensive income (loss) | | | (159 | ) | | | 12 | | | | (609 | ) |
Total recognized in net periodic postretirement benefit cost and other
comprehensive income | | $ | (75 | ) | | $ | 118 | | | $ | (480 | ) |
The following assumptions were used in determining the components of the postretirement benefit obligation:
| | | | | | | | | | | | |
| | 2024 | | | 2023 | | | 2022 | |
Weighted average discount rates: | | | | | | | | | |
Used to determine benefit obligations at December 31 | | | 5.40 | % | | | 4.70 | % | | | 5.00 | % |
Used to determine net periodic postretirement benefit cost for years
ended December 31 | | | 4.70 | % | | | 5.00 | % | | | 2.50 | % |
Assumed health care cost trend rates at December 31: | | | | | | | | | |
Health care cost trend rate assumed for next year | | | 5.00 | % | | | 5.50 | % | | | 6.00 | % |
Rate to which the cost trend rate is assumed to decline (the ultimate
trend rate) | | | 4.00 | % | | | 4.00 | % | | | 3.90 | % |
Year that rate reaches ultimate trend rate | | 2075 | | | 2075 | | | 2075 | |
The following benefits are expected to be paid over the next five years and in aggregate for the next five years thereafter. Because the plan is unfunded, the expected net benefits to be paid and the estimated Company contributions are the same amount.
| | | | |
| | Expected to be Paid | |
| | (In Thousands) | |
2025 | | $ | 192 | |
2026 | | | 199 | |
2027 | | | 206 | |
2028 | | | 214 | |
2029 | | | 152 | |
2030 through 2034 | | | 715 | |
Assumed health care cost trend rates have a significant effect on the amounts reported for the health care plans.
The Company expects to contribute $192,000 before reflecting expected Medicare retiree drug subsidy payments in 2025.
Premier and the Bank are subject to minimum capital adequacy guidelines. Failure to meet minimum capital requirements can initiate certain mandatory and possibly additional discretionary actions by regulators, which could have a material impact on Premier’s financial statements. Under capital adequacy guidelines, Premier and the Bank must maintain capital amounts in excess of minimum ratios based on quantitative measures of their assets, liabilities, and certain off-balance sheet items as calculated under regulatory accounting practices.
The rules include a minimum common equity tier 1 capital to risk-weighted assets ratio (“CET1”) of 4.5% and a capital conservation buffer of 2.5% of risk-weighted assets, which effectively results in a minimum CET1 ratio of 7.0%. Basel III raises the minimum ratio of tier 1 capital to risk-weighted assets from 4.0% to 6.0% (which, with the capital conservation buffer, effectively results in a minimum tier 1 capital ratio of 8.5%), which effectively results in a minimum total capital to risk-weighted assets ratio of 10.5%, and requires a minimum leverage ratio of 4.0%. Basel III also makes changes to risk weights for certain assets and off-balance sheet exposures.
The federal banking agencies have also established a system of “prompt corrective action” to resolve certain problems of undercapitalized banks. The regulatory agencies can initiate certain mandatory actions if the Bank fails to meet the minimum capital requirements, which could have a material effect on Premier’s financial statements.
The following schedule presents Premier consolidated and the Bank’s regulatory capital ratios as of December 31, 2024 and 2023 (dollars in thousands):
| | | | | | | | | | | | | | | | | | | | | | | | |
| | December 31, 2024 | |
| | Actual | | | Minimum Required for
Adequately Capitalized | | | Minimum Required to be
Well Capitalized for
Prompt Corrective Action | |
| | Amount | | | Ratio | | | Amount | | | Ratio(1) | | | Amount | | | Ratio | |
CET1 Capital (to Risk-Weighted Assets) | | | | | | | | | | | | | | | | | | |
Consolidated | | $ | 859,624 | | | | 12.62 | % | | $ | 306,515 | | | | 4.5 | % | | N/A | | | N/A | |
Premier Bank | | $ | 891,975 | | | | 13.14 | % | | $ | 305,356 | | | | 4.5 | % | | $ | 441,070 | | | | 6.5 | % |
Tier 1 Capital | | | | | | | | | | | | | | | | | | |
Consolidated | | $ | 894,624 | | | | 10.54 | % | | $ | 339,673 | | | | 4.0 | % | | N/A | | | N/A | |
Premier Bank | | $ | 891,975 | | | | 10.54 | % | | $ | 338,630 | | | | 4.0 | % | | $ | 423,288 | | | | 5.0 | % |
Tier 1 Capital (to Risk Weighted Assets) | | | | | | | | | | | | | | | | | | |
Consolidated | | $ | 894,624 | | | | 13.13 | % | | $ | 408,687 | | | | 6.0 | % | | N/A | | | N/A | |
Premier Bank | | $ | 891,975 | | | | 13.14 | % | | $ | 407,142 | | | | 6.0 | % | | $ | 542,856 | | | | 8.0 | % |
Total Capital (to Risk Weighted Assets) | | | | | | | | | | | | | | | | | | |
Consolidated | | $ | 1,022,976 | | | | 15.02 | % | | $ | 544,916 | | | | 8.0 | % | | N/A | | | N/A | |
Premier Bank | | $ | 969,156 | | | | 14.28 | % | | $ | 542,856 | | | | 8.0 | % | | $ | 678,570 | | | | 10.0 | % |
(1) Excludes capital conservation buffer of 2.50% as of December 31, 2024.
| | | | | | | | | | | | | | | | | | | | | | | | |
| | December 31, 2023 | |
| | Actual | | | Minimum Required for
Adequately Capitalized | | | Minimum Required to be
Well Capitalized for
Prompt Corrective Action | |
| | Amount | | | Ratio | | | Amount | | | Ratio(1) | | | Amount | | | Ratio | |
CET1 Capital (to Risk-Weighted Assets) | | | | | | | | | | | | | | | | | | |
Consolidated | | $ | 826,639 | | | | 11.70 | % | | $ | 318,003 | | | | 4.5 | % | | N/A | | | N/A | |
Premier Bank | | $ | 871,342 | | | | 12.38 | % | | $ | 316,676 | | | | 4.5 | % | | $ | 457,421 | | | | 6.5 | % |
Tier 1 Capital | | | | | | | | | | | | | | | | | | |
Consolidated | | $ | 861,639 | | | | 10.26 | % | | $ | 335,772 | | | | 4.0 | % | | N/A | | | N/A | |
Premier Bank | | $ | 871,342 | | | | 10.42 | % | | $ | 334,641 | | | | 4.0 | % | | $ | 418,301 | | | | 5.0 | % |
Tier 1 Capital (to Risk Weighted Assets) | | | | | | | | | | | | | | | | | | |
Consolidated | | $ | 861,639 | | | | 12.19 | % | | $ | 424,005 | | | | 6.0 | % | | N/A | | | N/A | |
Premier Bank | | $ | 871,342 | | | | 12.38 | % | | $ | 422,235 | | | | 6.0 | % | | $ | 562,980 | | | | 8.0 | % |
Total Capital (to Risk Weighted Assets) | | | | | | | | | | | | | | | | | | |
Consolidated | | $ | 991,873 | | | | 14.04 | % | | $ | 565,339 | | | | 8.0 | % | | N/A | | | N/A | |
Premier Bank | | $ | 951,576 | | | | 13.52 | % | | $ | 562,980 | | | | 8.0 | % | | $ | 703,725 | | | | 10.0 | % |
(1) Excludes capital conservation buffer of 2.50% as of December 31, 2023.
Dividend Restrictions - Dividends paid by the Bank to Premier are subject to various regulatory restrictions. In 2024, the Bank paid $60.0 million in dividends to Premier. In 2023, the Bank paid $26.5 million in dividends to Premier and received $29.8 million cash contribution from Premier. The Bank may not pay dividends to Premier in excess of its net profits (as defined by statute) for the last two fiscal years, plus any year to date net profits without the approval of the ODFI. As of December 31, 2024, the Bank could dividend up to an additional $126.1 million to Premier. First Insurance paid $1.0 million in dividends to Premier in 2024 and $43.0 million in dividends in 2023. PFC Risk Management did not pay dividends to Premier in 2024 and 2023. PFC Capital did not pay dividends or receive a cash contribution in 2024 and 2023.
The components of income tax expense are as follows:
| | | | | | | | | | | | |
| | Years Ended December 31, | |
| | 2024 | | | 2023 | | | 2022 | |
| | (In Thousands) | |
Current: | | | | | | | | | |
Federal | | $ | 17,838 | | | $ | 30,323 | | | $ | 24,698 | |
State and local | | | 843 | | | | 793 | | | | 704 | |
Deferred | | | (408 | ) | | | (2,934 | ) | | | (1,306 | ) |
| | $ | 18,273 | | | $ | 28,182 | | | $ | 24,096 | |
The effective tax rates differ from federal statutory rate applied to income before income taxes due to the following:
| | | | | | | | | | | | |
| | Years Ended December 31, | |
| | 2024 | | | 2023 | | | 2022 | |
| | (In Thousands) | |
Tax expense at statutory rate (21%) | | $ | 18,833 | | | $ | 29,289 | | | $ | 26,519 | |
Increases (decreases) in taxes from: | | | | | | | | | |
State income tax – net of federal tax benefit | | | 666 | | | | 627 | | | | 557 | |
Tax exempt interest income, net of TEFRA | | | (173 | ) | | | (484 | ) | | | (723 | ) |
Bank owned life insurance | | | (1,137 | ) | | | (1,053 | ) | | | (829 | ) |
Captive insurance | | | — | | | | (368 | ) | | | (417 | ) |
Sale of First Insurance goodwill | | | — | | | | 1,515 | | | | — | |
Merger costs | | | 527 | | | | — | | | | — | |
Other | | | (443 | ) | | | (1,344 | ) | | | (1,011 | ) |
Totals | | $ | 18,273 | | | $ | 28,182 | | | $ | 24,096 | |
Deferred federal income taxes reflect the net tax effects of temporary differences between the carrying amounts of assets and liabilities for financial reporting purposes and the amounts used for income tax purposes.
Significant components of Premier’s deferred federal income tax assets and liabilities are as follows:
| | | | | | | | |
| | December 31, | |
| | 2024 | | | 2023 | |
| | (In Thousands) | |
Deferred federal income tax assets: | | | | | | |
Allowance for credit losses | | $ | 15,895 | | | $ | 16,068 | |
Allowance for unfunded commitments | | | 610 | | | | 905 | |
Interest on nonaccrual loans | | | 963 | | | | 535 | |
Postretirement benefit costs | | | 443 | | | | 394 | |
Cash flow hedge derivatives | | | 7,919 | | | | 7,261 | |
Deferred compensation | | | 2,372 | | | | 2,069 | |
Individually evaluated loans | | | 71 | | | | 244 | |
Net unrealized loss on available-for-sale securities | | | 33,913 | | | | 33,768 | |
Equity securities fair value | | | — | | | | 88 | |
Accrued bonus | | | 1,073 | | | | 1,132 | |
Lease liability | | | 4,566 | | | | 2,924 | |
Net operating loss carryforward | | | 170 | | | | 204 | |
Other | | | 1,572 | | | | 1,943 | |
Total deferred federal income tax assets | | | 69,567 | | | | 67,535 | |
Deferred federal income tax liabilities: | | | | | | |
Equity securities fair value | | | 8 | | | | — | |
Goodwill | | | 3,148 | | | | 3,126 | |
Mortgage servicing rights | | | 3,611 | | | | 3,926 | |
Cash flow hedge derivatives | | | 8 | | | | 63 | |
Fixed assets | | | 2,823 | | | | 2,541 | |
Other intangible assets | | | 1,756 | | | | 2,522 | |
Deferred loan origination fees and costs | | | 2,768 | | | | 2,607 | |
Prepaid expenses | | | 725 | | | | 678 | |
Right of use asset | | | 4,426 | | | | 2,838 | |
Earnout on sale of FIG | | | 337 | | | | 320 | |
Other | | | 40 | | | | 228 | |
Total deferred federal income tax liabilities | | | 19,650 | | | | 18,849 | |
Net deferred federal income tax asset/ (liability) | | $ | 49,917 | | | $ | 48,686 | |
The realization of the Company’s deferred tax assets is dependent upon the Company’s ability to generate taxable income in future periods and the reversal of deferred tax liabilities during the same period. The Company has evaluated the available evidence supporting the realization of its deferred tax assets and determined it is more likely than not that the assets will be realized and thus no valuation allowance was required at December 31, 2024.
Retained earnings at December 31, 2024, included approximately $32.1 million for which no tax provision for federal income taxes had been made. This amount represents the tax bad debt reserve at December 31, 1987, which is the end of the Company’s base year for purposes of calculating the bad debt deduction for tax purposes. If this portion of retained earnings is used in the future for any purpose other than to absorb bad debts, the amount used will be added to future taxable income. The unrecorded deferred tax liability on the above amount at December 31, 2024, was approximately $6.7 million.
The total amount of interest and penalties recorded in the income statement was $0 for each of the years ended December 31, 2024, 2023 and 2022. The amount accrued for interest and penalties was $0 at December 31, 2024, 2023 and 2022.
The Company and its subsidiaries are subject to U.S. federal income tax as well as income tax in the states of Indiana and West Virginia. The Company is no longer subject to examination by taxing authorities for years before 2021. At December 31, 2024, the Company also operated in the states of Ohio, Pennsylvania and Michigan, which tax financial institutions based on their equity rather than their income.
The Company’s net operating loss of $811,000 will be carried forward to use against future taxable income. The net operating loss carryforwards begin to expire in the year ending December 31, 2029. This tax benefit is subject to an annual limitation under Internal Revenue Code Section 382; however, Premier and the Bank expect to utilize the full amount of the benefit.
18.Employee Benefit Plans
401(k) Plan
Employees of Premier are eligible to participate in the Premier Financial Corp. 401(k) Employee Savings Plan (the “Premier 401(k)”) if they meet certain age and service requirements. Under the Premier 401(k), Premier matches 100% of the participants’ contributions up to 3% of compensation and then 50% of the participants’ contributions for the next 2% of compensation. The Premier 401(k) also provides for a discretionary Premier contribution in addition to the Premier matching contribution. Premier matching contributions totaled $2.4 million, $2.6 million and $2.7 million for the years ended December 31, 2024, 2023 and 2022, respectively. There were no discretionary contributions in any of those years.
Group Life Plan
The executive group life plan covers various employees, including the Company’s named executive officers. Under the terms of the group life plan, the Bank will purchase and own life insurance policies covering the lives of employees selected by the Board of Directors of the Bank as participants. There was $(37,000), $(27,000) and $411,000 of expense/(recovery) recorded for the years ended December 31, 2024, 2023 and 2022, respectively, with a liability of $2.0 million for future benefits recorded at both December 31, 2024 and 2023, respectively.
Deferred Compensation
The deferred compensation plans cover all directors and certain employees that elect to participate. Under the plans, the Company pays each participant, or their beneficiary, the amount of fees deferred plus interest over a defined time period. The deferred compensation plans have approximately $14.5 million and $10.7 million in assets and liabilities, respectively, as of December 31, 2024, which are matched in terms of investment elections. As of December 31, 2023, the deferred compensation plans had approximately $12.4 million and $9.3 million in assets and liabilities, respectively, which were matched in terms of investment elections. Every year, other noninterest expense reflects the net changes in fair value of the underlying investments in the assets and liabilities. The net expense (income) recorded for the deferred compensation plan for each of the last three years was $201,000, $309,000 and $414,000 in 2024, 2023 and 2022, respectively.
19.Stock Compensation Plans
Premier has established equity based compensation plans for its directors and employees. On February 27, 2018, the Board adopted, and the shareholders approved at the 2018 Annual Shareholders Meeting, the Premier Financial Corp. 2018 Equity Incentive Plan (the “2018 Equity Plan”). The 2018 Equity Plan replaced all existing plans, although the Company’s former equity plans remain in existence to the extent there were outstanding grants thereunder at the time the 2018 Equity Plan was approved. In addition, as a result of the Company's merger (the "Merger") with United Community Financial Corp. ("UCFC"), Premier assumed certain outstanding stock options granted under UCFC’s Amended and Restated 2007 Long-Term Incentive Plan (the “UCFC 2007 Plan”) and UCFC’s 2015 Long Term Incentive Plan, which has since been renamed as the “Premier Financial Corp. 2015 Long Term Incentive Plan” (the “2015 Plan”). Premier also assumed the shares available for future issuance under the 2015 Plan as of the effective date of the Merger, with appropriate adjustments to the number of shares available to reflect the Merger. The stock options assumed from UCFC in the Merger remain subject to the terms of the 2015 Plan, but became exercisable solely to purchase shares of Premier, with appropriate adjustments to the number of shares subject to the assumed stock options and the exercise price of such stock options. Besides certain options previously issued under the First Defiance Financial Corp. 2010 Equity Incentive Plan, all awards currently outstanding are issued under the 2018 Equity Plan or the 2015 Plan. The 2018 Equity Plan and the 2015 Plan were each amended and restated in February 2022 to align certain administrative components of the plans in addition to enhancing certain governance components. New awards will be made under either the 2018 Equity Plan or the 2015 Plan as the Company determines. The 2018 Equity Plan allows for issuance of up to 900,000 common shares through the award of options, restricted stock, stock, stock appreciation rights, or other stock-based awards. The 2015 Plan allows for the issuance of up to 1.2 million common shares, as adjusted for the Merger, through the award of options, stock, restricted stock, stock units, stock appreciation rights, or performance stock awards.
Beginning in 2023, directors were able to elect to receive stock in lieu of cash for their director fees. In the twelve months ended December 31, 2024, the Company did not issue any shares or recognize any expense for shares. In the twelve months ended December 31, 2023, the Company recognized $80,000 in expense for 4,114 shares that were issued to directors in lieu of cash fees.
The Company maintains Long-Term Equity Incentive Plans (each, an "LTIP") for select members of management (the "Executive LTIP") and a Key Employee and Commercial Lender Plan (the "Key Plan"). Under the Executive LTIP, participants may earn a percentage of their salary for potential payout in the form of (1) equity awards based on the achievement of certain corporate performance targets over a three-year period and (2) beginning in 2023, restricted stock awards ("RSAs"). The Company granted 82,737 performance stock units ("PSUs") to the participants under the Executive LTIP during 2024, which represents the maximum target award. The value of PSU awards issued in 2022, 2023 and 2024 under the Executive LTIP will be determined individually at the end of each respective 36 month performance period ending December 31. The benefits earned under these PSUs will be paid out in equity in the first quarter following the end of the performance period. The participants will receive all or a portion of the award if their employment is terminated
by the Company without cause, by the participant in certain situations, or by death, disability or retirement of the participant. The RSAs issued under the Executive LTIP vest incrementally over three years, being fully vested upon the third anniversary of the grant date. The Company granted 28,702 RSAs under the Executive LTIP in 2024.
The maximum amount of compensation expense that may be earned for the PSUs at December 31, 2024, is approximately $5.7 million in the aggregate. However, the estimated expense that is expected to be earned as of December 31, 2024 is $3.8 million, of which $2.5 million was unrecognized at December 31, 2024, and will be recognized over the remaining performance periods. Total expense was reduced by $503,000 and was recorded for $443,000 for the years ended December 31, 2024 and December 31, 2023, respectively.
Beginning in 2022, under the Key Plan, the participants are granted restricted stock awards ("RSAs") based upon the achievement of certain targets in the prior year. Prior to 2022, restricted stock units ("RSUs") were issued to participants under the same plan. The participants can earn from 5% to 10% of their salary in RSAs or RSUs that vest three years from the date of grant. The Company granted 31,139 and 25,044 in RSAs in the first quarter of 2024 and 2023, respectively, as a payout under the Key Plan.
In 2024, the Company also granted 9,471 discretionary RSAs and 24,768 RSAs to directors that vest over a period of time ranging from one to three years. Compensation expense is recognized over the performance or vesting period. Total expense of $2.1 million and $1.9 million was recorded for the years ended December 31, 2024 and 2023, respectively. Approximately $1.4 million and $1.9 million is included within other liabilities at December 31, 2024 and December 31, 2023, respectively, related to the cash portion of the Company's Short-Term Incentive Plans.
The following table sets forth Premier's performance and restricted stock activity during the year ended December 31, 2024:
| | | | | | | | | | | | | | | | | | | | | | | | |
| | Performance Stock Units | | | Restricted Stock Units | | | Restricted Stock Awards | |
Unvested Shares | | Shares | | | Weighted-
Average
Grant Date
Fair Value | | | Shares | | | Weighted-
Average
Grant Date
Fair Value | | | Shares | | | Weighted-
Average
Grant Date
Fair Value | |
Unvested at January 1, 2024 | | | 217,562 | | | $ | 28.75 | | | | 18,625 | | | $ | 29.52 | | | | 153,779 | | | $ | 25.49 | |
Granted | | | 82,737 | | | | 19.43 | | | | — | | | | — | | | | 94,080 | | | | 19.88 | |
Vested | | | (23,245 | ) | | | 30.08 | | | | (18,625 | ) | | | 29.52 | | | | (50,679 | ) | | | 23.68 | |
Forfeited | | | (57,688 | ) | | | 30.17 | | | | — | | | | — | | | | (5,203 | ) | | | 24.10 | |
Unvested at December 31, 2024 | | | 219,366 | | | $ | 24.72 | | | | — | | | $ | — | | | | 191,977 | | | $ | 23.26 | |
As of December 31, 2024, 22,175 options to acquire Premier shares were outstanding at option prices based on the market value of the underlying shares on the date the options were granted. All options expire ten years from the date of grant. Vested options of retirees expire on the earlier of the scheduled expiration date or one year after the retirement date.
The fair value of each option award is estimated on the date of grant using the Black-Scholes model. Expected volatilities are based on historical volatilities of the Company’s common shares. The Company uses historical data to estimate option exercise and post-vesting termination behavior. The expected term of options granted is based on historical data and represents the period of time that options granted are expected to be outstanding, which takes into account that the options are not transferable. The risk-free interest rate for the expected term of the option is based on the U.S. Treasury yield curve in effect at the time of the grant.
There were no options granted during the years ended December 31, 2024 and 2023.
Following is stock option activity under the plans during the year ended December 31, 2024:
| | | | | | | | | | | | | | | | |
| | Options
Outstanding | | | Weighted
Average
Exercise Price | | | Weighted
Average
Remaining
Contractual
Term (in years) | | | Aggregate
Intrinsic
Value
(in 000’s) | |
Options outstanding, January 1, 2024 | | | 28,175 | | | $ | 23.18 | | | | | | | |
Forfeited or cancelled | | | — | | | | — | | | | | | | |
Exercised | | | (6,000 | ) | | | 17.68 | | | | | | | |
Granted | | | — | | | | — | | | | | | | |
Options outstanding, December 31, 2024 | | | 22,175 | | | | 24.67 | | | | 2.72 | | | $ | 27,920 | |
Exercisable at December 31, 2024 | | | 22,175 | | | $ | 24.67 | | | | 2.72 | | | $ | 27,920 | |
Proceeds, related tax benefits realized from options exercised and intrinsic value of options exercised were as follows:
| | | | | | | | | | | | |
| | Year Ended December 31, | |
| | 2024 | | | 2023 | | | 2022 | |
| | (In Thousands, except per share amounts) | |
Intrinsic value of options exercised | | $ | 54 | | | $ | 12 | | | $ | 29 | |
Cash received from option exercises | | | 106 | | | | 15 | | | | 53 | |
Tax benefit realized from option exercises | | | 9 | | | | 3 | | | | 6 | |
As of December 31, 2024, there was a de minimus amount of total unrecognized compensation costs related to unvested stock options granted under the Company’s equity plans. The cost is expected to be recognized over a weighted-average period of one month.
20.Parent Company Statements
Condensed parent company financial statements, which include transactions with subsidiaries, are as follow:
| | | | | | | | |
| | December 31, | |
Statements of Financial Condition | | 2024 | | | 2023 | |
| | (In Thousands) | |
Assets | | | | | | |
Cash and cash equivalents | | $ | 30,757 | | | $ | 15,314 | |
Equity securities | | | 4,037 | | | | 5,773 | |
Investment in banking subsidiary | | | 1,034,164 | | | | 1,020,329 | |
Investment in non-bank subsidiaries | | | 15,166 | | | | 16,053 | |
Other assets | | | 5,032 | | | | 5,425 | |
Total assets | | $ | 1,089,156 | | | $ | 1,062,894 | |
Liabilities and stockholders’ equity: | | | | | | |
Subordinated debentures | | $ | 85,356 | | | $ | 85,229 | |
Accrued liabilities | | | 1,987 | | | | 2,038 | |
Stockholders’ equity | | | 1,001,813 | | | | 975,627 | |
Total liabilities and stockholders’ equity | | $ | 1,089,156 | | | $ | 1,062,894 | |
| | | | | | | | | | | | |
| | Years Ended December 31, | |
Statements of Income | | 2024 | | | 2023 | | | 2022 | |
| | (In Thousands) | |
Dividends from subsidiaries | | $ | 61,000 | | | $ | 69,500 | | | $ | 58,550 | |
Interest income | | | 495 | | | | 465 | | | | 657 | |
Interest expense | | | (4,591 | ) | | | (4,531 | ) | | | (3,327 | ) |
Other income | | | — | | | | — | | | | — | |
Noninterest expense | | | (1,149 | ) | | | (1,261 | ) | | | (1,391 | ) |
Other income (expense) | | | 550 | | | | (453 | ) | | | (551 | ) |
Income before income taxes and equity in earnings of subsidiaries | | | 56,305 | | | | 63,720 | | | | 53,938 | |
Income tax credit | | | (986 | ) | | | (1,214 | ) | | | (969 | ) |
Income before equity in earnings of subsidiaries | | | 57,291 | | | | 64,934 | | | | 54,907 | |
Undistributed equity in earnings of subsidiaries | | | 14,113 | | | | 46,361 | | | | 47,280 | |
Net income | | | 71,404 | | | | 111,295 | | | | 102,187 | |
Other comprehensive income (loss) | | | (3,099 | ) | | | 19,741 | | | | (170,032 | ) |
Comprehensive income (loss) | | $ | 68,305 | | | $ | 131,036 | | | $ | (67,845 | ) |
| | | | | | | | | | | | |
| | Years Ended December 31, | |
Statements of Cash Flows | | 2024 | | | 2023 | | | 2022 | |
| | (In Thousands) | |
Operating activities: | | | | | | | | | |
Net income | | $ | 71,404 | | | $ | 111,295 | | | $ | 102,187 | |
Adjustments to reconcile net income to net cash (used in)
provided by operating activities: | | | | | | | | | |
Undistributed equity in earnings of subsidiaries | | | (14,113 | ) | | | (46,361 | ) | | | (47,280 | ) |
Return of capital from subsidiary | | | — | | | | 6,123 | | | | — | |
Change in other assets and liabilities | | | 275 | | | | 1,415 | | | | 156 | |
Net cash provided by operating activities | | | 57,566 | | | | 72,472 | | | | 55,063 | |
Investing activities: | | | | | | | | | |
Cash distribution to subsidiary | | | — | | | | (29,750 | ) | | | — | |
Sale of equity securities | | | 2,286 | | | | 1,606 | | | | 8,714 | |
Purchase of equity securities | | | — | | | | — | | | | (3,000 | ) |
Net cash provided by (used in) investing activities | | | 2,286 | | | | (28,144 | ) | | | 5,714 | |
Financing activities: | | | | | | | | | |
Repurchase of common stock | | | — | | | | (11 | ) | | | (26,870 | ) |
Cash dividends paid | | | (44,409 | ) | | | (44,267 | ) | | | (42,795 | ) |
Net cash used in financing activities | | | (44,409 | ) | | | (44,278 | ) | | | (69,665 | ) |
Net increase (decrease) in cash and cash equivalents | | | 15,443 | | | | 50 | | | | (8,888 | ) |
Cash and cash equivalents at beginning of year | | | 15,314 | | | | 15,264 | | | | 24,152 | |
Cash and cash equivalents at end of year | | $ | 30,757 | | | $ | 15,314 | | | $ | 15,264 | |
FASB ASC Topic 820, Fair Value Measurements, defines fair value as the price that would be received to sell an asset or paid to transfer a liability (an exit price) in an orderly transaction between market participants. A fair value measurement assumes that the transaction to sell the asset or transfer the liability occurs in the principal market for the asset or liability or, in the absence of a principal market, the most advantageous market for the asset or liability. The price in the principal (or most advantageous) market used to measure the fair value of the asset or liability shall not be adjusted for transaction costs. An orderly transaction is a transaction that assumes exposure to the market for a period prior to the measurement date to allow for marketing activities that are usual and customary for transactions involving such assets and liabilities; it is not a forced transaction. Market participants are buyers and sellers in the principal market that are (i) independent, (ii) knowledgeable, (iii) able to transact and (iv) willing to transact.
FASB ASC Topic 820 requires the use of valuation techniques that are consistent with the market approach, the income approach and/or the cost approach. The market approach uses prices and other relevant information generated by market transactions involving identical or comparable assets and liabilities. The income approach uses valuation techniques to convert future amounts, such as cash flows or earnings, to a single present amount on a discounted basis. The cost approach is based on the amount that currently would be required to replace the service capacity of an asset (replacement cost). Valuation techniques should be consistently applied. Inputs to valuation techniques refer to the assumptions that market participants would use in pricing the asset or liability. Inputs may be observable, meaning those that reflect the assumptions market participants would use in pricing the asset or liability developed based on the best information available. In that regard, FASB ASC Topic 820 established a fair value hierarchy for valuation inputs that gives the highest priority to quoted prices in active markets for identical assets or liabilities and the lowest priority to unobservable inputs. The fair value hierarchy is as follows:
•Level 1: Quoted prices (unadjusted) in active markets for identical assets or liabilities that the reporting entity has the ability to access at the measurement date.
•Level 2: Inputs other than quoted prices included in Level 1 that are observable for the asset or liability, either directly or indirectly. These might include quoted prices for similar assets or liabilities in active markets, quoted prices for identical or similar assets or liabilities in markets that are not active, inputs other than quoted prices that are observable for the asset or liability (such as interest rates, prepayment speeds, credit risks, etc.) or inputs that are derived principally from or corroborated by market data by a correlation or other means.
•Level 3: Unobservable inputs for determining fair value of assets and liabilities that reflect an entity’s own assumptions about the assumptions that market participants would use in pricing the assets or liabilities.
A description of the valuation methodologies used for instruments measured at fair value, as well as the general classification of such instruments pursuant to the valuation hierarchy, is set forth below.
Available-for-sale securities - Securities classified as available for sale are generally reported at fair value utilizing Level 2 inputs where the Company obtains fair value measurements from an independent pricing service that uses matrix pricing, which is a mathematical technique widely used in the industry to value debt securities without relying exclusively on quoted prices for the specific securities but rather by relying on the securities’ relationship to other benchmark quoted securities (Level 2 inputs). The fair value measurements consider observable data that may include dealer quotes, market spreads, cash flows and the bonds’ terms and conditions, among other things. Securities in Level 2 include U.S. federal government agencies, mortgage-backed securities, corporate bonds and municipal securities.
Equity securities – These securities are reported at fair value utilizing Level 1 inputs where the Company obtains quoted prices in active markets for identical equity securities.
Loans held for sale, carried at fair value – The Company has elected the fair value option for all loans held for sale.
The fair value of conventional loans held for sale is determined using the current 15 day forward contract price for either 15 or 30 year conventional mortgages (Level 2). The fair value of permanent construction loans held for sale is determined using the current 60 day forward contract price for 15 or 30 year conventional mortgages which is then adjusted for unobservable market data such as estimated fall out rates and estimated time from origination to completion of construction (Level 3).
Collateral Dependent loans - Fair values for individually analyzed, collateral dependent loans are generally based on appraisals obtained from licensed real estate appraisers and in certain circumstances consideration of offers obtained to purchase properties prior to foreclosure. Appraisals for commercial real estate generally use three methods to derive value: cost, sales or market comparison and income approach. The cost method bases value on the cost to replace the current property. Value of market comparison approach evaluates the sales price of similar properties in the same market area. The income approach considers net operating income generated by the property and an investor’s required return. Adjustments are routinely made in the appraisal process by the independent appraisers to adjust for differences between the comparable sales and income data available. Comparable sales adjustments are based on known sales prices of similar type and similar use properties and duration of time that the property has been on the market to sell. Such adjustments made in the appraisal process are typically significant and result in a Level 3 classification of the inputs for determining fair value.
Real estate held for sale - Assets acquired through or instead of loan foreclosure are initially recorded at fair value less costs to sell when acquired, establishing a new cost basis. These assets are then reviewed monthly by members of the asset review committee for valuation changes and are accounted for at lower of cost or fair value less estimated costs to sell. Fair value is commonly based on recent real estate appraisals which may utilize a single valuation approach or a combination of approaches including cost, comparable sales and the income approach. Adjustments are routinely made in the appraisal process by the independent appraisers to adjust for differences between the comparable sales and income data available. Such adjustments may be significant and typically result in a Level 3 classification of the inputs for determining fair value.
Appraisals for both collateral-dependent loans and other real estate owned are performed by certified general appraisers (for commercial properties) or certified residential appraisers (for residential properties) whose qualifications and licenses have been reviewed and verified by the Company. Once received, a member of the Company’s asset quality or collections department reviews the assumptions and approaches utilized in the appraisal. Appraisal values are discounted from 0% to 30% to account for other factors that may impact the value of collateral. In determining the value of collateral dependent loans and other real estate owned, significant unobservable inputs may be used, which include but are not limited to: physical condition of comparable properties sold, net operating income generated by the property and investor rates of return.
Mortgage servicing rights - On a quarterly basis, mortgage servicing rights are evaluated for impairment based upon the fair value of the rights as compared to the carrying amount. If the carrying amount of an individual tranche exceeds fair value, impairment is recorded on that tranche so that the servicing asset is carried at fair value. Fair value is determined at a tranche level based on a model that calculates the present value of estimated future net servicing income. The valuation model utilizes assumptions that market participants would use in estimating future net servicing income and are validated against available market data (Level 2).
Mortgage banking derivative - The fair value of mortgage banking derivatives are evaluated monthly based on derivative valuation models using quoted prices for similar assets adjusted for specific attributes of the commitments and other observable market data at the valuation date (Level 2).
Interest rate swaps – The Company periodically enters into interest rate swap agreements with its commercial customers who desire a fixed rate loan term that is longer than the Company is willing to extend. The Company then enters into a reciprocal swap agreement with a third party that offsets the interest rate risk from the interest rate swap extended to the customer. The interest rate swaps are derivative instruments which are carried at fair value on the statement of financial condition. The Company uses an independent third party that performs a market valuation analysis for both swap positions. (Level 2)
Cash flow and fair value hedge derivatives - The Company periodically enters into cash flow and fair value hedge derivative instruments to hedge the risk of variability in cash flows on the Company's floating rate loan pool, fixed rate mortgage loan pool and FHLB advances. The Company uses an independent third party to perform a market valuation analysis for these derivatives (Level 2).
The following table summarizes the financial assets measured at fair value on a recurring basis segregated by the level of the valuation inputs within the fair value hierarchy utilized to measure fair value:
Assets and Liabilities Measured on a Recurring Basis
| | | | | | | | | | | | | | | | |
December 31, 2024 | | Level 1
Inputs | | | Level 2
Inputs | | | Level 3
Inputs | | | Total Fair
Value | |
| | (In Thousands) | | | | | | | | | | |
Assets: | | | | | | | | | | | | |
Available for sale securities: | | | | | | | | | | | | |
Obligations of U.S. government corporations and agencies | | $ | — | | | $ | 98,902 | | | $ | — | | | $ | 98,902 | |
Mortgage-backed securities | | | — | | | | 164,926 | | | | — | | | | 164,926 | |
Collateralized mortgage obligations | | | — | | | | 328,743 | | | | — | | | | 328,743 | |
Asset-backed securities | | | — | | | | 250,900 | | | | — | | | | 250,900 | |
Corporate bonds | | | — | | | | 65,745 | | | | — | | | | 65,745 | |
Obligations of states and political subdivisions | | | — | | | | 198,442 | | | | — | | | | 198,442 | |
US Treasuries | | | 48,910 | | | | — | | | | — | | | | 48,910 | |
Equity securities | | | 4,037 | | | | — | | | | — | | | | 4,037 | |
Loans held for sale, at fair value | | | — | | | | 19,408 | | | | 98,556 | | | | 117,964 | |
Interest rate swaps | | | — | | | | 2,523 | | | | — | | | | 2,523 | |
Cash flow / Fair value hedge derivatives | | | — | | | | 353 | | | | — | | | | 353 | |
Mortgage banking derivatives - asset | | | — | | | | 1,952 | | | | — | | | | 1,952 | |
Liabilities: | | | | | | | | | — | | | | |
Interest rate swaps | | | — | | | | 2,519 | | | | — | | | | 2,519 | |
Cash flow / Fair value hedge derivatives | | | — | | | | 37,708 | | | | — | | | | 37,708 | |
ML FV hedge | | | — | | | | 99 | | | | — | | | | 99 | |
| | | | | | | | | | | | | | | | |
December 31, 2023 | | Level 1
Inputs | | | Level 2
Inputs | | | Level 3
Inputs | | | Total Fair
Value | |
| | (In Thousands) | | | | | | | | | | |
Assets: | | | | | | | | | | | | |
Available for sale securities: | | | | | | | | | | | | |
Obligations of U.S. government corporations and agencies | | $ | — | | | $ | 101,598 | | | $ | — | | | $ | 101,598 | |
Mortgage-backed securities | | | — | | | | 156,508 | | | | — | | | | 156,508 | |
Collateralized mortgage obligations | | | — | | | | 235,767 | | | | — | | | | 235,767 | |
Asset-backed securities | | | — | | | | 136,980 | | | | — | | | | 136,980 | |
Corporate bonds | | | — | | | | 62,420 | | | | — | | | | 62,420 | |
Obligations of states and political subdivisions | | | — | | | | 204,258 | | | | — | | | | 204,258 | |
US Treasuries | | | 49,177 | | | | — | | | | — | | | | 49,177 | |
Equity securities | | | 5,773 | | | | — | | | | — | | | | 5,773 | |
Loans held for sale, at fair value | | | — | | | | 14,397 | | | | 131,244 | | | | 145,641 | |
Interest rate swaps | | | — | | | | 2,867 | | | | — | | | | 2,867 | |
Cash flow / Fair value hedge derivatives | | | — | | | | 299 | | | | — | | | | 299 | |
Mortgage banking derivatives - asset | | | — | | | | — | | | | — | | | | — | |
Liabilities: | | | | | | | | | | | | |
Interest rate swaps | | | — | | | | 2,867 | | | | — | | | | 2,867 | |
Cash flow / Fair value hedge derivatives | | | — | | | | 35,392 | | | | — | | | | 35,392 | |
Mortgage banking derivatives - liability | | | — | | | | 4,750 | | | | — | | | | 4,750 | |
The table below presents a reconciliation of all assets measured at fair value on a recurring basis using significant unobservable inputs (Level 3) for the twelve month periods ended December 31, 2024 and 2023.
| | | | | | | |
| Construction loans held for sale | |
| Years Ended
December 31, | |
| 2024 | | | 2023 | |
Balance of recurring Level 3 assets at beginning of period | $ | 131,244 | | | $ | 91,662 | |
Total gains (losses) for the period | | | | | |
Included in change in fair value of loans held for sale | | 2,454 | | | | 9,589 | |
Originations | | 93,122 | | | | 90,667 | |
Sales | | (128,264 | ) | | | (60,674 | ) |
Balance of recurring Level 3 assets at end of period | $ | 98,556 | | | $ | 131,244 | |
For Level 3 assets and liabilities measured at fair value on a recurring basis, the significant unobservable inputs used in the fair value measurements were as follows:
| | | | | | | | | | |
December 31, 2024 | | Fair
Value | | | Valuation Technique | | Unobservable Inputs | | Range of
Inputs |
| | | | | (Dollars in Thousands) |
Construction loans held for sale | | $ | 98,556 | | | Adjusted secondary market pricing | | Adjustments | | 0.00% - 0.456% |
| | | | | | | | | | |
December 31, 2023 | | Fair Value | | | Valuation Technique | | Unobservable Inputs | | Range of
Inputs |
| | | | | (Dollars in Thousands) |
Construction loans held for sale | | $ | 131,244 | | | Adjusted secondary market pricing | | Adjustments | | 0.00 - 0.098% |
The Company has elected the fair value option for residential mortgage and permanent construction loans held for sale. These loans are intended for sale and the Company believes that fair value is the best indicator of the resolution of these loans. Interest income is recorded based on the contractual terms of the loan and in accordance with the Company’s policies.
The aggregate fair value of the residential mortgage loans held for sale at December 31, 2024 and 2023 was $19.4 million and $14.4 million, respectively and they had contractual balances of $19.6 million and $14.7 million, respectively. The difference between these two figures is recorded in gains and losses on the sale of loans held for sale. For the twelve months ended December 31, 2024, $34,000 was recorded in the gain on sale of loans held for sale for the change in fair value. For the twelve months ended December 31, 2023, $1.1 million was recorded in the gain on sale of loans held for sale for the change in fair value.
The aggregate fair value of the permanent construction loans held for sale at December 31, 2024 and 2023 was $98.6 million and $131.2 million and they had a contractual balance of $96.4 million and $133.1 million, respectively. The difference between these two figures is recorded in gains and losses on the sale of loans held for sale. For the twelve months ended December 31, 2024, $2.5 million was recorded in the gain on sale of loans held for sale for the change in fair value. For the twelve months ended December 31, 2023, $9.6 million was recorded in the gain on the sale of loans held for sale for the change in fair value.
The following table summarizes the financial assets measured at fair value on a non-recurring basis segregated by the level of the valuation inputs within the fair value hierarchy utilized to measure fair value:
Assets and Liabilities Measured on a Non-Recurring Basis
| | | | | | | | | | | | | | | | |
December 31, 2024 | | Level 1
Inputs | | | Level 2
Inputs | | | Level 3
Inputs | | | Total Fair
Value | |
| | (In Thousands) | |
Individually analyzed loans | | | | | | | | | | | | |
Commercial Real Estate | | $ | — | | | $ | — | | | $ | 5,058 | | | $ | 5,058 | |
Commercial | | | — | | | | — | | | | 23,779 | | | | 23,779 | |
| | | | | | | | | | | | |
Mortgage servicing rights | | | — | | | | 2,244 | | | | — | | | | 2,244 | |
| | | | | | | | | | | | | | | | |
December 31, 2023 | | Level 1
Inputs | | | Level 2
Inputs | | | Level 3
Inputs | | | Total Fair
Value | |
| | (In Thousands) | |
Individually analyzed loans | | | | | | | | | | | | |
Commercial Real Estate | | $ | — | | | $ | — | | | $ | 3,425 | | | $ | 3,425 | |
Commercial | | | — | | | | — | | | | 6,164 | | | | 6,164 | |
| | | | | | | | | | | | |
Mortgage servicing rights | | | — | | | | 2,744 | | | | — | | | | 2,744 | |
For Level 3 assets and liabilities measured at fair value on a nonrecurring basis as of December 31, 2024, the significant unobservable inputs used in the fair value measurements were as follows:
| | | | | | | | | | | | | | |
| | Fair
Value | | | Valuation Technique | | Unobservable Inputs | | Range of
Inputs | | Weighted
Average | |
| | | | | (Dollars in Thousands) | |
Individually analyzed Loans- Applies to loan
classes with an appraisal valuation | | $ | 28,837 | | | Appraisals which utilize sales comparison, net income and cost approach | | Discounts for collection issues and changes in market conditions | | 10-50% | | | 41.27 | % |
For Level 3 assets and liabilities measured at fair value on a nonrecurring basis as of December 31, 2023, the significant unobservable inputs used in the fair value measurements were as follows:
| | | | | | | | | | | | | | |
| | Fair
Value | | | Valuation Technique | | Unobservable Inputs | | Range of
Inputs | | Weighted
Average | |
| | | | | (Dollars in Thousands) | |
Individually analyzed Loans- Applies to loan
classes with an appraisal valuation | | $ | 9,589 | | | Appraisals which utilize sales comparison, net income and cost approach | | Discounts for collection issues and changes in market conditions | | 10-50% | | | 27.60 | % |
Individually analyzed loans, which are evaluated using the fair value of the collateral for collateral dependent loans, had a fair value of $28.8 million that includes a valuation allowance of $14.5 million and a fair value of $9.6 million that includes a valuation allowance of $4.3 million at December 31, 2024 and 2023, respectively. A provision expense of $10.2 million, $1.9 million and $1.7 million for the years ended December 31, 2024, 2023 and 2022, respectively, related to these loans was included in earnings.
Mortgage servicing rights, which are carried at the lower of cost or fair value, had a fair value of $2.2 million with a valuation allowance of $63,000 and a fair value of $2.7 million with a valuation allowance of $757,000 at December 31, 2024 and 2023, respectively. A recovery of $710,000, an expense of $69,000, and a recovery of $2.0 million was included in earnings for the years ended December 31, 2024, 2023 and 2022, respectively.
Real estate held for sale is determined using Level 3 inputs which include appraisals and are adjusted for changes in market conditions. There was no change in fair value of real estate held for sale for the years ended December 31, 2024, 2023 and 2022.
Fair Value of Financial Instruments
Much of the information used to arrive at “fair value” is highly subjective and judgmental in nature and therefore the results may not be precise. Subjective factors include, among other things, estimated cash flows, risk characteristics and interest rates, all of which are subject to change. With the exception of investment securities, the Company’s financial instruments are not readily marketable and market prices do not exist. Since negotiated prices for the instruments, which are not readily marketable, depend greatly on the motivation of the buyer and seller, the amounts that will actually be realized or paid per settlement or maturity of these instruments could be significantly different.
The carrying amount of cash and cash equivalents and accrued interest receivable, as a result of their short-term nature, is considered to be equal to fair value and are classified as Level 1.
It was not practicable to determine the fair value of FHLB stock due to restrictions placed on its transferability.
The Company uses an exit price income approach to determine the fair value of the loan portfolio. The model utilizes a discounted cash flow approach to estimate the fair value of the loans using assumptions for the coupon rates, remaining maturities, prepayment speeds, projected default probabilities, losses given defaults, and estimates of prevailing discount rates. The discounted cash flow approach
models the credit losses directly in the projected cash flows. The model applies various assumptions regarding credit, interest, and prepayment risks for the loans based on loan types, payment types and fixed or variable classifications. For all periods presented, the estimated fair value of individually analyzed loans is based on the fair value of the collateral, less estimated cost to sell, or the present value of the loan’s expected future cash flows (discounted at the loan’s effective interest rate). All individually analyzed loans are classified as Level 3 within the valuation hierarchy.
The fair value of noninterest-bearing deposits are considered equal to the amount payable on demand at the reporting date (i.e., carrying value) and are classified as Level 1. The fair value of savings, NOW and certain money market accounts are equal to their carrying amounts and are a Level 1 classification. Fair values of fixed rate certificates of deposit are estimated using a discounted cash flow calculation that applies interest rates currently being offered on certificates to a schedule of aggregated expected monthly maturities on time deposits resulting in a Level 2 classification.
The fair values of securities sold under repurchase agreements are equal to their carrying amounts resulting in a Level 1 classification. The fair value of subordinated debentures are estimated using a discounted cash flow calculation that applies interest rates currently being offered on subordinated debentures to the schedule of maturities on the subordinated debt tranches resulting in a Level 2 classification.
FHLB advances with maturities greater than 90 days are valued based on discounted cash flow analysis, using interest rates currently being quoted for similar characteristics and maturities resulting in a Level 2 classification.
The carrying values and estimated fair values of financial instruments at December 31, 2024 and 2023 were as follows:
| | | | | | | | | | | | | | | | | | | | |
| | | | | Fair Value Measurements at December 31, 2024 | |
| | | | | (In Thousands) | |
| | Carrying
Value | | | Total | | | Level 1 | | | Level 2 | | | Level 3 | |
Financial Assets: | | | | | | | | | | | | | | | |
Cash and cash equivalents | | $ | 121,489 | | | $ | 121,489 | | | $ | 121,489 | | | $ | — | | | $ | — | |
Federal Home Loan Bank Stock | | | 31,585 | | | N/A | | | N/A | | | N/A | | | N/A | |
Loans receivable, net | | | 6,400,939 | | | | 6,086,922 | | | | — | | | | — | | | | 6,086,922 | |
Accrued interest receivable | | | 35,514 | | | | 35,514 | | | | 35,514 | | | | — | | | | — | |
| | | | | | | | | | | | | | | |
Financial Liabilities: | | | | | | | | | | | | | | | |
Deposits | | $ | 6,849,799 | | | $ | 6,841,863 | | | $ | 5,478,272 | | | $ | 1,363,591 | | | $ | — | |
Advances from Federal Home Loan Bank | | | 507,000 | | | | 506,218 | | | | — | | | | 506,218 | | | | — | |
Subordinated debentures | | | 85,356 | | | | 80,323 | | | | — | | | | — | | | | 80,323 | |
Advance payments by borrowers | | | 16,145 | | | | 16,145 | | | | 16,145 | | | | — | | | | — | |
| | | | | | | | | | | | | | | | | | | | |
| | | | | Fair Value Measurements at December 31, 2023 | |
| | | | | (In Thousands) | |
| | Carrying
Value | | | Total | | | Level 1 | | | Level 2 | | | Level 3 | |
Financial Assets: | | | | | | | | | | | | | | | |
Cash and cash equivalents | | $ | 114,756 | | | $ | 114,756 | | | $ | 114,756 | | | $ | — | | | $ | — | |
Federal Home Loan Bank Stock | | | 21,760 | | | N/A | | | N/A | | | N/A | | | N/A | |
Loans receivable, net | | | 6,662,875 | | | | 6,100,394 | | | | — | | | | — | | | | 6,100,394 | |
Accrued interest receivable | | | 33,446 | | | | 33,446 | | | | 33,446 | | | | — | | | | — | |
| | | | | | | | | | | | | | | |
Financial Liabilities: | | | | | | | | | | | | | | | |
Deposits | | $ | 7,143,046 | | | $ | 7,099,593 | | | $ | 5,447,423 | | | $ | 1,652,170 | | | $ | — | |
Advances from Federal Home Loan Bank | | | 280,000 | | | | 279,213 | | | | — | | | | 279,213 | | | | — | |
Subordinated debentures | | | 85,229 | | | | 84,231 | | | | — | | | | — | | | | 84,231 | |
Advance payments by borrowers | | | 23,277 | | | | 23,277 | | | | 23,277 | | | | — | | | | — | |
22.Derivative Financial Instruments
At December 31, 2024, the Company had approximately $22.6 million of interest rate lock commitments and $285 million of forward sales of mortgage backed securities. These commitments are considered derivatives. The Bank had approximately $12.1 million of interest rate lock commitments and $385 million of forward commitments at December 31, 2023.
The fair value of these mortgage banking derivatives is reflected by a derivative asset recorded in other assets or a derivative liability recorded in other liabilities in the Consolidated Statements of Financial Condition. The table below provides data about the carrying values of these derivative instruments (in thousands):
| | | | | | | | | | | | | | | | | | | | | | | | |
| | December 31, 2024 | | | December 31, 2023 | |
| | Assets | | | (Liabilities) | | | | | | Assets | | | (Liabilities) | | | | |
| | | | | | | | Derivative | | | | | | | | | Derivative | |
| | Carrying | | | Carrying | | | Net Carrying | | | Carrying | | | Carrying | | | Net Carrying | |
| | Value | | | Value | | | Value | | | Value | | | Value | | | Value | |
| | (In Thousands) | |
Derivatives not designated as hedging
instruments | | | | | | | | | | | | | | | | | | |
Mortgage Banking | | | | | | | | | | | | | | | | | | |
Derivatives | | $ | 1,952 | | | $ | — | | | $ | 1,952 | | | $ | — | | | $ | (4,750 | ) | | $ | 4,750 | |
The table below provides data about the amount of gains and losses recognized in income on derivative instruments not designated as hedging instruments. The difference in derivative net carrying value at December 31, 2024 and 2023 represents a fair value adjustment that runs through mortgage banking income.
| | | | | | | | | | | | |
| | Years Ended December 31, | |
| | 2024 | | | 2023 | | | 2022 | |
| | (In Thousands) | |
Derivatives not designated as hedging instruments | | | | | | | | | |
Mortgage Banking Derivatives – Gain (Loss) | | $ | 6,702 | | | $ | (6,099 | ) | | $ | (987 | ) |
Interest Rate Swaps
The Company maintains an interest rate protection program for commercial loan customers. Under this program, the Company provides a customer with a fixed rate loan while creating a variable rate asset for the Company by the customer entering into an interest rate swap with terms that match the loan. The Company offsets its risk exposure by entering into an offsetting interest rate swap with an unaffiliated institution. The Company had interest rate swaps associated with commercial loans with a notional value of $118.8 million and fair value of $2.5 million in other assets and $2.5 million in other liabilities at December 31, 2024. As of December 31, 2023, the Company had interest rate swaps associated with commercial loans with a notional value of $83.7 million and fair value of $2.9 million in other assets and $2.9 million in other liabilities. The difference in fair value of $4,000, $65,000 and $72,000 between the asset and liability represents a credit valuation adjustment that flows through noninterest income as of December 31, 2024, 2023 and 2022, respectively.
Interest Rate Swaps Designated as Cash Flow Hedge and Fair Value Hedge
In May 2021, the Company entered into derivative instruments designated as a cash flow hedge. In June 2023, the Company entered into derivative instruments designated as a fair value hedge and another designated as a cash flow hedge. For a derivative instrument that is designated and qualifies as a cash flow hedge, the change in fair value of the derivative instrument is reported as a component of other comprehensive income (loss) and reclassified into earnings in the same period or periods during which the hedged transaction affects earnings. For a derivative instrument that is designated and qualified as a fair value hedge, the change in fair value is recorded to the hedged item and reclassified into earnings in the same period or periods during which the hedged transaction affects earnings.
An interest rate swap with notional amount totaling $250.0 million as of December 31, 2024 was designated as a cash flow hedge to hedge the risk of variability in cash flows (future interest receipts) attributable to changes in the contractually specified benchmark interest rate on the Company’s floating rate loan pool. The Company is receiving a fixed rate of 1.437% and paying one month SOFR. The maturity date of this interest rate swap is May 2031. The gross aggregate fair value of the swap of $37.7 million is recorded in other liabilities in the Consolidated Balance Sheets at December 31, 2024, with changes in fair value recorded net of tax in other comprehensive income (loss). As of December 31, 2023, the gross aggregate fair value of the swap of $34.6 million was recorded in other liabilities in the Consolidated Balance Sheets. The Company expects the hedge to remain highly effective during the remaining terms of the swap.
The table presented below represents data from cash flow hedges:
| | | | | | | | | | | | |
| | Year Ended December 31, 2024 | |
| | Amount of Gain (Loss) Recognized in OCI on Derivative | | | Fair Value on the Interest Rate Swap | | | Amount of Gain (Loss) Reclassified from OCI into Income | |
| | (In Thousands) | |
| | | | | | | | | |
Interest rate swap designated on cash flow hedges | | $ | (3,394 | ) | | $ | (37,708 | ) | | $ | (6,763 | ) |
| | | | | | | | | |
| | Year Ended December 31, 2023 | |
| | Amount of Gain (Loss) Recognized in OCI on Derivative | | | Fair Value on the Interest Rate Swap | | | Amount of Gain (Loss) Reclassified from OCI into Income | |
| | (In Thousands) | |
| | | | | | | | | |
Interest rate swap designated on cash flow hedges | | $ | 5,755 | | | $ | (34,575 | ) | | $ | (5,408 | ) |
| | | | |
| | December 31, 2024 | |
| | | |
Notional amount Cash Flow Hedge | | $ | 250,000 | |
Weighted average fixed pay rates | | | 1.437 | % |
Weighted average variable SOFR receive rates | | | 4.568 | % |
Weighted average remaining maturity (in years) | | | 6.4 | |
Fair value | | $ | (37,708 | ) |
Three $125.0 million interest rate swaps with a notional amount totaling $375.0 million as of December 31, 2024 were designated as fair value hedges to mitigate the risk of further interest rate increases and the subsequent impact on the valuation of the $1.3 billion associated pool of fixed rate mortgages. The gross fair value of the swaps of $100,000 are recorded in other liabilities in the Consolidated Statements of Financial Position at December 31, 2024, with changes in fair value offsetting to the fixed rate mortgage loan pool. There was $800,000 as of December 31, 2023. The Company expects the hedges to remain effective during the remaining terms of the swaps. A summary of the interest rate swaps designated as fair value hedges are presented below (dollars in thousands):
| | | | |
| | December 31, 2024 | |
| | | |
Notional amount Fair Value Hedge | | $ | 375,000 | |
Weighted average fixed pay rates | | | 4.112 | % |
Weighted average variable SOFR receive rates | | | 4.594 | % |
Weighted average remaining maturity (in years) | | | 1.1 | |
Fair value | | $ | 215 | |
An interest rate swap with a notional amount totaling $125.0 million as of December 31, 2024 was also designated as a cash flow hedge to hedge the risk of variability in cash flows attributable to changes in the contractually specified benchmark interest rate on the Company’s short-term fixed rate FHLB advances. The gross aggregate fair value of the swap of $39,000 is recorded in other assets in the Consolidated Statements of Financial Position Balance Sheets at December 31, 2024, with changes recorded net of tax in other comprehensive income (loss). The gross aggregate fair value of the swap was $44,000 as of December 31, 2023. The Company expects the hedge to remain effective during the remaining term of the swap. A summary of the interest rate swap designated as a cash flow hedge is presented below (dollars in thousands):
| | | | |
| | December 31, 2024 | |
| | | |
Notional amount Cash Flow Hedge | | $ | 125,000 | |
Weighted average fixed pay rates | | | 4.160 | % |
Weighted average variable SOFR receive rates | | | 4.861 | % |
Weighted average remaining maturity (in years) | | | 0.4 | |
Fair value | | $ | 39 | |
23.Quarterly Consolidated Results of Operations (Unaudited)
The following is a summary of the quarterly consolidated results of operations:
| | | | | | | | | | | | | | | | |
| | Three Months Ended | |
| | March 31 | | | June 30 | | | September 30 | | | December 31 | |
2024 | | (In Thousands, Except Per Share Amounts) | |
Interest income | | $ | 96,342 | | | $ | 98,470 | | | $ | 100,169 | | | $ | 97,687 | |
Interest expense | | | 46,768 | | | | 49,245 | | | | 49,988 | | | | 45,398 | |
Net interest income | | | 49,574 | | | | 49,225 | | | | 50,181 | | | | 52,289 | |
Provision for credit losses | | | 560 | | | | 3,173 | | | | (475 | ) | | | 632 | |
Provision for unfunded commitments | | | (693 | ) | | | (271 | ) | | | 185 | | | | (622 | ) |
Net interest income after provision for credit losses | | | 49,707 | | | | 46,323 | | | | 50,471 | | | | 52,279 | |
Noninterest income | | | 12,496 | | | | 12,078 | | | | 12,574 | | | | 13,063 | |
Noninterest expense | | | 39,900 | | | | 38,158 | | | | 39,125 | | | | 37,162 | |
Transaction costs | | | — | | | | 50 | | | | 2,790 | | | | 2,129 | |
Income before income taxes | | | 22,303 | | | | 20,193 | | | | 21,130 | | | | 26,051 | |
Income taxes | | | 4,514 | | | | 4,017 | | | | 4,465 | | | | 5,277 | |
Net income | | $ | 17,789 | | | $ | 16,176 | | | $ | 16,665 | | | $ | 20,774 | |
Earnings per common share: | | | | | | | | | | | | |
Basic | | $ | 0.50 | | | $ | 0.45 | | | $ | 0.46 | | | $ | 0.58 | |
Diluted | | $ | 0.50 | | | $ | 0.45 | | | $ | 0.46 | | | $ | 0.58 | |
| | | | | | | | | | | | | | | | |
| | Three Months Ended | |
| | March 31 | | | June 30 | | | September 30 | | | December 31 | |
2023 | | (In Thousands, Except Per Share Amounts) | |
Interest income | | $ | 84,156 | | | $ | 90,159 | | | $ | 94,897 | | | $ | 96,298 | |
Interest expense | | | 27,870 | | | | 36,167 | | | | 40,633 | | | | 43,747 | |
Net interest income | | | 56,286 | | | | 53,992 | | | | 54,264 | | | | 52,551 | |
Provision for credit losses | | | 3,944 | | | | 1,410 | | | | 245 | | | | 2,143 | |
Provision for unfunded commitments | | | (238 | ) | | | (870 | ) | | | (1,018 | ) | | | (382 | ) |
Net interest income after provision for credit losses | | | 52,580 | | | | 53,452 | | | | 55,037 | | | | 50,790 | |
Noninterest income | | | 12,461 | | | | 53,346 | | | | 13,253 | | | | 11,789 | |
Noninterest expense | | | 42,791 | | | | 44,495 | | | | 38,052 | | | | 37,893 | |
Income before income taxes | | | 22,250 | | | | 62,303 | | | | 30,238 | | | | 24,686 | |
Income taxes | | | 4,103 | | | | 13,912 | | | | 5,551 | | | | 4,616 | |
Net income | | $ | 18,147 | | | $ | 48,391 | | | $ | 24,687 | | | $ | 20,070 | |
Earnings per common share: | | | | | | | | | | | | |
Basic | | $ | 0.51 | | | $ | 1.35 | | | $ | 0.69 | | | $ | 0.56 | |
Diluted | | $ | 0.51 | | | $ | 1.35 | | | $ | 0.69 | | | $ | 0.56 | |
24.Other Comprehensive Income (Loss)
The before and after tax amounts allocated to each component of other comprehensive income (loss) are presented in the table below. Reclassification adjustments related to securities available for sale are included in gains on sale or call of securities in the accompanying consolidated condensed statements of income. Reclassification adjustments related to cash flow hedge derivatives are included in interest income on loans in the accompanying consolidated condensed statements of income. Reclassification adjustments related to the defined benefit postretirement medical plan are included in compensation and benefits in the accompanying consolidated condensed statements of income.
| | | | | | | | | | | | |
| | Before Tax
Amount | | | Tax Effect | | | Net of Tax
Amount | |
| | (In Thousands) | |
Year ended December 31, 2024: | | | | | | | | | |
Securities available for sale and transferred securities: | | | | | | | | | |
Change in net unrealized (loss) during the period | | $ | (688 | ) | | $ | 144 | | | $ | (544 | ) |
Reclassification adjustment for net losses included in net income | | | — | | | | — | | | | — | |
Cash flow hedge derivatives: | | | | | | | | | |
Change in net unrealized gain during the period | | | (11,954 | ) | | | 2,510 | | | | (9,444 | ) |
Reclassification adjustment for net gains included in net income | | | 8,560 | | | | (1,797 | ) | | | 6,763 | |
Defined benefit postretirement medical plan: | | | | | | | | | |
Net gain on defined benefit postretirement medical plan realized
during the period | | | 187 | | | | (39 | ) | | | 148 | |
Reclassification adjustment for net amortization and deferral on defined
benefit postretirement medical plan (included in compensation and
benefits) | | | (28 | ) | | | 6 | | | | (22 | ) |
Total other comprehensive income | | $ | (3,923 | ) | | $ | 824 | | | $ | (3,099 | ) |
| | | | | | | | | | | | |
| | Before Tax
Amount | | | Tax Effect | | | Net of Tax
Amount | |
| | (In Thousands) | |
Year ended December 31, 2023: | | | | | | | | | |
Securities available for sale and transferred securities: | | | | | | | | | |
Change in net unrealized (loss) during the period | | $ | 19,281 | | | $ | (4,049 | ) | | $ | 15,232 | |
Reclassification adjustment for net losses included in net income | | | (37 | ) | | | 8 | | | | (29 | ) |
Cash flow hedge derivatives: | | | | | | | | | |
Change in net unrealized gain during the period | | | (3,626 | ) | | | 762 | | | | (2,864 | ) |
Reclassification adjustment for net gains included in net income | | | 9,381 | | | | (1,970 | ) | | | 7,411 | |
Defined benefit postretirement medical plan: | | | | | | | | | |
Net gain on defined benefit postretirement medical plan realized
during the period | | | 11 | | | | (2 | ) | | | 9 | |
Reclassification adjustment for net amortization and deferral on defined
benefit postretirement medical plan (included in compensation and
benefits) | | | (23 | ) | | | 5 | | | | (18 | ) |
Total other comprehensive income | | $ | 24,987 | | | $ | (5,246 | ) | | $ | 19,741 | |
| | | | | | | | | | | | |
| | Before Tax
Amount | | | Tax Effect | | | Net of Tax
Amount | |
| | (In Thousands) | |
Year ended December 31, 2022: | | | | | | | | | |
Securities available for sale and transferred securities: | | | | | | | | | |
Change in net unrealized (loss) during the period | | $ | (174,953 | ) | | $ | 36,739 | | | $ | (138,214 | ) |
Reclassification adjustment for net losses included in net income | | | 1 | | | | — | | | | 1 | |
Cash flow hedge derivatives: | | | | | | | | | |
Change in net unrealized gain during the period | | | (40,494 | ) | | | 8,504 | | | | (31,990 | ) |
Reclassification adjustment for net gains included in net income | | | (392 | ) | | | 82 | | | | (310 | ) |
Defined benefit postretirement medical plan: | | | | | | | | | |
Net gain on defined benefit postretirement medical plan realized
during the period | | | 599 | | | | (126 | ) | | | 473 | |
Reclassification adjustment for net amortization and deferral on defined
benefit postretirement medical plan (included in compensation and
benefits) | | | 10 | | | | (2 | ) | | | 8 | |
Total other comprehensive income | | $ | (215,229 | ) | | $ | 45,197 | | | $ | (170,032 | ) |
Activity in accumulated other comprehensive income (loss), net of tax, was as follows:
| | | | | | | | | | | | | | | | |
| | Securities
Available
For Sale | | | Cash Flow Hedge Derivative | | | Post-
retirement
Benefit | | | Accumulated
Other
Comprehensive
Income | |
| | (In Thousands) | |
Balance January 1, 2024 | | $ | (127,033 | ) | | $ | (27,079 | ) | | $ | 393 | | | $ | (153,719 | ) |
Other comprehensive income before reclassifications | | | (544 | ) | | | (9,444 | ) | | | 148 | | | | (9,840 | ) |
Amounts reclassified from accumulated other comprehensive loss | | | — | | | | 6,763 | | | | (22 | ) | | | 6,741 | |
Net other comprehensive income during period | | | (544 | ) | | | (2,681 | ) | | | 126 | | | | (3,099 | ) |
Balance December 31, 2024 | | $ | (127,577 | ) | | $ | (29,760 | ) | | $ | 519 | | | $ | (156,818 | ) |
| | | | | | | | | | | | |
Balance January 1, 2023 | | $ | (142,236 | ) | | $ | (31,626 | ) | | $ | 402 | | | $ | (173,460 | ) |
Other comprehensive income before reclassifications | | | 15,232 | | | | (2,864 | ) | | | 9 | | | | 12,377 | |
Amounts reclassified from accumulated other comprehensive loss | | | (29 | ) | | | 7,411 | | | | (18 | ) | | | 7,364 | |
Net other comprehensive income during period | | | 15,203 | | | | 4,547 | | | | (9 | ) | | | 19,741 | |
Balance December 31, 2023 | | $ | (127,033 | ) | | $ | (27,079 | ) | | $ | 393 | | | $ | (153,719 | ) |
| | | | | | | | | | | | |
Balance January 1, 2022 | | $ | (4,023 | ) | | $ | 674 | | | $ | (79 | ) | | $ | (3,428 | ) |
Other comprehensive income before reclassifications | | | (138,214 | ) | | | (31,990 | ) | | | 473 | | | | (169,731 | ) |
Amounts reclassified from accumulated other comprehensive loss | | | 1 | | | | (310 | ) | | | 8 | | | | (301 | ) |
Net other comprehensive income during period | | | (138,213 | ) | | | (32,300 | ) | | | 481 | | | | (170,032 | ) |
Balance December 31, 2022 | | $ | (142,236 | ) | | $ | (31,626 | ) | | $ | 402 | | | $ | (173,460 | ) |
25. Business Combinations
On July 26, 2024, PFC and Wesbanco, Inc. (Nasdaq: WSBC) announced the signing of a definitive merger agreement under which PFC will merge into WSBC in a stock-for-stock transaction. Under the terms of the merger agreement, shareholders of PFC will receive 0.80 shares of WSBC common stock for each share of PFC common stock. Premier Bank, a wholly owned subsidiary of PFC, will merge into Wesbanco Bank, Inc., a wholly owned subsidiary of WSBC. Upon closing, PFC shareholders will own approximately 30% of the combined company. All necessary regulatory approvals and the approval of shareholders of both PFC and WSBC have been obtained. The merger is expected to close on or about February 28, 2025 subject to the completion of customary closing conditions.
26. Subsequent Events
In February 2025, the Company terminated each of the interest rate swaps accounted for as cash flow hedges or fair value hedges. The pre-tax amounts recorded in accumulated other comprehensive income for the fair value of the cash flow hedges was reclassified to earnings at the time of the termination.
In February 2025, the Company terminated its line of credit with First Horizon Bank prior to maturity. This line was undrawn at the time of termination.
Item 9. Changes In and Disagreements with Accountants on Accounting and Financial Disclosure
None.
Item 9A. Controls and Procedures
Disclosure Controls and Procedures
Premier’s management carried out an evaluation, under the supervision and with the participation of the chief executive officer and the chief financial officer, of the effectiveness of Premier’s disclosure controls and procedures (as such term is defined in Rules 13a-15(e) and 15d-15(e) under the Exchange Act) as of December 31, 2024. Based on this evaluation, our Chief Executive Officer and Chief Financial Officer concluded that our disclosure controls and procedures are effective to ensure that information required to be disclosed by us in reports that we file or submit under the Exchange Act is recorded, processed, summarized and reported within the time periods specified in the SEC’s rules and forms, and to ensure that information required to be disclosed by us in the reports we file or submit under the Exchange Act is accumulated and communicated to management, including our principal executive and principal financial officers, as appropriate, to allow timely decisions regarding required disclosures.
Limitations on the Effectiveness of Controls
Premier’s disclosure controls and procedures and internal control over financial reporting are designed to provide reasonable assurance of achieving their objectives as specified above. Because of its inherent limitations, disclosure controls and procedures and internal control over financial reporting may not prevent or detect misstatements. Also, projections of any evaluation of effectiveness to future periods are subject to the risk that controls may become inadequate because of changes in conditions, or that the degree of compliance with the policies or procedures may deteriorate. A control system, no matter how well conceived and operated, can provide only reasonable, not absolute, assurance that the objectives of the control system will be attained. Further, no evaluation of controls can provide absolute assurance that misstatements due to error or fraud will not occur or that all control issues and instances of fraud, if any, within Premier have been detected.
Changes in Internal Control Over Financial Reporting
There were no changes in Premier’s internal control over financial reporting (as such term is defined in Rules 13a-15(f) and 15d-15(f) under the Exchange Act) during the last fiscal quarter ended December 31, 2024, that have materially affected, or are reasonably likely to materially affect, Premier’s internal control over financial reporting.
Reports on Internal Control over Financial Reporting
The information set forth under “Management’s Report on Internal Control Over Financial Reporting” included in Item 8 herein is incorporated herein by reference.
The effectiveness of the Company’s internal control over financial reporting as of December 31, 2024 has been audited by Crowe LLP, an independent registered public accounting firm, as stated in their report which appears herein.
Item 9B. Other Information
During the three months ended December 31, 2024, none of Premier’s directors or executive officers adopted or terminated any contract, instruction or written plan for the purchase or sale of Premier securities that was intended to satisfy the affirmative defense conditions of Rule 10b5-1(c) or any “non-Rule 10b5-1” trading arrangement.
Item 9C. Disclosure Regarding Foreign Jurisdictions that Prevent Inspections
Not applicable.
PART III
Item 10. Directors, Executive Officers and Corporate Governance
(a)Information Regarding Directors and Executive Officers
Identification of Directors
COMPOSITION OF THE BOARD
Premier’s Board consists of 14 directors and is divided into three classes, with two classes having five members and one class having four members. The directors were elected by class to serve three-year terms. The terms of the three classes expire at successive annual meetings so that the shareholders elect one class of directors at each annual meeting. Each of the directors of Premier is also a director of Premier Bank.
| |
Class II – Directors elected at the 2024 Annual Meeting whose terms would have expired at the 2027 Annual Meeting: | Marty E. Adams Donald P. Hileman Nikki R. Lanier Gary M. Small Samuel S. Strausbaugh |
Class III – Directors whose terms would have expired at the 2025 Annual Meeting: | Zahid Afzal Louis M. Altman Terri A. Bettinger John L. Bookmyer |
Class I – Directors whose terms would have expired at the 2026 Annual Meeting: | Lee Burdman Jean A. Hubbard Charles D. Niehaus Mark A. Robison Richard J. Schiraldi |
| |
Directors Elected at the 2024 Annual Meeting whose terms would have expired at the 2027 Annual Meeting: |
Marty E. Adams
Director Since: 2020 Age: 72
Committees: Compensation (Chair) Governance & Nominating Executive | Since 2008, Mr. Adams has been the President of Marty Adams Consulting, LLC, where he serves as both an advisor to banks and their boards of directors and to private equity firms pertaining to bank equity investments. He is also the managing member of Strategic Value Bank Partners, LLC since 2015. Mr. Adams is presently a Director of First National Bank of America, East Lansing, Michigan (2016), and of FineMark Holdings, Inc. and FineMark National Bank & Trust, Fort Myers, Florida (October 2021) and of American Savings Bank, Honolulu, HI. He served as the interim chief executive officer of PVF Capital Corp. and Park View Federal Savings Bank, Solon, Ohio, and as president and chief operating officer of Huntington Bancshares Inc. following Huntington’s acquisition of Sky Financial Group, Inc. from July 2007 until December 2007. Mr. Adams was previously the chairman and chief executive officer of Sky Financial Group and Sky Bank. Mr. Adams served on the boards of United Community Financial Corp. and Home Savings Bank from February 2013 through January 2020. Mr. Adams’ skills and qualifications that he has developed through more than 45 years of experience in the banking and financial services industries, as well as his service in significant public company leadership positions, enable him to contribute technical knowledge to the Board in nearly all operational areas of banking. |
Donald P. Hileman
Executive Chair
Director Since: 2013 Age: 72
Committees: | Mr. Hileman is the Executive Chairman of Premier and Premier Bank since April 1, 2021. He previously served as the CEO of Premier from January 2014 through March 2021; CEO of Premier Bank from January 2015 through March 2021; President of Premier from January 2014 through January 2020; President of Premier Bank from 2015 to March 2019; Executive Vice President and Chief Financial Officer of Premier and Premier Bank from 2009 through 2013; Interim Chief Financial Officer from October 2008 to March 2009; and CEO of First Insurance Group of the |
| | |
Executive (Chair) Risk Technology | Midwest from 2007 until April 1, 2021. He has worked in the financial services industry for more than 40 years. Mr. Hileman is also a Trustee of Defiance College.
Mr. Hileman brings valuable experience and expertise to the Board from his work within financial institutions, as well as his knowledge and familiarity with Premier and its subsidiaries.
Mr. Hileman also serves on the Trust Committee of Premier Bank. |
Nikki R. Lanier
Director Since: 2022 Age: 54
Committees: Compensation Risk | Ms. Lanier is the founder and Chief Executive Officer of Harper Slade, a racial equality advisory firm that began operations January 1, 2022. Prior to forming Harper Slade, she was the Senior Vice President and Site General Manager of the Federal Reserve Bank of St. Louis (Louisville, Kentucky Branch) from October 2014 through December 2021. Ms. Lanier is an adjunct MBA professor at the University of Louisville College of Business and a member of its Board of Advisors. She also serves as chair of the board of One West, a Louisville based community development corporation, and as secretary and audit committee chair of the Louisville Regional Airport Authority board.
With a background as a labor and employment attorney, Ms. Lanier brings valuable experience and expertise to the Board regarding diversity, equity and inclusion considerations and human capital matters. Her experience in a variety of industries including banking, manufacturing, education and healthcare, both in the public and private sectors, is expected to provide additional beneficial perspective to the Board. |
Gary M. Small
Director Since: 2020 Age: 64
Committees: Executive Risk | Mr. Small is the CEO and President of Premier and Premier Bank (since April 2021) and President of Premier and Premier Bank (since February 2020). He has served on the Board of Directors and as the CEO of First Insurance Group since February 2020 and continues in that role following the sale of substantially all the assets of First Insurance Group in June 2023. Mr. Small was the President, Chief Executive Officer and a director of UCFC and Home Savings from March 2014 through January 2020. He previously held executive leadership roles in other financial institutions including as the Senior Executive Vice President and Chief Banking Officer for S&T Bank; Senior Vice President of Customer Operations and Chief Operating Officer for Jackson Hewitt Tax Services; Executive Vice President and Regional Banking Group President for Huntington National Bank; Executive Vice President and Head of Regional Banking for Sky Financial Group; and over 20 years in a number of senior operating and financial roles with National City Corporation and its predecessor Merchants National Corporation, including four years as Executive Vice President and Retail Network Executive with responsibility for over 200 branch locations across the Midwest.
With over 35 years of banking and finance experience, Mr. Small provides the Board with invaluable knowledge regarding financial institutions.
Mr. Small also serves on the Trust Committee of Premier Bank. |
Samuel S. Strausbaugh
Director Since: 2006 Age: 61
Committees: Audit (Chair) Executive Executive | Mr. Strausbaugh is President of Elpis Opportunity Fund L.P., a Private Equity Investment Fund based in Indianapolis, IN, since October 2020. He served as President and CEO of Vrsus Assets, LLC, a digital case management platform firm for plaintiff attorneys, from June 2018 through October 2020. Mr. Strausbaugh has also served as the president or chief executive officer of several other business entities in the past. He presently serves as director of Keller Logistics, a logistics and trucking firm in Defiance, Ohio, since 2018.
Mr. Strausbaugh has important tactical and strategic skills that he has developed in management and executive positions with his prior employers. His experience with a growing company helps to inform the Board of Directors when considering future business opportunities. |
| | |
Directors Whose Terms Would Have Expired
at the 2025 Annual Meeting: |
Zahid Afzal
Director Since: 2020 Age: 62
Committees: Risk Technology | Mr. Afzal is a member of the Board of Directors of Buckeye Insurance Group, Piqua, Ohio since December 2019and serves as the Chair of Compensation Committee of this Board. Mr. Afzal also serves on the Board of Directors of Axiom Bank, Orlando, FL. He previously served as the Chief Operating Officer at Home Savings Bank from March 2018 to January 2020. Prior to joining Home Savings, Mr. Afzal served as executive vice president, Chief Technology and Operations Executive at Capital Bank in Raleigh, North Carolina from 2013 to November 2017. From March 2006 until February 2013, he was the Senior Executive Vice President, Chief Information Officer and Chief Operating Officer of Huntington National Bank. He also served in various management and leadership positions for Bank of America and Citicorp. Mr. Afzal has served on several boards of directors, including those of Bancsource (April 2015 to June 2021), RoamHR (June 2019 to December 2021), Bitglass (January 2012 to November 2021), Banksight, Bowling Green State University College of Business Board of Advisors (August 2006 to August 2013), Ohio Foundation of Independent Colleges, and Groundwork Group.
Mr. Afzal has expertise that will contribute to the Board, including banking, technology, operations, and marketing experience.
Mr. Afzal also serves on the Trust Committee of Premier Bank. |
Louis M. Altman
Director Since: 2020 Age: 56
Committees: Audit Governance & Nominating | Mr. Altman is a co-managing partner of the Altman Company, a full service real estate development firm for commercial, multi-family, office, medical and hotel properties located in multiple states. He has over 30 years of experience in managing, developing and financing commercial real estate ventures. Mr. Altman served as the chairman of Premier Bank and Trust from 2015 until the bank’s sale to Home Savings Bank in 2017 and as a director of Ohio Legacy Corp. from February 2010 to January 2018. He also previously served on the board of directors of Sky Bank. Mr. Altman served on the boards of United Community Financial Corp. and Home Savings Bank from February 2017 through January 2020. Since April 2020, Mr. Altman also serves on the board of the Akron Children’s Hospital Foundation. The attributes, skills and qualifications developed by Mr. Altman through his role as a director of financial institutions over the past 15 years and his broad experience in real estate development benefit the Board in his unique insight in the areas of financing, property management, acquisition, business development and leadership.
Mr. Altman also serves on the Trust Committee of Premier Bank. |
Terri A. Bettinger
Director Since: 2018 Age: 57
Committees: Compensation Risk Technology | Ms. Bettinger is the Deputy Director and Chief Information Officer for the Ohio Department of Aging since May 2019 and sits on Ohio’s Technology First Taskforce. She is also the president and owner of VCIO Services, LLC, an executive consulting company in Columbus, Ohio since June of 2017. Ms. Bettinger served as the Chief Information Officer of Franklin County Data Center in Columbus, Ohio from February 2015 to October 2017. She also led North America Fund Services Technology for the Global Financial Services Group at Citigroup Inc. from April 2009 to February 2015. Ms. Bettinger presently serves and as an executive advisory board member for Ohio Women in Technology.
Ms. Bettinger spent 20 years in the banking and financial services industry, and her successful career in the delivery of valuable technology solutions provides beneficial knowledge to the Board in the areas of technological cybersecurity and technology growth and innovation. |
John L. Bookmyer
Director Since: 2005 Age: 60
| Mr. Bookmyer is the Chief Executive Officer of Pain Management Group located in Findlay, Ohio since January 2009. He also served as the Chief Operating Officer of Blanchard Valley Health System in Findlay, Ohio, from August 1995 until December 2008.
|
| |
Committees: Audit Compensation Executive Governance & Nominating | Mr. Bookmyer is an inactive Certified Public Accountant in Ohio and has extensive experience in oversight, leadership and financial matters from his roles at all entities. He is also very familiar with the needs of the region through his interactions with community hospitals and businesses. |
| | |
Directors Whose Terms Would Have Expired
at the 2026 Annual Meeting: |
Lee Burdman
Director Since: 2020 Age: 61
Committees: Compensation Risk | Mr. Burdman is Co-Founder and Managing Partner of Redstone Investments, a development, management and acquisitions company focused on shopping center development, headquartered in Youngstown, OH since 1991. He also serves on the board of directors of SIMCO Management Corp., a residential apartment management firm operating in northeast Ohio and northwest Pennsylvania, since 2003.
He served on the boards of United Community Financial Corp. and Home Savings Bank from April 2011 through January 2020.
Mr. Burdman contributes to the Board through his more than 30 years of experience and expertise in owning, managing and developing real estate, commercial real estate lending, financial literacy and executive management. |
Jean A. Hubbard
Director Since: 2008 Age: 66
Committees: Compensation Governance & Nominating | Ms. Hubbard served as the Corporate Treasurer and Business Manager of The Hubbard Company, a printing and office supply company located in Defiance, Ohio, from 2003 through May 20, 2022. She previously held various positions in the financial industry.
Ms. Hubbard offers financial and business expertise through her work as corporate treasurer. Ms. Hubbard also provides the Board with insight regarding employee and human resource issues from her experience at Rurban Financial Corp. Ms. Hubbard also serves as Chair of the Trust Committee of Premier Bank. |
Charles D. Niehaus
Director Since: 2014 Age: 65
Committees: Risk (Chair) Governance & Nominating | Mr. Niehaus is the managing partner of Niehaus.Law, Ltd., Attorneys at Law, in Toledo, Ohio, since 2007. Mr. Niehaus has provided legal representation to corporate and business clients for over 35 years on a wide range of business issues including the representation of financial institutions in formation, acquisitions, bank litigation, shareholder matters and regulatory compliance. He brings extensive experience in the legal and financial services areas and provides valuable guidance and insight with respect to strategy and compliance.
Mr. Niehaus also serves on the Trust Committee of Premier Bank. |
Mark A. Robison
Director Since: 2018 Age: 60
Committees: Audit Compensation | Mr. Robison is President of Brotherhood Mutual Insurance Company headquartered in Fort Wayne, Indiana, since 2007 and Chairman of the Board of Brotherhood Mutual since 2009. Prior to his promotion to President of Brotherhood Mutual Insurance Company, Mr. Robison served in various positions at Brotherhood Mutual since 1994, including as Vice President of Finance.
As a successful leader of a national company, Mr. Robison adds valuable leadership experience to the Board. |
Richard J. Schiraldi
Vice Chair and Lead Independent Director
Director Since: 2020 | Mr. Schiraldi is retired from Cohen & Company CPAs as a CPA/JD after 36 years of servicing closely held businesses and entrepreneurs on a wide variety of business and tax issues. He also serves as director of the Youngstown State University Foundation since 2010. He has served as Vice Chair of Premier since February 2020.
Mr. Schiraldi was the Chairman of the Board of Directors of United Community Financial Corp. and Home Savings Bank from 2011 through January 2020 and served on both of these Boards as director beginning in 2002.
|
| |
Age: 70
Committees: Governance & Nominating (Chair) Audit Executive | Mr. Schiraldi’s skills and qualifications developed by Mr. Schiraldi throughout his years as a CPA, as well as his experience as the owner and manager of privately held businesses and director of numerous not-for-profit entities enable him to contribute significant insight to the Board in the areas of strategic planning, tax, accounting and financial, local community affairs and leadership. |
Identification of Executive Officers
The following individuals, in addition to Mr. Hileman and Mr. Small whose information is set forth above, serve as the current executive officers of Premier.
| |
Kathy Bushway Senior Vice President, Chief Marketing Officer (since June 2020)
Age: 65 | Kathy Bushway joined Premier as part of the United Community Financial Corp. (Home Savings Bank) merger in 2020. She leads a team of professionals in brand management, marketing, product management, digital banking, and analytics. Prior to her current role, she was Director of Marketing for Home Savings Bank from September 2016 until June 2020. Ms. Bushway served as Senior Vice President, Marketing & Communications Director and various other positions with Huntington National Bank (formerly FirstMerit Corporation) from September 2004 to September 2016. She has also held various marketing roles at Society (Key) Bank, Bank One (Chase) and a publishing company. |
Varun Chandhok Executive Vice President, Chief Information Officer and Operations Officer (since October 2021)
Age: 53 | Prior to his current role, Mr. Chandhok was Chief Information Officer from March 2021 through October 2021. Prior to joining Premier, Mr. Chandhok served as Chief Information Officer – Corporate, Risk Regulatory and Finance from October 2019 to March 2021 and as Chief Information Officer – Corporate and Chief Architect from February 2014 to October 2019 of M&T Bank. |
Sharon L. Davis Executive Vice President, Chief Human Resources Officer (since January 2020)
Age: 43 | Prior to her current role, Ms. Davis was Director of Human Resources of Premier and Premier Bank from November 2015 to January 2020. Prior to joining Premier, Ms. Davis was Senior Vice President and Human Resources Director at First Community Bank from October 2007 to November 2015. Prior to that, she served as an Assistant Vice President, Senior Human Resources Business Partner for BBVA Compass. |
Jason L. Gendics Executive Vice President, Retail and Business Banking (since January 2020)
Age: 54 | Prior to his current role, Mr. Gendics was Executive Vice President, Head of Consumer and Business Banking for Home Savings Bank from May 2019 until its merger with Premier Bank in January 2020. Prior to that time, Mr. Gendics was Senior Vice President, Home Lending Region Manager for Huntington Bank from 2016 to April 2019. |
John Houpt Executive Vice President, Chief Credit Officer (since May 2023)
Age: 53 | Mr. Houpt joined Premier Bank in 2022 as Deputy Chief Credit Officer. Prior to joining Premier Bank, he was Market Credit Leader for the Ohio commercial banking group of Wells Fargo Bank since 2011. |
| | |
Rick L. Hull Executive Vice President, Head of Commercial Banking (since April 2023)
Age: 72 | Prior to his current role, Mr. Hull was employed by Premier Bank as an Executive Vice President and Market President from 2020 until March 2023. He previously was employed at Home Savings Bank as an Executive Vice President and Market President form 2017-to 2020.
|
Shannon M. Kuhl Executive Vice President, Chief Legal Officer (since March 2021)
Age: 54 | Prior to her current role, Ms. Kuhl was a member of Frost Brown Todd LLC, a law firm, from May 2019 through February 2021. Previously, Ms. Kuhl was with First Financial Bancorp and First Financial Bank, Cincinnati, Ohio, where she served in various positions since 2006, including Chief Risk Officer from November 2017 until November 2018, Chief Legal Officer from October 2013 until April 2018, and Chief Compliance Officer from September 2016 until November 2017. |
Paul D. Nungester Executive Vice President and Chief Financial Officer (since April 2019)
Age: 51 | Prior to his current role, Mr. Nungester was Executive Vice President, Director of Finance and Accounting from July 2018 to April 2019. Prior to joining Premier, Mr. Nungester worked at Welltower Inc., a real estate investment trust, where he served in various positions since 2001: Senior Vice President and Controller from January 2012 to May 2018; Vice President and Controller from March 2006 to January 2012; and Controller from September 2002 to March 2006. |
Dennis E. Rose, Jr. Executive Vice President and Chief Strategy Officer (since October 2021)
Age: 56 | Prior to his current role, Mr. Rose served as Chief Operations Officer from January 2020 through October 2021, Director of Strategy Management from January 2017 to January 2020, Executive Vice President, Head of Business Banking from October 2013 to December 2016, and Executive Vice President, Chief Operations Officer from 2001 to 2013. Mr. Rose joined Premier Bank in 1996 and served as Corporate Controller until 2001. |
Jennifer Scroggs Senior Vice President, Wealth Management Director (since January 2020)
Age: 47 | Prior to her current role, Ms. Scroggs served as the Senior Vice President, Director of Trust and Chief Trust Fiduciary Officer from January 2020 through June 2021 for Premier Bank. Ms. Scroggs joined Premier Bank in January 2017 as Vice President, Senior Trust Fiduciary Officer. Prior to joining Premier Bank, Ms. Scroggs served as a Trust Officer and Vice President, Senior Trust Officer for Fifth Third Bank from 2006 to 2017. |
Tina M. Shaver Executive Vice President, Chief Risk Officer (since November 2020)
Age: 57 | Prior to joining Premier, Ms. Shaver served as Senior Director and Deputy Chief Compliance & Ethics Officer of Treliant, LLC in Washington D.C., where she provided consultative guidance to financial institutions on enterprise risk matters from September 2016 to October 2020. Prior to that, she served as Senior Vice President & Chief Compliance Officer of FirstMerit Bank, N.A. in Akron, Ohio, from October 2004 to August 2016. |
(b)Delinquent Section 16(a)Reports
Section 16(a) of the Exchange Act requires our executive officers and directors, and persons who own more than ten percent of our shares, to file reports of ownership and changes in ownership on Forms 3, 4 and 5 with the SEC and to provide us with a copy of such form. Based on our review of the copies of such forms we received, we believe that our executive officers and directors complied with all Section 16 filing requirements applicable to them with respect to transactions during the fiscal year ended December 31, 2024., except Varun Chandhok had one late Form 4 reporting one transaction.
We have adopted a code of ethics that applies to our principal executive officer, principal financial officer, principal accounting officer or controller, or persons performing similar functions (“Code”) meeting the requirements of Item 406 of Regulation S-K. More
information about our corporate governance programs is available on our website at www.premierfincorp.com under the link “Governance Documents,” where you can a copy of the Code.
(d)Procedures for Shareholders to Recommend Director Nominees.
There have been no material changes to the procedures by which security holders may recommend nominees to our Board.
(e)Audit Committee Information.
We have a separately-designated standing audit committee established in accordance with section 3(a)(58)(A) of the Exchange Act. Our Audit Committee consists of Samuel S. Strausbaugh, Chair, Louis M. Altman, John L. Bookmyer, Mark A. Robison and Richard J. Schiraldi. Nasdaq rules and our Audit Committee charter require that our Audit Committee be comprised entirely of independent directors. The Audit Committee’s Charter is evaluated annually to ensure compliance with SEC rules and regulations and Nasdaq listing standards and was last reviewed on January 22, 2024. A copy of the Audit Committee’s Charter is available at www.premierfincorp.com under the link “Governance Documents.” The committee is responsible for, among other things: the appointment of our independent registered public accounting firm; review of the external audit plan and the results of the auditing engagement; the appointment of our internal audit firm; review of the internal audit plan and results of the internal audits; review of the effectiveness of our system of internal control, including review of the process used by management to evaluate the effectiveness of the system of internal control; and oversight of our accounting and financial reporting practices.
At least once per year, our Audit Committee meets privately with each of our independent registered public accounting firm, management and our internal auditors.
The Board has determined that Directors Bookmyer, Robison, Schiraldi, and Strausbaugh each have the attributes listed in the definition of “audit committee financial expert” set forth in Item 407(d)(5)(ii) of Regulation S-K and in the Nasdaq listing rules. The Board has further determined that all members of the Audit Committee are “independent” for purposes of Nasdaq listing rules and meet Nasdaq standards for financial sophistication.
(f)Information About Insider Trading Policies and Procedures.
We have adopted insider trading policies and procedures applicable to our directors, officers, and employees, and have implemented processes for the company, that we believe are reasonably designed to promote compliance with insider trading laws, rules, and regulations, and the listing standards of The Nasdaq Stock Market LLC. Our insider trading policy is filed as Exhibit 19 to this Annual Report on Form 10-K.
Item 11. Executive Compensation
COMPENSATION DISCUSSION AND ANALYSIS
This Compensation Discussion and Analysis (“CD&A”) provides a detailed description of our executive compensation philosophy and programs, the compensation decisions the Compensation Committee (the “Committee”) has made under those programs, and the factors considered in making those decisions. This CD&A focuses on the compensation of our named executive officers (“NEOs”), as identified in the Summary Compensation Table below.
2024 Performance Summary
Our goal is to continue to be a high-performing community-focused financial institution, meeting or exceeding the 75th percentile of our peers in key financial measures. Compensation is a key component of attracting talent to our organization that will enable us to reach this goal.
As of December 31, 2024, the Company had assets of approximately $8.6 billion. Highlights from fiscal 2024 include:
•Average interest-earning assets growth of approximately $79.6 million or 1.0%;
•Average deposits, excluding brokered deposits, growth of approximately $162.4 million or 2.4%;
•Equity growth of $26.2 million or 2.7%; and
•Announced strategic merger with Wesbanco, Inc.
Our performance was driven by three-year average return on assets of 1.14%, and our successful execution of our organic growth strategy. By emphasizing growth opportunities in our metro markets, our three-year compounded average growth rate in total assets was 5%.
Compensation Philosophy and Objectives
The Board believes the most effective executive compensation program is one that rewards the achievement of specific annual, long-term, and strategic goals that are established in conjunction with strategic planning initiatives and the long-term objective of maximizing shareholder value. The Board believes that a significant amount of executive compensation should be performance-based because it aligns with shareholder interests, enables the attraction and retention of executive talent, balances risk with rewards, and supports the long-term performance goals of the Company. We have created opportunities for the NEOs, other Section 16 officers, and certain other employees to earn short-term and long-term incentive compensation in the form of cash and equity in the Company based on the level of achievement of performance goals that the Committee establishes each year.
The Committee evaluates our executive compensation program to ensure that it is sufficiently competitive to enable us to attract and retain qualified employees in key positions. Total compensation commensurate with a range around mid-point compensation paid to similarly situated executives of peer companies, both overall and by component, is generally what the Committee considers competitive. The Committee considers multiple factors such as experience, leadership ability, and breadth of responsibility in setting or adjusting compensation on an individual basis.
The Board encourages ownership of PFC shares by executive management in order to align the Company’s compensation philosophy with the interests of shareholders, which is why a significant part of each NEO’s compensation package is paid in equity, particularly associated with the Long Term Incentive Plan.
Executive Compensation Program Practices and Risk Management Perspectives
The Committee believes the Company has designed its executive compensation program and implemented several compensation practices to balance and control unnecessary or excessive risk-taking and encourage sound management of the Company.
| | | |
ü | Mix of compensation elements (short- and long-term, fixed and variable) with a significant percentage of total compensation based on performance | ü | Compensation Committee retains management, oversight, and discretion on short-term and long-term incentive plan payouts, including the ability to reduce or eliminate any plan or payout |
ü | Executive short-term and long-term incentive plan corporate performance certified by Committee | ü | Incentive plans require minimum threshold performance for corporate components with payouts capped at 150% of target |
ü | Performance metrics positioned to encourage performance relative to budget and strategic initiatives | ü | Multi-year vesting on long-term awards with awards payable in Company shares |
ü | Compensation Committee comprised of only independent directors | ü | Share Ownership Guidelines for executive officers and nonemployee directors |
ü | Engagement of independent compensation consultant | ü | Periodic risk assessment of incentive plans |
ü | Clawback policy | ü | Anti-hedging and pledging policy |
ü | Double trigger change in control agreements and equity award agreements | ü | Employment and severance/change in controls with strong protective covenants concerning non-solicitation and confidentiality |
Risk Review and Assessment
In 2022, Pearl Meyer & Partners, LLC (“Pearl Meyer”) was engaged to conduct a risk assessment of all incentive compensation plans, including the short-term incentive plan and the long-term incentive plan as well as line-of-business incentive plans. Pearl Meyer reviewed each plan for design and governance considerations and determined they do not encourage excessive risk-taking.
Compensation Decision Making
Role of the Compensation Committee in Compensation Decisions - The Compensation Committee makes all compensation-related decisions for the Company’s Section 16 officers, including the NEOs. The Committee’s responsibilities include:
•Assessing the adequacy and suitability of the compensation for the Company’s Section 16 officers in consideration of the Company’s goals and performance, the competitive hiring market, and sound corporate governance practices;
•Setting individual-specific compensation for the CEO, NEOs, and other Section 16 officers;
•Considering and approving the overall design of the Company’s executive officer compensation program, compensation components, and compensation–related policies and governance;
•Defining potential payments to Section 16 officers in various termination scenarios and in connection with a change in control;
•Overseeing the evaluation of all Section 16 officers and establishing the CEOs annual goals and objectives;
•Identifying the members of the Company’s peer group for compensation purposes;
•Periodically reviewing the Company’s incentive compensation practices in consideration of the Company's risk management objectives and the relationship between compensation and risk; and
•Assessing the adequacy and suitability of the director compensation program and recommending changes to the full Board for approval.
In performing its duties, the Committee considers peer group and industry related information concerning compensation programs and practices, the advice of expert compensation consultants, and management prepared reports and recommendations. The most recent full-scope competitive market analysis of the Company’s executive compensation program was prepared by Pearl Meyer at the direction of the Committee in 2023 to ensure the compensation program was properly aligned with the Company’s compensation philosophy and appropriate for the size and activities of the Company.
Role of Management in Compensation Decisions - The CEO and other members of management assist the Compensation Committee in its responsibilities and regularly attend Committee meetings though they do not attend or participate in any discussions relating to their individual compensation or evaluations. This assistance includes:
•Providing recommendations with respect to compensation programs and practices;
•Providing financial and performance data to the Committee and making recommendation concerning performance measures and goals; and
•CEO provided evaluations of and recommendations concerning the compensation for the Section 16 officers.
Role of the Compensation Consultant - The Compensation Committee has the authority to engage a compensation consultant or other advisors to provide information and recommendations to the Committee. Since 2020, the Committee has engaged Pearl Meyer to assist in identifying the Company’s compensation peer group, provide peer and industry executive compensation related data, identify peer and industry compensation trends, and provide other services as requested. The engagement of Pearl Meyer is assessed annually and the firm was again retained in 2023 for these purposes with respect to 2024. Pearl Meyer reports directly to the Compensation Committee and serves at the discretion of the Committee. The Committee has the sole authority to appoint, compensate and oversee Pearl Meyer, including responsibility for evaluating Pearl Meyer’s independence and establishing its fees and retention terms. In retaining Pearl Meyer for 2024, the Committee assessed Pearl Meyer’s independence pursuant to the applicable rules of the SEC and Nasdaq and determined that Pearl Meyer’s services for the Compensation Committee did not raise any conflict of interest that would impair Pearl Meyer’s independence.
Peer Group - A peer group is identified by the Compensation Committee each year with the assistance and recommendation of Pearl Meyer. The compensation practices of the peer group are reviewed to assist in evaluating the appropriateness of the compensation of our NEOs and Section 16 officers, and to evaluate the relative performance measures for the long-term incentive compensation payable under the Company’s Long-Term Incentive Program. The 2024 peer group consists of 18financial institutions that are similar in size and general business model to the Company, and that are located in the Midwest. There are no changes in the 2024 peer group compared to 2023. The 2024 peer group consists of the following financial institutions:
| |
•1st Source Corporation., IN (SRCE) | · Midland States Bancorp, Inc., IL (MSBI) |
· City Holding Company., WV (CHCO) | · MidWestOne Financial Group, Inc. IA (MOFG) |
· Enterprise Financial Services Corp., MO (EFSC) | · Northwest Bancshares, Inc., OH (NWBI) |
· First Busey Corporation., Chicago, IL (BUSE) | · Park National Corporation., OH (PRK) |
| |
· First Commonwealth Financial Corp., PA (FCF) | · Peoples Bancorp Inc., OH (PEBO) |
· German American Bancorp, Inc., IN (GABC) | · QCR Holdings, Inc., IL (QCRH) |
· Great Southern Bancorp, Inc., MO (GSBC) | · Republic Bancorp, Inc., KY (RBCA.A) |
· Horizon Bancorp, Inc., IN (HBNC) | · S & T Bancorp, Inc., PA (STBA) |
· Lakeland Financial Corporation., IN (LKFN) | · Univest Financial Corporation., PA (UVSP) |
Advisory Vote on Executive Compensation - At both our 2024 and 2023 annual meetings, our shareholders approved our executive compensation with more than 93% and 94%, respectively, of the votes cast being cast in favor, indicating that shareholders strongly support our executive compensation program. The Compensation Committee viewed the results of this advisory vote as an indication that our shareholders generally support our executive compensation program. While important, the vote was only one of several factors influencing our executive compensation decisions for the 2024 fiscal year. The Committee will continue to monitor shareholder approval levels going forward. At our 2019 annual meeting, our shareholders approved holding annual votes on our executive compensation.
Shareholder Engagement - The feedback provided by our shareholders through the advisory vote, in addition to investor feedback we receive through the Company’s shareholder engagement throughout the year, provides invaluable information to the Board and the Committee. Because of the value that we place on investor feedback, the Company strives to maintain open communication with its shareholders, including through participation at investor conferences.
Executive Compensation Components
The Compensation Committee has designed the compensation packages to its executive officers to reward and encourage performance supporting both the long-term and short-term goals of the Company. The principal components of compensation for our NEOs in 2024 are described below.
Base Salary - We provide our NEOs and other employees with a base salary to compensate them for services rendered during the fiscal year. The base salary for each of the NEOs is generally determined at the beginning of the year. Base salaries for NEOs other than the CEO are determined based upon recommendations made by the CEO.
Short-Term Cash Incentive Compensation - Short-term incentive compensation to the NEOs and other executive officers is administered under a short-term incentive plan (the “Short-Term Incentive Plan”). Under the Short-Term Incentive Plan, the Committee approves target awards for executive officers based on a percentage of the officer’s base salary. The target award is further delineated with a portion attributable to the satisfaction of certain corporate performance goals and a portion attributable to the individual’s personal performance goals.
For the corporate component, the Committee establishes a threshold, target and maximum payout based upon the level of achievement of respective performance goals. If the threshold performance level is not achieved, the payout percentage for that component of the award is zero. If the performance level for a component is between threshold and target, or between the target and maximum, the payout percentage is prorated based upon linear interpolation. The individual performance goals are established in consideration of the Board’s and management’s expectations for the year and weighted for each officer based on the officer’s role within the Company.
The performance period considered for purposes of determining short-term incentive compensation begins on January 1 and ends on December 31 of the same year. At the end of the performance period, the Compensation Committee determines the level of achievement of the corporate performance goals. The Committee also evaluates and determines the level of attainment by the CEO of the CEO’s individual performance goals, and reviews the annual assessment of the other NEOs and other Section 16 officers completed by the CEO. The Committee approves the actual short-term incentive awards payable to the CEO, other NEOs, and other Section 16 officers based on these assessments and the level of attainment of the corporate performance goals. Short-term incentive awards are payable in cash following the end of the performance period.
Long-Term Equity Incentive Compensation - The Committee may also grant long-term incentive compensation awards under the Long Term Incentive Program to its executive officers, including the NEOs. In 2024, awards under the Long Term Incentive Program were issued in the form of performance share units and restricted stock under the Company’s Amended and Restated 2018 Equity Incentive Plan.
Performance Share Units (“PSUs”) - A PSU award is designed to align an individual’s compensation with the long-term success of the Company based upon the achievement of certain performance measures at the end of the performance period. The performance period and performance measures are both identified at the time of grant. The performance period
for PSU awards is three years beginning on January 1 of the year of grant through December 31 at the close of the three-year performance period. A “target” award is identified at the time of grant determined as a percentage of the executive’s base salary translated into PSUs based upon the Company’s average stock price for the twenty (20) trading days prior to the effective date of the grant.
The Committee establishes a threshold, target and maximum payout based upon the level of achievement of respective performance goals. If the threshold performance level is not achieved, the payout percentage for that component of the award is zero. If the performance level for a component is between threshold and target, or between the target and maximum, the payout percentage is prorated based upon linear interpolation.
If the performance measures identified in the grant are satisfied, the PSU award will vest and be converted to shares of common stock of the Company based on the level of performance achieved. The actual number of common shares that the executive earns at the end of the performance period will be determined by the Committee based on the level of achievement of the performance measures and the executive’s average base salary over the performance period. All determinations of whether the performance measures have been achieved, any adjustments attributed to changes in average base salary, the actual award earned by the executive, and all other matters related to a PSU award will be made by the Committee in its sole discretion.
In addition to the issuance of common shares to the executive upon certification of performance by the Committee, the executive receives dividend equivalents equal to the dividends on the common shares underlying the PSUs, if any, paid by the Company prior to the date the Committee determines the performance measure level of attainment.
Restricted Stock Awards (“RSAs”) - The Committee also uses non-performance based long-term equity incentive compensation in the form of RSAs as another method to align the individual’s interests with the long-term performance of the Company and increase employee ownership of shares. RSAs are frequently considered for the purpose of attracting and retaining talented personnel. There are no performance based measures associated with an RSA. RSAs are issued as current shares of PFC when granted but are subject to possible forfeiture and certain restrictions such as non-transferability, until they vest according to the stated schedule. Premier allows holders of RSAs to vote the shares and to receive dividends, if and when paid, on the shares prior to vesting. RSAs issued by the Company vest after defined periods of time equal to at least one year following the date of grant, and may cliff vest or vest in portions over stated periods.
Retirement Benefits - All of our employees, including the NEOs, are eligible to participate in the Premier Financial Corp 401(k) Employee Savings Plan (the “401(k) Savings Plan”). The 401(k) Savings Plan is a tax-qualified retirement savings plan pursuant to which all employees are able to contribute up to the limit prescribed by the Internal Revenue Service to the 401(k) Savings Plan on a before-tax basis. We maintain a safe harbor plan that matches 100% of the first 3% of pay that is contributed to the 401(k) Savings Plan plus 50% of the salary deferrals between 3% and 5% of compensation. All employee and Company contributions to the 401(k) Savings Plan are fully vested upon contribution.
In addition, the NEOs and other executives are eligible to participate in the Premier Financial Corp. Deferred Compensation Plan (the “Premier DCP”), which allows the deferral of up to 80% of a participant’s salary and up to 100% of short-term incentive compensation. A group of senior officers, including the NEOs, also are eligible to receive a restoration benefit under the Premier DCP which provides for matching contributions in excess of the 401(k) Savings Plan caps. Investment options within the Premier DCP do not provide any guaranteed or enhanced investment returns. The Premier DCP is discussed in further detail below under the heading “Nonqualified Deferred Compensation,”.
Employee Share Purchase Plan - All of our employees, including the NEOs, were eligible to participate in the Premier Financial Corp. Employee Share Purchase Plan (the “ESPP”) in 2024. The ESPP is a means for all employees to purchase PFC shares at the current market price at the time of purchase through regular payroll deductions. We contribute an amount equal to 15% of each of the participating employee’s actual payroll deductions up to $150 per month. The employee specifies the amount to be withheld from their pay with a minimum of $30 per month and a maximum of $5,000 per month. The ESPP was terminated February 12, 2025.
Insurance Plans - Our NEOs are eligible to participate in the Company’s general medical, dental, and vision insurance plans on the same basis as other employees.
The NEOs are also eligible to participate in the Company’s group term life and disability insurance program on the same basis as other employees which provides a benefit in the event of the death of the employee of two times the employee’s annual salary up to a maximum of $800,000. In addition to the group term life insurance, our NEOs, as well as other key employees, also receive benefits from Company purchased split dollar bank-owned life insurance. As of December 31, 2024, Mr. Small’s potential
benefit was $870,475 under the split dollar bank-owned life insurance in addition to $800,000 benefit under the group term life insurance. The potential benefit to the other NEOs is one times the individual’s annual salary, in addition to the group term insurance benefit. The Company also provides additional life and supplemental disability insurance benefits to Mr. Small.
Perquisites and Other Personal Benefits - We provide our NEOs with perquisites and other personal benefits that the Committee believes are reasonable and consistent with our overall compensation program to better enable us to attract and retain executive talent. The Committee periodically reviews the levels of perquisites and other personal benefits.
Each NEO is eligible, upon relocation, to receive reimbursement for certain reasonable expenses associated with the costs of such relocation. On a case by case basis, the Company considers reimbursement requests for country club and other social organization membership for its senior officers, including the NEOs, for certain business purposes.
Employment and Severance and Change in Control Agreements - We have employment or change of control agreements with certain key employees, including the NEOs. These agreements include provisions for severance payments upon a change of control and are designed to promote stability and continuity of senior management. These agreements each include important protections to the Company, including, but not limited to, provisions restricting competition or the solicitation of Company customers and employees and the requirement that the executive sign a release of claims before receiving any of the severance or change in control benefits outlined in the agreement. Information regarding applicable payments under such agreements for the NEOs is provided under the heading “Potential Payments Upon Termination or Change in Control” below.
2024 Executive Compensation Determinations
Base Salary - In 2021, Pearl Meyer conducted a market analysis of compensation, using available peer and industry index compensation data and surveys, for purposes of NEO and other executive officer salary and compensation adjustments in 2023 and 2024.
In making a recommendation for 2024 salaries for the other NEOs, the CEO compared the base salary levels of the other NEOs with Pearl Meyer’s market analysis and also consulted with Pearl Meyer regarding median executive compensation levels of the peer group. In light of these considerations, Mr. Small recommended salary increases for 2024 for the other NEOs ranging from 3.0% to 9.0%. After evaluating a number of factors, including performance evaluations, the individual executive’s skills, competencies and experience, and the importance of each executive’s role to the Company, the Committee approved the CEO’s recommendations, all of which were effective January 1, 2024. The Committee approved a salary increase of 3.0% for Mr. Small effective April 1, 2024.
2024 Short-Term Incentive Compensation - The 2024 Short-Term Incentive Plan corporate performance goals, the associated threshold, target and maximum payout levels, and actual performance levels are detailed in the following table:
| | | | | |
Award Component | Threshold (50% Payout) | Target (100% Payout) | Maximum (150% Payout) | Actual Performance | Adjusted Payout Percentage (4) |
Net Income (1) | $71,960,000 | $82,105,236 | $87,791,200 | $75,856,167 | 82% |
PTPP Income (1) | $100,567,963 | $113,201,113 | $120,281,445 | $97,448,212 | 75% |
Efficiency Ratio (1) | 61.34% | 58.51% | 57.01% | 61.43% | 80% |
Average Loan Growth (2) | 0.00% | 3.08% | 4.50% | -0.20% | 83% |
Average Deposit Growth (3) | 0.00% | 4.77% | 6.00% | 2.45% | 84% |
(1)Net income, pre-tax pre-provision income (PTPP) and efficiency ratio adjusted to exclude merger-related transaction costs. (2)Average loan growth represents growth in average balances including loans held for sale compared to 2023. (3)Average deposit growth represents growth in average balances excluding brokered deposits compared to 2023. (4)Represents a blend of actual performance for the first half of 2024 and target for the second half of 2024. |
The Committee reviewed various information when evaluating the Company’s actual results against the originally defined corporate goals under the Short-Term Incentive Plan, including information regarding (1) the impact of the announced strategic merger with Wesbanco, Inc., (2) the Company’s credit quality, and (3) the external environment for interest rates and the residential mortgage secondary market. The Committee also discussed the Company’s quality of earnings and the impact management’s actions had on the outcome for 2024. Additional consideration was given to the overall execution by management of the operating plan against the approved 2024 budget. The Committee concluded that adjustments would be made to exclude the impact of the announced strategic merger with Wesbanco, Inc. resulting in an adjusted blended payout of 81% for actual results compared to budget for the first half of 2024 and target for the second half of 2024.
In addition to the corporate performance goals, a portion of each 2024 short-term incentive award is attributable to the satisfaction of individual performance goals for each of the NEOs. Each participant’s individual component award is based on their performance against specific business objectives and initiatives falling under their direct responsibility over the course of the year. The payout received with respect to this individual component cannot exceed 150% of the award opportunity. The final individual component payouts for 2024 were (1) 100% for Mr. Small, (2) 135% for Mr. Nungester, (3) 150% for Mr. Hull, (4) 150% for Mr. Chandhok, and (5) 150% for Ms. Kuhl.
The weighting of the corporate performance goals and the individual performance goal component for each executive officer is determined at the beginning of the performance period. The relative weighting of the goals for each participating NEO in 2024 was:
| | | | | |
Short Term Incentive Award Component | Gary Small | Paul Nungester | Rick Hull | Varun Chandhok | Shannon Kuhl |
Net Income | 18.75% | 17.50% | 12.50% | 12.50% | 17.50% |
PTPP Income | 16.875% | 15.75% | 11.25% | 11.25% | 15.75% |
Efficiency Ratio | 11.25% | 10.50% | 7.50% | 7.50% | 10.50% |
Average Loan Growth | 11.25% | 10.50% | 7.50% | 7.50% | 10.50% |
Average Deposit Growth | 16.875% | 15.75% | 11.25% | 11.25% | 15.75% |
Individual Goals | 25.00% | 30.00% | 50.00% | 50.00% | 30.00% |
Total | 100.00% | 100.00% | 100.00% | 100.00% | 100.00% |
The 2024 target short-term incentive compensation component and actual bonus payout as approved by the Committee for the participating NEOs is set forth below:
| | | |
2024 Target Bonus Potential and Awards |
Executive Officer | Target (as a % of Base Salary) | Target ($) | Actual Payout ($) |
Gary Small | 50.0% | 321,360 | 275,566 |
Paul Nungester | 35.0% | 140,595 | 136,658 |
Rick Hull | 30.0% | 137,689 | 159,031 |
Varun Chandhok | 35.0% | 122,570 | 141,568 |
Shannon Kuhl | 25.0% | 74,475 | 75,741 |
In addition to the above payouts under the 2024 Short-Term Incentive Plan, Ms. Kuhl received additional cash bonuses amounting to $74,475 in the aggregate in 2024, in consideration of her individual efforts in connection with the strategic merger with Wesbanco, Inc.
2024 Long-Term Incentive Compensation - In the first quarter of 2024, the Committee established long-term incentive compensation awards for certain executives, including all of the NEOs. To better align the long-term incentive plan mix of compensation with peer practices and to provide the executive officers with a more predictable form of long-term incentive compensation, the Committee identified a total award for each executive consisting of RSAs (equal in value to one-third of the total award) and PSUs (equal in value to two-thirds of the total award).
Restricted Stock Awards – With respect to the RSAs, the Company entered into a Restricted Stock Award Agreement with each of the NEOs. The number of RSAs granted was calculated by taking one-third of the maximum incentive payout dollar value for each executive and dividing it by the Company’s closing stock price immediately prior to the grant date. The RSAs vest in one-third increments over a three-year period and will be fully vested in February 2027.
Performance Share Units - With respect to the PSUs, the Company entered into a Performance Share Units Award Agreement with each of the NEOs. The PSUs have a three-year performance period ending December 31, 2026. The number of PSUs granted was calculated by taking two-thirds of the maximum incentive payout dollar value for each executive and dividing it by the Company’s average stock price for the 20 trading days prior to the approval of PSUs by the Committee, which was $21.39 for all except Mr. Small for whom it was $19.95.
With respect to the PSU awards granted in 2024, the table below sets forth the two performance measures, their respective weighting, and the goals for threshold performance, target performance and superior performance. Achievement of the threshold performance goal will result in 50% of the target payout, achievement of the target performance goal will result in 100% of target payout for the respective measure, and achievement of the superior performance goal will result in 150% of the target payout for the measure.
| | | | |
Performance Goals |
Performance Measure | Weight | Threshold | Target | Superior |
3-year Average Core ROA | 50% | 25th %ile | 50th %ile | 75th %ile |
3-year Total Shareholder Return (rTSR) | 50% | 25th %ile | 50th %ile | 75th %ile |
Payout for Performance Level
(% of Target Opportunity): |
| 50% | 100% | 150% |
The 2024-2026 PSU long-term incentive compensation award target for each of the participating NEOs is set forth below.
| | | | |
Bonus Potential Dollar Amount(1) |
Executive Officer | Target as % of Base Salary | Threshold ($) | Target ($) | Maximum ($) |
Gary Small | 50% | $109,562 | $219,124 | $328,686 |
Paul Nungester | 35% | $48,285 | $96,570 | $144,855 |
Rick Hull | 20% | $23,643 | $47,287 | $70,930 |
Varun Chandhok | 35% | $42,095 | $84,189 | $126,284 |
Shannon Kuhl | 25% | $25,577 | $51,155 | $76,732 |
(1)The dollar amount of the Threshold award is based on the number of shares determined by multiplying base salary by 50% of the target percentage of base salary divided by the average stock price noted above. The dollar amount of the Target award potential is based on the number of shares determined by multiplying the base salary by the target percentage of base salary divided by the average stock price noted above. The dollar amount of the Maximum award is based on the number of shares determined by multiplying the base salary by 150% of the target percentage of base salary divided by the average stock price noted above. The actual award will be adjusted as a result of the amount of the executive’s average base salary over the performance period. |
Other Long Term Incentive Compensation - In February 2024, the Committee also approved a special RSA award equal to 5,147 shares, vesting in full at the expiration of three years, to Mr. Chandhok..
2025 Executive Compensation Determinations
The Compensation Committee met prior to the execution of the merger agreement with Wesbanco, Inc. to consider the compensation program for 2025 in light of the anticipated merger. The Committee also met in the fourth quarter of 2024 to consider the salary component of the compensation program. The Committee considered the Company’s 2024 performance, recommendations from executive management, the roles and contributions of the executive officers, the Company’s compensation philosophy, and the expectation that the strategic merger with WesBanco, Inc. would close in the first quarter of 2025. Based on these reviews, the Committee approved the following changes to the compensation program for 2025.
Base Salaries - Salary increases for the NEOs, excluding Mr. Small, of 3.5% were approved effective January 1, 2025. No salary increase for Mr. Small was approved.
Short-Term Incentive Plan – The Committee determined that the NEOs would receive payments under the Short-Term Incentive Plan at the NEOs target percentage of base salary prorated based on the number of days in 2025 before the consummation of the strategic merger with Wesbanco, Inc..
Beginning in 2022, the Committee decided to eliminate any payout under the Short-Term Incentive Plan in the event a participant terminates their employment for “good reason” outside of a change in control scenario, and change the payout from full to pro-rated in the event of the death or disability of the participant. Individual NEOs may receive short-term incentive based severance payments in the event of certain “good reason” terminations as described in the section entitled “Potential Payments upon Termination or Change In Control.”
Long-Term Incentive Plan – The Committee again decided to grant awards under the Long-Term Incentive Plan such that one-third of the award will be granted in the form of RSAs while two-thirds will be in the form of PSUs. For 2025, the awards will be granted on the first day of each calendar quarter that passes prior to consummation of the merger with Wesbanco, Inc. Each quarterly award will be equal to 25% of the Long-Term Incentive Plan target percentage of base salary for each NEO..
Tax Implications
Section 162(m) of the Internal Revenue Code generally prohibits us from claiming a deduction on our federal income tax return for compensation in excess of $1,000,000 paid in a given fiscal year to certain current and former executive officers. While the Committee carefully considers the net cost and value to Premier of maintaining the deductibility of all compensation, it also desires the flexibility to reward NEOs and other key employees in a manner that enhances Premier’s ability to attract and retain individuals, as well as to create longer-term value for shareholders. Thus, income tax deductibility is only one of several factors the Committee considers in making decisions regarding Premier’s compensation program.
The Board has not adopted a formal policy regarding tax deductibility of compensation paid to our executive officers. The Board may authorize compensation that might not be deductible and may modify compensation that was initially intended to be exempt from Section 162(m) if it determines that such compensation decisions are in the best interests of the Company and its shareholders.
Compensation Related Governance and Policies
Share Ownership Guidelines - We believe that our NEOs and nonemployee directors should have and maintain a significant equity interest in the Company to align their interests with the interests of our shareholders and promote a long-term perspective in the success of the Company. The Committee has established the following share ownership guidelines for executives and nonemployee directors as follows:
| |
CEO and President | 3 times base salary |
CFO and Chief Lending Officer | 2 times base salary |
All other Executive Officers | 1.5 times base salary |
Nonemployee Directors | 5 times the annual retainer |
Anti-Hedging Policy - Executive officers are prohibited from engaging in transactions that could reduce the extent to which their investment in Premier’s shares is aligned with the interests of shareholders. As a result, our Corporate Governance Guidelines and Insider Trading Policy prohibit executive officers from entering into speculative transactions involving our shares, including any hedging, short sales, puts, calls, swaps, forward contracts, or other derivative securities.
Clawback Policy for Incentive Compensation - The Board has adopted an incentive compensation clawback policy providing for a three‑year review period of the Company’s reported results to ensure that incentive compensation for all executive officers (including the NEOs) is based on accurate financial and operating data and the correct calculations of the attainment of performance goals. The policy allows the Company to recover incentive awards previously paid or awarded. A copy of this policy is posted on the Company’s website at www.premierfincorp.com under the link “Governance Documents.”
Compensation Committee Interlocks and Insider Participation - Directors Adams, Afzal (through October 2023), Bettinger, Bookmyer, Burdman, Hubbard, Lanier, and Robison served on the Compensation Committee during 2023 and Director Schiraldi participated in Committee meetings in an ex officio capacity. There were no Compensation Committee interlocks or insider (employee) participation during 2024.
COMPENSATION COMMITTEE REPORT
Premier’s Board of Directors has reviewed and discussed the Compensation Discussion and Analysis required by Item 402(b) of Regulation S-K with management and, based on such review and discussions, has approved that the Compensation Discussion and Analysis be included in our annual report on Form 10-K.
| | |
Marty Adams | Lee Burdman | Mark A. Robison |
Zahid Afzal | Donald P. Hileman | Richard J. Schiraldi |
Louis M. Altman | Jean A. Hubbard | Gary M. Small |
Terri A. Bettinger | Nikki R. Lanier | Samuel S. Strausbaugh |
John L. Bookmyer | Charles D. Niehaus |
|
February 28, 2025
SUMMARY COMPENSATION TABLE
The table below summarizes the total compensation paid or earned by each of the NEOs for the fiscal years ended December 31, 2024, 2023, and 2022. The NEOs include those persons serving as our CEO and CFO during 2024 and our three other most highly compensated executive officers in 2024. The titles for each executive officer below are as of December 31, 2024.
| | | | | | | |
(a) | (b) | (c) | (d) | (e) | (f) | (g) | (h) |
Name and Principal Position | Year | Salary($) | Bonus($) | Stock Awards ($)(3) | Non-Equity Incentive Plan Compen- sation ($)(4) | All Other Compen-sation ($)(5) | Total($) |
Gary M. Small President and CEO of Premier and Premier Bank | 2024 2023 2022 | 637,320 617,077 590,038
| - - - | 326,129 309,590 308,829 | 275,566 119,340 210,000 | 54,953 61,719 55,242 | 1,293,968 1,107,726 1,164,109 |
Paul D. Nungester Executive Vice President and
Chief Financial Officer
of Premier and Premier Bank | 2024 2023 2022 | 400,673 373,862 344,471 | - 50,000 - | 138,471 130,566 126,309 | 136,658 58,669 102,635 | 21,454 20,523 16,134 | 697,256 633,620 589,549 |
Rick L. Hull Executive Vice President and Head of Commercial Banking | 2024 2023
| 343,836 330,665
| - - | 66,047 65,097
| 159,031 87,559
| 47,663 45,988
| 616,577 529,309
|
Varun Chandhok (1) Executive Vice President and Chief | 2024 2023 2022 | 349,091 320,885 308,654 | - - - | 223,608 111,882 112,976 | 141,568 82,107 97,443 | 15,387 21,174 15,328 | 729,654 536,048 534,401 |
| | | | | | | |
Information and Operations Officer | | | | | | | |
Shannon M. Kuhl (2) Executive Vice President and Chief Legal Officer | 2024 2023
| 297,567 288,796
| 74,475 30,000
| 73,363 170,685
| 75,741 36,659
| 16,576 15,156
| 537,722 541,296
|
(1)In 2024, Mr. Chandhok received a retention restricted stock award of 5,147 shares to vest in full at the expiration of three years with a grant date fair value of $102,889 reflected in column (e) in addition to the award described in note 4 below. (2)In 2023, Ms. Kuhl received a retention restricted stock award of 3,985 shares to vest over a period of three years with a grant date fair value of $98,748 reflected in column (e) in addition to the award described in note 3 below. (3)The amounts in column (e) reflect the aggregate grant date fair value of restricted stock awards and shares underlying performance share units granted under the Long-Term Incentive Program and the relevant year’s long-term incentive compensation awards, as computed in accordance with FASB ASC Topic 718, based upon the probable outcomes. Restricted stock awards were as follows: Mr. Small 5,185 shares or $104,581; Mr. Nungester 2,412 shares or $48,216; Mr. Hull 1,093 shares or $21,849; Mr. Chandhok 2,103 shares or $42,039; and Ms. Kuhl 1,278 shares or $25,547. All restricted stock awards vest annually over three years. Assumptions used in the performance share unit calculations are not materially different from the amounts included in Note 20 to our audited financial statements for the fiscal year ended December 31, 2024, included in this Annual Report on Form 10-K. If maximum results are achieved under the Long-Term Incentive Program for the 2024 performance share unit awards, the value of such payout under these awards at the grant date would be as follows: Mr. Small 16,476 shares, or $332,321, Mr. Nungester 6,773 shares, or $135,392; Mr. Hull 3,317 shares, or $66,307; and Mr. Chandhok 5,904 shares, or $118,021; and Ms. Kuhl 3,588 shares, or $71,724. All awards are paid in Premier common shares. (4)The dollar amounts in column (f) reflect the cash short-term incentive awards earned by the named individuals with respect to performance during the applicable fiscal year, as discussed in further detail under the heading “2024 Short-Term Incentive Compensation” above. (5)The dollar amount shown as “All Other Compensation” includes the following perquisites and personal benefits: |
| | | | | | | |
Name | Club Membership ($) | 401(k) Match ($) | Value of Life Insurance ($) | Disability & Life Insurance Premium ($) | Employee Stock Purchase Plan Match ($) | Company Deferred Compensation Plan Contribution ($) | Total ($) |
Gary Small | 7,673 | 13,800 | 1,523 | 9,921 | - | 22,036 | 54,953 |
Paul Nungester | - | 13,800 | 297 | 3,034 | 1,800 | 2,523 | 21,454 |
Rick Hull | 14,634 | 10,344 | 1,284 | 16,666 | 975 | 3,760 | 47,663 |
Varun Chandhok | - | 6,473 | 403 | 1,764 | - | 6,747 | 15,387 |
Shannon Kuhl | - | 12,113 | 235 | 1,497 | - | 2,731 | 16,576 |
2024 GRANTS OF AWARDS
During 2024, we made awards to certain NEOs as part of short-term and long-term incentive compensation under the Long-Term Incentive Program, as described above. The short-term incentive compensation awards provide for cash payments. The long-term incentive compensation awards are made in PSUs and RSAs and settled in PFC shares.
| | | | | | | | | | |
Name |
Grant Date |
Date Approved by Comp Committee | Estimated Future Payouts Under Non-Equity Incentive Plan Awards (1) | Estimated Future Payouts Under Equity Incentive Plan Awards (2) | All Other
Stock
Awards:
Number of
Shares of
Stock or
Units | Grant Date Fair Value of Stock Awards ($)(3) |
Threshold ($) |
Target ($) |
Maximum ($) |
Threshold (Shares/ Units) |
Target (Shares/ Units) |
Maximum (Share/ Units) |
Gary Small | 3/11/2024 3/11/2024 | 3/11/2024 3/11/2024 | 109,562 n/a | 219,124 n/a | 328,686 n/a | 5,492 n/a | 10,984 n/a | 16,476 n/a | n/a 5,185 | 221,547 104,581 |
Paul Nungester | 2/14/2024 2/14/2024 | 2/14/2024 2/14/2024 | 48,285 n/a | 96,570 n/a | 144,855 n/a | 2,258 n/a | 4,515 n/a | 6,773 n/a | n/a 2,412 | 90,255 48,216 |
Rick Hull | 2/14/2024 2/14/2024 | 2/14/2024 2/14/2024 | 23,643 n/a | 47,287 n/a | 70,930 n/a | 1,106 n/a | 2,211 n/a | 3,317 n/a | n/a 1,093 | 44,198 21,849 |
Varun Chandhok | 2/14/2024 2/14/2024 2/14/2024
| 2/14/2024 2/14/2024 2/14/2024
| 42,095 n/a n/a | 84,189 n/a n/a | 126,284 n/a n/a | 1,968 n/a n/a | 3,936 n/a n/a | 5,904 n/a n/a | n/a 2,103 5,147 | 78,681 42,039 102,889 |
Shannon Kuhl | 2/14/2024 2/14/2024 | 2/14/2024 2/14/2024 | 25,577 n/a
| 51,155 n/a
| 76,732 n/a
| 1,196 n/a
| 2,392 n/a
| 3,588 n/a
| n/a 1,278
| 47,816 25,547
|
(1)Short-term incentive awards granted in 2024 pursuant to the Short-Term Incentive Plan, as described above. Actual amounts are included in the “2024 Target Bonus Potential and Awards” table above. (2)Long-term incentive awards granted in the form of PSUs and RSAs in 2024 under the Long-Term Incentive Program, as described above. (3)Grant date fair value determined by multiplying shares, or Target shares in the case of the PSUs issued February 14, 2024 and March 11, 2024, times the grant date closing stock price. Applicable closing stock prices were: $19.99 on February 14, 2024 and $20.17 on March 11, 2024. |
OUTSTANDING EQUITY AWARDS AT FISCAL YEAR-END 2024
The following table provides information concerning unexercised options and non-vested stock awards for each NEO outstanding as of the end of the most recently completed fiscal year.
| | | | | | | | |
Option Awards | Stock Awards |
Name | Number of Securities Underlying Unexercised Options (#) Exercisable | Number of Securities Underlying Unexercised Options (#) Unexercisable | Option Exercise Price | Option Expiration Date | Number of shares or units of stock that have not vested (#)(1) | Market value of shares or units of stock that have not vested ($)(2) | Equity incentive plan awards: number of unearned shares, units or other rights that have not vested (#)(3) | Equity incentive plan awards: market or payout value of unearned shares, units or other rights that have not vested ($)(2) |
Gary Small | 18,575 | - | $26.00 | 2/21/2028 | 16,964 | 433,769 | 44,606 | 1,140,575 |
Paul Nungester | - | - | - | - | 3,575 | 91,413 | 18,741 | 479,207 |
Rick Hull | - | - | - | - | 1,657 | 42,369 | 8,160 | 208,651 |
Varun Chandhok | - | - | - | - | 8,246 | 210,850 | 16,328 | 417,507 |
Shannon Kuhl | - | - | - | - | 4,576 | 117,008 | 8,900 | 227,573 |
(1)Mr. Small’s restricted shares vest as follows: 1,379 on March 2, 2025, 1,728 on March 11, 2025, 4,510 on April 1, 2025, 1,380 on March 2, 2026, 1,728 on March 11, 2026, 4,510 on April 1, 2026, and 1,729 on March 11, 2027. Mr. Nungester’s restricted shares vest as follows: 1,386 on February 14, 2025; 1,385 on February 14, 2026; and 804 on February 14, 2027. Mr. Hull’s restricted shares vest as follows: 646 on February 14, 2025, 647 on February 14, 2026, and 364 on February 14, 2027. Mr. Chandhok’s restricted shares vest as follows: 1,199 on February 14, 2025, 1,199 on February 14, 2026, and 5,848 on February 14, 2027. Ms. Kuhl’s restricted shares vest as follows: 2,075 on February 14, 2025; 2,075 on February 14, 2026; and 426 on February 14, 2027. (2)Market value determined by multiplying unvested shares by the December 31, 2024, stock price of $25.57. (3)This column reflects the PSUs that were granted as long-term incentive compensation awards pursuant to the Company’s Long-Term Incentive Program. The PSUs vest on the date the Compensation Committee certifies the performance results at the end of the applicable performance which will be within 60 days following the completion of the performance period. While this generally occurs in the month of February, the date is not specified. Mr. Small’s PSUs vest as follows: 15,277 PSUs in February 2025; 12,771 PSUs in February 2026; and 16,558 PSUs in February 2024. Mr. Nungester’s PSUs vest as follows: 6,496 in February 2025; 5,439 PSUs in February 2026; and 6,806 PSUs in February 2027. Mr. Hull’s PSUs vest as follows: 3,248 in February 2025; 2,690 in February 2026; and 3,333 PSUs in February 2027. Mr. Chandhok’s PSUs vest as follows: 5,677 in February 2025; 4,717 in February 2026; and 5,934 PSUs in February 2027. Ms. Kuhl’s PSUs vest as follows: 3,578 in February 2025; 2,918 in February 2026; and 3,606 PSUs in February 2027. |
OPTION EXERCISES AND STOCK VESTED IN 2024
The following table provides information concerning exercises of stock options and vesting of stock awards during the most recently completed fiscal year for each of the NEOs on an aggregated basis. The table reports the number of shares for which the options were exercised or vested and the aggregate dollar value realized upon exercising those options or when the stock awards became vested. No NEOs exercised options during 2024.
| | | | |
| Option Awards | Stock Awards |
Name | Number of Shares Acquired on Exercise (#) | Value Realized on Exercise ($) | Number of Shares Acquired on Vesting (#) | Value Realized on Vesting ($) |
Gary Small | - | - | 10,009 | 200,694 |
Paul Nungester | - | - | 2,370 | 47,376 |
Rick Hull | - | - | 1,200 | 23,988 |
Varun Chandhok | - | - | 2,989 | 59,880 |
Shannon Kuhl | - | - | 2,675 | 54,500 |
NONQUALIFIED DEFERRED COMPENSATION
Premier maintains the non-qualified Premier Financial Corp. Deferred Compensation Plan (the “Premier DCP”), effective January 1, 2022, to attract and maintain key employees and members of the Board. Eligible participants are identified annually by the Board, acting through the Compensation Committee, and include all of the Company’s NEOs. The Premier DCP allows employee participants to defer up to 80% of their base salary and up to 100% of their annual short-term incentive compensation. Directors may defer up to 100% of their cash retainer fees. Premier may make discretionary contributions to participants. Deferral elections are made annually and are generally irrevocable; however, employee participants may adjust the deferral election for short-term incentive compensation once after the initial annual election. The participant elects the timing and manner of distributions from the Premier DCP. The timing of distributions may be based upon the individual’s separation from service or a date specified by the participant, permitting distributions while a participant is still employed, and may be paid in a lump sum or in annual installments. Contributions accrue interest, earnings, and losses based on the performance of the investment option selected by the participant from the designated investment options determined by the Compensation Committee. Participants may alter their investment options at any time. The Premier DCP also allows for hardship withdrawals upon the approval of the Compensation Committee.
Premier may make discretionary contributions to the Premier DCP, including contributions designed to match employer contributions under the 401(k) Savings Plan for individuals who elect to defer into the Premier DCP rather than the 401(k) Savings Plan (“make-up contributions”), or if the individual’s participation or the Company’s matching contributions in the 401(k) Savings Plan are limited under Section 401(a)(17) of the Internal Revenue Code (“supplemental contributions”). Company discretionary contributions are only payable following the individual’s separation from service to the Company. Employer make-up and supplemental contributions are 100% vested when made while other discretionary contributions vest according to a schedule determined by the Compensation Committee, though these will fully vest in the event of the death of the participant while employed by the Company or if there is a change in control of the Company.
Prior to the Premier DCP, the Company maintained the First Defiance Deferred Compensation Plan (the “First Defiance DCP”). This plan was frozen on December 31, 2021 and does not accept further participants or contributions. Mr. Nungester previously contributed to the First Defiance DCP and is a participant in this plan. The United Community Financial Corp. Deferred Compensation Plan (the “UCFC DCP”) was frozen on January 31, 2020 upon the consummation of the merger of United Community Financial Corp. into Premier in January 2020 (the “Merger”) and did not accept further participants or contributions after that date. Mr. Small and Mr. Hull previously contributed to the UCFC DCP and are participants in this plan. The First Defiance DCP and UCFC DCP have substantially similar material terms as follows:
•Contributions accrue interest, earnings, and losses based on the performance of the investment option selected by the participant from the designated investment options determined by the Compensation Committee.
•Participants may alter their investment options at any time.
•Benefits are generally paid beginning in the year following the executive’s retirement or termination but have provisions for scheduled “in-service” distributions and allow for hardship withdrawals upon the approval of the Compensation Committee.
•Retirement benefits are paid either in a lump sum or in scheduled installment payments when the executive’s termination is considered a retirement. All other distributions are made in lump sum payments.
The following table provides information with respect to our NEOs’ participation in the Premier DCP, the First Defiance DCP, and the UCFC DCP. None of our NEOs received a withdrawal or distribution under any of the deferred compensation plans in 2024.
| | | | | |
| Executive Contributions in Last Fiscal Year | Registrant Contributions in Last Fiscal Year (1) | Aggregate Earnings in Last Fiscal Year | Aggregate Withdrawals/ Distributions in Last Fiscal Year | Aggregate Balance at Last Fiscal Year End (2) |
Name | ($) | ($) | ($) | ($) | ($) |
Gary M. Small | 39,382 | 22,036 | 193,859 | - | 1,036,080 |
Paul D. Nungester | - | 2,523 | 545 | - | 11,927 |
Rick L. Hull | 41,900 | 3,760 | 54,328 | - | 490,932 |
Varun Chandhok | - | 6,747 | 726 | - | 16,619 |
Shannon M. Kuhl | 38,866 | 2,731 | 9,064 | - | 101,912 |
(1)All amounts are included in the All Other Compensation column of the Summary Compensation Table. (2)All amounts except Aggregate Earnings have been reported as compensation in the Summary Compensation Table in previous years. |
POTENTIAL PAYMENTS UPON TERMINATION OR CHANGE IN CONTROL
Our NEOs are entitled to certain compensation in the event of the termination of their employment, including by resignation, retirement, death or disability, involuntary termination, or for “good reason” in connection with a change of control of the Company. Additionally, Mr. Small and Mr. Nungester are entitled to severance compensation in the event of a termination for “good reason” not in connection with a change in control of the Company.
Accrued Benefits Payable Upon Any Termination
Regardless of the manner in which a NEO’s employment terminates, each executive is entitled to receive amounts earned during the term of their employment. These amounts (the “Accrued Benefits”) are payable without respect to an Executive Agreement (as defined below) and are payable to other terminated employees of the Company to the extent the individual participates in the applicable benefit plans. All payments would be made in accordance with the Company’s normal payroll practices or in accordance with the terms of the associated plan. These Accrued Benefits are not described in the table entitled “Executive Benefits and Payments upon Termination” on page P# and include:
•Base salary earned through the date of termination;
•Balance of accounts in the deferred compensation plans;
•Accrued but unused vacation pay; and
•All amounts held in the individual’s account in the 401(k) Savings Plan.
Benefits Payable Under the Short-Term Incentive Plan for Certain Terminations
For 2024, each NEO would receive amounts under the Short-Term Incentive Plan in certain termination scenarios if not directly addressed in the individual’s Executive Agreement described below. While Mr. Nungester is the only NEO whose Executive Agreement does not directly address a severance benefit relating to the Short-Term Incentive Plan for the year of termination and who is eligible to receive a payment as described in the Short-Term Incentive Plan, the benefit is similar to that payable under the Executive Agreements of the other NEOs. If the executive’s employment is terminated as a result of their death, disability, retirement, or by the Company without cause, a pro-rata portion of the award (a “Pro-Rated Short Term Incentive Payment”) will vest in proportion to the number of months or partial months elapsed during the performance period before the termination of the individual’s employment. For any of these termination scenarios, the portion of the award attributable to corporate performance would be based on actual performance determined at the end of the performance period in the ordinary administration of the Short-Term Incentive Plan. The portion of the award attributable to individual performance will be assumed to be at target, except that the Compensation Committee may determine a different level of individual goal satisfaction in the event of a retirement or termination by the Company
without cause. Any payment would be made at the same time as other participants in the plan. This benefit is included in the table entitled “Executive Benefits and Payments upon Termination” below.
Benefits Payable Under the Short-Term Incentive Plan in Connection with a Change in Control
If there is a change in control (as defined in the 2018 Equity Incentive Plan) during a performance period, the award for that performance period will be deemed earned and vested at target levels, unless the Compensation Committee determines that actual performance or a different treatment is appropriate, on the effective date of the Change in Control.
Benefits Received Under the Long-Term Incentive Program for Certain Terminations
The Long-Term Incentive Program and the terms of award agreements issued under this plan provide for the acceleration of certain benefits in connection with certain termination scenarios if these were not directly addressed in the individual’s Executive Agreement described below. As only Mr. Small’s Executive Agreement addresses the treatment of Long-Term Incentive benefits in the event of his termination, the following description applies to the benefits applicable to the NEOs other than Mr. Small. These benefits are included in the table entitled “Executive Benefits and Payments upon Termination” below.
| | |
Equity Award Type | Termination Scenarios(1) | Benefit |
Restricted Stock Award (issued in 2021) | •Change in Control – involuntary termination without Cause | Accelerated FULL vesting of all unvested restricted stock awards |
•Involuntary termination without Cause •Termination by employee for Good Reason (not in connection with a Change in Control) •Change in Control – termination by employee for Good Reason | Unvested RSAs forfeited |
Restricted Stock Award (issued in 2022 and forward) | •Change in Control – involuntary termination without Cause •Change in Control – termination by employee for Good Reason | Accelerated FULL vesting of all unvested RSAs |
| Accelerated vesting of a PRO-RATA portion of unvested RSA award (determined by the number of months, including any partial months, of the restricted period that have elapsed at the time of termination)(a “Pro-Rated RSA Benefit”) |
•Involuntary termination without Cause •Termination by Executive for Good Reason (not in connection with a Change in Control) | Unvested RSAs forfeited |
Performance Share Unit
| | Accelerated FULL vesting of unvested PSUs calculated at target and payable within 90 days of vesting |
| Pro-Rated PSU Benefit calculated at target, vests and payable one year after separation |
| | |
Equity Award Type | Termination Scenarios(1) | Benefit |
| •Involuntary termination without Cause | |
•Change in Control – involuntary termination without Cause •Change in Control – termination by employee for Good Reason | Accelerated FULL vesting upon consummation of the Change in Control (1) using the actual performance of the Company for closed years in the performance period, and (2) at target for open years in the performance period |
•Termination by Executive for Good Reason (not in connection with a Change in Control) | Unvested PSUs forfeited |
(1)With respect to the definition of “Cause,” all award agreements refer to the definition within the NEO’s Executive Agreement.
The outstanding equity award agreements to our NEOs include restrictive covenants concerning confidentiality, non-competition, and/or non-solicitation to protect Premier’s interests. However, all such award agreements issued beginning in 2022 provide that if the employee is party to an Executive Agreement with restrictive covenants concerning confidentiality and non-solicitation, the terms of the Executive Agreement control in this respect in order to avoid conflicting restrictions. Mr. Small’s outstanding unvested 2021 RSA was previously amended to have the restrictive covenants of his Executive Agreement control. As Mr. Nungester’s Executive Agreement does not include restrictive covenants concerning solicitation, he is prohibited from soliciting customers and employees of Premier for a period of 12 months following his termination under his outstanding 2022, 2023, and 2024 PSU awards.
Benefits Received Under the Long-Term Incentive Program in Connection with a Change in Control
Generally, for purposes of this discussion, the definition of a “change of control” under the 2018 Equity Incentive Plan aligns with the meaning set forth in Section 409A(a)(2)(A)(v) of the Internal Revenue Code of 1986, as amended.
PSUs receive special treatment under the 2018 Equity Incentive Plan and the applicable outstanding award agreements for these awards in the event of a change in control. With or without a termination of their employment, the NEOs are entitled to accelerated vesting of outstanding PSUs, calculated using the actual performance of the Company for each closed year in the performance period and calculated at target with respect to any open years in the performance period. PSUs vesting in connection with a change in control are payable in cash rather than in shares.
Under the 2018 Equity Incentive Plan and the applicable outstanding award agreements for restricted stock units or restricted stock awards, the vesting of these awards will not accelerate and no other benefits will be payable in connection with a change in control unless the executive’s employment is also terminated without cause or by the executive for good reason in the period immediately preceding or shortly following the change in control event. For awards granted in 2021, this benefit is only in the event of a termination by the Company without cause. For awards granted in 2022, 2023 and 2024, this benefit applies in the event of a termination by the Company without cause or a termination by the executive for good reason. In the event there is such a “double trigger” consisting of both a change in control event and a permitted termination scenario, the outstanding award will fully vest.
Employment and Severance/Change in Control Agreements
Each of our NEOs has an employment agreement or a severance and change in control agreement (collectively, the “Executive Agreements”). The NEOs are not eligible to receive any payments, other than the Accrued Benefit described above, in the event of a termination “for cause” or in connection with a voluntary termination except in certain circumstances that constitute “good reason” under their respective Executive Agreements. The following summaries of the Executive Agreements are qualified by reference to the specific agreements, copies of which are identified as exhibits to the Company’s Annual Report on Form 10-K for the year ended December 31, 2024. Each of the Executive Agreements requires that the executive release all claims against the Company and include expected restrictive covenants concerning confidentiality, non-competition, and/or non-solicitation to protect Premier’s interests. Each of the Executive Agreements incorporates a definition of a “change of control” consistent with the meaning set forth in Section 409A(a)(2)(A)(v) of the Internal Revenue Code of 1986, as amended, although the specific Executive Agreements provide additional description and distinctions in this regard.
Employment Agreement of Gary Small - The Company entered into an employment agreement with Mr. Small in September 2019 in anticipation of and effective upon the consummation of the Merger on January 31, 2020. Under the agreement, Mr. Small serves as the Chief Executive Officer and a director of the Company and of Premier Bank. The initial term of this agreement was
for a three year period and automatically extends for additional 12-month periods unless terminated with 90 days prior written notice. The current term of the agreement ends January 31, 2026. The agreement describes Mr. Small’s compensation package from the Company, subject to adjustment by the Company.
In addition to the Accrued Benefits, the agreement provides the listed benefits to Mr. Small in the following termination scenarios:
Death or Disability – (1) the Pro-Rated Short Term Incentive Payment described above, except that the pro-ration will be based on the number of days elapsed instead of months, for the year in which the termination occurs; and (2) accelerated vesting in full of any unvested RSAs and vesting in full of any unvested PSUs calculatedusing the actual performance of the Company for each closed year in the performance period and calculated at target with respect to any open years in the performance period. In the event of Mr. Small’s death, his beneficiary will receive 90 days of base salary in a lump sum payment. In the event of Mr. Small’s disability, he will also receive a cash payment equal to 18 months of COBRA premiums (the “CEO COBRA Benefit”) and his group and supplemental life insurance will be maintained until he attains age 65.
Without Cause or for Good Reason – (1) a lump sum severance payment equal to two times the sum of Mr. Small’s base salary and the greater of his target short-term incentive compensation payment or the prior year’s actual short-term incentive compensation payout; (2) the CEO COBRA Benefit, (3) the Pro-Rated Short Term Incentive Payment (with the pro-ration based on the number of days elapsed instead of months); and (4) accelerated vesting in full of any unvested RSAs and vesting in full of any unvested PSU calculated in the same fashion as described above.
Without Cause or for Good Reason in Connection with a Change in Control – (1) a lump sum severance payment equal to 2.99 times the sum of Mr. Small’s base salary and the greater of his target short-term incentive compensation payment or the prior year’s actual short-term incentive compensation payout; (2) the CEO COBRA Benefit, (3) the Pro-Rated Short Term Incentive Payment (with the pro-ration based on the number of days elapsed instead of months); and (4) accelerated vesting in full of any unvested RSAs and vesting in full of any unvested PSU calculated in the same fashion as described above. The increased severance benefit to Mr. Small in connection with a change in control is only available in the event the termination occurs within the six months before or the two years following the consummation of the change in control.
Under Mr. Small’s agreement, “cause” means (1) continued intentional failure to perform under the agreement or his assigned duties; (2) engagement in willful misconduct in the course of his employment; (3) conviction or plea of guilty or nolo contender to a felony or a crime involving moral turpitude or breach of trust or duty to the Company; or (4) unauthorized disclosure of non-public confidential information. Events giving rise to a “good reason” under Mr. Small’s agreement include (1) a material diminution in his title, position, authority or duties; (2) a requirement that he report to any person or entity other than the Board; (3) a reduction in his base salary or target short-term or long-term incentive awards; (4) a material change in the geographic location of his primary work location; (5) the non-renewal of the agreement without an offer of a substantially similar agreement; or (6) any material breach of the agreement. Mr. Small must give notice of the good reason event within 90 days of becoming aware of it, after which the Company will have 30 days to remedy the condition. If the Company does not remedy the condition, Mr. Small must terminate his employment to receive any payments associated with a termination for good reason.
Mr. Small’s agreement includes language modifying the benefits due to him in the event the payments would be “excess parachute payments” under Section 280G of the Internal Revenue Code. If this were to occur, Mr. Small’s payments and benefits under the agreement may be reduced if doing so results in Mr. Small receiving the net greatest benefit compared to paying the excise tax under Section 4999 of the Internal Revenue Code.
Mr. Small’s agreement includes restrictive covenants concerning non-competition and non-solicitation, of customers and of employees, for a period of one year following the termination of his employment.
Employment Agreement of Paul Nungester - The Company entered into an employment agreement with Mr. Nungester in May 2019 pursuant to which Mr. Nungester serves as the Chief Financial Officer of the Company. The initial term of this agreement was 12 months and it is evergreen, extending in such a fashion that the term is always 12 additional months until notice of termination is given and the term then becomes fixed at 12 months. The agreement describes Mr. Nungester’s compensation package from the Company, subject to adjustment by the Company.
In addition to the Accrued Benefits, the agreement provides the listed benefits to Mr. Nungester in the following termination scenarios:
Without Cause or for Good Reason – lump sum payment equal to Mr. Nungester’s base salary plus the average annual payment paid under the short-term incentive plan over the last five years.
Without Cause or for Good Reason in Connection with a Change in Control – (1) a lump sum payment equal to 2.99 times the sum of Mr. Nungester’s base salary plus the average annual payment paid under the short-term incentive plan over the last five years; (2) payment on Mr. Nungester’s behalf of insurance premiums to maintain medical and dental insurance coverage under COBRA until the earlier of the first anniversary of the termination or the date on which Mr. Nungester is eligible to participate in another employer’s comparable plan. The increased severance benefit to Mr. Nungester in connection with a change in control is only available in the event the termination occurs within the six months before or the one year following the consummation of the change in control.
Under Mr. Nungester’s agreement, “cause” means personal dishonesty, incompetence, willful misconduct, breach of fiduciary duty involving personal profit, intentional failure to perform stated duties, willful violation of any law, rule or regulation or final cease-and-desist order, or a material breach of the agreement. Events giving rise to a “good reason” under Mr. Nungester’s agreement include (1) the assignment of duties inconsistent with his position or duties immediately prior to the assignment; (2) a material change in his reporting responsibilities or titles; (3) his not being appointed to the position of chief financial officer; (4) a reduction in base salary; (5) the relation of the Company’s principal offices away from the Defiance, Ohio area; (6) a material reduction in fringe benefits; (7) the failure of the Company to obtain the assumption of the agreement by any successor; and (8) the Company’s failure to comply with the agreement. Mr. Nungester must terminate his employment to receive any payments associated with a termination for good reason.
Mr. Nungester’s agreement includes language modifying the benefits due to him in the event the payments would be “excess parachute payments” under Section 280G of the Internal Revenue Code. If this were to occur, Mr. Nungester’s payments and benefits under the agreement will be reduced by the minimum amount necessary to result in no portion of the payments and benefits being non-deductible to the Company and subject to the excise taxes imposed under the Internal Revenue Code for parachute payments.
Mr. Nungester’s agreement includes restrictive covenants concerning non-competition for a period of one year following the termination of his employment.
Severance and Change in Control Protection Agreements of Rick Hull, Varun Chandhok, and Shannon Kuhl - The Company entered into Severance and Change in Control Protection Agreements with Varun Chandhok and Shannon Kuhl effective April 2022. The initial term of these agreements is 12 months and automatically extends for additional 12-month periods unless terminated with 90 days prior written notice. The current term of each of Mr. Chandhok’s and Ms. Kuhl’s agreements ends March 31, 2025. The Company entered into a Severance and Change in Control Protection Agreement with Rick Hull in February 2024 with an initial term ending March 31, 2025 that similarly will renew for additional 12-month periods unless terminated with 90 days prior written notice.
In addition to the Accrued Benefits, the agreements provide the listed benefits to each of Mr. Hull, Mr. Chandhok, and Ms. Kuhl in the following termination scenarios:
Disability – (1) the Pro-Rated Short Term Incentive Payment described above; and (2) subject to the timely election of continuation coverage of health benefits in accordance with COBRA, payment of the full amount of the executive’s premiums for this continued coverage until the earlier of 18 months following the termination of employment or the executive becomes eligible for group health coverage from another employer (the “Severance/CIC COBRA Subsidy”).
Death – (1) the Pro-Rated Short Term Incentive Payment described above; and (2) subject to the timely election of continuation coverage of health benefits in accordance with COBRA by the executive’s surviving beneficiary, payment of a lump sum equal to the sum total of premiums for 18 months of continued coverage.
Without Cause –
Mr. Chandhok and Ms. Kuhl will receive (1) severance payments in the form of salary continuation for a period of 12 months, (2) a lump sum payment equal to the target award payable under the Short-Term Incentive Plan for the year in which the termination occurs, (3) a lump sum payment equal to the Pro-Rated Short Term Incentive Payment for the year in which the termination occurs; (4) outplacement services not to exceed $12,000; and (5) the Severance/CIC COBRA Subsidy.
Mr. Hull will receive (1) severance payments in the form of salary continuation for a period of 18 months, (2) a lump sum payment equal to 1.5 times the target award payable under the Short-Term Incentive Plan for the year in
which the termination occurs, (3) a lump sum payment equal to the Pro-Rated Short Term Incentive Payment for the year in which the termination occurs; (4) outplacement services not to exceed $12,000; and (5) the Severance/CIC COBRA Subsidy.
Without Cause or for Good Reason in Connection with a Change in Control – (1) severance payments in the form of salary continuation for a period of 18 months; (2) a lump sum payment equal to 1.5 times the target award payable under the Short-Term Incentive Plan for the year in which the termination occurs; (3) a lump sum payment equal to the Pro-Rated Short Term Incentive Payment for the year in which the termination occurs; (4) outplacement services not to exceed $12,000; and (5) the Severance/CIC COBRA Subsidy. The increased severance benefits to Mr. Chandhok and Ms. Kuhl in connection with a change in control are only available in the event the executive’s employment is terminated (1) by the Company within the six months prior to or the 12 months following the change in control, or (2) by the executive for good reason within 12 months following the change in control.
Under these agreements, “cause” means (1) the executive’s indictment or conviction of, or plea of guilty or nolo contendere to any felony, or any other crime that involves moral turpitude, theft, dishonesty, or breach of trust; (2) breach of fiduciary duty to the Company; (3) willful misconduct in the course of the executive’s employment; (4) the executive being prohibited from participating the affairs of the Company or its affiliates by and order of the FDIC; (5) the executive’s willful and repeated failure to perform their duties; (6) the executive engaging in unsafe or unsound banking practices; or (7) any other material breach of the agreement or of any code or policy of the Company by the executive. Events giving rise to a “good reason” under these agreements include (1) a material (10% or greater) reduction in the executive’s base salary; (2) a material reduction in the executive’s title; (3) a material change in the geographic location of the executive’s principal work location; or (4) a material breach of the agreement by the Company. The executive must give notice of the good reason event within 90 days of becoming aware of it, after which the Company will have 30 days to remedy the condition. If the Company does not remedy the condition, the executive must terminate their employment within 90 days of the cure period to receive any payments associated with a termination for good reason.
Each of Mr. Hull’s, Mr. Chandhok’s and Ms. Kuhl’s agreements include language modifying the benefits due in the event the payments would be “excess parachute payments” under Section 280G of the Internal Revenue Code. If this were to occur, the executive’s payments and benefits under the agreement will be reduced by the minimum amount necessary to result in no portion of the payments and benefits being non-deductible to the Company and subject to the excise taxes imposed under the Internal Revenue Code for parachute payments.
Each of these agreements includes restrictive covenants concerning non-competition for a period of six months following the termination of the executive’s employment, and concerning non-solicitation, of customers and of employees, for a period of one year following the termination of the executive’s employment.
The table below summarizes the estimated payments due to the NEOs under the short-term incentive plan, the long-term incentive plan, and the applicable Executive Agreement described above in the event of the NEO’s termination of the employment. The amounts shown assume that such termination was effective as of December 31, 2024, and, thus, include amounts earned through such time and are estimates of the amounts which would be paid out to the executives upon their termination. The actual amounts to be paid out can only be determined at the time of such executive’s separation from us.
The merger of Premier into Wesbanco, Inc. is considered a change in control. Mr. Small, Mr. Nungester, and Ms. Kuhl will each receive applicable change in control payments upon the termination of their employment at the time merger is completed while Mr. Hull, whose employment will continue, will receive certain payments in connection with the cancellation of his Severance and Change in Control Protection Agreement. Mr. Chandhok, whose employment will continue, will receive a new agreement from Wesbanco, Inc. replacing his Severance and Change in Control Protection Agreement with Premier.
Executive Benefits and Payments upon Termination
| | | | | | | |
|
Voluntary Termination (w/o Good Reason and no CIC) ($)
| Termination by Employee with Good Reason (No CIC) ($) |
Involuntary Termination Not for Cause (No CIC) ($)
|
Retirement ($)
|
Death ($)
|
Disability ($)
|
Change of Control Involuntary or Good Reason Termination(2) ($)
|
Gary Small |
|
|
|
|
|
|
|
Cash Payments (1) Vesting of equity awards | -- -- | 2,278,548 762,560 | 2,278,548 762,560 | 321,360 328,790 | 482,040 980,345 | 350,388 980,345 | 3,232,987 875,235 |
Paul Nungester |
|
|
|
|
|
|
|
Cash Payments (1) Vesting of equity awards | -- -- | 648,234 48,231 | 648,234 233,824 | 136,658 233,824 | 136,658 329,439 | 136,658 329,439 | 1,692,144 283,577 |
Rick Hull |
|
|
|
|
|
|
|
Cash Payments (1) | -- | - | 854,081 | 159,031 | 188,059 | 188,059 | 853,660 |
Vesting of equity awards | -- | 24,115 | 112,903 | 112,903 | 159,874 | 159,874 | 137,226 |
Varun Chandhok |
|
|
|
|
|
|
|
Cash Payments (1) Vesting of equity awards | - -- | - 42,147 | 659,242 334,815 | 141,568 334,815 | 174,472 418,027 | 174,472 418,027 | 833,969 378,227 |
Shannon Kuhl |
|
|
|
|
|
|
|
Cash Payments (1) Vesting of equity awards | -- -- | - 26,564 | 385,642 193,873 | 75,741 193,873 | 75,741 244,728 | 75,741 244,728 | 497,037 220,174 |
(1)Cash payments include any amounts payable as short-term incentive compensation, severance payments due under an Executive Agreement, the COBRA Amount, and other payments made with respect to the continuation of medical benefits.
(2)Mr. Chandhok’s PSU awards (with a value of $167,377) and RSAs (with a value of $210,850) will vest in connection with a change in control in the event of either an involuntary termination without cause or a termination by Mr. Chandhok for Good Reason. Amounts reflected for other NEOs reflect vesting in connection with a change in control in the event of either an involuntary termination without cause or a termination by the NEO for Good Reason.
CEO PAY RATIO
We are required to disclose the median of the total compensation of the Company’s employees, excluding the Company’s CEO, for the last completed fiscal year, the annual total compensation of the Company’s CEO for the last completed fiscal year, and the ratio between the foregoing compensation amounts. We identified the median employee by examining the 2024 total federal taxable compensation through December 31, 2024 for all individuals, excluding our CEO, who were employed by us on November 30, 2024 (whether employed on a full-time, part-time, or seasonal basis). For such employees, we did not make any assumptions, adjustments, or estimates with respect to total federal taxable compensation, and we did not annualize the compensation for any full-time employees that were not employed by us for all of 2024. After identifying the median employee, we calculated annual total compensation for such employee using the same methodology we use for our NEOs as set forth in the Summary Compensation Table on page P# of this Proxy Statement.
For fiscal year 2024, the median annual total compensation for all employees (excluding the CEO) was $46,307, and the annual total compensation of our CEO was $1,281,270, resulting in a ratio of 1: 27.67.
Director Compensation
The table below provides compensation information concerning Mr. Hileman, who is a current employee of the Company, and our non-employee directors for the fiscal year ended December 31, 2023. Employee directors are not paid any additional amounts for Board service. Compensation information for Mr. Small is included in the Executive Compensation section above.
| | | | |
Director | Fees Earned or Paid in Cash ($) | Stock Awards ($)(1) | All Other
Compensation
($)
| Total ($) |
Adams, Marty E. | $78,750 | $40,000 | -- | $118,750 |
Afzal, Zahid | $49,850 | $40,000 | -- | $89,850 |
Altman, Louis M. | $52,750 | $40,000 | -- | $92,750 |
Bettinger, Terri A. | $53,350 | $40,000 | -- | $93,350 |
Bookmyer, John L. | $81,250 | $40,000 | -- | $121,250 |
Burdman, Lee | $50,000 | $40,000 | -- | $90,000 |
Hileman, Donald P. (2) | -- | $50,001 | $358,637 | $408,638 |
Hubbard, Jean A. | $51,750 | $40,000 | -- | $91,750 |
Lanier, Nikki R. | $50,000 | $40,000 | -- | $90,000 |
Niehaus, Charles D. | $55,250 | $40,000 | -- | $95,250 |
Robison, Mark A. | $52,500 | $40,000 | -- | $92,500 |
Schiraldi, Richard J. | $92,500 | $40,000 | -- | $132,500 |
Strausbaugh, Samuel S. | $80,000 | $40,000 | -- | $120,000 |
| |
(1)
| In 2024, each non-employee director was granted an award of restricted shares as of the date of the 2024 Annual Shareholder Meeting. The dollar amounts reported for such awards in this column represent the aggregate grant date fair value of the shares granted to each non-employee computed in accordance with Financial Accounting Standards Board (FASB) Accounting Standards Codification (ASC) Topic 718 (“FASB ASC Topic 718”) using the closing price of PFC common stock on the award date. |
(2) | The dollar amount shown as “All Other Compensation” for Mr. Hileman includes the following compensation, perquisites, and personal benefits: employee salary of $273,077; bonus compensation of $50,000; Company 401(k) contributions of $10,923; Company deferred compensation plan contributions of $2,810; life insurance with a value of $6,160; insurance premiums of $11,353; and country club dues of $4,314. |
Each non-employee director received an annual retainer of $80,000 in 2024. Mr. Schiraldi, as Vice Chair, received an additional retainer of $12,500. The Company pays directors $40,000 of the annual retainer in Premier shares. Directors receive additional retainers in connection with their service on Board committees or the Trust Committee of Premier Bank as described in the following table. While all our directors serve on the Board of Premier Bank, the directors do not receive separate compensation in connection with this service.
| | | |
2024 Board Committee Retainers |
Committee | Chair
Retainer ($) | Member
Retainer ($) |
|
| | | |
Audit | 15,000 | 7,500 |
|
Compensation | 10,000 | 5,000 |
|
Risk | 10,000 | 5,000 |
|
Governance & Nominating | 7,500 | 3,750 |
|
Technology(1) | 3,350 | -- |
|
Trust | 3,000 | 1,500 |
|
Executive | -- | 25,000 |
|
| |
(1)
| The independent directors on the Technology Committee both serve as co-chairs and no separate member retainer amount was set for 2024. |
Besides the portion of the retainer paid in Premier shares, the Company allows individual directors to elect to receive all or any part of the balance of their director compensation in either cash or stock. Our directors may also defer all or any part of their cash retainer payable to them under the Premier Financial Corp. Deferred Compensation Plan further described above. The returns on the amounts deferred are dependent on the investment elections made by the director.
No non-employee director received perquisites or personal benefits with an aggregate value exceeding $10,000.
The Board has set stock ownership guidelines for the Board and executive management in the Corporate Governance Guidelines. The guideline for each Board member is ownership equal to a value of five times the annual retainer payable in Premier shares. The Board prohibits directors from engaging in transactions that could reduce the extent to which their investment in Premier’s shares is aligned with the interests of shareholders. As a result, our Corporate Governance Guidelines prohibit directors from entering into speculative transactions involving our shares, including any hedging, short sales, puts, calls, swaps, forward contracts, or other derivative securities.
Disclosure of Action to Recover Erroneously Awarded Compensation
Premier was not required to prepare an accounting restatement during or after the completion of the fiscal year ending December 31, 2024. No recovery of erroneously awarded compensation under the Company’s Compensation Clawback Policy was required nor was there an outstanding balance of erroneously awarded compensation from the prior fiscal year.
Disclosure of Policies and Practices Related to the Grant of Equity Awards Close in Time to the Release of Material Nonpublic Information
No options were awarded by the Company during the fiscal year ending December 31, 2024.
Item 12. Security Ownership of Certain Beneficial Owners and Management and Related Stockholder Matters
Security Ownership of Certain Beneficial Owners
The following table sets forth information about the only persons known to the Company to own beneficially more than 5% of our outstanding common shares based on the most recent filed Schedule 13G for each of the listed security holders.
| | |
Amount and Nature of Beneficial Ownership |
Name and Address of Beneficial Owner | Shares Beneficially
Owned | Percent of Class Outstanding |
BlackRock, Inc. 55 East 52nd Street New York, New York 10055 | 4,161,629 (1) | 11.6% (1) |
| | |
Dimensional Fund Advisors LP Building One, 6300 Bee Cave Road Austin, Texas 78746 | 2,254,801 (2) | 6.3% (2) |
The Vanguard Group 100 Vanguard Blvd. Malvern, PA 19355 | 1,973,151 (3) | 5.52% (3) |
(1) As of September 30, 2024, and based on a Schedule 13G/A filed with the SEC on November 12, 2024, BlackRock, Inc. possesses sole voting power over 3,968,495 shares and sole dispositive power over 4,161,629 shares. (2) As of December 29, 2023, and based on a Schedule 13G/A filed with the SEC on February 9, 2024, Dimensional Fund Advisors LP (“Dimensional”), an investment advisor registered under Section 203 of the Investment Advisors Act of 1940, possesses sole voting power over 2,213,203 shares and sole dispositive power over 2,254,801shares. All shares reported are owned by the funds for which Dimensional serves as investment advisor, and Dimensional disclaims beneficial ownership of such securities. (3) As of December 29, 2023, and based on a Schedule 13G/A filed with the SEC on February 13, 2024, The Vanguard Group possesses shared voting power over 47,120 shares, sole dispositive power over 1,894,742 shares and shared dispositive power over 78,409 shares.
|
Beneficial Ownership of Management
The following table includes, as of February 12, 2025, certain information as to the PFC shares beneficially owned by (1) each director and nominee and (2) all of our directors and executive officers as a group.
| | | |
Amount and Nature of Beneficial Ownership
|
|
Name of Beneficial Owner | Shares Beneficially
Owned (1) | Percent of Class
Outstanding (2) |
Marty E. Adams (3) | 82,003 | - |
Zahid Afzal (4) | 55,137 | - |
Louis Altman (5) | 50,140 | - |
Terri Bettinger | 11,403 | - |
John L. Bookmyer (6) | 66,596 | - |
Lee Burdman (7) | 77,775 | - |
Varun Chandhok (8) | 25,051 | - |
Donald P. Hileman | 89,203 | - |
Jean A. Hubbard | 20,830 | - |
Rick L. Hull (9) | 29,125 | - |
Shannon M. Kuhl (10) | 12,709 | - |
Nikki R. Lanier | 2,319 | - |
Charles D. Niehaus | 24,992 | - |
Paul D. Nungester (11) | 56,517 | - |
Mark Robison | 17,922 | - |
| | | |
Richard J. Schiraldi | 47,238 | - |
Gary M. Small (12) | 130,778 | - |
Samuel S. Strausbaugh | 24,398 | - |
All current directors and executive officers as a group (25 persons) (13)
| 931,978 | 2.59% |
(1) Share numbers shown are rounded to the nearest whole number. The beneficial owner has sole voting and investment power over the shares unless otherwise noted. (2) Based on 35,892,588 shares of common stock outstanding and 20,575,unexercised options as of February 12, 2025 plus 132,765 shares to be issued pursuant to the vesting of performance share units within 60 days of February 12, 2005. If no percent is provided in this column, the number of shares is less than 1% of the total outstanding Premier shares. (3) Includes 10,000 shares owned by the Marty and Patti Family Foundation over which Mr. Adams has voting and investment power. (4) Includes 29,534 shares owned by the living trust of Mr. Afzal’s spouse. (5) Includes 965 shares held in an irrevocable trust of Mr. Altman; and 25,155 owned by the living trust of Mr. Altman’s spouse, 18,723 shares held in the Altman Family Trust, and 143 shares owned by the Ruth Altman Trust over which Mr. Altman has shared voting and investment power. (6) Includes 64,532 shares jointly owned with Mr. Bookmyer’s spouse with whom he shares voting and investment power. (7) Includes 6,959 shares owned by Mr. Burdman’s spouse; and 6,915 shares owned by Purple Burd Limited Partnership, 16,207 shares owned by KB Kidz Limited Partnership, and 1,238 shares owned by the Marsh Burdman Family Trust, over which Mr. Burdman has shared voting and investment power. (8) Includes 2,627 shares issuable upon the vesting of performance share units on February 15, 2025; and 7,101 shares issuable upon the vesting of performance share units upon the change in control associated with the consummation of the merger with Wesbanco, Inc. anticipated on February 28, 2025. (9) Includes 1,504 shares issuable upon the vesting of performance share units on February 15, 2025; and 4,016 shares issuable upon the vesting of performance share units upon the change in control associated with the consummation of the merger with Wesbanco, Inc. anticipated on February 28, 2025. (10) Includes 1,656 shares issuable upon the vesting of performance share units on February 15, 2025; and 4,349 shares issuable upon the vesting of performance share units upon the change in control associated with the consummation of the merger with Wesbanco, Inc. anticipated on February 28, 2025. (11) Includes 3,006 shares issuable upon the vesting of performance share units on February 15, 2025; and 8,164 shares issuable upon the vesting of performance share units upon the change in control associated with the consummation of the merger with Wesbanco, Inc. anticipated on February 28, 2025. (12) Includes 18,575 shares issuable pursuant to currently exercisable stock options; 7,069 shares issuable upon the vesting of performance share units on February 15, 2025; and 19,149 shares issuable upon the vesting of performance share units upon the change in control associated with the consummation of the merger with Wesbanco, Inc. anticipated on February 28, 2025. (13) For executives who are not NEOs, includes 9,616 shares issuable upon the vesting of performance share units on February 15, 2025; and 25,875 shares issuable upon the vesting of performance share units upon the change in control associated with the consummation of the merger with Wesbanco, Inc. anticipated on February 28, 2025.
|
|
Equity Compensation Plans
The following table provides information as of December 31, 2024, with respect to the shares of Premier common stock that are reserved for issuance under Premier’s existing equity compensation plans. There are no equity compensation plans that have not been approved by Premier’s shareholders.
| | | | | | | | | | | | |
| | | | | | | | | | | | |
Plan Category |
| Number of
securities to
be Issued
Upon Exercise
of Outstanding
Options,
Warrants
and Rights |
|
| Weighted
Average
Exercise Price of
Outstanding
Options,
Warrants
and Rights |
|
| Number of
Securities
Remaining
Available
for Future
Issuance
Under Equity
Compensation
Plans (Excluding
Securities
Reflected
in Column (a) |
|
|
| (a) |
|
| (b) |
|
| (c) |
|
Equity Compensation Plans Approved by Security Holders |
|
| 22,175 |
|
| $ | 24.67 |
|
|
| 301,763 |
|
Equity Compensation Plans
The following table provides information as of December 31, 2024, with respect to the shares of Premier common stock that are reserved for issuance under Premier’s existing equity compensation plans.
| | | | | | | | | | | | |
Plan Category | | Number of
securities to
be Issued
Upon Exercise
of Outstanding
Options,
Warrants
and Rights | | | Weighted
Average
Exercise Price of
Outstanding
Options,
Warrants
and Rights | | | Number of
Securities
Remaining
Available
for Future
Issuance
Under Equity
Compensation
Plans (Excluding
Securities
Reflected
in Column (a) | |
| | (a) | | | (b) | | | (c) | |
Equity Compensation Plans Approved by Security Holders | | | 22,175 | | | $ | 24.67 | | | | 301,763 | |
Item 13. Certain Relationships and Related Transactions, and Director Independence
Related Person Transactions
The Board and the Governance and Nominating Committee review and approve all transactions and payments involving the directors and executive officers, or involving their related persons or immediate family members, that occur in a given fiscal year. No related person transactions were identified in 2024 that require disclosure in this Proxy Statement. Transactions with related persons of certain independent directors were identified and reviewed by the Board of Directors, but none of these transactions were determined to affect the ability of such directors to exercise their independent judgment while serving on the Board or any Board committees due to the minimal values involved.
Premier Bank has, and expects to have in the future, banking relationships in the ordinary course of business with directors, executive officers, and their affiliates on the same terms, including interest rates and collateral on loans, as those prevailing at the same time for comparable transactions with others. Normal, arms-length banking relationships entered into in the ordinary course of business and consistent with applicable federal banking or other regulations are not considered to interfere with a director’s independence. Service specialization, rate concessions, fee concessions, or other services or product modifications may similarly be offered to directors and executive officers and their affiliates if the same would be offered to other similarly situated clients on a non-discriminatory basis in the ordinary course of business. All loans or extensions of credit to a director or officer, or their related interests (as defined by Regulation O of the Federal Reserve), (1) were made in compliance with Regulation O of the Federal Reserve, (2) were made in the
ordinary course of business, (3) were made on substantially the same terms, including interest rates and nature of collateral, as those prevailing at the time for comparable transactions with other persons not related to the Company, and (4) did not involve more than the normal risk of collectability or present other unfavorable features.
Director Independence
Our Corporate Governance Guidelines require that at least a majority of the members of the Board qualify as independent directors under applicable rules, including the independence listing standards of The Nasdaq Stock Market LLC (“Nasdaq”). Each year the Board assesses the independence of all directors and nominees with these standards and also in terms of whether these individuals have any relationships with the Company or others that could impact the exercise of their independent judgment. The Board has determined that the following directors, constituting a majority (12 of 14 directors) of the Board, are independent directors:
| | |
Marty E. Adams | John L. Bookmyer | Charles D. Niehaus |
Zahid Afzal | Lee Burdman | Mark A. Robison |
Louis M. Altman | Jean A. Hubbard | Richard J. Schiraldi |
Terri A. Bettinger | Nikki R. Lanier | Samuel S. Strausbaugh |
Directors Hileman and Small are not considered independent due to their current employment status with the Company.
Item 14. Principal Accountant Fees and Services
Crowe LLP was our independent registered public accounting firm for the fiscal years ended December 31, 2024, 2023 and 2022, and has reported on our consolidated financial statements for each of these years.
Audit and Non-Audit Fees
The following table sets forth the aggregate fees that we paid to Crowe for audit and non-audit services in 2024 and 2023. The table lists audit fees, audit related fees, tax fees and all other fees.
| | | |
Services Rendered | 2024 ($) | 2023 ($) |
Audit Fees | 887,199 |
| 813,270 |
Audit-Related Fees | 108,377 |
| 45,850 |
Tax Fees | 134,450 |
| 108,275 |
All Other Fees | -- |
| 4,093 |
Total Fees Paid | 1,130,026 |
| 971,488 |
Audit-related fees relate to services for employee benefit plan audits and the audits of the captive insurance company. Tax fees consist of fees related to the preparation of tax returns, services relating to the insurance agency disposition, and consulting services relating to the company’s prepared tax model and low-income housing tax credits. All other fees consist of an accounting research tool subscription.
Pre-Approval Policies and Procedures
Pursuant to its charter, the Audit Committee reviews and pre-approves audit and permissible non-audit services performed by the Company’s independent registered public accounting firm as well as the scope, fees, and other terms of such services. The Audit Committee may not approve any service that individually or in the aggregate may impair, in the Audit Committee’s opinion, the independence of the independent registered public accounting firm. The Audit Committee has delegated its authority to pre-approve audit, audit-related, and non-audit services to the Chair of the Committee, provided that any decisions to pre-approve shall be presented to the full Audit Committee at its next scheduled meeting. For the fiscal years 2024 and 2023, respectively, all of the audit and non-audit services provided by the Company’s independent registered public accounting firm were pre-approved by the Audit Committee or the Chair of the Audit Committee in accordance with the Audit Committee Charter.
PART IV
Item 15.Exhibits, Financial Statement Schedules
(1)The following documents are filed as Item 8 of this Form 10-K.
(A) Report of Independent Registered Public Accounting Firm (Crowe LLP)
(B) Consolidated Statements of Financial Condition as of December 31, 2024 and 2023
(C) Consolidated Statements of Income for the years ended December 31, 2024, 2023 and 2022
(D) Consolidated Statements of Comprehensive Income for the years ended December 31, 2024, 2023 and 2022
(E) Consolidated Statements of Changes in Stockholders’ Equity for the years ended December 31, 2024, 2023 and 2022
(F) Consolidated Statements of Cash Flows for the years ended December 31, 2024, 2023 and 2022
(G) Notes to Consolidated Financial Statements
(2)Separate financial statement schedules are not being filed because of the absence of conditions under which they are required or because the required information is included in the consolidated financial statements or the related notes.
(3)The exhibits required by this item are listed in the Exhibit Index of this Form 10-K.
Item 16. 10-K Summary
None.
SIGNATURES
Pursuant to the requirements of Sections 13 or 15(d) of the Securities Exchange Act of 1934, the registrant has duly caused this report to be signed on its behalf by the undersigned, thereunto duly authorized.
| | | |
| | PREMIER FINANCIAL CORP. |
| | | |
February 28, 2025 | | By: | /s/ Paul Nungester |
| | | Paul Nungester, Chief Financial Officer |
Pursuant to the requirements of the Securities Exchange Act of 1934, this report has been signed below by the following persons on behalf of the registrant and in the capacities indicated on February 28, 2025.
| | |
Signature | | Title |
| | |
/s/ Gary M. Small | | Chief Executive Officer, President and Director |
Gary M. Small | | |
| | |
/s/ Paul Nungester | | Executive Vice President and Chief |
Paul Nungester | | Financial Officer (principal accounting officer) |
| | |
/s/ Donald P. Hileman* | | Executive Chairman and Director |
Donald P. Hileman | | |
| | |
/s/ Richard J. Schiraldi* | | Vice Chairman and Director |
Richard J. Schiraldi | | |
| | |
/s/ Marty E. Adams* | | Director |
Marty E. Adams | | |
| | |
/s/ Zahid Afzal* | | Director |
Zahid Afzal | | |
| | |
/s/ Louis M. Altman* | | Director |
Louis M. Altman | | |
| | |
/s/ Terri A. Bettinger* | | Director |
Terri A. Bettinger | | |
| | |
/s/ John L. Bookmyer* | | Director |
John L. Bookmyer | | |
| | |
/s/ Lee Burdman* | | Director |
Lee Burdman | | |
/s/ Jean A. Hubbard* | | Director |
Jean A. Hubbard | | |
| | |
/s/ Nikki R. Lanier* | | Director |
Nikki R. Lanier | | |
| | |
/s/ Charles D. Niehaus* | | Director |
Charles D. Niehaus | | |
| | |
/s/ Mark A. Robison* | | Director |
Mark A. Robison | | |
| | |
/s/ Samuel S. Strausbaugh* | | Director |
Samuel S. Strausbaugh | | |
| | |
*By: /s/ Paul Nungester | | |
Paul Nungester, Attorney in Fact | | |
Exhibit Index
This report incorporates by reference the documents listed below that we have previously filed with the SEC. The SEC allows us to incorporate by reference information in this document. The information incorporated by reference is considered to be part of this document.
The SEC maintains an internet web site that contains reports, proxy statements, and other information about issuers, like Premier, who file electronically with the SEC. The address of the site is http://www.sec.gov. The reports and other information filed by Premier with the SEC are also available at the Premier Financial Corp. web site. The address of the site is http://www.yourpremierbank.com. Except as specifically incorporated by reference into this Form 10-K, information on those web sites is not part of this report.
| | | |
Exhibit | | | |
Number | | Description | |
| | | |
2.1 | | Agreement and Plan of Merger, dated July 25, 2024, by and among Premier Financial Corp., Premier Bank, Wesbanco, Inc. and Wesbanco Bank Inc. (incorporated herein by reference to Exhibit 2.1 in Registrant's Form 8-K filed July 26, 2024) | |
| | | |
3.1 | | Second Amended and Restated Articles of Incorporation of Premier Financial Corp. (incorporated herein by reference to Exhibit 3.2 in Registrant’s Form 8-K filed June 22, 2020 (File No. 000-26850)) | |
| | | |
3.2 | | Second Amended and Restated Code of Regulations of Premier Financial Corp. (reflecting all amendments) (incorporated herein by reference to Exhibit 3.3 in Registrant’s Form 8-K filed June 22, 2020 (File No. 000-26850)) | |
| | | |
4.1* | | Description of Capital Stock | |
| | | |
4.2 | | Indenture, dated September 30, 2020, between Premier Financial Corp. and U.S. Bank National Association, as trustee (incorporated herein by reference to Exhibit 4.1 in Registrant’s Form 8-K filed September 30, 2020 (File No. 000-26850)) | |
| | | |
4.3 | | First Supplemental Indenture, dated September 30, 2020, between Premier Financial Corp, and U.S. Bank National Association, as trustee (incorporated herein by reference to Exhibit 4.2 in Registrant’s Form 8-K filed September 30, 2020 (File No. 000-26850)) | |
| | | |
4.4 | | Form of 4.00% Fixed-to-Floating Rate Subordinated Note due 2030 (included in Exhibit 4.3) (incorporated herein by reference to Exhibit 4.4 in Registrant's Form 10-K filed March 1, 2022 (File No. 000-26850) | |
| | | |
10.1+ | | Premier Financial Corp. Amended and Restated 2015 Long Term Incentive Plan (incorporated herein by reference to Exhibit 10.3 in Registrant's Form 10-K filed March 1, 2022 (File No. 000-26850) | |
| | | |
10.2+ | | Premier Financial Corp. Amended and Restate 2018 Equity Incentive Plan (incorporated herein by reference to Exhibit 10.4 in Registrant's Form 10-K filed March 1, 2022 (File No. 000-26850) | |
| | | |
10.3+* | | Premier Financial Corp. Short Term Incentive Program (2024) | |
| | | |
10.4+ | | Premier Financial Corp. Form of Long Term Incentive Plan Performance Share Units Award Agreement (2023) (incorporated herein by reference to Exhibit 10.4 in Registrant's 10-K filed February 28, 2024 (File No. 000-26850)) | |
| | | |
10.5+ | | Premier Financial Corp. Form of Restricted Stock Award Agreement (2023) (incorporated herein by reference to Exhibit 10.6 in Registrant's 10-K filed February 28, 2024 (File No. 000-26850)) | |
| | | |
10.6+ | | United Community Financial Corp. 2017 Deferred Compensation Plan (incorporated herein by reference to Exhibit 10.7 in Registrant's 10-K filed February 28, 2024 (File No. 000-26850)) | |
| | | |
10.7+ | | Form of Premier Financial Corp. Form of Restricted Stock Award Agreement (NonEmployee Director) (2023) (incorporated herein by reference to Exhibit 10.8 in Registrant's 10-K filed February 28, 2024 (File No. 000-26850)) | |
| | | |
10.8+ | | First Defiance Deferred Compensation Plan, revised October 30, 2014 (incorporated herein by reference to Exhibit 10.3 in the Registrant’s Form 10-Q filed August 7, 2018 (File No. 000-26850)) | |
| | | |
10.9+ | | Premier Financial Corp. 2022 Deferred Compensation Plan (incorporated herein by reference to Exhibit 10.10 in Registrant's Form 10-K filed March 1, 2022 (File No. 000-26850) | |
| | | |
10.10+ | | 2021 Form of Restricted Stock Award Agreement under 2018 Equity Incentive Plan (incorporated herein by reference to Exhibit 10.30 in Registrant's Form 10-K filed March 12, 2021 (File No. 000-26850)) | |
| | | |
10.11+ | | Premier Financial Corp. Long Term Incentive Program (incorporated herein by reference to Exhibit 10.1 in Registrant's 8-K filed February 23, 2022 (File No. 000-26850)) | |
| | | |
| | | |
10.12+ | | Premier Financial Corp. Form of Long Term Incentive Plan Performance Share Units Award Agreement (2022) (incorporated herein by reference to Exhibit 10.2 in Registrant's 8-K filed February 23, 2022 (File No. 000-26850)) | |
| | | |
10.13+ | | Premier Financial Corp. Form of Restricted Stock Award Agreement (2022) (incorporated herein by reference to Exhibit 10.3 in Registrant's 8-K filed February 23, 2022 (File No. 000-26850)) | |
| | | |
10.14+ | | Premier Financial Corp. Form of Restricted Stock Award Agreement (2024) (incorporated herein by reference to Exhibit 10.18 in Registrant's 10-K filed February 28, 2024 (File No. 000-26850)) | |
| | | |
10.15+ | | Employment Agreement with Gary M. Small, dated September 9, 2019 (incorporated herein by reference to Exhibit 10.2 in Registrant’s Form 8-K filed September 10, 2019 (File No. 000-26850)) | |
| | | |
10.16+ | | Employment Agreement with Paul D. Nungester, dated May 1, 2019 (incorporated herein by reference to Exhibit 10.1 in the Registrant’s Form 10-Q filed May 7, 2019 (File No. 000-26850)) | |
| | | |
10.17+ | | Severance and Change in Control Protection Agreement with Varun Chandhok, effective April 1, 2022 (incorporated herein by reference to Exhibit 10.1 in the Registrant’s Form 8-K filed May 18, 2022 (File No. 000-26850)) | |
| | | |
10.18+ | | Severance and Change in Control Protection Agreement with Rick L. Hull, effective February 7, 2024 (incorporated herein by reference to Exhibit 10.22 in Registrant's 10-K filed February 28, 2024 (File No. 000-26850)) | |
| | | |
10.19+ | | Severance and Change in Control Protection Agreement with Shannon M. Kuhl, effective April 1, 2022 (incorporated herein by reference to Exhibit 10.23 in Registrant's 10-K filed February 28, 2024 (File No. 000-26850)) | |
| | | |
10.20+ | | Amendment to Equity Award Agreements of Gary M. Small (incorporated herein by reference to Exhibit 10.27 in Registrant's Form 10-K filed March 1, 2022 (File No. 000-26850) | |
| | | |
10.21 | | Purchase Agreement, among Premier Financial Corp., Premier Bank and Piper Sandler & Co., dated September 25, 2020 (incorporated herein by reference to Exhibit 10.1 in Registrant’s Form 8-K filed September 30, 2020 (File 000-26850)) | |
| | | |
10.22+ | | Premier Financial Corp. Form of Long Term Incentive Plan Performance Share Units Award Agreement (2024) (incorporated herein by reference to Exhibit 10.27 in Registrant's 10-K filed February 28, 2024 (File No. 000-26850)) | |
| | | |
10.23+ | | Premier Financial Corp. Form of Restricted Stock Award Agreement (NonEmployee Director) (2024) (incorporated herein by reference to Exhibit 10.28 in Registrant's 10-K filed February 28, 2024 (File No. 000-26850)) | |
| | | |
19* | | Insider Trading Policy | |
| | | |
21* | | List of Subsidiaries of the Company | |
| | | |
23* | | Consent of Crowe LLP | |
| | | |
24.1* | | Power of Attorney | |
| | | |
31.1* | | Certification of Chief Executive Officer pursuant to Section 302 of the Sarbanes-Oxley Act of 2002 | |
| | | |
31.2* | | Certification of Chief Financial Officer pursuant to Section 302 of the Sarbanes-Oxley Act of 2002 | |
| | | |
32.1* | | Certification of Chief Executive Officer pursuant to Section 906 of the Sarbanes-Oxley Act of 2002 | |
| | | |
32.2* | | Certification of Chief Financial Officer pursuant to Section 906 of the Sarbanes-Oxley Act of 2002 | |
| | | |
97* | | Compensation Clawback Policy | |
| | | |
101.INS | | Inline XBRL Instance Document - the instance document does not appear in the Interactive Data File because XBRL tags are embedded within the Inline XBRL document. | |
| | | |
101.SCH | | Inline XBRL Taxonomy Schema With Embedded Linkbase Documents | |
| | | |
104 | | Cover Page Interactive Data File (embedded within the Inline XBRL document) | |
* Filed herewith
** Furnished herewith
+ Indicates management contract or compensatory plan.