Exhibit 99

Company Update November 2017 Donald P. Hileman President & CEO Kevin T. Thompson Executive Vice President & CFO
Forward Looking Statements The issuer has filed a registration statement including a prospectus, and will file a related supplement with the Securities and Exchange Commission (“SEC”), for the offering to which this communication relates. Before you invest, you should read the prospectus, the prospectus supplement and any other documents the issuer has filed or will file with the SEC for more complete information about the issuer and this offering. This presentation may contain certain forward - looking statements within the meaning of Section 27A of the Securities Act of 1933, as amended, and Section 21B of the Securities Exchange Act of 1934, as amended, which are intended to be safe harbors created thereby. Those statements may include, but are not limited to, all statements regarding intent, beliefs, expectations, projections, forecasts and plans of First Defiance Financial Corp. and its management, and specifically include statements regarding: changes in economic conditions, the nature, extent and timing of governmental actions and reforms, future movements of interest rates, the production levels of mortgage loan generation, the ability to grow loans and deposits, the ability to benefit from a changing interest rate environment, the ability to sustain credit quality ratios at current or improved levels, the ability to sell OREO properties, the continued strength of First Federal Bank of the Midwest in its market area, and the ability of First Defiance to grow in existing and adjacent markets. These forward - looking statements involve numerous risks and uncertainties, including those inherent in general and local banking, insurance and mortgage conditions, competitive factors specific to markets in which First Defiance and its subsidiaries operate, future interest rate levels, legislative and regulatory decisions or capital market conditions and other risks and uncertainties detailed from time to time in the First Defiance’s SEC filings, including First Defiance’s Annual Report on Form 10 - K for the year ended December 31, 2016. One or more of these factors have affected or could in the future affect First Defiance’s business and financial results and could cause actual results to differ materially from plans and projections. Therefore, there can be no assurances that the forward - looking statements included in this investor presentation will prove to be accurate. In light of significant uncertainties in the forward - looking statements included herein, the inclusion of such information should not be regarded as a representation by First Defiance or any other persons, that the objectives and plans of First Defiance will be achieved. All forward - looking statement made in this investor presentation are based on information presently available to the management of First Defiance. First Defiance assumes no obligation to update any forward - looking statements. 2
Non - GAAP Financial Measures The slides in this presentation contain non - GAAP financial measures. For purposes of Regulation G, a non - GAAP financial measure is a numerical measure of the registrant's historical or future financial performance, financial position or cash flows that excludes amounts, or is subject to adjustments that have the effect of excluding amounts, that are included in the most directly comparable measure calculated and presented in accordance with GAAP in the statement of income, balance sheet or statement of cash flows (or equivalent statements ) of the registrant; or includes amounts, or is subject to adjustments that have the effect of including amounts, that are excluded from the most directly comparable measure so calculated and presented. In this regard, GAAP refers to generally accepted accounting principles in the United States . Pursuant to the requirements of Regulation G, First Defiance Financial Corp. has provided reconciliations within these slides, as necessary, of the non - GAAP financial measure to the most comparable GAAP financial measure. 3
Company Overview 4
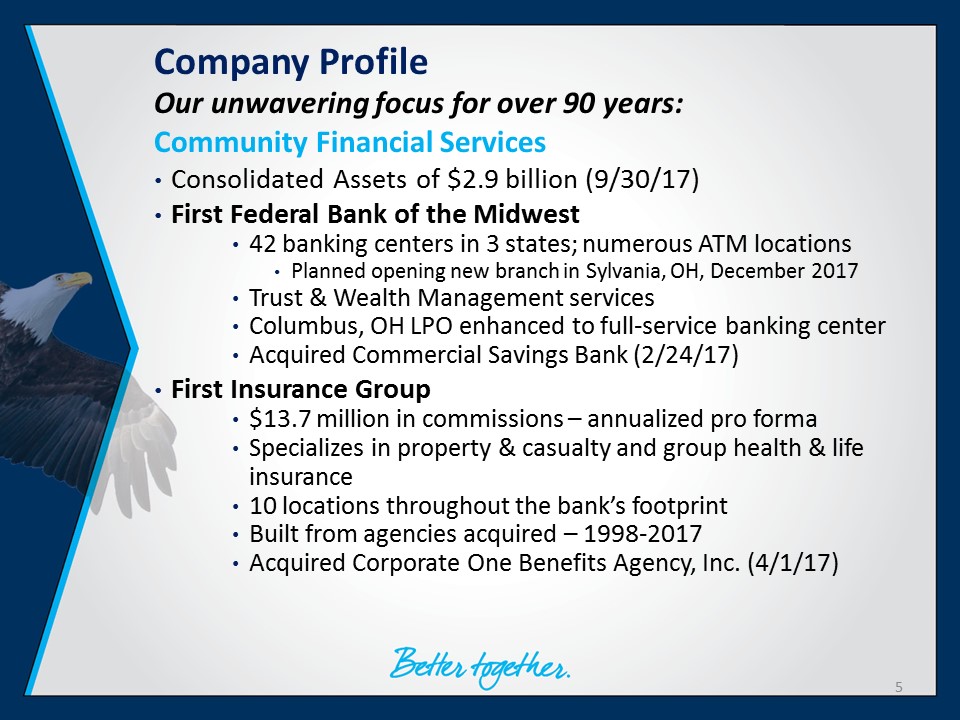
Company Profile Our unwavering focus for over 90 years: Community Financial Services • Consolidated Assets of $2.9 billion (9/30/17) • First Federal Bank of the Midwest • 42 banking centers in 3 states; numerous ATM locations • Planned opening new branch in Sylvania, OH, December 2017 • Trust & Wealth Management services • Columbus, OH LPO enhanced to full - service banking center • Acquired Commercial Savings Bank (2/24/17) • First Insurance Group • $13.7 million in commissions – annualized pro forma • Specializes in property & casualty and group health & life insurance • 10 locations throughout the bank’s footprint • Built from agencies acquired – 1998 - 2017 • Acquired Corporate One Benefits Agency, Inc. (4/1/17) 5
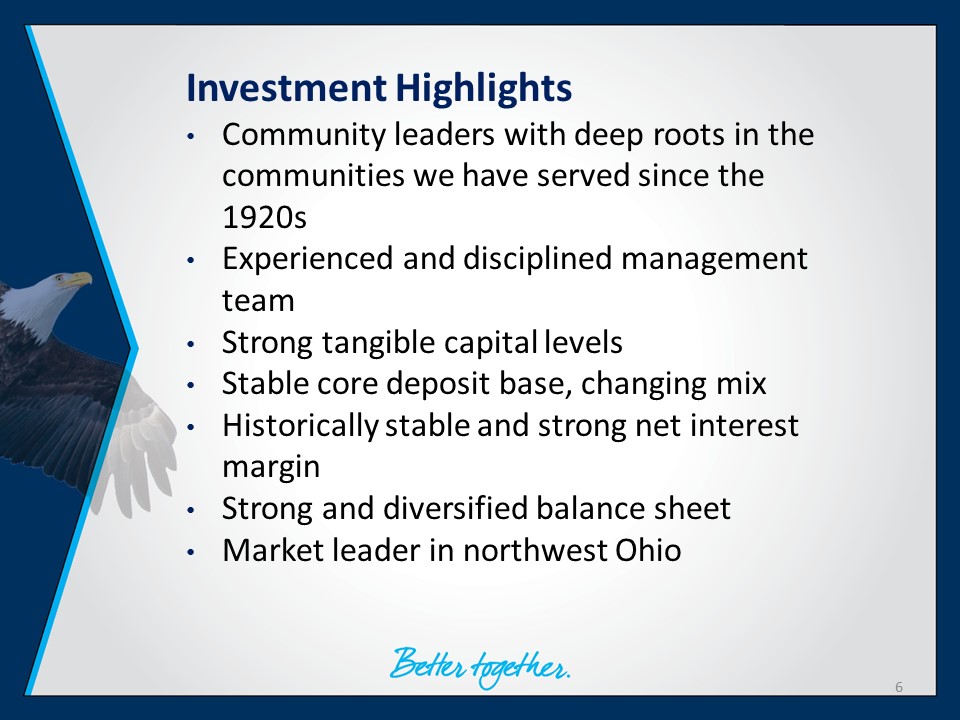
Investment Highlights • Community leaders with deep roots in the communities we have served since the 1920s • Experienced and disciplined management team • Strong tangible capital levels • Stable core deposit base, changing mix • Historically stable and strong net interest margin • Strong and diversified balance sheet • Market leader in northwest Ohio 6
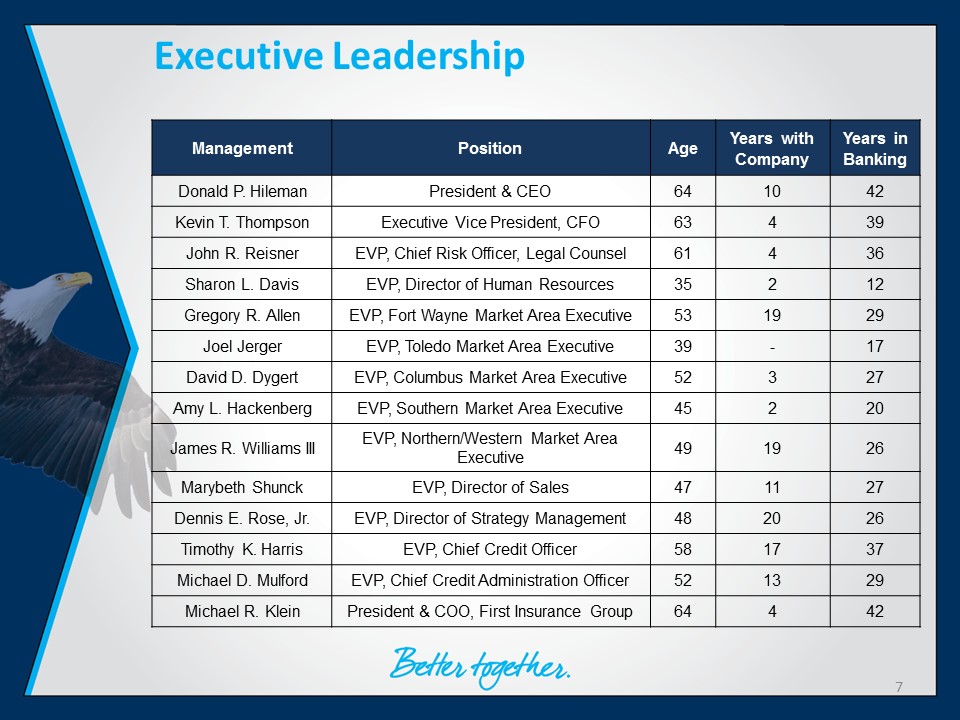
Executive Leadership 7 Management Position Age Years with Company Years in Banking Donald P. Hileman President & CEO 64 10 42 Kevin T. Thompson Executive Vice President, CFO 63 4 39 John R. Reisner EVP, Chief Risk Officer, Legal Counsel 61 4 36 Sharon L. Davis EVP, Director of Human Resources 35 2 12 Gregory R. Allen EVP, Fort Wayne Market Area Executive 53 19 29 Joel Jerger EVP, Toledo Market Area Executive 39 - 17 David D. Dygert EVP, Columbus Market Area Executive 52 3 27 Amy L. Hackenberg EVP, Southern Market Area Executive 45 2 20 James R. Williams III EVP, Northern/Western Market Area Executive 49 19 26 Marybeth Shunck EVP, Director of Sales 47 11 27 Dennis E. Rose, Jr. EVP, Director of Strategy Management 48 20 26 Timothy K. Harris EVP, Chief Credit Officer 58 17 37 Michael D. Mulford EVP, Chief Credit Administration Officer 52 13 29 Michael R. Klein President & COO, First Insurance Group 64 4 42

• Largest community bank based in northwest Ohio • Footprint covers northwest and c entral OH, southeast MI and northeast IN The First Defiance Market 8

Our Footprint – Local Economy • Fort to Port Growth Corridor • Fort Wayne, IN to Toledo, OH • Economic activity – expansion of transportation • Logistics projects linked to our transportation • Railroad • Regional distribution centers • Food processing and production • Market area unemployment consistent with national rate (4.5%, June 2017, source SNL) 9
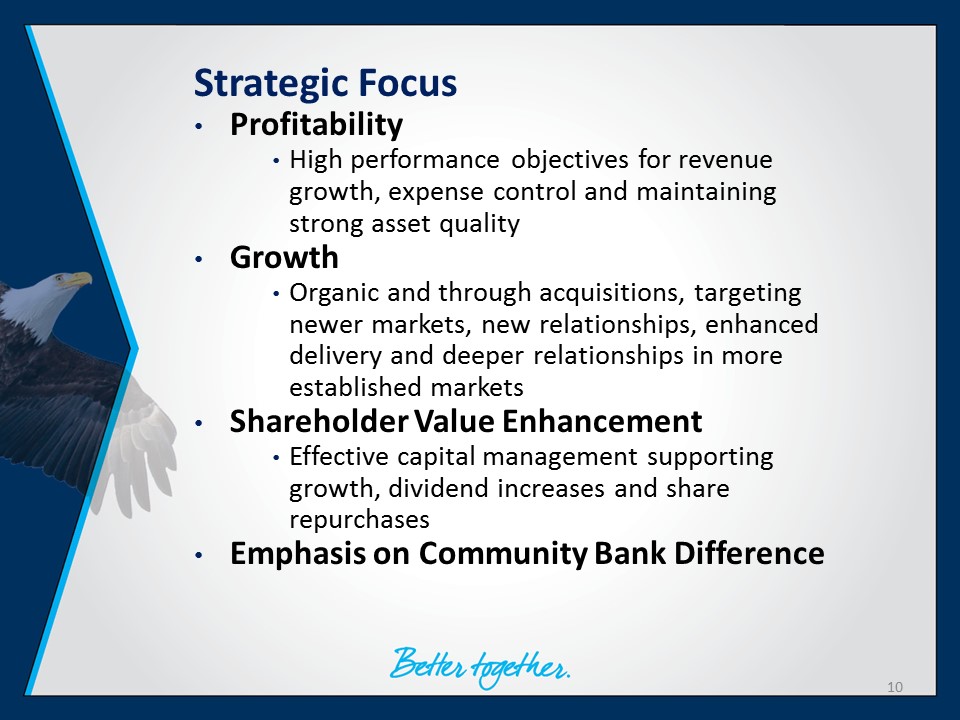
Strategic Focus • Profitability • High performance objectives for revenue growth, expense control and maintaining strong asset quality • Growth • Organic and through acquisitions, targeting newer markets, new relationships, enhanced delivery and deeper relationships in more established markets • Shareholder Value Enhancement • Effective capital management supporting growth, dividend increases and share repurchases • Emphasis on Community Bank Difference 10
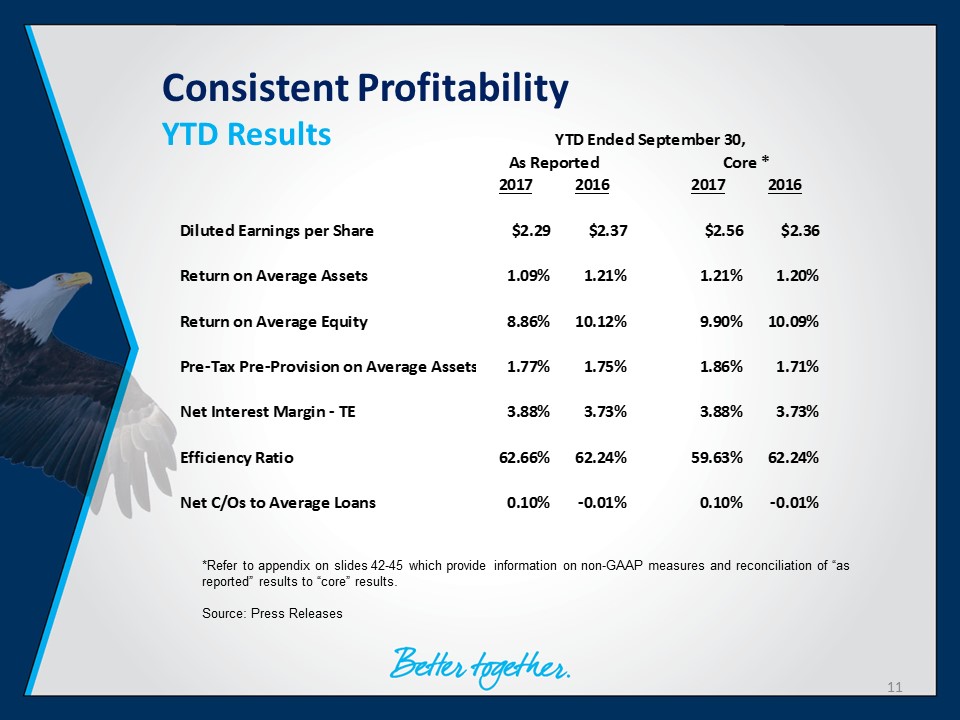
Consistent Profitability YTD Results *Refer to appendix on slides 42 - 45 which provide information on non - GAAP measures and reconciliation of “as reported” results to “core” results. Source : Press Releases 11 2017 2016 2017 2016 Diluted Earnings per Share $2.29 $2.37 $2.56 $2.36 Return on Average Assets 1.09% 1.21% 1.21% 1.20% Return on Average Equity 8.86% 10.12% 9.90% 10.09% Pre-Tax Pre-Provision on Average Assets 1.77% 1.75% 1.86% 1.71% Net Interest Margin - TE 3.88% 3.73% 3.88% 3.73% Efficiency Ratio 62.66% 62.24% 59.63% 62.24% Net C/Os to Average Loans 0.10% -0.01% 0.10% -0.01% YTD Ended September 30, As Reported Core *
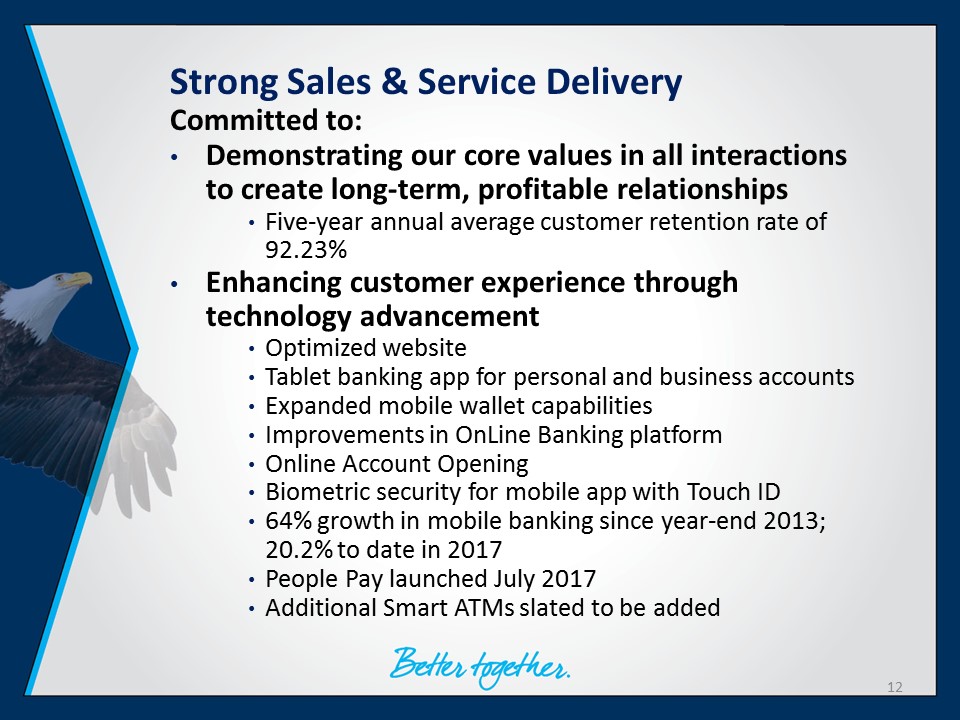
Strong Sales & Service Delivery Committed to: • Demonstrating our core values in all interactions to create long - term, profitable relationships • Five - year annual average customer retention rate of 92.23% • Enhancing customer experience through technology advancement • Optimized website • Tablet banking app for personal and business accounts • Expanded mobile wallet capabilities • Improvements in OnLine Banking platform • Online Account Opening • Biometric security for mobile app with Touch ID • 64% growth in mobile banking since year - end 2013; 20.2% to date in 2017 • People Pay launched July 2017 • Additional Smart ATMs slated to be added 12
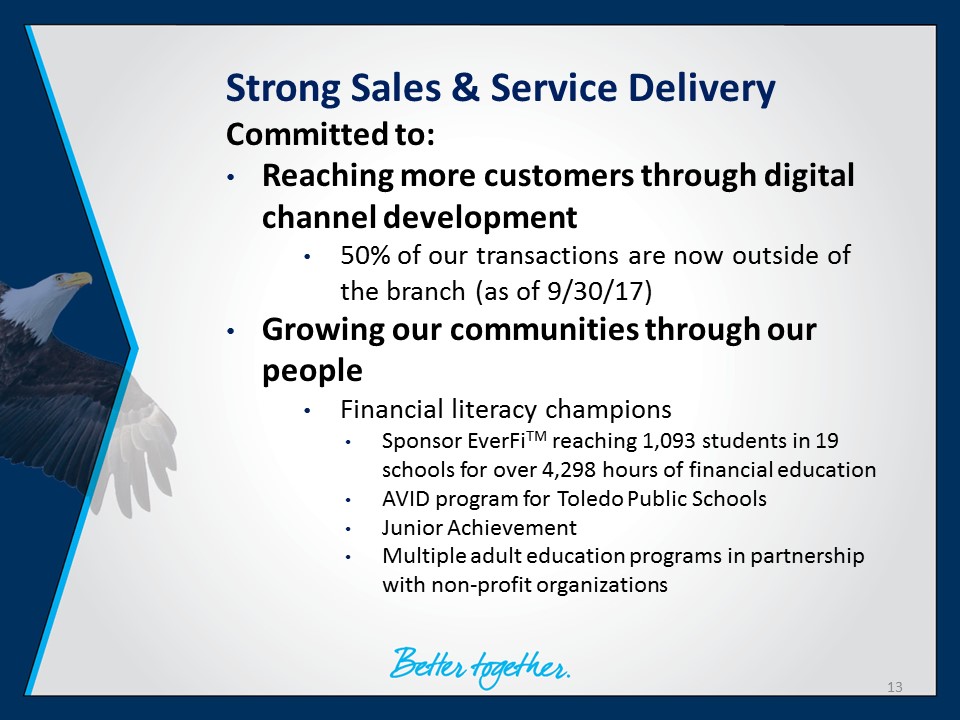
Strong Sales & Service Delivery Committed to: • Reaching more customers through digital channel development • 50% of our transactions are now outside of the branch (as of 9/30/17) • Growing our communities through our people • Financial literacy champions • Sponsor EverFi TM reaching 1,093 students in 19 schools for over 4,298 hours of financial education • AVID program for Toledo Public Schools • Junior Achievement • Multiple adult education programs in partnership with non - profit organizations 13
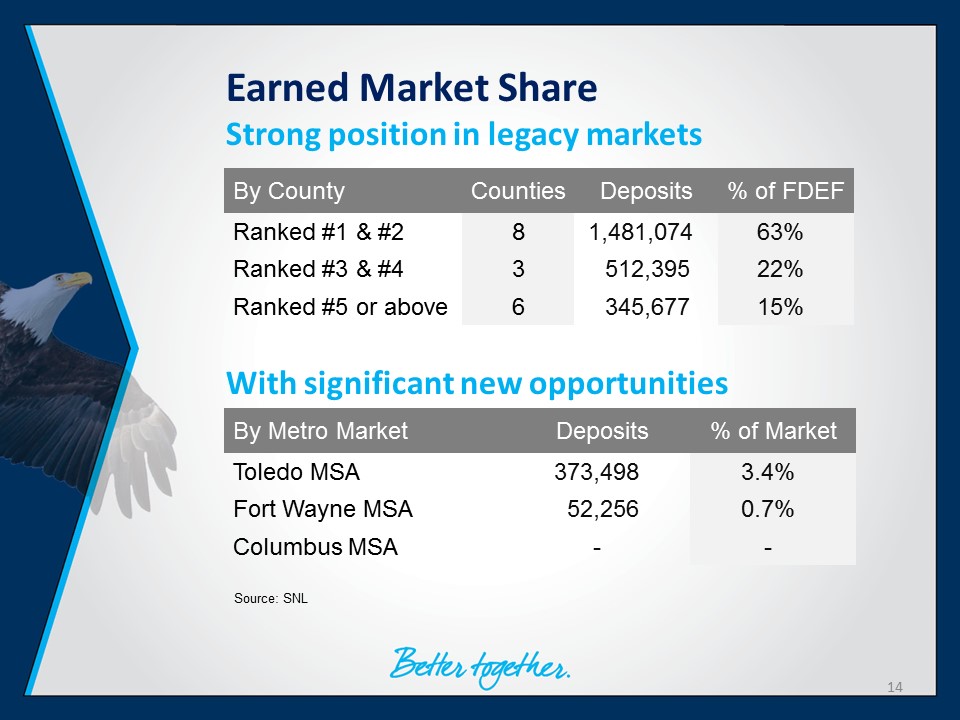
Earned Market Share Strong position in legacy markets With significant new opportunities Source: SNL By County Counties Deposits % of FDEF Ranked #1 & #2 8 1,481,074 63% Ranked #3 & #4 3 512,395 22% Ranked #5 or above 6 345,677 15% By Metro Market Deposits % of Market Toledo MSA 373,498 3.4% Fort Wayne MSA 52,256 0.7% Columbus MSA - - 14
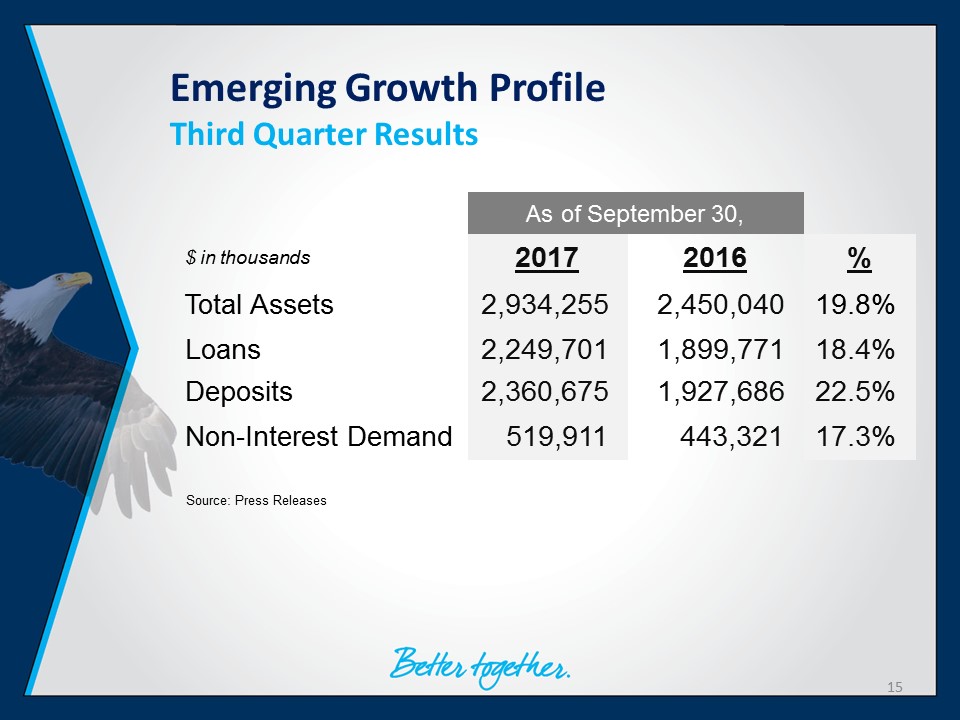
Emerging Growth Profile Third Quarter Results Source: Press Releases As of September 30, $ in thousands 2017 2016 % Total Assets 2,934,255 2,450,040 19.8% Loans 2,249,701 1,899,771 18.4% Deposits 2,360,675 1,927,686 22.5% Non - Interest Demand 519,911 443,321 17.3% 15
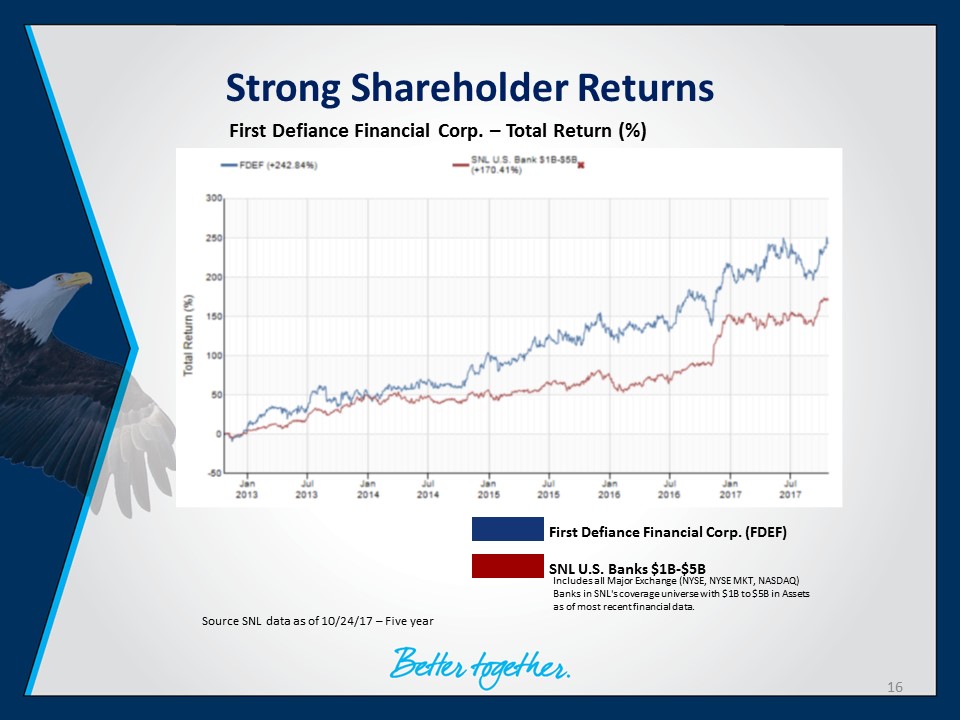
Strong Shareholder Returns Source SNL data as of 10/24/17 – Five year First Defiance Financial Corp. – Total Return (%) First Defiance Financial Corp. (FDEF) SNL U.S. Banks $1B - $5B Includes all Major Exchange (NYSE, NYSE MKT, NASDAQ) Banks in SNL's coverage universe with $1B to $5B in Assets as of most recent financial data. 16

Talent Development and Retention Mergers and Acquisitions Metro Market and Organic Growth The Client Experience Leveraging Technology for Efficiency and Growth 17

Financial Highlights 18
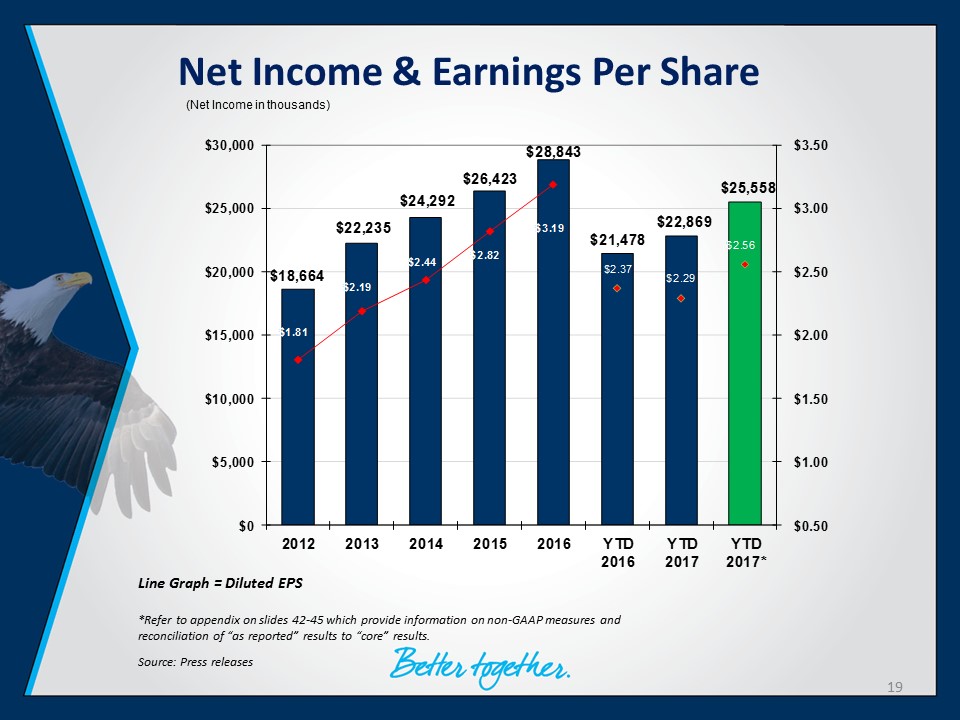
Net Income & Earnings Per Share Source : Press releases $18,664 $22,235 $24,292 $26,423 $28,843 $21,478 $22,869 $25,558 $1.81 $2.19 $2.44 $2.82 $3.19 $2.37 $2.29 $2.56 $0.50 $1.00 $1.50 $2.00 $2.50 $3.00 $3.50 $0 $5,000 $10,000 $15,000 $20,000 $25,000 $30,000 2012 2013 2014 2015 2016 YTD 2016 YTD 2017 YTD 2017* Line Graph = Diluted EPS * Refer to appendix on slides 42 - 45 which provide information on non - GAAP measures and reconciliation of “as reported” results to “core” results. (Net Income in thousands) 19
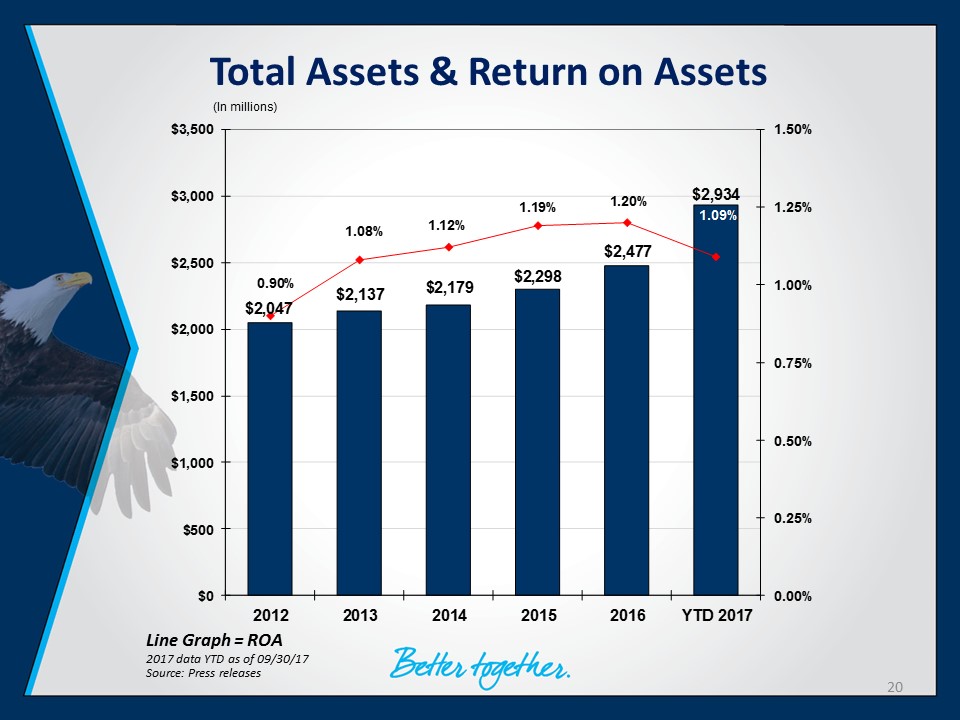
Total Assets & Return on Assets Source : Press releases 2017 data YTD as of 09/30/17 Line Graph = ROA $2,047 $2,137 $2,179 $2,298 $2,477 $2,934 0.90% 1.08% 1.12% 1.19% 1.20% 1.09% 0.00% 0.25% 0.50% 0.75% 1.00% 1.25% 1.50% $0 $500 $1,000 $1,500 $2,000 $2,500 $3,000 $3,500 2012 2013 2014 2015 2016 YTD 2017 (In millions) 20
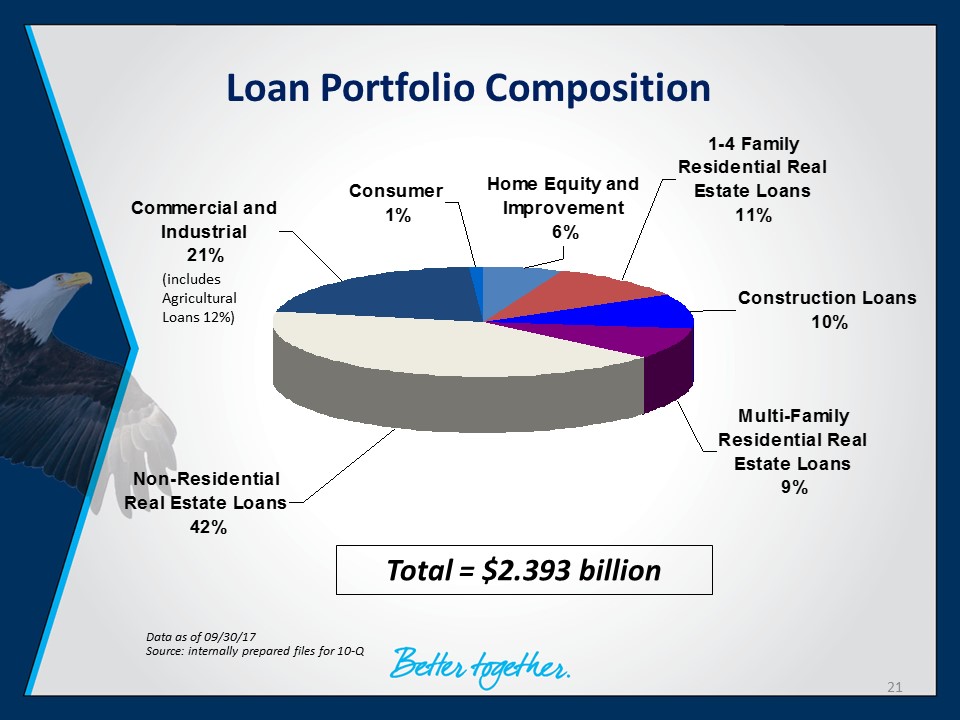
Commercial and Industrial 21% Non-Residential Real Estate Loans 42% Multi-Family Residential Real Estate Loans 9% Consumer 1% Construction Loans 10% 1-4 Family Residential Real Estate Loans 11% Home Equity and Improvement 6% Loan Portfolio Composition Source : internally prepared files for 10 - Q Data as of 09/30/17 Total = $2.393 billion 21 (includes Agricultural Loans 12%)
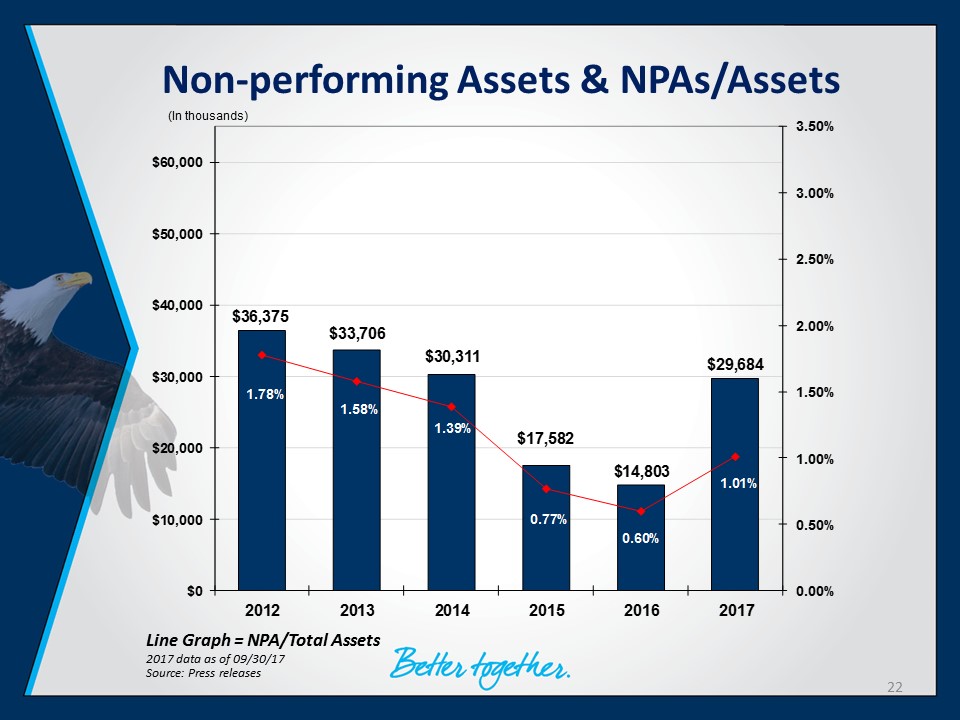
Non - performing Assets & NPAs/Assets Source : Press releases 2017 data as of 09/30/17 Line Graph = NPA/Total Assets $36,375 $33,706 $30,311 $17,582 $14,803 $29,684 1.78% 1.58% 1.39% 0.77% 0.60% 1.01% 0.00% 0.50% 1.00% 1.50% 2.00% 2.50% 3.00% 3.50% $0 $10,000 $20,000 $30,000 $40,000 $50,000 $60,000 2012 2013 2014 2015 2016 2017 (In thousands) 22
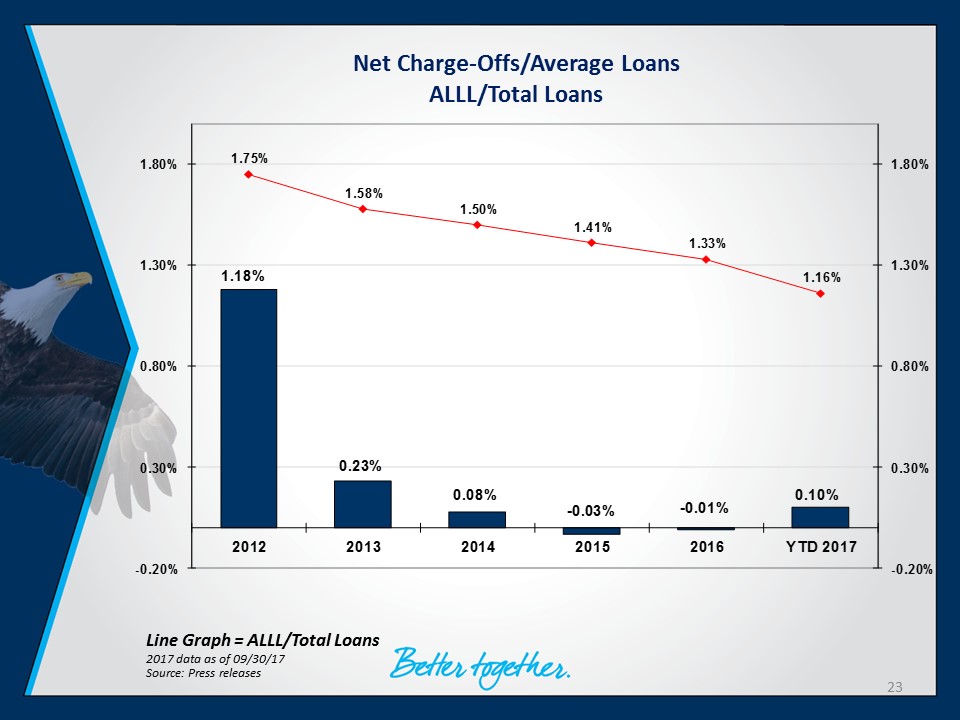
Net Charge - Offs/Average Loans ALLL/Total Loans Source : Press releases 2017 data as of 09/30/17 Line Graph = ALLL/Total Loans 1.18% 0.23% 0.08% - 0.03% - 0.01% 0.10% 1.75% 1.58% 1.50% 1.41% 1.33% 1.16% -0.20% 0.30% 0.80% 1.30% 1.80% -0.20% 0.30% 0.80% 1.30% 1.80% 2012 2013 2014 2015 2016 YTD 2017 23
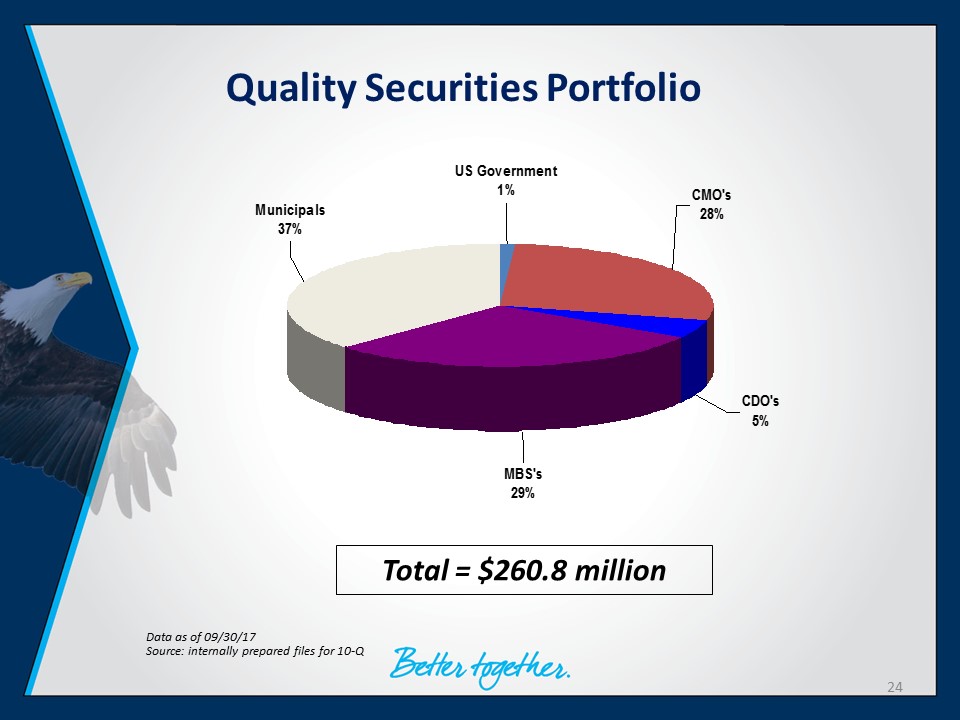
Quality Securities Portfolio Source : internally prepared files for 10 - Q Data as of 09/30/17 Total = $260.8 million US Government 1% CMO's 28% CDO's 5% MBS's 29% Municipals 37% 24
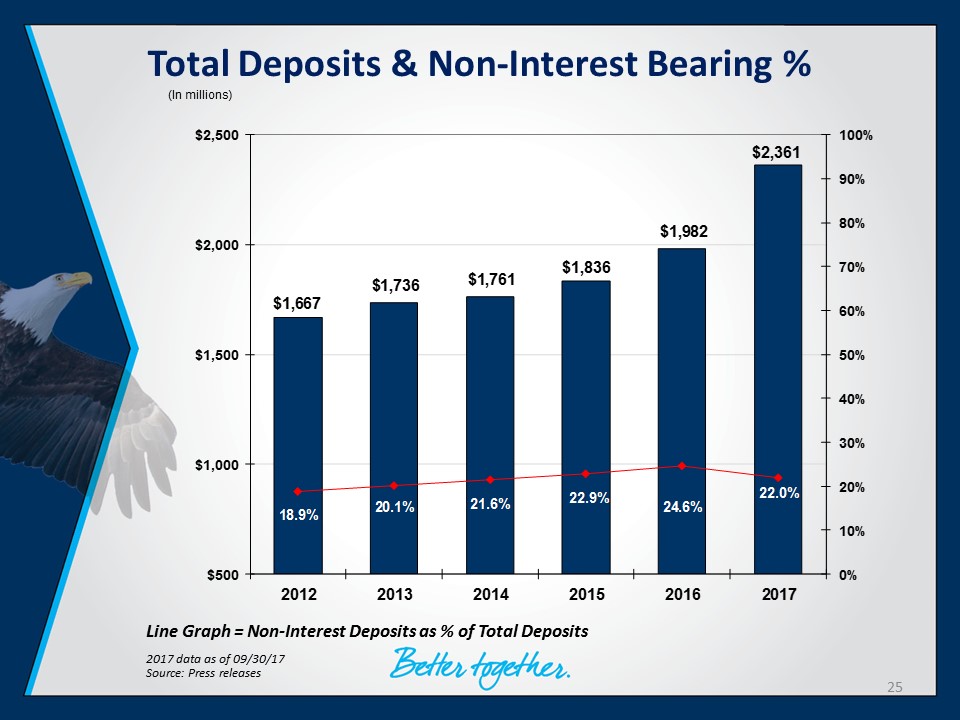
Total Deposits & Non - Interest Bearing % Source : Press releases 2017 data as of 09/30/17 Line Graph = Non - Interest Deposits as % of Total Deposits $1,667 $1,736 $1,761 $1,836 $1,982 $2,361 20.1% 22.0% 18.9% 21.6% 22.9% 24.6% 0% 10% 20% 30% 40% 50% 60% 70% 80% 90% 100% $500 $1,000 $1,500 $2,000 $2,500 2012 2013 2014 2015 2016 2017 (In millions) 25
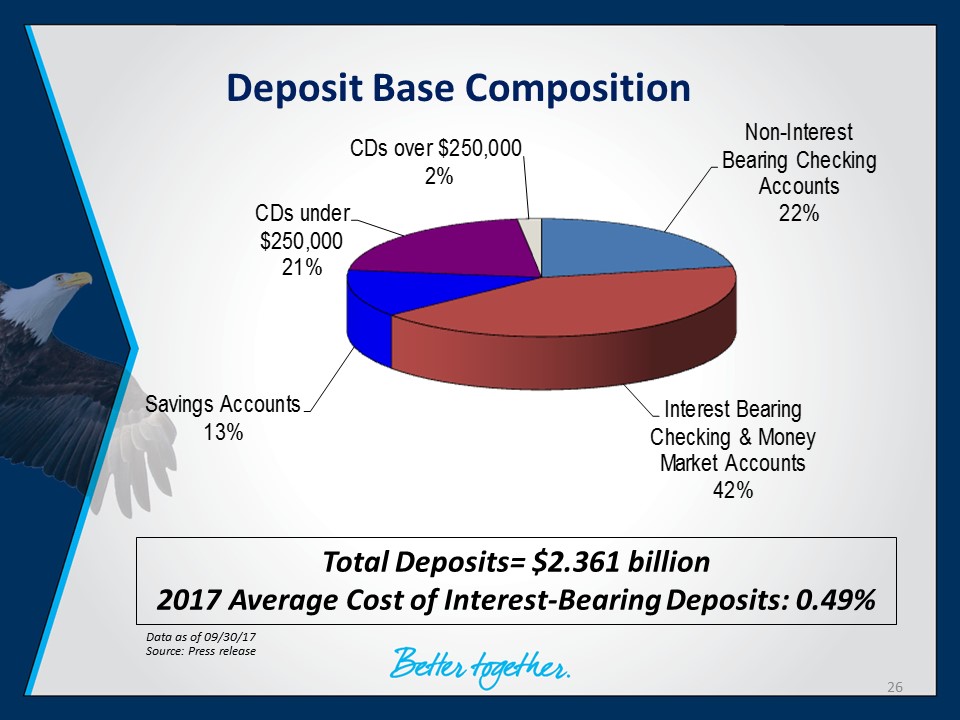
Non - Interest Bearing Checking Accounts 22% Interest Bearing Checking & Money Market Accounts 42% Savings Accounts 13% CDs under $250,000 21% CDs over $250,000 2% Deposit Base Composition Source : Press release Data as of 09/30/17 Total Deposits= $2.361 billion 2017 Average Cost of Interest - Bearing Deposits: 0.49% 26
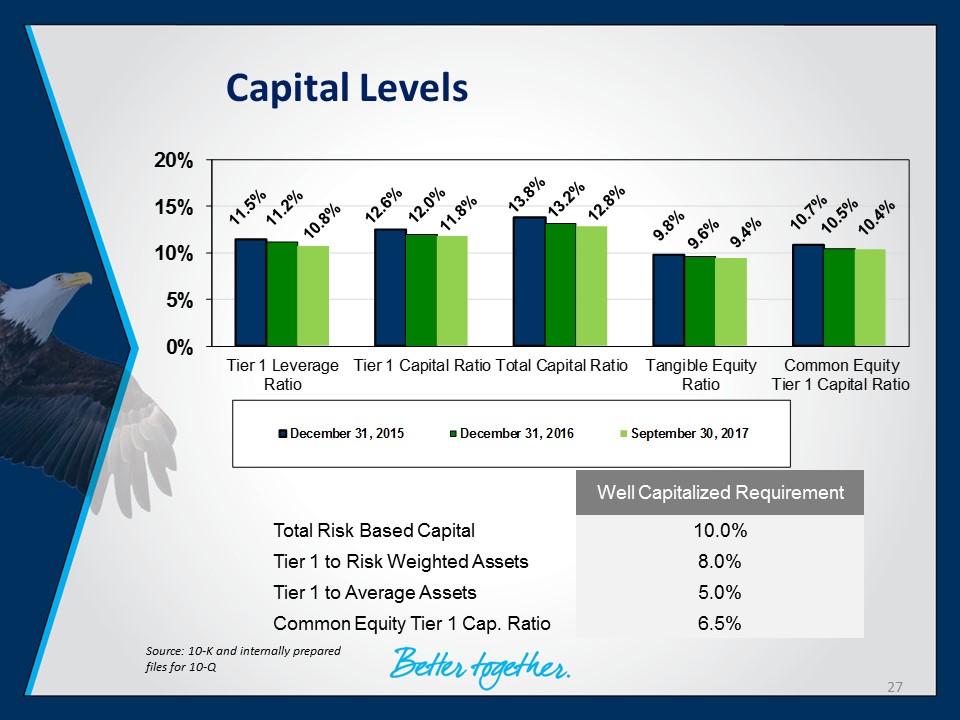
Capital Levels Source : 10 - K and internally prepared files for 10 - Q 0% 5% 10% 15% 20% Tier 1 Leverage Ratio Tier 1 Capital Ratio Total Capital Ratio Tangible Equity Ratio Common Equity Tier 1 Capital Ratio December 31, 2015 December 31, 2016 September 30, 2017 Well Capitalized Requirement Total Risk Based Capital 10.0% Tier 1 to Risk Weighted Assets 8.0% Tier 1 to Average Assets 5.0% Common Equity Tier 1 Cap. Ratio 6.5% 27
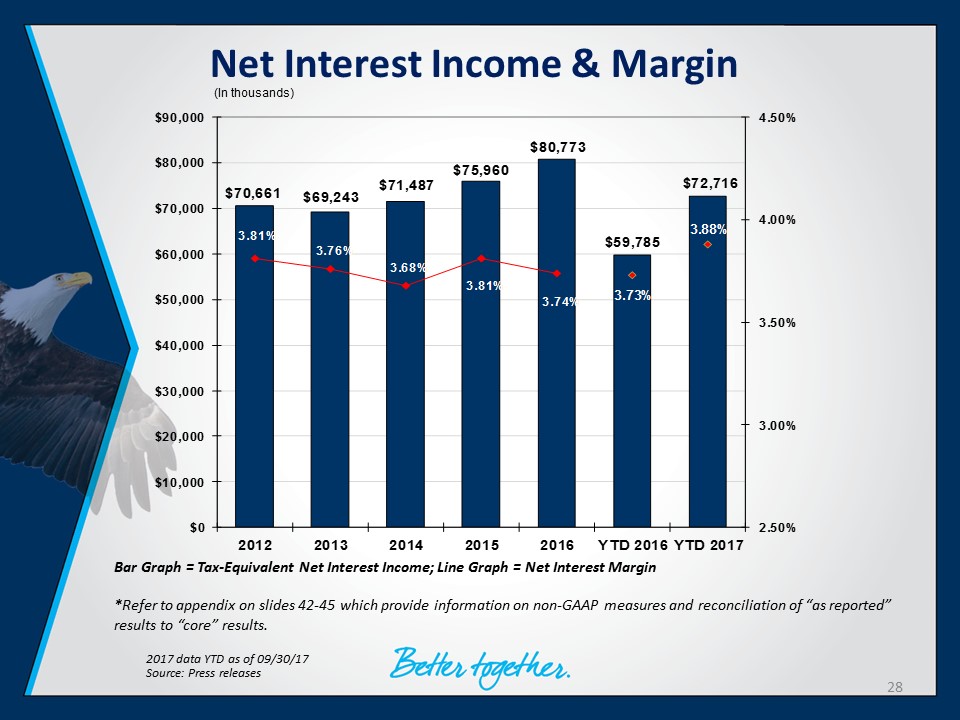
Net Interest Income & Margin Source : Press releases 2017 data YTD as of 09/30/17 Bar Graph = Tax - Equivalent Net Interest Income; Line Graph = Net Interest Margin * Refer to appendix on slides 42 - 45 which provide information on non - GAAP measures and reconciliation of “as reported” results to “core” results. $70,661 $69,243 $71,487 $75,960 $80,773 $59,785 $72,716 3.81% 3.76% 3.68% 3.81% 3.74% 3.73% 3.88% 2.50% 3.00% 3.50% 4.00% 4.50% $0 $10,000 $20,000 $30,000 $40,000 $50,000 $60,000 $70,000 $80,000 $90,000 2012 2013 2014 2015 2016 YTD 2016 YTD 2017 (In thousands) 28
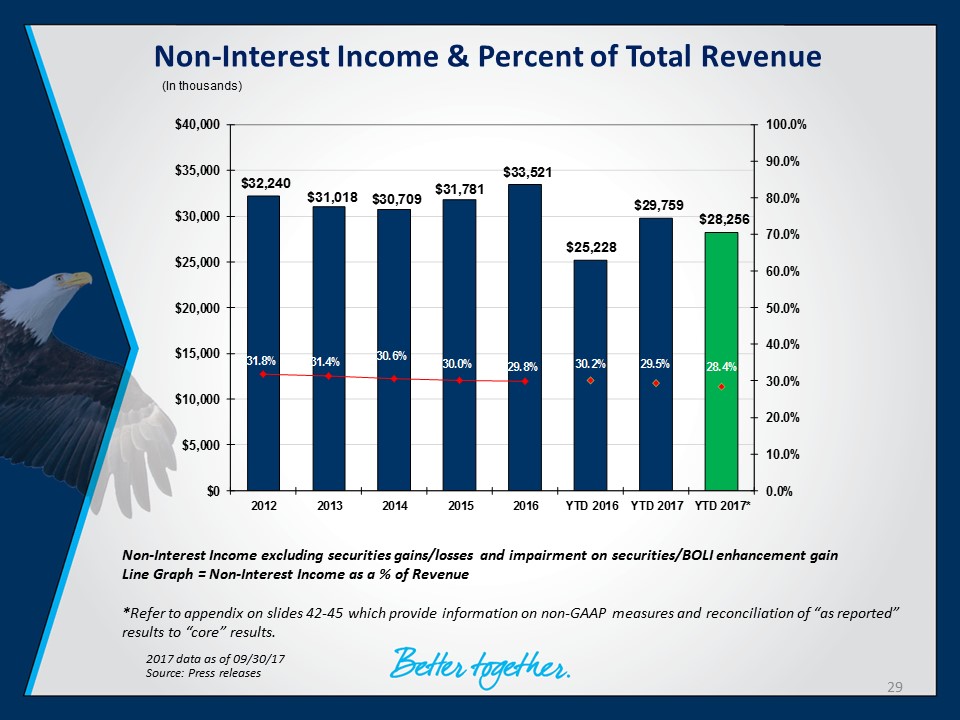
Non - Interest Income & Percent of Total Revenue Source : Press releases 2017 data as of 09/30/17 Non - Interest Income excluding securities gains/losses and impairment on securities/BOLI enhancement gain Line Graph = Non - Interest Income as a % of Revenue * Refer to appendix on slides 42 - 45 which provide information on non - GAAP measures and reconciliation of “as reported” results to “core” results. $32,240 $31,018 $30,709 $31,781 $33,521 $25,228 $29,759 $28,256 31.8% 31.4% 30.6% 30.0% 29.8% 30.2% 29.5% 28.4% 0.0% 10.0% 20.0% 30.0% 40.0% 50.0% 60.0% 70.0% 80.0% 90.0% 100.0% $0 $5,000 $10,000 $15,000 $20,000 $25,000 $30,000 $35,000 $40,000 2012 2013 2014 2015 2016 YTD 2016 YTD 2017 YTD 2017* (In thousands) 29

Non - Interest Expense & Efficiency Ratio Source : Press releases 2017 data as of 09/30/17 Line Graph = Efficiency Ratio * Refer to appendix on slides 42 - 45 which provide information on non - GAAP measures and reconciliation of “as reported” results to “core” results. $65,780 $65,052 $66,758 $67,889 $71,093 $52,913 $64,211 $60,207 63.9% 64.8% 65.3% 63.0% 62.2% 62.2% 62.7 % 59.6% 10% 20% 30% 40% 50% 60% 70% 80% 90% $0 $10,000 $20,000 $30,000 $40,000 $50,000 $60,000 $70,000 2012 2013 2014 2015 2016 YTD 2016 YTD 2017 YTD 2017* (In thousands) 30
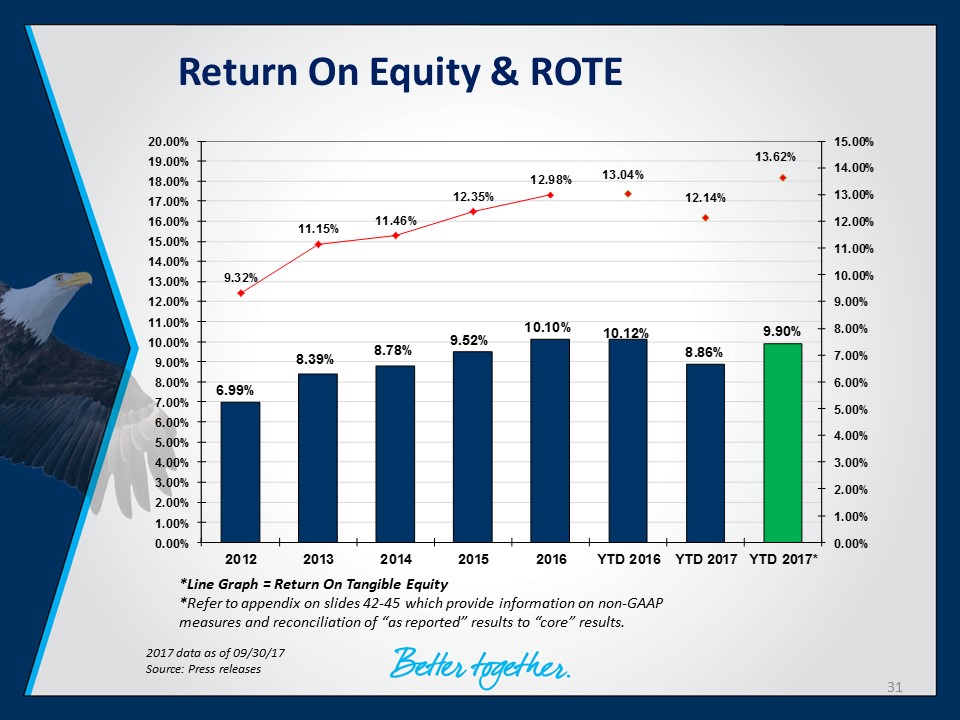
Return On Equity & ROTE Source : Press releases 2017 data as of 09/30/17 * Line Graph = Return On Tangible Equity * Refer to appendix on slides 42 - 45 which provide information on non - GAAP measures and reconciliation of “as reported” results to “core” results. 6.99% 8.39% 8.78% 9.52% 10.10% 10.12% 8.86% 9.90% 9.32% 11.15% 11.46% 12.35% 12.98% 13.04% 12.14% 13.62% 0.00% 1.00% 2.00% 3.00% 4.00% 5.00% 6.00% 7.00% 8.00% 9.00% 10.00% 11.00% 12.00% 13.00% 14.00% 15.00% 0.00% 1.00% 2.00% 3.00% 4.00% 5.00% 6.00% 7.00% 8.00% 9.00% 10.00% 11.00% 12.00% 13.00% 14.00% 15.00% 16.00% 17.00% 18.00% 19.00% 20.00% 2012 2013 2014 2015 2016 YTD 2016 YTD 2017 YTD 2017* 31
Recent Mergers 32
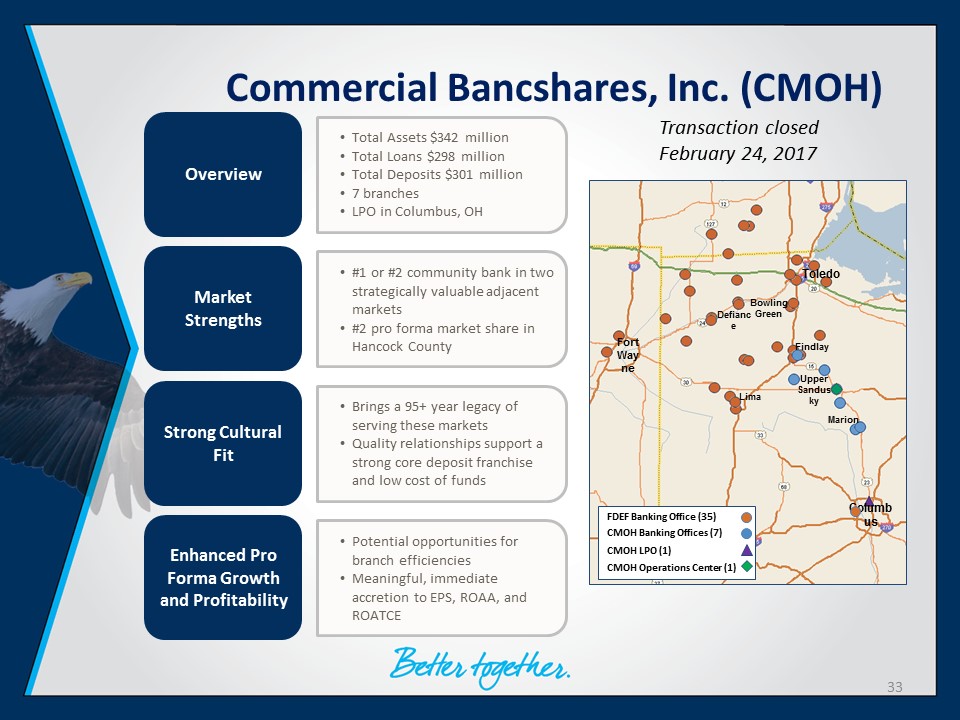
Commercial Bancshares, Inc. (CMOH) Overview Market Strengths Enhanced Pro Forma Growth and Profitability • Total Assets $342 million • Total Loans $298 million • Total Deposits $301 million • 7 branches • LPO in Columbus, OH • Potential opportunities for branch efficiencies • Meaningful, immediate accretion to EPS, ROAA, and ROATCE • #1 or #2 community bank in two strategically valuable adjacent markets • #2 pro forma market share in Hancock County Strong Cultural Fit • Brings a 95+ year legacy of serving these markets • Quality relationships support a strong core deposit franchise and low cost of funds Columb us FDEF Banking Office (35) CMOH Banking Offices ( 7 ) CMOH LPO (1) CMOH Operations Center (1) Fort Way ne Toledo Findlay Lima Defianc e Marion Upper Sandus ky Bowling Green 33 Transaction closed February 24, 2017
34 Corporate One Benefits Transaction closed effective April 1, 2017 • Founded in 1996 and headquartered in Fostoria, OH with two satellite locations • Annual Commission Income of approximately $2.8 million • Specializes in Employee B enefit products to large accounts (>100 lives) • Tailored product offerings to client needs including online enrollment and consulting projects

Shareholder Value 35
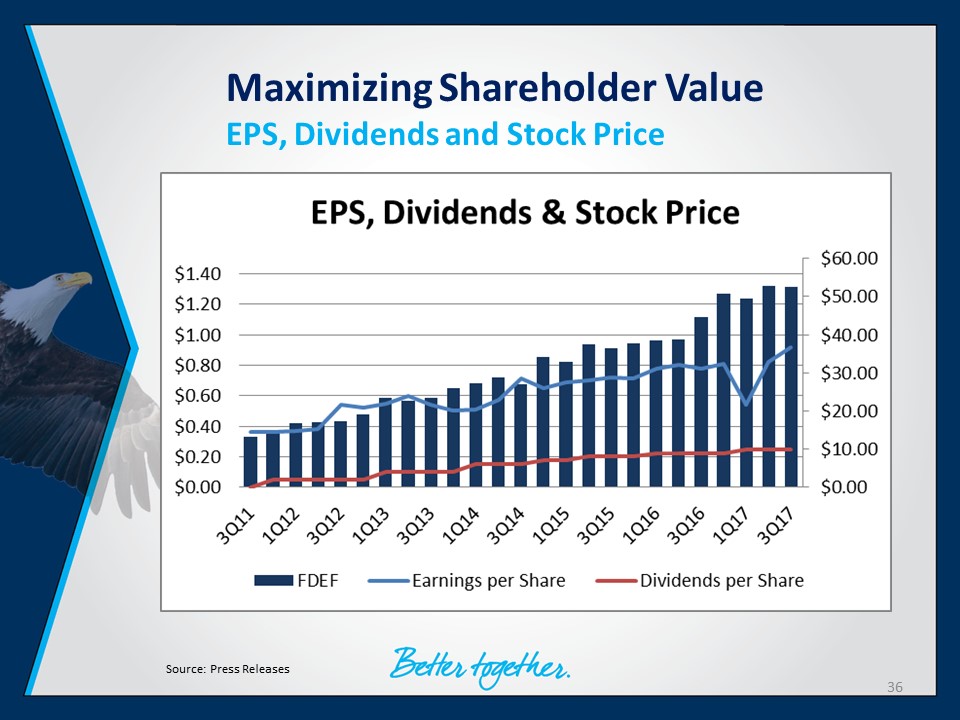
Maximizing Shareholder Value EPS, Dividends and Stock Price Source: Press Releases 36
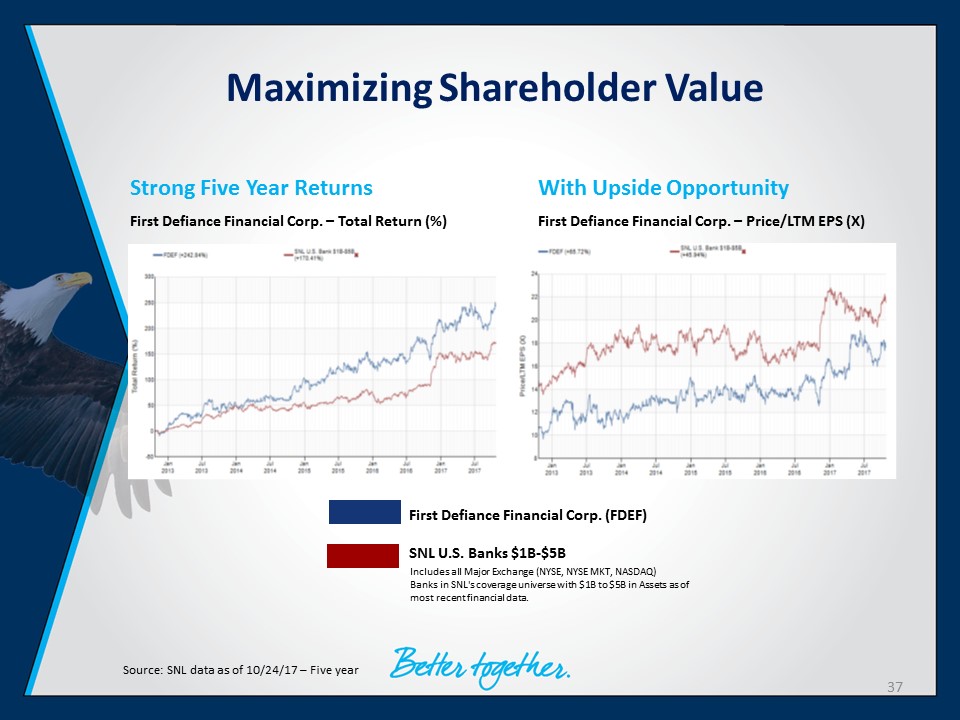
Maximizing Shareholder Value Source: SNL data as of 10/24/17 – Five year Strong Five Year Returns First Defiance Financial Corp. – Total Return (%) With Upside Opportunity First Defiance Financial Corp. – Price/LTM EPS (X) First Defiance Financial Corp. (FDEF) SNL U.S. Banks $1B - $5B Includes all Major Exchange (NYSE, NYSE MKT, NASDAQ) Banks in SNL's coverage universe with $1B to $5B in Assets as of most recent financial data. 37
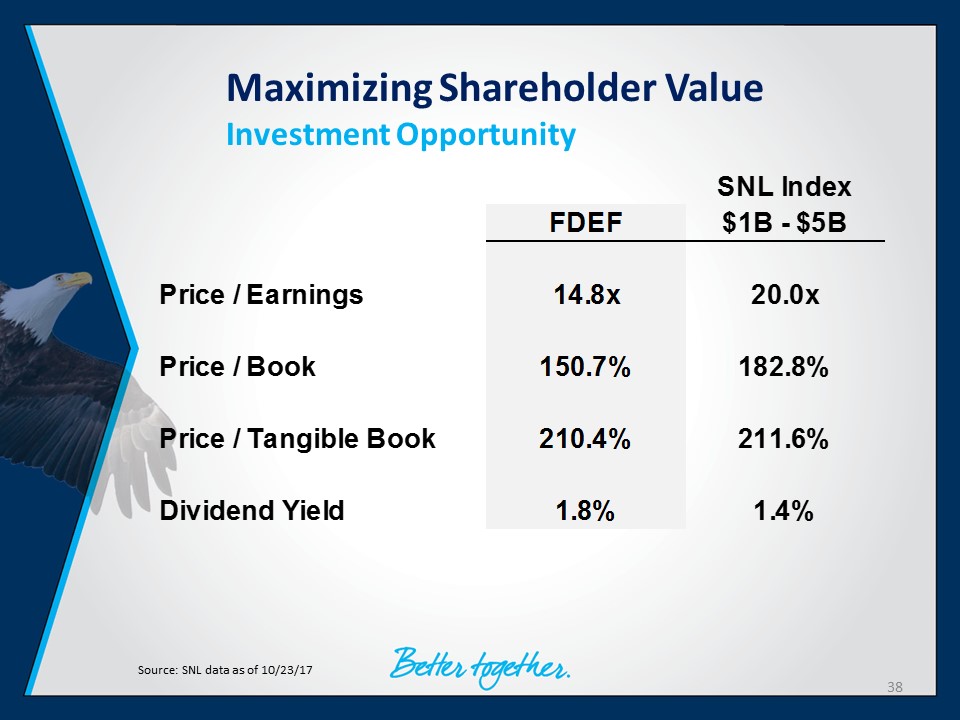
Maximizing Shareholder Value Investment Opportunity Source: SNL data as of 10/23/17 38 SNL Index FDEF $1B - $5B Price / Earnings 14.8x 20.0x Price / Book 150.7% 182.8% Price / Tangible Book 210.4% 211.6% Dividend Yield 1.8% 1.4%
Summary • Disciplined management team with proven track record • Reputation of focusing on fundamentals • Strong capital levels • Balance sheet strength – attractive core deposit base • Balanced loan portfolio with a disciplined approach to lending • Well - positioned to grow our balance sheet and geographic footprint, enhancing long - term shareholder value 39

Thank you. Donald P. Hileman | President & CEO 419 - 785 - 2210 | dhileman@first - fed.com Kevin T. Thompson | Executive Vice President & CFO 419 - 783 - 1098 | kthompson@first - fed.com 40
Appendix 41
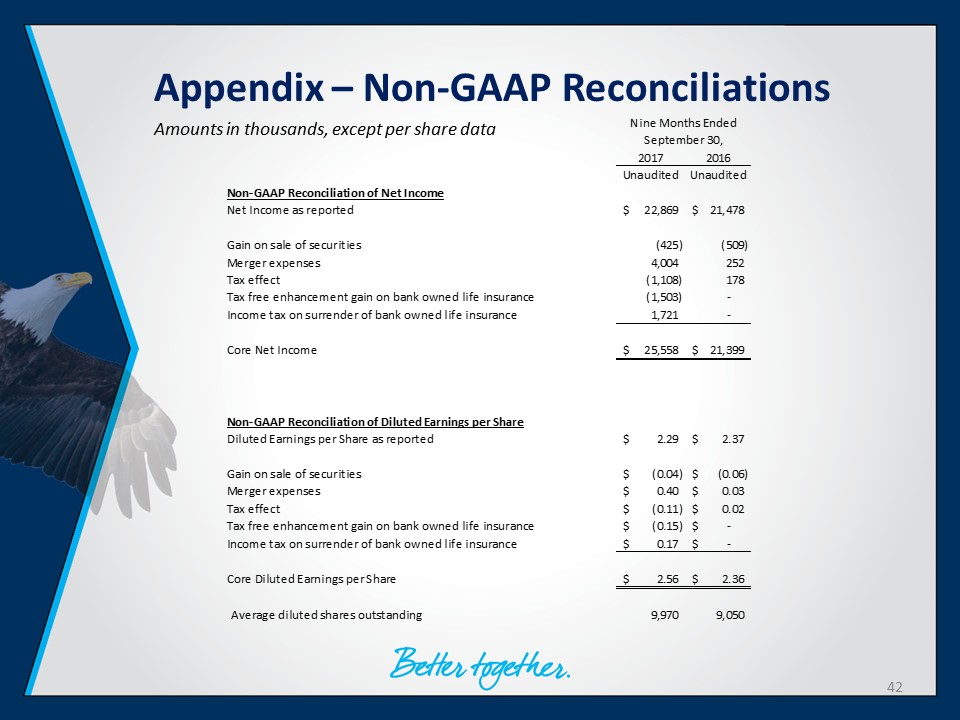
Appendix – Non - GAAP Reconciliations Amounts in thousands, except per share data 42 2017 2016 Unaudited Unaudited Non-GAAP Reconciliation of Net Income Net Income as reported 22,869$ 21,478$ Gain on sale of securities (425) (509) Merger expenses 4,004 252 Tax effect (1,108) 178 Tax free enhancement gain on bank owned life insurance (1,503) - Income tax on surrender of bank owned life insurance 1,721 - Core Net Income 25,558$ 21,399$ Non-GAAP Reconciliation of Diluted Earnings per Share Diluted Earnings per Share as reported 2.29$ 2.37$ Gain on sale of securities (0.04)$ (0.06)$ Merger expenses 0.40$ 0.03$ Tax effect (0.11)$ 0.02$ Tax free enhancement gain on bank owned life insurance (0.15)$ -$ Income tax on surrender of bank owned life insurance 0.17$ -$ Core Diluted Earnings per Share 2.56$ 2.36$ Average diluted shares outstanding 9,970 9,050 Nine Months Ended September 30,
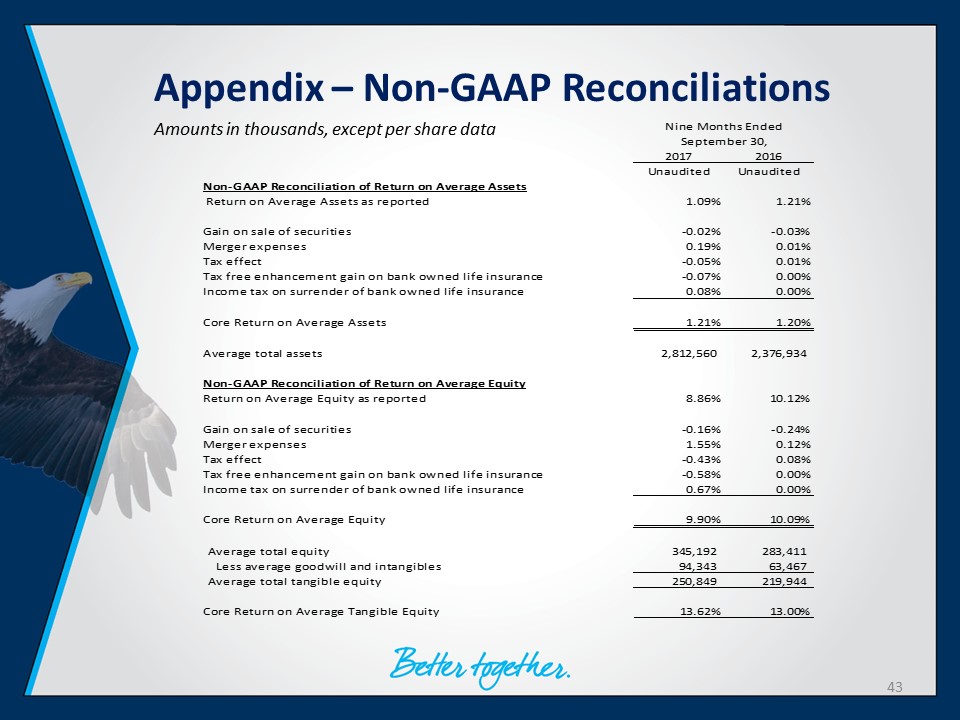
Appendix – Non - GAAP Reconciliations Amounts in thousands, except per share data 43 2017 2016 Unaudited Unaudited Non-GAAP Reconciliation of Return on Average Assets Return on Average Assets as reported 1.09% 1.21% Gain on sale of securities -0.02% -0.03% Merger expenses 0.19% 0.01% Tax effect -0.05% 0.01% Tax free enhancement gain on bank owned life insurance -0.07% 0.00% Income tax on surrender of bank owned life insurance 0.08% 0.00% Core Return on Average Assets 1.21% 1.20% Average total assets 2,812,560 2,376,934 Non-GAAP Reconciliation of Return on Average Equity Return on Average Equity as reported 8.86% 10.12% Gain on sale of securities -0.16% -0.24% Merger expenses 1.55% 0.12% Tax effect -0.43% 0.08% Tax free enhancement gain on bank owned life insurance -0.58% 0.00% Income tax on surrender of bank owned life insurance 0.67% 0.00% Core Return on Average Equity 9.90% 10.09% Average total equity 345,192 283,411 Less average goodwill and intangibles 94,343 63,467 Average total tangible equity 250,849 219,944 Core Return on Average Tangible Equity 13.62% 13.00% Nine Months Ended September 30,
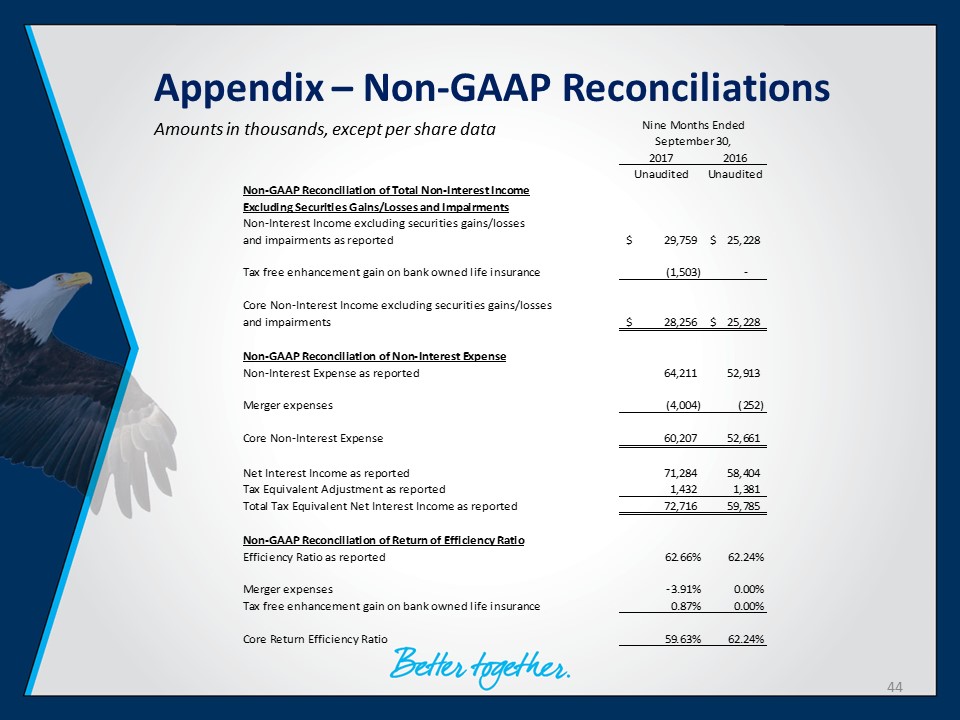
Appendix – Non - GAAP Reconciliations Amounts in thousands, except per share data 44 2017 2016 Unaudited Unaudited Non-GAAP Reconciliation of Total Non-Interest Income Excluding Securities Gains/Losses and Impairments Non-Interest Income excluding securities gains/losses and impairments as reported 29,759$ 25,228$ Tax free enhancement gain on bank owned life insurance (1,503) - Core Non-Interest Income excluding securities gains/losses and impairments 28,256$ 25,228$ Non-GAAP Reconciliation of Non-Interest Expense Non-Interest Expense as reported 64,211 52,913 Merger expenses (4,004) (252) Core Non-Interest Expense 60,207 52,661 Net Interest Income as reported 71,284 58,404 Tax Equivalent Adjustment as reported 1,432 1,381 Total Tax Equivalent Net Interest Income as reported 72,716 59,785 Non-GAAP Reconciliation of Return of Efficiency Ratio Efficiency Ratio as reported 62.66% 62.24% Merger expenses -3.91% 0.00% Tax free enhancement gain on bank owned life insurance 0.87% 0.00% Core Return Efficiency Ratio 59.63% 62.24% Nine Months Ended September 30,
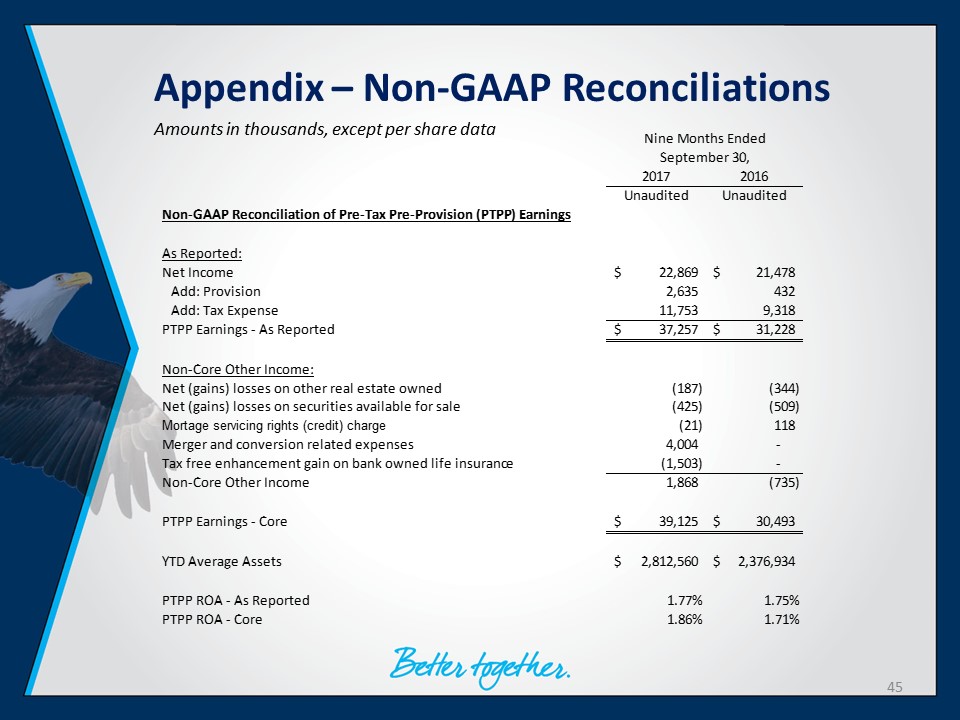
Appendix – Non - GAAP Reconciliations Amounts in thousands, except per share data 45 2017 2016 Unaudited Unaudited Non-GAAP Reconciliation of Pre-Tax Pre-Provision (PTPP) Earnings As Reported: Net Income 22,869$ 21,478$ Add: Provision 2,635 432 Add: Tax Expense 11,753 9,318 PTPP Earnings - As Reported 37,257$ 31,228$ Non-Core Other Income: Net (gains) losses on other real estate owned (187) (344) Net (gains) losses on securities available for sale (425) (509) Mortage servicing rights (credit) charge (21) 118 Merger and conversion related expenses 4,004 - Tax free enhancement gain on bank owned life insurance (1,503) - Non-Core Other Income 1,868 (735) PTPP Earnings - Core 39,125$ 30,493$ YTD Average Assets 2,812,560$ 2,376,934$ PTPP ROA - As Reported 1.77% 1.75% PTPP ROA - Core 1.86% 1.71% Nine Months Ended September 30,