EXHIBIT 99.2
The following is a summary of selected information contained in our annual, quarterly and current reports, proxy statements, and other information that has been filed with the U.S. Securities and Exchange Commission (the “SEC”), including our Annual Report on Form 10-K for the fiscal year ended December 31, 2014, our Quarterly Report on Form 10-Q for the periods ended March 31, 2015, June 30, 2015 and September 30, 2015 and our consolidated financial statements and the related notes thereto. It does not contain all of the information that you should consider before deciding to purchase shares of our common stock. You should read this entire Business Summary carefully, as well as the section entitled “Risk Factors,” which has been filed as Exhibit 99.1 to this Current Report on Form 8-K, as well as the other information included or incorporated by reference herein, before making an investment decision to purchase our common stock. Unless indicated otherwise, or the context otherwise requires, references in this Business Summary to “Banner,” “the Company,” “we,” “us,” and “our” are to Banner Corporation together with its subsidiaries. Unless indicated otherwise, or the context otherwise requires, references in this Business Summary to the “common stock” of Banner are to Banner Corporation’s voting common stock. References in this Business Summary to items “at September 30, 2015 on a pro forma basis” represent unaudited pro forma combined condensed consolidated financial information for Banner and Starbuck as of September 30, 2015, giving effect to our acquisition of Starbuck Bancshares, Inc. that was consummated as of the close of business on October 1, 2015. Cross references contained in the Business Summary section reference our registration statement on Form S-1 filed with the SEC on December 11, 2015.
Our Company
We are a bank holding company incorporated in the State of Washington. We are primarily engaged in the business of planning, directing and coordinating the business activities of our wholly-owned subsidiaries, Banner Bank and Islanders Bank. Banner Bank, founded in 1890, is a Washington-chartered commercial bank that conducts business from its main office in Walla Walla, Washington and, as of September 30, 2015, its 102 branch offices and nine loan production offices located in Washington, Oregon and Idaho. Islanders Bank is also a Washington-chartered commercial bank that conducts business from three locations in San Juan County, Washington. Banner Corporation is subject to regulation by the Board of Governors of the Federal Reserve System (the “Federal Reserve Board”). Banner Bank and Islanders Bank are subject to regulation by the Washington State Department of Financial Institutions, Division of Banks (the “DFI”) and the Federal Deposit Insurance Corporation (the “FDIC”). In March 2015, we acquired Siuslaw Financial Group (“Siuslaw”), the holding company of Siuslaw Bank, an Oregon state chartered commercial bank headquartered in Florence, Oregon, with ten branches serving multiple locations in Lane County including Eugene, Oregon. By the terms of that acquisition, Siuslaw Bank merged with and into Banner Bank. As of September 30, 2015, we had total consolidated assets of $5.3 billion, total loans of $4.4 billion, total deposits of $4.4 billion and total stockholders’ equity of $671 million.
As of the close of business on October 1, 2015, we completed our acquisition (the “Merger”) of Starbuck Bancshares, Inc. (“Starbuck”) and its subsidiary, AmericanWest Bank (“AmericanWest”), a Washington state chartered commercial bank headquartered in Spokane, Washington with 98 branches serving markets in Washington, Oregon, Idaho, California and Utah. Previously, in February 2015, Starbuck completed its acquisition of Greater Sacramento Bancorp (“GSB”), through which GSB merged with and into Starbuck and Bank of Sacramento, GSB’s wholly-owned bank subsidiary, merged with and into AmericanWest. On the Merger closing date, Starbuck merged with and into a wholly-owned subsidiary of Banner and AmericanWest merged with and into Banner Bank. As a result of these transactions, Banner Bank and Islanders Bank continue to be our only bank subsidiaries (collectively, the “Banks”). Pursuant to the Merger, the equity holders of SKBHC Holdings LLC (“SKBHC”), the parent holding company of Starbuck, received an aggregate of $130.0 million in cash and 13.23 million shares of Banner common stock and non-voting common stock. At September 30, 2015 on a pro forma basis, we had approximately $9.9 billion in total consolidated assets, $7.4 billion in total loans, $8.0 billion in total deposits, $1.3 billion in total stockholders’ equity and 203 branches.
Since becoming a public company in 1995, we have invested significantly in expanding our branch and distribution systems with a primary emphasis on strengthening our market presence in the Pacific Northwest United States. Those markets traditionally have included the four largest metropolitan areas in the Pacific Northwest: the Puget Sound region of Washington, the greater Portland market of Oregon, Boise in Idaho and the
1
Spokane market of Washington. In addition, our markets include our historical base in the agricultural communities in the Columbia Basin region of Washington and Oregon. The acquisition of AmericanWest strengthened our market presence in the Northwest and expanded our operations into what we believe are attractive growth markets in California and Utah. These new markets include the greater San Diego and Sacramento, California and Salt Lake City, Utah metropolitan areas. Our aggressive franchise expansion strategy since becoming a public company has included ten acquisitions, including the Merger, as well as the opening or acquisition of 35 branches.
Our Business
Banner Bank is a regional bank that offers a wide variety of commercial banking services and financial products to individuals, businesses and public sector entities in its primary market areas. Islanders Bank is a community bank that offers similar banking services to individuals, businesses and public entities located in the San Juan Islands. The Banks’ primary business is that of traditional banking institutions, accepting deposits and originating loans in locations surrounding their offices in portions of Washington, Oregon, Idaho, California and Utah. Banner Bank is also an active participant in the secondary loan market, engaging in mortgage banking operations largely through the origination and sale of one- to four-family residential and multifamily real estate loans. Lending activities include commercial business and commercial and multifamily real estate loans, agriculture business loans, construction and land development loans, one- to four-family residential loans and consumer loans.
Lending Activities
All of our lending activities are conducted through Banner Bank, its subsidiary, Community Financial Corporation, a residential construction lender located in Portland, Oregon, and Islanders Bank. We offer a wide range of loan products to meet the demands of our customers and our loan portfolio is diversified by product type, borrower and geographic location within our market area. Our lending activities are primarily focused on the origination of real estate and commercial loans. We originate loans for our own loan portfolio and for sale in the secondary market. Management’s strategy has been to maintain a well-diversified portfolio with a significant percentage of assets in the loan portfolio having more frequent interest rate repricing terms or shorter maturities than traditional long-term fixed-rate mortgage loans. As part of this effort, we have developed a variety of floating or adjustable interest rate products that correlate more closely with our cost of interest bearing funds, particularly loans for commercial business and real estate, agricultural business, and construction and development purposes. However, in response to customer demand, we continue to originate fixed-rate loans, including fixed interest rate mortgage loans with terms of up to 30 years. The relative amount of fixed-rate loans and adjustable-rate loans that can be originated at any time is largely determined by the demand for each in a competitive environment.
Commercial Business Lending: We are active in small- to medium-sized business lending and are engaged in agricultural lending primarily by providing crop production loans. Our commercial bankers are focused on local markets and devote significant effort to developing customer relationships and providing these types of borrowers with a full array of products and services delivered in a thorough and responsive manner, including related treasury management and deposit services, which defines our super community bank model that we consider a competitive strength for our company. While also strengthening our commitment to small business lending, in recent years we have added experienced officers and staff focused on corporate lending opportunities for middle market borrowers with credit needs generally between $3 million and $15 million. In addition to providing earning assets, commercial business lending has helped us increase our deposit base. In recent years, our commercial business lending has included participation in certain national syndicated loans, including shared national credits. We also originate business loans with smaller balances principally through our retail branch network, using our “Quick Step” business loan program, which is closely aligned with our consumer lending operations and relies on centralized underwriting procedures. At December 31, 2014, commercial business loans
2
were $724 million, or 19% of our total loan portfolio. At September 30, 2015 on a pro forma basis, commercial business loans were $1.20 billion, or 16% of our total loan portfolio.
Agricultural Lending: Agriculture is a major industry in many parts of our service areas. We make agricultural loans to borrowers with a strong capital base, sufficient management depth, proven ability to operate through agricultural cycles, reliable cash flows and adequate financial reporting. Payments on agricultural loans depend, to a large degree, on the results of operations of the related farm entity. The repayment is also subject to other economic and weather conditions as well as market prices for agricultural products, which can be highly volatile. At December 31, 2014, agricultural loans were $238 million, or 6% of our total loan portfolio. At September 30, 2015 on a pro forma basis, agricultural loans were $388 million, or 5% of our total loan portfolio.
Commercial and Multifamily Real Estate Lending: We originate loans secured by commercial and multifamily real estate including, as noted below, loans for construction of multifamily and commercial real estate projects. Commercial real estate loans are made for both owner-occupied and investor properties. Commercial and multifamily real estate lending affords us an opportunity to receive interest at rates higher than those generally available from one- to four-family residential lending. However, loans secured by commercial and multifamily properties are larger, more difficult to evaluate and monitor and, therefore, potentially riskier than one- to four-family residential mortgage loans. However, our underwriting guidelines for commercial and multifamily real estate loans require an appraisal from a qualified independent appraiser and an economic analysis of each property with respect to the projected annual revenue and expenses, debt service coverage and fair value to determine the maximum loan amount. In the approval process, we assess the borrowers’ willingness and ability to manage the property and repay the loan and the adequacy of the collateral in relation to the loan amount. Following our acquisition of AmericanWest, we now also originate and sell multifamily real estate loans on a servicing-released basis through a dedicated team of loan officers and underwriters.
We originate both fixed- and adjustable-rate commercial and multifamily real estate loans, generally with intermediate terms of five to ten years. The interest rate for a significant portion of our commercial and multifamily real estate loans are linked to various FHLB advance rates, certain prime rates or other market rate indices. Our commercial real estate portfolio consists of loans on a variety of property types with no large concentrations by property type, location or borrower. At December 31, 2014, commercial and multifamily real estate loans were $1.57 billion, or 41% of our total loan portfolio, with multifamily real estate loans constituting $168 million of that portfolio. At September 30, 2015 on a pro forma basis, commercial and multifamily real estate loans were $3.63 billion or 50% of our total loan portfolio, with multifamily real estate loans constituting $631 million of that portfolio.
Construction and Land Lending: Historically, we have invested a significant portion of our loan portfolio in residential construction and land loans to professional home builders and developers. However, we have reduced the significance of these loans from approximately one third of our loan portfolio in 2009 to approximately 8% of our loan portfolio as of September 30, 2015 on a pro forma basis. We regularly monitor our construction and land loan portfolios and the economic conditions and housing inventory in each of our markets and increase or decrease this type of lending as we observe changes in market conditions. To a lesser extent, we also originate construction loans for commercial and multifamily real estate. Although well-diversified with respect to sub-markets, price ranges and borrowers, our construction, land and land development loans have historically been significantly concentrated in the greater Puget Sound region of Washington State and the Portland, Oregon market area. As a result of the Merger and our expansion into the greater San Diego and Sacramento, California and Salt Lake City, Utah metropolitan areas, we have the opportunity to further diversify our loan portfolio. At December 31, 2014, construction and land loans were $411 million, or 11% of our total loan portfolio. At September 30, 2015 on a pro forma basis, construction and land loans were $558 million, or 8% of our total loan portfolio.
3
One- to Four-Family Residential Real Estate Lending: At both Banks, we originate loans secured by first mortgages on one- to four-family residences in the communities in the western United States where we have offices. Through our mortgage banking activities, we sell residential loans on either a servicing-retained or servicing-released basis. In recent years, we have generally sold a significant portion of our conventional residential mortgage originations and nearly all of our government insured loans in the secondary market. At December 31, 2014, one- to four-family residential real estate loans were $540 million, or 14% of our total loan portfolio. At September 30, 2015 on a pro forma basis, one- to four-family residential real estate loans were $939 million, or 13% of our total loan portfolio.
Consumer and Other Lending: We originate a variety of consumer loans, including home equity lines of credit, automobile, boat and recreational vehicle loans and loans secured by deposit accounts. While consumer lending has traditionally been a small part of our business, with loans made primarily to accommodate our existing customer base, it has received consistent emphasis in recent years. Part of this emphasis includes a Banner Bank-owned credit card program. Similar to other consumer loan programs, we focus this credit card program on our existing customer base to add to the depth of our customer relationships. In addition to earning balances, credit card accounts produce non-interest revenues through interchange fees and other activity-based revenues. Our underwriting of consumer loans is focused on the borrower’s credit history and ability to repay the debt as evidenced by documented sources of income. At December 31, 2014, consumer loans were $349 million, or 9% of our total loan portfolio. At September 30, 2015 on a pro forma basis, consumer loans were $639 million, or 9% of our total loan portfolio.
Loan Originations, Sales and Purchases
While we originate a variety of loans, our ability to originate each type of loan is dependent upon the relative customer demand and competition in each market we serve.
We sell many of our newly originated one- to four-family residential mortgage loans to secondary market purchasers as part of our interest rate risk and liquidity management strategy. Sales of loans generally are beneficial to us because these sales may generate income at the time of sale, provide funds for additional lending and other investments, increase liquidity or reduce interest rate risk. We sell loans on both a servicing-retained and a servicing-released basis. All loans are sold without recourse. The decision to hold or sell loans is based on asset liability management, strategies and market conditions.
We periodically purchase whole loans and loan participation interests or participate in syndicates originating new loans, including shared national credits, primarily during periods of reduced loan demand in our primary market area and at times to support our Community Reinvestment Act lending activities. Any such purchases or loan participations are made consistent with our underwriting standards; however, the loans may be located outside of our normal lending area.
Loan Servicing
We receive fees from a variety of institutional owners in return for performing the traditional services of collecting individual payments and managing portfolios of sold loans. Loan servicing includes processing payments, accounting for loan funds and collecting and paying real estate taxes, hazard insurance and other loan-related items such as private mortgage insurance. In addition to earning fee income, we retain certain amounts in escrow for the benefit of the lender for which we incur no interest expense but are able to invest the funds into earning assets.
Investment Activities
Under Washington state law, banks are permitted to invest in various types of marketable securities. Authorized securities include but are not limited to Treasury obligations, securities of various federal agencies (including government-sponsored enterprises (“GSEs”)), mortgage-backed and asset-backed securities, certain
4
certificates of deposit of insured banks and savings institutions, bankers’ acceptances, repurchase agreements, federal funds, commercial paper, corporate debt and equity securities and obligations of states and their political subdivisions. Our investment policies are designed to provide and maintain adequate liquidity and to generate favorable rates of return without incurring undue interest rate or credit risk. Our policies generally limit investments to U.S. government and agency (including GSEs) securities, municipal bonds, certificates of deposit, corporate debt obligations and mortgage-backed securities. Investment in mortgage-backed securities may include those issued or guaranteed by Freddie Mac, Fannie Mae, Government National Mortgage Association (“Ginnie Mae” or “GNMA”) and privately-issued mortgage-backed securities that have an AA credit rating or higher at the time of purchase, as well as collateralized mortgage obligations (“CMOs”). A high credit rating indicates only that the rating agency believes there is a low risk of loss or default. However all of our investment securities, including those that have high credit ratings, are subject to market risk in so far as a change in market rates of interest or other conditions may cause a change in an investment’s earnings performance and/or market value.
Deposit Activities and Other Sources of Funds
Retail deposits, wholesale borrowings, loan repayments and investment portfolio cash flows are our major sources of funds for lending and other investment purposes. Scheduled loan repayments are a relatively stable source of funds, while deposit inflows and outflows and loan prepayments are influenced by general economic, interest rate and money market conditions and may vary significantly. Borrowings may be used on a short-term basis to compensate for reductions in the availability of funds from other sources. Borrowings may also be used on a longer-term basis for general business purposes, including funding loans and investments.
We compete with other financial institutions and financial intermediaries in attracting deposits. There is strong competition for transaction balances and savings deposits from commercial banks, credit unions and non-bank corporations, such as securities brokerage companies, mutual funds and other diversified companies, some of which have nationwide networks of offices. Much of the focus of our branch expansion, relocations and renovation and advertising and marketing campaigns has been directed toward attracting additional deposit customer relationships and balances. In addition, our electronic banking activities, including debit card and automated teller machine (“ATM”) programs, on-line internet banking services and, most recently, customer remote deposit and mobile banking capabilities, are all directed at providing products and services that enhance customer relationships and result in growing deposit balances, as well as fee income. Growing core deposits (transaction and savings accounts) is a fundamental element of our business strategy.
Deposit Accounts: We generally attract deposits from within our primary market areas by offering a broad selection of deposit instruments, including demand checking accounts, interest-bearing checking accounts, money market deposit accounts, regular savings accounts, certificates of deposit, treasury management services and retirement savings plans. Deposit account terms vary according to the minimum balance required, the time periods the funds must remain on deposit and the interest rate, among other factors. In determining the terms of deposit accounts, we consider current market interest rates, profitability to us, matching deposit and loan products and customer preferences.
Borrowings: While deposits are the primary source of funds for our lending and investment activities and for general business purposes, we also use borrowings to supplement our supply of lendable funds, to meet deposit withdrawal requirements and to more efficiently leverage our capital position. The Federal Home Loan Bank of Des Moines (“FHLB-Des Moines”) serves as our primary borrowing source, although in recent years we have significantly reduced our use of FHLB advances. The FHLB-Des Moines provides credit for member financial institutions such as the Banks. As members, the Banks are required to own capital stock in the FHLB-Des Moines and are authorized to apply for advances on the security of that stock and certain of their mortgage loans and securities provided certain credit worthiness standards have been met. Limitations on the amount of advances are based on the financial condition of the member institution, the adequacy of collateral pledged to secure the credit, and FHLB stock ownership requirements. While not frequently utilized, we also maintain a
5
credit facility with the Federal Reserve Bank of San Francisco, which provides an additional source of liquidity. See “Description of Certain Indebtedness.”
Our Competitive Strengths
We attribute our success to the following competitive strengths, among others:
Premier West Coast Bank in Attractive Growth Markets:We operate 203 branches across key markets in Washington, Oregon, California, Idaho and Utah. We are ranked third by deposits in the Pacific Northwest among regional banks headquartered in Idaho, Washington and Oregon with total assets of more than $2 billion, and have recently expanded into attractive markets in California (San Diego and Sacramento) and Utah (Salt Lake City). Our footprint covers nine of the top twenty largest western cities by population. The core markets in which we operate are among the 14 fastest growing markets in the U.S. by population. The region in which we operate represents approximately 17% of the United States population but is projected by 2030 to drive approximately 22% of the gross domestic product growth according to Moody’s Analytics. The table below demonstrates the attractive market demographic data of the states in which Banner has branches relative to the aggregate United States:
Demographic Data(1)
WA | OR | CA | ID | UT | Aggregate U.S. | |||||||||||||||||||
Demographic Data | ||||||||||||||||||||||||
Population Forecast Growth(‘15-‘20 Change) | 5.8 | % | 4.5 | % | 4.8 | % | 5.3 | % | 6.5 | % | 3.7 | % | ||||||||||||
Median Household Income (000s) | $ | 62.3 | $ | 52.7 | $ | 63.6 | $ | 49.0 | $ | 63.9 | $ | 55.6 | ||||||||||||
Forecast Growth (‘15-‘20 Change) | 7.4 | % | 9.1 | % | 8.0 | % | 7.7 | % | 10.2 | % | 7.8 | % | ||||||||||||
Unemployment Rate | 5.2 | 6.2 | 5.9 | 4.2 | 3.6 | 5.0 |
Source:SNL Financial.
(1) | Banner does not operate within all areas of these states. |
The region in which we operate is also home to powerful and diverse drivers of economic growth. Leading companies headquartered in the Pacific Northwest include Microsoft, Intel, Amazon, Boeing, Costco, Nike, Nordstrom, Weyerhaeuser, Tri Marine and Trident Seafoods, among others. By expanding into California, we are increasing our presence in markets that are home to established businesses and a strong economy.
Super Community Bank Model:We employ a desirable combination of the broad capabilities of a large regional bank with the personal relationship delivery of a community bank. We offer a broad set of products to middle market, small business and consumer clients. Our community bank model allows us to emphasize relationship banking, providing clients with localized and efficient decision making.
We believe our combination of big bank capabilities with community bank relationship management provides a differentiated value proposition when compared to smaller community bank competitors and money center banks within our footprint. Our relationship driven approach, speed and efficiency attracts customers who demand both responsiveness from their bank and a broad offering of products and services. We are able to align delivery channels to allow effective tactical execution and balance a flexible approach while maintaining high underwriting standards and a moderate risk profile.
Our involvement in the communities in which we operate and our reputation can be seen through the numerous awards and accolades we have received over the years, including Forbes 2014 “America’s 50 Most Trustworthy Financial Companies,” the highest rating on Bankrate.com SAFE & SOUND Star Ratings and SBA “Regional Lender of the Year” for the Seattle/Spokane District in 2014.
6
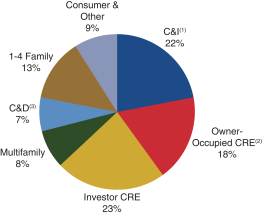
Balanced Loan Portfolio with Attractive Credit Risk Profile:We believe our risk management approach is robust for a community bank our size. We maintain what we believe are conservative underwriting standards and, following the financial crisis, have consistently and substantially improved our credit quality. Risk management at Banner is built on deep-rooted culture, process and experience. This is demonstrated by our well diversified loan portfolio:
Loan Mix (as of September 30, 2015 on a pro forma basis)
(1) | Commercial and industrial. |
(2) | Owner-occupied commercial real estate. |
(3) | Construction and development. |
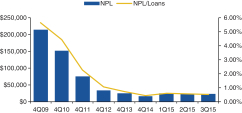
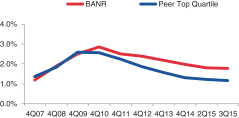
In addition to a well diversified loan portfolio, we believe our conservative risk management is evidenced through our low levels of non-performing loans (“NPLs”). For example, in the third quarter of 2015, we had non-performing loans of $23.5 million or 0.5% of total loans, as compared to 1.1% of total loans for the top quartile of our peers ranked by NPLs as a percentage of total loans (peers include 53 publicly listed banks with between $5 and $15 billion in total assets). For the same period, our ratio of allowance for loan and lease losses (“ALLL”) to total loans was 1.77% as compared with 1.17% for the top quartile of our peers ranked by ALLL to total loans. Our disciplined approach to risk management has allowed us to grow while maintaining strong asset quality: We do not believe the Merger to have meaningfully affected the percentage NPLs or ALLL on pro forma basis.
Non-Performing Loans of Banner | ALLL / Loans | |
Source: SNL Financial.
Note:Peers include 53 publicly listed banks with between $5 and $15 billion in total assets. The top quartile of peers in the ALLL/Loans chart above are ranked by ALLL to total loans. We define NPLs as nonaccrual loans and 90+ days delinquent accruing loans. Banner results are its actual historic results and do not include any pro forma adjustments.
Low Cost and Broad-Based Deposit Base:Our diversified and low cost core deposit base (core deposits consisting of transaction account and savings account deposits) provides a stable source of funding for us to continue our growth strategy. Our cost of deposits for the quarter ending September 30, 2015 was 0.16%
7
compared to 0.22% for the top quartile of our peers, ranked by cost of deposits. AmericanWest’s cost of deposits for the quarter ending September 30, 2015 was 0.22%.
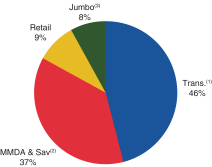
In addition, our deposits are geographically diversified in both rural and metropolitan markets. We have over 415,000 unique accounts on a pro forma basis in our franchise and this continues to grow as we expand our footprint and develop relationships in our new markets. Approximately a third of our deposits are non-interest bearing and, at September 30, 2015 on a pro forma basis, 83% of our deposits were core deposits.
Deposit Mix (as of September 30, 2015 on a pro forma basis)
(1) | Transaction deposits. |
(2) | Money market and savings account deposits. |
(3) | Jumbo savings account deposits, or “high yield” deposits. Certificates of deposit accounts of $100,000 or greater. |
Improving Profitability:Effective execution of our super community bank model, which has resulted in significant client acquisition and revenue growth, has enabled us to generate positive operating leverage, expand our market share and produce increasing and sustainable profitability. We believe the realization of merger synergies and economies of scale will further drive meaningful improvement in earnings and profitability as well.
Our revenue growth is driven by strong loan growth and stable net interest margins. We have also significantly expanded our fee revenue channels in recent years. In the quarter ended September 30, 2015, deposit fees totaled $9.7 million, representing year-over-year growth of 17.6%, or growth of 14.1% without including the effect of the Siuslaw acquisition. Our net income benefits from positive operating leverage, translating into return on average assets consistently around 1%.
We believe we have a strong capital position that affords significant flexibility to pursue strategic opportunities, invest in our franchise and fund organic growth, reward our stockholders and consider other capital management alternatives. Pro forma as of September 30, 2015, we have $455 million in excess capital over an 8% tangible common equity / tangible assets industry benchmark.
Successful Expansion Through Disciplined M&A:Recent successful and conservatively priced acquisitions have meaningfully increased our scale, accelerated our operating leverage and enhanced our competitive positioning. The acquisition of Siuslaw added over $300 million in low cost deposits in complementary markets in Oregon. Similarly, the acquisition of AmericanWest added over $3.6 billion in low cost deposits and extended our franchise into California, Utah, southern Oregon and northern Idaho. We expect both acquisitions to be accretive to our earnings per share and build value for our stockholders following the conclusion of our integration and conversion activities.
We have also demonstrated our ability to exercise restraint in acquisitions if deal economics are not favorable. We take a stockholder friendly approach to acquisitions by remaining disciplined in choosing targets
8
as well as taking steps to have an orderly integration of institutions that we do acquire. Our goal is to pursue targets with strong credit profiles in an effort to reduce execution risk while realizing cost savings.
Strong Management:Our share price has approximately tripled since current management took over in 2010. The combined Banner and AmericanWest management team has successfully executed numerous transactions involving billions of dollars in assets over the last eight years. To date, we have been able to retain key talent from AmericanWest following the Merger and maintain a strong and experienced management team.
Long History and Scalable Franchise:Banner Bank was founded 125 years ago in 1890 and has been serving the communities in the Pacific Northwest United States ever since. We believe our long history and community focus has made us a pillar in the communities that we serve and we consistently invest in those communities to maintain this status.
Since becoming a public company in 1995, we have been able to effectively scale our franchise outside of our home state of Washington. Today we operate in 59 counties in Washington, Oregon, Idaho, California and Utah. We have followed an aggressive franchise expansion strategy since becoming a public company and have completed ten acquisitions, including the Merger, and opened or acquired 35 branches. We believe we are able to expand successfully through acquisitions because we have an efficient and scalable platform, depth of management and a culture of success. We believe we are able to integrate new businesses into our model efficiently, realize cost savings and collaborate with new management teams.
Our Growth Strategy
We believe stable long-term growth and profitability are the result of building strong customer relationships while maintaining disciplined risk management standards. We plan to focus on originating high-quality loans and growing our low-cost deposit base through our relationship-based business banking. We believe that continuing to focus on our core strengths will enable us to gain market share, continue to improve our operational efficiency and increase profitability. The key components of our strategy for continued success and future growth include the following:
Solidify Newly Expanded Footprint and Gain Market Share:A key component to our growth will be to establish our reputation in our new markets of California and Utah and grow our core deposit base as well as our overall market share in these key locations. The acquisition of AmericanWest strengthened our market presence in the Pacific Northwest and expanded our operations into what we believe are attractive growth markets in California and Utah, including the greater San Diego, Sacramento and Salt Lake City metropolitan areas. We consider these new markets to have strong growth profiles with respect to population growth, median household income and projected unemployment. The AmericanWest acquisition also adds over $3.6 billion in low cost deposits and raises our deposit market share among regional banks to third in Washington, fourth in Oregon and third overall in the Pacific Northwest. Overall, with the combination of our strong reputation and the positive growth drivers in our expanded footprint, we believe we are positioned well for growth.
Continued Growth Through Expanding Revenue Channels:We offer a wide range of loan and deposit products to meet the demands of our consumer and business clients and look to both deepen our product offering and expand our client base. Our successful execution of our client acquisition strategies has contributed significant growth in recent years. We believe implementing these same strategies across our expanded franchise will result in significant client growth, which will add to net interest income and deposit fees and service charges.
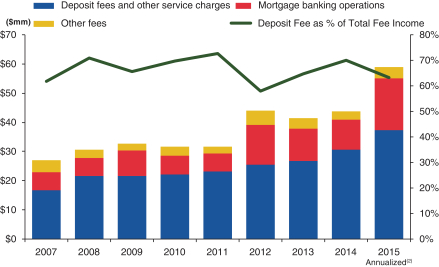
Both our net interest income and fee income revenue have increased steadily since 2012. Our growth in our total loans while maintaining stable net interest margins (“NIM”) has driven net interest income growth. For the quarter ended September 30, 2015, we experienced 17.6% growth over the deposit fee income for the quarter ended September 30, 2014 on an actual historic basis, or growth of 14.1% without including the effect of the Siuslaw acquisition. We expect to continue to benefit from organic fee income growth. Our deposit fees have
9
made up over 60% of other operating income. There is strong competition for transaction balances and savings deposits among the nationwide players in our footprint. However, through our expanded branch network and proven client acquisition strategies, we believe that our ability to attract low cost core deposits going forward will continue. The chart below reflects our deposit fees and the percentage of deposit fees to total fees:
Fee Income Breakdown(1)
(1) | Represents actual historic Banner results and does not reflect any pro forma adjustments. |
(2) | 2015 annualized results were calculated by adding the actual historic Banner results for the first and second quarters of 2015 to two times the results for the third quarter of 2015, without making any pro forma adjustments in any quarter. |
Build and Protect the Banner Bank Brand:We have worked hard to create a reputable and well-recognized brand in the markets that we serve. We intend to continue to make investments and pursue initiatives that both sustain and strengthen our brand going forward.
Technology is changing the banking landscape and our goal is to provide the resources and capabilities our customers have come to expect from us. We regularly invest in alternate platforms and services that will improve the customer experience through increased connectivity and faster responsiveness.
We believe our super community bank model allows us to communicate our expertise in the marketplace and grow our relationships. We believe this model offers a desirable combination of localized decision making with a broad product offering. We believe our focus on middle market, small business and consumer clients through a personal relationship delivery model drives client loyalty and advocacy of the Banner brand.
Community investment is a core part of our strategy as we believe a bank that actively participates in and supports its community stands to grow relationships and offer the best advice for clients. Our involvement in the communities in which we operate and our reputation can be seen through the numerous awards and accolades we have received over the years, including Forbes 2014 “America’s 50 Most Trustworthy Financial Companies,” the highest rating on Bankrate.com SAFE & SOUND Star Ratings and SBA “Regional Lender of the Year” for the Seattle/Spokane District in 2014.
Enhancing Stockholder Value:It is our goal to continue to create value for our stockholders. We expect to accomplish this through:
• | protecting NIM; |
10
• | improving operating efficiency; |
• | maintaining a moderate credit risk profile; and |
• | retaining risk appropriate capital. |
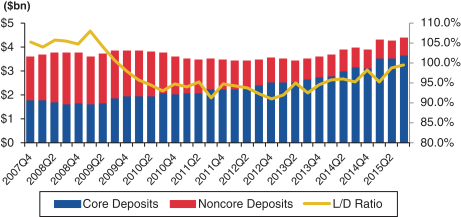
We have maintained consistent loan growth over the past four years. From the fourth quarter of 2010 to the third quarter of 2015, we experienced a compounded annual growth rate (“CAGR”) of 5.4% in our loan portfolio as a result of organic growth and acquisitions. Deposits, especially core deposits, are our main source of funding for our loan growth. Our total deposits and core deposits have grown at a CAGR of 4.3% and 13.1%, respectively, from the fourth quarter of 2010 to the third quarter of 2015 (on an actual historic basis). We believe these positive characteristics will result in continued future growth.
Loan Growth(1)(2)
(1) | Represents actual historic Banner results and does not reflect any pro forma adjustments. |
(2) | Reflects the results of the Sterling branch acquisition starting on June 21, 2014 and the Siuslaw acquisition starting on March 7, 2015. |
Deposit Breakdown(1)(2)
(1) | Represents actual historic Banner results and does not reflect any pro forma adjustments. |
(2) | Reflects the results of the Sterling branch acquisition starting on June 21, 2014 and the Siuslaw acquisition starting on March 7, 2015. |
11
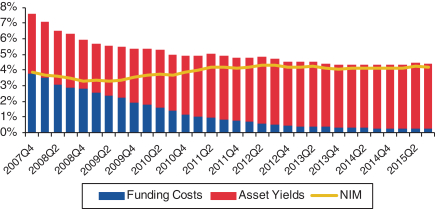
We intend to protect our net interest margins by managing our asset mix and yields while continuing to grow stable low cost deposits to minimize our funding costs. As reflected below, our funding costs have significantly declined since the financial crisis and in recent years our asset yields have maintained a steady spread over our costs. For the quarter ended September 30, 2015, our NIM was 4.14%.
Historical NIM(1)
(1) | Represents actual historic Banner results and does not reflect any pro forma adjustments. |
As compared with 2010, we have meaningfully reduced our core efficiency ratio, which is the ratio of our core total revenues to core operating expenses. Core total revenues exclude fair value adjustments and gains and losses on the sale of securities and acquisition bargain purchase gain. Core operating expenses exclude acquisition-related costs. Continuing to improve operating efficiency will depend upon our continuing to grow core total revenue faster than core operating expense and driving positive operating leverage. We intend to carefully manage our cost structure and implement internal processes to improve productivity and enhance our earnings to position us to be able to continue the recent downward trend in our core efficiency ratio.
Overall, we believe our scalable systems, risk management infrastructure and operating model will better enable us to achieve further operational efficiencies as we continue to grow our business. We believe our focus on generating positive operating leverage through superior core revenue growth has contributed significantly to our return on equity, return on assets and net income and is reflected in our core efficiency ratio.
Risks We Face
There are a number of risks you should consider before buying our common stock. These risks are discussed more fully in the section entitled “Risk Factors.”
The Merger
On October 1, 2015, we consummated the Merger with Starbuck. As part of the merger consideration, the previous equity holders of SKBHC, including the Selling Stockholders, received an aggregate of $130.0 million in cash and 13.23 million shares of our common stock and non-voting common stock.
We believe the Merger will result in cost savings and operating synergies between Banner and Starbuck and provide benefits to our expanded group of clients, communities, stockholders and employees. We expect to begin to see the financial benefits of these cost savings and synergies in the second half of 2016, with the cost savings
12
expected to be fully implemented by the fourth quarter of 2016. As part of the integration efforts, we will consolidate approximately 11 branches and convert the AmericanWest IT systems to the Banner system. We anticipate the data systems conversion will occur in February of 2016. As a result these efforts, we expect to incur approximately $33 million of acqusition-related costs subsequent to the close of the Merger through the second quarter of 2016, with the majority being incurred in the fourth quarter of 2015 and the first quarter of 2016. With respect to the fourth quarter of 2015, we expect these restructuring charges to substantially offset any net income we otherwise would have recognized during the quarter. These charges will relate to items such as severance and benefits costs, expenses related to branch consolidation charges, vendor contract termination costs, expenses related to IT systems integration and conversion, incurrence of professional services and consulting fees, and other items. There are various material assumptions underlying both our ability to realize cost savings and operational synergies and the amount and timing of our incurrence of acquisition-related costs, which may result in these items being materially greater or less than we anticipate.
Following the close of the Merger, Banner Bank’s total assets were $9.9 billion. We intend to carefully manage our balance sheet and opportunistically sell certain assets from our combined securities portfolio and the AmericanWest loan portfolio, depending on market conditions, so that Banner Bank’s total assets remain below $10 billion in the short term, particularly at December 31, 2015. This rebalancing of our asset portfolios may have a modest impact on the concentrations in our various loan portfolios and may affect the level of risk of our earning assets overall.
We also expect to experience modest net interest margin compression as a result of the Merger because the size of the AmericanWest securities portfolio initially will result in the Company having proportionally more securities and fewer loans in its earning asset mix.
Corporate Information
Our principal executive offices are located at 10 South First Avenue, Walla Walla, WA 99362. Our telephone number is(509) 527-3636 and our website address is www.bannerbank.com. The reference to the website is an inactive textual reference only and information contained on our website is not part of or incorporated by reference into this Business Summary section.
13