Table of Contents
SECURITIES AND EXCHANGE COMMISSION
Washington, DC 20549
FORM 6-K
Report of Foreign Issuer
Pursuant to Rule 13a-16 or 15d-16
of the Securities Exchange Act of 1934
For Q1-2003 Results
Nera ASA
Kokstadveien 23, P.O. Box 7090
N-5020 BERGEN
Norway
N-5020 BERGEN
Norway
| Indicate by check mark whether the registrant files or will file annual reports under cover of Form 20-F or Form 40-F. |
Form 20-Fx Form 40-Fo
| Indicate by check mark whether the registrant by furnishing the information continued in this Form is also thereby furnishing the information to the Commission pursuant to Rule 12g3-2(b) under the Securities Exchange Act of 1934. |
Yeso Nox
| If “Yes” is marked, indicate below the file number assigned to the registrant in connection with Rule 12g3- 2(b): |
TABLE OF CONTENTS
| SIGNATURES | ||||||||
Table of Contents
SIGNATURES
Pursuant to the requirements of the Securities Exchange Act of 1934, the registrant has duly caused this report to be signed on its behalf by the undersigned, thereunto duly authorised.
| Nera ASA | ||
| By: Bjørn Ove Skjeie (sign.) Name: Bjørn Ove Skjeie Title: President and Chief Operating Officer |
Dated: April 29, 2003
Table of Contents

| Nera ASA | ||
| Postal Address P.O. Box 7090, N-5020 BERGEN, Norway, | ||
| PRESS RELEASE, 29 April 2003 | Office Address Kokstadvn. 23, BERGEN, Norway, Tel.No. +47 55 22 51 00 Fax.No. +47 55 22 52 99 | |
| Head Office Nera ASA, 5020 BERGEN Register of Business Enterprises NO 944 536 949 MVA |
Nera ASA: Results per 1st quarter 2003
Bergen/Norway, 29 April 2003
Nera ASA (OSE: NER) had operating revenues of MNOK 540 for Q1, compared to MNOK 681 for Q1 2002. Although the company’s turnover is reduced, the operating income and income before tax have improved. The Nera Group reports positive pre-tax profit of MNOK 2, compared to a loss of MNOK 36 in 2002. Good earnings for Satellite Communications, lower operating costs and higher financial income are the main reasons for the improvement. In spite of the increase in orders received, the weak transmission market still presents the company with considerable challenges. Nera retains its goal of regaining profitability during 2003.
| • | Operating income per Q1: MNOK (24.6) compared to MNOK (42.5) for Q1 2002 | ||
| • | Income before tax per Q1: MNOK 2.0 compared to a loss of 35.7 MNOK for Q1 2002 | ||
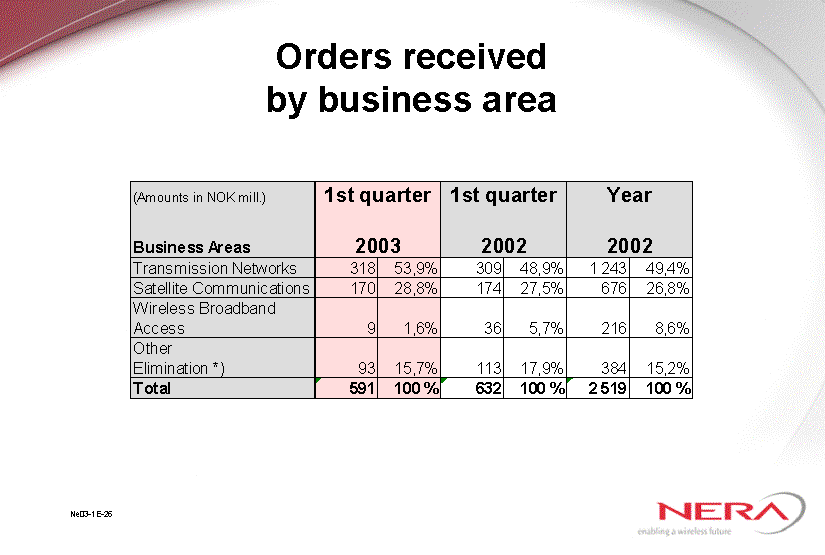
| • | Transmission Networks booked new orders for MNOK 318 in Q1, and had an operating loss of MNOK 40.7 | ||
| • | Satellite Communications strengthens its market position and achieved an operating income of MNOK 27.5 in Q1, compared to MNOK 14.4 in Q1 last year | ||
| • | Operating expenses have been reduced by 26 percent and new cost cut initiatives are under implementation | ||
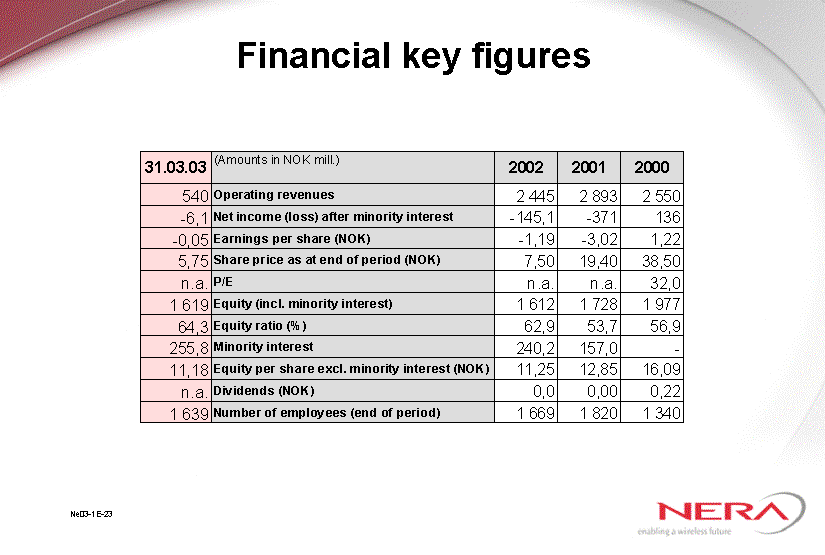
| • | Nera’s balance sheet is still strong, and at the close of Q1 the company had cash reserves of MNOK 757 and an equity ratio of 64 percent |
| Figures in MNOK | Q1 2003 | Q1 2002 | 2002 | |||||||||
| Orders received | 591.3 | 631.8 | 2 518.6 | |||||||||
| Operating revenues | 539.7 | 680.7 | 2 444.8 | |||||||||
| Operating income | (24.6 | ) | (42.5 | ) | (144.4 | ) | ||||||
| Income before tax | 2.0 | (35.7 | ) | (162.2 | ) | |||||||
| Earnings per share | (0.05 | ) | (0.29 | ) | (1.19 | ) | ||||||
“We note that the effects of the reductions of expenses and good earnings for Satellite Communications has given a marked improvement of results”, says Bjørn Ove Skjeie, CEO of Nera ASA. Skjeie continues: “Orders received per first quarter for Transmission Networks is back at 300+ level, and we still think a volume at 2002 level is realistically attainable for this business area”.
Table of Contents
Transmission Networks
In Nera’s Transmission Networks business, the market is still characterised by a low will to invest in new mobile network infrastructure. Nera still sees a positive trend in that the order intake is back on the levels seen in the five quarters before Q4 2002. Transmission Networks booked orders for MNOK 318 in Q1 2003, compared to MNOK 235 in Q4 2002 and MNOK 309 in Q1 2002. Among the orders received, South-East Asian and Eastern European markets still dominate, but the company is pleased to note that Latin America is once again showing a positive development.
Operating revenues in Transmission Networks were MNOK 258 per Q1, compared to MNOK 378 in Q1 of last year. The operating loss was MNOK 40.7, compared to a loss of MNOK 53.5 in Q1 2002. In addition to other cost cut initiatives, the ongoing streamlining of Nera Networks’ supply chain is expected to reduce the workforce by up to 90 man-years for this business area.
Satellite Communication
Nera continues its positive trend in satellite communication. An unstable geo-political situation has led to a marked increase in the demand for satellite phones, and has also increased demand in the land-earth station market. The demand for the Nera WorldPhone and the Nera WorldCommunicator was particularly good in the past quarter. Satellite Communication booked orders for MNOK 170 in Q1. This is at the level of Q4 2002, but is 40 percent above the Q1 2002 level.
Satellite Communication had operating revenues of MNOK 172 in Q1, compared to MNOK 161 in the beginning of 2002. Operating income was MNOK 27.5, nearly twice that of the same period last year. The strong result gave Satellite Communication an operating margin of 16 percent.
Wireless Broadband Access
The wireless broadband market is still in a phase of development, which means that the number of projects is limited and the volume of orders received is unstable. The priority area for the company’s terrestrial systems is expanding geographically. Because of the exceptionally large order intake in Q4 2002, the focus in broadband via satellite is currently on delivery efforts. Nera’s Wireless Broadband Access business booked new orders for MNOK 9 in Q1 2003, compared to MNOK 36 in Q1 2002.
Wireless Broadband Access had operating revenues of MNOK 31 in Q1 2003, compared to MNOK 20 in Q1 2002. This resulted in an operating loss of MNOK 11.5, compared to a loss of MNOK 16.7 in Q1 2002.
Prospects
“Our goal still stands – to regain profitability in the course of 2003”, underlines Bjørn Ove Skjeie, CEO of Nera ASA. “Attaining it will require a determined implementation of cost cut initiatives in the Transmission Networks business area and a constant focus on improving profitability throughout the company. Meanwhile, we need to keep up our marketing efforts, to secure a business volume of more than MNOK 300 per quarter in Transmission Networks. We also need to further strengthen the market position of our Satellite Communications business”, concludes Skjeie.
For further information, please contact:
Helge Skaar, EVP Information and Public Affairs, +47 55 22 58 20 (work), 90 14 20 40 (mobile), or hsk@nera.no
or
www.nera.no
2 (2)
Table of Contents
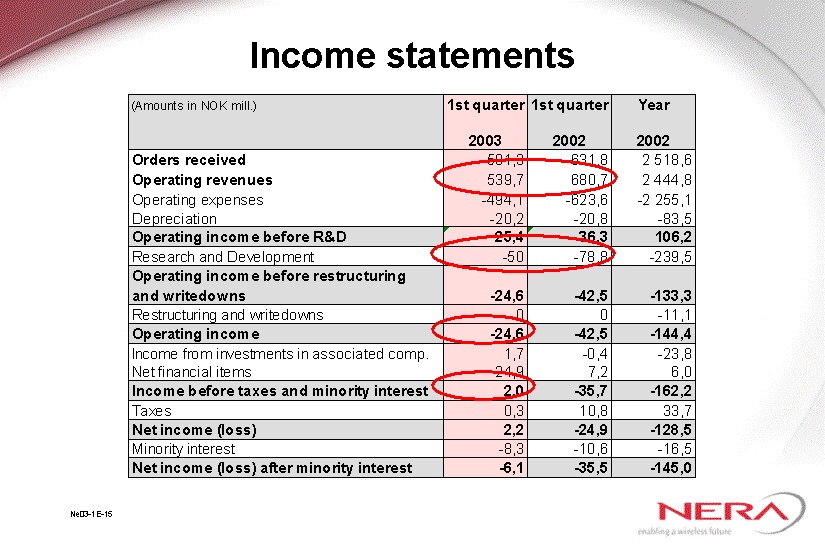
Income Statements
| (Amounts in NOK mill.) | 1st quarter | 1st quarter | Year | |||||||||
| 2003 | 2002 | 2002 | ||||||||||
Orders received | 591,3 | 631,8 | 2 518,6 | |||||||||
Operating revenues | 539,7 | 680,7 | 2 444,8 | |||||||||
| Operating expenses | -494,1 | -623,6 | -2 255,1 | |||||||||
| Depreciation | -20,2 | -20,8 | -83,5 | |||||||||
Operating income before R&D | 25,4 | 36,3 | 106,2 | |||||||||
| Research and Development | -50 | -78,8 | -239,5 | |||||||||
Operating income before restructuring and writedowns | -24,6 | -42,5 | -133,3 | |||||||||
| Restructuring and writedowns | 0 | 0 | -11,1 | |||||||||
Operating income | -24,6 | -42,5 | -144,4 | |||||||||
| Income from investments in associated comp. | 1,7 | -0,4 | -23,8 | |||||||||
| Net financial items | 24,9 | 7,2 | 6,0 | |||||||||
Income before taxes and minority interest | 2,0 | -35,7 | -162,2 | |||||||||
| Taxes | 0,3 | 10,8 | 33,7 | |||||||||
Net income (loss) | 2,2 | -24,9 | -128,5 | |||||||||
| Minority interest | -8,3 | -10,6 | -16,5 | |||||||||
Net income (loss) after minority interest | -6,1 | -35,5 | -145,0 | |||||||||
Table of Contents
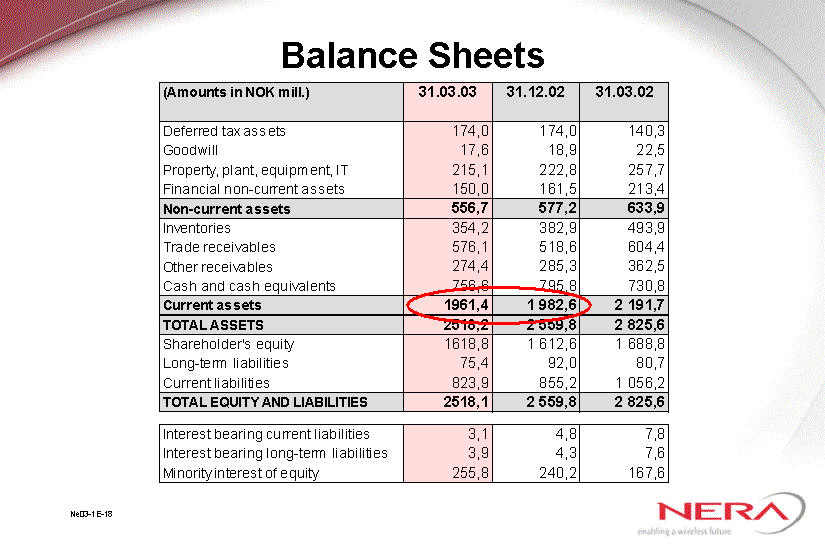
Balance Sheets
| (Amounts in NOK mill.) | 31.03.03 | 31.12.02 | 31.03.02 | |||||||||
| Deferred tax assets | 174,0 | 174,0 | 140,3 | |||||||||
| Goodwill | 17,6 | 18,9 | 22,5 | |||||||||
| Property, plant, equipment, IT | 215,1 | 222,8 | 257,7 | |||||||||
| Financial non-current assets | 150,0 | 161,5 | 213,4 | |||||||||
Non-current assets | 556,7 | 577,2 | 633,9 | |||||||||
| Inventories | 354,2 | 382,9 | 493,9 | |||||||||
| Trade receivables | 576,1 | 518,6 | 604,4 | |||||||||
| Omløpsaksjer Cash and cash equivalents | 756,6 | 795,8 | 730,8 | |||||||||
Current assets | 1961,4 | 1 982,6 | 2 191,7 | |||||||||
TOTAL ASSETS | 2518,2 | 2 559,8 | 2 825,6 | |||||||||
| Shareholder’s equity | 1618,8 | 1 612,6 | 1 688,8 | |||||||||
| Long-term liabilities | 75,4 | 92,0 | 80,7 | |||||||||
| Current liabilities | 823,9 | 855,2 | 1 056,2 | |||||||||
TOTAL EQUITY AND LIABILITIES | 2518,1 | 2 559,8 | 2 825,6 | |||||||||
| Interest bearing current liabilities | 3,1 | 4,8 | 7,8 | |||||||||
| Interest bearing long-term liabilities | 3,9 | 4,3 | 7,6 | |||||||||
| Minority interest of equity | 255,8 | 240,2 | 167,6 | |||||||||
Table of Contents
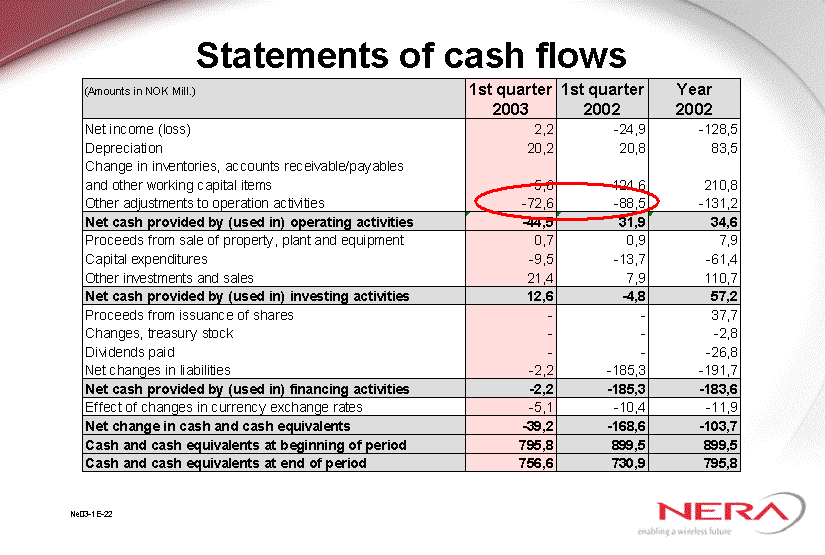
Statements of Cash Flow
| (Amounts in NOK Mill.) | 1st quarter | 1st quarter | Year | |||||||||
| 2003 | 2002 | 2002 | ||||||||||
| Net income (loss) | 2,2 | -24,9 | -128,5 | |||||||||
| Depreciation | 20,2 | 20,8 | 83,5 | |||||||||
| Change in inventories, accounts receivable/payables and other working capital items | 5,6 | 124,6 | 210,8 | |||||||||
| Other adjustments to operation activities | -72,6 | -88,5 | -131,2 | |||||||||
Net cash provided by (used in) operating activities | -44,5 | 31,9 | 34,6 | |||||||||
| Proceeds from sale of property, plant and equipment | 0,7 | 0,9 | 7,9 | |||||||||
| Capital expenditures | -9,5 | -13,7 | -61,4 | |||||||||
| Other investments and sales | 21,4 | 7,9 | 110,7 | |||||||||
Net cash provided by (used in) investing activities | 12,6 | -4,8 | 57,2 | |||||||||
| Proceeds from issuance of shares | — | — | 37,7 | |||||||||
| Changes, treasury stock | — | — | -2,8 | |||||||||
| Dividends paid | — | — | -26,8 | |||||||||
| Net changes in liabilities | -2,2 | -185,3 | -191,7 | |||||||||
Net cash provided by (used in) financing activities | -2,2 | -185,3 | -183,6 | |||||||||
| Effect of changes in currency exchange rates | -5,1 | -10,4 | -11,9 | |||||||||
Net change in cash and cash equivalents | -39,2 | -168,6 | -103,7 | |||||||||
Cash and cash equivalents at beginning of period | 795,8 | 899,5 | 899,5 | |||||||||
Cash and cash equivalents at end of period | 756,6 | 730,9 | 795,8 | |||||||||
Table of Contents
First quarter report 2003
Unaudited

Table of Contents
Q1-03 REPORT
The Nera Group had operating revenues of MNOK 540 for the first quarter of 2003, compared to MNOK 681 for the same period in 2002. Despite a lower turnover, the operating income and income before tax has been improved. The company reports a positive income before tax of MNOK 2 compared to a loss of MNOK 36 in the first quarter 2002. Lower operating costs, good earnings from satellite communications and high financial revenues are the main reasons for the improvement. The weak transmission market will still present the company with challenges throughout 2003. The ambition to regain profitability during the course of 2003 is maintained.
Order intake and the market situation
The Nera Group booked new orders for MNOK 591 in the first quarter of 2003, compared to 632 in last year’s first quarter. The order intake improved somewhat from fourth quarter of last year, when the company’s order intake was MNOK 575.
Transmission Networks booked new orders for MNOK 318, compared to MNOK 309 for the corresponding period of last year and up from MNOK 235 in fourth quarter of 2002. The order intake for this business area is thus again at the average level for the period since the fourth quarter of 2001. After a weak start , the order intake recovered towards the end of the quarter.
The transmission market remains difficult and the prevailing sentiment is still reluctance towards investing in new infrastructure for mobile networks in Western Europe and the USA. This contributes to increased competition in the remaining regions and market segments. South East Asia and Eastern Europe continue at a high level of activity, while Latin America yields increasing activity.
The Mobile Satellite Solutions business area booked orders for MNOK 170 in the first quarter in 2003, at the same level as for the corresponding quarter last year, but 40 percent above last year’s fourth quarter.
Mobile Satellite Solutions has experienced a quarter of substantial sales of the land mobile satellite terminals Nera WorldPhone and Nera WorldCommunicator. This increase comes as a consequence of an unstable geo-political climate. The situation boosts the traffic volume and will again provide new business volume for the land-earth station segment.
The Wireless Broadband Access business area saw an order intake in the first quarter of 2003 of MNOK 9, which is a decline from the very strong previous quarter, which included the Shin Sat contract for MNOK 125. Orders received in the first quarter of 2002 were MNOK 36.
The orders received are principally in connection with terrestrial broadband solutions. Nera continue to direct its market efforts on concentrated geographical areas. Meanwhile, the sales of these solutions is increasingly generated through Nera’s own international sales network Outside of Scandinavia and Italy, contracts have been signed in Eastern Europe, Latin America and South-East Asia. Contracts in this field are typically small, usually between one and two MNOK.
The broadband-via-satellite business has mainly focused the work in connection with delivering the major contracts that were signed in the previous quarter.
Other activities (mainly Electronics Contract Manufacturing and Information Technology in NeraTel, Singapore) booked orders of MNOK 93 in first quarter, which is MNOK 20 less than in first quarter of 2002. As previously communicated, these activities are currently suffering under a weak market.
Operations
The Nera Group had operating revenues of MNOK 540 in the first quarter, compared to MNOK 681 for the first quarter of 2002, and down from MNOK 614 in fourth quarter 2002. As pointed out in the presentation of the results for fourth quarter 2002, this is in line with the company’s expectations, due to the low order intake for the transmission networks business area in the fourth quarter 2002.
Table of Contents
Both Transmission Networks and Other Activities had a substantially lower business volume, while Satellite Communication and the broadband operations increased their turnover. The Transmission Networks business area had a turnover of MNOK 258, compared to MNOK 378 in the same period last year. The corresponding figure for Satellite Communication was MNOK 172, compared to MNOK 161 last year. The broadband operations had a turnover of MNOK 31, compared to MNOK 20 last year, while Other Activities in NeraTel had a turnover of MNOK 78, compared to 122 MNOK last year.
In spite of lower volumes, the company’s operating loss has been reduced. This is a consequence of a lowering of expenses. Ordinary operating costs were MNOK 494, compared to MNOK 624 in the previous year. R&D expenses were MNOK 50, compared to MNOK 79 in the previous year.
The reduction of costs is a result of efforts to cut expenses in the Transmission Networks business are. These efforts have been ongoing throughout the first quarter. New measures have been announced, including streamlining of the company’s internal supply chain, which will reduce the workforce by up to 90 employees.
The operating loss for the first quarter was MNOK 24.6, compared to a loss of MNOK 42.5 last year. The operating loss situation improved somewhat since fourth quarter 2002, which ended at a MNOK 28.8 loss.
The Satellite Communication business area showed very good earnings for the first quarter, while both the Transmission Networks business are and the broadband operations delivered operating losses. For Transmission Networks, the operating loss was MNOK 40.7, compared to MNOK 53.5 for the corresponding period in 2002. Satellite Communication had an operating profit of MNOK 27.5, nearly doubling its profit of MNOK 14.4 in the corresponding period of last year. The operating loss for the broadband operations was reduced from MNOK 16.7 in Q1 2002, to MNOK 11.5 in Q1 2003.
Financial figures
The Nera Group’s financial income was extraordinarily high in the first quarter, at MNOK 26.8, compared to MNOK 7.2 last year. The high financial income is mainly a consequence of the sale of shares in TV Mobile (MNOK 6) and a currency gain of MNOK 9.
Pre-tax profit for the first quarter was MNOK 2, including an income of MNOK 1.7 from associated company. The result is a marked improvement over last year’s pre-tax loss of MNOK 35.7, as well as over fourth quarter 2002, which showed an MNOK 30.6 loss.
Including a calculated net tax income of MNOK 0.3 and minority interests of MNOK -8.3, the net loss for first quarter 2003 is MNOK 6.1, compared to a net loss of MNOK 35.5 in the first quarter 2002.
Balance sheets and liquidity
The company’s financial situation is robust, with, a satisfactory equity ratio and net cash position.
The Nera Group’s balance sheet as at 31 March 2003 was at the same level as at the start of the quarter, and approx. MNOK 300 lower than at the corresponding date in 2002. There are no significant changes in the balance sheet items for this quarter. The company had an equity of MNOK 1619, giving an equity ratio of 64.3 percent.
At the close of the quarter, the Nera Group had cash reserves of MNOK 757, compared to MNOK 796 at the start of the quarter.
Table of Contents
Prospects
Political unrest and financial uncertainty still characterises the geo-political situation. Another factor of uncertainty is the economic effects of spread of the SARS virus.
The Transmission Networks business area expects the market to decline further, due to continued reluctance towards new construction of mobile networks globally. The Eastern European markets including Russia and the South-East Asian markets are expected to still provide a good volume of activity, while certain Latin American markets seem to improve somewhat. Along with a number of single projects in other regions where Nera is well positioned, this leads the company’s management to still consider it to be realistic maintaining the same business volume in this business area as in 2002 a viable possibility.
Nevertheless, the company focuses on further cost reduction efforts aimed at bringing this part of the operation in balance.
With regards to Satellite Communication, the geo-political unrest may contribute to a lasting high demand, but with the possibility that the market gradually levels out. At the same time, the company makes a consistent effort to expand the markets for the company’s maritime communication solutions and for other areas of use. All in all, the company expects a relatively stable business volume for Satellite Communication, but changes in the product mix may yield somewhat lower margins in the second half of the year.
No substantial changes are expected in the development of other business areas.
The company’s ambition to regain profitability during the course of 2003 is upheld .
Bergen, 28 April 2003
Table of Contents
| Amounts in | ||||||||||||
| Income Statements | NOK million | |||||||||||
| 1.1.-31.3.2003 | 1.1.-31.3.2002 | Year 2002 | ||||||||||
| Orders received | 591,3 | 631,8 | 2 518,6 | |||||||||
| Operating revenue | 539,7 | 680,7 | 2 444,8 | |||||||||
| Operating expenses | (494,1 | ) | (623,6 | ) | (2 255,1 | ) | ||||||
| Depreciation | (20,2 | ) | (20,8 | ) | (83,5 | ) | ||||||
Operating income before R&D costs | 25,4 | 36,3 | 106,2 | |||||||||
| Research and development | (50,0 | ) | (78,8 | ) | (239,5 | ) | ||||||
Operating income (loss) before restructuring and write -downs | (24,6 | ) | (42,5 | ) | (133,3 | ) | ||||||
| Restructuring and write-downs | — | (11,1 | ) | |||||||||
Operating income (loss) | (24,6 | ) | (42,5 | ) | (144,4 | ) | ||||||
| Earnings from investments in associated companies | 1,7 | (0,4 | ) | (23,8 | ) | |||||||
| Net financial items | 24,9 | 7,2 | 6,0 | |||||||||
Income (loss) before tax | 1,9 | (35,7 | ) | (162,2 | ) | |||||||
| Taxes | 0,3 | 10,8 | 33,7 | |||||||||
Net income (loss) | 2,2 | (24,9 | ) | (128,5 | ) | |||||||
| Minority interest | (8,3 | ) | (10,6 | ) | (16,5 | ) | ||||||
Net income (loss) after minority interests | (6,1 | ) | (35,5 | ) | (145,0 | ) | ||||||
Earnings per share, primary (NOK) | (0,05 | ) | (0,29 | ) | (1,19 | ) | ||||||
Table of Contents
| Amounts in | ||||||||||||
| Balance Sheets | NOK million | |||||||||||
| 31.3.2003 | 31.12.2002 | 31.3.2002 | ||||||||||
| Deferred tax asset | 174,0 | 174,0 | 140,3 | |||||||||
| IT — Software | 24,6 | 23,7 | — | |||||||||
| Goodwill | 17,6 | 18,9 | 22,5 | |||||||||
| Property, plant and equipment | 190,5 | 199,1 | 257,7 | |||||||||
| Financial non-current assets | 150,0 | 161,5 | 213,4 | |||||||||
Non-current assets | 556,7 | 577,2 | 633,9 | |||||||||
| Inventories | 354,3 | 382,9 | 493,9 | |||||||||
| Trade receivables | 576,1 | 518,6 | 604,4 | |||||||||
| Other receivables | 274,4 | 285,3 | 362,5 | |||||||||
| Cash and cash equivalents | 756,6 | 795,8 | 730,8 | |||||||||
Current assets | 1 961,4 | 1 982,6 | 2 191,7 | |||||||||
TOTAL ASSETS | 2 518,1 | 2 559,8 | 2 825,6 | |||||||||
| Shareholders’ equity | 1 618,8 | 1 612,6 | 1 688,8 | |||||||||
| Long-term liabilities | 75,4 | 92,0 | 80,7 | |||||||||
| Current liabilities | 823,9 | 855,2 | 1 056,2 | |||||||||
TOTAL EQUITY AND LIABILITIES | 2 518,1 | 2 559,8 | 2 825,6 | |||||||||
| Interest bearing current liabilities | 3,1 | 4,8 | 7,8 | |||||||||
| Interest bearing long-term liabilities | 3,9 | 4,3 | 7,6 | |||||||||
| Minority shareholders’ interest | 255,8 | 240,2 | 167,6 | |||||||||
Change in equity : | ||||||||||||
| Equity as of 01.01 | 1 612,6 | 1 728,1 | ||||||||||
| 1 728,1 | ||||||||||||
| Net income (loss) | 2,2 | (128,5 | ) | |||||||||
| (24,9 | ) | |||||||||||
| Additional treasury stock | (2,8 | ) | ||||||||||
| Additional minority interest | 126,4 | |||||||||||
| Dividend | (26,8 | ) | ||||||||||
| Other equity changes | (6,6 | ) | ||||||||||
| Translation differences | 4,0 | (77,2 | ) | (14,4 | ) | |||||||
Equity as of end of period | 1 618,8 | 1 612,6 | 1 688,8 | |||||||||
Table of Contents
| Amounts | ||||||||||||
| in NOK | ||||||||||||
| Statements of cash flows | million | |||||||||||
| 1.1.-31.3.2003 | 1.1.-31.3.2002 | Year 2002 | ||||||||||
| Net income (loss) | 2,2 | (24,9 | ) | (128,5 | ) | |||||||
| Depreciation | 20,2 | 20,8 | 83,5 | |||||||||
| Change in inventories, trade receivables/payables and other working capital | 5,6 | 124,6 | 210,8 | |||||||||
| Other operational related adjustments | (72,6 | ) | (88,5 | ) | (131,2 | ) | ||||||
Net cash provided by (used in) operating activities | (44,5 | ) | 31,9 | 34,6 | ||||||||
| Proceeds from sales of property, plant and equipment | 0,7 | 0,9 | 7,9 | |||||||||
| Capital expenditures | (9,5 | ) | (13,7 | ) | (61,4 | ) | ||||||
| Other investments and sales | 21,4 | 7,9 | 110,7 | |||||||||
Net cash provided by (used in) investing activities | 12,6 | (4,8 | ) | 57,2 | ||||||||
| Proceeds from issuance of shares | 37,7 | |||||||||||
| Changes, Treasury stock | (2,8 | ) | ||||||||||
| Dividends paid | (26,8 | ) | ||||||||||
| Net changes in liabilities | (2,2 | ) | (185,3 | ) | (191,7 | ) | ||||||
Net cash provided by (used in) financing activities | (2,2 | ) | (185,3 | ) | (183,6 | ) | ||||||
| Effect of changes in currency exchange rates | (5,1 | ) | (10,4 | ) | (11,9 | ) | ||||||
Net change in cash and cash equivalents | (39,2 | ) | (168,6 | ) | (103,7 | ) | ||||||
Cash and cash equivalents at beginning of period | 795,8 | 899,5 | 899,5 | |||||||||
Cash and cash equivalents at end of period | 756,6 | 730,9 | 795,8 | |||||||||
Table of Contents
| Amounts in NOK | ||||||||||||||||||||||||
| Orders received by Business Area | million | |||||||||||||||||||||||
| Business Areas | 1.1.-31.3.2003 | 1.1.-31.3.2002 | Year 2002 | |||||||||||||||||||||
| Transmissions Networks | 318 | 53,9 | % | 309 | 48,9 | % | 1 243 | 49,4 | % | |||||||||||||||
| Mobile Satellite Communications | 170 | 28,8 | % | 174 | 27,6 | % | 677 | 26,9 | % | |||||||||||||||
| Wireless Broadband Access | 9 | 1,6 | % | 36 | 5,6 | % | 215 | 8,5 | % | |||||||||||||||
| Others/eliminations | 93 | 15,8 | % | 113 | 17,9 | % | 384 | 15,3 | % | |||||||||||||||
Total | 591 | 100,0 | % | 632 | 100,0 | % | 2 519 | 100,0 | % | |||||||||||||||
| Operating revenues by Business Area | Amounts in NOK | |||||||||||||||||||||||
| million | ||||||||||||||||||||||||
| Business Areas | 1.1.-31.3.2003 | 1.1.-31.3.2002 | Year 2002 | |||||||||||||||||||||
| Transmissions Networks | 258 | 47,8 | % | 378 | 55,6 | % | 1 343 | 54,9 | % | |||||||||||||||
| Mobile Satellite Communications | 172 | 31,9 | % | 161 | 23,7 | % | 617 | 25,2 | % | |||||||||||||||
| Wireless Broadband Access | 31 | 5,7 | % | 20 | 2,9 | % | 69 | 2,8 | % | |||||||||||||||
| Others/eliminations | 78 | 14,5 | % | 122 | 17,9 | % | 417 | 17,1 | % | |||||||||||||||
Total | 540 | 100,0 | % | 681 | 100,0 | % | 2 445 | 100,0 | % | |||||||||||||||
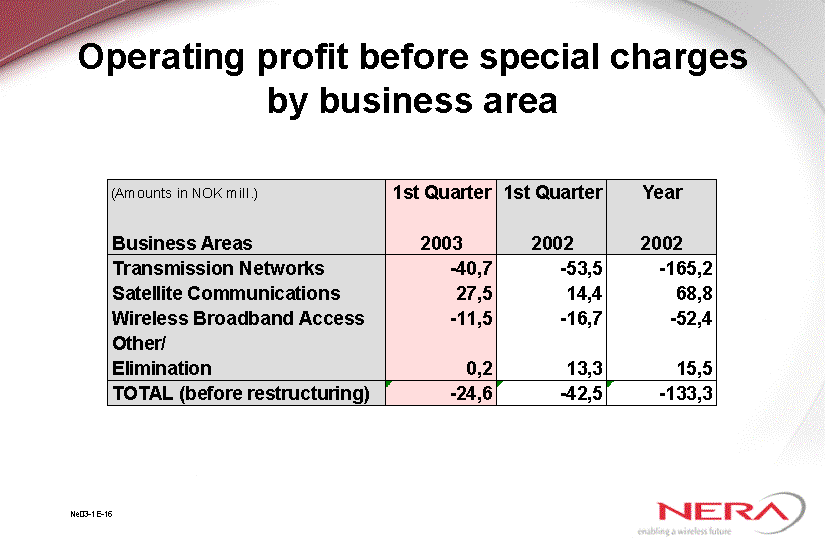
| Operating Income (loss) before restr.and write-down by Business | ||||||||||||
| Area | Amounts in NOK | |||||||||||
| million | ||||||||||||
| Business Areas | 1.1.-31.3.2003 | 1.1.-31.3.2002 | Year 2002 | |||||||||
| Transmissions Networks | (40,7 | ) | (53,5 | ) | (165,2 | ) | ||||||
| Mobile Satellite Communications | 27,5 | 14,4 | 68,8 | |||||||||
| Wireless Broadband Access | (11,5 | ) | (16,7 | ) | (52,4 | ) | ||||||
| Others/eliminations | 0,2 | 13,3 | 15,5 | |||||||||
Total | (24,6 | ) | (42,5 | ) | (133,3 | ) | ||||||
Table of Contents
| Orders received by Geographical Destinations | Amounts in NOK | |||||||||||||||||||||||
| million | ||||||||||||||||||||||||
| Geographical Destinations | 1.1.-31.3.2003 | 1.1.-31.3.2002 | Year 2002 | |||||||||||||||||||||
| Norway | 90 | 17,6 | % | 62 | 9,8 | % | 281 | 11,2 | % | |||||||||||||||
| Great Britain | 22 | 3,8 | % | 15 | 2,4 | % | 197 | 7,8 | % | |||||||||||||||
| Rest of Europe | 105 | 17,7 | % | 99 | 15,7 | % | 442 | 17,5 | % | |||||||||||||||
| America | 134 | 22,6 | % | 178 | 28,2 | % | 545 | 21,6 | % | |||||||||||||||
| Africa | 7 | 1,1 | % | 51 | 8,1 | % | 114 | 4,5 | % | |||||||||||||||
| Asia | 212 | 33,6 | % | 205 | 32,5 | % | 899 | 35,7 | % | |||||||||||||||
| Oceania | 21 | 3,6 | % | 21 | 3,3 | % | 41 | 1,7 | % | |||||||||||||||
Total | 591 | 100,0 | % | 632 | 100,0 | % | 2 519 | 100,0 | % | |||||||||||||||
| Operating revenues by Geographical Destinations | Amounts in NOK | |||||||||||||||||||||||
| million | ||||||||||||||||||||||||
| Geographical Destinations | 1.1.-31.3.2003 | 1.1.-31.3.2002 | Year 2002 | |||||||||||||||||||||
| Norway | 85 | 15,8 | % | 45 | 6,7 | % | 276 | 11,3 | % | |||||||||||||||
| Great Britain | 34 | 6,4 | % | 21 | 3,1 | % | 110 | 4,5 | % | |||||||||||||||
| Rest of Europe | 114 | 21,2 | % | 110 | 16,1 | % | 498 | 20,4 | % | |||||||||||||||
| America | 100 | 18,4 | % | 186 | 27,4 | % | 538 | 22,0 | % | |||||||||||||||
| Africa | 20 | 3,7 | % | 33 | 4,9 | % | 105 | 4,3 | % | |||||||||||||||
| Asia | 179 | 33,1 | % | 274 | 40,2 | % | 863 | 35,3 | % | |||||||||||||||
| Oceania | 8 | 1,4 | % | 11 | 1,7 | % | 55 | 2,2 | % | |||||||||||||||
Total | 540 | 100,0 | % | 681 | 100,0 | % | 2 445 | 100,0 | % | |||||||||||||||
Table of Contents

| Presentation 1st Quarter 2003 Oslo, 29 April 2003 |
Table of Contents

| Bjorn Ove Skjeie Chief Executive Officer |
Table of Contents
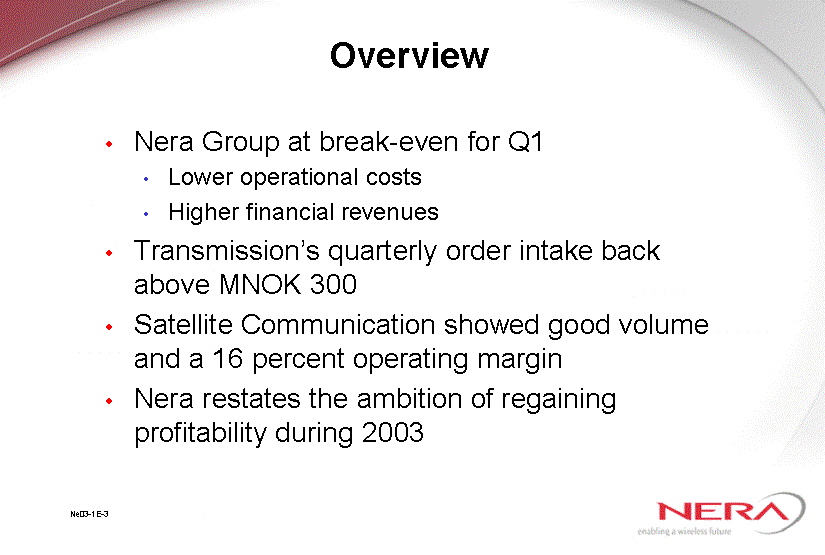
| Overview Nera Group at break-even for Q1 Lower operational costs Higher financial revenues Transmission's quarterly order intake back above MNOK 300 Satellite Communication showed good volume and a 16 percent operating margin Nera restates the ambition of regaining profitability during 2003 |
Table of Contents

| Key figures (Amounts in NOK mill.) 1ST QUARTER 1ST QUARTER TOTAL 2003 2002 2002 ORDERS RECEIVED 591 632 2 519 OPERATING REVENUES 540 681 2 445 EBIT -25 -43 -144 PRE-TAX PROFIT 2 -36 -162 |
Table of Contents

| Quarterly orders received by business area |
Table of Contents

| Market outlook (1) Transmission Networks market Still weak development in mobile networks Positive potential for Nera in other segments Still positive development for Fixed Wireless Access - Nera expands geographical scope |
Table of Contents

| Quarterly orders received by market Transmission Networks |
Table of Contents

| Market outlook (2) Satellite market Land-mobile market expected to level out gradually Introduction of new products expected to bring growth to maritime market Still stable, high activity in the gateway market New areas of use increase sales of satellite phones Satellite broadband market seems digital by nature - - no major contracts expected in Q2 |
Table of Contents

| Market outlook (3) Other business IT Networks stable Still weak outlook for Contract Manufacturing |
Table of Contents

| OPEX Development ^ R&D - sales & admin. expenses ^ Nera Group ^ Transmission Networks (Distributed cost Nera Singapore not included) |
Table of Contents

| Efficiency improvement programs 2003 Supply chain improvement under implementation: Effect - up to 90 man-years Other efficiency EMEA improvement initiatives: Effect - 10 to 20 man-years Further initiatives following conclusions from sourcing studies under implementation |
Table of Contents

| Ambitions ahead Regain profitability during 2003 Continued focus on making Transmission business more efficient Secure Transmission business volume above MNOK 300 per quarter throughout 2003 Further strengthen Satellite Communication's market position |
Table of Contents

| Bjorn Olafsson Chief Financial Officer |
Table of Contents

| Financial highlights Q1 financials are favourably affected by Continued excellent performance in Satellite Communications Cost reductions yielding visible results Exceptional net financial result |
Table of Contents
| Income statements |
Table of Contents
| Operating profit before special charges by business area |
Table of Contents

| 1997 1998 1999 2000 2001 2002 Q1-03 Gross margin % 33 25 30 30 28 21 21 Oper. margin % 2.8 4 8.5 8.9 7.3 -12.3 -15.8 North 45.9 46.9 45 43.9 1997 1998 1999 2000 2001 2002 Q1-03 Gross margin % 35 30 33 40 36 35 37 Oper. margin % 9.1 2 4.9 13.8 10.8 11.2 16 45.9 46.9 45 Margin development Transmission/Satellite Transmission Satellite |
Table of Contents
| Balance Sheets |
Table of Contents

| Net cash position (Cash - interest bearing debt) Q4 - 1995 Q4 - 1996 Q2 - 1997 Q4 - 1997 Q2 - 1998 Q3 - 1998 Q4 - 1998 Q1 - 1999 Q2 - 1999 Q3 - 1999 Q4 - 1999 Q1 - 2000 Q2 - 2000 Q3 - 2000 Q4 - 2000 Q1 - 2001 Q2 - 2001 Q3 - 2001 Q4 - 2001 Q1 - 2002 Q2 - 2002 MNOK Q3 - 2002 Q4 - 2002 Nera Singapore Nera Norway Q1 - 2003 |
Table of Contents
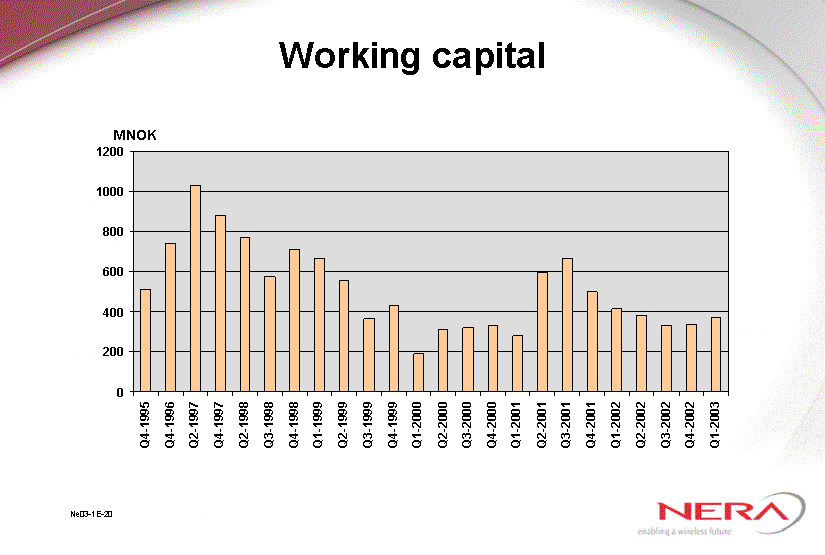
| Working capital Q4-1995 Q4-1996 Q2-1997 Q4-1997 Q2-1998 Q3-1998 Q4-1998 Q1-1999 Q2-1999 Q3-1999 Q4-1999 Q1-2000 Q2-2000 Q3-2000 Q4-2000 Q1-2001 Q2-2001 Q3-2001 Q4-2001 Q1-2002 Q2-2002 Q3-2002 Q4-2002 Q1-2003 East 510 739 1028 881 773 573 713 666 556 367 431 190 309 322 331 280 595 664 498 412 379 330 336.4 373.9 West 30.6 38.6 34.6 31.6 North 45.9 46.9 45 43.9 MNOK |
Table of Contents

| Trade receivables/ Inventories/trade payables (days) 1995 1996 1997 1998 1999 2000 2001 2002 Q1-03 Receivables 76 91 102 88 77 111 97 76 96 Inventories 82 77 67 51 40 38 67 56 59 Payables 41 43 48 48 29 45 53 46 50 Days |
Table of Contents
| Statements of cash flows |
Table of Contents
| Financial key figures |
Table of Contents

| Q & A Oslo, 17 February 2003 |
Table of Contents

| Appendix |
Table of Contents
| Orders received by business area |
Table of Contents
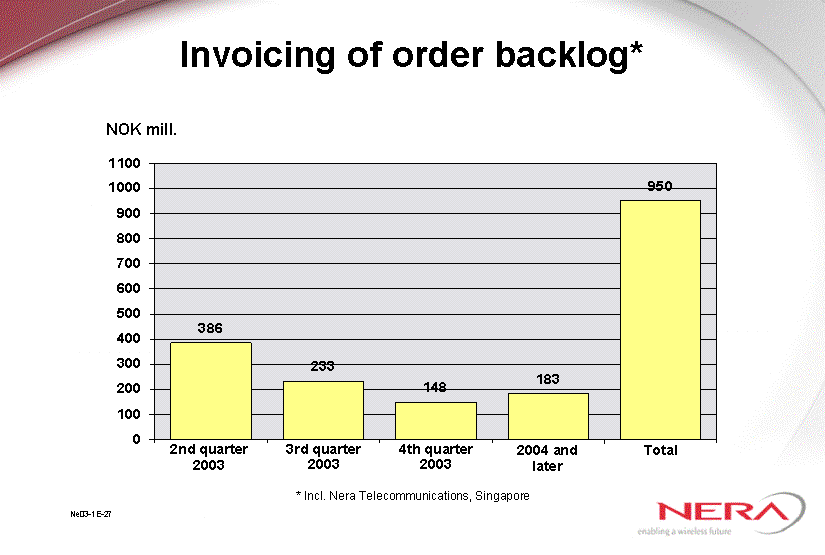
| Invoicing of order backlog* 2nd quarter 2003 3rd quarter 2003 Total NOK mill. 2004 and later 4th quarter 2003 * Incl. Nera Telecommunications, Singapore |
Table of Contents

| Operating revenue by business area |
Table of Contents

| Quarterly operating revenue by business area |
Table of Contents
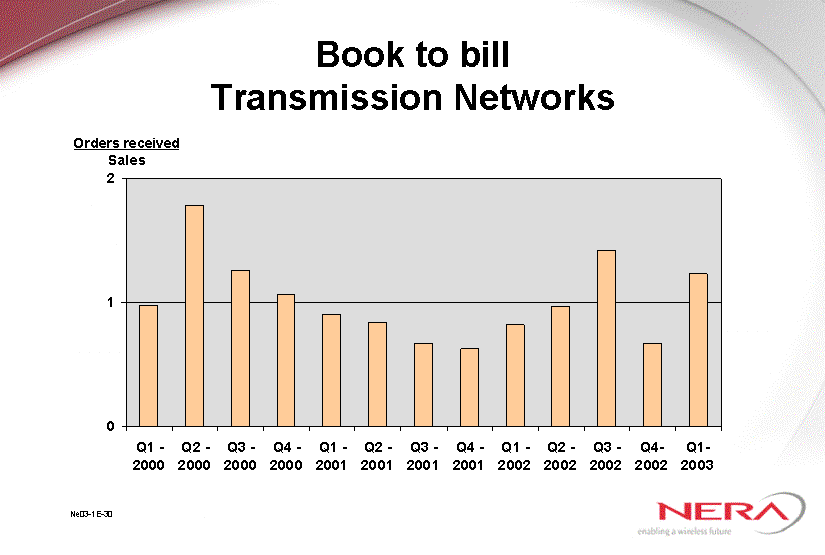
| Book to bill Transmission Networks Q1 - 2000 Q2 - 2000 Q3 - 2000 Q4 - 2000 Q1 - 2001 Q2 - 2001 Q3 - 2001 Q4 - 2001 Q1 - 2002 Q2 - 2002 Q3 - 2002 Q4-2002 Q1-2003 Orders received/Sales 0.9787 1.7837 1.2585 1.0626 0.9014 0.8364 0.6687 0.6239 0.8175 0.9678 1.42 0.6645431 1.2325581 West 30.6 38.6 34.6 31.6 North 45.9 46.9 45 43.9 Orders received Sales |
Table of Contents
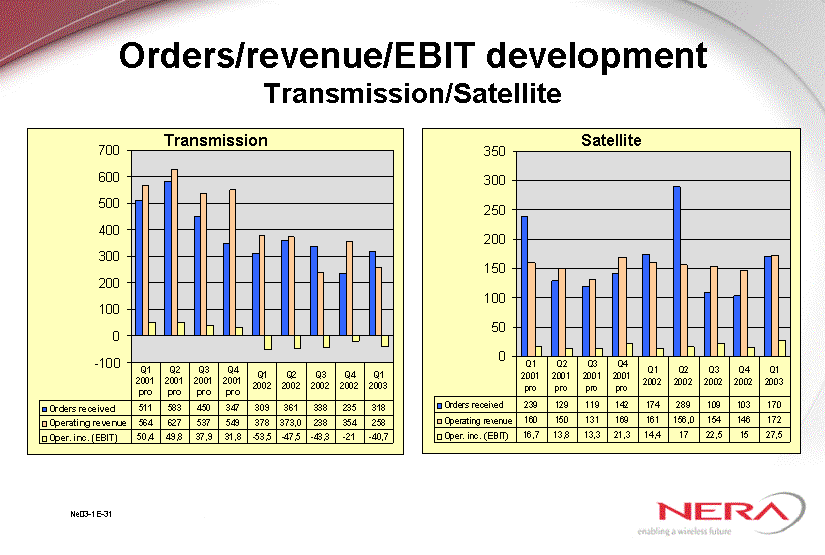
| Q1 2001 pro forma Q2 2001 pro forma Q3 2001 pro forma Q4 2001 pro forma Q1 2002 Q2 2002 Q3 2002 Q4 2002 Q1 2003 Orders received 511 583 450 347 309 361 338 235 318 Operating revenue 564 627 537 549 378 373 238 354 258 Oper. inc. (EBIT) 50.4 49.8 37.9 31.8 -53.5 -47.5 -43.3 -21 -40.7 Q1 2001 pro forma Q2 2001 pro forma Q3 2001 pro forma Q4 2001 pro forma Q1 2002 Q2 2002 Q3 2002 Q4 2002 Q1 2003 Orders received 239 129 119 142 174 289 109 103 170 Operating revenue 160 150 131 169 161 156 154 146 172 Oper. inc. (EBIT) 16.7 13.8 13.3 21.3 14.4 17 22.5 15 27.5 Orders/revenue/EBIT development Transmission/Satellite Transmission Satellite |
Table of Contents

| Quarterly operating revenue by market Transmission Networks |
Table of Contents

| WBA - quarterly "fixed" cost level (R&D + sales and admin.) Q2-2000 Q3-2000 Q4-2000 Q1-2001 Q2-2001 Q3-2001 Q4-2001 Q1-2002 Q2-2002 Q3-2002 Q4-2002 Q1-2003 East 20 33 43 58 71 51 45 19 16 17 16 14 West 30.6 38.6 34.6 31.6 North 45.9 46.9 45 43.9 MNOK |
Table of Contents

| Orders received by market |
Table of Contents

| Orders received by market Asia 35.9% (32.4%)* Percentage per region by 31 March 2003 Africa 1.1% (8.1%)* Americas 22.6% (28.2%)* Oceania 3.6% (3.3%)* UK 3.8% (2.4%)* Norway 15.2% (9.9%)* Rest of Europe 17.7% (15.7%)* * Figures in brackets are Orders received per 31.03.02 |
Table of Contents

| Operating revenue by market |
Table of Contents

| Operating margins* before R&D 1996 1997 1998 1999 2000 2001 2002 Per 31.03.2003 East 0.139 0.114 0.09 0.142 0.153 0.062 0.069 0.047 MNOK 1996 1997 1998 1999 2000 2001 2002 per quarter 2003 per quarter 3-D Column 193 204 200 216 287 347 79 50 51 51 59 (6,6%)* (7,8%)* Research & Development 347 (9.5%)* * Operating income before R& D as % of sales revenue (1) Adjusted for special charges * R&D as % of sales revenue (11,3%)* 240 (9.8%)* (9.3%)* |
Table of Contents

| Working capital in % of annualised sales Q4-1995 Q4-1996 Q2-1997 Q4-1997 Q2-1998 Q3-1998 Q4-1998 Q1-1999 Q2-1999 Q3-1999 Q4-1999 Q1-2000 Q2-2000 Q3-2000 Q4-2000 Q1-2001 Q2-2001 Q3-2001 Q4-2001 Q1-2002 Q2-2002 Q3-2002 Q4-2002 Q1-2003 East 19 31 34 24 29 20 20 23 20 14 15 8 14 15 10 10 20 26 16 15 15 13.5 13.8 17.3 West North 45.9 46.9 45 43.9 % |