Table of Contents
SECURITIES AND EXCHANGE COMMISSION
Washington, DC 20549
FORM 6-K
Report of Foreign Issuer
Rursuant to Rule 13a-16 or 15d-16 of the
Securities Exchange Act of 1934
For Q1-2004 Results
Nera ASA
Kokstadveien 23, P.O. Box 7090
N-5020 BERGEN
Norway
N-5020 BERGEN
Norway
Indicate by check mark whether the registrant files or will file annual reports under cover of Form 20-F or Form 40-F.
| Form 20-Fx | Form 40-Fo |
Indicate by ckeck mark whether the registrant by furnishing the information continued in this Form is also thereby furnishing the information to the Commission pursuant to Rule 12g3-2(b) under the Securities Exchange Act of 1934.
| Yeso | Nox |
If “Yes” is marked, indicate below the file number assigned to the registrant in connection with Rule 12g3- 2(b):
TABLE OF CONTENTS
| SIGNATURES | ||||||||
Table of Contents
SIGNATURES
Pursuant to the requirements of the Securities Exchange Act of 1934, the registrant has duly caused this report to be signed on its behalf by the undersigned, thereunto duly authorised.
| Nera ASA | ||||||
| By: | Bjørn Ove Skjeie (sign.) | |||||
| Dated: April 28, 2004 | Name: Title: | Bjørn Ove Skjeie President and Chief Executive Officer | ||||
Table of Contents

PRESS RELEASE, 28 April, 2004
Nera ASA
Postal Address
P.O. Box 7090, N-5020 BERGEN, Norway,
Office Address
Kokstadvn. 23, BERGEN, Norway,
Tel.No. +47 55 22 51 00
Fax.No. +47 55 22 52 99
Head Office
Nera ASA, 5020 BERGEN
Register of Business Enterprises
NO 944 536 949 MVA
Nera ASA: Results in Q1 2004
Nera ASA (OSE: NER) reports increased market activity and expected growth in the upcoming quarters. The company had operating revenues in Q1 2004 of NOK 515 million, compared to NOK 540 million in Q1 2003. The operating loss for the quarter was NOK 23.2 million, compared to a loss of NOK 24.6 million in Q1 2003.
| • | Operating loss in Q1 was NOK 23.2 million compared to a loss of NOK 24.6 million in Q1 2003 | |||
| • | Orders received in Q1 were at NOK 593 million compared to NOK 591 million in Q1 2003 | |||
| • | Transmission Networks received new orders to a value of NOK 280 million in Q1 and posted an operating loss of NOK 28.9 million for the quarter | |||
| • | Satellite Communications received orders to a value of NOK 130 million and made an operating profit of NOK 17.6 million | |||
| • | The equity ratio as at 31 March 2004 was 59.4 percent. | |||
| Figures in NOK mill. | Q1 2004 | Q1 2003 | 2003 | |||||||||
| Orders received | 592.8 | 591.3 | 2 157.7 | |||||||||
| Operating revenues | 515.1 | 539.7 | 2 252.7 | |||||||||
| Operating profit | (23.2 | ) | (24.6 | ) | (53.7 | ) | ||||||
| Profit (loss) before tax | (18.4 | ) | 1.9 | (16.7 | ) | |||||||
| Earnings per share | (0.23 | ) | (0.05 | ) | (0.43 | ) | ||||||
“A distinct and positive change has occurred in Nera’s markets during March and April. The trend is noticeable at macro level and in the industry’s development, as well as in a long list of market opportunities. The changes have already resulted in an increase in orders received, of which a NOK 100 million order for InterLink equipment to a leading mobile operator in South America is a clear indication”, said Bjørn Ove Skjeie, President and CEO of Nera. “Q1 results are not satisfactory, but during this period we have laid further foundation for new growth for Nera. We now have a broader and more solid market platform than ever, and expect to reap larger business volumes from all business segments in the next quarters. At the same time, we will continue to curb expenses. All these factors contribute to the foundation for profitable growth, and we expect to see positive results going forward”, said Bjørn Ove Skjeie.
For further information, please contact:
Helge Skaar, Director of Corporate Communications Nera ASA,
+47 55 22 58 20 (office), +47 90 14 20 40 (mobile) or hsk@nera.no
Odd Bjørn Ur, Director of Investor Relations, Nera ASA
+47 55 22 55 71 (office), +47 90 14 14 83 (mobile) or obu@nera.no
or
www.nera.no
Table of Contents
First quarter report 2004
Unaudited

Table of Contents
Nera ASA Q1–04
The Nera Group’s turnover and operating profit in first quarter of 2004 is on level with the first quarter of the previous year. Higher market activity and orders received indicate a positive development for the company in the upcoming quarters.
Orders received and the market situation
The Nera Group received new orders to a value of NOK 593 million in Q1 2004, on level with Q1 2003. Orders received are NOK 62 million above Q4 2003.
Transmission Networks received new orders to a value of NOK 280 million, compared to NOK 318 million in Q1 2003 and on level with the previous quarter. The largest orders were booked in the Philippines, Jamaica, Argentina and North-Africa. In addition to several contracts from Ericsson, Nera also saw the first significant tangible result from the company’s partnership with Nortel.
The transmission networks market activity is trending positively in all regions and market segments, although this positive trend has yet to materialise into a considerable increase in orders received. Nera’s competitiveness is strengthened through a wider and improved product portfolio and new market approaches.
Satellite Communications received orders to a value of NOK 130 million, which is below Q1 2003’s record-high NOK 170 million, but a slight improvement on Q4 2003.
Nera has received a number of new orders for terminal products, especially for the new data and telecommunications terminal for larger vessels, the Nera Fleet 77. The land earth station market segment has shown less activity than in previous quarters, but is expected to improve in the upcoming quarters.
Wireless Broadband Access received orders to a value of NOK 39 million, compared to NOK 9 million in Q1 of last year and NOK 41 million in Q4 of 2003. In addition to orders received from the Norwegian market, new broadband orders have been booked in Greece and Italy. New broadband via satellite orders have been signed with Shinsat of Thailand and Divona of Monaco.
“Other business” received orders worth NOK 144 million in Q1 2004, compared to NOK 93 million last year and NOK 78 million in Q4 2003. The increase in order intake for this quarter is primarily connected with a major IT contract with an international telecommunications operator for deliveries to several Southeast Asian countries. The IT networks market is currently showing greater momentum than for the past several quarters.
Operations
Operating revenues for Q1 2004 were NOK 515 million, compared to NOK 540 million for Q1 2003. Operating revenues for Q4 2003 were NOK 659 million. (Fourth quarter generally yields strong revenues).
Transmission Networks had operating revenues of NOK 247 million, compared to NOK 258 million in the first quarter of 2003. Satellite Communications had a turnover of NOK 143 million, compared to NOK 172 million in 2003. Broadband had operating revenues of NOK 54 million, compared to NOK 31 million last
Table of Contents
year, while Other business had operating revenues of NOK 71 million for the quarter, compared to NOK 78 million for Q1 2003.
Operating expenses for Q1 2004 were NOK 473 million, compared to NOK 494 million in 2003, while R&D costs were NOK 47 million, compared to NOK 50 million last year.
The operating loss for the quarter was NOK 23.2 million, compared to a loss of NOK 24.6 million for Q1 2003. Transmission Networks has curbed its loss considerably compared to last year, but Satellite Communications has performed poorer due to a less favourable product mix.
Satellite Communications produced an operating profit of NOK 17.6 million, compared to NOK 27.5 million last year. The operating margin for Satellite Communications in Q1 2004 was 12.3 percent, while the gross margin was 35.3 percent. Transmission Networks produced an operating loss of NOK 28.9 million, compared to a loss of NOK 40.7 million in Q1 2003. The gross margin was 24.1 percent. Wireless Broadband Access produced a loss of NOK 11.8 million in Q1, compared to a loss of NOK 11.5 million last year. Other business had an operating loss of NOK 0.1 million, compared to a profit of NOK 0.2 million last year.
Financial income and profit (loss) before/after tax
Nera’s total financial income in Q1 2004 was NOK 4.8 million, of which ordinary financial income constituted NOK 2.8 million and income from associated companies constituted NOK 2.0 million. In Q1 of last year, the company’s total financial income was NOK 26.6 million, of which NOK 24.9 million was ordinary financial income and NOK 1.7 mi llion was income from associated companies. Last year’s high financial income derived from the sale of shares in the company TV Mobile and from foreign exchange earnings.
For Q1 2004, the loss before tax was NOK 18.4 million, compared to a profit of NOK 1.9 million in Q1 2003. The Group had a loss after tax and minority interests of NOK 27.5 million, compared to a loss of NOK 6.1 million last year.
Balance sheets and liquidity
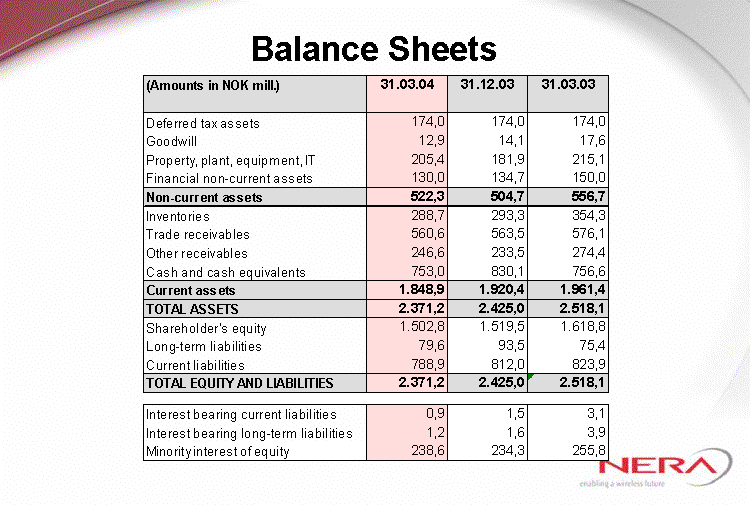
As at 31 March 2004, Nera’s total assets were NOK 2,371 million, compared to NOK 2,518 million as at 31 March of 2003. Compared to year-end 2003, the balance sheet is NOK 54 million less. The bulk of the reduction since 31 March 2003 can be attributed to a reduction in inventories.
Liquid assets constitute NOK 753 million as at 31 March 2003 – on level with the close of Q1 2003, but NOK 77 million less than at year-end 2003. The reduction in liquid assets since year-end 2003 is attributable to the settlement for a property in Bergen, for which the Nera has exercised the company’s pre-emptive right to purchase. It can also in part by attributed to seasonal variations, which generally entail relatively heavy charges against liquidity in the year’s first quarter, compared to the later quarters of the year.
The equity ratio as at 31 March 2004 was 63.4 percent.
Table of Contents
Prospects
Activity in the transmission networks markets is on the increase, and the corporate management therefore anticipates an increase in orders received and turnover in the upcoming quarters. Nera’s product portfolio has rendered the company more competitive, and Nera’s market position has improved in several segments.
The sale of satellite communications terminals is expected to retain the current level, while the land earth station market is expected to improve during the course of the year.
An increase in market activity is expected for both Wireless Broadband Access and Other business.
Nera expects an increase in turnover to produce an operating profit in Q2 2004.
The quarterly report applies same accounting principles as are used in the company’s annual report. The quarterly report is prepared in accordance with the accounting standard for quarterly reporting.
Bergen, 27 April 2004
Table of Contents
| Profit and Loss Account | Figures in NOK million |
| | 1.1.-31.3.2004 | 1.1.-31.3.2003 | Year 2003 | |||||||||
| Orders received | 592,8 | 591,3 | 2 157,7 | |||||||||
| Operating revenues | 515,1 | 539,7 | 2 252,7 | |||||||||
| Operating expenses | (472,9 | ) | (494,1 | ) | (2 024,1 | ) | ||||||
| Depreciation | (18,7 | ) | (20,2 | ) | (79,8 | ) | ||||||
Operating profit before R&D costs | 23,5 | 25,4 | 148,8 | |||||||||
| Research and development | (46,7 | ) | (50,0 | ) | (174,2 | ) | ||||||
Operating profit (loss) before restructuring and write-downs | (23,2 | ) | (24,6 | ) | (25,4 | ) | ||||||
| Restructuring and write-downs | (28,3 | ) | ||||||||||
Operating profit (loss) | (23,2 | ) | (24,6 | ) | (53,7 | ) | ||||||
| Profit (loss) from investments in associated comp. | 2,0 | 1,7 | 11,0 | |||||||||
| Net financial items | 2,8 | 24,9 | 26,0 | |||||||||
Profit (loss) before tax | (18,4 | ) | 1,9 | (16,7 | ) | |||||||
| Taxes | (5,7 | ) | 0,3 | (13,0 | ) | |||||||
Net profit (loss) | (24,1 | ) | 2,2 | (29,7 | ) | |||||||
| Minority interests | (3,4 | ) | (8,3 | ) | (23,0 | ) | ||||||
Net profit (loss) after minority interests | (27,5 | ) | (6,1 | ) | (52,7 | ) | ||||||
Earnings per share, primary (NOK) | (0,23 | ) | (0,05 | ) | (0,43 | ) | ||||||
Earnings per share, diluted (NOK) | (0,23 | ) | (0,05 | ) | (0,43 | ) | ||||||
Table of Contents
| Balance Sheet | Figures in NOK million |
| | 31.3.2004 | 31.12.2003 | 31.3.2003 | |||||||||
| Deferred tax assets | 174,0 | 174,0 | 174,0 | |||||||||
| IT software | 25,5 | 23,1 | 24,6 | |||||||||
| Goodwill | 12,9 | 14,1 | 17,6 | |||||||||
| Tangible fixed assets | 179,9 | 158,8 | 190,5 | |||||||||
| Fixed asset investments | 130,0 | 134,7 | 150,0 | |||||||||
Fixed assets | 522,3 | 504,7 | 556,7 | |||||||||
| Stocks | 288,7 | 293,3 | 354,3 | |||||||||
| Account receivable | 560,6 | 563,5 | 576,1 | |||||||||
| Other current receivables | 246,6 | 233,4 | 274,4 | |||||||||
| Liquid assets | 753,0 | 830,1 | 756,6 | |||||||||
Current assets | 1 848,9 | 1 920,3 | 1 961,4 | |||||||||
ASSETS | 2 371,2 | 2 425,0 | 2 518,1 | |||||||||
| Called-up and fully paid share capital | 409,1 | 409,1 | 1 467,0 | |||||||||
| Retained earnings (incl. minority interests) | 1 093,7 | 1 110,4 | 1 51,8 | |||||||||
Equity | 1 502,8 | 1 519,5 | 1 618,8 | |||||||||
| Provisions for liabilities | 40,5 | 53,0 | 29,7 | |||||||||
| Other long-term liabilities | 39,1 | 40,5 | 45,7 | |||||||||
| Current liabilities | 788,8 | 812,0 | 823,9 | |||||||||
Liabilities | 868,4 | 905,5 | 899,3 | |||||||||
EQUITY AND LIABILITIES | 2 371,2 | 2 425,0 | 2 518,1 | |||||||||
| Interest bearing current liabilities | 0,9 | 1,5 | 3,1 | |||||||||
| Interest bearing long-term liabilities | 1,2 | 1,6 | 3,9 | |||||||||
| Minority interests | 238,6 | 234,3 | 255,8 | |||||||||
Change in equity : | ||||||||||||
| Equity as at 01.01 | 1 519,5 | 1 612,6 | 1 612,6 | |||||||||
| Net profit (loss) | (24,1 | ) | (29,7 | ) | 2,2 | |||||||
| Dividend | (50,3 | ) | ||||||||||
| Conversion differences | 7,3 | (13,1 | ) | 4.0 | ||||||||
Equity as at end of period | 1 502,8 | 1 519,5 | 1 618,8 | |||||||||
Table of Contents
| Cash Flow Statement | Figures in NOK million |
| | 1.1.-31.3.2004 | 1.1.-31.3.2003 | Year 2003 | |||||||||
| Net profit (loss) | (24,1 | ) | 2,2 | (29,7 | ) | |||||||
| Ordinary depreciation | 18,7 | 20,2 | 79,8 | |||||||||
| Change in inventories, trade receivables, advance billings, etc. | (8,0 | ) | 5,6 | 21,9 | ||||||||
| Other operational related adjustments | (36,7 | ) | (72,6 | ) | 4,8 | |||||||
Net cash provided by (used in) operating activities | (50,1 | ) | (44,5 | ) | 76,8 | |||||||
| Proceeds from sales of property, plant and equipment | 0,2 | 0,7 | 2,5 | |||||||||
| Capital expenditures | (34,3 | ) | (9,5 | ) | (38,2 | ) | ||||||
| Other investments and proceeds | 9,0 | 21,4 | 24,3 | |||||||||
Net cash provided by (used in) investing activities | (25,1 | ) | 12,6 | (11,4 | ) | |||||||
| Dividends paid | (5,8 | ) | ||||||||||
| Net changes in liabilities | (1,0 | ) | (2,2 | ) | (6,0 | ) | ||||||
Net cash provided by (used in) financing activities | (1,0 | ) | (2,2 | ) | (11,7 | ) | ||||||
| Effect of changes in currency exchange rates | (0,9 | ) | (5,1 | ) | (19,4 | ) | ||||||
Net change in cash and cash equivalents | (77,1 | ) | (39,2 | ) | 34,3 | |||||||
Cash and cash equivalents at beginning of period | 830,1 | 795,8 | 795,8 | |||||||||
Cash and cash equivalents at end of period | 753,0 | 756,6 | 830,1 | |||||||||
Table of Contents
| Orders received by Business Area | Figures in NOK million |
| Business Areas | 1.1.-31.3.2004 | | 1.1.-31.3.2003 | | Year 2003 | | ||||||||||||||||||
| Transmissions Networks | 280 | 47,2 | % | 318 | 53,9 | % | 1 213 | 56,2 | % | |||||||||||||||
| Mobile Satellite Communiciations | 130 | 21,9 | % | 170 | 28,8 | % | 496 | 23,0 | % | |||||||||||||||
| Wireless Broadband Access | 39 | 6,6 | % | 9 | 1,6 | % | 137 | 6,3 | % | |||||||||||||||
| Others/eliminations | 144 | 24,3 | % | 93 | 15,8 | % | 312 | 14,5 | % | |||||||||||||||
Total | 593 | 100,0 | % | 591 | 100,0 | % | 2 158 | 100,0 | % | |||||||||||||||
| Operating revenues by Business Area | Figures in NOK | |||||||||||||||||||||||
| Business Areas | 1.1.-31.3.2004 | | 1.1.-31.3.2003 | | Year 2003 | million | ||||||||||||||||||
| Transmissions Networks | 247 | 48,0 | % | 258 | 47,8 | % | 1 189 | 52,8 | % | |||||||||||||||
| Mobile Satellite Communiciations | 143 | 27,8 | % | 172 | 31,9 | % | 577 | 25,6 | % | |||||||||||||||
| Wireless Broadband Access | 54 | 10,5 | % | 31 | 5,7 | % | 166 | 7,3 | % | |||||||||||||||
| Others/eliminations | 71 | 13,8 | % | 78 | 14,5 | % | 321 | 14,2 | % | |||||||||||||||
Total | 515 | 100,0 | % | 540 | 100,0 | % | 2 253 | 100,0 | % | |||||||||||||||
| Operating Profit (loss) by Business Area | Figures in NOK | |||||||||||||||
| Business Areas | 1.1.-31.3.2004 | 1.1.-31.3.2003 | Year 2003 | million | ||||||||||||
| Transmissions Networks | (28,9 | ) | (40,7 | ) | (71,2 | ) | ||||||||||
| Mobile Satellite Communiciations | 17,6 | 27,5 | 87,2 | |||||||||||||
| Wireless Broadband Access | (11,8 | ) | (11,5 | ) | (40,3 | ) | ||||||||||
| Others/eliminations | (0,1 | ) | 0,2 | (1,0 | ) | |||||||||||
Total | (23,2 | ) | (24,6 | ) | (25,4 | ) | ||||||||||
Table of Contents
| Orders received by market area | Figures in NOK million |
| Market area | 1.1.-31.3.2004 | | 1.1.-31.3.2003 | | Year 2003 | | ||||||||||||||||||
| Norway | 55 | 9,3 | % | 90 | 15,2 | % | 294 | 13,6 | % | |||||||||||||||
| Great Britain | 22 | 3,7 | % | 22 | 3,8 | % | 71 | 3,3 | % | |||||||||||||||
| Rest of Europe | 132 | 22,3 | % | 105 | 17,7 | % | 485 | 22,5 | % | |||||||||||||||
| America | 106 | 17,9 | % | 134 | 22,6 | % | 518 | 24,0 | % | |||||||||||||||
| Africa | 32 | 5,4 | % | 7 | 1,1 | % | 64 | 3,0 | % | |||||||||||||||
| Asia | 244 | 41,2 | % | 212 | 35,9 | % | 661 | 30,6 | % | |||||||||||||||
| Oceania | 2 | 0,3 | % | 21 | 3,6 | % | 65 | 3,0 | % | |||||||||||||||
Total | 593 | 100,0 | % | 591 | 100,0 | % | 2 158 | 100,0 | % | |||||||||||||||
| Figures | ||||||||||||||||||||||||
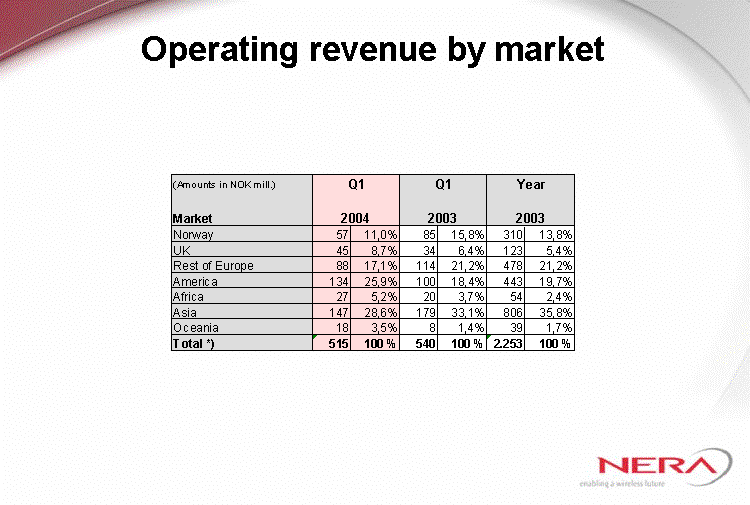
| Operating revenues by market area | in NOK | |||||||||||||||||||||||
| Market area | 1.1.-31.3.2004 | | 1.1.-31.3.2003 | | Year 2003 | million | ||||||||||||||||||
| Norway | 57 | 11,0 | % | 85 | 15,8 | % | 310 | 13,8 | % | |||||||||||||||
| Great Britain | 45 | 8,7 | % | 34 | 6,4 | % | 123 | 5,4 | % | |||||||||||||||
| Rest of Europe | 88 | 17,1 | % | 114 | 21,2 | % | 478 | 21,2 | % | |||||||||||||||
| America | 133 | 25,9 | % | 100 | 18,4 | % | 443 | 19,7 | % | |||||||||||||||
| Africa | 27 | 5,2 | % | 20 | 3,7 | % | 54 | 2,4 | % | |||||||||||||||
| Asia | 147 | 28,6 | % | 179 | 33,1 | % | 806 | 35,8 | % | |||||||||||||||
| Oceania | 18 | 3,5 | % | 8 | 1,4 | % | 39 | 1,7 | % | |||||||||||||||
Total | 515 | 100,0 | % | 540 | 100,0 | % | 2 253 | 100,0 | % | |||||||||||||||
Table of Contents
| Oslo, April 28, 2004 Ne03-3E-1 Q1 Presentation 2004 |
Table of Contents

| Bjorn Ove Skjeie Chief Executive Officer |
Table of Contents

| New growth materialising Market characteristics: Macro indicators positive Industrial signals positive Nera's prospect and order platform confirm upswing |
Table of Contents

| Americas: Improved market position starting to pay off Announcing: A contract in the region of 100 MNOK with a leading mobile operator in South-America Nortel: first contract signed - further projects in the pipeline New relations to key players Telefonica and TIM Strengthening position in Central-America and the Caribbean Repeat orders from Ericsson, BellSouth and other long time clients InterLink Compact LInk |
Table of Contents

| Asia: New markets add order intake Nera has repositioned in India and China Repeat orders from first tier operators in Indonesia, Philippines and Malaysia Regional pick up for IT-business |
Table of Contents

| EMEA: Still mixed, but market picking up Several new orders in North-Africa & Middle- East Improved position and higher activity in Latin- Europe New approaches into interesting markets starting to pay off Pending orders in eastern Europe eastern Europe eastern Europe eastern Europe eastern Europe eastern Europe eastern Europe eastern Europe eastern Europe eastern Europe eastern Europe eastern Europe eastern Europe eastern Europe eastern Europe eastern Europe eastern Europe eastern Europe eastern Europe eastern Europe eastern Europe eastern Europe eastern Europe |
Table of Contents
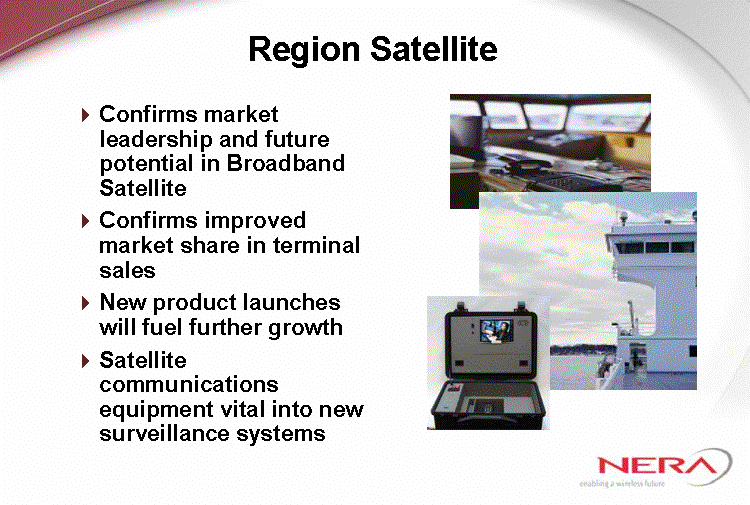
| Region Satellite Confirms market leadership and future potential in Broadband Satellite Confirms improved market share in terminal sales New product launches will fuel further growth Satellite communications equipment vital into new surveillance systems surveillance systems surveillance systems surveillance systems surveillance systems surveillance systems surveillance systems surveillance systems surveillance systems surveillance systems surveillance systems surveillance systems surveillance systems surveillance systems surveillance systems surveillance systems surveillance systems surveillance systems surveillance systems surveillance systems surveillance systems surveillance systems surveillance systems surveillance systems surveillance systems surveillance systems surveillance systems |
Table of Contents

| Nera - well positioned for profitable growth |
Table of Contents

| Next quarters: Set for growth Improved business volume expected in all business areas Higher capacity utilisation will give a positive operating result in Q2 |
Table of Contents
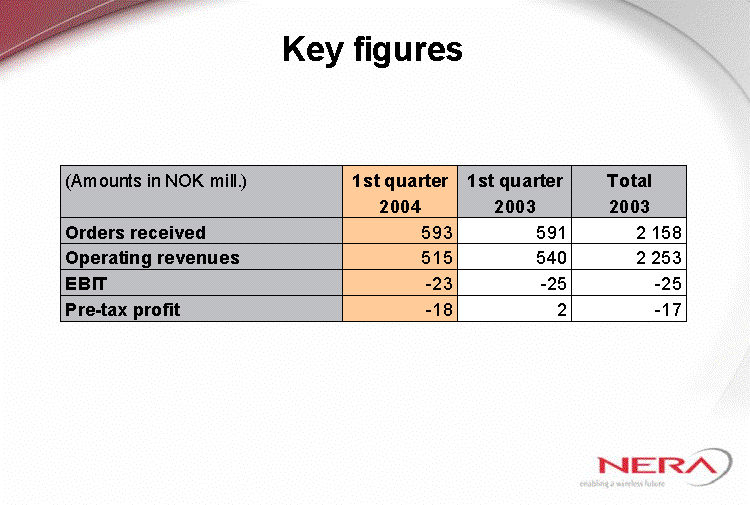
| Key figures |
Table of Contents

| Bjorn Olafsson Chief Financial Officer |
Table of Contents

| Comments to the operation in Q1 Business volume & operating income on level with Q1-03 Improved Transmission business Satellite business still with double digit margin Profitable growth in IT and CM business OPEX back on track |
Table of Contents

| Income statements |
Table of Contents

| Quarterly orders received by Business Area |
Table of Contents

| Quarterly operating revenue by business area |
Table of Contents
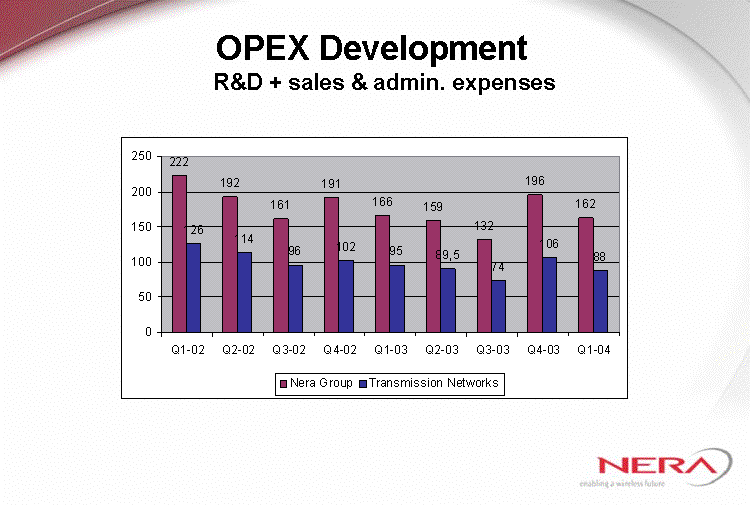
| OPEX Development R&D + sales & admin. expenses |
Table of Contents

| Operating profit by business area |
Table of Contents

| 1997 1998 1999 2000 2001 2002 2003 Q1-04 Gross margin % 33 25 30 30 28 21 24.5 24.1 Oper. margin % 2.8 4 8.5 8.9 7.3 -12.3 -6 -11.7 North 45.9 46.9 45 43.9 1997 1998 1999 2000 2001 2002 2003 Q1 - 04 Gross margin % 35 30 33 40 36 35 39 35 Oper. margin % 9.1 2 4.9 13.8 10.8 11.2 16 12.3 45.9 46.9 45 Margin development Transmission/Satellite Transmission Satellite |
Table of Contents
| Balance Sheets |
Table of Contents

| Net cash position (Cash - interest bearing debt) Q4 - 1995 Q4 - 1996 Q2 - 1997 Q4 - 1997 Q2 - 1998 Q3 - 1998 Q4 - 1998 Q1 - 1999 Q2 - 1999 Q3 - 1999 Q4 - 1999 Q1 - 2000 Q2 - 2000 Q3 - 2000 Q4 - 2000 Q1 - 2001 Q2 - 2001 Q3 - 2001 Q4 - 2001 Q1 - 2002 Q2 - 2002 MNOK Q3 - 2002 Q4 - 2002 Nera Singapore Nera Norway Q1 - 2003 Q3 - 2003 Q2 - 2003 Q4 - 2003 Q1 - 2004 |
Table of Contents

| Trade receivables/ Inventories/trade payables (days) 1995 1996 1997 1998 1999 2000 2001 2002 Q1-03 Q2-03 Q3-03 Q4-03 Q1-04 Receivables 76 91 102 88 77 111 97 76 96 78 87 90 98 Inventories 82 77 67 51 40 38 67 56 59 53 54 47 50 Payables 41 43 48 48 29 45 53 46 50 46 44 43 47 Days |
Table of Contents

| Statement of cash flows |
Table of Contents
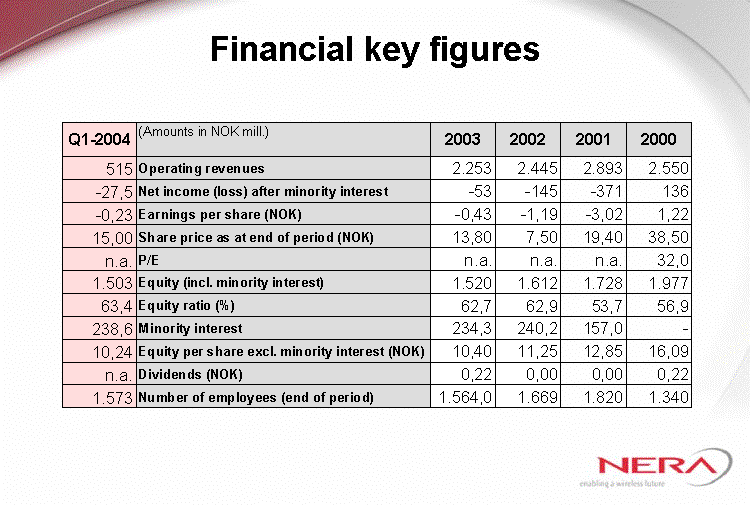
| Financial key figures |
Table of Contents

| Book to bill Transmission Networks Q1 - 2000 Q2 - 2000 Q3 - 2000 Q4 - 2000 Q1 - 2001 Q2 - 2001 Q3 - 2001 Q4 - 2001 Q1 - 2002 Q2 - 2002 Q3 - 2002 Q4-2002 Q1-2003 Q2-2003 Q3-2003 Q4-2003 Q1-2004 Orders received/Sales 0.9787 1.7837 1.2585 1.0626 0.9014 0.8364 0.6687 0.6239 0.8175 0.9678 1.42 0.6645431 1.2325581 1.26 0.86 0.8 1.13 West 30.6 38.6 34.6 31.6 North 45.9 46.9 45 43.9 Orders received Sales |
Table of Contents

| Invoicing of order backlog* 2nd quarter 2004 3rd quarter 2004 Total NOK mill. 1st quarter 2005 4th quarter 2004 * Incl. Nera Telecommunications, Singapore |
Table of Contents

| Next quarters: Set for growth Improved business volume expected in all business areas Higher capacity utilisation will give a positive operating result in Q2 |
Table of Contents

| Appendix |
Table of Contents
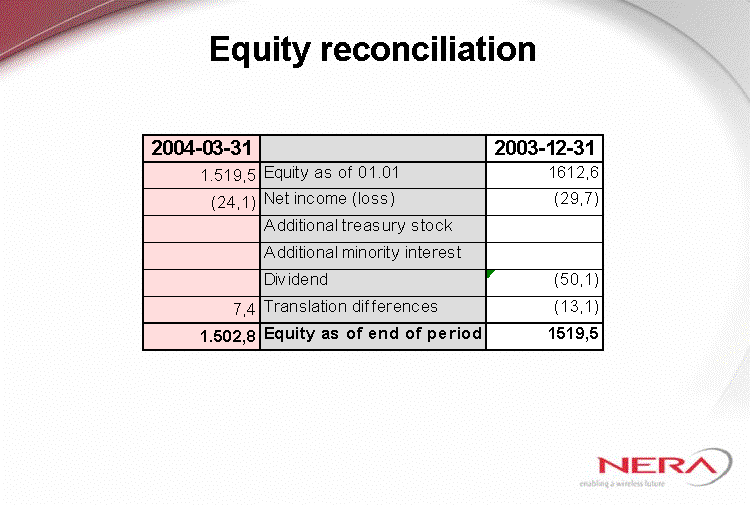
| Equity reconciliation |
Table of Contents

| Orders received by business area |
Table of Contents

| Operating revenues by business area |
Table of Contents

| Q1 2001 pro forma Q2 2001 pro forma Q3 2001 pro forma Q4 2001 pro forma Q1 2002 Q2 2002 Q3 2002 Q4 2002 Q1 2003 Q2 2003 Q3 2003 Q4 2003 Q1 2004 Orders received 511 583 450 347 309 361 338 235 318 368 236 291 280 Operating revenue 564 627 537 549 378 373 238 354 258 293 276 362 247 Oper. inc. (EBIT) 50.4 49.8 37.9 31.8 -53.5 -47.5 -43.3 -21 -40.7 -25.1 -6.6 1.3 -28.9 Q1 2001 pro forma Q2 2001 pro forma Q3 2001 pro forma Q4 2001 pro forma Q1 2002 Q2 2002 Q3 2002 Q4 2002 Q1 2003 Q2 2003 Q3 2003 Q4 2003 Q1 2004 Orders received 239 129 119 142 174 289 109 103 170 126 79 121 130 Operating revenue 160 150 131 169 161 156 154 146 172 142 125 138 143 Oper. inc. (EBIT) 16.7 13.8 13.3 21.3 14.4 17 22.5 15 27.5 25.5 19.8 14.4 17.6 Orders/revenue/EBIT development Transmission/Satellite Transmission Satellite |
Table of Contents
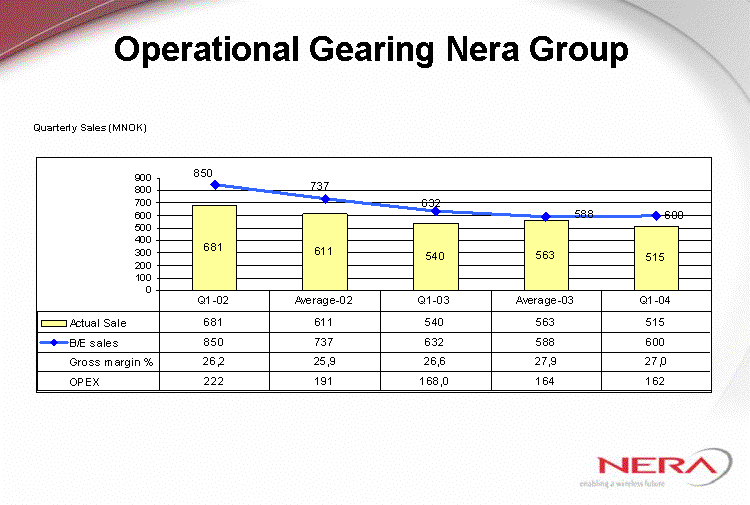
| Operational Gearing Nera Group Quarterly Sales (MNOK) |
Table of Contents

| Operational Target (Short Term) Transmission Networks B/E-Target (Quarterly sales = 325 MNOK) Quarterly Sales (MNOK) B/E Target = 325/Q |
Table of Contents

| Orders received by market |
Table of Contents

| Orders received by market Asia 41.2% (35.9%)* Percentage per region by 31 March 2004 Africa 5.4% (1.1%)* Americas 17.9% (22.6%)* Oceania 0.3% (3.6%)* UK 3.7% (3.8%)* Norway 9.3% (15.2%)* Rest of Europe 22.3% (17.7%)* * Figures in brackets are Orders received per 31.03.03 |
Table of Contents
| Operating revenue by market |
Table of Contents

| Quarterly orders received by market Transmission Networks |
Table of Contents

| Quarterly operating revenue by market Transmission Networks |
Table of Contents
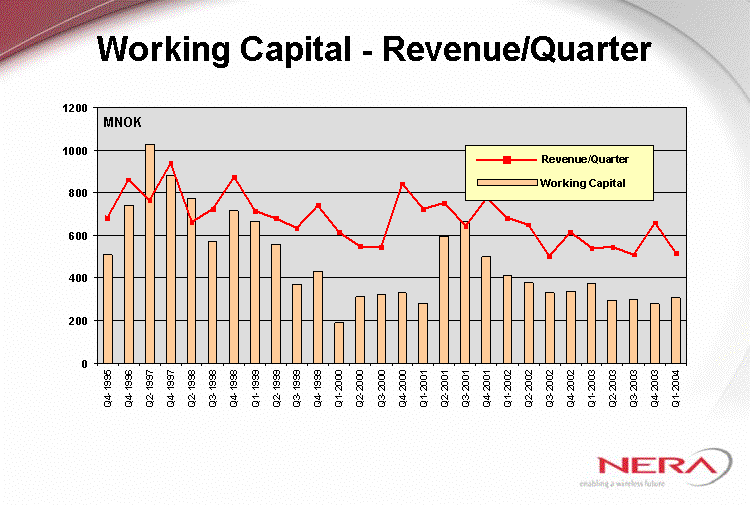
| Working Capital - Revenue/Quarter Q4-1995 Q4-1996 Q2-1997 Q4-1997 Q2-1998 Q3-1998 Q4-1998 Q1-1999 Q2-1999 Q3-1999 Q4-1999 Q1-2000 Q2-2000 Q3-2000 Q4-2000 Q1-2001 Q2-2001 Q3-2001 Q4-2001 Q1-2002 Q2-2002 Q3-2002 Q4-2002 Q1-2003 Q2-2003 Q3-2003 Q4-2003 Q1-2004 Working capital 510 739 1028 881 773 573 713 666 556 367 431 190 309 322 331 280 595 664 498 412 379 330 336.4 373.9 294.5 302 278 308 Revenues/Quarter 683 862 764 937 664 724 874 713 680 635 738 615 548 544 843 724 752 643 774 681 649 501 614 540 545 510 659 515 North 45.9 46.9 45 43.9 MNOK Revenue/Quarter Working Capital |