United States
Securities and Exchange Commission
Washington, D.C. 20549
Form N-CSR
Certified Shareholder Report of Registered Management Investment Companies
811-7309
(Investment Company Act File Number)
Federated Total Return Government Bond Fund
_______________________________________________________________
(Exact Name of Registrant as Specified in Charter)
Federated Investors Funds
4000 Ericsson Drive
Warrendale, Pennsylvania 15086-7561
(Address of Principal Executive Offices)
(412) 288-1900
(Registrant's Telephone Number)
John W. McGonigle, Esquire
Federated Investors Tower
1001 Liberty Avenue
Pittsburgh, Pennsylvania 15222-3779
(Name and Address of Agent for Service)
(Notices should be sent to the Agent for Service)
Date of Fiscal Year End: 2/28/17
Date of Reporting Period: 2/28/17
| Item 1. | Reports to Stockholders |

| Share Class | Ticker |
| Institutional | FTRGX |
| Service | FTGSX |
| R6 | FTGLX |
| 1 | The Fund's R6 Shares commenced operations on June 29, 2016. For the period prior to the commencement of operations of the R6 Shares, the performance information shown is for Institutional Shares adjusted to reflect the expenses of R6 Shares for each year for which the Fund's R6 expenses would have exceeded the actual expenses paid by the Fund's Institutional Shares. |
| 2 | Please see the footnotes to the line graph under “Fund Performance and Growth of a $10,000 Investment” below for the definition of and more information about, the BBGB. |
| 3 | Please see the footnotes to the line graph under “Fund Performance and Growth of a $10,000 Investment” below for the definition of, and more information about, the LIUSGFA. |
| 4 | Duration is a measure of a security's price sensitivity to changes in interest rates. Securities with longer durations are more sensitive to changes in interest rates than other securities of shorter durations. |
| 5 | The value of some mortgage-backed securities may be particularly sensitive to changes in prevailing interest rates and although the securities are generally supported by some form of government or private insurance, there is no assurance that private guarantors or insurers will meet their obligations. |
| 6 | Bond prices are sensitive to changes in interest rates, and a rise in interest rates can cause a decline in their prices. |
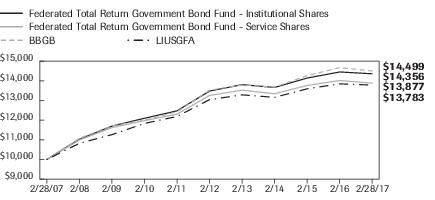
| Federated Total Return Government Bond Fund - | Institutional Shares | Service Shares | NA | BBGB | LIUSGFA |
| F | F | NA | I | I | |
| 2/28/2007 | 10,000 | 10,000 | 10,000 | 10,000 | |
| 2/29/2008 | 11,028 | 10,992 | 11,075 | 10,822 | |
| 2/28/2009 | 11,697 | 11,620 | 11,710 | 11,262 | |
| 2/28/2010 | 12,095 | 11,974 | 11,997 | 11,831 | |
| 2/28/2011 | 12,471 | 12,305 | 12,421 | 12,189 | |
| 2/29/2012 | 13,479 | 13,253 | 13,519 | 13,040 | |
| 2/28/2013 | 13,802 | 13,525 | 13,787 | 13,284 | |
| 2/28/2014 | 13,662 | 13,341 | 13,677 | 13,158 | |
| 2/28/2015 | 14,140 | 13,761 | 14,263 | 13,592 | |
| 2/29/2016 | 14,448 | 14,014 | 14,667 | 13,844 | |
| 2/28/2017 | 14,356 | 13,877 | 14,499 | 13,783 |
| 1 Year | 5 Years | 10 Years | |
| Institutional Shares | -0.64% | 1.27% | 3.68% |
| Service Shares | -0.98% | 0.93% | 3.33% |
| R6 Shares4 | -0.70% | 1.12% | 3.45% |
| BBGB | -1.15% | 1.41% | 3.78% |
| LIUSGFA | -0.44% | 1.10% | 3.14% |
| 1 | The Fund's performance assumes the reinvestment of all dividends and distributions. The BBGB and the LIUSGFA have been adjusted to reflect reinvestment of dividends on securities in the index and average. |
| 2 | The BBGB is a market value weighted index of U.S. government and government agency securities (other than mortgage securities) with maturities of one year or more. Effective August 24, 2016, the name of the BBGB changed from “Barclays U.S. Government Bond Index” to “Bloomberg Barclays U.S. Government Bond Index.” The index is not adjusted to reflect sales charges, expenses or other fees that the Securities and Exchange Commission requires to be reflected in the Fund's performance. The index is unmanaged, and unlike the Fund, is not affected by cash flows. It is not possible to invest directly in an index. |
| 3 | Lipper figures represent the average of the total returns reported by all funds designated by Lipper, Inc., as falling into the respective category and is not adjusted to reflect any sales charges. The Lipper figures in the Growth of $10,000 line graph are based on historical return information published by Lipper and reflect the return of the funds comprising the category in the year of publication. Because the funds designated by Lipper as falling into the category can change over time, the Lipper figures in the line graph may not match the Lipper figures in the Average Annual Total Returns table, which reflect the return of the funds that currently comprise the category. |
| 4 | The Fund's R6 Shares commenced operations on June 29, 2016. For the period prior to the commencement of operations of the R6 Shares, the performance information shown is for Institutional Shares adjusted to reflect the expenses of R6 Shares for each year for which the Fund's R6 expenses would have exceeded the actual expenses paid by the Fund's Institutional Shares. |
| Type of Investment | Percentage of Total Net Assets |
| U.S. Government Agency Commercial Mortgage-Backed Securities | 43.0% |
| U.S. Treasury Securities | 32.4% |
| U.S. Government Agency Securities | 15.6% |
| U.S. Government Agency Mortgage-Backed Securities2 | 8.0% |
| Repurchase Agreement—Collateral3 | 1.2% |
| Cash Equivalents4 | 1.6% |
| Other Assets and Liabilities—Net5 | (1.8)% |
| TOTAL | 100.0% |
| 1 | See the Fund's Prospectus and Statement of Additional Information for a description of the types of securities in which the Fund invests. |
| 2 | For purposes of this table, Mortgage-Backed Securities include mortgage-backed securities guaranteed by Government Sponsored Entities (GSEs) and adjustable rate mortgage-backed securities. |
| 3 | Includes repurchase agreement purchased with cash collateral or proceeds received in securities lending and/or dollar-roll transactions, as well as cash covering when-issued and delayed-delivery transactions. |
| 4 | Cash Equivalents include any investment in money market mutual funds. |
| 5 | Assets, other than investments in securities, less liabilities. See Statement of Assets and Liabilities. |
| Principal Amount or Shares | Value | ||
| U.S. TREASURY—32.4% | |||
| U.S. Treasury Bonds—13.1% | |||
| $2,250,000 | 2.250%, 8/15/2046 | $1,923,715 | |
| 9,250,000 | 2.500%, 2/15/2045 - 2/15/2046 | 8,383,822 | |
| 6,500,000 | 2.750%, 8/15/2042 | 6,244,863 | |
| 8,000,000 | 2.875%, 8/15/2045 - 11/15/2046 | 7,832,676 | |
| 6,250,000 | 3.000%, 11/15/2044 - 11/15/2045 | 6,270,540 | |
| 2,000,000 | 3.125%, 2/15/2043 | 2,057,099 | |
| 18,250,000 | 3.625%, 8/15/2043 | 20,510,919 | |
| 14,000,000 | 4.375%, 5/15/2041 | 17,562,284 | |
| TOTAL | 70,785,918 | ||
| U.S. Treasury Notes—19.3% | |||
| 2,000,000 | 0.750%, 9/30/2018 | 1,988,734 | |
| 8,000,000 | 1.125%, 2/28/2021 - 7/31/2021 | 7,788,451 | |
| 13,500,000 | 1.250%, 12/31/2018 | 13,510,961 | |
| 35,500,000 | 1.375%, 2/29/2020 - 10/31/2020 | 35,231,837 | |
| 9,000,000 | 1.500%, 11/30/2019 | 9,010,792 | |
| 4,000,000 | 1.625%, 12/31/2019 - 11/15/2022 | 3,962,601 | |
| 15,000,000 | 1.750%, 11/30/2021 | 14,904,017 | |
| 15,275,000 | 2.000%, 8/15/2025 - 11/15/2026 | 14,787,020 | |
| 2,000,000 | 2.625%, 11/15/2020 | 2,066,580 | |
| 750,000 | 2.750%, 2/15/2024 | 776,668 | |
| TOTAL | 104,027,661 | ||
| TOTAL U.S. TREASURY (IDENTIFIED COST $170,274,564) | 174,813,579 | ||
| ADJUSTABLE RATE MORTGAGES—0.0% | |||
| Federal Home Loan Mortgage Corporation ARM—0.0% | |||
| 18,265 | 2.965%, 7/1/2035 | 19,146 | |
| 77,581 | 3.275%, 11/1/2035 | 80,420 | |
| TOTAL ADJUSTABLE RATE MORTGAGES (IDENTIFIED COST $95,442) | 99,566 | ||
| GOVERNMENT AGENCIES—15.6% | |||
| Federal Farm Credit System—1.0% | |||
| 1,000,000 | 4.250%, 4/16/2018 | 1,037,202 | |
| 2,000,000 | 5.050%, 8/1/2018 | 2,112,623 | |
| 1,000,000 | 5.375%, 11/10/2020 | 1,127,215 |
| Principal Amount or Shares | Value | ||
| GOVERNMENT AGENCIES—continued | |||
| Federal Farm Credit System—continued | |||
| $1,000,000 | 5.550%, 8/1/2017 | $1,020,124 | |
| 249,000 | 5.800%, 11/10/2021 | 291,605 | |
| TOTAL | 5,588,769 | ||
| Federal Home Loan Bank System—4.3% | |||
| 6,000,000 | 1.625%, 9/11/2020 | 5,970,858 | |
| 1,000,000 | 2.125%, 6/10/2022 | 1,004,268 | |
| 10,000,000 | 3.625%, 3/12/2021 | 10,681,567 | |
| 4,000,000 | 4.125%, 12/13/2019 - 3/13/2020 | 4,283,307 | |
| 1,500,000 | 4.250%, 3/9/2018 | 1,551,718 | |
| TOTAL | 23,491,718 | ||
| Federal Home Loan Mortgage Corporation—4.4% | |||
| 23,000,000 | 2.375%, 1/13/2022 | 23,430,576 | |
| 70,000 | 6.750%, 9/15/2029 | 98,016 | |
| TOTAL | 23,528,592 | ||
| Federal National Mortgage Association—3.9% | |||
| 6,000,000 | 1 | 1.625%, 1/21/2020 | 6,018,109 |
| 10,000,000 | 1.750%, 11/26/2019 | 10,069,930 | |
| 5,000,000 | 2.625%, 9/6/2024 | 5,089,932 | |
| TOTAL | 21,177,971 | ||
| Tennessee Valley Authority Bonds—2.0% | |||
| 8,100,000 | 2.875%, 2/1/2027 | 8,126,609 | |
| 2,000,000 | 5.250%, 9/15/2039 | 2,536,558 | |
| TOTAL | 10,663,167 | ||
| TOTAL GOVERNMENT AGENCIES (IDENTIFIED COST $82,181,583) | 84,450,217 | ||
| MORTGAGE-BACKED SECURITIES—2.0% | |||
| Federal Home Loan Mortgage Corporation—0.0% | |||
| 35,821 | 4.500%, 11/1/2018 | 36,646 | |
| 136,369 | 5.500%, 11/1/2020 | 143,588 | |
| 2,679 | 6.000%, 8/1/2017 | 2,701 | |
| TOTAL | 182,935 | ||
| Federal National Mortgage Association—0.1% | |||
| 184,392 | 5.000%, 10/1/2017 - 1/1/2035 | 197,968 | |
| 205,427 | 5.500%, 2/1/2023 - 6/1/2025 | 223,757 | |
| 312,048 | 6.000%, 2/1/2026 - 1/1/2037 | 354,257 | |
| TOTAL | 775,982 |
| Principal Amount or Shares | Value | ||
| MORTGAGE-BACKED SECURITIES—continued | |||
| Government National Mortgage Association—0.3% | |||
| $618,134 | 4.000%, 5/15/2025 | $654,827 | |
| 195,072 | 5.000%, 3/15/2023 | 207,258 | |
| 317,069 | 5.500%, 2/15/2023 - 5/15/2038 | 349,335 | |
| 99,946 | 6.000%, 1/20/2029 - 3/15/2032 | 113,504 | |
| 49,996 | 6.500%, 10/15/2031 | 58,031 | |
| 18,422 | 7.500%, 10/15/2026 - 10/15/2027 | 21,599 | |
| TOTAL | 1,404,554 | ||
| Government Agency—1.6% | |||
| 8,495,958 | 2,3 | FDIC Trust 2013-R1, Class A, 1.150%, 3/25/2033 | 8,391,127 |
| 204,847 | 2,3 | FDIC Trust 2013-R2, Class A, 1.250%, 3/25/2033 | 202,104 |
| TOTAL | 8,593,231 | ||
| TOTAL MORTGAGE-BACKED SECURITIES (IDENTIFIED COST $10,913,861) | 10,956,702 | ||
| COMMERCIAL MORTGAGE-BACKED SECURITIES—43.0% | |||
| Agency Commercial Mortgage-Backed Securities—43.0% | |||
| 5,377,430 | FHLMC REMIC KS02 A, 1.151%, 8/25/2023 | 5,372,955 | |
| 690,895 | FHLMC REMIC KF02 A1, 1.152%, 7/25/2020 | 690,747 | |
| 8,220,283 | FHLMC REMIC KJ03 A1, 1.669%, 1/25/2021 | 8,133,995 | |
| 4,846,565 | FHLMC REMIC K017 A1, 1.891%, 12/25/2020 | 4,853,363 | |
| 3,129,084 | FHLMC REMIC K714 A1, 2.075%, 12/25/2019 | 3,143,585 | |
| 10,562,621 | FHLMC REMIC K720 A1, 2.316%, 11/25/2021 | 10,666,659 | |
| 8,000,000 | FHLMC REMIC KJ08 A2, 2.356%, 8/25/2022 | 7,943,230 | |
| 9,633,685 | FHLMC REMIC K053 A1, 2.548%, 2/25/2025 | 9,713,581 | |
| 9,325,000 | FHLMC REMIC K504 A2, 2.566%, 9/25/2020 | 9,489,992 | |
| 10,253,428 | FHLMC REMIC K052 A1, 2.598%, 1/25/2025 | 10,364,196 | |
| 4,239,737 | FHLMC REMIC K721 A1, 2.610%, 1/25/2022 | 4,315,377 | |
| 7,000,000 | FHLMC REMIC KSMC A2, 2.615%, 1/25/2023 | 7,040,404 | |
| 9,400,000 | FHLMC REMIC K027 A2, 2.637%, 1/25/2023 | 9,505,229 | |
| 20,189,620 | FHLMC REMIC K703 A2, 2.699%, 5/25/2018 | 20,439,660 | |
| 6,500,000 | FHLMC REMIC K720 A2, 2.716%, 6/25/2022 | 6,602,860 | |
| 12,150,000 | FHLMC REMIC K054 A2, 2.745%, 1/25/2026 | 12,034,936 | |
| 7,290,918 | FHLMC REMIC K014 A1, 2.788%, 10/25/2020 | 7,395,118 | |
| 7,901,620 | FHLMC REMIC K050 A1, 2.802%, 1/25/2025 | 8,026,868 | |
| 3,032,345 | FHLMC REMIC K029 A1, 2.839%, 10/25/2022 | 3,100,703 | |
| 1,433,938 | FHLMC REMIC K011 A1, 2.917%, 8/25/2020 | 1,457,817 | |
| 6,000,000 | FHLMC REMIC K049 A2, 3.010%, 7/25/2025 | 6,081,832 | |
| 5,000,000 | FHLMC REMIC K033 A2, 3.060%, 7/25/2023 | 5,158,722 |
| Principal Amount or Shares | Value | ||
| COMMERCIAL MORTGAGE-BACKED SECURITIES—continued | |||
| Agency Commercial Mortgage-Backed Securities—continued | |||
| $18,481,548 | FHLMC REMIC K702 A2, 3.154%, 2/25/2018 | $18,739,243 | |
| 1,000,000 | FHLMC REMIC K031 A2, 3.300%, 4/25/2023 | 1,045,597 | |
| 6,440,815 | FHLMC REMIC K010 A1, 3.320%, 7/25/2020 | 6,501,349 | |
| 2,000,000 | FHLMC REMIC K003 A4, 5.053%, 1/25/2019 | 2,093,194 | |
| 7,221,781 | FNMA REMIC 2012-M1 A1, 1.811%, 10/25/2021 | 7,174,362 | |
| 8,000,000 | FNMA REMIC 2016-M2 AV2, 2.152%, 1/25/2023 | 7,846,927 | |
| 650,000 | FNMA REMIC 2012-M13 A2, 2.377%, 5/25/2022 | 645,812 | |
| 9,000,000 | FNMA REMIC 2016-M5 A2, 2.469%, 4/25/2026 | 8,670,757 | |
| 4,000,000 | FNMA REMIC 2015-M4 AV2, 2.509%, 7/25/2022 | 4,011,723 | |
| 13,604,278 | FNMA REMIC 2011-M7 A2, 2.578%, 9/25/2018 | 13,767,102 | |
| TOTAL COMMERCIAL MORTGAGE-BACKED SECURITIES (IDENTIFIED COST $234,683,953) | 232,027,895 | ||
| COLLATERALIZED MORTGAGE OBLIGATIONS—6.0% | |||
| Federal Home Loan Mortgage Corporation—0.8% | |||
| 73,198 | REMIC 2411 FJ, 1.120%, 12/15/2029 | 73,222 | |
| 234,215 | REMIC 2458 FB, 1.770%, 1/15/2032 | 237,776 | |
| 34,349 | REMIC 2534 FI, 1.670%, 2/15/2032 | 34,826 | |
| 7,426 | REMIC 2555 B, 4.250%, 1/15/2018 | 7,501 | |
| 2,320,529 | REMIC 2601 DA, 4.000%, 4/15/2023 | 2,410,397 | |
| 1,698,475 | REMIC 3322 FB, 1.160%, 5/15/2037 | 1,696,308 | |
| TOTAL | 4,460,030 | ||
| Federal National Mortgage Association—0.9% | |||
| 271 | REMIC 1988-16 B, 9.500%, 6/25/2018 | 276 | |
| 396 | REMIC 1989-35 G, 9.500%, 7/25/2019 | 419 | |
| 568,130 | REMIC 1999-51 F, 1.272%, 9/17/2029 | 569,872 | |
| 7,659 | REMIC 2003-16 CB, 4.000%, 2/25/2033 | 7,729 | |
| 287,723 | REMIC 2006-58 FP, 1.078%, 7/25/2036 | 286,912 | |
| 560,313 | REMIC 2006-85 PF, 1.158%, 9/25/2036 | 560,313 | |
| 776,835 | REMIC 2007-46 FA, 1.148%, 5/25/2037 | 775,701 | |
| 820,391 | REMIC 2008-17 PA, 4.500%, 10/25/2037 | 847,543 | |
| 1,271,467 | REMIC 2009-14 PB, 3.500%, 3/25/2024 | 1,301,490 | |
| 214,553 | REMIC 370 F21, 1.078%, 6/25/2036 | 213,855 | |
| TOTAL | 4,564,110 | ||
| Government National Mortgage Association—4.3% | |||
| 23,434,705 | REMIC 2013-H16 FA, 1.312%, 7/20/2063 | 23,379,879 | |
| TOTAL COLLATERALIZED MORTGAGE OBLIGATIONS (IDENTIFIED COST $32,501,113) | 32,404,019 |
| Principal Amount or Shares | Value | ||
| INVESTMENT COMPANY—1.6% | |||
| 8,703,448 | 4 | Federated Government Obligations Fund, Premier Shares, 0.49%5 (IDENTIFIED COST $8,703,448) | $8,703,448 |
| REPURCHASE AGREEMENT—1.2% | |||
| $6,150,000 | Interest in $895,000,000 joint repurchase agreement 0.53%, dated 2/28/2017 under which Bank of America, N.A. will repurchase securities provided as collateral for $895,013,176 on 3/1/2017. The security provided as collateral at the end of the period held with BNY Mellon as tri-party agent, was a U.S Government Agency security maturing on 2/25/2044 and the market value of that underlying security was $921,863,572 (purchased with proceeds from securities lending collateral) (AT COST) | 6,150,000 | |
| TOTAL INVESTMENTS—101.8% (IDENTIFIED COST $545,503,964)6 | 549,605,426 | ||
| OTHER ASSETS AND LIABILITIES - NET—(1.8)%7 | (9,893,888) | ||
| TOTAL NET ASSETS—100% | $539,711,538 |
| 1 | All or a portion of this security is temporarily on loan to unaffiliated broker/dealers. |
| 2 | Denotes a restricted security that either: (a) cannot be offered for public sale without first being registered, or being able to take advantage of an exemption from registration, under the Securities Act of 1933; or (b) is subject to a contractual restriction on public sales. At February 28, 2017, these restricted securities amounted to $8,593,231, which represented 1.6% of total net assets. |
| 3 | Denotes a restricted security that may be resold without restriction to “qualified institutional buyers” as defined in Rule 144A under the Securities Act of 1933 and that the Fund has determined to be liquid under criteria established by the Fund's Board of Trustees (the “Trustees”). At February 28, 2017, these liquid restricted securities amounted to $8,593,231, which represented 1.6% of total net assets. |
| 4 | Affiliated holding. |
| 5 | 7-day net yield. |
| 6 | The cost of investments for federal tax purposes amounts to $545,539,216. |
| 7 | Assets, other than investments in securities, less liabilities. See Statement of Assets and Liabilities. |
| Valuation Inputs | ||||
| Level 1— Quoted Prices | Level 2— Other Significant Observable Inputs | Level 3— Significant Unobservable Inputs | Total | |
| Debt Securities: | ||||
| U.S. Treasury | $— | $174,813,579 | $— | $174,813,579 |
| Adjustable Rate Mortgages | — | 99,566 | — | 99,566 |
| Government Agencies | — | 84,450,217 | — | 84,450,217 |
| Mortgage-Backed Securities | — | 10,956,702 | — | 10,956,702 |
| Commercial Mortgage-Backed Securities | — | 232,027,895 | — | 232,027,895 |
| Collateralized Mortgage Obligations | — | 32,404,019 | — | 32,404,019 |
| Repurchase Agreement | — | 6,150,000 | — | 6,150,000 |
| Investment Company | 8,703,448 | — | — | 8,703,448 |
| TOTAL SECURITIES | $8,703,448 | $540,901,978 | $— | $549,605,426 |
| ARM | —Adjustable Rate Mortgage |
| FDIC | —Federal Deposit Insurance Corporation |
| FHLMC | —Federal Home Loan Mortgage Corporation |
| FNMA | —Federal National Mortgage Association |
| REMIC | —Real Estate Mortgage Investment Conduit |
| Year Ended February 28 or 29 | 2017 | 2016 | 2015 | 2014 | 2013 |
| Net Asset Value, Beginning of Period | $11.10 | $11.20 | $11.04 | $11.51 | $11.80 |
| Income From Investment Operations: | |||||
| Net investment income | 0.22 | 0.20 | 0.20 | 0.20 | 0.24 |
| Net realized and unrealized gain (loss) on investments | (0.29) | 0.04 | 0.18 | (0.32) | 0.04 |
| TOTAL FROM INVESTMENT OPERATIONS | (0.07) | 0.24 | 0.38 | (0.12) | 0.28 |
| Less Distributions: | |||||
| Distributions from net investment income | (0.21) | (0.21) | (0.20) | (0.20) | (0.24) |
| Distributions from net realized gain on investments | (0.05) | (0.13) | (0.02) | (0.15) | (0.33) |
| TOTAL DISTRIBUTIONS | (0.26) | (0.34) | (0.22) | (0.35) | (0.57) |
| Net Asset Value, End of Period | $10.77 | $11.10 | $11.20 | $11.04 | $11.51 |
| Total Return1 | (0.64)% | 2.18% | 3.50% | (1.02)% | 2.40% |
| Ratios to Average Net Assets: | |||||
| Net expenses | 0.32% | 0.31% | 0.31% | 0.31% | 0.31% |
| Net investment income | 1.96% | 1.81% | 1.84% | 1.77% | 1.95% |
| Expense waiver/reimbursement2 | 0.19% | 0.18% | 0.19% | 0.18% | 0.16% |
| Supplemental Data: | |||||
| Net assets, end of period (000 omitted) | $434,673 | $521,834 | $509,697 | $542,747 | $864,400 |
| Portfolio turnover | 33% | 82% | 58% | 49% | 89% |
| Portfolio turnover (excluding purchases and sales from dollar-roll transactions) | 33% | 58% | 54% | 44% | 40% |
| 1 | Based on net asset value. Total returns for periods of less than one year are not annualized. |
| 2 | This expense decrease is reflected in both the net expense and the net investment income ratios shown above. |
| Year Ended February 28 or 29 | 2017 | 2016 | 2015 | 2014 | 2013 |
| Net Asset Value, Beginning of Period | $11.10 | $11.20 | $11.04 | $11.51 | $11.80 |
| Income From Investment Operations: | |||||
| Net investment income | 0.18 | 0.16 | 0.17 | 0.16 | 0.20 |
| Net realized and unrealized gain (loss) on investments | (0.28) | 0.04 | 0.18 | (0.32) | 0.04 |
| TOTAL FROM INVESTMENT OPERATIONS | (0.10) | 0.20 | 0.35 | (0.16) | 0.24 |
| Less Distributions: | |||||
| Distributions from net investment income | (0.18) | (0.17) | (0.17) | (0.16) | (0.20) |
| Distributions from net realized gain on investments | (0.05) | (0.13) | (0.02) | (0.15) | (0.33) |
| TOTAL DISTRIBUTIONS | (0.23) | (0.30) | (0.19) | (0.31) | (0.53) |
| Net Asset Value, End of Period | $10.77 | $11.10 | $11.20 | $11.04 | $11.51 |
| Total Return1 | (0.98)% | 1.84% | 3.15% | (1.36)% | 2.05% |
| Ratios to Average Net Assets: | |||||
| Net expenses | 0.66% | 0.65% | 0.65% | 0.65% | 0.65% |
| Net investment income | 1.62% | 1.47% | 1.49% | 1.42% | 1.61% |
| Expense waiver/reimbursement2 | 0.34% | 0.34% | 0.34% | 0.33% | 0.32% |
| Supplemental Data: | |||||
| Net assets, end of period (000 omitted) | $79,661 | $118,253 | $133,013 | $138,193 | $278,256 |
| Portfolio turnover | 33% | 82% | 58% | 49% | 89% |
| Portfolio turnover (excluding purchases and sales from dollar-roll transactions) | 33% | 58% | 54% | 44% | 40% |
| 1 | Based on net asset value. Total returns for periods of less than one year are not annualized. |
| 2 | This expense decrease is reflected in both the net expense and the net investment income ratios shown above. |
| Period Ended 2/28/20171 | |
| Net Asset Value, Beginning of Period | $11.27 |
| Income From Investment Operations: | |
| Net investment income | 0.14 |
| Net realized and unrealized gain (loss) on investments | (0.45) |
| TOTAL FROM INVESTMENT OPERATIONS | (0.31) |
| Less Distributions: | |
| Distributions from net investment income | (0.15) |
| Distributions from net realized gain on investments | (0.04) |
| TOTAL DISTRIBUTIONS | (0.19) |
| Net Asset Value, End of Period | $10.77 |
| Total Return2 | (2.80)% |
| Ratios to Average Net Assets: | |
| Net expenses | 0.31%3 |
| Net investment income | 2.03%3 |
| Expense waiver/reimbursement4 | 0.15%3 |
| Supplemental Data: | |
| Net assets, end of period (000 omitted) | $25,377 |
| Portfolio turnover | 33%5 |
| Portfolio turnover (excluding purchases and sales from dollar-roll transactions) | 33% |
| 1 | Reflects operations for the period from June 29, 2016 (date of initial investment) to February 28, 2017. |
| 2 | Based on net asset value. Total returns for periods of less than one year are not annualized. |
| 3 | Computed on an annualized basis. |
| 4 | This expense decrease is reflected in both the net expense and the net investment income ratios shown above. |
| 5 | Portfolio turnover is calculated at the Fund level. Percentage indicated was calculated for the year ended February 28, 2017. |
| Assets: | ||
| Total investment in securities, at value including $8,703,448 of investment in an affiliated holding (Note 5) and $6,018,109 of securities loaned (identified cost $545,503,964) | $549,605,426 | |
| Income receivable | 1,832,817 | |
| Receivable for shares sold | 161,416 | |
| TOTAL ASSETS | 551,599,659 | |
| Liabilities: | ||
| Payable for shares redeemed | $5,413,777 | |
| Bank overdraft | 171 | |
| Payable for collateral due to broker for securities lending | 6,150,000 | |
| Income distribution payable | 140,028 | |
| Payable to adviser (Note 5) | 2,161 | |
| Payable for administrative fees (Note 5) | 1,168 | |
| Payable for distribution services fee (Note 5) | 3,635 | |
| Payable for other service fees (Notes 2 and 5) | 19,217 | |
| Accrued expenses (Note 5) | 157,964 | |
| TOTAL LIABILITIES | 11,888,121 | |
| Net assets for 50,122,272 shares outstanding | $539,711,538 | |
| Net Assets Consist of: | ||
| Paid-in capital | $539,332,207 | |
| Net unrealized appreciation of investments | 4,101,462 | |
| Accumulated net realized loss on investments | (3,742,025) | |
| Undistributed net investment income | 19,894 | |
| TOTAL NET ASSETS | $539,711,538 | |
| Net Asset Value, Offering Price and Redemption Proceeds Per Share | ||
| Institutional Shares: | ||
| $434,673,138 ÷ 40,368,278 shares outstanding, no par value, unlimited shares authorized | $10.77 | |
| Service Shares: | ||
| $79,661,041 ÷ 7,397,835 shares outstanding, no par value, unlimited shares authorized | $10.77 | |
| Class R6 Shares: | ||
| $25,377,359 ÷ 2,356,159 shares outstanding, no par value, unlimited shares authorized | $10.77 |
| Investment Income: | |||
| Interest (including $9,916 received from an affiliated holding (Note 5) and income on securities loaned of $56,766) | $13,826,691 | ||
| Expenses: | |||
| Investment adviser fee (Note 5) | $1,820,233 | ||
| Administrative fee (Note 5) | 474,659 | ||
| Custodian fees | 22,606 | ||
| Transfer agent fee (Note 2) | 443,192 | ||
| Directors'/Trustees' fees (Note 5) | 10,954 | ||
| Auditing fees | 31,800 | ||
| Legal fees | 9,309 | ||
| Portfolio accounting fees | 171,136 | ||
| Distribution services fee (Note 5) | 260,510 | ||
| Other service fees (Notes 2 and 5) | 252,090 | ||
| Share registration costs | 53,898 | ||
| Printing and postage | 28,055 | ||
| Miscellaneous (Note 5) | 24,859 | ||
| TOTAL EXPENSES | 3,603,301 | ||
| Waivers and Reimbursements: | |||
| Waiver/reimbursement of investment adviser fee (Note 5) | $(963,448) | ||
| Waiver/reimbursement of other operating expenses (Notes 2 and 5) | (366,281) | ||
| TOTAL WAIVERS AND REIMBURSEMENTS | (1,329,729) | ||
| Net expenses | 2,273,572 | ||
| Net investment income | 11,553,119 | ||
| Realized and Unrealized Gain (Loss) on Investments: | |||
| Net realized gain on investments | 1,789,077 | ||
| Net change in unrealized appreciation of investments | (17,244,345) | ||
| Net realized and unrealized loss on investments | (15,455,268) | ||
| Change in net assets resulting from operations | $(3,902,149) |
| Year Ended February 28 or 29 | 2017 | 2016 |
| Increase (Decrease) in Net Assets | ||
| Operations: | ||
| Net investment income | $11,553,119 | $10,895,525 |
| Net realized gain on investments and futures contracts | 1,789,077 | 2,977,640 |
| Net change in unrealized appreciation/depreciation of investments and futures contracts | (17,244,345) | (1,162,059) |
| CHANGE IN NET ASSETS RESULTING FROM OPERATIONS | (3,902,149) | 12,711,106 |
| Distributions to Shareholders: | ||
| Distributions from net investment income | ||
| Institutional Shares | (9,592,935) | (9,463,989) |
| Service Shares | (1,649,764) | (1,918,252) |
| Class R6 Shares | (105,877) | — |
| Distributions from net realized gain on investments and futures contracts | ||
| Institutional Shares | (2,054,103) | (5,828,894) |
| Service Shares | (409,372) | (1,452,066) |
| Class R6 Shares | (71,052) | — |
| CHANGE IN NET ASSETS RESULTING FROM DISTRIBUTIONS TO SHAREHOLDERS | (13,883,103) | (18,663,201) |
| Share Transactions: | ||
| Proceeds from sale of shares | 112,182,565 | 136,050,683 |
| Net asset value of shares issued to shareholders in payment of distributions declared | 11,824,123 | 15,990,817 |
| Cost of shares redeemed | (206,596,797) | (148,712,253) |
| CHANGE IN NET ASSETS RESULTING FROM SHARE TRANSACTIONS | (82,590,109) | 3,329,247 |
| Change in net assets | (100,375,361) | (2,622,848) |
| Net Assets: | ||
| Beginning of period | 640,086,899 | 642,709,747 |
| End of period (including undistributed (distributions in excess of) net investment income of $19,894 and $(185,235), respectively) | $539,711,538 | $640,086,899 |
| ■ | Fixed-income securities are fair valued using price evaluations provided by a pricing service approved by the Trustees. |
| ■ | Shares of other mutual funds or non-exchange-traded investment companies are valued based upon their reported NAVs. |
| ■ | Derivative contracts listed on exchanges are valued at their reported settlement or closing price, except that options are valued at the mean of closing bid and asked quotations. |
| ■ | Over-the-counter (OTC) derivative contracts are fair valued using price evaluations provided by a pricing service approved by the Trustees. |
| ■ | For securities that are fair valued in accordance with procedures established by and under the general supervision of the Trustees, certain factors may be considered such as: the last traded or purchase price of the security, information obtained by contacting the issuer or dealers, analysis of the issuer's financial statements or other available documents, fundamental analytical data, the nature and duration of restrictions on disposition, the movement of the market in which the security is normally traded, public trading in similar securities or derivative contracts of the issuer or comparable issuers, movement of a relevant index, or other factors including but not limited to industry changes and relevant government actions. |
| Transfer Agent Fees Incurred | Transfer Agent Fees Reimbursed | |
| Institutional Shares | $368,504 | $(175,743) |
| Service Shares | 74,016 | — |
| Class R6 Shares | 672 | — |
| TOTAL | $443,192 | $(175,743) |
| Other Service Fees Incurred | |
| Service Shares | $252,090 |
| Market Value of Securities Loaned | Market Value of Collateral |
| $6,018,109 | $6,150,000 |
| Year Ended February 28 or 29 | 2017 | 2016 | ||
| Institutional Shares: | Shares | Amount | Shares | Amount |
| Shares sold | 5,943,344 | $65,807,311 | 9,513,645 | $105,469,105 |
| Shares issued to shareholders in payment of distributions declared | 884,089 | 9,714,776 | 1,168,157 | 12,855,462 |
| Shares redeemed | (13,463,045) | (147,688,264) | (9,191,030) | (101,538,448) |
| NET CHANGE RESULTING FROM INSTITUTIONAL SHARE TRANSACTIONS | (6,635,612) | $(72,166,177) | 1,490,772 | $16,786,119 |
| Year Ended February 28 or 29 | 2017 | 2016 | ||
| Service Shares: | Shares | Amount | Shares | Amount |
| Shares sold | 1,728,221 | $19,151,876 | 2,770,560 | $30,581,578 |
| Shares issued to shareholders in payment of distributions declared | 175,797 | 1,932,824 | 285,066 | 3,135,355 |
| Shares redeemed | (5,157,359) | (57,017,318) | (4,281,570) | (47,173,805) |
| NET CHANGE RESULTING FROM SERVICE SHARE TRANSACTIONS | (3,253,341) | $(35,932,618) | (1,225,944) | $(13,456,872) |
| Period Ended 2/28/20171 | Year Ended 2/29/2016 | |||
| Class R6 Shares: | Shares | Amount | Shares | Amount |
| Shares sold | 2,515,516 | $27,223,378 | – | $– |
| Shares issued to shareholders in payment of distributions declared | 16,402 | 176,523 | – | – |
| Shares redeemed | (175,759) | (1,891,215) | (-) | (-) |
| NET CHANGE RESULTING FROM CLASS R6 SHARE TRANSACTIONS | 2,356,159 | $25,508,686 | – | $– |
| NET CHANGE RESULTING FROM TOTAL FUND SHARE TRANSACTIONS | (7,532,794) | $(82,590,109) | 264,828 | $3,329,247 |
| 1 | Reflects operations for the period from June 29, 2016 (date of initial investment) to February 28, 2017. |
| Increase (Decrease) | |
| Undistributed Net Investment Income | Accumulated Net Realized Gain (Loss) |
| $586 | $(586) |
| 2017 | 2016 | |
| Ordinary income1 | $11,992,990 | $12,589,354 |
| Long-term capital gains | $1,890,113 | $6,073,847 |
| 1 | For tax purposes, short-term capital gain distributions are considered ordinary income distributions. |
| Undistributed tax-exempt income | $19,894 |
| Net unrealized appreciation | $4,066,210 |
| Capital loss deferrals | $(3,706,773) |
| Administrative Fee | Average Daily Net Assets of the Investment Complex |
| 0.150% | on the first $5 billion |
| 0.125% | on the next $5 billion |
| 0.100% | on the next $10 billion |
| 0.075% | on assets in excess of $20 billion |
| Distribution Services Fees Incurred | Distribution Services Fees Waived | |
| Service Shares | $260,510 | $(190,538) |
| Balance of Shares Held 2/29/2016 | Purchases/ Additions | Sales/ Reductions | Balance of Shares Held 2/28/2017 | Value | Dividend Income | |
| Federated Government Obligations Fund, Premier Shares | — | 10,587,208 | (1,883,760) | $8,703,448 | $8,703,448 | $9,916 |
| Purchases | $71,994,050 |
| Sales | $76,042,105 |
April 24, 2017
| Beginning Account Value 9/1/2016 | Ending Account Value 2/28/2017 | Expenses Paid During Period1 | |
| Actual: | |||
| Institutional Shares | $1,000 | $973.00 | $1.57 |
| Service Shares | $1,000 | $971.40 | $3.23 |
| Class R6 Shares | $1,000 | $973.10 | $1.52 |
| Hypothetical (assuming a 5% return before expenses): | |||
| Institutional Shares | $1,000 | $1,023.20 | $1.61 |
| Service Shares | $1,000 | $1,021.50 | $3.31 |
| Class R6 Shares | $1,000 | $1,023.30 | $1.56 |
| 1 | Expenses are equal to the Fund's annualized net expense ratios, multiplied by the average account value over the period, multiplied by 181/365 (to reflect the one-half-year period). The annualized net expense ratios are as follows: |
| Institutional Shares | 0.32% |
| Service Shares | 0.66% |
| Class R6 Shares | 0.31% |
| Name Birth Date Positions Held with Fund Date Service Began | Principal Occupation(s) for Past Five Years, Other Directorships Held and Previous Position(s) |
| J. Christopher Donahue* Birth Date: April 11, 1949 President and Trustee Indefinite Term Began serving: June 1995 | Principal Occupations: Principal Executive Officer and President of certain of the Funds in the Federated Fund Family; Director or Trustee of the Funds in the Federated Fund Family; President, Chief Executive Officer and Director, Federated Investors, Inc.; Chairman and Trustee, Federated Investment Management Company; Trustee, Federated Investment Counseling; Chairman and Director, Federated Global Investment Management Corp.; Chairman, Federated Equity Management Company of Pennsylvania; Trustee, Federated Shareholder Services Company; Director, Federated Services Company. Previous Positions: President, Federated Investment Counseling; President and Chief Executive Officer, Federated Investment Management Company, Federated Global Investment Management Corp. and Passport Research, Ltd; Chairman, Passport Research, Ltd. |
| Name Birth Date Positions Held with Fund Date Service Began | Principal Occupation(s) for Past Five Years, Other Directorships Held and Previous Position(s) |
| John B. Fisher* Birth Date: May 16, 1956 Trustee Indefinite Term Began serving: May 2016 | Principal Occupations: Principal Executive Officer and President of certain of the Funds in the Federated Fund Family; Director or Trustee of certain of the Funds in the Federated Fund Family; Vice President, Federated Investors, Inc.; President, Director/Trustee and CEO, Federated Advisory Services Company, Federated Equity Management Company of Pennsylvania, Federated Global Investment Management Corp., Federated Investment Counseling, Federated Investment Management Company; President of some of the Funds in the Federated Fund Complex and Director, Federated Investors Trust Company. Previous Positions: President and Director of the Institutional Sales Division of Federated Securities Corp.; President and Director of Federated Investment Counseling; President and CEO of Passport Research, Ltd.; Director, Edgewood Securities Corp.; Director, Federated Services Company; Director, Federated Investors, Inc.; Chairman and Director, Southpointe Distribution Services, Inc. and President, Technology, Federated Services Company. |
| * | Reasons for “interested” status: J. Christopher Donahue and John B. Fisher are interested due to their beneficial ownership of shares of Federated Investors, Inc. and due to positions they hold with Federated and its subsidiaries. J. Christopher Donahue is the son of John F. Donahue, Chairman Emeritus of the Federated Funds. |
| Name Birth Date Positions Held with Fund Date Service Began | Principal Occupation(s) for Past Five Years, Other Directorships Held, Previous Position(s) and Qualifications |
| John T. Collins Birth Date: January 24, 1947 Trustee Indefinite Term Began serving: October 2013 | Principal Occupations: Director or Trustee of the Federated Fund Family; formerly, Chairman and CEO, The Collins Group, Inc. (a private equity firm) (Retired). Other Directorships Held: Director, Current Chair of the Compensation Committee, KLX Corp. Qualifications: Mr. Collins has served in several business and financial management roles and directorship positions throughout his career. Mr. Collins previously served as Chairman and CEO, The Collins Group, Inc. (a private equity firm). Mr. Collins serves as Chairman Emeriti, Bentley University. Mr. Collins previously served as Director and Audit Committee Member, Bank of America Corp.; Director, FleetBoston Financial Corp.; and Director, Beth Israel Deaconess Medical Center (Harvard University Affiliate Hospital). |
| Name Birth Date Positions Held with Fund Date Service Began | Principal Occupation(s) for Past Five Years, Other Directorships Held, Previous Position(s) and Qualifications |
| G. Thomas Hough Birth Date: February 28, 1955 Trustee Indefinite Term Began serving: August 2015 | Principal Occupations: Director or Trustee of the Federated Fund Family; formerly, Vice Chair, Ernst & Young LLP (public accounting firm) (Retired). Other Directorships Held: Director, Chair of the Audit Committee, Governance Committee, Publix Super Markets, Inc.; Director, Member of the Audit Committee and Technology Committee of Equifax, Inc. Qualifications: Mr. Hough has served in accounting, business management and directorship positions throughout his career. Mr. Hough most recently held the position of Americas Vice Chair of Assurance with Ernst & Young LLP (public accounting firm). Mr. Hough is an Executive Committee member of the United States Golf Association, he serves on the President's Cabinet and Business School Board of Visitors for the University of Alabama and is on the Business School Board of Visitors for Wake Forest University. |
| Maureen Lally-Green Birth Date: July 5, 1949 Trustee Indefinite Term Began serving: August 2009 | Principal Occupations: Director or Trustee of the Federated Fund Family; Interim Dean of the Duquesne University School of Law; Adjunct Professor of Law, Duquesne University School of Law; formerly, Associate General Secretary and Director, Office of Church Relations, Diocese of Pittsburgh. Other Directorships Held: Director, CONSOL Energy Inc. Qualifications: Judge Lally-Green has served in various legal and business roles and directorship positions throughout her career. Judge Lally-Green previously served as: Associate General Secretary, Diocese of Pittsburgh; a member of the Superior Court of Pennsylvania; and as a Professor of Law, Duquesne University School of Law. Judge Lally-Green also currently holds the positions on either a public or not for profit Board of Directors as follows: Director and Chair, UPMC Mercy Hospital; Regent, St. Vincent Seminary; Director and Vice Chair, Our Campaign for the Church Alive!, Inc.; Director, Saint Vincent College; Member, Pennsylvania State Board of Education (public); and Director and Chair, Cardinal Wuerl North Catholic High School, Inc. Judge Lally-Green has held the positions of: Director, Auberle; Director, Epilepsy Foundation of Western and Central Pennsylvania; Director, Ireland Institute of Pittsburgh; Director, Saint Thomas More Society; Director, Catholic High Schools of the Diocese of Pittsburgh, Inc.; and Director, Pennsylvania Bar Institute. |
| Peter E. Madden Birth Date: March 16, 1942 Trustee Indefinite Term Began serving: July 1995 | Principal Occupation: Director or Trustee, and Chair of the Board of Directors or Trustees, of the Federated Fund Family; Retired. Other Directorships Held: None. Qualifications: Mr. Madden has served in several business management, mutual fund services and directorship positions throughout his career. Mr. Madden previously served as President, Chief Operating Officer and Director, State Street Bank and Trust Company (custodian bank) and State Street Corporation (financial services). He was Director, VISA USA and VISA International and Chairman and Director, Massachusetts Bankers Association. Mr. Madden served as Director, Depository Trust Corporation and Director, The Boston Stock Exchange. Mr. Madden also served as a Representative to the Commonwealth of Massachusetts General Court. |
| Name Birth Date Positions Held with Fund Date Service Began | Principal Occupation(s) for Past Five Years, Other Directorships Held, Previous Position(s) and Qualifications |
| Charles F. Mansfield, Jr. Birth Date: April 10, 1945 Trustee Indefinite Term Began serving: January 1999 | Principal Occupations: Director or Trustee of the Federated Fund Family; Management Consultant. Other Directorships Held: None. Qualifications: Mr. Mansfield has served as a Marine Corps officer and in several banking, business management, educational roles and directorship positions throughout his long career. He remains active as a Management Consultant. |
| Thomas M. O'Neill Birth Date: June 14, 1951 Trustee Indefinite Term Began serving: August 2006 | Principal Occupations: Director or Trustee, Chair of the Audit Committee of the Federated Fund Family; Sole Proprietor, Navigator Management Company (investment and strategic consulting). Other Directorships Held: None. Qualifications: Mr. O'Neill has served in several business, mutual fund and financial management roles and directorship positions throughout his career. Mr. O'Neill serves as Director, Medicines for Humanity and Director, The Golisano Children's Museum of Naples, Florida. Mr. O'Neill previously served as Chief Executive Officer and President, Managing Director and Chief Investment Officer, Fleet Investment Advisors; President and Chief Executive Officer, Aeltus Investment Management, Inc.; General Partner, Hellman, Jordan Management Co., Boston, MA; Chief Investment Officer, The Putnam Companies, Boston, MA; Credit Analyst and Lending Officer, Fleet Bank; Director and Consultant, EZE Castle Software (investment order management software); and Director, Midway Pacific (lumber). |
| P. Jerome Richey Birth Date: February 23, 1949 Trustee Indefinite Term Began serving: October 2013 | Principal Occupations: Director or Trustee of the Federated Fund Family; Management Consultant; formerly, Senior Vice Chancellor and Chief Legal Officer, University of Pittsburgh and Executive Vice President and Chief Legal Officer, CONSOL Energy Inc. Other Directorships Held: None. Qualifications: Mr. Richey has served in several business and legal management roles and directorship positions throughout his career. Mr. Richey most recently held the positions of Senior Vice Chancellor and Chief Legal Officer, University of Pittsburgh. Mr. Richey previously served as Chairman of the Board, Epilepsy Foundation of Western Pennsylvania and Chairman of the Board, World Affairs Council of Pittsburgh. Mr. Richey previously served as Chief Legal Officer and Executive Vice President, CONSOL Energy Inc.; and Board Member, Ethics Counsel and Shareholder, Buchanan Ingersoll & Rooney PC (a law firm). |
| Name Birth Date Positions Held with Fund Date Service Began | Principal Occupation(s) for Past Five Years, Other Directorships Held, Previous Position(s) and Qualifications |
| John S. Walsh Birth Date: November 28, 1957 Trustee Indefinite Term Began serving: January 1999 | Principal Occupations: Director or Trustee of the Federated Fund Family; President and Director, Heat Wagon, Inc. (manufacturer of construction temporary heaters); President and Director, Manufacturers Products, Inc. (distributor of portable construction heaters); President, Portable Heater Parts, a division of Manufacturers Products, Inc. Other Directorships Held: None. Qualifications: Mr. Walsh has served in several business management roles and directorship positions throughout his career. Mr. Walsh previously served as Vice President, Walsh & Kelly, Inc. (paving contractors). |
| Name Birth Date Positions Held with Fund Date Service Began | Principal Occupation(s) for Past Five Years and Previous Position(s) |
| John W. McGonigle Birth Date: October 26, 1938 EXECUTIVE VICE PRESIDENT AND SECRETARY Officer since: June 1995 | Principal Occupations: Executive Vice President and Secretary of the Federated Fund Family; Vice Chairman, Executive Vice President, Secretary and Director, Federated Investors, Inc. Previous Positions: Trustee, Federated Investment Management Company and Federated Investment Counseling; Director, Federated Global Investment Management Corp., Federated Services Company and Federated Securities Corp. |
| Lori A. Hensler Birth Date: January 6, 1967 TREASURER Officer since: April 2013 | Principal Occupations: Principal Financial Officer and Treasurer of the Federated Fund Family; Senior Vice President, Federated Administrative Services; Financial and Operations Principal for Federated Securities Corp. and Edgewood Services, Inc.; and Assistant Treasurer, Federated Investors Trust Company. Ms. Hensler has received the Certified Public Accountant designation. Previous Positions: Controller of Federated Investors, Inc.; Senior Vice President and Assistant Treasurer, Federated Investors Management Company; Treasurer, Federated Investors Trust Company; Assistant Treasurer, Federated Administrative Services, Federated Administrative Services, Inc., Federated Securities Corp., Edgewood Services, Inc., Federated Advisory Services Company, Federated Equity Management Company of Pennsylvania, Federated Global Investment Management Corp., Federated Investment Counseling, Federated Investment Management Company, Passport Research, Ltd., and Federated MDTA, LLC; Financial and Operations Principal for Federated Securities Corp., Edgewood Services, Inc. and Southpointe Distribution Services, Inc. |
| Name Birth Date Positions Held with Fund Date Service Began | Principal Occupation(s) for Past Five Years and Previous Position(s) |
| Peter J. Germain Birth Date: September 3, 1959 CHIEF LEGAL OFFICER Officer since: January 2005 | Principal Occupations: Mr. Germain is Chief Legal Officer of the Federated Fund Family. He is General Counsel and Vice President, Federated Investors, Inc.; President, Federated Administrative Services and Federated Administrative Services, Inc.; Vice President, Federated Securities Corp.; Secretary, Federated Private Asset Management, Inc.; and Secretary, Retirement Plan Service Company of America. Mr. Germain joined Federated in 1984 and is a member of the Pennsylvania Bar Association. Previous Positions: Deputy General Counsel, Special Counsel, Managing Director of Mutual Fund Services, Federated Investors, Inc.; Senior Vice President, Federated Services Company; and Senior Corporate Counsel, Federated Investors, Inc. |
| Richard B. Fisher Birth Date: May 17, 1923 VICE PRESIDENT Officer since: June 1995 | Principal Occupations: Vice Chairman or Vice President of some of the Funds in the Federated Fund Family; Vice Chairman, Federated Investors, Inc.; Chairman, Federated Securities Corp. Previous Positions: President and Director or Trustee of some of the Funds in the Federated Fund Family; Executive Vice President, Federated Investors, Inc.; Director and Chief Executive Officer, Federated Securities Corp. |
| Stephen Van Meter Birth Date: June 5, 1975 CHIEF COMPLIANCE OFFICER AND SENIOR VICE PRESIDENT Officer since: July 2015 | Principal Occupations: Senior Vice President and Chief Compliance Officer of the Federated Fund Family; Vice President and Chief Compliance Officer of Federated Investors, Inc. and Chief Compliance Officer of certain of its subsidiaries. Mr. Van Meter joined Federated in October 2011. He holds FINRA licenses under Series 3, 7, 24 and 66. Previous Positions: Mr. Van Meter previously held the position of Compliance Operating Officer, Federated Investors, Inc. Prior to joining Federated, Mr. Van Meter served at the United States Securities and Exchange Commission in the positions of Senior Counsel, Office of Chief Counsel, Division of Investment Management and Senior Counsel, Division of Enforcement. |
| Robert J. Ostrowski Birth Date: April 26, 1963 Chief Investment Officer Officer since: May 2004 | Principal Occupations: Robert J. Ostrowski joined Federated in 1987 as an Investment Analyst and became a Portfolio Manager in 1990. He was named Chief Investment Officer of Federated's taxable fixed-income products in 2004 and also serves as a Senior Portfolio Manager. Mr. Ostrowski became an Executive Vice President of the Fund's Adviser in 2009 and served as a Senior Vice President of the Fund's Adviser from 1997 to 2009. Mr. Ostrowski has received the Chartered Financial Analyst designation. He received his M.S. in Industrial Administration from Carnegie Mellon University. |

5800 Corporate Drive
Pittsburgh, PA 15237-7000
or call 1-800-341-7400.
CUSIP 31429A204
CUSIP 31429A303
2017 ©Federated Investors, Inc.
| Item 2. | Code of Ethics |
(a) As of the end of the period covered by this report, the registrant has adopted a code of ethics (the "Section 406 Standards for Investment Companies - Ethical Standards for Principal Executive and Financial Officers") that applies to the registrant's Principal Executive Officer and Principal Financial Officer; the registrant's Principal Financial Officer also serves as the Principal Accounting Officer.
(c) There was no amendment to the registrant’s code of ethics described in Item 2(a) above during the period covered by the report.
(d) There was no waiver granted, either actual or implicit, from a provision to the registrant’s code of ethics described in Item 2(a) above during the period covered by the report.
(e) Not Applicable
(f)(3) The registrant hereby undertakes to provide any person, without charge, upon request, a copy of the code of ethics. To request a copy of the code of ethics, contact the registrant at 1-800-341-7400, and ask for a copy of the Section 406 Standards for Investment Companies - Ethical Standards for Principal Executive and Financial Officers.
Item 3. Audit Committee Financial Expert
The registrant's Board has determined that each of the following members of the Board's Audit Committee is an “audit committee financial expert,” and is "independent," for purposes of this Item: John T. Collins, G. Thomas Hough and Thomas M. O'Neill.
| Item 4. | Principal Accountant Fees and Services |
(a) Audit Fees billed to the registrant for the two most recent fiscal years:
Fiscal year ended 2017 - $29,400
Fiscal year ended 2016 - $28,300
(b) Audit-Related Fees billed to the registrant for the two most recent fiscal years:
Fiscal year ended 2017 - $3,500
Fiscal year ended 2016 - $43
Fiscal year ended 2017- Audit consent fee for N-1A filing.
Fiscal year ended 2016- Travel to Audit Committee Meeting.
Amount requiring approval of the registrant’s audit committee pursuant to paragraph (c)(7)(ii) of Rule 2-01 of Regulation S-X, $0 and $0 respectively.
(c) Tax Fees billed to the registrant for the two most recent fiscal years:
Fiscal year ended 2017 - $0
Fiscal year ended 2016 - $0
Amount requiring approval of the registrant’s audit committee pursuant to paragraph (c)(7)(ii) of Rule 2-01 of Regulation S-X, $0 and $0 respectively.
(d) All Other Fees billed to the registrant for the two most recent fiscal years:
Fiscal year ended 2017 - $0
Fiscal year ended 2016 - $0
Amount requiring approval of the registrant’s audit committee pursuant to paragraph (c)(7)(ii) of Rule 2-01 of Regulation S-X, $0 and $0 respectively.
(e)(1) Audit Committee Policies regarding Pre-approval of Services.
The Audit Committee is required to pre-approve audit and non-audit services performed by the independent auditor in order to assure that the provision of such services do not impair the auditor’s independence. Unless a type of service to be provided by the independent auditor has received general pre-approval, it will require specific pre-approval by the Audit Committee. Any proposed services exceeding pre-approved cost levels will require specific pre-approval by the Audit Committee.
Certain services have the general pre-approval of the Audit Committee. The term of the general pre-approval is 12 months from the date of pre-approval, unless the Audit Committee specifically provides for a different period. The Audit Committee will annually review the services that may be provided by the independent auditor without obtaining specific pre-approval from the Audit Committee and may grant general pre-approval for such services. The Audit Committee will revise the list of general pre-approved services from time to time, based on subsequent determinations. The Audit Committee will not delegate its responsibilities to pre-approve services performed by the independent auditor to management.
The Audit Committee has delegated pre-approval authority to its Chairman. The Chairman will report any pre-approval decisions to the Audit Committee at its next scheduled meeting. The Committee will designate another member with such pre-approval authority when the Chairman is unavailable.
AUDIT SERVICES
The annual Audit services engagement terms and fees will be subject to the specific pre-approval of the Audit Committee. The Audit Committee must approve any changes in terms, conditions and fees resulting from changes in audit scope, registered investment company (RIC) structure or other matters.
In addition to the annual Audit services engagement specifically approved by the Audit Committee, the Audit Committee may grant general pre-approval for other Audit Services, which are those services that only the independent auditor reasonably can provide. The Audit Committee has pre-approved certain Audit services, all other Audit services must be specifically pre-approved by the Audit Committee.
AUDIT-RELATED SERVICES
Audit-related services are assurance and related services that are reasonably related to the performance of the audit or review of the Company’s financial statements or that are traditionally performed by the independent auditor. The Audit Committee believes that the provision of Audit-related services does not impair the independence of the auditor, and has pre-approved certain Audit-related services, all other Audit-related services must be specifically pre-approved by the Audit Committee.
TAX SERVICES
The Audit Committee believes that the independent auditor can provide Tax services to the Company such as tax compliance, tax planning and tax advice without impairing the auditor’s independence. However, the Audit Committee will not permit the retention of the independent auditor in connection with a transaction initially recommended by the independent auditor, the purpose of which may be tax avoidance and the tax treatment of which may not be supported in the Internal Revenue Code and related regulations. The Audit Committee has pre-approved certain Tax services, all Tax services involving large and complex transactions must be specifically pre-approved by the Audit Committee.
ALL OTHER SERVICES
With respect to the provision of services other than audit, review or attest services the pre-approval requirement is waived if:
| (1) | The aggregate amount of all such services provided constitutes no more than five percent of the total amount of revenues paid by the registrant, the registrant’s adviser (not including any sub-adviser whose role is primarily portfolio management and is subcontracted with or overseen by another investment adviser), and any entity controlling, controlled by, or under common control with the investment adviser that provides ongoing services to the registrant to its accountant during the fiscal year in which the services are provided; |
| (2) | Such services were not recognized by the registrant, the registrant’s adviser (not including any sub-adviser whose role is primarily portfolio management and is subcontracted with or overseen by another investment adviser), and any entity controlling, controlled by, or under common control with the investment adviser that provides ongoing services to the registrant at the time of the engagement to be non-audit services; and |
| (3) | Such services are promptly brought to the attention of the Audit Committee of the issuer and approved prior to the completion of the audit by the Audit Committee or by one or more members of the Audit Committee who are members of the board of directors to whom authority to grant such approvals has been delegated by the Audit Committee. |
The Audit Committee may grant general pre-approval to those permissible non-audit services classified as All Other services that it believes are routine and recurring services, and would not impair the independence of the auditor.
The SEC’s rules and relevant guidance should be consulted to determine the precise definitions of prohibited non-audit services and the applicability of exceptions to certain of the prohibitions.
PRE-APPROVAL FEE LEVELS
Pre-approval fee levels for all services to be provided by the independent auditor will be established annually by the Audit Committee. Any proposed services exceeding these levels will require specific pre-approval by the Audit Committee.
PROCEDURES
Requests or applications to provide services that require specific approval by the Audit Committee will be submitted to the Audit Committee by both the independent auditor and the Principal Accounting Officer and/or Internal Auditor, and must include a joint statement as to whether, in their view, the request or application is consistent with the SEC’s rules on auditor independence.
(e)(2) Percentage of services identified in items 4(b) through 4(d) that were approved by the registrants audit committee pursuant to paragraph (c)(7)(i)(C) of Rule 2-01 of Regulation S-X:
4(b)
Fiscal year ended 2017 – 0%
Fiscal year ended 2016 - 0%
Percentage of services provided to the registrants investment adviser and any entity controlling, controlled by, or under common control with the investment adviser that provides ongoing services to the registrant that were approved by the registrants audit committee pursuant to paragraph (c)(7)(i)(C) of Rule 2-01 of Regulation S-X, 0% and 0% respectively.
4(c)
Fiscal year ended 2017 – 0%
Fiscal year ended 2016 – 0%
Percentage of services provided to the registrants investment adviser and any entity controlling, controlled by, or under common control with the investment adviser that provides ongoing services to the registrant that were approved by the registrants audit committee pursuant to paragraph (c)(7)(i)(C) of Rule 2-01 of Regulation S-X, 0% and 0% respectively.
4(d)
Fiscal year ended 2017 – 0%
Fiscal year ended 2016 – 0%
Percentage of services provided to the registrants investment adviser and any entity controlling, controlled by, or under common control with the investment adviser that provides ongoing services to the registrant that were approved by the registrants audit committee pursuant to paragraph (c)(7)(i)(C) of Rule 2-01 of Regulation S-X, 0% and 0% respectively.
| (f) | NA |
| (g) | Non-Audit Fees billed to the registrant, the registrant’s investment adviser, and certain entities controlling, controlled by or under common control with the investment adviser: |
Fiscal year ended 2017 - $227,719
Fiscal year ended 2016 - $49,779
| (h) | The registrant’s Audit Committee has considered that the provision of non-audit services that were rendered to the registrant’s adviser (not including any sub-adviser whose role is primarily portfolio management and is subcontracted with or overseen by another investment adviser), and any entity controlling, controlled by, or under common control with the investment adviser that provides ongoing services to the registrant that were not pre-approved pursuant to paragraph (c)(7)(ii) of Rule 2-01 of Regulation S-X is compatible with maintaining the principal accountant’s independence. |
In its required communications to the Audit Committee of the registrant’s Board, Ernst & Young LLP (“EY”), the registrant’s independent public accountant, informed the Audit Committee that EY and/ or covered person professionals within EY maintain lending relationships with certain owners of greater than 10% of the shares of the registrant and/or certain investment companies within the “investment company complex” as defined under Rule 2-01(f)(14) of Regulation S-X, which are affiliates of the registrant. EY has advised the Audit Committee that these lending relationships implicate Rule 2-01(c)(1)(ii)(A) of Regulation S-X (referred to as the “Loan Rule”). The Loan Rule prohibits an independent public accountant, or covered person professionals at such firm, from having a financial relationship (such as a loan) with a lender that is a record or beneficial owner of more than 10% of an audit client’s equity securities. For purposes of the Loan Rule, audit clients include the registrant, as well as all registered investment companies advised by advisory subsidiaries of Federated Investors, Inc., the Adviser (for which EY serves as independent public accountant), and their respective affiliates (collectively, the “Federated Fund Complex”).
EY informed the Audit Committee that EY believes that these lending relationships described above do not and will not impair EY’s ability to exercise objective and impartial judgment in connection with the audits of the financial statements for the registrant and a reasonable investor with knowledge of all relevant facts and circumstances would conclude that EY has been and is capable of objective and impartial judgment on all issues encompassed within EY’s audits.
On June 20, 2016, the Division of Investment Management of the Securities and Exchange Commission (“SEC”) issued a no-action letter to another mutual fund complex (see Fidelity Management & Research Company et al., No-Action Letter) related to similar Loan Rule matters as those described above. In that letter, the SEC Staff confirmed that it would not recommend enforcement action against an investment company that relied on the audit services performed by an independent public accountant where the Loan Rule was implicated in certain specified circumstances. In that letter, the SEC staff indicated that it would not recommend enforcement action against the investment company complex if the Loan Rule is implicated provided that: (1) the auditor has complied with PCAOB Rule 3526(b)(1) and 3526(b)(2); (2) the Loan Rule is implicated because of lending relationships; and (3) notwithstanding such lending relationships that implicate the Loan Rule, the auditor has concluded that it is objective and impartial with respect to the issues encompassed within its engagement as auditor of the funds. The circumstances described in the no-action letter are substantially similar to the circumstances that implicated the Loan Rule with respect to EY and the registrant. The relief provided in the SEC no-action letter is effective for 18 months from its June 20, 2016 issuance date.
If it were to be determined that the relief available under the no-action letter was improperly relied upon, or that the independence requirements under the federal securities laws were not otherwise complied with regarding the registrant, for certain periods, any of the registrant’s filings with the SEC which contain financial statements of the registrant for such periods may not comply with applicable federal securities laws, the registrant’s ability to offer shares under its current registration statement may be impacted, and certain financial reporting and/or other covenants with, and representations and warranties to, the registrant’s lender under its committed line of credit may be impacted. Such events could have a material adverse effect on the registrant and the Federated Fund Complex.
| Item 5. | Audit Committee of Listed Registrants |
Not Applicable
| Item 6. | Schedule of Investments |
(a) The registrant’s Schedule of Investments is included as part of the Report to Stockholders filed under Item 1 of this form.
(b) Not Applicable; Fund had no divestments during the reporting period covered since the previous Form N-CSR filing.
| Item 7. | Disclosure of Proxy Voting Policies and Procedures for Closed-End Management Investment Companies |
Not Applicable
| Item 8. | Portfolio Managers of Closed-End Management Investment Companies |
Not Applicable
| Item 9. | Purchases of Equity Securities by Closed-End Management Investment Company and Affiliated Purchasers |
Not Applicable
| Item 10. | Submission of Matters to a Vote of Security Holders |
No Changes to Report
| Item 11. | Controls and Procedures |
(a) The registrant’s President and Treasurer have concluded that the
registrant’s disclosure controls and procedures (as defined in rule 30a-3(c) under the Act) are effective in design and operation and are sufficient to form the basis of the certifications required by Rule 30a-(2) under the Act, based on their evaluation of these disclosure controls and procedures within 90 days of the filing date of this report on Form N-CSR.
(b) There were no changes in the registrant’s internal control over financial reporting (as defined in rule 30a-3(d) under the Act) during the second fiscal quarter of the period covered by this report that have materially affected, or are reasonably likely to materially affect, the registrant’s internal control over financial reporting.
| Item 12. | Exhibits |
(a)(1) Code of Ethics- Not Applicable to this Report.
(a)(2) Certifications of Principal Executive Officer and Principal Financial Officer.
(a)(3) Not Applicable.
(b) Certifications pursuant to 18 U.S.C. Section 1350.
SIGNATURES
Pursuant to the requirements of the Securities Exchange Act of 1934 and the Investment Company Act of 1940, the registrant has duly caused this report to be signed on its behalf by the undersigned, thereunto duly authorized.
Registrant Federated Total Return Government Bond Fund
By /S/ Lori A. Hensler
Lori A. Hensler, Principal Financial Officer
Date April 24, 2017
Pursuant to the requirements of the Securities Exchange Act of 1934 and the Investment Company Act of 1940, this report has been signed below by the following persons on behalf of the registrant and in the capacities and on the dates indicated.
By /S/ J. Christopher Donahue
J. Christopher Donahue, Principal Executive Officer
Date April 24, 2017
By /S/ Lori A. Hensler
Lori A. Hensler, Principal Financial Officer
Date April 24, 2017