Table of Contents
Exhibit 99.1
| TD Bank Group Reports Third Quarter 2019 Results Report to Shareholders•Three and Nine months ended July 31, 2019 |

The financial information in this document is reported in Canadian dollars and is based on the Bank's unaudited Interim Consolidated Financial Statements and related Notes prepared in accordance with International Financial Reporting Standards (IFRS) as issued by the International Accounting Standards Board (IASB), unless otherwise noted.
Reported results conform to generally accepted accounting principles (GAAP), in accordance with IFRS. Adjusted measures arenon-GAAP measures. Refer to the "How the Bank Reports" section of the Management's Discussion and Analysis (MD&A) for an explanation of reported and adjusted results.
THIRD QUARTER FINANCIAL HIGHLIGHTS, compared with the third quarter last year:
| • | Reported diluted earnings per share were $1.74, compared with $1.65. |
| • | Adjusted diluted earnings per share were $1.79, compared with $1.66. |
| • | Reported net income was $3,248 million, compared with $3,105 million. |
| • | Adjusted net income was $3,338 million, compared with $3,127 million. |
YEAR-TO-DATE FINANCIAL HIGHLIGHTS, nine months ended July 31, 2019, compared with the corresponding period last year:
| • | Reported diluted earnings per share were $4.71, compared with $4.43. |
| • | Adjusted diluted earnings per share were $5.11, compared with $4.84. |
| • | Reported net income was $8,830 million, compared with $8,374 million. |
| • | Adjusted net income was $9,557 million, compared with $9,135 million. |
THIRD QUARTER ADJUSTMENTS (ITEMS OF NOTE)
The third quarter reported earnings figures included the following items of note:
| • | Amortization of intangibles of $75 million ($64 millionafter-tax or 3 cents per share), compared with $77 million ($65 millionafter-tax or 3 cents per share) in the third quarter last year. |
| • | Charges associated with the acquisition of Greystone of $26 million ($26 millionafter-tax or 2 cents per share). |
TORONTO, August 29, 2019 – TD Bank Group ("TD" or the "Bank") today announced its financial results for the third quarter ended July 31, 2019. Third quarter reported earnings were $3.2 billion, up 5%, and adjusted earnings were $3.3 billion, up 7%, compared with the same quarter last year.
"This was a great quarter for TD, reflecting increased earnings and revenue growth across all of our business segments," said Bharat Masrani, Group President and Chief Executive Officer, TD Bank Group. "Our record earnings are a testament to the strength of our diversified business model which enables us to enrich the lives of our customers as we continue to innovate for the future."
Canadian Retail
Canadian Retail reported net income of $1,890 million and adjusted net income of $1,916 million, an increase of 2% and 3%, respectively, compared with the same quarter last year. Revenue grew by 6% reflecting increased volumes and higher margins, and higher revenue in its wealth and insurance businesses. Canadian Retail continues to invest in new capabilities to make it easier for customers to manage their finances. This quarter, to further support its New to Canada strategy, Canadian Retail launched a new online money transfer service allowing customers to quickly and easily send money around the world from their TD personal accounts.
U.S. Retail
U.S. Retail reported and adjusted net income was $1,287 million (US$967 million), an increase of 13% (10% in U.S. dollars) on a reported basis and 11% (9% in U.S. dollars) on an adjusted basis, compared with the same quarter last year. TD Ameritrade contributed $294 million (US$220 million) in reported and adjusted earnings to the segment, an increase of 31% (26% in U.S. dollars) on a reported basis and 21% (17% in U.S. dollars) on an adjusted basis, compared to the same quarter last year.
The U.S. Retail Bank, which excludes the Bank's investment in TD Ameritrade, contributed $993 million (US$747 million), up 8% (6% in U.S. dollars) from the same quarter last year. Earnings growth reflects higher loan and deposit volumes. The U.S. Retail Bank remains focused on providing legendary customer service with the launch of its new digital mortgage offering that streamlines and accelerates the customer's home buying experience. Additionally, it launched new capabilities to align the U.S. Retail Bank and TD Ameritrade online platforms to enhance the customer experience. U.S. Retail continues to invest in its digital capabilities and further connectivity across its businesses.
Wholesale
Wholesale Banking reported net income of $244 million this quarter, an increase of 9% compared to the same quarter last year, reflecting higher revenue, partially offset by highernon-interest expenses and higher provisions for credit losses. Revenue for the quarter was $914 million, an increase of 13% compared with the third quarter last year, reflecting higher trading-related revenue, partially offset by lower fee revenue. The Wholesale Bank continues to focus on the global expansion of its U.S. dollar strategy.
Capital
TD's Common Equity Tier 1 Capital ratio on a Basel III fullyphased-in basis was 12.0%.
Innovation
"We continue to advance our innovation priorities, introduce new omni-channel capabilities and provide customers with the experiences they expect in a digital world," added Masrani. "We also promote innovation in the communities in which we operate. With the launch of this year's TD Ready Challenge, focused on Better Health, we are offering a total of 10 grants of $1 million each, to be awarded to 10 organizations offering innovative solutions for a changing world."
| TD BANK GROUP• THIRD QUARTER 2019• REPORT TO SHAREHOLDERS | Page 1 |
Table of Contents
Conclusion
"I am very pleased with our performance this quarter," added Masrani. "As we head into the final quarter of the year, the macroeconomic environment has become less supportive. With the strength of our franchise and the investments we've been making in our capabilities, I am confident in our ability to continue meeting our customers' needs while delivering value for shareholders."
"I want to thank our more than 85,000 colleagues around the world for their contributions to our success," concluded Masrani. "Our results this quarter are a true reflection of their hard work and dedication."
The foregoing contains forward-looking statements. Please refer to the "Caution Regarding Forward-Looking Statements" on page 4.
| TD BANK GROUP• THIRD QUARTER 2019• REPORT TO SHAREHOLDERS | Page 2 |
Table of Contents
ENHANCED DISCLOSURE TASK FORCE
The Enhanced Disclosure Task Force (EDTF) was established by the Financial Stability Board in 2012 to identify fundamental disclosure principles, recommendations and leading practices to enhance risk disclosures of banks. The index below includes the recommendations (as published by the EDTF) and lists the location of the related EDTF disclosures presented in the third quarter 2019 Report to Shareholders (RTS), Supplemental Financial Information (SFI), or Supplemental Regulatory Disclosures (SRD). Information on TD's website, SFI, and SRD is not and should not be considered incorporated herein by reference into the third quarter 2019 RTS, Management's Discussion and Analysis, or the Interim Consolidated Financial Statements. Certain disclosure references have been made to the Bank's 2018 Annual Report.
Type of Risk | Topic | EDTF Disclosure |
Page
| |||||||||
| RTS Third Quarter 2019 | SFI Third Quarter 2019 | SRD Third Quarter 2019 | Annual Report 2018 | |||||||||
General | 1 | Present all related risk information together in any particular report.
| Refer to below for location of disclosures
| |||||||||
| 2 | The bank's risk terminology and risk measures and present key parameter values used.
| 71-76,81,87, 89-91, 101-103 | ||||||||||
| 3 | Describe and discuss top and emerging risks.
| 67-71 | ||||||||||
| 4 | Outline plans to meet each new key regulatory ratio once applicable rules are finalized.
| 27, 33, 40 | 62-63,95-96, 98 | |||||||||
Risk Governance and Risk Management and Business Model | 5 | Summarize the bank's risk management organization, processes, and key functions.
| 72-75 | |||||||||
| 6 | Description of the bank's risk culture and procedures applied to support the culture.
| 71-72 | ||||||||||
| 7 | Description of key risks that arise from the bank's business models and activities.
| 61, 71, 76-103 | ||||||||||
| 8 | Description of stress testing within the bank's risk governance and capital frameworks.
| 31 | 60,75-76, 84,101 | |||||||||
Capital Adequacy and Risk Weighted Assets | 9 | Pillar 1 capital requirements and the impact for global systemically important banks.
| 26-27, 76 | 1-3, 6 | 57-59, 63, 211 | |||||||
| 10 | Composition of capital and reconciliation of accounting balance sheet to the regulatory balance sheet.
| 1-3, 5 | 57 | |||||||||
| 11 | Flow statement of the movements in regulatory capital.
| 4 | ||||||||||
| 12 | Discussion of capital planning within a more general discussion of management's strategic planning.
| 58-60, 101 | ||||||||||
| 13 | Analysis of how risk-weighted assets (RWA) relate to business activities and related risks.
| 4-7 | 60-61 | |||||||||
| 14 | Analysis of capital requirements for each method used for calculating RWA.
| 31 | 10 | 77-79,81, 83-84 | ||||||||
| 15 | Tabulate credit risk in the banking book for Basel asset classes and major portfolios.
| 21-34, 37-42 | ||||||||||
| 16 | Flow statement reconciling the movements of RWA by risk type.
| 27-28 | 11-12 | |||||||||
| 17 | Discussion of Basel III back-testing requirements.
| 51 | 80, 84, 89 | |||||||||
| Liquidity | 18 | The bank's management of liquidity needs and liquidity reserves.
| 33-35, 37-38 | 91-93 | ||||||||
| Funding | 19 | Encumbered and unencumbered assets in a table by balance sheet category.
| 36 | 94,204 | ||||||||
| 20 | Tabulate consolidated total assets, liabilities andoff-balance sheet commitments by remaining contractual maturity at the balance sheet date.
| 40-42 | 98-100 | |||||||||
| 21 | Discussion of the bank's funding sources and the bank's funding strategy.
| 36-37,39-40 | 97-98 | |||||||||
| Market Risk | 22 | Linkage of market risk measures for trading andnon-trading portfolio and balance sheet.
| 30 | 82 | ||||||||
| 23 | Breakdown of significant trading andnon-trading market risk factors.
| 30-33 | 82,84-87 | |||||||||
| 24 | Significant market risk measurement model limitations and validation procedures.
| 31 | 83-87, 89 | |||||||||
| 25 | Primary risk management techniques beyond reported risk measures and parameters.
| 31 | 83-87 | |||||||||
| Credit Risk | 26 | Provide information that facilitates users' understanding of the bank's credit risk profile, including any significant credit risk concentrations.
| 22-25,62-67 | 15-31 | 1-5,10-11, 13-51 | 44-57,76-81, 162-169, 178, 180-182,209-210 | ||||||
| 27 | Description of the bank's policies for identifying impaired loans.
| 67 | 52,130-131,137-138, 168 | |||||||||
| 28 | Reconciliation of the opening and closing balances of impaired loans in the period and the allowance for loan losses.
| 22,64-67 | 19, 23-24 | 49,165-167 | ||||||||
| 29 | Analysis of the bank's counterparty credit risks that arise from derivative transactions.
| 35-36,43-47 | 79-80, 147, 174-175,178, 180-182 | |||||||||
| 30 | Discussion of credit risk mitigation, including collateral held for all sources of credit risk.
| 80, 134, 147 | ||||||||||
| Other Risks | 31 | Description of 'other risk' types based on management's classifications and discuss how each one is identified, governed, measured, and managed.
| 87-90, 101-103 | |||||||||
| 32 | Discuss publicly known risk events related to other risks.
| 74 | 70-71,202-204 | |||||||||
| TD BANK GROUP• THIRD QUARTER 2019• REPORT TO SHAREHOLDERS | Page 3 |
Table of Contents
MANAGEMENT'S DISCUSSION AND ANALYSIS OF OPERATING PERFORMANCE
This MD&A is presented to enable readers to assess material changes in the financial condition and operating results of TD Bank Group ("TD" or the "Bank") for the three and nine months ended July 31, 2019, compared with the corresponding periods shown. This MD&A should be read in conjunction with the Bank's unaudited Interim Consolidated Financial Statements and related Notes included in this Report to Shareholders and with the 2018 Consolidated Financial Statements and related Notes and 2018 MD&A. This MD&A is dated August 28, 2019. Unless otherwise indicated, all amounts are expressed in Canadian dollars and have been primarily derived from the Bank's 2018 Consolidated Financial Statements and related Notes or Interim Consolidated Financial Statements and related Notes, prepared in accordance with IFRS as issued by the IASB. Note that certain comparative amounts have been revised to conform with the presentation adopted in the current period. Additional information relating to the Bank, including the Bank's 2018 Annual Information Form, is available on the Bank's website at http://www.td.com, as well as on SEDAR at http://www.sedar.com and on the SEC's website at http://www.sec.gov (EDGAR filers section).
Caution Regarding Forward-Looking Statements
From time to time, the Bank (as defined in this document) makes written and/or oral forward-looking statements, including in this document, in other filings with Canadian regulators or the United States (U.S.) Securities and Exchange Commission (SEC), and in other communications. In addition, representatives of the Bank may make forward-looking statements orally to analysts, investors, the media, and others. All such statements are made pursuant to the "safe harbour" provisions of, and are intended to be forward-looking statements under, applicable Canadian and U.S. securities legislation, including theU.S. Private Securities Litigation Reform Act of 1995. Forward-looking statements include, but are not limited to, statements made in this document, the Management's Discussion and Analysis ("2018 MD&A") in the Bank's 2018 Annual Report under the heading "Economic Summary and Outlook", for the Canadian Retail, U.S. Retail, and Wholesale Banking segments under headings "Business Outlook and Focus for 2019", and for the Corporate segment, "Focus for 2019", and in other statements regarding the Bank's objectives and priorities for 2019 and beyond and strategies to achieve them, the regulatory environment in which the Bank operates, and the Bank's anticipated financial performance. Forward-looking statements are typically identified by words such as "will", "would", "should", "believe", "expect", "anticipate", "intend", "estimate", "plan", "goal", "target", "may", and "could".
By their very nature, these forward-looking statements require the Bank to make assumptions and are subject to inherent risks and uncertainties, general and specific. Especially in light of the uncertainty related to the physical, financial, economic, political, and regulatory environments, such risks and uncertainties – many of which are beyond the Bank's control and the effects of which can be difficult to predict – may cause actual results to differ materially from the expectations expressed in the forward-looking statements. Risk factors that could cause, individually or in the aggregate, such differences include: credit, market (including equity, commodity, foreign exchange, interest rate, and credit spreads), liquidity, operational (including technology and infrastructure), reputational, insurance, strategic, regulatory, legal, environmental, capital adequacy, and other risks. Examples of such risk factors include the general business and economic conditions in the regions in which the Bank operates; the ability of the Bank to execute on key priorities, including the successful completion of acquisitions and dispositions, business retention plans, and strategic plans and to attract, develop, and retain key executives; disruptions in or attacks (including cyber-attacks) on the Bank's information technology, internet, network access or other voice or data communications systems or services; the evolution of various types of fraud or other criminal behaviour to which the Bank is exposed; the failure of third parties to comply with their obligations to the Bank or its affiliates, including relating to the care and control of information; the impact of new and changes to, or application of, current laws and regulations, including without limitation tax laws, capital guidelines and liquidity regulatory guidance, and the bank recapitalization"bail-in" regime; exposure related to significant litigation and regulatory matters; increased competition, including through internet and mobile banking andnon-traditional competitors; changes to the Bank's credit ratings; changes in currency and interest rates (including the possibility of negative interest rates); increased funding costs and market volatility due to market illiquidity and competition for funding; critical accounting estimates and changes to accounting standards, policies, and methods used by the Bank; existing and potential international debt crises; and the occurrence of natural and unnatural catastrophic events and claims resulting from such events. The Bank cautions that the preceding list is not exhaustive of all possible risk factors and other factors could also adversely affect the Bank's results. For more detailed information, please refer to the "Risk Factors and Management" section of the 2018 MD&A, as may be updated in subsequently filed quarterly reports to shareholders and news releases (as applicable) related to any events or transactions discussed under the headings "Significant Events" and "Significant and Subsequent Events in 2019" in the relevant MD&A, which applicable releases may be found on www.td.com. All such factors should be considered carefully, as well as other uncertainties and potential events, and the inherent uncertainty of forward-looking statements, when making decisions with respect to the Bank and the Bank cautions readers not to place undue reliance on the Bank's forward-looking statements.
Material economic assumptions underlying the forward-looking statements contained in this document are set out in the 2018 MD&A under the headings "Economic Summary and Outlook", for the Canadian Retail, U.S. Retail, and Wholesale Banking segments, "Business Outlook and Focus for 2019", and for the Corporate segment, "Focus for 2019", each as may be updated in subsequently filed quarterly reports to shareholders.
Any forward-looking statements contained in this document represent the views of management only as of the date hereof and are presented for the purpose of assisting the Bank's shareholders and analysts in understanding the Bank's financial position, objectives and priorities and anticipated financial performance as at and for the periods ended on the dates presented, and may not be appropriate for other purposes. The Bank does not undertake to update any forward-looking statements, whether written or oral, that may be made from time to time by or on its behalf, except as required under applicable securities legislation.
This document was reviewed by the Bank's Audit Committee and was approved by the Bank's Board of Directors, on the Audit Committee's recommendation, prior to its release.
| TD BANK GROUP• THIRD QUARTER 2019• REPORT TO SHAREHOLDERS | Page 4 |
Table of Contents
(millions of Canadian dollars, except as noted) | As at or for the three months ended | As at or for the nine months ended | ||||||||||||||||||
| | July 31 2019 | | | April 30 2019 | | | July 31 2018 | | | July 31 2019 |
| | July 31 2018 |
| ||||||
Results of operations | ||||||||||||||||||||
Total revenue | $ | 10,499 | $ | 10,228 | $ | 9,899 | $ | 30,725 | $ | 28,756 | ||||||||||
Provision for credit losses | 655 | 633 | 561 | 2,138 | 1,810 | |||||||||||||||
Insurance claims and related expenses | 712 | 668 | 627 | 2,082 | 1,760 | |||||||||||||||
Non-interest expenses – reported | 5,374 | 5,248 | 5,131 | 16,477 | 14,829 | |||||||||||||||
Non-interest expenses – adjusted2 | 5,298 | 5,163 | 5,078 | 15,622 | 14,630 | |||||||||||||||
Net income – reported | 3,248 | 3,172 | 3,105 | 8,830 | 8,374 | |||||||||||||||
Net income – adjusted2 | 3,338 | 3,266 | 3,127 | 9,557 | 9,135 | |||||||||||||||
Financial position(billions of Canadian dollars) | ||||||||||||||||||||
Total loans net of allowance for loan losses | $ | 675.9 | $ | 663.6 | $ | 635.2 | $ | 675.9 | $ | 635.2 | ||||||||||
Total assets | 1,405.4 | 1,356.6 | 1,292.5 | 1,405.4 | 1,292.5 | |||||||||||||||
Total deposits | 870.3 | 875.3 | 838.6 | 870.3 | 838.6 | |||||||||||||||
Total equity | 86.4 | 84.9 | 77.7 | 86.4 | 77.7 | |||||||||||||||
Total Common Equity Tier 1 Capital risk-weighted assets3 | 454.9 | 452.3 | 428.9 | 454.9 | 428.9 | |||||||||||||||
Financial ratios | ||||||||||||||||||||
Return on common equity – reported | 15.8 | % | 16.5 | % | 16.9 | % | 14.8 | % | 15.6 | % | ||||||||||
Return on common equity – adjusted4 | 16.2 | 17.0 | 17.1 | 16.1 | 17.1 | |||||||||||||||
Return on tangible common equity4 | 22.0 | 23.4 | 24.5 | 21.0 | 22.7 | |||||||||||||||
Return on tangible common equity – adjusted4 | 22.2 | 23.6 | 24.2 | 22.3 | 24.3 | |||||||||||||||
Efficiency ratio – reported | 51.2 | 51.3 | 51.8 | 53.6 | 51.6 | |||||||||||||||
Efficiency ratio – adjusted2 | 50.5 | 50.5 | 51.3 | 50.8 | 50.7 | |||||||||||||||
Provision for credit losses as a % of net average loans and acceptances5 | 0.38 | 0.39 | 0.35 | 0.43 | 0.39 | |||||||||||||||
Common share information – reported(Canadian dollars) | ||||||||||||||||||||
Per share earnings | ||||||||||||||||||||
Basic | $ | 1.75 | $ | 1.70 | $ | 1.65 | $ | 4.72 | $ | 4.44 | ||||||||||
Diluted | 1.74 | 1.70 | 1.65 | 4.71 | 4.43 | |||||||||||||||
Dividends per share | 0.74 | 0.74 | 0.67 | 2.15 | 1.94 | |||||||||||||||
Book value per share | 44.30 | 43.51 | 39.34 | 44.30 | 39.34 | |||||||||||||||
Closing share price6 | 77.15 | 76.42 | 77.17 | 77.15 | 77.17 | |||||||||||||||
Shares outstanding (millions) | ||||||||||||||||||||
Average basic | 1,825.3 | 1,826.6 | 1,830.0 | 1,828.4 | 1,838.4 | |||||||||||||||
Average diluted | 1,828.6 | 1,830.0 | 1,834.0 | 1,831.6 | 1,842.6 | |||||||||||||||
End of period | 1,819.2 | 1,828.4 | 1,826.1 | 1,819.2 | 1,826.1 | |||||||||||||||
Market capitalization (billions of Canadian dollars) | $ | 140.4 | $ | 139.7 | $ | 140.9 | $ | 140.4 | $ | 140.9 | ||||||||||
Dividend yield7 | 3.9 | % | 3.9 | % | 3.5 | % | 3.9 | % | 3.5 | % | ||||||||||
Dividend payout ratio | 42.3 | 43.4 | 40.4 | 45.5 | 43.7 | |||||||||||||||
Price-earnings ratio | 12.3 | 12.3 | 13.2 | 12.3 | 13.2 | |||||||||||||||
Total shareholder return (1 year)8 | 3.9 | 10.0 | 24.3 | 3.9 | 24.3 | |||||||||||||||
Common share information – adjusted(Canadian dollars)2 | ||||||||||||||||||||
Per share earnings | ||||||||||||||||||||
Basic | $ | 1.79 | $ | 1.75 | $ | 1.67 | $ | 5.12 | $ | 4.85 | ||||||||||
Diluted | 1.79 | 1.75 | 1.66 | 5.11 | 4.84 | |||||||||||||||
Dividend payout ratio | 41.1 | % | 42.1 | % | 40.1 | % | 41.9 | % | 40.0 | % | ||||||||||
Price-earnings ratio | 11.4 | 11.6 | 12.4 | 11.4 | 12.4 | |||||||||||||||
Capital ratios | ||||||||||||||||||||
Common Equity Tier 1 Capital ratio3 | 12.0 | % | 12.0 | % | 11.7 | % | 12.0 | % | 11.7 | % | ||||||||||
Tier 1 Capital ratio3 | 13.4 | 13.5 | 13.3 | 13.4 | 13.3 | |||||||||||||||
Total Capital ratio3 | 16.1 | 15.8 | 15.4 | 16.1 | 15.4 | |||||||||||||||
Leverage ratio | 4.1 | 4.2 | 4.1 | 4.1 | 4.1 | |||||||||||||||
| 1 | Certain comparative amounts have been recast to conform with the presentation adopted in the current period. |
| 2 | Adjusted measures arenon-GAAP measures. Refer to the "How the Bank Reports" section of this document for an explanation of reported and adjusted results. |
| 3 | Each capital ratio has its own risk-weighted assets (RWA) measure due to the Office of the Superintendent of Financial Institutions Canada (OSFI) prescribed scalar for inclusion of the Credit Valuation Adjustment (CVA). For fiscal 2019, the scalars for inclusion of CVA for Common Equity Tier 1 (CET1), Tier 1, and Total Capital RWA are all 100%. For fiscal 2018, the scalars for inclusion were 80%, 83%, and 86%, respectively. |
| 4 | Metrics arenon-GAAP financial measures. Refer to the "Return on Common Equity" and "Return on Tangible Common Equity" sections of this document for an explanation. |
| 5 | Excludes acquired credit-impaired (ACI) loans. |
| 6 | Toronto Stock Exchange (TSX) closing market price. |
| 7 | Dividend yield is calculated as the annualized dividend per common share paid divided by daily average closing stock price in the relevant period. Dividend per common share is derived as follows: a) for the quarter – by annualizing the dividend per common share paid during the quarter; and b) for theyear-to-date – by annualizing theyear-to-date dividend per common share paid. |
| 8 | Total shareholder return is calculated based on share price movement and dividends reinvested over a trailingone-year period. |
| TD BANK GROUP• THIRD QUARTER 2019• REPORT TO SHAREHOLDERS | Page 5 |
Table of Contents
Corporate Overview
The Toronto-Dominion Bank and its subsidiaries are collectively known as TD Bank Group ("TD" or the "Bank"). TD is the fifth largest bank in North America by branches and serves over 26 million customers in three key businesses operating in a number of locations in financial centres around the globe: Canadian Retail, which includes the results of the Canadian personal and commercial banking, wealth, and insurance businesses; U.S. Retail, which includes the results of the U.S. personal and business banking operations, wealth management services, and the Bank's investment in TD Ameritrade; and Wholesale Banking. TD also ranks among the world's leading online financial services firms, with more than 13 million active online and mobile customers. TD had $1.4 trillion in assets on July 31, 2019. The Toronto-Dominion Bank trades under the symbol "TD" on the Toronto and New York Stock Exchanges.
How the Bank Reports
The Bank prepares its Interim Consolidated Financial Statements in accordance with IFRS, the current GAAP, and refers to results prepared in accordance with IFRS as "reported" results. The Bank also utilizesnon-GAAP financial measures referred to as "adjusted" results to assess each of its businesses and to measure the Bank's overall performance. To arrive at adjusted results, the Bank removes "items of note", from reported results. The items of note relate to items which management does not believe are indicative of underlying business performance. The Bank believes that adjusted results provide the reader with a better understanding of how management views the Bank's performance. The items of note are disclosed in Table 3. As explained, adjusted results differ from reported results determined in accordance with IFRS. Adjusted results, items of note, and related terms used in this document are not defined terms under IFRS and, therefore, may not be comparable to similar terms used by other issuers.
The Bank's U.S. strategic cards portfolio comprises agreements with certain U.S. retailers pursuant to which TD is the U.S. issuer of private label andco-branded consumer credit cards to their U.S. customers. Under the terms of the individual agreements, the Bank and the retailers share in the profits generated by the relevant portfolios after credit losses. Under IFRS, TD is required to present the gross amount of revenue and provisions for credit losses related to these portfolios in the Bank's Interim Consolidated Statement of Income. At the segment level, the retailer program partners' share of revenues and credit losses is presented in the Corporate segment, with an offsetting amount (representing the partners' net share) recorded inNon-interest expenses, resulting in no impact to Corporate reported Net income (loss). The Net income (loss) included in the U.S. Retail segment includes only the portion of revenue and credit losses attributable to TD under the agreements.
The following table provides the operating results on a reported basis for the Bank.
TABLE 2: OPERATING RESULTS – Reported1
| (millions of Canadian dollars) | For the three months ended | For the nine months ended | ||||||||||||||||||
| July 31 2019 | April 30 2019 | July 31 2018 | July 31 2019 | July 31 2018 | ||||||||||||||||
Net interest income | $ | 6,024 | $ | 5,872 | $ | 5,655 | $ | 17,756 | $ | 16,483 | ||||||||||
Non-interest income | 4,475 | 4,356 | 4,244 | 12,969 | 12,273 | |||||||||||||||
Total revenue | 10,499 | 10,228 | 9,899 | 30,725 | 28,756 | |||||||||||||||
Provision for credit losses | 655 | 633 | 561 | 2,138 | 1,810 | |||||||||||||||
Insurance claims and related expenses | 712 | 668 | 627 | 2,082 | 1,760 | |||||||||||||||
Non-interest expenses | 5,374 | 5,248 | 5,131 | 16,477 | 14,829 | |||||||||||||||
Income before income taxes and equity in net income of aninvestment in TD Ameritrade | 3,758 | 3,679 | 3,580 | 10,028 | 10,357 | |||||||||||||||
Provision for income taxes | 813 | 773 | 705 | 2,089 | 2,491 | |||||||||||||||
Equity in net income of an investment in TD Ameritrade | 303 | 266 | 230 | 891 | 508 | |||||||||||||||
Net income – reported | 3,248 | 3,172 | 3,105 | 8,830 | 8,374 | |||||||||||||||
Preferred dividends | 62 | 62 | 59 | 184 | 163 | |||||||||||||||
Net income available to common shareholders andnon-controllinginterests in subsidiaries | $ | 3,186 | $ | 3,110 | $ | 3,046 | $ | 8,646 | $ | 8,211 | ||||||||||
Attributable to: | ||||||||||||||||||||
Common shareholders | $ | 3,186 | $ | 3,110 | $ | 3,028 | $ | 8,628 | $ | 8,157 | ||||||||||
Non-controlling interests | – | – | 18 | 18 | 54 | |||||||||||||||
| 1 | Certain comparative amounts have been recast to conform with the presentation adopted in the current period. |
| TD BANK GROUP• THIRD QUARTER 2019• REPORT TO SHAREHOLDERS | Page 6 |
Table of Contents
The following table provides a reconciliation between the Bank's adjusted and reported results.
TABLE 3:NON-GAAP FINANCIAL MEASURES – Reconciliation of Adjusted to Reported Net Income1
| (millions of Canadian dollars) | For the three months ended | For the nine months ended | ||||||||||||||||||
| July 31 2019 | April 30 2019 | July 31 2018 | July 31 2019 | July 31 2018 | ||||||||||||||||
Operating results – adjusted | ||||||||||||||||||||
Net interest income | $ | 6,024 | $ | 5,872 | $ | 5,655 | $ | 17,756 | $ | 16,483 | ||||||||||
Non-interest income2 | 4,475 | 4,356 | 4,244 | 12,969 | 12,362 | |||||||||||||||
Total revenue | 10,499 | 10,228 | 9,899 | 30,725 | 28,845 | |||||||||||||||
Provision for credit losses | 655 | 633 | 561 | 2,138 | 1,810 | |||||||||||||||
Insurance claims and related expenses | 712 | 668 | 627 | 2,082 | 1,760 | |||||||||||||||
Non-interest expenses3 | 5,298 | 5,163 | 5,078 | 15,622 | 14,630 | |||||||||||||||
Income before income taxes and equity in net income of aninvestment in TD Ameritrade | 3,834 | 3,764 | 3,633 | 10,883 | 10,645 | |||||||||||||||
Provision for income taxes | 824 | 787 | 778 | 2,289 | 2,194 | |||||||||||||||
Equity in net income of an investment in TD Ameritrade4 | 328 | 289 | 272 | 963 | 684 | |||||||||||||||
Net income – adjusted | 3,338 | 3,266 | 3,127 | 9,557 | 9,135 | |||||||||||||||
Preferred dividends | 62 | 62 | 59 | 184 | 163 | |||||||||||||||
Net income available to common shareholders andnon-controllinginterests in subsidiaries – adjusted | 3,276 | 3,204 | 3,068 | 9,373 | 8,972 | |||||||||||||||
Attributable to: | ||||||||||||||||||||
Non-controlling interests in subsidiaries, net of income taxes | – | – | 18 | 18 | 54 | |||||||||||||||
Net income available to common shareholders – adjusted | 3,276 | 3,204 | 3,050 | 9,355 | 8,918 | |||||||||||||||
Pre-tax adjustments of items of note | ||||||||||||||||||||
Amortization of intangibles5 | (75 | ) | (78 | ) | (77 | ) | (233 | ) | (248 | ) | ||||||||||
Charges related to the long-term loyalty agreement with Air Canada6 | – | – | – | (607 | ) | – | ||||||||||||||
Charges associated with the acquisition of Greystone7 | (26 | ) | (30 | ) | – | (87 | ) | – | ||||||||||||
Charges associated with the Scottrade transaction8 | – | – | (18 | ) | – | (168 | ) | |||||||||||||
Impact from U.S. tax reform9 | – | – | – | – | (48 | ) | ||||||||||||||
Provision for (recovery of) income taxes for items of note | ||||||||||||||||||||
Amortization of intangibles5,10 | (11 | ) | (12 | ) | (12 | ) | (36 | ) | (42 | ) | ||||||||||
Charges related to the long-term loyalty agreement with Air Canada6 | – | – | – | (161 | ) | – | ||||||||||||||
Charges associated with the acquisition of Greystone7 | – | (2 | ) | – | (3 | ) | – | |||||||||||||
Charges associated with the Scottrade transaction8 | – | – | – | – | (5 | ) | ||||||||||||||
Impact from U.S. tax reform9 | – | – | (61 | ) | – | 344 | ||||||||||||||
Total adjustments for items of note | (90 | ) | (94 | ) | (22 | ) | (727 | ) | (761 | ) | ||||||||||
Net income available to common shareholders – reported | $ | 3,186 | $ | 3,110 | $ | 3,028 | $ | 8,628 | $ | 8,157 | ||||||||||
| 1 | Certain comparative amounts have been recast to conform with the presentation adopted in the current period. |
| 2 | AdjustedNon-interest income excludes the following item of note: Adjustment to the carrying balances of certain tax credit-related investments, as explained in footnote 9 – first quarter 2018 – $(89) million. This amount was reported in the Corporate segment. |
| 3 | AdjustedNon-interest expenses exclude the following items of note: Amortization of intangibles, as explained in footnote 5 – third quarter 2019 – $50 million, second quarter 2019 – $55 million, first quarter 2019 – $56 million, third quarter 2018 – $53 million, second quarter 2018 – $62 million, first quarter 2018 – $63 million; these amounts were reported in the Corporate segment. Charges related to the long-term loyalty agreement with Air Canada, as explained in footnote 6 – first quarter 2019 – $607 million; this amount was reported in the Canadian Retail segment. Charges associated with the acquisition of Greystone, as explained in footnote 7 – third quarter 2019 – $26 million, second quarter 2019 – $30 million, first quarter 2019 – $31 million; this amount was reported in the Canadian Retail segment. Charges associated with Scottrade transaction, as explained in footnote 8 – second quarter 2018 – $16 million and first quarter 2018 – $5 million; these amounts were reported in the U.S. Retail segment. |
| 4 | Adjusted Equity in net income of an investment in TD Ameritrade excludes the following items of note: Amortization of intangibles, as explained in footnote 5 – third quarter 2019 – $25 million, second quarter 2019 – $23 million, first quarter 2019 – $24 million, third quarter 2018 – $24 million, second quarter 2018 – $24 million, first quarter 2018 – $22 million; and the Bank's share of TD Ameritrade's deferred tax balances adjustment, as explained in footnote 9 – first quarter 2018 – $(41) million. The earnings impact of both of these items was reported in the Corporate segment. The Bank's share of charges associated with TD Ameritrade's acquisition of Scottrade Financial Services Inc. ("Scottrade"), as explained in footnote 8 – third quarter 2018 – $18 million, second quarter 2018 – $61 million, and first quarter 2018 – $68 million. This item was reported in the U.S. Retail segment. |
| 5 | Amortization of intangibles relates to intangibles acquired as a result of asset acquisitions and business combinations, including theafter-tax amounts for amortization of intangibles relating to the Equity in net income of the investment in TD Ameritrade. Although the amortization of software and asset servicing rights are recorded in amortization of intangibles, they are not included for purposes of the items of note. |
| 6 | On January 10, 2019, the Bank's long-term loyalty program agreement with Air Canada became effective in conjunction with Air Canada completing its acquisition of Aimia Canada Inc., which operates the Aeroplan loyalty business (the "Transaction"). In connection with the Transaction, the Bank recognized an expense of $607 million ($446 millionafter-tax) in the Canadian Retail segment during the first quarter of 2019. |
| 7 | On November 1, 2018, the Bank acquired Greystone Capital Management Inc., the parent company of Greystone Managed Investments Inc. ("Greystone"). The Bank incurred acquisition-related charges including compensation to employee shareholders issued in common shares in respect of the purchase price, direct transaction costs, and certain other acquisition-related costs. These amounts have been recorded as an adjustment to net income and were reported in the Canadian Retail segment. |
| 8 | On September 18, 2017, the Bank acquired Scottrade Bank and TD Ameritrade acquired Scottrade, together with the Bank's purchase of TD Ameritrade shares issued in connection with TD Ameritrade's acquisition of Scottrade (the "Scottrade transaction"). Scottrade Bank merged with TD Bank, N.A. The Bank and TD Ameritrade incurred acquisition-related charges including employee severance, contract termination fees, direct transaction costs, and otherone-time charges. These amounts have been recorded as an adjustment to net income and include charges associated with the Bank's acquisition of Scottrade Bank and theafter-tax amounts for the Bank's share of charges associated with TD Ameritrade's acquisition of Scottrade. These amounts were reported in the U.S. Retail segment. |
| 9 | In the first quarter of 2018, the reduction of the U.S. federal corporate tax rate enacted by theTax Cuts and Jobs Act(the "U.S. Tax Act") resulted in a net charge to earnings of $453 million, comprising a net $48 millionpre-tax charge related to the write-down of certain tax credit-related investments, partially offset by the favourable impact of the Bank's share of TD Ameritrade's remeasurement of its deferred income tax balances, and a net $405 million income tax expense resulting from the remeasurement of the Bank's deferred tax assets and liabilities to the lower base rate of 21% and other related tax adjustments. The amount was estimated during the first quarter of 2018 and was updated during the third quarter of 2018, resulting in a net $61 million deferred income tax benefit. The earnings impact was reported in the Corporate segment. |
| 10 | The amount reported for the nine months ended July 31, 2018, excludes $31 million relating to theone-time adjustment of associated deferred tax liability balances as a result of the U.S. Tax Act. The impact of this adjustment is included in the Impact from U.S. tax reform item of note. |
| TD BANK GROUP• THIRD QUARTER 2019• REPORT TO SHAREHOLDERS | Page 7 |
Table of Contents
TABLE 4: RECONCILIATION OF REPORTED TO ADJUSTED EARNINGS PER SHARE (EPS)1
| (Canadian dollars) | For the three months ended | For the nine months ended | ||||||||||||||||||
| July 31 2019 | April 30 2019 | July 31 2018 | July 31 2019 | July 31 2018 | ||||||||||||||||
Basic earnings per share – reported | $ | 1.75 | $ | 1.70 | $ | 1.65 | $ | 4.72 | $ | 4.44 | ||||||||||
Adjustments for items of note2 | 0.04 | 0.05 | 0.02 | 0.40 | 0.41 | |||||||||||||||
Basic earnings per share – adjusted | $ | 1.79 | $ | 1.75 | $ | 1.67 | $ | 5.12 | $ | 4.85 | ||||||||||
Diluted earnings per share – reported | $ | 1.74 | $ | 1.70 | $ | 1.65 | $ | 4.71 | $ | 4.43 | ||||||||||
Adjustments for items of note2 | 0.05 | 0.05 | 0.01 | 0.40 | 0.41 | |||||||||||||||
Diluted earnings per share – adjusted | $ | 1.79 | $ | 1.75 | $ | 1.66 | $ | 5.11 | $ | 4.84 | ||||||||||
| 1 | EPS is computed by dividing net income available to common shareholders by the weighted-average number of shares outstanding during the period. |
| 2 | For explanations of items of note, refer to the"Non-GAAP Financial Measures – Reconciliation of Adjusted to Reported Net Income" table in the "How We Performed" section of this document. |
TABLE 5: AMORTIZATION OF INTANGIBLES, NET OF INCOME TAXES1,2,3
| (millions of Canadian dollars) | For the three months ended | For the nine months ended | ||||||||||||||||||
| July 31 2019 | April 30 2019 | July 31 2018 | July 31 2019 | July 31 2018 | ||||||||||||||||
TD Bank, National Association (TD Bank, N.A.) | $ | 17 | $ | 21 | $ | 21 | $ | 59 | $ | 67 | ||||||||||
TD Ameritrade Holding Corporation (TD Ameritrade)4 | 25 | 23 | 24 | 72 | 70 | |||||||||||||||
MBNA Canada | 11 | 9 | 10 | 30 | 39 | |||||||||||||||
Aeroplan | 4 | 5 | 4 | 13 | 13 | |||||||||||||||
Other | 7 | 8 | 6 | 23 | 17 | |||||||||||||||
| 64 | 66 | 65 | 197 | 206 | ||||||||||||||||
Software and asset servicing rights | 116 | 117 | 107 | 343 | 335 | |||||||||||||||
Amortization of intangibles, net of income taxes | $ | 180 | $ | 183 | $ | 172 | $ | 540 | $ | 541 | ||||||||||
| 1 | Certain comparative amounts have been recast to conform with the presentation adopted in the current period. |
| 2 | The amount reported for the nine months ended July 31, 2018 excludes $31 million relating to theone-time adjustment of associated deferred tax liability balances as a result of the U.S. Tax Act. The impact of this adjustment is included in the Impact from U.S. tax reform item of note. |
| 3 | Amortization of intangibles, with the exception of software and asset servicing rights, is included as items of note. For explanations of items of note, refer to the"Non-GAAP Financial Measures – Reconciliation of Adjusted to Reported Net Income" table in the "How We Performed" section of this document. |
| 4 | Included in Equity in net income of an investment in TD Ameritrade. |
Return on Common Equity
The Bank's methodology for allocating capital to its business segments is aligned with the common equity capital requirements under Basel III. For fiscal 2019, the capital allocated to the business segments is based on 10% CET1 Capital. Capital allocated to the business segments was based on 9% for fiscal 2018.
Adjusted Return on common equity (ROE) is adjusted net income available to common shareholders as a percentage of average common equity.
Adjusted ROE is anon-GAAP financial measure as it is not a defined term under IFRS. Readers are cautioned that earnings and other measures adjusted to a basis other than IFRS do not have standardized meanings under IFRS and, therefore, may not be comparable to similar terms used by other issuers.
TABLE 6: RETURN ON COMMON EQUITY
| (millions of Canadian dollars, except as noted) | For the three months ended | For the nine months ended | ||||||||||||||||||
| July 31 2019 | April 30 2019 | July 31 2018 | July 31 2019 | July 31 2018 | ||||||||||||||||
Average common equity | $ | 80,160 | $ | 77,369 | $ | 70,935 | $ | 77,773 | $ | 69,849 | ||||||||||
Net income available to common shareholders – reported | 3,186 | 3,110 | 3,028 | 8,628 | 8,157 | |||||||||||||||
Items of note, net of income taxes1 | 90 | 94 | 22 | 727 | 761 | |||||||||||||||
Net income available to common shareholders – adjusted | $ | 3,276 | $ | 3,204 | $ | 3,050 | $ | 9,355 | $ | 8,918 | ||||||||||
Return on common equity – reported | 15.8 | % | 16.5 | % | �� | 16.9 | % | 14.8 | % | 15.6 | % | |||||||||
Return on common equity – adjusted | 16.2 | 17.0 | 17.1 | 16.1 | 17.1 | |||||||||||||||
| 1 | For explanations of items of note, refer to the"Non-GAAP Financial Measures – Reconciliation of Adjusted to Reported Net Income" table in the "How We Performed" section of this document. |
Return on Tangible Common Equity
Tangible common equity (TCE) is calculated as common shareholders' equity less goodwill, imputed goodwill and intangibles on an investment in TD Ameritrade and other acquired intangible assets, net of related deferred tax liabilities. Return on tangible common equity (ROTCE) is calculated as reported net income available to common shareholders after adjusting for theafter-tax amortization of acquired intangibles, which are treated as an item of note, as a percentage of average TCE. Adjusted ROTCE is calculated using reported net income available to common shareholders, adjusted for items of note, as a percentage of average TCE. Adjusted ROTCE provides a useful measure of the performance of the Bank's income producing assets, independent of whether or not they were acquired or developed internally. TCE, ROTCE, and adjusted ROTCE are eachnon-GAAP financial measures and are not defined terms under IFRS. Readers are cautioned that earnings and other measures adjusted to a basis other than IFRS do not have standardized meanings under IFRS and, therefore, may not be comparable to similar terms used by other issuers.
| TD BANK GROUP• THIRD QUARTER 2019• REPORT TO SHAREHOLDERS | Page 8 |
Table of Contents
TABLE 7: RETURN ON TANGIBLE COMMON EQUITY
| (millions of Canadian dollars, except as noted) | For the three months ended | For the nine months ended | ||||||||||||||||||
| July 31 2019 | April 30 2019 | July 31 2018 | July 31 2019 | July 31 2018 | ||||||||||||||||
Average common equity | $ | 80,160 | $ | 77,369 | $ | 70,935 | $ | 77,773 | $ | 69,849 | ||||||||||
Average goodwill | 17,123 | 17,083 | 16,339 | 17,073 | 16,136 | |||||||||||||||
Average imputed goodwill and intangibles on an investment in TD Ameritrade | 4,145 | 4,136 | 4,114 | 4,153 | 4,100 | |||||||||||||||
Average other acquired intangibles1 | 666 | 717 | 648 | 680 | 702 | |||||||||||||||
Average related deferred tax liabilities | (272 | ) | (269 | ) | (222 | ) | (259 | ) | (247 | ) | ||||||||||
Average tangible common equity | 58,498 | 55,702 | 50,056 | 56,126 | 49,158 | |||||||||||||||
Net income available to common shareholders – reported | 3,186 | 3,110 | 3,028 | 8,628 | 8,157 | |||||||||||||||
Amortization of acquired intangibles, net of income taxes2 | 64 | 66 | 65 | 197 | 206 | |||||||||||||||
Net income available to common shareholders after adjusting forafter-tax amortization of acquired intangibles | 3,250 | 3,176 | 3,093 | 8,825 | 8,363 | |||||||||||||||
Other items of note, net of income taxes2 | 26 | 28 | (43 | ) | 530 | 555 | ||||||||||||||
Net income available to common shareholders – adjusted | $ | 3,276 | $ | 3,204 | $ | 3,050 | $ | 9,355 | $ | 8,918 | ||||||||||
Return on tangible common equity | 22.0 | % | 23.4 | % | 24.5 | % | 21.0 | % | 22.7 | % | ||||||||||
Return on tangible common equity – adjusted | 22.2 | 23.6 | 24.2 | 22.3 | 24.3 | |||||||||||||||
| 1 | Excludes intangibles relating to software and asset servicing rights. |
| 2 | For explanations of items of note, refer to the"Non-GAAP Financial Measures – Reconciliation of Adjusted to Reported Net Income" table in the "How We Performed" section of this document. |
SIGNIFICANT EVENTS IN 2019
Agreement for Air Canada Credit Card Loyalty Program
On January 10, 2019, the Bank's long-term loyalty program agreement (the "Loyalty Agreement") with Air Canada became effective in conjunction with Air Canada completing its acquisition of Aimia Canada Inc., which operates the Aeroplan loyalty business (the "Transaction"). Under the terms of the Loyalty Agreement, the Bank will become the primary credit card issuer for Air Canada's new loyalty program when it launches in 2020 through to 2030. TD Aeroplan cardholders will become members of Air Canada's new loyalty program and their miles will be transitioned when Air Canada's new loyalty program launches in 2020.
In connection with the Transaction, the Bank paid $622 million plus applicable sales tax to Air Canada, of which $547 million ($446 million after sales and income taxes) was recognized inNon-interest expenses – Other in the Canadian Retail segment during the first quarter of 2019, and $75 million was recognized as an intangible asset which will be amortized over the Loyalty Agreement term. In addition, the Bank prepaid $308 million plus applicable sales tax for the future purchase of loyalty points over aten-year period. The Bank also expects to incur additionalpre-tax costs of approximately $100 million over two years to build the functionality required to facilitate the new program. The Transaction reduced the Bank's CET1 ratio by approximately 13 basis points (bps).
Acquisition of Greystone
On November 1, 2018, the Bank acquired 100% of the outstanding equity of Greystone for consideration of $821 million, of which $479 million was paid in cash and $342 million was paid in the Bank's common shares. The value of 4.7 million common shares issued as consideration was based on the volume weighted-average market price of the Bank's common shares over the 10 trading day period immediately preceding the fifth business day prior to the acquisition date and was recorded based on market price at close. Common shares of $167 million issued to employee shareholders in respect of the purchase price are being held in escrow for two years post-acquisition, subject to their continued employment, and are being recorded as a compensation expense over thetwo-year escrow period.
The acquisition was accounted for as a business combination under the purchase method. As at November 1, 2018, the acquisition contributed $165 million of assets and $46 million of liabilities. The excess of accounting consideration over the fair value of the identifiable net assets has been allocated to customer relationship intangibles of $140 million, deferred tax liability of $37 million, and goodwill of $432 million. Goodwill is not deductible for tax purposes. The results of the acquisition have been consolidated from the acquisition date and reported in the Canadian Retail segment.
Performance Summary
Outlined below is an overview of the Bank's performance on an adjusted basis for the third quarter of 2019. Shareholder performance indicators help guide and benchmark the Bank's accomplishments. For the purposes of this analysis, the Bank utilizes adjusted earnings, which excludes items of note from the reported results that are prepared in accordance with IFRS. Reported and adjusted results and items of note are explained in the "How the Bank Reports" section of this document.
| • | Adjusted diluted earnings per share for the nine months ended July 31, 2019, increased 6% from the same period last year. The Bank's goal is to achieve 7 to 10% adjusted earnings per share growth over the medium term. |
| • | Adjusted ROTCE for the nine months ended July 31, 2019, was 22.3%. |
| • | For the twelve months ended July 31, 2019, the total shareholder return was 3.9% compared to the Canadian peer1 average of (1.4)%. |
Net Income
Quarterly comparison – Q3 2019 vs. Q3 2018
Reported net income for the quarter was $3,248 million, an increase of $143 million, or 5%, compared with the third quarter last year. The increase reflects higher revenue and a higher contribution from TD Ameritrade, partially offset by highernon-interest expenses including charges related to the acquisition of Greystone, higher provision for credit losses (PCL) and insurance claims. Adjusted net income for the quarter was $3,338 million, an increase of $211 million, or 7%.
By segment, the increase in reported net income was due to an increase in U.S. Retail of $144 million, or 13%, an increase in Canadian Retail of $38 million, or 2%, and an increase in Wholesale Banking of $21 million, or 9%, partially offset by a higher net loss in the Corporate segment of $60 million, or 53%.
| 1 | Canadian peers include Bank of Montreal, Canadian Imperial Bank of Commerce, Royal Bank of Canada, and The Bank of Nova Scotia. |
| TD BANK GROUP• THIRD QUARTER 2019• REPORT TO SHAREHOLDERS | Page 9 |
Table of Contents
Quarterly comparison – Q3 2019 vs. Q2 2019
Reported net income for the quarter increased $76 million, or 2%, compared with the prior quarter. The increase reflects higher revenue and a higher contribution from TD Ameritrade, partially offset by highernon-interest expenses, insurance claims, and PCL. Adjusted net income for the quarter increased $72 million, or 2%.
By segment, the increase in reported net income was due to an increase in Canadian Retail of $41 million, or 2%, an increase in U.S. Retail of $24 million, or 2%, an increase in Wholesale Banking of $23 million, or 10%, partially offset by a higher net loss in the Corporate segment of $12 million, or 7%.
Year-to-date comparison – Q3 2019 vs. Q3 2018
Reported net income of $8,830 million increased $456 million, or 5%, compared with the same period last year. The increase reflects higher revenue, the impact from U.S. tax reform in the same period last year, and a higher contribution from TD Ameritrade, partially offset by highernon-interest expenses, including charges related to the agreement with Air Canada and the acquisition of Greystone, higher PCL, and insurance claims. Adjusted net income was $9,557 million, an increase of $422 million, or 5%, compared with the same period last year.
By segment, the increase in reported net income was due to an increase in U.S. Retail of $716 million, or 23%, a lower net loss in the Corporate segment of $384 million, or 42%, partially offset by a decrease in Canadian Retail of $324 million, or 6%, and a decrease in Wholesale Banking of $320 million, or 42%.
Net Interest Income
Quarterly comparison – Q3 2019 vs. Q3 2018
Net interest income for the quarter was $6,024 million, an increase of $369 million, or 7%, compared with the third quarter last year. The increase reflects volume growth in the Canadian and U.S. Retail segments, and the impact of foreign currency translation, partially offset by lower net interest income in Wholesale Banking.
By segment, the increase in net interest income was due to an increase in Canadian Retail of $174 million, or 6%, an increase in U.S. Retail of $127 million, or 6%, and an increase in the Corporate segment of $146 million, or 46%, partially offset by a decrease in Wholesale Banking of $78 million, or 28%.
Quarterly comparison – Q3 2019 vs. Q2 2019
Net interest income for the quarter increased $152 million, or 3%, compared with the prior quarter, primarily due to the effect of three additional days in the current quarter, and volume growth in the Canadian and U.S. Retail segments, partially offset by lower net interest income in Wholesale Banking, and lower margins in the Canadian and U.S. Retail segments.
By segment, the increase in net interest income was due to an increase in Canadian Retail of $112 million, or 4%, an increase in the Corporate segment of $94 million, or 25%, and an increase in U.S. Retail of $10 million, partially offset by a decrease in Wholesale Banking of $64 million, or 24%.
Year-to-date comparison – Q3 2019 vs. Q3 2018
Net interest income was $17,756 million, an increase of $1,273 million, or 8%, compared with the same period last year. The increase was primarily due to volume growth and higher margins in the Canadian and U.S. Retail segments, and the impact of foreign currency translation, partially offset by lower trading-related revenue.
By segment, the increase in net interest income was due to an increase in U.S. Retail of $688 million, or 11%, an increase in Canadian Retail of $622 million, or 7%, and an increase in the Corporate segment of $207 million, or 20%, partially offset by a decrease in Wholesale Banking of $244 million, or 28%.
Non-Interest Income
Quarterly comparison – Q3 2019 vs. Q3 2018
Reportednon-interest income for the quarter was $4,475 million, an increase of $231 million, or 5%, compared with the third quarter last year. The increase was primarily due to higher trading-related revenue, higher insurance premiums,fee-based revenue in the wealth business, the acquisition of Greystone, an increase in the fair value of investments supporting claims liabilities which resulted in a similar increase to insurance claims, and the impact of foreign currency translation, partially offset by lower advisory and equity underwriting fees in Wholesale Banking.
By segment, the increase in reportednon-interest income was due to an increase in Wholesale Banking of $183 million, or 34%, an increase in Canadian Retail of $173 million, or 6%, and an increase in U.S. Retail of $47 million, or 7%, partially offset by a decrease in the Corporate segment of $172 million.
Quarterly comparison – Q3 2019 vs. Q2 2019
Reportednon-interest income for the quarter increased $119 million, or 3%, compared with the prior quarter. The increase was primarily due to higher trading-related revenue,fee-based revenue in the wealth and banking businesses, revenue from the insurance business, and the effect of three additional days in the current quarter, partially offset by lower advisory and equity underwriting fees in Wholesale Banking, and a decrease in the fair value of investments supporting claims liabilities which resulted in a similar decrease to insurance claims.
By segment, the increase in reportednon-interest income was due to an increase in Wholesale Banking of $91 million, or 15%, an increase in Canadian Retail of $75 million, or 3%, and an increase in U.S. Retail of $68 million, or 10%, partially offset by a decrease in the Corporate segment of $115 million.
Year-to-date comparison – Q3 2019 vs. Q3 2018
Reportednon-interest income was $12,969 million, an increase of $696 million, or 6%, compared with the same period last year. The increase reflects higher revenue from the insurance business,fee-based revenue in the wealth and banking businesses, foreign currency translation, the impact from U.S. tax reform in the same period last year, and highernon-interest income in Wholesale Banking.
By segment, the increase in reportednon-interest income was due to an increase in Canadian Retail of $610 million, or 7%, and an increase in U.S. Retail of $68 million, or 3%, and an increase in Wholesale Banking of $41 million, or 2%, partially offset by a decrease in Corporate segment of $23 million, or 11%.
Provision for Credit Losses
Quarterly comparison – Q3 2019 vs. Q3 2018
PCL for the quarter was $655 million, an increase of $94 million, or 17%, compared with the third quarter last year. PCL – impaired for the quarter was $581 million, an increase of $51 million, or 10%, reflecting higher provisions in Canadian Retail and Wholesale Banking, partially offset by lower provisions in the U.S. strategic credit cards portfolio, largely recognized in the Corporate segment. PCL – performing for the quarter was $74 million, an increase of $43 million, primarily reflecting parameter updates in the consumer lending portfolios, partially offset by lower provisions in the U.S. commercial portfolio. Total PCL for the quarter as an annualized percentage of credit volume was 0.38%.
| TD BANK GROUP• THIRD QUARTER 2019• REPORT TO SHAREHOLDERS | Page 10 |
Table of Contents
By segment, increase in PCL was due to an increase in Canadian Retail of $70 million, or 28%, an increase in U.S. Retail of $33 million, or 15%, an increase in Wholesale Banking of $15 million, partially offset by a decrease in the Corporate segment of $24 million, or 22%.
Quarterly comparison – Q3 2019 vs. Q2 2019
PCL for the quarter increased by $22 million, or 3%, compared with the prior quarter. PCL – impaired was $581 million, a decrease of $12 million, or 2%, reflecting lower provisions in U.S. Retail and Corporate segments, partially offset by higher provisions in Canadian Retail and Wholesale Banking. PCL – performing was $74 million, an increase of $34 million, or 85%, reflecting parameter updates in the consumer lending portfolios, partially offset by lower provisions in the U.S. commercial portfolio and in Wholesale Banking. Total PCL for the quarter as an annualized percentage of credit volume was 0.38%.
By segment, the increase in PCL was due to an increase in Canadian Retail of $36 million, or 13%, an increase in U.S. Retail of $29 million, or 13%, and an increase in Wholesale Banking of $6 million, partially offset by a decrease in Corporate segment of $49 million, or 37%.
Year-to-date comparison – Q3 2019 vs. Q3 2018
PCL was $2,138 million, an increase of $328 million, or 18%, compared with the same period last year. PCL – impaired was $1,891 million, an increase of $284 million, or 18%, reflecting higher provisions in the Canadian business and consumer lending portfolios, the U.S. commercial portfolio, and Wholesale Banking. PCL – performing was $247 million, an increase of $44 million, or 22%, reflecting parameter updates in the consumer lending portfolios and credit migration in Canadian Retail, partially offset by lower provisions in the U.S. commercial portfolio. Total PCL as an annualized percentage of credit volume was 0.42%.
By segment, the increase in PCL was due to an increase in Canadian Retail of $171 million or 23%, an increase in U.S. Retail of $114 million or 17%, an increase in the Corporate segment of $35 million, or 9% (largely reflecting PCL for the U.S. strategic cards portfolio, which is offset in Corporate segmentnon-interest expenses), and an increase in Wholesale Banking of $8 million.
TABLE 8: PROVISION FOR CREDIT LOSSES
(millions of Canadian dollars) | For the three months ended | For the nine months ended | ||||||||||||||||||
| | July 31 2019 | | | April 30 2019 | | | July 31 2018 | | | July 31 2019 | | | July 31 2018 | | ||||||
Provision for credit losses – Stage 3 (impaired) | ||||||||||||||||||||
Canadian Retail | $ | 282 | $ | 256 | $ | 226 | $ | 802 | $ | 682 | ||||||||||
U.S. Retail | 184 | 199 | 185 | 668 | 571 | |||||||||||||||
Wholesale Banking | 12 | – | – | 12 | (8 | ) | ||||||||||||||
Corporate1 | 103 | 138 | 119 | 409 | 362 | |||||||||||||||
Total provision for credit losses – Stage 3 | 581 | 593 | 530 | 1,891 | 1,607 | |||||||||||||||
Provision for credit losses – Stage 1 and Stage 2 (performing)2 | ||||||||||||||||||||
Canadian Retail | 34 | 24 | 20 | 104 | 53 | |||||||||||||||
U.S. Retail | 71 | 27 | 37 | 119 | 102 | |||||||||||||||
Wholesale Banking | (11 | ) | (5 | ) | (14 | ) | (9 | ) | 3 | |||||||||||
Corporate1 | (20 | ) | (6 | ) | (12 | ) | 33 | 45 | ||||||||||||
Total provision for credit losses – Stage 1 and Stage 2 | 74 | 40 | 31 | 247 | 203 | |||||||||||||||
Total provision for credit losses | $ | 655 | $ | 633 | $ | 561 | $ | 2,138 | $ | 1,810 | ||||||||||
| 1 | Includes PCL on the retailer program partners' share of the U.S. strategic cards portfolio. |
| 2 | Includes financial assets, loan commitments, and financial guarantees. |
Insurance claims and related expenses
Quarterly comparison – Q3 2019 vs. Q3 2018
Insurance claims and related expenses for the quarter were $712 million, an increase of $85 million, or 14%, compared with the third quarter last year. The increase reflects increased business volumes, higher current year claims, and changes in the fair value of investments supporting claims liabilities, partially offset by less severe weather-related events and more favourable prior years' claims development.
Quarterly comparison – Q3 2019 vs. Q2 2019
Insurance claims and related expenses for the quarter increased $44 million, or 7%, compared with the prior quarter. The increase reflects increased business volumes and higher current year claims, partially offset by more favourable prior years' claims development, changes in the fair value of investments supporting claims liabilities, and less severe weather-related events.
Year-to-date comparison – Q3 2019 vs. Q3 2018
Insurance claims and related expenses were $2,082 million, an increase of $322 million, or 18%, compared with the same period last year. The increase reflects changes in the fair value of investments supporting claims liabilities, increased business volumes, higher current year claims, and less favourable prior years' claims development, partially offset by less severe weather-related events.
Non-Interest Expenses and Efficiency Ratio
Quarterly comparison – Q3 2019 vs. Q3 2018
Reportednon-interest expenses were $5,374 million, an increase of $243 million, or 5%, compared with the third quarter last year, reflecting additional employees supporting business growth, the impact of foreign currency translation, charges related to the acquisition of Greystone, and continued investments supporting the global expansion of Wholesale Banking's U.S. dollar strategy. Adjustednon-interest expenses were $5,298 million, an increase of $220 million, or 4%.
By segment, the increase in reportednon-interest expenses was due to an increase in Canadian Retail of $133 million, or 6%, an increase in U.S. Retail of $76 million, or 5%, and an increase in Wholesale Banking of $62 million, or 12%, partially offset by a decrease in the Corporate segment of $28 million, or 4%.
The Bank's reported efficiency ratio was 51.2%, compared with 51.8% in the third quarter last year. The Bank's adjusted efficiency ratio was 50.5%, compared with 51.3% in the third quarter last year.
Quarterly comparison – Q3 2019 vs. Q2 2019
Reportednon-interest expenses for the quarter increased $126 million, or 2%, compared with the prior quarter, reflecting additional employees supporting business growth and the effect of three additional days in the quarter. Adjustednon-interest expenses increased $135 million, or 3%.
| TD BANK GROUP• THIRD QUARTER 2019• REPORT TO SHAREHOLDERS | Page 11 |
Table of Contents
By segment, the increase in reportednon-interest expenses was due to an increase in U.S. Retail of $77 million, or 5%, an increase in Canadian Retail of $52 million, or 2%, partially offset by a decrease in Wholesale Banking of $3 million, or 1%.
The Bank's reported efficiency ratio was 51.2%, compared with 51.3% in the prior quarter. The Bank's adjusted efficiency ratio was 50.5%, same as in the prior quarter.
Year-to-date comparison – Q3 2019 vs. Q3 2018
Reportednon-interest expenses of $16,477 million increased $1,648 million, or 11%, compared with the same period last year, primarily reflecting charges related to the agreement with Air Canada and the acquisition of Greystone, additional employees supporting business growth, higher spend on strategic initiatives, business volume growth, and the impact of foreign currency translation. Adjustednon-interest expenses were $15,622 million, an increase of $992 million, or 7%.
By segment, the increase in reportednon-interest expenses was due to an increase in Canadian Retail of $1,155 million, or 17%, an increase in U.S. Retail of $279 million, or 6%, and an increase in Wholesale Banking of $219 million, or 14%, partially offset by a decrease in the Corporate segment of $5 million.
The Bank's reported efficiency ratio was 53.6%, compared with 51.6% in the same period last year. The Bank's adjusted efficiency ratio was 50.8%, compared with 50.7% in the same period last year.
Income Taxes
As discussed in the "How the Bank Reports" section of this document, the Bank adjusts its reported results to assess each of its businesses and to measure overall Bank performance. As such, the provision for income taxes is stated on a reported and an adjusted basis.
The Bank's effective income tax rate on a reported basis was 21.6% for the third quarter, compared with 19.7% in the third quarter last year and 21.0% in the prior quarter. The year-over-year increase was largely due to theone-time tax adjustment associated with the remeasurement of deferred tax assets and liabilities to the lower Alberta corporate tax rate enacted during the current quarter and an update on the impact of U.S. tax reform during the third quarter last year, partially offset by highertax-exempt dividend income in the current quarter. The quarter-over-quarter increase was mainly due to the impact of theone-time tax adjustment associated with the Alberta corporate tax rate reduction in the current quarter and the effect of positive tax items in the prior quarter.
TABLE 9: INCOME TAXES
(millions of Canadian dollars, except as noted) | For the three months ended | For the nine months ended | ||||||||||||||||||||||||||||||||||||||
| | July 31 2019 | | April 30 2019 | | July 31 2018 | | July 31 2019 | | July 31 2018 | |||||||||||||||||||||||||||||||
Income taxes at Canadian statutory income tax rate | $ | 994 | 26.5 | % | $ | 974 | 26.5 | % | $ | 948 | 26.5 | % | $ | 2,655 | 26.5 | % | $ | 2,743 | 26.5 | % | ||||||||||||||||||||
Increase (decrease) resulting from: | ||||||||||||||||||||||||||||||||||||||||
Dividends received | (28 | ) | (0.7 | ) | (27 | ) | (0.7 | ) | (21 | ) | (0.6 | ) | (78 | ) | (0.8 | ) | (118 | ) | (1.1 | ) | ||||||||||||||||||||
Rate differentials on international operations | (176 | ) | (4.7 | ) | (170 | ) | (4.6 | ) | (225 | ) | (6.3 | ) | (531 | ) | (5.3 | ) | (151 | ) | (1.5 | ) | ||||||||||||||||||||
Other | 23 | 0.5 | (4 | ) | (0.2 | ) | 3 | 0.1 | 43 | 0.4 | 17 | 0.2 | ||||||||||||||||||||||||||||
Provision for income taxes and effective income tax rate – reported | $ | 813 | 21.6 | % | $ | 773 | 21.0 | % | $ | 705 | 19.7 | % | $ | 2,089 | 20.8 | % | $ | 2,491 | 24.1 | % | ||||||||||||||||||||
Total adjustments for items of note1 | 11 | 14 | 73 | 200 | (297 | ) | ||||||||||||||||||||||||||||||||||
Provision for income taxes and effective income tax rate – adjusted2,3 | $ | 824 | 21.5 | % | $ | 787 | 20.9 | % | $ | 778 | 21.4 | % | $ | 2,289 | 21.0 | % | $ | 2,194 | 20.6 | % | ||||||||||||||||||||
| 1 | For explanations of items of note, refer to the"Non-GAAP Financial Measures – Reconciliation of Adjusted to Reported Net Income" table in the "How We Performed" section of this document. |
| 2 | The tax effect for each item of note is calculated using the statutory income tax rate of the applicable legal entity. |
| 3 | Adjusted effective income tax rate is the adjusted provision for income taxes before other taxes as a percentage of adjusted net income before taxes. |
The Bank's adjusted effective tax rate was 21.5% for the quarter, higher than 21.4% in the third quarter last year and 20.9% in the prior quarter. The year-over-year increase was largely due to theone-time tax adjustment associated with the remeasurement of deferred tax assets and liabilities to the lower Alberta corporate tax rate enacted during the current quarter, partially offset by highertax-exempt dividend income. The quarter-over-quarter increase was mainly due to the impact of theone-time tax adjustment associated with the Alberta corporate tax rate reduction in the current quarter and the effect of positive tax items in the prior quarter.
Impact of Foreign Currency Translation on U.S. Retail Segment Earnings
The following table reflects the estimated impact of foreign currency translation on key U.S. Retail segment income statement items.
TABLE 10: IMPACT OF FOREIGN CURRENCY TRANSLATION ON U.S. RETAIL SEGMENT EARNINGS
(millions of Canadian dollars, except as noted) | For the three months ended | For the nine months ended | ||||||
| | July 31, 2019 vs. July 31, 2018 | | | July 31, 2019 vs. July 31, 2018 | | |||
U.S. Retail Bank | ||||||||
Total revenue | $ | 53 | $ | 323 | ||||
Non-interest expenses | 29 | 173 | ||||||
Net income –after-tax | 18 | 107 | ||||||
Equity in net income on an investment in TD Ameritrade1 | 10 | 35 | ||||||
U.S. Retail segment decreased net income –after-tax | 28 | 142 | ||||||
Earnings per share(Canadian dollars) | ||||||||
Basic | $ | 0.02 | $ | 0.08 | ||||
Diluted | 0.02 | 0.08 | ||||||
| 1 | Equity in net income on an investment in TD Ameritrade and the foreign exchange impact are reported with aone-month lag. |
Average foreign exchange rate (equivalent of CAD $1.00) | For the three months ended | For the nine months ended | ||||||||||||||
| | July 31 2019 | | July 31 2018 | | July 31 2019 | | July 31 2018 | |||||||||
U.S. dollar | 0.753 | 0.767 | 0.752 | 0.780 | ||||||||||||
| TD BANK GROUP• THIRD QUARTER 2019• REPORT TO SHAREHOLDERS | Page 12 |
Table of Contents
Economic Summary and Outlook
Expectations for global real gross domestic product (GDP) continue to edge down, currently to a tepid pace of 2.9% in the 2019 calendar year. This marks a significant downshift from the 3.6% pace recorded in calendar 2018. This is in part due to the fading impact of past fiscal and monetary stimulus, but ongoing trade and geopolitical tensions have been taking an increasing toll on global activity. Alongside subdued inflationary pressures, a number of central banks – including those in the United States, Australia, and New Zealand – have responded by implemented precautionary interest rate cuts, while the European Central Bank has signalled more stimulus is forthcoming. The easing in financial conditions is expected to help insulate the global economy from downside risks, maintaining the expansion around its current rate in calendar 2020.
The U.S. economy remains resilient but has decelerated from roughly a 3% pace in the past year. The U.S. Department of Commerce advance GDP report indicated a moderate gain of 2.1% (annualized) in the April-June period, with the details of the report mixed. A strong 4.3% advance in consumer spending proved the main contributor to growth, rebounding from a weak performance in the prior quarter. Government spending also accelerated from shutdown-induced weakness in the winter. In contrast, both residential andnon-residential investment, as well as exports contracted in the quarter. Forward-looking indicators, such as the Institute for Supply Management'sReport On Business, suggest that the weight of tariffs and persistent uncertainty on the outlook are weighing on general business sentiment.
Although U.S.-China working-level discussions towards a trade truce are expected to resume, the recent escalation in tariffs by both countries has elevated domestic and global risks. An expected follow-through of tariffs in September will result in a markdown of the U.S. economic forecast for 2020 and encourage the Federal Reserve to continue to ease monetary policy as a counterbalance to the outlook risks.
At its July30-31, 2019 policy meeting, the Federal Reserve Open Market Committee voted to reduce the key policy interest rate by 25 bps, to a range of2.00%-2.25%. The action was taken as insurance against trade uncertainty, growing global growth risks, and subdued domestic inflationary pressures. In its statement and subsequent communication, the central bank has left the door open to further easing. TD Economics anticipates two additional rate cuts this year and U.S. real GDP growth at or just below 2% in calendar 2020.
Bucking the trend in the global economy, the Canadian economy has recorded a solid growth pickup in recent months, after a challenging start to the year. Supported by an easing in mandated government production curtailments in Alberta's oil patch, output and exports have staged a moderate recovery from March onwards. More broadly, housing market activity has firmed in most parts of the country, and households remain supported by continued strength in job markets and an acceleration in wage growth. TD Economics is projecting real GDP growth of roughly 3% annualized in the April-June period, marking a significant improvement from virtually no growth in the prior two quarters.
Looking ahead, Canada is unlikely to remain an outlier as global growth slows. The pace of economic expansion is estimated to converge back towards its estimated longer-term trend rate of below 2%. Factors limiting further upside potential include high household debt, a low personal savings rate, and elevated business inventories. Moreover, consistent with global trends, Canadian businesses will likely remain cautious to invest amid elevated global uncertainty.
Even as other central banks ease monetary policy, Bank of Canada communications in July expressed comfort with the current level of interest rates. Accordingly, TD Economics has left the Bank of Canada policy rate at 1.75% over the forecast horizon, but believe the balance of risks from the U.S.-China trade war escalation are tilting the scales to the central bank adopting a risk management approach that can also lead to "insurance" cuts in the months ahead. In the coming months, the Canadian dollar will reflect the push and pull forces from a narrowing differential betweenUS-Canadian short-term interest rates and persistent global economic risks. This is likely to keep the dollar range-bound withinUS74-77 cents. Domestically, the Bank of Canada will remain watchful for the possibility of a renewed slowdown in housing activity and a period of household deleveraging. Energy sector developments are also important, with prices subject to international forces and the possibility of a further investment retrenchment due to domestic transportation capacity issues. Geopolitical issues with Venezuela and Iran also remain fluid, with potential impacts on North American energy markets.
More broadly, risks have worsened with trade conflict escalation between the U.S. and China, while persisting with other regions such as Europe, India, and Vietnam. This has the potential for further disruption of globally integrated supply chains. Recent political developments in the United Kingdom have increased the risk of a disorderly exit from the European Union this year, withknock-on effects to global trade, confidence, and financial markets. Further, the risk of a no-deal Brexit has now risen following the appointment of a new U.K. Prime Minister in July 2019. Lastly, other areas that continue to present a downside risk include ongoing tensions in the Middle East and the Korean Peninsula, and populist threats to established political and economic systems. These all keep global uncertainty elevated and may drive periods of financial market volatility. However, it should be noted that upside potential can also quickly come into the foreground, particularly if progress becomes evident on trade or European Union-United Kingdom tensions.
| TD BANK GROUP• THIRD QUARTER 2019• REPORT TO SHAREHOLDERS | Page 13 |
Table of Contents
For management reporting purposes, the Bank reports its results under three key business segments: Canadian Retail, which includes the results of the Canadian personal and commercial banking, wealth, and insurance businesses; U.S. Retail, which includes the results of the U.S. personal and business banking operations, wealth management services, and the Bank's investment in TD Ameritrade; and Wholesale Banking. The Bank's other activities are grouped into the Corporate segment.
Results of each business segment reflect revenue, expenses, assets, and liabilities generated by the businesses in that segment. Where applicable, the Bank measures and evaluates the performance of each segment based on adjusted results and ROE, and for those segments, the Bank indicates that the measure is adjusted. For further details, refer to the "How the Bank Reports" section of this document, the "Business Focus" section in the Bank's 2018 MD&A, and Note 29 Segmented Information of the Bank's Consolidated Financial Statements for the year ended October 31, 2018. For information concerning the Bank's measure of ROE, which is anon-GAAP financial measure, refer to the "How We Performed" section of this document.
PCL related to performing (Stage 1 and Stage 2) and impaired (Stage 3) financial assets, loan commitments, and financial guarantees is recorded within the respective segment.
Net interest income within Wholesale Banking is calculated on a taxable equivalent basis (TEB), which means that the value ofnon-taxable ortax-exempt income, including certain dividends, is adjusted to its equivalentbefore-tax value. Using TEB allows the Bank to measure income from all securities and loans consistently and makes for a more meaningful comparison of net interest income with similar institutions. The TEB increase to net interest income and provision for income taxes reflected in Wholesale Banking's results are reversed in the Corporate segment. The TEB adjustment for the quarter was $37 million, compared with $33 million in the prior quarter and $26 million in the third quarter last year.
TABLE 11: CANADIAN RETAIL
(millions of Canadian dollars, except as noted) | For the three months ended | For the nine months ended | ||||||||||||||||||
| | July 31 2019 | | | April 30 2019 | | | July 31 2018 | | | July 31 2019 | | | July 31 2018 | | ||||||
Net interest income | $ | 3,122 | $ | 3,010 | $ | 2,948 | $ | 9,176 | $ | 8,554 | ||||||||||
Non-interest income | 3,024 | 2,949 | 2,851 | 8,917 | 8,307 | |||||||||||||||
Total revenue | 6,146 | 5,959 | 5,799 | 18,093 | 16,861 | |||||||||||||||
Provision for credit losses – impaired | 282 | 256 | 226 | 802 | 682 | |||||||||||||||
Provision for credit losses – performing | 34 | 24 | 20 | 104 | 53 | |||||||||||||||
Total provision for credit losses | 316 | 280 | 246 | 906 | 735 | |||||||||||||||
Insurance claims and related expenses | 712 | 668 | 627 | 2,082 | 1,760 | |||||||||||||||
Non-interest expenses – reported | 2,533 | 2,481 | 2,400 | 8,098 | 6,943 | |||||||||||||||
Non-interest expenses – adjusted1 | 2,507 | 2,451 | 2,400 | 7,404 | 6,943 | |||||||||||||||
Provision for (recovery of) income taxes – reported | 695 | 681 | 674 | 1,889 | 1,981 | |||||||||||||||
Provision for (recovery of) income taxes – adjusted1 | 695 | 683 | 674 | 2,053 | 1,981 | |||||||||||||||
Net income – reported | 1,890 | 1,849 | 1,852 | 5,118 | 5,442 | |||||||||||||||
Net income – adjusted1 | $ | 1,916 | $ | 1,877 | $ | 1,852 | $ | 5,648 | $ | 5,442 | ||||||||||
Selected volumes and ratios | ||||||||||||||||||||
Return on common equity – reported2 | 41.7 | % | 43.2 | % | 48.6 | % | 38.8 | % | 48.8 | % | ||||||||||
Return on common equity – adjusted1,2 | 42.2 | 43.9 | 48.6 | 42.9 | 48.8 | |||||||||||||||
Net interest margin (including on securitized assets) | 2.96 | 2.99 | 2.93 | 2.96 | 2.90 | |||||||||||||||
Efficiency ratio – reported | 41.2 | 41.6 | 41.4 | 44.8 | 41.2 | |||||||||||||||
Efficiency ratio – adjusted1 | 40.8 | 41.1 | 41.4 | 40.9 | 41.2 | |||||||||||||||
Assets under administration (billions of Canadian dollars) | $ | 419 | $ | 421 | $ | 403 | $ | 419 | $ | 403 | ||||||||||
Assets under management (billions of Canadian dollars) | 350 | 349 | 297 | 350 | 297 | |||||||||||||||
Number of Canadian retail branches | 1,097 | 1,100 | 1,108 | 1,097 | 1,108 | |||||||||||||||
Average number of full-time equivalent staff | 41,583 | 40,498 | 38,838 | 40,695 | 38,316 | |||||||||||||||
| 1 | Adjustednon-interest expenses exclude the following items of note: Charges related to the long-term loyalty agreement with Air Canada in the first quarter 2019 – $607 million ($446 millionafter-tax); and charges associated with the acquisition of Greystone in the third quarter 2019 – $26 million ($26 millionafter-tax), second quarter 2019 – $30 million ($28 millionafter-tax) and the first quarter 2019 – $31 million ($30 millionafter-tax). For explanations of items of note, refer to the"Non-GAAP Financial Measures – Reconciliation of Adjusted to Reported Net Income" table in the "How We Performed" section of this document. |
| 2 | Capital allocated to the business segment was based on 10% CET1 Capital in fiscal 2019 and 9% in fiscal 2018. |
Quarterly comparison – Q3 2019 vs. Q3 2018
Canadian Retail reported net income for the quarter was $1,890 million, an increase of $38 million, or 2%, compared with the third quarter last year, reflecting higher revenue, partially offset by highernon-interest expenses including charges related to the acquisition of Greystone, as well as higher insurance claims, and PCL. On an adjusted basis, net income for the quarter was $1,916 million, an increase of $64 million, or 3%. The reported and adjusted annualized ROE for the quarter was 41.7% and 42.2%, respectively, compared with 48.6% in the third quarter last year.
Canadian Retail revenue is derived from Canadian personal and commercial banking, wealth, and insurance businesses. Revenue for the quarter was $6,146 million, an increase of $347 million, or 6%, compared with the third quarter last year.
Net interest income was $3,122 million, an increase of $174 million, or 6%, reflecting volume growth and higher margins. Average loan volumes increased $21 billion, or 5%, reflecting 4% growth in personal loans and 8% growth in business loans. Average deposit volumes increased $11 billion, or 3%, reflecting 5% growth in personal deposits, 2% growth in wealth deposits, and 1% growth in business deposits. Net interest margin was 2.96%, an increase of 3 bps, reflecting higher interest rates, partially offset by competitive pricing in loans.
Non-interest income was $3,024 million, an increase of $173 million, or 6%, reflecting higher insurance premiums, higherfee-based revenue in the wealth business, and the acquisition of Greystone. The increase innon-interest income also included $35 million related to increases in the fair value of investments supporting claims liabilities, which resulted in a similar increase to insurance claims.
Assets under administration (AUA) were $419 billion as at July 31, 2019, an increase of $16 billion, or 4%, compared with the third quarter last year, reflecting new asset growth. Assets under management (AUM) were $350 billion as at July 31, 2019, an increase of $53 billion, or 18%, compared with the third quarter last year, reflecting the acquisition of Greystone, increases in market value, and new asset growth.
PCL was $316 million, an increase of $70 million, or 28%, compared with the third quarter last year. PCL – impaired for the quarter was $282 million, an increase of $56 million, or 25%, reflecting low prior period provisions in business banking, higher insolvencies in the current quarter in other personal lending and
| TD BANK GROUP• THIRD QUARTER 2019• REPORT TO SHAREHOLDERS | Page 14 |
Table of Contents
credit card portfolios, and volume growth. PCL – performing was $34 million, an increase of $14 million, reflecting parameter updates in the consumer lending portfolios. Total PCL as an annualized percentage of credit volume was 0.29%, or an increase of 5 bps.
Insurance claims and related expenses for the quarter were $712 million, an increase of $85 million, or 14%, compared with the third quarter last year. The increase reflects increased business volumes, higher current year claims, and changes in the fair value of investments supporting claims liabilities, partially offset by less severe weather-related events and more favourable prior years' claims development.
Reportednon-interest expenses for the quarter were $2,533 million, an increase of $133 million, or 6%, compared with the third quarter last year, reflecting higher costs supporting business growth, including additional employees and higher cost per employee, and charges related to the acquisition of Greystone, partially offset by lower marketing and promotion costs. On an adjusted basis,non-interest expenses were $2,507 million, an increase of $107 million, or 4%.
The reported and adjusted efficiency ratio for the quarter was 41.2% and 40.8%, respectively, compared with 41.4% in the third quarter last year.
Quarterly comparison – Q3 2019 vs. Q2 2019
Canadian Retail reported net income for the quarter increased $41 million, or 2%, compared with the prior quarter, reflecting higher revenue, partially offset by highernon-interest expenses, insurance claims, and PCL. On an adjusted basis, net income increased $39 million, or 2%. The reported and adjusted annualized ROE for the quarter was 41.7% and 42.2%, respectively, compared with 43.2% and 43.9%, respectively, in the prior quarter.
Revenue increased $187 million, or 3%, compared with the prior quarter. Net interest income increased $112 million, or 4%, reflecting the effect of three additional days in the third quarter and volume growth, partially offset by lower margins. Average loan volumes increased $6 billion, or 2%, reflecting 1% growth in personal loans and 2% growth in business loans. Average deposit volumes increased $5 billion, or 2%, reflecting 2% growth in personal deposits and 2% growth in business deposits. Net interest margin was 2.96%, a decrease of 3 bps, reflecting a prior period refinement in revenue recognition assumptions in the auto finance portfolio and competitive pricing in term deposits.
Non-interest income increased $75 million, or 3%, due to higherfee-based revenues in the wealth and banking businesses, higher revenue from the insurance business, and the effect of three additional days in the third quarter. The increase innon-interest income was partially offset by $18 million related to decreases in the fair value of investments supporting claims liabilities, which resulted in a similar decrease to insurance claims.
AUA decreased $2 billion, compared with the prior quarter, reflecting decreases in market value, partially offset by new asset growth. AUM increased $1 billion, compared with the prior quarter, reflecting increases in market value, partially offset by net fund outflows.
PCL increased $36 million, or 13%, compared with the prior quarter. PCL – impaired increased by $26 million, or 10%, reflecting new formations in the business banking portfolio and low prior period provisions in the real estate secured lending portfolios. PCL – performing increased by $10 million, reflecting parameter updates in the consumer lending portfolios. Total PCL as an annualized percentage of credit volume was 0.29%, an increase of 2 bps.
Insurance claims and related expenses increased $44 million, or 7%, compared with the prior quarter. The increase reflects increased business volumes and higher current year claims, partially offset by more favourable prior years' claims development, changes in the fair value of investments supporting claims liabilities, and less severe weather-related events.
Reportednon-interest expenses increased $52 million, or 2%, compared with the prior quarter, reflecting higher costs supporting business growth, including additional employees and higher cost per employee, and revenue-based variable expenses in the wealth business, partially offset by lower spend related to strategic initiatives. On an adjusted basis,non-interest expenses increased $56 million, or 2%.
The reported and adjusted efficiency ratio for the quarter was 41.2% and 40.8%, respectively, compared with 41.6% and 41.1%, respectively, in the prior quarter.
Year-to-date comparison – Q3 2019 vs. Q3 2018
Canadian Retail reported net income for the nine months ended July 31, 2019, was $5,118 million, a decrease of $324 million, or 6%, compared with same period last year. The decrease in earnings reflects charges related to the agreement with Air Canada and the acquisition of Greystone, higher othernon-interest expenses, insurance claims, and PCL, partially offset by revenue growth. On an adjusted basis, net income for the period was $5,648 million, an increase of $206 million, or 4%. The reported and adjusted annualized ROE for the period was 38.8% and 42.9%, respectively, compared with 48.8%, in the same period last year.
Revenue for the period was $18,093 million, an increase of $1,232 million, or 7%, compared with same period last year. Net interest income was $9,176 million, an increase of $622 million, or 7%, reflecting volume growth and higher margins. Average loan volumes increased $22 billion, or 6%, reflecting 5% growth in personal loan volumes and 9% growth in business loan volumes. Average deposit volumes increased $9 billion, or 3%, reflecting 4% growth in personal deposits volume and 2% growth in business deposit volumes. Net interest margin was 2.96%, an increase of 6 bps, reflecting rising interest rates, partially offset by competitive pricing in loans.
Non-interest income was $8,917 million, an increase of $610 million, or 7%, reflecting higher revenue from the insurance business, higherfee-based revenue in the banking businesses, the acquisition of Greystone, and higher fee-based revenue due to higher asset levels in the wealth management business. The increase innon-interest income also included $171 million related to increases in the fair value of investments supporting claims liabilities, which resulted in a similar increase to insurance claims.
PCL was $906 million, an increase of $171 million, or 23%, compared with the same period last year. PCL – impaired was $802 million, an increase of $120 million, or 18%, reflecting low prior period provisions in business banking, higher losses in the current period in the other personal and auto lending portfolios, and volume growth. PCL – performing was $104 million, an increase of $51 million, reflecting credit migration in the consumer lending and business banking portfolios, and parameter updates in the consumer lending portfolios. Annualized PCL as a percentage of credit volume was 0.29%, an increase of 4 bps.
Insurance claims and related expenses were $2,082 million, an increase of $322 million, or 18%, compared with the same period last year. The increase reflects changes in the fair value of investments supporting claims liabilities, increased business volumes, higher current year claims, and less favourable prior years' claims development, partially offset by less severe weather-related events.
Reportednon-interest expenses were $8,098 million, an increase of $1,155 million, or 17%, compared with the same period last year. The increase reflects charges related to the agreement with Air Canada and the acquisition of Greystone, higher spend supporting business growth including additional employees and higher cost per employee, and investment in strategic initiatives, partially offset by restructuring and promotion costs in the same period last year. On an adjusted basis,non-interest expenses were $7,404 million, an increase of $461 million, or 7%.
The reported and adjusted efficiency ratio for the period was 44.8% and 40.9%, respectively, compared with 41.2% for the same period last year.
| TD BANK GROUP• THIRD QUARTER 2019• REPORT TO SHAREHOLDERS | Page 15 |
Table of Contents
TABLE 12: U.S. RETAIL
| (millions of dollars, except as noted) | For the three months ended | For the nine months ended | ||||||||||||||||||
| Canadian Dollars | July 31 2019 | April 30 2019 | July 31 2018 | July 31 2019 | July 31 2018 | |||||||||||||||
Net interest income | $ | 2,241 | $ | 2,231 | $ | 2,114 | $ | 6,719 | $ | 6,031 | ||||||||||
Non-interest income1 | 745 | 677 | 698 | 2,123 | 2,055 | |||||||||||||||
Total revenue | 2,986 | 2,908 | 2,812 | 8,842 | 8,086 | |||||||||||||||
Provision for credit losses – impaired | 184 | 199 | 185 | 668 | 571 | |||||||||||||||
Provision for credit losses – performing | 71 | 27 | 37 | 119 | 102 | |||||||||||||||
Total provision for credit losses | 255 | 226 | 222 | 787 | 673 | |||||||||||||||
Non-interest expenses – reported | 1,604 | 1,527 | 1,528 | 4,742 | 4,463 | |||||||||||||||
Non-interest expenses – adjusted2 | 1,604 | 1,527 | 1,528 | 4,742 | 4,442 | |||||||||||||||
Provision for (recovery of) income taxes – reported1 | 134 | 150 | 144 | 386 | 341 | |||||||||||||||
Provision for (recovery of) income taxes – adjusted1,2 | 134 | 150 | 144 | 386 | 346 | |||||||||||||||
U.S. Retail Bank net income – reported | 993 | 1,005 | 918 | 2,927 | 2,609 | |||||||||||||||
U.S. Retail Bank net income – adjusted2 | 993 | 1,005 | 918 | 2,927 | 2,625 | |||||||||||||||
Equity in net income of an investment in TD Ameritrade – reported1,3 | 294 | 258 | 225 | 863 | 465 | |||||||||||||||
Equity in net income of an investment in TD Ameritrade – adjusted1,4 | 294 | 258 | 243 | 863 | 612 | |||||||||||||||
Net income – reported | 1,287 | 1,263 | 1,143 | 3,790 | 3,074 | |||||||||||||||
Net income – adjusted | $ | 1,287 | $ | 1,263 | $ | 1,161 | $ | 3,790 | $ | 3,237 | ||||||||||
U.S. Dollars | ||||||||||||||||||||
Net interest income | $ | 1,686 | $ | 1,676 | $ | 1,620 | $ | 5,050 | $ | 4,704 | ||||||||||
Non-interest income1 | 561 | 507 | 536 | 1,596 | 1,604 | |||||||||||||||
Total revenue | 2,247 | 2,183 | 2,156 | 6,646 | 6,308 | |||||||||||||||
Provision for credit losses – impaired | 138 | 150 | 142 | 502 | 448 | |||||||||||||||
Provision for credit losses – performing | 53 | 20 | 28 | 89 | 78 | |||||||||||||||
Total provision for credit losses | 191 | 170 | 170 | 591 | 526 | |||||||||||||||
Non-interest expenses – reported | 1,208 | 1,148 | 1,172 | 3,565 | 3,483 | |||||||||||||||
Non-interest expenses – adjusted2 | 1,208 | 1,148 | 1,172 | 3,565 | 3,466 | |||||||||||||||
Provision for (recovery of) income taxes – reported1 | 101 | 112 | 111 | 290 | 264 | |||||||||||||||
Provision for (recovery of) income taxes – adjusted1,2 | 101 | 112 | 111 | 290 | 268 | |||||||||||||||
U.S. Retail Bank net income – reported | 747 | 753 | 703 | 2,200 | 2,035 | |||||||||||||||
U.S. Retail Bank net income – adjusted2 | 747 | 753 | 703 | 2,200 | 2,048 | |||||||||||||||
Equity in net income of an investment in TD Ameritrade – reported1,3 | 220 | 195 | 174 | 650 | 363 | |||||||||||||||
Equity in net income of an investment in TD Ameritrade – adjusted1,4 | 220 | 195 | 188 | 650 | 479 | |||||||||||||||
Net income – reported | 967 | 948 | 877 | 2,850 | 2,398 | |||||||||||||||
Net income – adjusted | $ | 967 | $ | 948 | $ | 891 | $ | 2,850 | $ | 2,527 | ||||||||||
Selected volumes and ratios | ||||||||||||||||||||
Return on common equity – reported5 | 12.9 | % | 13.2 | % | 13.1 | % | 12.9 | % | 12.0 | % | ||||||||||
Return on common equity – adjusted2,4,5 | 12.9 | 13.2 | 13.3 | 12.9 | 12.7 | |||||||||||||||
Net interest margin6 | 3.27 | 3.38 | 3.33 | 3.36 | 3.25 | |||||||||||||||
Efficiency ratio – reported | 53.8 | 52.6 | 54.4 | 53.6 | 55.2 | |||||||||||||||
Efficiency ratio – adjusted | 53.8 | 52.6 | 54.4 | 53.6 | 54.9 | |||||||||||||||
Assets under administration (billions of U.S. dollars) | $ | 20 | $ | 20 | $ | 19 | $ | 20 | $ | 19 | ||||||||||
Assets under management (billions of U.S. dollars) | 43 | 47 | 58 | 43 | 58 | |||||||||||||||
Number of U.S. retail stores | 1,238 | 1,238 | 1,246 | 1,238 | 1,246 | |||||||||||||||
Average number of full-time equivalent staff | 26,590 | 26,735 | 26,804 | 26,729 | 26,452 | |||||||||||||||
| 1 | The reduction of the U.S. federal corporate tax rate enacted by the U.S. Tax Act resulted in an adjustment to the Bank's U.S. deferred tax assets and liabilities to the lower base rate of 21% as well as an adjustment to the Bank's carrying balances of certain tax credit-related investments and its investment in TD Ameritrade. The amount was estimated during the first quarter of 2018 and was updated during the third quarter of 2018. The earnings impact was reported in the Corporate segment. For additional details, refer to the"Non-GAAP Financial Measures – Reconciliation of Adjusted to Reported Net Income" table in the "How We Performed" section of this document. |
| 2 | Adjusted U.S. Retail Banknon-interest expense excludes the following item of note: Charges associated with the Bank's acquisition of Scottrade Bank in the second quarter 2018 – $16 million ($12 millionafter-tax) or US$13 million (US$10 millionafter-tax) and first quarter 2018 – $5 million ($4 millionafter-tax) or US$4 million (US$3 millionafter-tax). For explanations of items of note, refer to the"Non-GAAP Financial Measures – Reconciliation of Adjusted to Reported Net Income" table in the "How We Performed" section of this document. |
| 3 | Theafter-tax amounts for amortization of intangibles relating to the Equity in net income of the investment in TD Ameritrade is recorded in the Corporate segment with other acquired intangibles. |
| 4 | Adjusted equity in net income of an investment in TD Ameritrade in the prior year excludes the following items of note: The Bank's share of charges associated with TD Ameritrade's acquisition of Scottrade in the second quarter 2018 – $61 million or US$47 millionafter-tax and first quarter 2018 – $68 million or US$55 millionafter-tax. For explanations of items of note, refer to the"Non-GAAP Financial Measures – Reconciliation of Adjusted to Reported Net Income" table in the "How We Performed" section of this document. |
| 5 | Capital allocated to the business segment was based on 10% CET1 Capital in fiscal 2019 and 9% in fiscal 2018. |
| 6 | Net interest margin excludes the impact related to the TD Ameritrade insured deposit accounts and the impact of intercompany deposits and cash collateral. In addition, the value oftax-exempt interest income is adjusted to its equivalentbefore-tax value. |
Quarterly comparison – Q3 2019 vs. Q3 2018
U.S. Retail reported net income for the quarter was $1,287 million (US$967 million), an increase of $144 million (US$90 million), or 13% (10% in U.S. dollars), compared with the third quarter last year. On an adjusted basis, net income for the quarter was $1,287 million (US$967 million), an increase of $126 million (US$76 million), or 11% (9% in U.S. dollars). The reported and adjusted annualized ROE for the quarter was 12.9%, compared with 13.1% and 13.3%, respectively, in the third quarter last year.
U.S. Retail net income includes contributions from the U.S. Retail Bank and the Bank's investment in TD Ameritrade. Net income for the quarter from the U.S. Retail Bank and the Bank's investment in TD Ameritrade were $993 million (US$747 million) and $294 million (US$220 million), respectively.
The contribution from TD Ameritrade of US$220 million increased US$46 million, or 26%, compared with the third quarter last year, primarily due to higher asset-based revenue, a gain on disposition of assets in the Trust business, and charges associated with the Scottrade transaction in the same quarter last year, partially offset by increased operating expenses. Adjusted contribution from TD Ameritrade increased US$32 million, or 17%.
| TD BANK GROUP• THIRD QUARTER 2019• REPORT TO SHAREHOLDERS | Page 16 |
Table of Contents
U.S. Retail Bank net income of US$747 million for the quarter increased US$44 million, or 6%, primarily due to loan and deposit growth, partially offset by higher expenses and PCL.
U.S. Retail Bank revenue is derived from personal and business banking, and wealth management. Revenue for the quarter was US$2,247 million, an increase of US$91 million, or 4%, compared with the third quarter last year. Net interest income increased US$66 million, or 4%, reflecting growth in loan and deposit volumes. Net interest margin was 3.27%, a decrease of 6 bps, primarily due to balance sheet mix, partially offset by higher deposit margins.Non-interest income increased US$25 million, or 5%, largely due to growth in personal banking fees, partially offset by the decline in wealth management fee income largely due to net fund outflows.
Average loan volumes increased US$9 billion, or 6%, compared with the third quarter last year due to growth in personal and business loans of 5% and 7%, respectively. Average deposit volumes were up US$3 billion, or 1%, compared with the third quarter last year, with growth in personal and business deposit volumes of 5% and 7%, respectively, offset by a decrease of 5% in sweep deposit volumes.
AUA were US$20 billion as at July 31, 2019, up slightly compared with the third quarter last year. AUM were US$43 billion as at July 31, 2019, a decrease of US$15 billion, or 26%, reflecting net fund outflows including the impact of the strategic disposition of U.S. money market funds in the first quarter of this year.
PCL for the quarter was US$191 million, an increase of US$21 million, or 12%, compared with the third quarter last year. PCL – impaired was US$138 million, a decrease of US$4 million, or 3%. PCL – performing was US$53 million, an increase of US$25 million, or 89%, primarily reflecting parameter updates in the consumer lending portfolios, partially offset by lower provisions in the commercial portfolio. U.S. Retail PCL including only the Bank's contractual portion of credit losses in the U.S. strategic cards portfolio, as an annualized percentage of credit volume was 0.48%, an increase of 2 bps.
Non-interest expenses for the quarter were US$1,208 million, an increase of US$36 million, or 3%, compared with the third quarter last year, reflecting higher employee-related costs, business and volume growth, and higher investments in business initiatives, partially offset by productivity and elimination of the Federal Deposit Insurance Corporation (FDIC) deposit insurance surcharge.
The efficiency ratio for the quarter was 53.8%, compared with 54.4%, in the third quarter last year.
Quarterly comparison – Q3 2019 vs. Q2 2019
U.S. Retail net income of $1,287 million (US$967 million) increased $24 million (US$19 million), or 2% (2% in U.S. dollars), compared with the prior quarter. The annualized ROE for the quarter was 12.9%, compared with 13.2% in the prior quarter.
The contribution from TD Ameritrade was US$220 million, an increase of US$25 million, or 13%, compared with the prior quarter, primarily due to a gain on disposition of assets in the Trust business.
U.S. Retail Bank net income for the quarter was US$747 million, a decrease of US$6 million, or 1% compared with the prior quarter.
Revenue for the quarter increased US$64 million, or 3%, compared with the prior quarter. Net interest income increased US$10 million, or 1%, primarily due to the effect of additional days in the quarter coupled with growth in loan and deposit volumes, partially offset by deposit margin compression. Net interest margin was 3.27%, a decrease of 11 bps, primarily due to lower deposit margins and balance sheet mix.Non-interest income increased US$54 million, or 11%, primarily reflecting higher personal banking fees and the effect of additional days in the quarter.
Average loan volumes increased US$3 billion, or 2%, compared with the prior quarter, due to growth in business and personal loans of 1% and 2%, respectively. Average deposit volumes were relatively flat compared with the prior quarter, with growth in business deposit volumes of 2%, offset by a decrease of 1% in sweep deposit volumes.
AUA were US$20 billion, as at July 31, 2019, relatively flat to prior quarter. AUM were US$43 billion as at July 31, 2019, a decrease of US$4 billion, or 8%, reflecting net fund outflows.
PCL for the quarter increased US$21 million, or12%, compared with the prior quarter. PCL – impaired was US$138 million, a decrease of US$12 million, or 8%, primarily reflecting parameter updates in the consumer lending portfolios, partially offset by higher provisions in the commercial portfolio. PCL – performing was US$53 million, an increase of US$33 million, primarily reflecting parameter updates in the consumer lending portfolios, partially offset by lower provisions in the commercial portfolio. U.S. Retail PCL including only the Bank's contractual portion of credit losses in the U.S. strategic cards portfolio, as an annualized percentage of credit volume was 0.48%, an increase of 3 bps.
Non-interest expenses for the quarter were US$1,208 million, an increase of US$60 million, or 5%, compared with the prior quarter, reflecting the recovery of a legal provision in the prior quarter, store optimization, and the effect of additional days in the quarter.
The efficiency ratio for the quarter was 53.8%, compared with 52.6% in the prior quarter.
Year-to-date comparison – Q3 2019 vs. Q3 2018
U.S. Retail reported net income for the nine months ended July 31, 2019, was $3,790 million (US$2,850 million), an increase of $716 million (US$452 million), or 23% (19% in U.S. dollars), compared with the same period last year. On an adjusted basis, net income for the period increased $553 million (US$323 million), or 17% (13% in U.S. dollars). The reported and adjusted annualized ROE for the period was 12.9%, compared with 12.0% and 12.7%, respectively, in the same period last year.
Net income for the period from the U.S. Retail Bank and the Bank's investment in TD Ameritrade was $2,927 million (US$2,200 million) and $863 million (US$650 million), respectively.
The reported contribution from TD Ameritrade of US$650 million increased US$287 million, or 79%, compared with the same period last year, primarily due to charges associated with the Scottrade transaction in the same period last year, higher asset-based revenue, and decreased operating expenses. Adjusted contribution from TD Ameritrade increased US$171 million, or 36%.
U.S. Retail Bank reported net income for the period was US$2,200 million, an increase of US$165 million, or 8%, compared with the same period last year, primarily due to higher revenue, partially offset by higher expenses and PCL. U.S. Retail Bank adjusted net income increased US$152 million, or 7%.
Revenue for the period was US$6,646 million, an increase of US$338 million, or 5%, compared with same period last year. Net interest income increased US$346 million, or 7%, reflecting higher deposit margins as well as growth in loan and deposit volumes. Net interest margin was 3.36%, an 11 bps increase primarily due to higher deposit margins, partially offset by balance sheet mix.Non-interest income decreased US$8 million, as lower wealth management fees and investment income were partially offset by growth in personal banking fees.
Average loan volumes increased US$7 billion, or 5%, compared with the same period last year, due to growth in personal loans of 4% and business loans of 5%. Average deposit volumes increased US$3 billion, or 1%, with growth in personal and business deposit volumes of 4% and 5%, respectively, partially offset by a decrease of 4% in sweep deposit volumes.
PCL was US$591 million, an increase of US$65 million, or 12%, compared with the same period last year. PCL – impaired was US$502 million, an increase of US$54 million, or 12%, primarily reflecting higher provisions for the commercial portfolio. PCL – performing was US$89 million, an increase of US$11 million, or 14%, primarily reflecting parameter updates in the consumer lending portfolios, partially offset by lower provisions in the commercial
| TD BANK GROUP• THIRD QUARTER 2019• REPORT TO SHAREHOLDERS | Page 17 |
Table of Contents
portfolio. U.S. Retail PCL including only the Bank's contractual portion of credit losses in the U.S. strategic cards portfolio, as an annualized percentage of credit volume, was 0.51%, an increase of 3 bps.
Reportednon-interest expenses for the period were US$3,565 million, an increase of US$82 million, or 2%, compared with the same period last year, reflecting higher investments in business initiatives, business volume growth, and higher employee-related costs, partially offset by productivity savings, the elimination of the FDIC deposit insurance surcharge, and the recovery of a legal provision. On an adjusted basis,non-interest expenses increased US$99 million, or 3%.
The reported and adjusted efficiency ratio for the period was 53.6%, compared with 55.2% and 54.9%, respectively, for the same period last year.
TD AMERITRADE HOLDING CORPORATION
Refer to Note 7, Investment in Associates and Joint Ventures of the Bank's Interim Consolidated Financial Statements for further information on TD Ameritrade.
TABLE 13: WHOLESALE BANKING1
| (millions of Canadian dollars, except as noted) | For the three months ended | For the nine months ended | ||||||||||||||||||
| July 31 2019 | April 30 2019 | July 31 2018 | July 31 2019 | July 31 2018 | ||||||||||||||||
Net interest income (TEB) | $ | 198 | $ | 262 | $ | 276 | $ | 633 | $ | 877 | ||||||||||
Non-interest income | 716 | 625 | 533 | 1,750 | 1,709 | |||||||||||||||
Total revenue | 914 | 887 | 809 | 2,383 | 2,586 | |||||||||||||||
Provision for (recovery of) credit losses – impaired | 12 | – | – | 12 | (8 | ) | ||||||||||||||
Provision for (recovery of) credit losses – performing | (11 | ) | (5 | ) | (14 | ) | (9 | ) | 3 | |||||||||||
Total provision for (recovery of) credit losses | 1 | (5 | ) | (14 | ) | 3 | (5 | ) | ||||||||||||
Non-interest expenses | 594 | 597 | 532 | 1,793 | 1,574 | |||||||||||||||
Provision for (recovery of) income taxes (TEB)2 | 75 | 74 | 68 | 139 | 249 | |||||||||||||||
Net income | $ | 244 | $ | 221 | $ | 223 | $ | 448 | $ | 768 | ||||||||||
Selected volumes and ratios | ||||||||||||||||||||
Trading-related revenue (TEB) | $ | 500 | $ | 411 | $ | 275 | $ | 1,162 | $ | 1,265 | ||||||||||
Gross drawn (billions of Canadian dollars)3 | 24.3 | 24.5 | 23.6 | 24.3 | 23.6 | |||||||||||||||
Return on common equity4 | 13.4 | % | 12.5 | % | 14.0 | % | 8.2 | % | 17.5 | % | ||||||||||
Efficiency ratio | 65.0 | 67.3 | 65.8 | 75.2 | 60.9 | |||||||||||||||
Average number of full-time equivalent staff | 4,594 | 4,502 | 4,239 | 4,525 | 4,107 | |||||||||||||||
| 1 | Certain comparative amounts have been recast to conform with the presentation adopted in the current period. |
| 2 | The reduction of the U.S. federal corporate tax rate enacted by the U.S. Tax Act resulted in aone-time adjustment during the first quarter of 2018 to Wholesale Banking's U.S. deferred tax assets and liabilities to the lower base rate of 21%. The earnings impact was reported in the Corporate segment. For additional details, refer to the"Non-GAAP Financial Measures – Reconciliation of Adjusted to Reported Net Income" table in the "How We Performed" section of this document. |
| 3 | Includes gross loans and bankers' acceptances, excluding letters of credit, cash collateral, credit default swaps (CDS), and allowance for credit losses relating to the corporate lending business. |
| 4 | Capital allocated to the business segment was based on 10% CET1 Capital in fiscal 2019 and 9% in fiscal 2018. |
Quarterly comparison – Q3 2019 vs. Q3 2018
Wholesale Banking net income for the quarter was $244 million, an increase of $21 million, or 9%, compared with the third quarter last year, reflecting higher revenue, partially offset by highernon-interest expenses and higher PCL.
Wholesale Banking revenue is derived primarily from capital markets and corporate and investment banking services provided to corporate, government, and institutional clients. Wholesale Banking generates revenue from corporate lending, advisory, underwriting, sales, trading and research, client securitization, trade finance, cash management, prime services, and trade execution services. Revenue for the quarter was $914 million, an increase of $105 million, or 13%, compared with the third quarter last year, reflecting higher trading-related revenue, partially offset by lower advisory and equity underwriting fees.
PCL for the quarter was $1 million, compared to a benefit of $14 million in the third quarter last year. PCL – impaired was $12 million. PCL – performing was a benefit of $11 million, compared to a benefit of $14 million last year.
Non-interest expenses were $594 million, an increase of $62 million, or 12%, compared with the third quarter last year reflecting continued investments supporting the global expansion of Wholesale Banking's U.S. dollar strategy and the impact of foreign exchange translation.
Quarterly comparison – Q3 2019 vs. Q2 2019
Wholesale Banking net income for the quarter was $244 million, an increase of $23 million, or 10%, compared with the prior quarter, reflecting higher revenue and lowernon-interest expenses, partially offset by higher PCL.
Revenue for the quarter increased $27 million, or 3%, compared with the prior quarter, reflecting higher trading-related revenue, partially offset by lower advisory and underwriting fees.
PCL was $1 million, compared to a benefit of $5 million in the prior quarter. PCL – impaired was $12 million. PCL – performing was a benefit of $11 million, compared to a benefit of $5 million in the prior quarter.
Non-interest expenses for the quarter decreased $3 million, or 1%, compared with the prior quarter.
Year-to-date comparison – Q3 2019 vs. Q3 2018
Wholesale Banking net income for the nine months ended July 31, 2019, was $448 million, a decrease of $320 million, compared with net income of $768 million for the same period last year, reflecting lower revenue, highernon-interest expenses, and higher PCL.
Revenue was $2,383 million, a decrease of $203 million, or 8%, compared with the same period last year reflecting challenging market conditions in the first quarter of this year.
PCL was $3 million, compared to a benefit of $5 million in the same period last year. PCL – impaired was $12 million, compared to a benefit of $8 million in the prior year. PCL – performing was a benefit of $9 million, compared to provisions of $3 million in the same period last year.
Non-interest expenses were $1,793 million, an increase of $219 million, or 14%, compared with the same period last year. This increase reflects the revaluation of certain liabilities for post-retirement benefits recognized in the prior year, continued investments supporting the global expansion of Wholesale Banking's U.S. dollar strategy, and the impact of foreign exchange translation, partially offset by lower variable compensation.
| TD BANK GROUP• THIRD QUARTER 2019• REPORT TO SHAREHOLDERS | Page 18 |
Table of Contents
TABLE 14: CORPORATE
| (millions of Canadian dollars) | For the three months ended | For the nine months ended | ||||||||||||||||||
| July 31 2019 | April 30 2019 | July 31 2018 | July 31 2019 | July 31 2018 | ||||||||||||||||
Net income (loss) – reported1 | $ | (173 | ) | $ | (161 | ) | $ | (113 | ) | $ | (526 | ) | $ | (910 | ) | |||||
Pre-tax adjustments for items of note2 | ||||||||||||||||||||
Amortization of intangibles | 75 | 78 | 77 | 233 | 248 | |||||||||||||||
Impact from U.S. tax reform1 | – | – | – | – | 48 | |||||||||||||||
Totalpre-tax adjustments for items of note | 75 | 78 | 77 | 233 | 296 | |||||||||||||||
Provision for (recovery of) income taxes for items of note1 | 11 | 12 | 73 | 36 | (302 | ) | ||||||||||||||
Net income (loss) – adjusted | $ | (109 | ) | $ | (95 | ) | $ | (109 | ) | $ | (329 | ) | $ | (312 | ) | |||||
Decomposition of items included in net income (loss) – adjusted | ||||||||||||||||||||
Net corporate expenses | $ | (156 | ) | $ | (176 | ) | $ | (214 | ) | $ | (514 | ) | $ | (601 | ) | |||||
Other | 47 | 81 | 87 | 167 | 235 | |||||||||||||||
Non-controlling interests | – | – | 18 | 18 | 54 | |||||||||||||||
Net income (loss) – adjusted | $ | (109 | ) | $ | (95 | ) | $ | (109 | ) | $ | (329 | ) | $ | (312 | ) | |||||
Selected volumes | ||||||||||||||||||||
Average number of full-time equivalent staff | 17,277 | 16,710 | 15,377 | 16,739 | 14,764 | |||||||||||||||
| 1 | The reduction of the U.S. federal corporate tax rate enacted by the U.S. Tax Act in the first quarter of 2018 resulted in a net charge to earnings of $453 million, comprising a net $48 millionpre-tax charge related to the write-down of certain tax credit-related investments, partially offset by the favourable impact of the Bank's share of TD Ameritrade's remeasurement of its deferred income tax balances, and a net $405 million income tax expense resulting from the remeasurement of the Bank's deferred tax assets and liabilities to the lower base rate of 21% and other related tax adjustments. The amount was estimated during the first quarter of 2018 and was updated during the third quarter of 2018, resulting in a net $61 million deferred income tax benefit. |
| 2 | For explanations of items of note, refer to the"Non-GAAP Financial Measures – Reconciliation of Adjusted to Reported Net Income" table in the "How We Performed" section of this document. |
Quarterly comparison – Q3 2019 vs. Q3 2018
Corporate segment's reported net loss for the quarter was $173 million, compared with a reported net loss of $113 million in the third quarter last year. Reported net loss increased primarily due to the income tax benefit from an update to the impact of U.S. tax reform in the third quarter last year, lower contribution from other items andnon-controlling interests, partially offset by lower net corporate expenses. Other items decreased largely reflecting the negative impact of tax items and legal provisions in the current quarter. Net corporate expenses were lower largely due to lower net pension expenses and lower enterprise projects in the current quarter. Adjusted net loss was $109 million, flat to the third quarter last year.
Quarterly comparison – Q3 2019 vs. Q2 2019
Corporate segment's reported net loss for the quarter was $173 million, compared with a reported net loss of $161 million in the prior quarter. Reported net loss increased primarily reflecting lower contribution from other items, partially offset by lower net corporate expenses. Other items decreased reflecting the negative impact of tax items and lower revenue from treasury and balance sheet management activities in the current quarter. Net corporate expenses were lower largely due to lower net pension expenses and lower tax items in the current quarter. Adjusted net loss was $109 million, compared with an adjusted net loss of $95 million in the prior quarter.
Year-to-date comparison – Q3 2019 vs. Q3 2018
Corporate segment's reported net loss for the nine months ended July 31, 2019, was $526 million, compared with a reported net loss of $910 million in the same period last year. The decrease in reported net loss is primarily due to the income tax charge resulting from the impact from U.S. tax reform in the same period last year and lower net corporate expenses in the current period, partially offset by lower contribution from other items andnon-controlling interests. Other items decreased reflecting the impact of legal provisions and lower revenue from treasury and balance sheet management activities in the current period. Net corporate expenses decreased primarily reflecting lower net pension expenses in the current period. Adjusted net loss for the nine months ended July 31, 2019, was $329 million, compared with an adjusted net loss of $312 million in the same period last year.
| TD BANK GROUP• THIRD QUARTER 2019• REPORT TO SHAREHOLDERS | Page 19 |
Table of Contents
The following table provides summary information related to the Bank's eight most recently completed quarters.
TABLE 15: QUARTERLY RESULTS1
| (millions of Canadian dollars, except as noted) | For the three months ended | |||||||||||||||||||||||||||||||
| 2019 | 2018 | 2017 | ||||||||||||||||||||||||||||||
| Jul. 31 | Apr. 30 | Jan. 31 | Oct. 31 | Jul. 31 | Apr. 30 | Jan. 31 | Oct. 31 | |||||||||||||||||||||||||
Net interest income | $ | 6,024 | $ | 5,872 | $ | 5,860 | $ | 5,756 | $ | 5,655 | $ | 5,398 | $ | 5,430 | $ | 5,330 | ||||||||||||||||
Non-interest income | 4,475 | 4,356 | 4,138 | 4,380 | 4,244 | 4,084 | 3,945 | 3,955 | ||||||||||||||||||||||||
Total revenue | 10,499 | 10,228 | 9,998 | 10,136 | 9,899 | 9,482 | 9,375 | 9,285 | ||||||||||||||||||||||||
Provision for credit losses | 655 | 633 | 850 | 670 | 561 | 556 | 693 | 578 | ||||||||||||||||||||||||
Insurance claims and related expenses | 712 | 668 | 702 | 684 | 627 | 558 | 575 | 615 | ||||||||||||||||||||||||
Non-interest expenses | 5,374 | 5,248 | 5,855 | 5,366 | 5,131 | 4,837 | 4,861 | 4,843 | ||||||||||||||||||||||||
Provision for (recovery of) income taxes | 813 | 773 | 503 | 691 | 705 | 746 | 1,040 | 640 | ||||||||||||||||||||||||
Equity in net income of an investment inTD Ameritrade | 303 | 266 | 322 | 235 | 230 | 131 | 147 | 103 | ||||||||||||||||||||||||
Net income – reported | 3,248 | 3,172 | 2,410 | 2,960 | 3,105 | 2,916 | 2,353 | 2,712 | ||||||||||||||||||||||||
Pre-tax adjustments for items of note | ||||||||||||||||||||||||||||||||
Amortization of intangibles2 | 75 | 78 | 80 | 76 | 77 | 86 | 85 | 78 | ||||||||||||||||||||||||
Charges related to the long-term loyalty agreementwith Air Canada2 | – | – | 607 | – | – | – | – | – | ||||||||||||||||||||||||
Charges associated with the acquisition of Greystone2 | 26 | 30 | 31 | – | – | – | – | – | ||||||||||||||||||||||||
Charges associated with the Scottrade transaction2 | – | – | – | 25 | 18 | 77 | 73 | 46 | ||||||||||||||||||||||||
Impact from U.S. tax reform2 | – | – | – | – | – | – | 48 | – | ||||||||||||||||||||||||
Dilution gain on the Scottrade transaction3 | – | – | – | – | – | – | – | (204 | ) | |||||||||||||||||||||||
Totalpre-tax adjustments for items of note | 101 | 108 | 718 | 101 | 95 | 163 | 206 | (80 | ) | |||||||||||||||||||||||
Provision for (recovery of) income taxes foritems of note | 11 | 14 | 175 | 13 | 73 | 17 | (387 | ) | 29 | |||||||||||||||||||||||
Net income – adjusted | 3,338 | 3,266 | 2,953 | 3,048 | 3,127 | 3,062 | 2,946 | 2,603 | ||||||||||||||||||||||||
Preferred dividends | 62 | 62 | 60 | 51 | 59 | 52 | 52 | 50 | ||||||||||||||||||||||||
Net income available to commonshareholders andnon-controlling interests in subsidiaries – adjusted | $ | 3,276 | $ | 3,204 | $ | 2,893 | $ | 2,997 | $ | 3,068 | $ | 3,010 | $ | 2,894 | $ | 2,553 | ||||||||||||||||
Attributable to: | ||||||||||||||||||||||||||||||||
Common shareholders – adjusted | $ | 3,276 | $ | 3,204 | $ | 2,875 | $ | 2,979 | $ | 3,050 | $ | 2,992 | $ | 2,876 | $ | 2,518 | ||||||||||||||||
Non-controlling interests – adjusted | – | – | 18 | 18 | 18 | 18 | 18 | 35 | ||||||||||||||||||||||||
(Canadian dollars, except as noted) | ||||||||||||||||||||||||||||||||
Basic earnings per share | ||||||||||||||||||||||||||||||||
Reported | $ | 1.75 | $ | 1.70 | $ | 1.27 | $ | 1.58 | $ | 1.65 | $ | 1.54 | $ | 1.24 | $ | 1.42 | ||||||||||||||||
Adjusted | 1.79 | 1.75 | 1.57 | 1.63 | 1.67 | 1.62 | 1.56 | 1.36 | ||||||||||||||||||||||||
Diluted earnings per share | ||||||||||||||||||||||||||||||||
Reported | 1.74 | 1.70 | 1.27 | 1.58 | 1.65 | 1.54 | 1.24 | 1.42 | ||||||||||||||||||||||||
Adjusted | 1.79 | 1.75 | 1.57 | 1.63 | 1.66 | 1.62 | 1.56 | 1.36 | ||||||||||||||||||||||||
Return on common equity – reported | 15.8 | % | 16.5 | % | 12.2 | % | 15.8 | % | 16.9 | % | 16.8 | % | 13.2 | % | 15.4 | % | ||||||||||||||||
Return on common equity – adjusted | 16.2 | 17.0 | 15.0 | 16.3 | 17.1 | 17.6 | 16.6 | 14.7 | ||||||||||||||||||||||||
(billions of Canadian dollars, except as noted) | ||||||||||||||||||||||||||||||||
Average earning assets | $ | 1,240 | $ | 1,191 | $ | 1,200 | $ | 1,183 | $ | 1,152 | $ | 1,124 | $ | 1,116 | $ | 1,077 | ||||||||||||||||
Net interest margin | 1.93 | % | 2.02 | % | 1.94 | % | 1.93 | % | 1.95 | % | 1.97 | % | 1.93 | % | 1.96 | % | ||||||||||||||||
| 1 | Certain comparative amounts have been recast to conform with the presentation adopted in the current period. |
| 2 | For explanations of items of note, refer to the"Non-GAAP Financial Measures – Reconciliation of Adjusted to Reported Net Income" table in the "How We Performed" section of this document. |
| 3 | In connection with TD Ameritrade's acquisition of Scottrade on September 18, 2017, TD Ameritrade issued 38.8 million shares, of which the Bank purchased 11.1 million pursuant to itspre-emptive rights. As a result of the share issuances, the Bank's common stock ownership percentage in TD Ameritrade decreased and the Bank realized a dilution gain of $204 million reported in the Corporate segment. |
| TD BANK GROUP• THIRD QUARTER 2019• REPORT TO SHAREHOLDERS | Page 20 |
Table of Contents
TABLE 16: SELECTED INTERIM CONSOLIDATED BALANCE SHEET ITEMS1
(millions of Canadian dollars) | As at | |||||||
| July 31, 2019 | October 31, 2018 | |||||||
Assets | ||||||||
Cash and interest-bearing deposits with banks | $ | 39,709 | $ | 35,455 | ||||
Trading loans, securities, and other | 142,161 | 127,897 | ||||||
Non-trading financial assets at fair value through profit or loss | 6,033 | 4,015 | ||||||
Derivatives | 52,555 | 56,996 | ||||||
Financial assets designated at fair value through profit or loss | 4,018 | 3,618 | ||||||
Financial assets at fair value through other comprehensive income | 116,700 | 130,600 | ||||||
Debt securities at amortized cost, net of allowance for credit losses | 116,390 | 107,171 | ||||||
Securities purchased under reverse repurchase agreements | 162,644 | 127,379 | ||||||
Loans, net of allowance for loan losses | 675,932 | 646,393 | ||||||
Other | 89,300 | 95,379 | ||||||
Total assets | $ | 1,405,442 | $ | 1,334,903 | ||||
Liabilities | ||||||||
Trading deposits | $ | 37,796 | $ | 114,704 | ||||
Derivatives | 53,569 | 48,270 | ||||||
Financial liabilities designated at fair value through profit or loss | 95,774 | 16 | ||||||
Deposits | 870,326 | 851,439 | ||||||
Obligations related to securities sold under repurchase agreements | 123,208 | 93,389 | ||||||
Subordinated notes and debentures | 10,596 | 8,740 | ||||||
Other | 127,791 | 138,305 | ||||||
Total liabilities | 1,319,060 | 1,254,863 | ||||||
Total equity | 86,382 | 80,040 | ||||||
Total liabilities and equity | $ | 1,405,442 | $ | 1,334,903 | ||||
| 1 | Certain comparative amounts have been reclassified to conform with the presentation adopted in the current period. |
Total assets were $1,405 billion as at July 31, 2019, an increase of $71 billion, or 5%, from October 31, 2018. The increase was primarily due to securities purchased under reverse repurchase agreements of $35 billion, loans, net of allowances for loan losses of $30 billion, trading loans, securities, and other of $14 billion, debt securities at amortized cost, net of allowance for credit losses of $9 billion, cash and interest-bearing deposits with banks of $4 billion,non-trading financial assets at fair value through profit or loss of $2 billion, and financial assets designated at fair value through profit or loss of $1 billion. The increase was partially offset by decreases in financial assets at fair value through other comprehensive income (FVOCI) of $14 billion, derivatives of $4 billion, and other assets of $6 billion. The foreign currency translation impact on total assets, primarily in the U.S. Retail segment, was an increase of approximately $1 billion.
Cash and interest-bearing deposits with banks increased $4 billion primarily due to cash management activities.
Trading loans, securities, and other increased $14 billion primarily due to higher market value of trading securities.
Non-trading financial assets at fair value through profit or loss increased $2 billion primarily due to new investments.
Derivativesdecreased $4 billion primarily due to the impact of netting positions, foreign exchange, and equity markets on themark-to-market values, partially offset by changes in interest rates.
Financial assets at FVOCIdecreased $14 billion primarily due to sales and maturities, partially offset by new investments.
Debt securities at amortized cost, net of allowance for credit lossesincreased $9 billion primarily due to new investments, partially offset by maturities.
Securities purchased under reverse repurchase agreementsincreased $35 billionprimarily due to an increase in trading volumes and financing activities.
Loans (net of allowance for loan losses) increased $30 billion primarily due to business and government loans, residential mortgages, and home equity lines of credit (HELOC).
Otherassets decreased $6 billion primarily due to amounts receivable from brokers, dealers, and clients due to unsettled and pending trades.
Total liabilities were $1,319 billion as at July 31, 2019, an increase of $64 billion, or 5%, from October 31, 2018. The increase was primarily due to financial liabilities designated at fair value though profit or loss of $96 billion, obligations related to securities sold under repurchase agreements of $30 billion, deposits of $19 billion, derivatives of $5 billion, and subordinated loans and debentures of $2 billion. The increase was partially offset by decreases in trading deposits of $77 billion and other liabilities of $11 billion. The foreign currency translation impact on total liabilities, primarily in the U.S. Retail segment, was an increase of approximately $1 billion.
Trading depositsdecreased $77 billion as majority of maturing deposits were reissued as financial liabilities designated at fair value through profit or loss.
Derivativesincreased $5 billion primarily due to changes in interest rates, partially offset by the impact of netting positions.
Financial liabilities designated at fair value through profit or loss increased $96 billion due to new issuances of funding instruments.
Deposits increased $19 billion primarily due to an increase in personal deposits, and business and government deposits.
Obligations related to securities sold under repurchase agreementsincreased $30 billion primarily due to an increase in trading volumes and financing activities.
| TD BANK GROUP• THIRD QUARTER 2019• REPORT TO SHAREHOLDERS | Page 21 |
Table of Contents
Subordinated loans and debentures increased $2 billion primarily due to the issuance of non-viability contingent capital (NVCC) subordinated debentures.
Otherliabilities decreased $11 billion primarily due to amounts payable to brokers, dealers, and clientsdue to unsettled and pending trades, and obligations related to securities sold short.
Equitywas $86 billion as at July 31, 2019, an increase of $6 billion, or 8%, from October 31, 2018. The increase was primarily due to other comprehensive income from gains on cash flow hedges, retained earnings, the issuance ofNon-Cumulative5-year Rate Reset Preferred Shares, Series 22 and 24, and the issuance of common shares due to the acquisition of Greystone, partially offset by the redemption of the TD Capital Trust III securities.
Quarterly comparison – Q3 2019 vs. Q3 2018
Gross impaired loans excluding FDIC covered loans and other ACI loans were $2,945 million as at July 31, 2019, a decrease of $19 million, or 1%, compared with the third quarter last year. Canadian Retail gross impaired loans increased $243 million, or 31%, compared with the third quarter last year largely due to new formations in the commercial portfolio. U.S. Retail gross impaired loans decreased $281 million, or 13%, compared with the third quarter last year largely reflecting a reclassification to performing for certain U.S. HELOC clients current with their payments. Wholesale Banking gross impaired loans were $19 million in the current quarter compared to nil in the third quarter last year. Net impaired loans were $2,237 million as at July 31, 2019, a decrease of $38 million, or 2%, compared with the third quarter last year.
The allowance for credit losses of $4,858 million as at July 31, 2019, was comprised of Stage 3 allowance for impaired loans of $729 million, Stage 2 allowance of $1,800 million, and Stage 1 allowance of $2,325 million collectively for performing loans andoff-balance sheet instruments and allowance for debt securities of $4 million.
The Stage 3 allowance for loan losses increased $20 million, or 3%, compared with the third quarter last year. The Stage 1 and Stage 2 allowance for loan losses increased $388 million, or 10%, largely reflecting the impact of foreign exchange, an increase in the U.S. credit card portfolio due to volume growth, seasoning, and mix shift, and parameter updates in the consumer lending portfolios.
The allowance for debt securities decreased by $99 million, or 96% compared with the third quarter last year primarily reflecting the sale of certain debt securities.
The Bank periodically reviews the methodology for assessing significant increase in credit risk and expected credit losses (ECLs). Forward-looking information is incorporated as appropriate where macroeconomic scenarios and associated probability weights are updated quarterly and incorporated to determine the probability-weighted ECLs. As part of periodic review and quarterly updates, certain revisions may be made to reflect updates in statistically derived loss estimates for the Bank's recent loss experience of its credit portfolios and forward-looking views, which may cause a change to the allowance for ECLs. During the third quarter of 2019, ordinary course updates were made to the forward-looking estimates used to determine the Bank's probability-weighted ECLs. Certain refinements were made to the methodology, the cumulative effect of which was not material and included in the change for the quarter.
The Bank calculates allowances for ECLs on debt securities measured at amortized cost and FVOCI. The Bank has $229 billion in such debt securities of which $229 billion are performing securities (Stage 1 and Stage 2) and none are impaired (Stage 3). The allowance for credit losses on debt securities at amortized cost (DSAC) and debt securities at FVOCI was $1 million and $3 million, respectively.
Quarterly comparison – Q3 2019 vs. Q2 2019
Gross impaired loans excluding FDIC covered loans and other ACI loans decreased $351 million, or 11%, compared with the prior quarter largely reflecting a sale of impaired loans in the U.S. commercial portfolio, attributable to the power and utilities sector, and the impact of foreign exchange. Impaired loans net of allowance decreased $285 million, or 11%, compared with the prior quarter reflecting the sale of impaired loans in the U.S. commercial portfolio, and the impact of foreign exchange.
The Stage 3 allowance for loan losses decreased $68 million, or 9%, compared with the prior quarter, primarily driven by parameter updates in the consumer lending portfolios. The Stage 1 and Stage 2 allowance for loan losses increased $39 million, or 1%, compared with the prior quarter.
The allowance for debt securities was $4 million as at July 31, 2019, stable over prior quarter.
For further details on loans, impaired loans, and allowance for credit losses, refer to Note 6 of the Bank's third quarter 2019 Interim Consolidated Financial Statements.
TABLE 17: CHANGES IN GROSS IMPAIRED LOANS AND ACCEPTANCES
(millions of Canadian dollars) | For the three months ended | For the nine months ended | ||||||||||||||||||
July 31 2019 | April 30 2019 | July 31 2018 | July 31 2019 | July 31 2018 | ||||||||||||||||
Personal, Business, and Government Loans1 | ||||||||||||||||||||
Impaired loans as at beginning of period | $ | 3,296 | $ | 3,534 | $ | 2,993 | $ | 3,154 | $ | 3,085 | ||||||||||
Classified as impaired during the period | 1,459 | 1,340 | 1,182 | 4,521 | 3,588 | |||||||||||||||
Transferred to performing during the period | (335 | ) | (489 | ) | (198 | ) | (1,024 | ) | (637 | ) | ||||||||||
Net repayments | (374 | ) | (358 | ) | (336 | ) | (1,103 | ) | (1,033 | ) | ||||||||||
Disposals of loans | (278 | ) | (14 | ) | (7 | ) | (292 | ) | (20 | ) | ||||||||||
Amounts written off | (790 | ) | (769 | ) | (699 | ) | (2,325 | ) | (2,043 | ) | ||||||||||
Recoveries of loans and advances previously written off | – | – | – | – | – | |||||||||||||||
Exchange and other movements | (33 | ) | 52 | 29 | 14 | 24 | ||||||||||||||
Impaired loans as at end of period | $ | 2,945 | $ | 3,296 | $ | 2,964 | $ | 2,945 | $ | 2,964 | ||||||||||
| 1 | Excludes FDIC covered loans and other ACI loans. |
| TD BANK GROUP• THIRD QUARTER 2019• REPORT TO SHAREHOLDERS | Page 22 |
Table of Contents
TABLE 18: ALLOWANCE FOR CREDIT LOSSES1
(millions of Canadian dollars, except as noted) | As at | |||||||||||
| July 31 2019 | April 30 2019 | July 31 2018 | ||||||||||
Allowance for loan losses foron-balance sheet loans | ||||||||||||
Stage 1 allowance for loan losses | $ | 1,717 | $ | 1,691 | $ | 1,614 | ||||||
Stage 2 allowance for loan losses | 1,330 | 1,297 | 1,212 | |||||||||
Stage 3 allowance for loan losses | 722 | 790 | 709 | |||||||||
Total allowance for loan losses foron-balance sheet loans | 3,769 | 3,778 | 3,535 | |||||||||
Allowance foroff-balance sheet instruments | ||||||||||||
Stage 1 allowance for loan losses | 608 | 580 | 511 | |||||||||
Stage 2 allowance for loan losses | 470 | 518 | 400 | |||||||||
Stage 3 allowance for loan losses | 7 | 7 | – | |||||||||
Total allowance foroff-balance sheet instruments | 1,085 | 1,105 | 911 | |||||||||
Allowance for loan losses | 4,854 | 4,883 | 4,446 | |||||||||
Allowance for debt securities | 4 | 4 | 103 | |||||||||
Allowance for credit losses | $ | 4,858 | $ | 4,887 | $ | 4,549 | ||||||
Impaired loans, net of allowance2,3 | $ | 2,237 | $ | 2,522 | $ | 2,275 | ||||||
Net impaired loans as a percentage of net loans2,3 | 0.32 | % | 0.37 | % | 0.35 | % | ||||||
Provision for credit losses as a percentage of net average loans and acceptances2 | 0.38 | 0.39 | 0.35 | |||||||||
| 1 | Certain comparative amounts have been recast to conform with the presentation adopted in the current period. |
| 2 | Excludes FDIC covered loans and other ACI loans. |
| 3 | Credit cards are considered impaired when they are 90 days past due and written off at 180 days past due. |
Real Estate Secured Lending
Retail real estate secured lending includes mortgages and lines of credit to North American consumers to satisfy financing needs including home purchases and refinancing. While the Bank retains first lien on the majority of properties held as security, there is a small portion of loans with second liens, but most of these are behind a TD mortgage that is in first position. In Canada, credit policies are designed to ensure that the combined exposure of all uninsured facilities on one property does not exceed 80% of the collateral value at origination. Lending at a higherloan-to-value ratio is permitted by legislation but requires default insurance. This insurance is contractual coverage for the life of eligible facilities and protects the Bank's real estate secured lending portfolio against potential losses caused by borrowers' default. The Bank also purchases default insurance on lowerloan-to-value ratio loans. The insurance is provided by either government-backed entities or approved private mortgage insurers. In the U.S., for residential mortgage originations, mortgage insurance is usually obtained from either government-backed entities or approved private mortgage insurers when theloan-to-value exceeds 80% of the collateral value at origination.
The Bank regularly performs stress tests on its real estate lending portfolio as part of its overall stress testing program. This is done with a view to determine the extent to which the portfolio would be vulnerable to a severe downturn in economic conditions. The effect of severe changes in house prices, interest rates, and unemployment levels are among the factors considered when assessing the impact on credit losses and the Bank's overall profitability. A variety of portfolio segments, including dwelling type and geographical regions, are examined during the exercise to determine whether specific vulnerabilities exist. Based on the Bank's most recent reviews, potential losses on all real estate secured lending exposures are considered manageable.
TABLE 19: CANADIAN REAL ESTATE SECURED LENDING1
(millions of Canadian dollars) | As at | |||||||||||||||||||
| Amortizing | Non-amortizing | Total | ||||||||||||||||||
| | Residential Mortgages | | Home equity lines of credit |
| | Total amortizing real estate secured lending | | | Home equity lines of credit | | ||||||||||
| July 31, 2019 | ||||||||||||||||||||
Total | $ | 198,162 | $ | 54,869 | $ | 253,031 | $ | 35,163 | $ | 288,194 | ||||||||||
| October 31, 2018 | ||||||||||||||||||||
Total | $ | 193,829 | $ | 50,554 | $ | 244,383 | $ | 35,605 | $ | 279,988 | ||||||||||
| 1 | Excludes loans classified as trading as the Bank intends to sell the loans immediately or in the near term, and loans designated at fair value through profit or loss for which no allowance is recorded. |
| TD BANK GROUP• THIRD QUARTER 2019• REPORT TO SHAREHOLDERS | Page 23 |
Table of Contents
TABLE 20: REAL ESTATE SECURED LENDING1,2,3
(millions of Canadian dollars, except as noted) |
| As at | ||||||||||||||||||||||||||||||||||||||||||||||
|
| |||||||||||||||||||||||||||||||||||||||||||||||
| Residential mortgages | Home equity lines of credit | Total | ||||||||||||||||||||||||||||||||||||||||||||||
| Insured4 | Uninsured | Insured4 | Uninsured | Insured4 | Uninsured | |||||||||||||||||||||||||||||||||||||||||||
| July 31, 2019 | ||||||||||||||||||||||||||||||||||||||||||||||||
Canada | ||||||||||||||||||||||||||||||||||||||||||||||||
Atlantic provinces | $ | 3,375 | 1.7 | % | $ | 2,759 | 1.4 | % | $ | 373 | 0.4 | % | $ | 1,290 | 1.4 | % | $ | 3,748 | 1.3 | % | $ | 4,049 | 1.4 | % | ||||||||||||||||||||||||
British Columbia5 | 11,290 | 5.7 | 25,426 | 12.8 | 1,932 | 2.1 | 15,093 | 16.9 | 13,222 | 4.6 | 40,519 | 14.1 | ||||||||||||||||||||||||||||||||||||
Ontario5 | 32,266 | 16.3 | 66,590 | 33.7 | 6,827 | 7.6 | 43,128 | 47.9 | 39,093 | 13.5 | 109,718 | 38.1 | ||||||||||||||||||||||||||||||||||||
Prairies5 | 22,621 | 11.4 | 15,723 | 7.9 | 3,077 | 3.4 | 11,002 | 12.2 | 25,698 | 8.9 | 26,725 | 9.3 | ||||||||||||||||||||||||||||||||||||
Québec | 8,941 | 4.5 | 9,171 | 4.6 | 1,184 | 1.3 | 6,126 | 6.8 | 10,125 | 3.5 | 15,297 | 5.3 | ||||||||||||||||||||||||||||||||||||
Total Canada | 78,493 | 39.6 | % | 119,669 | 60.4 | % | 13,393 | 14.8 | % | 76,639 | 85.2 | % | 91,886 | 31.8 | % | 196,308 | 68.2 | % | ||||||||||||||||||||||||||||||
United States | 928 | 32,259 | – | 11,784 | 928 | 44,043 | ||||||||||||||||||||||||||||||||||||||||||
Total | $ | 79,421 | $ | 151,928 | $ | 13,393 | $ | 88,423 | $ | 92,814 | $ | 240,351 | ||||||||||||||||||||||||||||||||||||
October 31, 2018 | ||||||||||||||||||||||||||||||||||||||||||||||||
Canada | ||||||||||||||||||||||||||||||||||||||||||||||||
Atlantic provinces | $ | 3,492 | 1.8 | % | $ | 2,544 | 1.3 | % | $ | 424 | 0.5 | % | $ | 1,312 | 1.5 | % | $ | 3,916 | 1.4 | % | $ | 3,856 | 1.4 | % | ||||||||||||||||||||||||
British Columbia5 | 12,389 | 6.4 | 23,460 | 12.1 | 1,981 | 2.3 | 14,221 | 16.5 | 14,370 | 5.1 | 37,681 | 13.5 | ||||||||||||||||||||||||||||||||||||
Ontario5 | 35,355 | 18.2 | 60,308 | 31.2 | 7,052 | 8.2 | 40,163 | 46.6 | 42,407 | 15.1 | 100,471 | 35.9 | ||||||||||||||||||||||||||||||||||||
Prairies5 | 23,561 | 12.2 | 14,998 | 7.7 | 3,408 | 4.0 | 10,963 | 12.7 | 26,969 | 9.6 | 25,961 | 9.3 | ||||||||||||||||||||||||||||||||||||
Québec | 9,350 | 4.8 | 8,372 | 4.3 | 1,105 | 1.3 | 5,530 | 6.4 | 10,455 | 3.7 | 13,902 | 5.0 | ||||||||||||||||||||||||||||||||||||
Total Canada | 84,147 | 43.4 | % | 109,682 | 56.6 | % | 13,970 | 16.3 | % | 72,189 | 83.7 | % | 98,117 | 34.9 | % | 181,871 | 65.1 | % | ||||||||||||||||||||||||||||||
United States | 900 | 30,462 | 1 | 12,367 | 901 | 42,829 | ||||||||||||||||||||||||||||||||||||||||||
Total | $ | 85,047 | $ | 140,144 | $ | 13,971 | $ | 84,556 | $ | 99,018 | $ | 224,700 | ||||||||||||||||||||||||||||||||||||
| 1 | Certain comparative amounts have been restated to conform with the presentation adopted in the current period. |
| 2 | Geographic location is based on the address of the property mortgaged. |
| 3 | Excludes loans classified as trading as the Bank intends to sell the loans immediately or in the near term, and loans designated at fair value through profit or loss for which no allowance is recorded. |
| 4 | Default insurance is contractual coverage for the life of eligible facilities whereby the Bank's exposure to real estate secured lending, all or in part, is protected against potential losses caused by borrower default. It is provided by either government-backed entities or other approved private mortgage insurers. |
| 5 | The territories are included as follows: Yukon is included in British Columbia; Nunavut is included in Ontario; and the Northwest Territories is included in the Prairies region. |
The following table provides a summary of the Bank's residential mortgages by remaining amortization period. All figures are calculated based on current customer payment behaviour in order to properly reflect the propensity to prepay by borrowers. The current customer payment basis accounts for any accelerated payments madeto-date, and projects remaining amortization based on existing balance outstanding and current payment terms.
TABLE 21: RESIDENTIAL MORTGAGES BY REMAINING AMORTIZATION1,2
| As at | ||||||||||||||||||||||||||||||||||||
| | <5 years | | | 5– <10 years | | | 10– <15 years | | | 15– <20 years | | | 20– <25 years | | | 25– <30 years | | | 30– <35 years | | | >=35 years | | Total | ||||||||||||
| July 31, 2019 | ||||||||||||||||||||||||||||||||||||
Canada | 1.0 | % | 3.6 | % | 6.6 | % | 15.9 | % | 43.7 | % | 28.5 | % | 0.7 | % | – | % | 100 | % | ||||||||||||||||||
United States | 4.8 | 6.9 | 4.8 | 6.0 | 27.6 | 48.1 | 1.5 | 0.3 | 100 | |||||||||||||||||||||||||||
Total | 1.6 | % | 4.1 | % | 6.4 | % | 14.5 | % | 41.3 | % | 31.3 | % | 0.8 | % | – | % | 100 | % | ||||||||||||||||||
October 31, 2018 | ||||||||||||||||||||||||||||||||||||
Canada | 1.0 | % | 3.8 | % | 6.7 | % | 15.1 | % | 42.7 | % | 30.1 | % | 0.6 | % | – | % | 100 | % | ||||||||||||||||||
United States | 4.8 | 8.2 | 4.8 | 5.2 | 29.4 | 46.3 | 1.0 | 0.3 | 100 | |||||||||||||||||||||||||||
Total | 1.6 | % | 4.4 | % | 6.5 | % | 13.7 | % | 40.8 | % | 32.4 | % | 0.6 | % | – | % | 100 | % | ||||||||||||||||||
| 1 | Excludes loans classified as trading as the Bank intends to sell the loans immediately or in the near term, and loans designated at fair value through profit or loss for which no allowance is recorded. |
| 2 | Percentage based on outstanding balance. |
TABLE 22: UNINSURED AVERAGELOAN-TO-VALUE – Newly Originated and Newly Acquired1,2,3
| For the three months ended | ||||||||||||||||||||||||
| | Residential mortgages | | | Home equity lines of credit4,5 | | Total | | Residential mortgages | | | Home equity lines of credit4,5 | | Total | |||||||||||
| July 31, 2019 | October 31, 2018 | |||||||||||||||||||||||
Canada | ||||||||||||||||||||||||
Atlantic provinces | 73 | % | 70 | % | 72 | % | 75 | % | 71 | % | 73 | % | ||||||||||||
British Columbia6 | 67 | 62 | 65 | 65 | 62 | 64 | ||||||||||||||||||
Ontario6 | 68 | 65 | 67 | 67 | 65 | 66 | ||||||||||||||||||
Prairies6 | 73 | 71 | 72 | 73 | 71 | 72 | ||||||||||||||||||
Québec | 73 | 73 | 73 | 73 | 73 | 73 | ||||||||||||||||||
Total Canada | 69 | 66 | 68 | 68 | 66 | 67 | ||||||||||||||||||
United States | 71 | 61 | 68 | 70 | 59 | 65 | ||||||||||||||||||
Total | 69 | % | 65 | % | 68 | % | 68 | % | 65 | % | 67 | % | ||||||||||||
| 1 | Geographic location is based on the address of the property mortgaged. |
| 2 | Excludes loans classified as trading as the Bank intends to sell the loans immediately or in the near term, and loans designated at fair value through profit or loss for which no allowance is recorded. |
| 3 | Based on house price at origination. |
| 4 | HELOCloan-to-value includes first position collateral mortgage if applicable. |
| 5 | HELOC fixed rate advantage option is included inloan-to-value calculation. |
| 6 | The territories are included as follows: Yukon is included in British Columbia; Nunavut is included in Ontario; and the Northwest Territories is included in the Prairies region. |
| TD BANK GROUP• THIRD QUARTER 2019• REPORT TO SHAREHOLDERS | Page 24 |
Table of Contents
Sovereign Risk
The following table provides a summary of the Bank's credit exposure to certain European countries, including Greece, Italy, Ireland, Portugal, and Spain (GIIPS).
TABLE 23: EXPOSURE TO EUROPE – Total Net Exposure by Country and Counterparty1
(millions of Canadian dollars) |
| As at | ||||||||||||||||||||||||||||||||||||||||||||||||||
|
| |||||||||||||||||||||||||||||||||||||||||||||||||||
| Loans and commitments2 | Derivatives, repos, and securities lending3 | Trading and investment portfolio4,5 | Total | |||||||||||||||||||||||||||||||||||||||||||||||||
| Corporate | Sovereign | Financial | Total | Corporate | Sovereign | Financial | Total | Corporate | Sovereign | Financial | Total | Exposure6 | ||||||||||||||||||||||||||||||||||||||||
| Country | July 31, 2019 | |||||||||||||||||||||||||||||||||||||||||||||||||||
GIIPS |
| |||||||||||||||||||||||||||||||||||||||||||||||||||
Greece | $ | – | $ | – | $ | – | $ | – | $ | – | $ | – | $ | – | $ | – | $ | – | $ | – | $ | – | $ | – | $ | – | ||||||||||||||||||||||||||
Italy | – | – | 1 | 1 | – | – | 9 | 9 | 9 | – | 11 | 20 | 30 | |||||||||||||||||||||||||||||||||||||||
Ireland | – | – | 297 | 297 | 13 | – | 236 | 249 | – | – | – | – | 546 | |||||||||||||||||||||||||||||||||||||||
Portugal | – | – | – | – | – | 119 | 1 | 120 | 18 | – | – | 18 | 138 | |||||||||||||||||||||||||||||||||||||||
Spain | – | 36 | 63 | 99 | – | – | 96 | 96 | 20 | 438 | 33 | 491 | 686 | |||||||||||||||||||||||||||||||||||||||
Total GIIPS | – | 36 | 361 | 397 | 13 | 119 | 342 | 474 | 47 | 438 | 44 | 529 | 1,400 | |||||||||||||||||||||||||||||||||||||||
Rest of Europe | ||||||||||||||||||||||||||||||||||||||||||||||||||||
Austria | – | – | 15 | 15 | 4 | 72 | 12 | 88 | 2 | 1,024 | – | 1,026 | 1,129 | |||||||||||||||||||||||||||||||||||||||
Belgium | 264 | – | 156 | 420 | 394 | 12 | 418 | 824 | 61 | 101 | – | 162 | 1,406 | |||||||||||||||||||||||||||||||||||||||
Finland | – | 95 | 13 | 108 | – | 36 | 201 | 237 | – | 806 | 6 | 812 | 1,157 | |||||||||||||||||||||||||||||||||||||||
France | 576 | 1,216 | 153 | 1,945 | 87 | 487 | 2,294 | 2,868 | 95 | 3,772 | 161 | 4,028 | 8,841 | |||||||||||||||||||||||||||||||||||||||
Germany | 1,274 | 651 | 51 | 1,976 | 661 | 800 | 994 | 2,455 | 203 | 9,144 | 195 | 9,542 | 13,973 | |||||||||||||||||||||||||||||||||||||||
Netherlands | 506 | 496 | 93 | 1,095 | 307 | 444 | 773 | 1,524 | 41 | 2,916 | 219 | 3,176 | 5,795 | |||||||||||||||||||||||||||||||||||||||
Norway | – | 424 | 5 | 429 | 10 | 447 | 53 | 510 | 2 | 544 | 689 | 1,235 | 2,174 | |||||||||||||||||||||||||||||||||||||||
Sweden | – | 12 | 31 | 43 | – | 217 | 122 | 339 | 25 | 1,549 | 690 | 2,264 | 2,646 | |||||||||||||||||||||||||||||||||||||||
Switzerland | 1,030 | 58 | 93 | 1,181 | 605 | – | 1,177 | 1,782 | 19 | – | 67 | 86 | 3,049 | |||||||||||||||||||||||||||||||||||||||
United Kingdom | 3,183 | 1,251 | 43 | 4,477 | 1,360 | 789 | 8,738 | 10,887 | 227 | 1,383 | 1,608 | 3,218 | 18,582 | |||||||||||||||||||||||||||||||||||||||
Other7 | – | – | 106 | 106 | 11 | 125 | 529 | 665 | 3 | 430 | 49 | 482 | 1,253 | |||||||||||||||||||||||||||||||||||||||
Total Rest of Europe | 6,833 | 4,203 | 759 | 11,795 | 3,439 | 3,429 | 15,311 | 22,179 | 678 | 21,669 | 3,684 | 26,031 | 60,005 | |||||||||||||||||||||||||||||||||||||||
Total Europe | $ | 6,833 | $ | 4,239 | $ | 1,120 | $ | 12,192 | $ | 3,452 | $ | 3,548 | $ | 15,653 | $ | 22,653 | $ | 725 | $ | 22,107 | $ | 3,728 | $ | 26,560 | $ | 61,405 | ||||||||||||||||||||||||||
| Country |
October 31, 2018 | |||||||||||||||||||||||||||||||||||||||||||||||||||
GIIPS |
| |||||||||||||||||||||||||||||||||||||||||||||||||||
Greece | $ | – | $ | – | $ | – | $ | – | $ | – | $ | – | $ | – | $ | – | $ | – | $ | – | $ | – | $ | – | $ | – | ||||||||||||||||||||||||||
Italy | – | 178 | 1 | 179 | – | – | 3 | 3 | 26 | 22 | 5 | 53 | 235 | |||||||||||||||||||||||||||||||||||||||
Ireland | – | – | 197 | 197 | 17 | – | 268 | 285 | – | – | – | – | 482 | |||||||||||||||||||||||||||||||||||||||
Portugal | – | – | – | – | – | 139 | 56 | 195 | 1 | – | – | 1 | 196 | |||||||||||||||||||||||||||||||||||||||
Spain | – | 30 | 56 | 86 | – | – | 61 | 61 | 23 | 522 | – | 545 | 692 | |||||||||||||||||||||||||||||||||||||||
Total GIIPS | – | 208 | 254 | 462 | 17 | 139 | 388 | 544 | 50 | 544 | 5 | 599 | 1,605 | |||||||||||||||||||||||||||||||||||||||
Rest of Europe | ||||||||||||||||||||||||||||||||||||||||||||||||||||
Austria | – | – | 7 | 7 | 9 | 46 | 12 | 67 | – | 1,008 | – | 1,008 | 1,082 | |||||||||||||||||||||||||||||||||||||||
Belgium | 263 | – | 225 | 488 | 140 | 34 | 486 | 660 | 40 | 94 | 2 | 136 | 1,284 | |||||||||||||||||||||||||||||||||||||||
Finland | – | 141 | – | 141 | – | 36 | 110 | 146 | – | 1,071 | – | 1,071 | 1,358 | |||||||||||||||||||||||||||||||||||||||
France | 579 | 514 | 133 | 1,226 | 77 | 621 | 1,822 | 2,520 | 122 | 5,613 | 176 | 5,911 | 9,657 | |||||||||||||||||||||||||||||||||||||||
Germany | 1,106 | 354 | 210 | 1,670 | 443 | 805 | 933 | 2,181 | 240 | 7,779 | 63 | 8,082 | 11,933 | |||||||||||||||||||||||||||||||||||||||
Netherlands | 509 | 706 | 194 | 1,409 | 273 | 506 | 362 | 1,141 | 44 | 3,717 | 265 | 4,026 | 6,576 | |||||||||||||||||||||||||||||||||||||||
Norway | 121 | 33 | 5 | 159 | 20 | 288 | 54 | 362 | 24 | 426 | 630 | 1,080 | 1,601 | |||||||||||||||||||||||||||||||||||||||
Sweden | – | 67 | 95 | 162 | – | 287 | 235 | 522 | 15 | 1,548 | 644 | 2,207 | 2,891 | |||||||||||||||||||||||||||||||||||||||
Switzerland | 997 | 58 | 89 | 1,144 | 37 | – | 2,127 | 2,164 | 39 | – | 25 | 64 | 3,372 | |||||||||||||||||||||||||||||||||||||||
United Kingdom | 2,872 | 1,082 | 19 | 3,973 | 1,558 | 559 | 9,262 | 11,379 | 336 | 857 | 2,429 | 3,622 | 18,974 | |||||||||||||||||||||||||||||||||||||||
Other7 | – | 5 | 99 | 104 | 30 | 164 | 761 | 955 | 3 | 395 | 66 | 464 | 1,523 | |||||||||||||||||||||||||||||||||||||||
Total Rest of Europe | 6,447 | 2,960 | 1,076 | 10,483 | 2,587 | 3,346 | 16,164 | 22,097 | 863 | 22,508 | 4,300 | 27,671 | 60,251 | |||||||||||||||||||||||||||||||||||||||
Total Europe | $ | 6,447 | $ | 3,168 | $ | 1,330 | $ | 10,945 | $ | 2,604 | $ | 3,485 | $ | 16,552 | $ | 22,641 | $ | 913 | $ | 23,052 | $ | 4,305 | $ | 28,270 | $ | 61,856 | ||||||||||||||||||||||||||
| 1 | Certain comparative amounts have been reclassified to conform with the presentation adopted in the current period. |
| 2 | Exposures include interest-bearing deposits with banks and are presented net of impairment charges where applicable. There were no impairment charges for European exposures as at July 31, 2019, or October 31, 2018. |
| 3 | Exposures are calculated on a fair value basis and are net of collateral. Total market value of pledged collateral is $0.4 billion (October 31, 2018 – $0.4 billion) for GIIPS and $81 billion for the rest of Europe (October 31, 2018 – $66 billion). Derivatives are presented as net exposures where there is an International Swaps and Derivatives Association master netting agreement. |
| 4 | Trading and investment portfolio includes deposits and trading exposures are net of eligible short positions. |
| 5 | The fair values of the GIIPS exposures in Level 3 in the trading and investment portfolio were not significant as at July 31, 2019 and October 31, 2018. |
| 6 | The reported exposures do not include $20 million of protection the Bank purchased through CDS (October 31, 2018 – $186 million). |
| 7 | Other European exposure is distributed across 8 countries (October 31, 2018 – 10 countries), each of which has a net exposure including loans and commitments, derivatives, repos and securities lending, and trading and investment portfolio below $1 billion as at July 31, 2019. |
Of the Bank's European exposure, approximately 98% (October 31, 2018 – 96%) is to counterparties in countries rated either Aa3 or better by Moody's Investor Services (Moody's) or AA or better by Standard & Poor's (S&P), with the majority of this exposure to the sovereigns themselves or to well rated, systemically important banks in these countries. Derivatives and securities repurchase transactions are completed on a collateralized basis. The vast majority of derivatives exposure is offset by cash collateral while the repurchase transactions are backed largely by government securities rated AA or better, and cash. The Bank also takes a limited amount of exposure to well-rated corporate issuers in Europe where the Bank also does business with their related entities in North America.
In addition to the European exposure identified above, the Bank also has $13.8 billion (October 31, 2018 – $11.2 billion) of exposure to supranational entities with European sponsorship and $2.5 billion (October 31, 2018 – $1.0 billion) of indirect exposure to European collateral fromnon-European counterparties related to repurchase and securities lending transactions that are margined daily.
As part of the Bank's usual credit risk and exposure monitoring processes, all exposures are reviewed on a regular basis. European exposures are reviewed monthly or more frequently as circumstances dictate and are periodically stress-tested to identify and understand any potential vulnerabilities. Based on the most recent reviews, all European exposures are considered manageable.
| TD BANK GROUP• THIRD QUARTER 2019• REPORT TO SHAREHOLDERS | Page 25 |
Table of Contents
REGULATORY CAPITAL
Capital requirements of the Basel Committee on Banking Supervision (BCBS) are commonly referred to as Basel III. Under Basel III, Total Capital consists of three components, namely CET1, Additional Tier 1, and Tier 2 Capital. Risk sensitive regulatory capital ratios are calculated by dividing CET1, Tier 1, and Total Capital by their respective RWA, inclusive of any minimum requirements outlined under the regulatory floor. In 2015, Basel III implemented anon-risk sensitive leverage ratio to act as a supplementary measure to the risk-sensitive capital requirements. The objective of the leverage ratio is to constrain thebuild-up of excess leverage in the banking sector. The leverage ratio is calculated by dividing Tier 1 Capital by leverage exposure which is primarily comprised ofon-balance sheet assets with adjustments made to derivative and securities financing transaction exposures, and credit equivalent amounts ofoff-balance sheet exposures. TD continues to manage its regulatory capital in accordance with the Basel III Capital Framework as discussed in the "Capital Position" section of the Bank's 2018 Annual Report.
OSFI's Capital Requirements under Basel III
OSFI's Capital Adequacy Requirements (CAR) guideline details how the Basel III capital rules apply to Canadian banks.
From fiscal 2014 to 2018, the CVA capital charge wasphased-in based on a scalar approach. For fiscal 2018, the scalars inclusion of CVA for CET1, Tier 1, and Total Capital RWA were 80%, 83%, and 86%, respectively. For fiscal 2019, the CVA has been fullyphased-in.
Effective January 1, 2013, all newly issuednon-common Tier 1 and Tier 2 Capital instruments must include NVCC provisions to qualify as regulatory capital. NVCC provisions require the conversion ofnon-common capital instruments into a variable number of common shares of the Bank upon the occurrence of a trigger event as defined in the guidance. Existingnon-common Tier 1 and Tier 2 capital instruments which do not include NVCC provisions arenon-qualifying capital instruments and are subject to aphase-out period which began in 2013 and ends in 2022.
The CAR guideline contains two methodologies for capital ratio calculation: (1) the "transitional" method; and (2) the"all-in" method. The minimum CET1, Tier 1, and Total Capital ratios, based on the"all-in" method, are 4.5%, 6%, and 8%, respectively. OSFI expects Canadian banks to include an additional capital conservation buffer of 2.5%, effectively raising the CET1, Tier 1 Capital, and Total Capital ratio minimum requirements to 7%, 8.5%, and 10.5%, respectively.
In March 2013, OSFI designated the six major Canadian banks as domestic systemically important banks(D-SIBs), for which a 1% common equity capital surcharge is in effect from January 1, 2016. As a result, the six Canadian banks designated asD-SIBs, including TD, are required to meet an"all-in" Pillar 1 target CET1, Tier 1, and Total Capital ratios of 8%, 9.5%, and 11.5%, respectively.
At the discretion of OSFI, a common equity countercyclical capital buffer (CCB) within a range of 0% to 2.5% may be imposed. The primary objective of the CCB is to protect the banking sector against future potential losses resulting from periods of excess aggregate credit growth that have often been associated with thebuild-up of system-wide risk. The CCB is an extension of the capital conservation buffer and must be met with CET1 capital. The CCB is calculated using the weighted-average of the buffers deployed in Canada and across BCBS member jurisdictions and selectednon-member jurisdictions to which the bank has private sector credit exposures.
Effective November 1, 2017, OSFI requiredD-SIBs and foreign bank subsidiaries in Canada to comply with the CCB regime,phased-in according to the transitional arrangements. As a result, the maximum countercyclical buffer relating to foreign private sector credit exposures was capped at 1.25% of total RWA in the first quarter of 2017 and increases each subsequent year by an additional 0.625%, to reach its final maximum of 2.5% of total RWA in the first quarter of 2019. As at July 31, 2019, the CCB is only applicable to private sector credit exposures located in France, Hong Kong, Sweden, Norway, and the United Kingdom. Based on the allocation of exposures and buffers currently in place in France, Hong Kong, Sweden, Norway, and the United Kingdom, the Bank's countercyclical buffer requirement is 0% as at July 31, 2019.
On June 25, 2018, OSFI provided greater transparency related to previously undisclosed Pillar 2 CET1 capital buffer through the introduction of the public Domestic Stability Buffer (DSB). The DSB is held byD-SIBs against Pillar 2 risks associated with systemic vulnerabilities including, but not limited to: (1) Canadian consumer indebtedness; (2) asset imbalances in the Canadian market; and (3) Canadian institutional indebtedness. The level of the buffer ranges between 0% and 2.5% of total RWA and must be met with CET1 Capital. At a minimum, OSFI will review the buffer semi-annually and any changes will be made public. The buffer was originally set at 1.5%. In December 2018, OSFI announced that the DSB would be increased to 1.75% as of April 30, 2019. In June 2019, OSFI announced the DSB would be further increased by 25 bps to 2.00% effective October 31, 2019, effectively raising the CET1 target to 10% inclusive of the DSB. A breach of the buffer will not automatically constrain capital distributions; however, OSFI will require a remediation plan.
Effective in the second quarter of 2018, OSFI implemented a revised methodology for calculating the regulatory capital floor. The revised floor is based on the Basel II standardized approach, with the floor factor transitioned in over three quarters. The floor was fully transitioned, to a factor of 75%, in the fourth quarter of fiscal 2018. The Bank is not constrained by the capital floor.
In the first quarter of 2019, the Bank implemented the revised CAR guidelines related to the domestic implementation of the standardized approach for measuring counterparty credit risk(SA-CCR), capital requirements for bank exposures to central counterparties, as well as revisions to the securitization framework.
The leverage ratio is calculated as per OSFI's Leverage Requirements guideline and has a regulatory minimum requirement of 3%.
The CanadianBail-in regime, including OSFI's Total Loss Absorbing Capacity (TLAC) guideline, came into effect on September 23, 2018. Under this guideline, the Bank in required to meet target TLAC requirements by November 1, 2021. The Bank is currently subject to a target risk-based TLAC ratio of 23.50% of RWA and a TLAC leverage ratio of 6.75%.
| TD BANK GROUP• THIRD QUARTER 2019• REPORT TO SHAREHOLDERS | Page 26 |
Table of Contents
The following table provides details of TD's regulatory capital position.
TABLE 24: REGULATORY CAPITAL POSITION
| (millions of Canadian dollars, except as noted) | As at | |||||||||||
| July 31 2019 | October 31 2018 | July 31 2018 | ||||||||||
Capital | ||||||||||||
Common Equity Tier 1 Capital | $ | 54,478 | $ | 52,389 | $ | 50,096 | ||||||
Tier 1 Capital | 61,114 | 59,735 | 57,047 | |||||||||
Total Capital | 73,369 | 70,434 | 65,933 | |||||||||
Common Equity Tier 1 Capital risk-weighted assets for: | ||||||||||||
Credit risk1 | 387,952 | 370,044 | 363,023 | |||||||||
Market risk | 12,072 | 13,213 | 14,670 | |||||||||
Operational risk | 54,857 | 52,375 | 51,250 | |||||||||
Total | $ | 454,881 | $ | 435,632 | $ | 428,943 | ||||||
Capital and leverage ratios | ||||||||||||
Common Equity Tier 1 Capital ratio1 | 12.0 | % | 12.0 | % | 11.7 | % | ||||||
Tier 1 Capital ratio1 | 13.4 | 13.7 | 13.3 | |||||||||
Total Capital ratio1 | 16.1 | 16.2 | 15.4 | |||||||||
Leverage ratio | 4.1 | 4.2 | 4.1 | |||||||||
| 1 | Each capital ratio has its own RWA measure due to the OSFI-prescribed scalar for inclusion of the CVA. For fiscal 2019, the scalars are 100%. For fiscal 2018, the scalars for inclusion of CVA for CET1, Tier 1, and Total Capital RWA were 80%, 83%, and 86%. |
As at July 31, 2019, the Bank's CET1, Tier 1, and Total Capital ratios were 12.0%, 13.4%, and 16.1%, respectively. Compared with the Bank's CET1 Capital ratio of 12.0% at October 31, 2018, the CET1 Capital ratio remained relatively flat as common shares repurchased, actuarial losses on employee benefit plans, the loyalty agreement with Air Canada, and the acquisition of Greystone were offset by organic capital growth.
As at July 31, 2019, the Bank's Leverage ratio was 4.1%, compared with the Bank's Leverage ratio of 4.2% at October 31, 2018. The Leverage ratio decreased due to common shares repurchased, an increase in exposure resulting from the implementation of the SA-CCR in the first quarter of 2019, and business growth primarily in Wholesale Banking, partially offset by organic capital growth and preferred share issuances.
Future Regulatory Capital Developments
Future regulatory capital developments, in addition to those described in the "Future Regulatory Capital Developments" section of the Bank's 2018 Annual Report, are noted below.
In July 2019, in consideration of the final Basel III revisions published by the BCBS in December 2017, OSFI published guidance related to the capital requirements for operational risk. Banks currently approved to use the Advanced Measurement Approach (AMA) will be required to use a revised Basel III standardized approach when the revised requirements are implemented in Canada in the first quarter of 2021. To facilitate implementation of the revised requirements, OSFI is providing a transition period for fiscal 2020, during which time banks currently reporting under AMA will report operational risk capital using the current standardized approach (TSA).
In June 2019, BCBS published a revision to align the leverage ratio measurement of client cleared derivatives with the measurement defined per theSA-CCR as used for risk-based capital requirements. This treatment will permit both cash andnon-cash forms of segregated initial margin and cash andnon-cash variation margin received from a client to offset the replacement cost and potential future exposure for client cleared derivatives only. The revisions are effective as of January 1, 2022.
In June 2019, BCBS published revisions to leverage ratio disclosure requirements. The revisions set out additional requirements for banks to disclose their leverage ratios based onquarter-end and on daily average value of securities financing transactions. This change is effective as of January 1, 2022.
In April 2019, OSFI published the final version of its GuidelineB-2: Large Exposure Limits forD-SIBs. The guideline outlines practices for the management of risk related to large exposures and provides additional guidance on methods for identifying, measuring, managing, and monitoring large exposures. The guideline introduces tighter limits for exposures to both Global Systemically Important Banks and to other CanadianD-SIBs, recognizes eligible credit risk mitigation techniques by measuring exposure on a net basis rather than a gross basis, and reduces the eligible capital base from Total Capital to Tier 1 Capital. The guideline is effective November 1, 2019.
In January 2019, BCBS published the final minimum capital requirements for market risk standard. The key aspects of the standard include: clarification on the scope; a refined standardized approach for foreign exchange risk and index instruments; revised standardized risk weights applicable to general interest rate risk, foreign exchange, and certain other exposures; revisions to the assessment process relating to internal models reflecting the risks on individual trading desks; and revisions related to identification of risk factors that are eligible for internal modelling. The standard is effective January 1, 2022.
In December 2018, BCBS published the final "Pillar 3 disclosure requirements – updated framework". The framework includes disclosure revisions and additions arising from the finalization of the Basel III reforms related to the following areas: credit risk, operational risk, leverage ratio, CVA risk; RWA calculated by the Bank's internal models and under standardized approaches; and an overview of risk management, RWA, and key prudential metrics. The framework also contains new disclosure requirements related to asset encumbrance and capital distribution constraints. These disclosure requirements, together with the first and second phase of the revised Pillar 3 disclosure requirements, issued in January 2015 and March 2017, respectively, complete the Pillar 3 framework. The disclosure requirements related to Basel III reforms are effective January 1, 2022.
Normal Course Issuer Bid
On June 14, 2019, the Bank announced that the Toronto Stock Exchange (TSX) and OSFI have approved the Bank's previously announced normal course issuer bid (NCIB) to repurchase for cancellation up to 20 million of its common shares.
The Bank's previous NCIB, which was announced on April 19, 2018 and as amended on December 10, 2018, expired on April 12, 2019. The Bank repurchased an aggregate of 30 million common shares under its previous NCIB, at an average price of $74.29 per share for a total amount of $2.2 billion.
During the three months ended July 31, 2019, the Bank repurchased 11.25 million common shares under its NCIB, at an average price of $76.91 per share for a total amount of $865 million. During the nine months ended July 31, 2019, the Bank repurchased an aggregate of 21.25 million common shares under its NCIB and its previous NCIB, at an average price of $74.95 per share, for a total amount of $1.6 billion.
During the year ended October 31, 2018, the Bank repurchased 20 million common shares under its previous NCIB at an average price of $75.07 per share for a total amount of $1.5 billion.
| TD BANK GROUP• THIRD QUARTER 2019• REPORT TO SHAREHOLDERS | Page 27 |
Table of Contents
TABLE 25: EQUITY AND OTHER SECURITIES
| (millions of shares/units, except as noted) | As at | |||||||
| July 31, 2019 | October 31, 2018 | |||||||
| Number of shares/units | Number of shares/units | |||||||
Common shares outstanding | 1,819.8 | 1,830.4 | ||||||
Treasury shares – common | (0.6 | ) | (2.1 | ) | ||||
Total common shares | 1,819.2 | 1,828.3 | ||||||
Stock options | ||||||||
Vested | 5.2 | 4.7 | ||||||
Non-vested | 8.1 | 8.4 | ||||||
Preferred shares – Class A | ||||||||
Series 1 | 20.0 | 20.0 | ||||||
Series 31 | 20.0 | 20.0 | ||||||
Series 5 | 20.0 | 20.0 | ||||||
Series 7 | 14.0 | 14.0 | ||||||
Series 9 | 8.0 | 8.0 | ||||||
Series 11 | 6.0 | 6.0 | ||||||
Series 12 | 28.0 | 28.0 | ||||||
Series 14 | 40.0 | 40.0 | ||||||
Series 16 | 14.0 | 14.0 | ||||||
Series 18 | 14.0 | 14.0 | ||||||
Series 20 | 16.0 | 16.0 | ||||||
Series 22 | 14.0 | – | ||||||
Series 24 | 18.0 | – | ||||||
| 232.0 | 200.0 | |||||||
Treasury shares – preferred | (0.2 | ) | (0.3 | ) | ||||
Total preferred shares | 231.8 | 199.7 | ||||||
Capital Trust Securities(thousands of shares) | ||||||||
Trust units issued by TD Capital Trust III: | ||||||||
TD Capital Trust III Securities – Series 20082 | – | 1,000.0 | ||||||
Debt issued by TD Capital Trust IV: | ||||||||
TD Capital Trust IV Notes – Series 13 | – | 550.0 | ||||||
TD Capital Trust IV Notes – Series 2 | 450.0 | 450.0 | ||||||
TD Capital Trust IV Notes – Series 3 | 750.0 | 750.0 | ||||||
| 1 | On July 18, 2019, the Bank announced that none of its 20 millionNon-Cumulative5-Year Rate Reset Preferred Shares NVCC, Series 3 (the "Series 3 Shares") would be converted on July 31, 2019, intoNon-Cumulative5-Year Rate Reset Preferred Shares NVCC, Series 4. As previously announced on July 2, 2019, the dividend rate for the Series 3 Shares for the5-year period from and including July 31, 2019, but excluding July 31, 2024, will be 3.681%. |
| 2 | TD Capital Trust III redeemed all of the outstanding TD Capital Trust III Securities – Series 2008 on December 31, 2018. |
| 3 | TD Capital Trust IV redeemed all of the outstanding TD Capital Trust IV Notes – Series 1 on June 30, 2019. |
All series of preferred shares – Class A include NVCC provisions. If a NVCC trigger event were to occur, the maximum number of common shares that could be issued, assuming there are no declared and unpaid dividends on the respective series of preferred shares at the time of conversion, would be 1.2 billion in aggregate.
For NVCC subordinated notes and debentures, if a NVCC trigger event were to occur, the maximum number of common shares that could be issued, assuming there is no accrued and unpaid interest on the respective subordinated notes and debentures, would be 3.1 billion in aggregate. The following subordinated debentures contain NVCC provisions: the 2.692% subordinated debentures due June 24, 2025, 2.982% subordinated debentures due September 30, 2025, 3.589% subordinated debentures due September 14, 2028, 3.224% subordinated debentures due July 25, 2029, 4.859% subordinated debentures due March 4, 2031, 3.625% subordinated debentures due September 15, 2031, and the 3.06% subordinated debentures due January 26, 2032. Refer to Note 19 of the Bank's 2018 Consolidated Financial Statements and Note 13 of the Bank's third quarter 2019 Interim Consolidated Financial Statements for additional details.
EXECUTIVE SUMMARY
Growing profitability in financial services involves selectively taking and managing risks within TD's risk appetite. The Bank's goal is to earn a stable and sustainable rate of return for every dollar of risk it takes, while putting significant emphasis on investing in TD's businesses so that it can meet its future strategic objectives.
TD's businesses and operations are exposed to a broad number of risks that have been identified and defined in the Enterprise Risk Framework. The Bank's tolerance to those risks is defined in the Enterprise Risk Appetite which has been developed within a comprehensive framework that takes into consideration current conditions in which the Bank operates and the impact that emerging risks will have on TD's strategy and risk profile. The Bank's risk appetite states that it takes risks required to build its business, but only if those risks: (1) fit the business strategy, and can be understood and managed; (2) do not expose the enterprise to any significant single loss events; TD does not 'bet the bank' on any single acquisition, business, or product; and (3) do not risk harming the TD brand. Each business is responsible for setting and aligning its individual risk appetites with that of the enterprise based on a thorough examination of the specific risks to which it is exposed.
TD considers it critical to regularly assess its operating environment and highlight top and emerging risks. These are risks with a potential to have a material effect on the Bank and where the attention of senior leaders is focused due to the potential magnitude or immediacy of their impact.
Risks are identified, discussed, and actioned by senior leaders and reported quarterly to the Risk Committee of the Board and the Board. Specific plans to mitigate top and emerging risks are prepared, monitored, and adjusted as required.
The Bank's risk governance structure and risk management approach have not substantially changed from that described in the Bank's 2018 Annual Report. Additional information on risk factors can be found in the 2018 MD&A under the heading "Risk Factors and Management". For a complete discussion of the risk governance structure and the risk management approach, refer to the "Managing Risk" section in the Bank's 2018 Annual Report.
The shaded sections of this MD&A represent a discussion relating to market and liquidity risks and form an integral part of the Interim Consolidated Financial Statements for the period ended July 31, 2019.
| TD BANK GROUP• THIRD QUARTER 2019• REPORT TO SHAREHOLDERS | Page 28 |
Table of Contents
CREDIT RISK
Gross credit risk exposure, also referred to as exposure at default (EAD), is the total amount the Bank is exposed to at the time of default of a loan and is measured before counterparty-specific provisions or write-offs. Gross credit risk exposure does not reflect the effects of credit risk mitigation and includes bothon-balance sheet andoff-balance sheet exposures.On-balance sheet exposures consist primarily of outstanding loans, acceptances,non-trading securities, derivatives, and certain other repo-style transactions.Off-balance sheet exposures consist primarily of undrawn commitments, guarantees, and certain otherrepo-style transactions.
Gross credit risk exposures for the two approaches the Bank uses to measure credit risk are included in the following table.
TABLE 26: GROSS CREDIT RISK EXPOSURES – Standardized and Advanced Internal Ratings-Based (AIRB) Approaches1
| (millions of Canadian dollars) | As at | |||||||||||||||||||||||
| July 31, 2019 | October 31, 2018 | |||||||||||||||||||||||
| Standardized | AIRB | Total | Standardized | AIRB | Total | |||||||||||||||||||
Retail | ||||||||||||||||||||||||
Residential secured | $ | 4,041 | $ | 381,396 | $ | 385,437 | $ | 3,091 | $ | 371,450 | $ | 374,541 | ||||||||||||
Qualifying revolving retail | – | 131,296 | 131,296 | – | 112,388 | 112,388 | ||||||||||||||||||
Other retail | 8,335 | 83,361 | 91,696 | 12,835 | 80,513 | 93,348 | ||||||||||||||||||
Total retail | 12,376 | 596,053 | 608,429 | 15,926 | 564,351 | 580,277 | ||||||||||||||||||
Non-retail | ||||||||||||||||||||||||
Corporate | 136,364 | 388,281 | 524,645 | 132,030 | 346,751 | 478,781 | ||||||||||||||||||
Sovereign | 100,573 | 136,150 | 236,723 | 95,411 | 136,951 | 232,362 | ||||||||||||||||||
Bank | 17,902 | 125,678 | 143,580 | 18,019 | 110,295 | 128,314 | ||||||||||||||||||
Totalnon-retail | 254,839 | 650,109 | 904,948 | 245,460 | 593,997 | 839,457 | ||||||||||||||||||
Gross credit risk exposures | $ | 267,215 | $ | 1,246,162 | $ | 1,513,377 | $ | 261,386 | $ | 1,158,348 | $ | 1,419,734 | ||||||||||||
| 1 | Gross credit risk exposures represent EAD and are before the effects of credit risk mitigation. This table excludes securitization, equity, and certain other credit RWA. |
| TD BANK GROUP• THIRD QUARTER 2019• REPORT TO SHAREHOLDERS | Page 29 |
Table of Contents
MARKET RISK
Market risk capital is calculated using internal models and comprises three components:(1) Value-at-Risk (VaR); (2) Stressed VaR; and (3) Incremental Risk Charge (IRC). In addition, the Bank calculates market risk capital using the standardized approach for a limited number of portfolios.
Market Risk Linkage to the Balance Sheet
The following table provides a breakdown of the Bank's balance sheet into assets and liabilities exposed to trading andnon-trading market risks. Market risk of assets and liabilities included in the calculation of VaR and other metrics used for regulatory market risk capital purposes is classified as trading market risk.
TABLE 27: MARKET RISK LINKAGE TO THE BALANCE SHEET1
| (millions of Canadian dollars) | As at | |||||||||||||||||||||||||||||||||||
| July 31, 2019 | October 31, 2018 | |||||||||||||||||||||||||||||||||||
Balance sheet | Trading market risk | Non-trading market risk | Other | Balance sheet | Trading market risk | Non-trading market risk | Other | Non-trading market risk –primary risk sensitivity | ||||||||||||||||||||||||||||
Assets subject to market risk | ||||||||||||||||||||||||||||||||||||
Interest-bearing deposits with banks | $ | 34,697 | $ | 130 | $ | 34,567 | $ | – | $ | 30,720 | $ | 729 | $ | 29,991 | $ | – | Interest rate | |||||||||||||||||||
Trading loans, securities, and other | 142,161 | 139,954 | 2,207 | – | 127,897 | 125,437 | 2,460 | – | Interest rate | |||||||||||||||||||||||||||
Non-trading financial assets atfair value through profit or loss | 6,033 | – | 6,033 | – | 4,015 | – | 4,015 | – | | Equity, foreign exchange, interest rate | | |||||||||||||||||||||||||
Derivatives | 52,555 | 49,642 | 2,913 | – | 56,996 | 53,087 | 3,909 | – | | Equity, foreign exchange, interest rate | | |||||||||||||||||||||||||
Financial assets designated atfair value through profit or loss | 4,018 | – | 4,018 | – | 3,618 | – | 3,618 | – | Interest rate | |||||||||||||||||||||||||||
Financial assets at fair value throughother comprehensive income | 116,700 | – | 116,700 | – | 130,600 | – | 130,600 | – | | Equity, foreign exchange, interest rate | | |||||||||||||||||||||||||
Debt securities at amortized cost,net of allowance for credit losses | 116,390 | – | 116,390 | – | 107,171 | – | 107,171 | – | | Foreign exchange, interest rate | | |||||||||||||||||||||||||
Securities purchased underreverse repurchase agreements | 162,644 | 2,860 | 159,784 | – | 127,379 | 3,920 | 123,459 | – | Interest rate | |||||||||||||||||||||||||||
Loans, net of allowance forloan losses | 675,932 | – | 675,932 | – | 646,393 | – | 646,393 | – | Interest rate | |||||||||||||||||||||||||||
Customers' liability underacceptances | 15,219 | – | 15,219 | – | 17,267 | – | 17,267 | – | Interest rate | |||||||||||||||||||||||||||
Investment in TD Ameritrade | 9,108 | – | 9,108 | – | 8,445 | – | 8,445 | – | Equity | |||||||||||||||||||||||||||
Other assets2 | 1,673 | – | 1,673 | – | 1,751 | – | 1,751 | – | Interest rate | |||||||||||||||||||||||||||
Assets not exposed tomarket risk | 68,312 | – | – | 68,312 | 72,651 | – | – | 72,651 | ||||||||||||||||||||||||||||
Total Assets | $ | 1,405,442 | $ | 192,586 | $ | 1,144,544 | $ | 68,312 | $ | 1,334,903 | $ | 183,173 | $ | 1,079,079 | $ | 72,651 | ||||||||||||||||||||
Liabilities subject to market risk | ||||||||||||||||||||||||||||||||||||
Trading deposits | $ | 37,796 | $ | 9,470 | $ | 28,326 | $ | – | $ | 114,704 | $ | 6,202 | $ | 108,502 | $ | – | Interest rate | |||||||||||||||||||
Derivatives | 53,569 | 48,685 | 4,884 | – | 48,270 | 44,119 | 4,151 | – | | Equity, foreign exchange, interest rate | | |||||||||||||||||||||||||
Securitization liabilities at fair value | 12,749 | 12,749 | – | – | 12,618 | 12,618 | – | – | Interest rate | |||||||||||||||||||||||||||
Financial liabilities designated atfair value through profit or loss | 95,774 | 5 | 95,769 | – | 16 | 2 | 14 | – | Interest rate | |||||||||||||||||||||||||||
Deposits | 870,326 | – | 870,326 | – | 851,439 | – | 851,439 | – | | Interest rate, foreign exchange | | |||||||||||||||||||||||||
Acceptances | 15,219 | – | 15,219 | – | 17,269 | – | 17,269 | – | Interest rate | |||||||||||||||||||||||||||
Obligations related to securitiessold short | 35,299 | 33,863 | 1,436 | – | 39,478 | 37,323 | 2,155 | – | Interest rate | |||||||||||||||||||||||||||
Obligations related to securities soldunder repurchase agreements | 123,208 | 1,447 | 121,761 | – | 93,389 | 3,797 | 89,592 | – | Interest rate | |||||||||||||||||||||||||||
Securitization liabilities at amortizedcost | 14,179 | – | 14,179 | – | 14,683 | – | 14,683 | – | Interest rate | |||||||||||||||||||||||||||
Subordinated notes and debentures | 10,596 | – | 10,596 | – | 8,740 | – | 8,740 | – | Interest rate | |||||||||||||||||||||||||||
Other liabilities2 | 16,672 | – | 16,672 | – | 16,134 | – | 16,134 | – | | Equity, interest rate | | |||||||||||||||||||||||||
Liabilities and Equity not exposed to market risk | 120,055 | – | – | 120,055 | 118,163 | – | – | 118,163 | ||||||||||||||||||||||||||||
Total Liabilities and Equity | $ | 1,405,442 | $ | 106,219 | $ | 1,179,168 | $ | 120,055 | $ | 1,334,903 | $ | 104,061 | $ | 1,112,679 | $ | 118,163 | ||||||||||||||||||||
| 1 | Certain comparative amounts have been reclassified to conform with the presentation adopted in the current period. |
| 2 | Relates to retirement benefits, insurance, and structured entity liabilities. |
| TD BANK GROUP• THIRD QUARTER 2019• REPORT TO SHAREHOLDERS | Page 30 |
Table of Contents
Calculating VaR
TD computes total VaR on a daily basis by combining the General Market Risk (GMR) and Idiosyncratic Debt Specific Risk (IDSR) associated with the Bank's trading positions.
GMR is determined by creating a distribution of potential changes in the market value of the current portfolio using historical simulation. The Bank values the current portfolio using the market price and rate changes of the most recent 259 trading days for equity, interest rate, foreign exchange, credit, and commodity products. GMR is computed as the threshold level that portfolio losses are not expected to exceed more than one out of every 100 trading days. Aone-day holding period is used for GMR calculation, which is scaled up to ten days for regulatory capital calculation purposes.
IDSR measures idiosyncratic (single-name) credit spread risk for credit exposures in the trading portfolio using Monte Carlo simulation. The IDSR model is based on the historical behaviour of five-year idiosyncratic credit spreads. Similar to GMR, IDSR is computed as the threshold level that portfolio losses are not expected to exceed more than one out of every 100 trading days. IDSR is measured for aten-day holding period.
The following graph discloses dailyone-day VaR usage and trading net revenue, reported on a TEB, within Wholesale Banking. Trading net revenue includes trading income and net interest income related to positions within the Bank's market risk capital trading books. For the quarter ended July 31, 2019, there was one day of trading loss and trading net revenue was positive for 98% of the trading days. Losses in the quarter did not exceed VaR on any trading day.
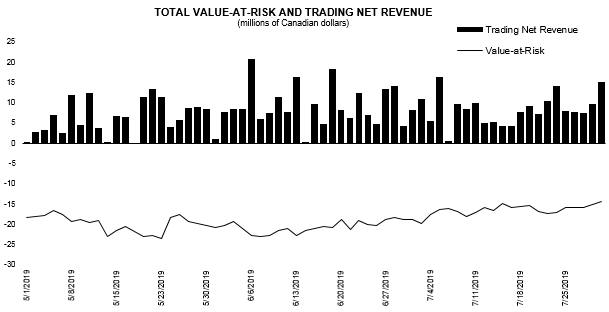
VaR is a valuable risk measure but it should be used in the context of its limitations, for example:
| • | VaR uses historical data to estimate future events, which limits its forecasting abilities; |
| • | it does not provide information on losses beyond the selected confidence level; and |
| • | it assumes that all positions can be liquidated during the holding period used for VaR calculation. |
The Bank continuously improves its VaR methodologies and incorporates new risk measures in line with market conventions, industry best practices, and regulatory requirements.
To mitigate some of the shortcomings of VaR, the Bank uses additional metrics designed for risk management and capital purposes. These include Stressed VaR, IRC, Stress Testing Framework, as well as limits based on the sensitivity to various market risk factors.
Calculating Stressed VaR
In addition to VaR, the Bank also calculates Stressed VaR, which includes Stressed GMR and Stressed IDSR. Stressed VaR is designed to measure the adverse impact that potential changes in market rates and prices could have on the value of a portfolio over a specified period of stressed market conditions. Stressed VaR is determined using similar techniques and assumptions in GMR and IDSR VaR. However, instead of using the most recent 259 trading days (one year), the Bank uses a selected year of stressed market conditions. In the third quarter of 2019, Stressed VaR was calculated using theone-year period that began on February 1, 2008. The appropriate historicalone-year period to use for Stressed VaR is determined on a quarterly basis. Stressed VaR is a part of regulatory capital requirements.
Calculating the Incremental Risk Charge
The IRC is applied to all instruments in the trading book subject to migration and default risk. Migration risk represents the risk of changes in the credit ratings of the Bank's exposures. TD applies a Monte Carlo simulation with aone-year horizon and a 99.9% confidence level to determine IRC, which is consistent with regulatory requirements. IRC is based on a "constant level of risk" assumption, which requires banks to assign a liquidity horizon to positions that are subject to IRC. IRC is a part of regulatory capital requirements.
| TD BANK GROUP• THIRD QUARTER 2019• REPORT TO SHAREHOLDERS | Page 31 |
Table of Contents
The following table presents the end of quarter, average, high, and low usage of TD's portfolio metrics.
TABLE 28: PORTFOLIO MARKET RISK MEASURES
(millions of Canadian dollars) | For the three months ended | For the nine months ended | ||||||||||||||||||||||||||||||
| | July 31 2019 |
| | April 30 2019 | | | July 31 2018 | | | July 31 2019 | | | July 31 2018 | | ||||||||||||||||||
| As at | Average | High | Low | Average | Average | Average | Average | |||||||||||||||||||||||||
Interest rate risk | $ | 5.9 | $ | 8.3 | $ | 13.1 | $ | 4.7 | $ | 8.6 | $ | 17.5 | $ | 9.9 | $ | 14.5 | ||||||||||||||||
Credit spread risk | 9.4 | 9.9 | 12.0 | 7.5 | 12.2 | 12.0 | 13.9 | 10.9 | ||||||||||||||||||||||||
Equity risk | 5.2 | 6.1 | 11.5 | 4.3 | 6.7 | 7.1 | 6.6 | 7.7 | ||||||||||||||||||||||||
Foreign exchange risk | 2.2 | 4.4 | 7.7 | 1.8 | 5.4 | 4.0 | 5.4 | 4.1 | ||||||||||||||||||||||||
Commodity risk | 1.6 | 1.7 | 2.6 | 1.2 | 2.2 | 2.4 | 2.2 | 2.4 | ||||||||||||||||||||||||
Idiosyncratic debt specific risk | 10.6 | 14.2 | 18.2 | 10.6 | 15.1 | 18.3 | 16.5 | 16.6 | ||||||||||||||||||||||||
Diversification effect1 | (20.7 | ) | (25.7 | ) | n/m | 2 | n/m | (29.2 | ) | (34.4 | ) | (32.0 | ) | (32.3 | ) | |||||||||||||||||
TotalValue-at-Risk(one-day) | 14.2 | 18.9 | 23.3 | 14.2 | 21.0 | 26.9 | 22.5 | 23.9 | ||||||||||||||||||||||||
StressedValue-at-Risk(one-day) | 42.7 | 43.0 | 46.8 | 33.4 | 43.5 | 55.8 | 49.4 | 50.8 | ||||||||||||||||||||||||
Incremental Risk Capital Charge(one-year) | $ | 260.9 | $ | 236.7 | $ | 275.6 | $ | 177.6 | $ | 204.2 | $ | 224.8 | $ | 225.2 | $ | 212.5 | ||||||||||||||||
| 1 | The aggregate VaR is less than the sum of the VaR of the different risk types due to risk offsets resulting from portfolio diversification. |
| 2 | Not meaningful. It is not meaningful to compute a diversification effect because the high and low may occur on different days for different risk types. |
Average VaR remained relatively unchanged compared to the prior quarter. Average VaR and average interest rate VaR decreased compared to the third quarter last year due to changes in U.S. interest rate risk positions. Average Stressed VaR remained relatively unchanged compared to the prior quarter and decreased compared to the third quarter last year driven by U.S. interest rate risk positions.
Average IRC increased compared to the prior quarter and the same quarter last year due to positions in Canadian banks and provinces.
Validation of VaR Model
The Bank uses a back-testing process to compare the actual and theoretical profit and losses to VaR to ensure that they are consistent with the statistical results of the VaR model. The theoretical profit or loss is generated using the daily price movements on the assumption that there is no change in the composition of the portfolio. Validation of the IRC model must follow a different approach since theone-year horizon and 99.9% confidence level preclude standard back-testing techniques. Instead, key parameters of the IRC model such as transition and correlation matrices are subject to independent validation by benchmarking against external study results or through analysis using internal or external data.
Interest Rate Risk
The following graph shows the Bank's interest rate risk exposure (as measured by Economic Value at Risk (EVaR)) on allnon-trading assets, liabilities, and derivative instruments used for structural interest rate management. This reflects the interest rate risk from personal and commercial banking products (loans and deposits) as well as related funding, investments and high-quality liquid assets (HQLA). EVaR is defined as the difference between the change in the present value of the Bank's asset portfolio and the change in the present value of the Bank's liability portfolio, includingoff-balance sheet instruments and assumed profiles fornon-rate sensitive products, resulting from an immediate and sustained 100 bps unfavourable interest rate shock. EVaR measures the relative sensitivity of asset and liability cash flow mismatches to changes in interest rates. Closely matching asset and liability cash flows reduces EVaR and mitigates the risk of volatility in future net interest income.
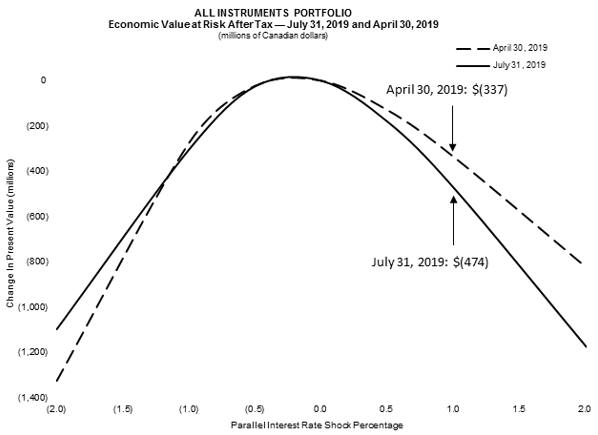
| TD BANK GROUP• THIRD QUARTER 2019• REPORT TO SHAREHOLDERS | Page 32 |
Table of Contents
The Bank uses derivative financial instruments, wholesale investments, funding instruments, other capital market alternatives, and, less frequently, product pricing strategies to manage interest rate risk. As at July 31, 2019 an immediate and sustained 100 bps increase in interest rates would have decreased the economic value of shareholders' equity by $474 million (April 30, 2019 – $337 million decrease)after-tax. An immediate and sustained 100 bps decrease in interest rates would have reduced the economic value of shareholders' equity by $303 million (April 30, 2019 – $274 million decrease)after-tax.
The interest risk exposure, or EVaR, in the insurance business is not included in the above graph. Interest rate risk in the insurance business is managed using defined exposure limits and processes, as set and governed by the insurance Board of Directors.
The following table shows the sensitivity of the economic value of shareholders' equity(after-tax) by currency for those currencies where TD has material exposure.
TABLE 29: SENSITIVITY OFAFTER-TAX ECONOMICVALUE-AT-RISK BY CURRENCY
| (millions of Canadian dollars) | As at | |||||||||||||||||||||||
| July 31, 2019 | April 30, 2019 | July 31, 2018 | ||||||||||||||||||||||
| Currency | 100 bps increase | 100 bps decrease | 100 bps increase | 100 bps decrease | 100 bps increase | 100 bp sdecrease | ||||||||||||||||||
Canadian dollar | $ | (55 | ) | $ | (21 | ) | $ | (66 | ) | $ | – | $ | (42 | ) | $ | (14 | ) | |||||||
U.S. dollar | (419 | ) | (282 | ) | (271 | ) | (274 | ) | (258 | ) | 8 | |||||||||||||
| $ | (474 | ) | $ | (303 | ) | $ | (337 | ) | $ | (274 | ) | $ | (300 | ) | $ | (6 | ) | |||||||
REGULATORY DEVELOPMENTS CONCERNING INTEREST RATE RISK
In April 2016, the BCBS published revisions to the framework for Interest Rate Risk in the Banking Book (IRRBB) that establishes a standardized framework for measuring IRRBB. To align with revised international guidance and best practice, OSFI's revised guideline, issued in May 2019, incorporates most of the BCBS guidance to reflect changes in the market, the methodology for measuring, managing and monitoring IRRBB, as well as updates related to supervisory practices. The Bank will adopt these new standards for the first quarter reporting in 2020.
Liquidity Risk
Liquidity risk is the risk of having insufficient cash or collateral to meet financial obligations and an inability to, in a timely manner, raise funding or monetize assets at anon-distressed price. Financial obligations can arise from deposit withdrawals, debt maturities, commitments to provide credit or liquidity support, or the need to pledge additional collateral.
TD'S LIQUIDITY RISK APPETITE
The Bank maintains a prudent and disciplined approach to managing its potential exposure to liquidity risk. The Bank targets a90-day survival horizon under a combined Bank-specific and market-wide stress scenario, and a minimum buffer over regulatory requirements prescribed by the OSFI Liquidity Adequacy Requirements (LAR) guideline. Under the LAR guideline, Canadian banks are required to maintain a Liquidity Coverage Ratio (LCR) at the minimum of 100%. The Bank operates under a prudent funding paradigm with an emphasis on maximizing deposits as a core source of funding and having a ready access to wholesale funding markets across diversified terms, funding types, and currencies so as to ensure low exposure to a sudden contraction of wholesale funding capacity and to minimize structural liquidity gaps. The Bank also maintains a detailed contingency funding plan to enhance preparedness for recovery from potential liquidity stress events. The resultant management strategies and actions comprise an integrated liquidity risk management program that ensures low exposure to identified sources of liquidity risk and compliance with regulatory requirements.
LIQUIDITY RISK MANAGEMENT RESPONSIBILITY
The Bank's Asset/Liability and Capital Committee (ALCO) oversees the Bank's liquidity risk management program. It is designed to ensure there are effective management structures and policies in place to properly measure and manage liquidity risk. The Global Liquidity and Funding Committee, a subcommittee of the ALCO comprised of senior management from Treasury and Balance Sheet Management (TBSM), Risk Management, Finance, and Wholesale Banking, identifies and monitors the Bank's liquidity risks. The management of liquidity risk is the responsibility of the Head of TBSM, while oversight and challenge are provided by the ALCO and independently by Risk Management. The Risk Committee of the Board regularly reviews the Bank's liquidity position and approves the Bank's Liquidity Risk Management Frameworkbi-annually and the related policies annually.
The Bank's liquidity risk appetite and liquidity risk management approach have not substantially changed from that described in the Bank's 2018 Annual Report. For a complete discussion of liquidity risk, refer to the "Liquidity Risk" section in the Bank's 2018 Annual Report.
LIQUID ASSETS
The unencumbered liquid assets the Bank holds to meet its liquidity requirements must be high-quality securities that the Bank believes can be monetized quickly in stress conditions with minimum loss in market value. Unencumbered liquid assets are represented in a cumulative liquidity gap framework with adjustments made for estimated market or trading depths, settlement timing, and/or other identified impediments to potential sale or pledging. Overall, the Bank expects any reduction in market value of its liquid asset portfolio to be modest given the underlying high credit and liquidity quality.
Assets held by the Bank to meet liquidity requirements are summarized in the following tables. The tables do not include assets held within the Bank's insurance businesses due to investment restrictions.
| TD BANK GROUP• THIRD QUARTER 2019• REPORT TO SHAREHOLDERS | Page 33 |
Table of Contents
TABLE 30: SUMMARY OF LIQUID ASSETS BY TYPE AND CURRENCY1
(millions of Canadian dollars, except as noted) | As at | |||||||||||||||||||||||
| Bank-owned liquid assets | Securities received as collateral from securities financing and derivative transactions2 | Total liquid assets | % of total | Encumbered liquid assets | Unencumbered liquid assets2 | |||||||||||||||||||
| July 31, 2019 | ||||||||||||||||||||||||
Cash and due from banks | $ | 2,384 | $ | – | $ | 2,384 | 1 | % | $ | 458 | $ | 1,926 | ||||||||||||
Canadian government obligations | 10,211 | 75,321 | 85,532 | 13 | 53,377 | 32,155 | ||||||||||||||||||
National Housing Act Mortgage-Backed Securities (NHA MBS) | 40,298 | 18 | 40,316 | 6 | 4,384 | 35,932 | ||||||||||||||||||
Provincial government obligations | 14,431 | 25,926 | 40,357 | 6 | 31,071 | 9,286 | ||||||||||||||||||
Corporate issuer obligations | 10,869 | 3,861 | 14,730 | 2 | 4,760 | 9,970 | ||||||||||||||||||
Equities | 11,608 | 3,557 | 15,165 | 3 | 10,335 | 4,830 | ||||||||||||||||||
Other marketable securities and/or loans | 3,293 | 339 | 3,632 | 1 | 569 | 3,063 | ||||||||||||||||||
Total Canadian dollar-denominated | 93,094 | 109,022 | 202,116 | 32 | 104,954 | 97,162 | ||||||||||||||||||
Cash and due from banks | 27,709 | – | 27,709 | 4 | 31 | 27,678 | ||||||||||||||||||
U.S. government obligations | 29,782 | 50,645 | 80,427 | 13 | 36,203 | 44,224 | ||||||||||||||||||
U.S. federal agency obligations, including U.S. federal agency mortgage-backed obligations | 53,695 | 7,612 | 61,307 | 10 | 16,915 | 44,392 | ||||||||||||||||||
Other sovereign obligations | 51,540 | 43,191 | 94,731 | 15 | 35,770 | 58,961 | ||||||||||||||||||
Corporate issuer obligations | 78,640 | 2,191 | 80,831 | 12 | 6,640 | 74,191 | ||||||||||||||||||
Equities | 44,391 | 38,498 | 82,889 | 13 | 46,244 | 36,645 | ||||||||||||||||||
Other marketable securities and/or loans | 4,005 | 2,905 | 6,910 | 1 | 2,471 | 4,439 | ||||||||||||||||||
Totalnon-Canadian dollar-denominated | 289,762 | 145,042 | 434,804 | 68 | 144,274 | 290,530 | ||||||||||||||||||
Total | $ | 382,856 | $ | 254,064 | $ | 636,920 | 100 | % | $ | 249,228 | $ | 387,692 | ||||||||||||
| October 31, 2018 | ||||||||||||||||||||||||
Cash and due from banks | $ | 3,002 | $ | – | $ | 3,002 | 1 | % | $ | 1,098 | $ | 1,904 | ||||||||||||
Canadian government obligations | 18,256 | 63,463 | 81,719 | 14 | 47,572 | 34,147 | ||||||||||||||||||
NHA MBS | 39,649 | 42 | 39,691 | 6 | 3,057 | 36,634 | ||||||||||||||||||
Provincial government obligations | 12,720 | 19,241 | 31,961 | 5 | 23,651 | 8,310 | ||||||||||||||||||
Corporate issuer obligations | 6,622 | 3,767 | 10,389 | 2 | 3,769 | 6,620 | ||||||||||||||||||
Equities | 10,554 | 1,637 | 12,191 | 2 | 6,028 | 6,163 | ||||||||||||||||||
Other marketable securities and/or loans | 2,655 | 349 | 3,004 | 1 | 277 | 2,727 | ||||||||||||||||||
Total Canadian dollar-denominated | 93,458 | 88,499 | 181,957 | 31 | 85,452 | 96,505 | ||||||||||||||||||
Cash and due from banks | 24,046 | – | 24,046 | 4 | 28 | 24,018 | ||||||||||||||||||
U.S. government obligations | 30,163 | 37,691 | 67,854 | 12 | 32,918 | 34,936 | ||||||||||||||||||
U.S. federal agency obligations, including U.S. federal agency mortgage-backed obligations | 47,150 | 927 | 48,077 | 8 | 7,522 | 40,555 | ||||||||||||||||||
Other sovereign obligations | 56,034 | 45,912 | 101,946 | 18 | 41,993 | 59,953 | ||||||||||||||||||
Corporate issuer obligations | 78,160 | 1,576 | 79,736 | 14 | 7,234 | 72,502 | ||||||||||||||||||
Equities | 33,514 | 37,666 | 71,180 | 12 | 32,206 | 38,974 | ||||||||||||||||||
Other marketable securities and/or loans | 4,786 | 4 | 4,790 | 1 | 191 | 4,599 | ||||||||||||||||||
Totalnon-Canadian dollar-denominated | 273,853 | 123,776 | 397,629 | 69 | 122,092 | 275,537 | ||||||||||||||||||
Total | $ | 367,311 | $ | 212,275 | $ | 579,586 | 100 | % | $ | 207,544 | $ | 372,042 | ||||||||||||
| 1 | Positions stated include gross asset values pertaining to securities financing transactions. |
| 2 | Liquid assets include collateral received that can bere-hypothecated or otherwise redeployed. |
Liquid assets are held in The Toronto-Dominion Bank and multiple domestic and foreign subsidiaries and branches and are summarized in the following table.
TABLE 31: SUMMARY OF UNENCUMBERED LIQUID ASSETS BY BANK, SUBSIDIARIES, AND BRANCHES
| (millions of Canadian dollars) | As at | |||||||
| July 31 2019 | October 31 2018 | |||||||
The Toronto-Dominion Bank (Parent) | $ | 149,429 | $ | 136,544 | ||||
Bank subsidiaries | 220,379 | 217,565 | ||||||
Foreign branches | 17,884 | 17,933 | ||||||
Total | $ | 387,692 | $ | 372,042 | ||||
| TD BANK GROUP• THIRD QUARTER 2019• REPORT TO SHAREHOLDERS | Page 34 |
Table of Contents
The Bank's monthly average liquid assets (excluding those held in insurance subsidiaries) for the quarters ended July 31, 2019 and April 30, 2019, are summarized in the following table.
TABLE 32: SUMMARY OF AVERAGE LIQUID ASSETS BY TYPE AND CURRENCY1
| (millions of Canadian dollars, except as noted) | Average for the three months ended | |||||||||||||||||||||||
| Bank-owned liquid assets | Securities received as | Total liquid assets | % of Total | Encumbered liquid assets | Unencumbered liquid assets2 | |||||||||||||||||||
| July 31, 2019 | ||||||||||||||||||||||||
Cash and due from banks | $ | 3,318 | $ | – | $ | 3,318 | 1 | % | $ | 457 | $ | 2,861 | ||||||||||||
Canadian government obligations | 12,219 | 80,389 | 92,608 | 14 | 59,293 | 33,315 | ||||||||||||||||||
NHA MBS | 41,413 | 23 | 41,436 | 6 | 3,592 | 37,844 | ||||||||||||||||||
Provincial government obligations | 13,945 | 25,084 | 39,029 | 6 | 29,876 | 9,153 | ||||||||||||||||||
Corporate issuer obligations | 9,934 | 3,895 | 13,829 | 2 | 4,078 | 9,751 | ||||||||||||||||||
Equities | 12,107 | 4,751 | 16,858 | 3 | 11,167 | 5,691 | ||||||||||||||||||
Other marketable securities and/or loans | 3,375 | 382 | 3,757 | 1 | 532 | 3,225 | ||||||||||||||||||
Total Canadian dollar-denominated | 96,311 | 114,524 | 210,835 | 33 | 108,995 | 101,840 | ||||||||||||||||||
Cash and due from banks | 29,992 | – | 29,992 | 5 | 33 | 29,959 | ||||||||||||||||||
U.S. government obligations | 29,699 | 46,696 | 76,395 | 12 | 36,464 | 39,931 | ||||||||||||||||||
U.S. federal agency obligations, including U.S. federal agency mortgage-backed obligations | 51,263 | 2,943 | 54,206 | 8 | 11,329 | 42,877 | ||||||||||||||||||
Other sovereign obligations | 53,479 | 50,450 | 103,929 | 16 | 43,182 | 60,747 | ||||||||||||||||||
Corporate issuer obligations | 78,860 | 2,404 | 81,264 | 13 | 6,922 | 74,342 | ||||||||||||||||||
Equities | 40,986 | 38,524 | 79,510 | 12 | 43,376 | 36,134 | ||||||||||||||||||
Other marketable securities and/or loans | 4,124 | 1,952 | 6,076 | 1 | 2,092 | 3,984 | ||||||||||||||||||
Totalnon-Canadian dollar-denominated | 288,403 | 142,969 | 431,372 | 67 | 143,398 | 287,974 | ||||||||||||||||||
Total | $ | 384,714 | $ | 257,493 | $ | 642,207 | 100 | % | $ | 252,393 | $ | 389,814 | ||||||||||||
| April 30, 2019 | ||||||||||||||||||||||||
Cash and due from banks | $ | 3,382 | $ | – | $ | 3,382 | 1 | % | $ | 209 | $ | 3,173 | ||||||||||||
Canadian government obligations | 13,906 | 63,924 | 77,830 | 13 | 47,864 | 29,966 | ||||||||||||||||||
NHA MBS | 42,626 | 35 | 42,661 | 7 | 3,267 | 39,394 | ||||||||||||||||||
Provincial government obligations | 13,495 | 23,012 | 36,507 | 6 | 27,004 | 9,503 | ||||||||||||||||||
Corporate issuer obligations | 6,918 | 4,010 | 10,928 | 2 | 3,939 | 6,989 | ||||||||||||||||||
Equities | 11,174 | 3,754 | 14,928 | 2 | 8,940 | 5,988 | ||||||||||||||||||
Other marketable securities and/or loans | 3,320 | 422 | 3,742 | 1 | 495 | 3,247 | ||||||||||||||||||
Total Canadian dollar-denominated | 94,821 | 95,157 | 189,978 | 32 | 91,718 | 98,260 | ||||||||||||||||||
Cash and due from banks | 28,170 | – | 28,170 | 5 | 39 | 28,131 | ||||||||||||||||||
U.S. government obligations | 30,183 | 43,578 | 73,761 | 12 | 37,620 | 36,141 | ||||||||||||||||||
U.S. federal agency obligations, including U.S. federal agency mortgage-backed obligations | 48,211 | 7,859 | 56,070 | 9 | 16,579 | 39,491 | ||||||||||||||||||
Other sovereign obligations | 49,987 | 41,458 | 91,445 | 15 | 33,212 | 58,233 | ||||||||||||||||||
Corporate issuer obligations | 80,437 | 2,441 | 82,878 | 14 | 6,896 | 75,982 | ||||||||||||||||||
Equities | 34,087 | 35,552 | 69,639 | 12 | 37,834 | 31,805 | ||||||||||||||||||
Other marketable securities and/or loans | 4,698 | 3 | 4,701 | 1 | 386 | 4,315 | ||||||||||||||||||
Totalnon-Canadian dollar-denominated | 275,773 | 130,891 | 406,664 | 68 | 132,566 | 274,098 | ||||||||||||||||||
Total | $ | 370,594 | $ | 226,048 | $ | 596,642 | 100 | % | $ | 224,284 | $ | 372,358 | ||||||||||||
| 1 | Positions stated include gross asset values pertaining to securities financing transactions. |
| 2 | Liquid assets include collateral received that can bere-hypothecated or otherwise redeployed. |
Average liquid assets held in The Toronto-Dominion Bank and multiple domestic and foreign subsidiaries and branches are summarized in the following table.
TABLE 33: SUMMARY OF AVERAGE UNENCUMBERED LIQUID ASSETS BY BANK, SUBSIDIARIES, AND BRANCHES
| (millions of Canadian dollars) | Average for the three months ended | |||||||
July 31 2019 | April 30 2019 | |||||||
The Toronto-Dominion Bank (Parent) | $ | 148,677 | $ | 137,951 | ||||
Bank subsidiaries | 223,785 | 218,334 | ||||||
Foreign branches | 17,352 | 16,073 | ||||||
Total | $ | 389,814 | $ | 372,358 | ||||
ASSET ENCUMBRANCE
In the course of the Bank'sday-to-day operations, assets are pledged to obtain funding, support trading and brokerage businesses, and participate in clearing and/or settlement systems. A summary of encumbered and unencumbered assets (excluding assets held in insurance subsidiaries) is presented in the following table to identify assets that are used or available for potential funding needs.
| TD BANK GROUP• THIRD QUARTER 2019• REPORT TO SHAREHOLDERS | Page 35 |
Table of Contents
TABLE 34: ENCUMBERED AND UNENCUMBERED ASSETS
| (millions of Canadian dollars, except as noted) | As at | |||||||||||||||||||||||
| Encumbered1 | Unencumbered | |||||||||||||||||||||||
Pledged as collateral2 | Other3 | Available as collateral4 | Other5 | Total assets | Encumbered assets as a % of total assets | |||||||||||||||||||
| July 31, 2019 | ||||||||||||||||||||||||
Cash and due from banks | $ | 181 | $ | – | $ | – | $ | 4,831 | $ | 5,012 | – | % | ||||||||||||
Interest-bearing deposits with banks | 5,595 | 84 | 26,044 | 2,974 | 34,697 | 0.4 | ||||||||||||||||||
Securities, trading loans, and other6 | 71,832 | 12,527 | 279,097 | 21,846 | 385,302 | 6.0 | ||||||||||||||||||
Derivatives | – | – | – | 52,555 | 52,555 | – | ||||||||||||||||||
Securities purchased under reverserepurchase agreements7 | – | – | – | 162,644 | 162,644 | – | ||||||||||||||||||
Loans, net of allowance for loan losses | 26,027 | 63,324 | 83,004 | 503,577 | 675,932 | 6.4 | ||||||||||||||||||
Customers' liability under acceptances | – | – | – | 15,219 | 15,219 | – | ||||||||||||||||||
Investment in TD Ameritrade | – | – | – | 9,108 | 9,108 | – | ||||||||||||||||||
Goodwill | – | – | – | 17,006 | 17,006 | – | ||||||||||||||||||
Other intangibles | – | – | – | 2,565 | 2,565 | – | ||||||||||||||||||
Land, buildings, equipment, and otherdepreciable assets | – | – | – | 5,463 | 5,463 | – | ||||||||||||||||||
Deferred tax assets | – | – | – | 1,898 | 1,898 | – | ||||||||||||||||||
Other assets8 | 581 | – | – | 37,460 | 38,041 | – | ||||||||||||||||||
Totalon-balance sheet assets | $ | 104,216 | $ | 75,935 | $ | 388,145 | $ | 837,146 | $ | 1,405,442 | 12.8 | % | ||||||||||||
Off-balance sheet items9 | ||||||||||||||||||||||||
Securities purchased under reverserepurchase agreements | 149,963 | – | 25,804 | (162,644 | ) | |||||||||||||||||||
Securities borrowing and collateral received | 60,779 | 1,833 | 16,310 | – | ||||||||||||||||||||
Margin loans and other client activity | 10,348 | – | 19,791 | (13,621 | ) | |||||||||||||||||||
Totaloff-balance sheet items | 221,090 | 1,833 | 61,905 | (176,265 | ) | |||||||||||||||||||
Total | $ | 325,306 | $ | 77,768 | $ | 450,050 | $ | 660,881 | ||||||||||||||||
| October 31, 2018 | ||||||||||||||||||||||||
Totalon-balance sheet assets | $ | 100,719 | $ | 72,086 | $ | 377,068 | $ | 785,030 | $ | 1,334,903 | 12.9 | % | ||||||||||||
Totaloff-balance sheet items | 185,323 | 559 | 57,845 | (142,072 | ) | |||||||||||||||||||
Total | $ | 286,042 | $ | 72,645 | $ | 434,913 | $ | 642,958 | ||||||||||||||||
| 1 | Asset encumbrance has been analyzed on an individual asset basis. Where a particular asset has been encumbered and TD has holdings of the asset bothon-balance sheet andoff-balance sheet, for the purpose of this disclosure, the on andoff-balance sheet holdings are encumbered in alignment with the business practice. |
| 2 | Represents assets that have been posted externally to support the Bank'sday-to-day operations, including securities financing transactions, clearing and payments, and derivative transactions. Also includes assets that have been pledged to Federal Home Loan Bank (FHLB) to support the U.S. Retail business. |
| 3 | Assets supporting TD's long-term funding activities, assets pledged against securitization liabilities, and assets held by consolidated securitization vehicles or in pools for covered bond issuance. |
| 4 | Assets that are considered readily available in their current legal form to generate funding or support collateral needs. This category includes reported FHLB assets that remain unutilized andheld-to-maturity securities that are available for collateral purposes however not regularly utilized in practice. |
| 5 | Assets that cannot be used to support funding or collateral requirements in their current form. This category includes those assets that are potentially eligible as funding program collateral (for example, Canada Mortgage and Housing Corporation insured mortgages that can be securitized into NHA MBS). |
| 6 | Securities include trading loans, securities,non-trading financial assets at fair value through profit or loss and other financial assets designated at fair value through profit or loss, securities at FVOCI, and DSAC. |
| 7 | Assets reported in Securities purchased under reverse repurchase agreements represent the value of the loans extended and not the value of the collateral received. |
| 8 | Other assets include amounts receivable from brokers, dealers, and clients. |
| 9 | Off-balance sheet items include the collateral value from the securities received under reverse repurchase agreements, securities borrowing, margin loans, and other client activity. The loan value from the reverse repurchase transactions and margin loans/client activity is deducted from theon-balance sheet Unencumbered – Other category. |
LIQUIDITY STRESS TESTING AND CONTINGENCY FUNDING PLANS
In addition to the "Severe Combined Stress" scenario, TD performs liquidity stress testing on multiple alternate scenarios. These scenarios are a mix ofTD-specific events and market-wide stress events designed to test the impact from risk factors material to TD's risk profile. Liquidity assessments are also part of the Bank's enterprise-wide stress testing program. Results from these stress event scenarios are used to inform the Bank's contingency funding plan actions.
The Bank has liquidity contingency funding plans (CFP) in place at the enterprise level ("Enterprise CFP") and for subsidiaries operating in both domestic and foreign jurisdictions ("Regional CFP"). The Enterprise CFP provides a documented framework for managing unexpected liquidity situations and thus is an integral component of the Bank's overall liquidity risk management program. It outlines different contingency levels based on the severity and duration of the liquidity situation, and identifies governance protocols and recovery actions appropriate for each level. For each recovery action, it provides key operational steps required to execute the action. Regional CFPs identify recovery actions to address region-specific stress events. The actions and governance structure proposed in the Enterprise CFP are aligned with the Bank's Crisis Management Recovery Plan.
CREDIT RATINGS
Credit ratings impact TD's borrowing costs and ability to raise funds. Rating downgrades could potentially result in higher financing costs, increased requirement to pledge collateral, reduced access to capital markets, and could also affect the Bank's ability to enter into derivative transactions.
Credit ratings and outlooks provided by rating agencies reflect their views and are subject to change from time to time, based on a number of factors including the Bank's financial strength, competitive position, and liquidity, as well as factors not entirely within the Bank's control, including the methodologies used by rating agencies and conditions affecting the overall financial services industry.
| TD BANK GROUP• THIRD QUARTER 2019• REPORT TO SHAREHOLDERS | Page 36 |
Table of Contents
TABLE 35: CREDIT RATINGS1
| As at | ||||||||||||
| July 31, 2019 | ||||||||||||
| Moody's | S&P | DBRS | ||||||||||
Deposits/Counterparty2 | Aa1 | AA- | AA (high) | |||||||||
Legacy Senior Debt3 | Aa1 | AA- | AA (high) | |||||||||
Senior Debt4 | Aa3 | A | AA | |||||||||
Covered Bonds | Aaa | – | AAA | |||||||||
Subordinated Debt | A2 | A | AA (low) | |||||||||
Subordinated Debt – NVCC | A2 (hyb) | A- | A | |||||||||
Preferred Shares – NVCC | Baa1 (hyb) | BBB | Pfd-2 (high) | |||||||||
Short-Term Debt (Deposits) | P-1 | A-1+ | R-1 (high) | |||||||||
Outlook | Stable | Stable | Stable | |||||||||
| 1 | The above ratings are for The Toronto-Dominion Bank legal entity. Subsidiaries' ratings are available on the Bank's website athttp://www.td.com/investor/credit.jsp. Credit ratings are not recommendations to purchase, sell, or hold a financial obligation in as much as they do not comment on market price or suitability for a particular investor. Ratings are subject to revision or withdrawal at any time by the rating organization. |
| 2 | Represents Moody's Long-Term Deposits Ratings and Counterparty Risk Rating, S&P's Issuer Credit Rating, and DBRS' Long-Term Issuer Rating. |
| 3 | Includes a) senior debt issued prior to September 23, 2018; and b) senior debt issued on or after September 23, 2018 which is excluded from the bank recapitalization"bail-in" regime, including debt with an originalterm-to-maturity of less than 400 days and most structured notes. |
| 4 | Subject to conversion under the bank recapitalization"bail-in" regime. |
The Bank regularly reviews the level of increased collateral its trading counterparties would require in the event of a downgrade of TD's credit rating. The following table presents the additional collateral that could have been contractually required to be posted to the derivative counterparties at the reporting date in the event of one, two, and three-notch downgrades of the Bank's credit ratings.
TABLE 36: ADDITIONAL COLLATERAL REQUIREMENTS FOR RATING DOWNGRADES1
| (millions of Canadian dollars) | Average for the three months ended | |||||||
July 31 2019 | April 30 2019 | |||||||
One-notch downgrade | $ | 81 | $ | 80 | ||||
Two-notch downgrade | 94 | 87 | ||||||
Three-notch downgrade | 710 | 535 | ||||||
| 1 | The above collateral requirements are based on contractual trading counterparty Credit Support Annex and the Bank's credit rating across applicable rating agencies. |
LIQUIDITY COVERAGE RATIO
The LCR is a Basel III metric calculated as the ratio of the stock of unencumbered HQLA over the net cash outflow requirements in the next 30 days under a hypothetical liquidity stress event.
The Bank must maintain the LCR above 100% under normal operating conditions in accordance with the OSFI LAR requirement. The Bank's LCR is calculated according to the scenario parameters in the OSFI LAR guideline, including prescribed HQLA eligibility criteria and haircuts, depositrun-off rates, and other outflow and inflow rates. HQLA eligible for the LCR calculation under the OSFI LAR guideline are primarily central bank reserves, sovereign issued or guaranteed securities, and high-quality securities issued bynon-financial entities.
| TD BANK GROUP• THIRD QUARTER 2019• REPORT TO SHAREHOLDERS | Page 37 |
Table of Contents
The following table summarizes the Bank's average daily LCR position for the quarter ended July 31, 2019.
TABLE 37: AVERAGE BASEL III LIQUIDITY COVERAGE RATIO1
| (millions of Canadian dollars, except as noted) | Average for the three months ended | |||||||
| July 31, 2019 | ||||||||
| Total unweighted value (average)2 | Total weighted value (average)3 | |||||||
High-quality liquid assets | ||||||||
Total high-quality liquid assets | $ | n/a | 4 | $ | 220,622 | |||
Cash outflows | ||||||||
Retail deposits and deposits from small business customers, of which: | $ | 480,045 | $ | 33,761 | ||||
Stable deposits5 | 203,475 | 6,104 | ||||||
Less stable deposits | 276,570 | 27,657 | ||||||
Unsecured wholesale funding, of which: | 248,238 | 128,366 | ||||||
Operational deposits (all counterparties) and deposits in networks of cooperative banks6 | 98,692 | 23,507 | ||||||
Non-operational deposits (all counterparties) | 107,517 | 62,830 | ||||||
Unsecured debt | 42,029 | 42,029 | ||||||
Secured wholesale funding | n/a | 20,266 | ||||||
Additional requirements, of which: | 203,055 | 57,284 | ||||||
Outflows related to derivative exposures and other collateral requirements | 28,951 | 20,182 | ||||||
Outflows related to loss of funding on debt products | 5,909 | 5,909 | ||||||
Credit and liquidity facilities | 168,195 | 31,193 | ||||||
Other contractual funding obligations | 13,120 | 6,915 | ||||||
Other contingent funding obligations7 | 572,994 | 9,071 | ||||||
Total cash outflows | $ | n/a | $ | 255,663 | ||||
Cash inflows | ||||||||
Secured lending | $ | 207,438 | $ | 28,871 | ||||
Inflows from fully performing exposures | 17,662 | 8,081 | ||||||
Other cash inflows | 52,191 | 52,191 | ||||||
Total cash inflows | $ | 277,291 | $ | 89,143 | ||||
| Average for the three months ended | ||||||||
| July 31, 2019 | April 30, 2019 | |||||||
Total adjusted value | Total adjusted value | |||||||
Total high-quality liquid assets8 | $ | 220,622 | $ | 213,526 | ||||
Total net cash outflows9 | 166,520 | 158,135 | ||||||
Liquidity coverage ratio | 132 | % | 135 | % | ||||
| 1 | The LCR for the quarter ended July 31, 2019, is calculated as an average of the 64 daily data points in the quarter. |
| 2 | Unweighted inflow and outflow values are outstanding balances maturing or callable within 30 days. |
| 3 | Weighted values are calculated after the application of respective HQLA haircuts or inflow and outflow rates, as prescribed by the OSFI LAR guideline. |
| 4 | Not applicable. |
| 5 | As defined by the OSFI LAR guideline, stable deposits from retail and smallmedium-sized enterprise (SME) customers are deposits that are insured and are either held in transactional accounts or the depositors have an established relationship with the Bank that make deposit withdrawal highly unlikely. |
| 6 | Operational deposits fromnon-SME business customers are deposits kept with the Bank in order to facilitate their access and ability to conduct payment and settlement activities. These activities include clearing, custody, or cash management services. |
| 7 | Includes uncommitted credit and liquidity facilities, stable value money market mutual funds, outstanding debt securities with remaining maturity greater than 30 days, and other contractual cash outflows. TD has no contractual obligation to buy back these outstanding TD debt securities, and as a result, a 0% outflow rate is applied under the OSFI LAR guideline. |
| 8 | Adjusted HQLA includes both asset haircut and applicable caps, as prescribed by the OSFI LAR guideline (HQLA assets after haircuts are capped at 40% for Level 2 and 15% for Level 2B). |
| 9 | Adjusted Net Cash Outflows include both inflow and outflow rates and applicable caps, as prescribed by the OSFI LAR guideline (inflows are capped at 75% of outflows). |
The Bank's average LCR of 132% for quarter ended July 31, 2019, continues to meet the regulatory requirements.
The Bank holds a variety of liquid assets commensurate with liquidity needs in the organization. Many of these assets qualify as HQLA under the OSFI LAR guideline. The average HQLA of the Bank for the quarter ended July 31, 2019, was $221 billion (April 30, 2019 – $214 billion), with Level 1 assets representing 82% (April 30, 2019 – 82%). The Bank's reported HQLA excludes excess HQLA from the U.S. Retail operations, as required by the OSFI LAR guideline, to reflect liquidity transfer considerations between U.S. Retail and its affiliates in the Bank as a result of U.S. Federal Reserve Board's regulations. By excluding excess HQLA, the U.S. Retail LCR is effectively capped at 100% prior to total Bank consolidation.
As described in the "How TD Manages Liquidity Risk" section of the Bank's 2018 Annual Report, the Bank manages its HQLA and other liquidity buffers to the higher of TD's90-day surplus requirement and the target buffers over regulatory requirements from the LCR and the Net Cumulative Cash Flow metrics. As a result, the total stock of HQLA is subject to ongoing rebalancing against the projected liquidity requirements.
| TD BANK GROUP• THIRD QUARTER 2019• REPORT TO SHAREHOLDERS | Page 38 |
Table of Contents
FUNDING
The Bank has access to a variety of unsecured and secured funding sources. The Bank's funding activities are conducted in accordance with the liquidity management policy that requires assets be funded to the appropriate term and to a prudent diversification profile.
The Bank's primary approach to managing funding activities is to maximize the use of deposits raised through personal and commercial banking channels. The following table illustrates the Bank's large base of personal and commercial, wealth, and TD Ameritrade sweep deposits (collectively, "P&C deposits") that make up over 70% of total funding.
TABLE 38: SUMMARY OF DEPOSIT FUNDING
| (millions of Canadian dollars) | As at | |||||||
July 31 2019 | October 31 2018 | |||||||
P&C deposits – Canadian Retail | $ | 371,786 | $ | 359,473 | ||||
P&C deposits – U.S. Retail | 351,976 | 346,624 | ||||||
Other deposits | 26 | 36 | ||||||
Total | $ | 723,788 | $ | 706,133 | ||||
The Bank actively maintains various registered external wholesale term (greater than 1 year) funding programs to provide access to diversified funding sources, including asset securitization, covered bonds, and unsecured wholesale debt. The Bank also raises term funding through Canadian Senior Notes, Canadian NHA MBS, Canada Mortgage Bonds, debt issued in Australia, and notes backed by credit card receivables (Evergreen Credit Card Trust). The Bank's wholesale funding is diversified by geography, by currency, and by funding types. The Bank raises short-term (1 year and less) funding using certificates of deposit and commercial paper.
The following table summarizes the registered term funding programs by geography, with the related program size.
| Canada | United States | Europe | ||
Capital Securities Program ($10 billion)
Canadian Senior Medium-Term Linked Notes Program ($4 billion)
HELOC Asset-Backed Security (ABS) Program (Genesis Trust II) ($7 billion)
|
U.S. SEC(F-3) Registered Capital and Debt Program (US$45 billion) |
United Kingdom Listing Authority (UKLA) Registered Legislative Covered Bond Program ($55 billion)
UKLA Registered European Medium-Term Note Program (US$20 billion) | ||
The Bank regularly evaluates opportunities to diversify its funding into new markets and to new investors in order to manage funding risk and cost. The following table presents a breakdown of the Bank's term debt by currency and funding type. Term funding for the quarter ended July 31, 2019, was $130.7 billion (October 31, 2018 – $127.7 billion).
TABLE 39: LONG-TERM FUNDING
| As at | ||||||||
| Long-term funding by currency | July 31 2019 | October 31 2018 | ||||||
Canadian dollar | 31 | % | 32 | % | ||||
U.S. dollar | 39 | 39 | ||||||
Euro | 21 | 19 | ||||||
British pound | 6 | 7 | ||||||
Other | 3 | 3 | ||||||
Total | 100 | % | 100 | % | ||||
| Long-term funding by type | ||||||||
Senior unsecured medium-term notes | 53 | % | 55 | % | ||||
Covered bonds | 32 | 29 | ||||||
Mortgage securitization1 | 11 | 12 | ||||||
Term asset-backed securities | 4 | 4 | ||||||
Total | 100 | % | 100 | % | ||||
| 1 | Mortgage securitization excludes the residential mortgage trading business. |
The Bank maintains depositor concentration limits against short-term wholesale deposits so that it does not depend on small groups of depositors for funding. The Bank further limits short-term wholesale funding maturity concentration in an effort to mitigate exposures to refinancing risk during a stress event.
| TD BANK GROUP• THIRD QUARTER 2019• REPORT TO SHAREHOLDERS | Page 39 |
Table of Contents
The following table represents the remaining maturity of various sources of funding outstanding as at July 31, 2019 and October 31, 2018.
TABLE 40: WHOLESALE FUNDING
| (millions of Canadian dollars) | As at | |||||||||||||||||||||||||||||||
| July 31 2019 | October 31 2018 | |||||||||||||||||||||||||||||||
| Less than 1 month | 1 to 3 months | 3 to 6 months | 6 months to 1 year | Over 1 to 2 years | Over 2 years | Total | Total | |||||||||||||||||||||||||
Deposits from banks1 | $ | 9,052 | $ | 1,906 | $ | 3,664 | $ | 42 | $ | – | $ | – | $ | 14,664 | $ | 14,176 | ||||||||||||||||
Bearer deposit note | 468 | 430 | 962 | 732 | – | – | 2,592 | 3,872 | ||||||||||||||||||||||||
Certificates of deposit | 8,527 | 17,437 | 16,533 | 15,495 | 152 | – | 58,144 | 51,401 | ||||||||||||||||||||||||
Commercial paper | 20,171 | 16,263 | 18,259 | 4,664 | – | – | 59,357 | 55,570 | ||||||||||||||||||||||||
Covered bonds | – | 2,228 | 902 | 4,014 | 9,496 | 24,910 | 41,550 | 36,284 | ||||||||||||||||||||||||
Mortgage securitization | – | 846 | 1,126 | 2,527 | 3,726 | 18,703 | 26,928 | 27,301 | ||||||||||||||||||||||||
Legacy senior unsecured medium-term notes2 | 1,646 | 5,086 | 2,322 | 9,150 | 22,544 | 17,398 | 58,146 | 69,518 | ||||||||||||||||||||||||
Senior unsecured medium-term notes3 | – | – | – | – | – | 10,756 | 10,756 | – | ||||||||||||||||||||||||
Subordinated notes and debentures4 | – | – | – | – | – | 10,596 | 10,596 | 8,740 | ||||||||||||||||||||||||
Term asset-backed securitization | – | 791 | – | 1,728 | 2,202 | 660 | 5,381 | 5,626 | ||||||||||||||||||||||||
Other5 | 7,638 | 1,046 | 746 | 210 | 495 | 2,026 | 12,161 | 6,534 | ||||||||||||||||||||||||
Total | $ | 47,502 | $ | 46,033 | $ | 44,514 | $ | 38,562 | $ | 38,615 | $ | 85,049 | $ | 300,275 | $ | 279,022 | ||||||||||||||||
Of which: | ||||||||||||||||||||||||||||||||
Secured | $ | – | $ | 3,865 | $ | 2,028 | $ | 8,269 | $ | 15,424 | $ | 44,283 | $ | 73,869 | $ | 69,225 | ||||||||||||||||
Unsecured | 47,502 | 42,168 | 42,486 | 30,293 | 23,191 | 40,766 | 226,406 | 209,797 | ||||||||||||||||||||||||
Total | $ | 47,502 | $ | 46,033 | $ | 44,514 | $ | 38,562 | $ | 38,615 | $ | 85,049 | $ | 300,275 | $ | 279,022 | ||||||||||||||||
| 1 | Includes fixed-term deposits from banks. |
| 2 | Includes a) senior debt issued prior to September 23, 2018; and b) senior debt issued on or after September 23, 2018 which is excluded from the bank recapitalization "bail-in" regime, including debt with an original term-to-maturity of less than 400 days. |
| 3 | Comprised of senior debt subject to conversion under the bank recapitalization"bail-in" regime. Excludes $1.9 billion of structured notes subject to conversion under the"bail-in" regime (October 31, 2018 – nil). |
| 4 | Subordinated notes and debentures are not considered wholesale funding as they may be raised primarily for capital management purposes. |
| 5 | Includes fixed-term deposits fromnon-bank institutions (unsecured) of $12.2 billion (October 31, 2018 – $6.5 billion). |
Excluding the Wholesale Banking mortgage aggregation business, the Bank's total mortgage-backed securities issuance for the three and nine months ended July 31, 2019, was $0.7 billion and $1.8 billion, respectively (three and nine months ended July 31, 2018 – $0.7 billion and $2.0 billion, respectively). Otherasset-backed securities issuance for the three and nine months ended July 31, 2019, was nil and $1.4 billion, respectively (three and nine months ended July 31, 2018 – $1.0 billion and $1.8 billion, respectively). The Bank also issued $6.1 billion and $11.9 billion, respectively, of unsecured medium-term notes for the three and nine months ended July 31, 2019 (three and nine months ended July 31, 2018 – $15.6 billion and $21.9 billion, respectively). The total covered bonds issuance for the three and nine months ended July 31, 2019, was $6.3 billion and $8.8 billion, respectively (three and nine months ended July 31, 2018 – $4.5 billion and $7.3 billion, respectively).
REGULATORY DEVELOPMENTS CONCERNING LIQUIDITY AND FUNDING
In July 2019, OSFI published proposed changes to GuidelineB-6: Liquidity Principles for public consultation. The changes proposed aim to ensure that the guideline remains relevant and current, and include additional clarity with respect to OSFI's expectations regarding institutions' liquidity risk management practices. OSFI has targeted an implementation date of January 2020.
In May 2019, OSFI published revisions to the covered bond limit calculation updating the limit calibration as well as how the metric is calculated. The changes are effective August 2019.
In April 2019, OSFI published its final guidelines for Canadian application of Net Stable Funding Ratio (NSFR) as part of its LAR. The NSFR requires that the ratio of available stable funding over required stable funding be greater than 100%. The NSFR is designed to reduce structural funding risk by requiring banks to have sufficient stable sources of funding and lower reliance on funding maturing in less than one year to support their businesses. OSFI implementation of NSFR forD-SIBs will be in January 2020 and the public disclosure requirement will begin in January 2021.
In April 2019, OSFI also published changes to the LAR guideline with an implementation date of January 2020. The changes increase reserve requirements on certain retail deposit types that, in the view of OSFI, may have higher risk of withdrawals in periods of stress. The regulation also introduces new monitoring requirements on the components of banks' funding profiles.
MATURITY ANALYSIS OF ASSETS, LIABILITIES, ANDOFF-BALANCE SHEET COMMITMENTS
The following table summarizeson-balance sheet andoff-balance sheet categories by remaining contractual maturity.Off-balance sheet commitments include contractual obligations to make future payments on operating capital lease commitments, certain purchase obligations, and other liabilities. The values of credit instruments reported in the following table represent the maximum amount of additional credit that the Bank could be obligated to extend should such instruments be fully drawn or utilized. Since a significant portion of guarantees and commitments are expected to expire without being drawn upon, the total of the contractual amounts is not representative of expected future liquidity requirements. These contractual obligations have an impact on the Bank's short-term and long-term liquidity and capital resource needs.
The maturity analysis presented does not depict the degree of the Bank's maturity transformation or the Bank's exposure to interest rate and liquidity risk. The Bank ensures that assets are appropriately funded to protect against borrowing cost volatility and potential reductions to funding market availability. The Bank utilizes stablenon-maturity deposits (chequing and savings accounts) and term deposits as the primary source of long-term funding for the Bank'snon-trading assets. The Bank also funds the stable balance of revolving lines of credit with long-term funding. The Bank issues long-term funding based primarily on the projected net growth ofnon-trading assets. The Bank raises short-term funding primarily to finance trading assets. The liquidity of trading assets under stressed market conditions is considered when determining the appropriate term of the related funding.
| TD BANK GROUP• THIRD QUARTER 2019• REPORT TO SHAREHOLDERS | Page 40 |
Table of Contents
TABLE 41: REMAINING CONTRACTUAL MATURITY
| (millions of Canadian dollars) | As at | |||||||||||||||||||||||||||||||||||||||
| July 31, 2019 | ||||||||||||||||||||||||||||||||||||||||
| Less than 1 month | 1 to 3 months | 3 to 6 months | 6 to 9 months | 9 months to 1 year | Over 1 to 2 years | Over 2 to 5 years | Over 5 years | No specific maturity | Total | |||||||||||||||||||||||||||||||
Assets | ||||||||||||||||||||||||||||||||||||||||
Cash and due from banks | $ | 2,342 | $ | 2,670 | $ | – | $ | – | $ | – | $ | – | $ | – | $ | – | $ | – | $ | 5,012 | ||||||||||||||||||||
Interest-bearing deposits with banks | 32,716 | 185 | 962 | – | 1 | – | – | – | 833 | 34,697 | ||||||||||||||||||||||||||||||
Trading loans, securities, and other1 | 3,130 | 2,434 | 3,987 | 3,192 | 3,691 | 10,976 | 25,603 | 17,979 | 71,169 | 142,161 | ||||||||||||||||||||||||||||||
Non-trading financial assets at fair value throughprofit or loss | – | 324 | 2 | 81 | 739 | 1,643 | 1,108 | 1,330 | 806 | 6,033 | ||||||||||||||||||||||||||||||
Derivatives | 7,359 | 8,966 | 5,338 | 2,510 | 1,935 | 6,298 | 8,539 | 11,610 | – | 52,555 | ||||||||||||||||||||||||||||||
Financial assets designated at fair value throughprofit or loss | 340 | 221 | 421 | 107 | 58 | 461 | 1,708 | 702 | – | 4,018 | ||||||||||||||||||||||||||||||
Financial assets at fair value through other comprehensive income | 1,755 | 3,263 | 3,129 | 5,179 | 6,492 | 19,578 | 44,891 | 30,567 | 1,846 | 116,700 | ||||||||||||||||||||||||||||||
Debt securities at amortized cost, net of allowancefor credit losses | 436 | 4,233 | 3,620 | 1,775 | 1,055 | 7,513 | 41,103 | 56,656 | (1 | ) | 116,390 | |||||||||||||||||||||||||||||
Securities purchased under reverse repurchase agreements | 114,837 | 23,144 | 15,571 | 5,494 | 3,513 | 33 | 52 | – | – | 162,644 | ||||||||||||||||||||||||||||||
Loans | ||||||||||||||||||||||||||||||||||||||||
Residential mortgages | 2,023 | 5,530 | 7,975 | 9,627 | 11,767 | 33,285 | 99,021 | 62,121 | – | 231,349 | ||||||||||||||||||||||||||||||
Consumer instalment and other personal | 926 | 2,096 | 2,946 | 3,503 | 3,944 | 16,452 | 59,047 | 28,265 | 61,043 | 178,222 | ||||||||||||||||||||||||||||||
Credit card | – | – | – | – | – | – | – | – | 36,756 | 36,756 | ||||||||||||||||||||||||||||||
Business and government | 30,464 | 5,173 | 7,124 | 7,364 | 8,668 | 23,035 | 70,139 | 60,511 | 20,896 | 233,374 | ||||||||||||||||||||||||||||||
Total loans | 33,413 | 12,799 | 18,045 | 20,494 | 24,379 | 72,772 | 228,207 | 150,897 | 118,695 | 679,701 | ||||||||||||||||||||||||||||||
Allowance for loan losses | – | – | – | – | – | – | – | – | (3,769 | ) | (3,769 | ) | ||||||||||||||||||||||||||||
Loans, net of allowance for loan losses | 33,413 | 12,799 | 18,045 | 20,494 | 24,379 | 72,772 | 228,207 | 150,897 | 114,926 | 675,932 | ||||||||||||||||||||||||||||||
Customers' liability under acceptances | 12,779 | 2,365 | 72 | (1 | ) | 4 | – | – | – | – | 15,219 | |||||||||||||||||||||||||||||
Investment in TD Ameritrade | – | – | – | – | – | – | – | – | 9,108 | 9,108 | ||||||||||||||||||||||||||||||
Goodwill2 | – | – | – | – | – | – | – | – | 17,006 | 17,006 | ||||||||||||||||||||||||||||||
Other intangibles2 | – | – | – | – | – | – | – | – | 2,565 | 2,565 | ||||||||||||||||||||||||||||||
Land, buildings, equipment, and other depreciable assets2 | – | – | – | – | – | – | – | – | 5,463 | 5,463 | ||||||||||||||||||||||||||||||
Deferred tax assets | – | – | – | – | – | – | – | – | 1,898 | 1,898 | ||||||||||||||||||||||||||||||
Amounts receivable from brokers, dealers, and clients | 21,169 | – | – | – | – | – | – | – | – | 21,169 | ||||||||||||||||||||||||||||||
Other assets | 3,178 | 884 | 324 | 2,426 | 101 | 160 | 169 | 99 | 9,531 | 16,872 | ||||||||||||||||||||||||||||||
Total assets | $ | 233,454 | $ | 61,488 | $ | 51,471 | $ | 41,257 | $ | 41,968 | $ | 119,434 | $ | 351,380 | $ | 269,840 | $ | 235,150 | $ | 1,405,442 | ||||||||||||||||||||
Liabilities | ||||||||||||||||||||||||||||||||||||||||
Trading deposits | $ | 7,328 | $ | 12,609 | $ | 7,654 | $ | 1,021 | $ | 1,115 | $ | 2,354 | $ | 4,166 | $ | 1,549 | $ | – | $ | 37,796 | ||||||||||||||||||||
Derivatives | 7,601 | 9,178 | 5,350 | 2,562 | 1,862 | 5,854 | 8,865 | 12,297 | – | 53,569 | ||||||||||||||||||||||||||||||
Securitization liabilities at fair value | – | 271 | 615 | 414 | 483 | 1,691 | 7,439 | 1,836 | – | 12,749 | ||||||||||||||||||||||||||||||
Financial liabilities designated at fair value through profit or loss | 27,473 | 19,529 | 29,188 | 6,788 | 12,639 | 150 | 1 | 6 | – | 95,774 | ||||||||||||||||||||||||||||||
Deposits3,4 | ||||||||||||||||||||||||||||||||||||||||
Personal | 5,576 | 8,124 | 9,148 | 7,689 | 7,659 | 9,630 | 9,764 | 25 | 433,923 | 491,538 | ||||||||||||||||||||||||||||||
Banks | 6,659 | 1,226 | 1,942 | – | 1 | – | 3 | 7 | 6,722 | 16,560 | ||||||||||||||||||||||||||||||
Business and government5 | 16,499 | 19,904 | 7,970 | 6,034 | 10,386 | 32,781 | 48,588 | 7,676 | 212,390 | 362,228 | ||||||||||||||||||||||||||||||
Total deposits | 28,734 | 29,254 | 19,060 | 13,723 | 18,046 | 42,411 | 58,355 | 7,708 | 653,035 | 870,326 | ||||||||||||||||||||||||||||||
Acceptances | 12,779 | 2,365 | 72 | (1 | ) | 4 | – | – | – | – | 15,219 | |||||||||||||||||||||||||||||
Obligations related to securities sold short1 | 86 | 3,094 | 2,430 | 894 | 1,573 | 4,223 | 9,644 | 12,493 | 862 | 35,299 | ||||||||||||||||||||||||||||||
Obligations related to securities sold under repurchase agreements | 109,775 | 11,457 | 1,471 | 180 | 258 | 53 | 14 | – | – | 123,208 | ||||||||||||||||||||||||||||||
Securitization liabilities at amortized cost | – | 576 | 510 | 1,275 | 355 | 2,035 | 6,595 | 2,833 | – | 14,179 | ||||||||||||||||||||||||||||||
Amounts payable to brokers, dealers, and clients | 21,866 | – | – | – | – | – | – | – | – | 21,866 | ||||||||||||||||||||||||||||||
Insurance-related liabilities | 211 | 296 | 351 | 307 | 308 | 935 | 1,613 | 907 | 1,864 | 6,792 | ||||||||||||||||||||||||||||||
Other liabilities6 | 4,644 | 2,008 | 1,458 | 1,404 | 1,595 | 2,698 | 1,121 | 157 | 6,602 | 21,687 | ||||||||||||||||||||||||||||||
Subordinated notes and debentures | – | – | – | – | – | – | – | 10,596 | – | 10,596 | ||||||||||||||||||||||||||||||
Equity | – | – | – | – | – | – | – | – | 86,382 | 86,382 | ||||||||||||||||||||||||||||||
Total liabilities and equity | $ | 220,497 | $ | 90,637 | $ | 68,159 | $ | 28,567 | $ | 38,238 | $ | 62,404 | $ | 97,813 | $ | 50,382 | $ | 748,745 | $ | 1,405,442 | ||||||||||||||||||||
Off-balance sheet commitments | ||||||||||||||||||||||||||||||||||||||||
Credit and liquidity commitments7,8 | $ | 17,924 | $ | 22,858 | $ | 18,018 | $ | 12,884 | $ | 13,005 | $ | 28,408 | $ | 108,125 | $ | 5,024 | $ | 1,296 | $ | 227,542 | ||||||||||||||||||||
Operating lease commitments | 81 | 163 | 245 | 244 | 241 | 925 | 2,323 | 3,428 | – | 7,650 | ||||||||||||||||||||||||||||||
Other purchase obligations | 94 | 110 | 246 | 134 | 163 | 612 | 1,043 | 546 | – | 2,948 | ||||||||||||||||||||||||||||||
Unconsolidated structured entity commitments | – | 1,114 | 504 | 155 | 447 | 816 | – | – | – | 3,036 | ||||||||||||||||||||||||||||||
Totaloff-balance sheet commitments | $ | 18,099 | $ | 24,245 | $ | 19,013 | $ | 13,417 | $ | 13,856 | $ | 30,761 | $ | 111,491 | $ | 8,998 | $ | 1,296 | $ | 241,176 | ||||||||||||||||||||
| 1 | Amount has been recorded according to the remaining contractual maturity of the underlying security. |
| 2 | For the purposes of this table,non-financial assets have been recorded as having 'no specific maturity'. |
| 3 | As the timing of demand deposits and notice deposits isnon-specific and callable by the depositor, obligations have been included as having 'no specific maturity'. |
| 4 | Includes $42 billion of covered bonds with remaining contractual maturities of $2 billion in 'over 1 month to 3 months', $1 billion in 'over 3 months to 6 months', $2 billion in 'over 6 months to 9 months', $2 billion in 'over 9 months to 1 year', $9 billion in 'over 1 to 2 years', $22 billion in 'over 2 to 5 years', and $4 billion in 'over 5 years'. |
| 5 | On June 30, 2019, TD Capital Trust IV redeemed all of the outstanding $550 million TD Capital Trust IV Notes – Series 1 at a redemption price of 100% of the principal amount plus any accrued and unpaid interest payable on the date of redemption. |
| 6 | Includes $89 million of capital lease commitments with remaining contractual maturities of $2 million in 'less than 1 month', $4 million in '1 month to 3 months', $5 million in '3 months to 6 months', $5 million in '6 months to 9 months', $5 million in '9 months to 1 year', $22 million in 'over 1 to 2 years', $44 million in 'over 2 to 5 years', and $2 million in 'over 5 years'. |
| 7 | Includes $297 million in commitments to extend credit to private equity investments. |
| 8 | Commitments to extend credit exclude personal lines of credit and credit card lines, which are unconditionally cancellable at the Bank's discretion at any time. |
| TD BANK GROUP• THIRD QUARTER 2019• REPORT TO SHAREHOLDERS | Page 41 |
Table of Contents
TABLE 41: REMAINING CONTRACTUAL MATURITY(continued)1
| (millions of Canadian dollars) | As at | |||||||||||||||||||||||||||||||||||||||
| October 31, 2018 | ||||||||||||||||||||||||||||||||||||||||
| Less than 1 month | 1 to 3 months | 3 to 6 months | 6 to 9 months | 9 months to 1 year | Over 1 to 2 years | Over 2 to 5 years | Over 5 years | No specific | Total | |||||||||||||||||||||||||||||||
Assets | ||||||||||||||||||||||||||||||||||||||||
Cash and due from banks | $ | 4,733 | $ | 2 | $ | – | $ | – | $ | – | $ | – | $ | – | $ | – | $ | – | $ | 4,735 | ||||||||||||||||||||
Interest-bearing deposits with banks | 28,332 | 924 | 154 | 21 | 16 | – | – | – | 1,273 | 30,720 | ||||||||||||||||||||||||||||||
Trading loans, securities, and other2 | 1,971 | 5,244 | 2,111 | 3,653 | 3,998 | 9,683 | 25,772 | 25,895 | 49,570 | 127,897 | ||||||||||||||||||||||||||||||
Non-trading financial assets at fair value throughprofit or loss | – | 12 | 99 | 460 | 906 | 227 | 841 | 848 | 622 | 4,015 | ||||||||||||||||||||||||||||||
Derivatives | 7,343 | 9,263 | 5,275 | 3,276 | 2,321 | 7,130 | 12,436 | 9,952 | – | 56,996 | ||||||||||||||||||||||||||||||
Financial assets designated at fair value throughprofit or loss | 30 | 95 | 535 | 243 | 90 | 297 | 1,532 | 796 | – | 3,618 | ||||||||||||||||||||||||||||||
Financial assets at fair value through other comprehensive income | 1,111 | 4,214 | 4,150 | 5,354 | 3,962 | 19,777 | 57,922 | 31,936 | 2,174 | 130,600 | ||||||||||||||||||||||||||||||
Debt securities at amortized cost, net of allowancefor credit losses | 881 | 2,577 | 3,010 | 3,594 | 4,059 | 8,103 | 34,032 | 50,990 | (75 | ) | 107,171 | |||||||||||||||||||||||||||||
Securities purchased under reverse repurchase agreements | 77,612 | 30,047 | 14,426 | 3,807 | 1,458 | 29 | – | – | – | 127,379 | ||||||||||||||||||||||||||||||
Loans | ||||||||||||||||||||||||||||||||||||||||
Residential mortgages | 908 | 3,234 | 6,614 | 11,166 | 11,061 | 43,063 | 113,852 | 35,293 | – | 225,191 | ||||||||||||||||||||||||||||||
Consumer instalment and other personal | 753 | 1,332 | 2,628 | 3,724 | 4,131 | 14,313 | 56,632 | 26,321 | 62,245 | 172,079 | ||||||||||||||||||||||||||||||
Credit card | – | – | – | – | – | – | – | – | 35,018 | 35,018 | ||||||||||||||||||||||||||||||
Business and government | 23,052 | 4,320 | 5,539 | 7,131 | 9,269 | 19,637 | 67,922 | 59,251 | 21,533 | 217,654 | ||||||||||||||||||||||||||||||
Total loans | 24,713 | 8,886 | 14,781 | 22,021 | 24,461 | 77,013 | 238,406 | 120,865 | 118,796 | 649,942 | ||||||||||||||||||||||||||||||
Allowance for loan losses | – | – | – | – | – | – | – | – | (3,549 | ) | (3,549 | ) | ||||||||||||||||||||||||||||
Loans, net of allowance for loan losses | 24,713 | 8,886 | 14,781 | 22,021 | 24,461 | 77,013 | 238,406 | 120,865 | 115,247 | 646,393 | ||||||||||||||||||||||||||||||
Customers' liability under acceptances | 14,984 | 2,145 | 132 | 6 | – | – | – | – | – | 17,267 | ||||||||||||||||||||||||||||||
Investment in TD Ameritrade | – | – | – | – | – | – | – | – | 8,445 | 8,445 | ||||||||||||||||||||||||||||||
Goodwill3 | – | – | – | – | – | – | – | – | 16,536 | 16,536 | ||||||||||||||||||||||||||||||
Other intangibles3 | – | – | – | – | – | – | – | – | 2,459 | 2,459 | ||||||||||||||||||||||||||||||
Land, buildings, equipment, and other depreciable assets3 | – | – | – | – | – | – | – | – | 5,324 | 5,324 | ||||||||||||||||||||||||||||||
Deferred tax assets | – | – | – | – | – | – | – | – | 2,812 | 2,812 | ||||||||||||||||||||||||||||||
Amounts receivable from brokers, dealers, and clients | 26,940 | – | – | – | – | – | – | – | – | 26,940 | ||||||||||||||||||||||||||||||
Other assets | 3,432 | 854 | 1,926 | 120 | 142 | 136 | 301 | 90 | 8,595 | 15,596 | ||||||||||||||||||||||||||||||
Total assets | $ | 192,082 | $ | 64,263 | $ | 46,599 | $ | 42,555 | $ | 41,413 | $ | 122,395 | $ | 371,242 | $ | 241,372 | $ | 212,982 | $ | 1,334,903 | ||||||||||||||||||||
Liabilities | ||||||||||||||||||||||||||||||||||||||||
Trading deposits | $ | 16,145 | $ | 37,337 | $ | 31,081 | $ | 12,954 | $ | 11,739 | $ | 1,183 | $ | 3,260 | $ | 1,005 | $ | – | $ | 114,704 | ||||||||||||||||||||
Derivatives | 6,195 | 8,684 | 4,230 | 3,103 | 2,263 | 5,510 | 9,282 | 9,003 | – | 48,270 | ||||||||||||||||||||||||||||||
Securitization liabilities at fair value | – | 981 | 194 | 661 | 272 | 1,822 | 6,719 | 1,969 | – | 12,618 | ||||||||||||||||||||||||||||||
Financial liabilities designated atfair value through profit or loss | 10 | 5 | – | – | – | – | – | 1 | – | 16 | ||||||||||||||||||||||||||||||
Deposits4,5 | ||||||||||||||||||||||||||||||||||||||||
Personal | 4,330 | 7,094 | 7,541 | 6,245 | 7,718 | 10,222 | 9,876 | 38 | 424,580 | 477,644 | ||||||||||||||||||||||||||||||
Banks | 6,499 | 1,941 | 255 | 24 | 54 | – | 3 | 8 | 7,928 | 16,712 | ||||||||||||||||||||||||||||||
Business and government | 18,840 | 19,337 | 7,033 | 9,984 | 11,299 | 21,345 | 54,780 | 8,000 | 206,465 | 357,083 | ||||||||||||||||||||||||||||||
Total deposits | 29,669 | 28,372 | 14,829 | 16,253 | 19,071 | 31,567 | 64,659 | 8,046 | 638,973 | 851,439 | ||||||||||||||||||||||||||||||
Acceptances | 14,986 | 2,145 | 132 | 6 | – | – | – | – | – | 17,269 | ||||||||||||||||||||||||||||||
Obligations related to securities sold short2 | 2,621 | 3,679 | 1,500 | 387 | 904 | 4,330 | 13,771 | 11,474 | 812 | 39,478 | ||||||||||||||||||||||||||||||
Obligations related to securities sold under repurchase agreements | 73,759 | 15,508 | 3,516 | 428 | 108 | 43 | 27 | – | – | 93,389 | ||||||||||||||||||||||||||||||
Securitization liabilities at amortized cost | 22 | 1,240 | 625 | 503 | 575 | 2,496 | 6,232 | 2,990 | – | 14,683 | ||||||||||||||||||||||||||||||
Amounts payable to brokers, dealers, and clients | 28,385 | – | – | – | – | – | – | – | – | 28,385 | ||||||||||||||||||||||||||||||
Insurance-related liabilities | 213 | 294 | 353 | 309 | 310 | 937 | 1,624 | 903 | 1,755 | 6,698 | ||||||||||||||||||||||||||||||
Other liabilities6 | 2,916 | 2,631 | 538 | 1,326 | 1,394 | 2,205 | 2,308 | 152 | 5,704 | 19,174 | ||||||||||||||||||||||||||||||
Subordinated notes and debentures | – | – | – | – | – | – | – | 8,740 | – | 8,740 | ||||||||||||||||||||||||||||||
Equity | – | – | – | – | – | – | – | – | 80,040 | 80,040 | ||||||||||||||||||||||||||||||
Total liabilities and equity | $ | 174,921 | $ | 100,876 | $ | 56,998 | $ | 35,930 | $ | 36,636 | $ | 50,093 | $ | 107,882 | $ | 44,283 | $ | 727,284 | $ | 1,334,903 | ||||||||||||||||||||
Off-balance sheet commitments | ||||||||||||||||||||||||||||||||||||||||
Credit and liquidity commitments7,8 | $ | 18,341 | $ | 16,732 | $ | 17,222 | $ | 13,105 | $ | 9,159 | $ | 25,720 | $ | 101,210 | $ | 5,260 | $ | 1,293 | $ | 208,042 | ||||||||||||||||||||
Operating lease commitments | 79 | 159 | 240 | 237 | 233 | 902 | 2,188 | 3,229 | – | 7,267 | ||||||||||||||||||||||||||||||
Other purchase obligations | 46 | 163 | 131 | 128 | 127 | 460 | 898 | 524 | – | 2,477 | ||||||||||||||||||||||||||||||
Unconsolidated structured entity commitments | – | 1,079 | 940 | 329 | – | 7 | 408 | – | – | 2,763 | ||||||||||||||||||||||||||||||
Totaloff-balance sheet commitments | $ | 18,466 | $ | 18,133 | $ | 18,533 | $ | 13,799 | $ | 9,519 | $ | 27,089 | $ | 104,704 | $ | 9,013 | $ | 1,293 | $ | 220,549 | ||||||||||||||||||||
| 1 | Certain comparative amounts have been recast to conform with the presentation adopted in the current period. |
| 2 | Amount has been recorded according to the remaining contractual maturity of the underlying security. |
| 3 | For the purposes of this table,non-financial assets have been recorded as having 'no specific maturity'. |
| 4 | As the timing of demand deposits and notice deposits isnon-specific and callable by the depositor, obligations have been included as having 'no specific maturity'. |
| 5 | Includes $36 billion of covered bonds with remaining contractual maturities of $1 billion in '3 months to 6 months', $3 billion in '6 months to 9 months', $2 billion in '9 months to 1 year', $5 billion in 'over 1 to 2 years', $22 billion in 'over 2 to 5 years', and $3 billion in 'over 5 years'. |
| 6 | Includes $60 million of capital lease commitments with remaining contractual maturities of $2 million in 'less than 1 month', $5 million in '1 month to 3 months', $7 million in '3 months to 6 months', $6 million in '6 months to 9 months', $6 million in '9 months to 1 year', $12 million in 'over 1 to 2 years', $17 million in 'over 2 to 5 years', and $5 million in 'over 5 years'. |
| 7 | Includes $205 million in commitments to extend credit to private equity investments. |
| 8 | Commitments to extend credit exclude personal lines of credit and credit card lines, which are unconditionally cancellable at the Bank's discretion at any time. |
| TD BANK GROUP• THIRD QUARTER 2019• REPORT TO SHAREHOLDERS | Page 42 |
Table of Contents
SECURITIZATION ANDOFF-BALANCE SHEET ARRANGEMENTS
The Bank enters into securitization andoff-balance sheet arrangements in the normal course of operations. The Bank is involved with structured entities that it sponsors, as well as entities sponsored by third-parties. Refer to "Securitization andOff-Balance Sheet Arrangements" section, Note 9: Transfers of Financial Assets and Note 10: Structured Entities of the Bank's 2018 Annual Report for further details. There have been no significant changes to the Bank's securitization andoff-balance sheet arrangements during the quarter ended July 31, 2019.
Securitization of Bank-Originated Assets
The Bank securitizes residential mortgages, business and government loans, credit cards, and personal loans to enhance its liquidity position, to diversify sources of funding, and to optimize the management of the balance sheet.
Residential Mortgage Loans
The Bank securitizes residential mortgage loans through significant unconsolidated special purpose entities (SPEs) and Canadiannon-SPE third parties. Residential mortgage loans securitized by the Bank may give rise to full derecognition of the financial assets depending on the individual arrangement of each transaction. In instances where the Bank fully derecognizes residential mortgage loans, the Bank may be exposed to the risks of transferred loans through retained interests.
Consumer Instalment and Other Personal Loans
The Bank securitizes consumer instalment and other personal loans through a consolidated SPE. The Bank consolidates the SPE as it serves as a financing vehicle for the Bank's assets, the Bank has power over the key economic decisions of the SPE, and the Bank is exposed to the majority of the residual risks of the SPE.
Credit Card Loans
The Bank securitizes credit card loans through a SPE. The Bank consolidates the SPE as it serves as a financing vehicle for the Bank's assets, the Bank has power over the key economic decisions of the SPE, and the Bank is exposed to the majority of the residual risks of the SPE.
Business and Government Loans
The Bank securitizes business and government loans through significant unconsolidated SPEs and Canadiannon-SPE third parties. Business and government loans securitized by the Bank may be derecognized from the Bank's balance sheet depending on the individual arrangement of each transaction. In instances where the Bank fully derecognizes business and government loans, the Bank may be exposed to the risks of transferred loans through retained interests. There are no ECLs on the retained interests of the securitized business and government loans as the mortgages are all government insured.
Securitization of Third Party-Originated Assets
Significant Unconsolidated Special Purpose Entities
Multi-Seller Conduits
The Bank administers multi-seller conduits and provides liquidity facilities as well as securities distribution services; it may also provide credit enhancements. Third party-originated assets are securitized through Bank-sponsored SPEs, which are not consolidated by the Bank. The Bank's maximum potential exposure to loss due to its ownership interest in commercial paper and through the provision of liquidity facilities for multi-seller conduits was $10.5 billion as at July 31, 2019 (October 31, 2018 – $10.4 billion). Further, as at July 31, 2019, the Bank had committed to provide an additional $3.0 billion in liquidity facilities that can be used to support future asset-backed commercial paper in the purchase of deal-specific assets (October 31, 2018 – $2.8 billion).
All third-party assets securitized by the Bank's unconsolidated multi-seller conduits were originated in Canada and sold to Canadian securitization structures.
Off-Balance Sheet Exposure to Third Party-Sponsored Conduits
The Bank hasoff-balance sheet exposure to third party-sponsored conduits arising from providing liquidity facilities and funding commitments of $3.9 billion as at July 31, 2019 (October 31, 2018 – $3.0 billion). The assets within these conduits are comprised of individual notes backed by automotive loan receivables, credit card receivables, equipment receivables and trade receivables. As at July 31, 2019, these assets have maintained ratings from various credit rating agencies, with a minimum rating of A.On-balance sheet exposure to third party-sponsored conduits have been included in the financial statements.
ACCOUNTING POLICIES AND ESTIMATES
The Bank's unaudited Interim Consolidated Financial Statements have been prepared in accordance with IFRS. For details of the Bank's accounting policies under IFRS, refer to Note 2 of the Bank's third quarter 2019 Interim Consolidated Financial Statements and the 2018 Annual Consolidated Financial Statements. For details of the Bank's significant accounting judgments, estimates, and assumptions under IFRS, refer to Note 3 of the Bank's 2018 Annual Consolidated Financial Statements.
CURRENT CHANGES IN ACCOUNTING POLICY
The following new standards have been adopted by the Bank on November 1, 2018.
Revenue from Contracts with Customers
On November 1, 2018, the Bank adopted IFRS 15,Revenue from Contracts with Customers(IFRS 15), which establishes the principles for recognizing revenue and cash flows arising from contracts with customers and prescribes the application of a five-step recognition and measurement model. The standard excludes from its scope, revenue arising from items such as financial instruments, insurance contracts, and leases. The Bank adopted the standard on a modified retrospective basis, recognizing the cumulative effect of initially applying the standard as an adjustment to opening retained earnings without restating comparative period financial information.
The adoption of IFRS 15 resulted in a reduction to Shareholders' Equity of $41 million related to certain expenses not eligible for deferral under IFRS 15. The presentation of certain revenue and expense items is changed due to IFRS 15 and reclassified prospectively. These presentation changes are not significant and do not have an impact on net income.
| TD BANK GROUP• THIRD QUARTER 2019• REPORT TO SHAREHOLDERS | Page 43 |
Table of Contents
In addition to the above changes related to the adoption of IFRS 15, the Bank also changed its accounting policy on securities lending and borrowing transactions. Where securities are received or pledged as collateral, securities lending income and securities borrowing fees are recorded inNon-interest income andNon-interest expenses, respectively, on the Interim Consolidated Statement of Income. This change has been applied retrospectively.
Revenue Recognition
Revenue is recognized at an amount that reflects the consideration the Bank expects to be entitled to in exchange for transferring services to a customer, excluding amounts collected on behalf of third parties. The Bank recognizes revenue when it transfers control of a good or a service to a customer at a point in time or over time. The determination of when performance obligations are satisfied requires the use of judgment. Refer to Note 3 for further details.
The Bank identifies contracts with customers subject to IFRS 15, which create enforceable rights and obligations. The Bank determines the performance obligations based on distinct services promised to the customers in the contracts. The Bank's contracts generally have a term of one year or less, consist of a single performance obligation, and the performance obligations generally reflect services.
For each contract, the Bank determines the transaction price, which includes estimating variable consideration and assessing whether the price is constrained. Variable consideration is included in the transaction price to the extent that it is highly probable that a significant reversal of the amount will not occur when the uncertainty associated with the amount of variable consideration is subsequently resolved. As such, the estimate of the variable consideration is constrained until the end of the invoicing period. The uncertainty is generally resolved at the end of the reporting period and as such, no significant judgment is required when recognizing variable consideration in revenues.
The Bank's receipt of payment from customers generally occurs subsequent to the satisfaction of performance obligations or a short time thereafter. As such, the Bank has not recognized any material contract assets (unbilled receivables) or contract liabilities (deferred revenues) and there is no significant financing component associated with the consideration due to the Bank.
When another party is involved in the transfer of services to a customer, an assessment is made to evaluate whether the Bank is the principal such that revenues are reported on a gross basis or the agent such that revenues are reported on a net basis. The Bank is the principal when it controls the services in the contract promised to the customer before they are transferred. Control is demonstrated by the Bank being primarily responsible for fulfilling the transfer of the services to the customer, having discretion in establishing pricing of the services, or both.
Refer to Note 2 of the Bank's 2018 Annual Consolidated Financial Statements for additional revenue policy disclosures.
Share-based Payment
In June 2016, the IASB published amendments to IFRS 2,Share-based Payment(IFRS 2), which provide additional guidance on the classification and measurement of share-based payment transactions. The amendments clarify the accounting for cash-settled share-based payment transactions that include a performance condition, the classification of share-based payment transactions with net settlement features for withholding tax obligations, and the accounting for modifications of share-based payment transactions from cash-settled to equity-settled. The amendments to IFRS 2 are effective for annual periods beginning on or after January 1, 2018, which was November 1, 2018 for the Bank. These amendments have been applied prospectively and did not have a significant impact on the Bank.
FUTURE CHANGES IN ACCOUNTING POLICIES
The following standards have been issued but are not yet effective on the date of issuance of the Bank's Interim Consolidated Financial Statements. The Bank is currently assessing the impact of the application of these standards on the Interim Consolidated Financial Statements and will adopt these standards when they become effective.
Leases
In January 2016, the IASB issued IFRS 16,Leases (IFRS 16), which will replace IAS 17,Leases, introducing a single lessee accounting model for all leases by eliminating the distinction between operating and financing leases. IFRS 16 requires lessees to recognizeright-of-use assets and lease liabilities for most leases on the balance sheet. Lessees will also recognize depreciation expense on theright-of-use asset, interest expense on the lease liability, and a shift in the timing of expense recognition in the statement of income. Short-term leases, which are defined as those that have a lease term of twelve months or less, and leases oflow-value assets are exempt. Lessor accounting remains substantially unchanged. IFRS 16 is effective for annual periods beginning on or after January 1, 2019, which will be November 1, 2019 for the Bank. The Bank will adopt the new standard using the modified retrospective approach by recognizing the cumulative effect of any transitional impacts in opening retained earnings within the Consolidated Balance Sheet at November 1, 2019, with no restatement of the comparative periods. The Bank's IFRS 16 program is governed by a formal multi-functional enterprise-wide governance structure and project delivery plan. In support of the program, the Bank continues to analyze the full impact of this standard upon its financial statements and regulatory metrics, upgrade its lease administration and accounting systems, and develop future processes and internal controls over financial reporting.
Insurance Contracts
In May 2017, the IASB issued IFRS 17,Insurance Contracts (IFRS 17), which replaces the guidance in IFRS 4,Insurance Contractsand establishes principles for recognition, measurement, presentation, and disclosure of insurance contracts. IFRS 17 is currently effective for the Bank's annual reporting period beginning November 1, 2021. In June 2019, the IASB issued an Exposure Draft which proposes targeted amendments to IFRS 17 including, amongst other matters, a deferral of the effective date by one year. It is expected that the IASB will finalize the amendments to the standard inmid-2020. Any change to the Bank's effective date is subject to updates of OSFI's related Advisory. The Bank is currently assessing the impact of adopting this standard and the proposed amendments.
Conceptual Framework for Financial Reporting
In March 2018, the IASB issued the revised Conceptual Framework for Financial Reporting (Revised Conceptual Framework), which provides a set of concepts to assist the IASB in developing standards and to help preparers consistently apply accounting policies where specific accounting standards do not exist. The framework is not an accounting standard and does not override the requirements that exist in other IFRS standards. The Revised Conceptual Framework describes that financial information must be relevant and faithfully represented to be useful, provides revised definitions and recognition criteria for assets and liabilities, and confirms that different measurement bases are useful and permitted. The Revised Conceptual Framework is effective for annual periods beginning on or after January 1, 2020, which will be November 1, 2020 for the Bank, with early adoption permitted. The Bank is currently assessing the impact of adopting the revised framework.
| TD BANK GROUP• THIRD QUARTER 2019• REPORT TO SHAREHOLDERS | Page 44 |
Table of Contents
Business Combinations
In October 2018, the IASB issued a narrow-scope amendment to IFRS 3,Business Combinations (IFRS 3). The amendments provide additional guidance on the definition of a business which determines whether an acquisition is of a business or a group of assets. An acquirer recognizes goodwill only when acquiring a business, not when acquiring a group of assets. The amendments to IFRS 3 are effective for annual reporting periods beginning on or after January 1, 2020, which will be November 1, 2020 for the Bank, with early adoption permitted and is to be applied prospectively. The Bank will assess the impact of the amendments on future acquisitions.
Presentation of Financial Statements and Accounting Policies, Changes in Accounting Estimates and Errors
In October 2018, the IASB issued amendments to IAS 1,Presentation of Financial Statements and IAS 8,Accounting Policies, Changes in Accounting Estimates and Errors, which clarify the definition of "material". Specifically, the amendments clarify that information is material if omitting, misstating, or obscuring it could reasonably be expected to influence the decisions that the primary users of general purpose financial statements make on the basis of those financial statements. Accompanying explanations to the definition have also been improved. The amendments are effective for annual periods beginning on or after January 1, 2020, which will be November 1, 2020 for the Bank, and are to be applied prospectively with early application permitted. The Bank is currently assessing the impact of adopting these amendments.
CHANGES IN INTERNAL CONTROL OVER FINANCIAL REPORTING
During the most recent interim period, there have been no changes in the Bank's policies and procedures and other processes that comprise its internal control over financial reporting, that have materially affected, or are reasonably likely to materially affect, the Bank's internal control over financial reporting.
| TD BANK GROUP• THIRD QUARTER 2019• REPORT TO SHAREHOLDERS | Page 45 |
Table of Contents
INTERIM CONSOLIDATED FINANCIAL STATEMENTS(unaudited)
The accompanying Notes are an integral part of these Interim Consolidated Financial Statements.
Certain comparative amounts have been reclassified to conform with the presentation adopted in the current period.
| TD BANK GROUP• THIRD QUARTER 2019• REPORT TO SHAREHOLDERS | Page 46 |
Table of Contents
INTERIM CONSOLIDATED STATEMENT OF INCOME(unaudited)
| (millions of Canadian dollars, except as noted) | For the three months ended | For the nine months ended | ||||||||||||||
| July 31 2019 | July 31 2018 | July 31 2019 | July 31 2018 | |||||||||||||
Interest income1 | ||||||||||||||||
Loans | $ | 8,161 | $ | 7,184 | $ | 23,808 | $ | 20,271 | ||||||||
Securities | ||||||||||||||||
Interest | 1,921 | 1,784 | 5,995 | 4,779 | ||||||||||||
Dividends | 383 | 346 | 1,101 | 859 | ||||||||||||
Deposits with banks | 179 | 197 | 557 | 519 | ||||||||||||
| 10,644 | 9,511 | 31,461 | 26,428 | |||||||||||||
Interest expense(Note 21) | ||||||||||||||||
Deposits | 3,489 | 2,850 | 10,362 | 7,363 | ||||||||||||
Securitization liabilities | 123 | 149 | 403 | 431 | ||||||||||||
Subordinated notes and debentures | 100 | 82 | 288 | 254 | ||||||||||||
Other | 908 | 775 | 2,652 | 1,897 | ||||||||||||
| 4,620 | 3,856 | 13,705 | 9,945 | |||||||||||||
Net interest income | 6,024 | 5,655 | 17,756 | 16,483 | ||||||||||||
Non-interest income | ||||||||||||||||
Investment and securities services | 1,213 | 1,234 | 3,626 | 3,525 | ||||||||||||
Credit fees | 333 | 325 | 967 | 899 | ||||||||||||
Net securities gain (loss)(Note 5) | 23 | 41 | 47 | 77 | ||||||||||||
Trading income (loss) | 398 | 125 | 810 | 730 | ||||||||||||
Income (loss) fromnon-trading financial instruments at fair value through profit or loss | 31 | 8 | 115 | 26 | ||||||||||||
Income (loss) from financial instruments designated at fair value through profit or loss | 8 | (13 | ) | 97 | (124 | ) | ||||||||||
Service charges | 736 | 695 | 2,142 | 2,018 | ||||||||||||
Card services | 630 | 623 | 1,887 | 1,768 | ||||||||||||
Insurance revenue | 1,088 | 1,030 | 3,158 | 2,998 | ||||||||||||
Other income (loss) | 15 | 176 | 120 | 356 | ||||||||||||
| 4,475 | 4,244 | 12,969 | 12,273 | |||||||||||||
Total revenue | 10,499 | 9,899 | 30,725 | 28,756 | ||||||||||||
Provision for credit losses(Note 6) | 655 | 561 | 2,138 | 1,810 | ||||||||||||
Insurance claims and related expenses | 712 | 627 | 2,082 | 1,760 | ||||||||||||
Non-interest expenses | ||||||||||||||||
Salaries and employee benefits(Note 16) | 2,849 | 2,640 | 8,500 | 7,697 | ||||||||||||
Occupancy, including depreciation | 446 | 434 | 1,360 | 1,313 | ||||||||||||
Equipment, including depreciation | 286 | 287 | 847 | 797 | ||||||||||||
Amortization of other intangibles | 195 | 186 | 589 | 598 | ||||||||||||
Marketing and business development | 197 | 206 | 563 | 546 | ||||||||||||
Restructuring charges (recovery) | 27 | 35 | 21 | 73 | ||||||||||||
Brokerage-related andsub-advisory fees | 84 | 84 | 250 | 268 | ||||||||||||
Professional and advisory services | 296 | 300 | 943 | 787 | ||||||||||||
Other | 994 | 959 | 3,404 | 2,750 | ||||||||||||
| 5,374 | 5,131 | 16,477 | 14,829 | |||||||||||||
Income before income taxes and equity in net income of an investment in TD Ameritrade | 3,758 | 3,580 | 10,028 | 10,357 | ||||||||||||
Provision for (recovery of) income taxes | 813 | 705 | 2,089 | 2,491 | ||||||||||||
Equity in net income of an investment in TD Ameritrade(Note 7) | 303 | 230 | 891 | 508 | ||||||||||||
Net income | 3,248 | 3,105 | 8,830 | 8,374 | ||||||||||||
Preferred dividends | 62 | 59 | 184 | 163 | ||||||||||||
Net income available to common shareholders andnon-controlling interests in subsidiaries | $ | 3,186 | $ | 3,046 | $ | 8,646 | $ | 8,211 | ||||||||
Attributable to: | ||||||||||||||||
Common shareholders | $ | 3,186 | $ | 3,028 | $ | 8,628 | $ | 8,157 | ||||||||
Non-controlling interests in subsidiaries | – | 18 | 18 | 54 | ||||||||||||
Earnings per share (Canadian dollars)(Note 18) | ||||||||||||||||
Basic | $ | 1.75 | $ | 1.65 | $ | 4.72 | $ | 4.44 | ||||||||
Diluted | 1.74 | 1.65 | 4.71 | 4.43 | ||||||||||||
Dividends per common share (Canadian dollars) | 0.74 | 0.67 | 2.15 | 1.94 | ||||||||||||
| 1 | Includes $8,838 million and $26,077 million, respectively, for the three and nine months ended July 31, 2019 (three and nine months ended July 31, 2018 – $7,853 million and $22,264 million, respectively) which have been calculated based on the effective interest rate method. Refer to Note 21. |
The accompanying Notes are an integral part of these Interim Consolidated Financial Statements.
Certain comparative amounts have been recast to conform with the presentation adopted in the current period.
| TD BANK GROUP• THIRD QUARTER 2019• REPORT TO SHAREHOLDERS | Page 47 |
Table of Contents
INTERIM CONSOLIDATED STATEMENT OF COMPREHENSIVE INCOME1(unaudited)
| (millions of Canadian dollars) | For the three months ended | For the nine months ended | ||||||||||||||
| July 31 2019 | July 31 2018 | July 31 2019 | July 31 2018 | |||||||||||||
Net income | $ | 3,248 | $ | 3,105 | $ | 8,830 | $ | 8,374 | ||||||||
Other comprehensive income (loss), net of income taxes | ||||||||||||||||
Items that will be subsequently reclassified to net income | ||||||||||||||||
Net change in unrealized gains (losses) on financial assets at fair value throughother comprehensive income | ||||||||||||||||
Change in unrealized gains (losses) on debt securities at fair value throughother comprehensive income | 34 | (19 | ) | 130 | (180 | ) | ||||||||||
Reclassification to earnings of net losses (gains) in respect of debt securities at fair valuethrough other comprehensive income | (22 | ) | (1 | ) | (8 | ) | (6 | ) | ||||||||
Reclassification to earnings of changes in allowance for credit losses on debt securities atfair value through other comprehensive income | – | (16 | ) | (2 | ) | – | ||||||||||
| 12 | (36 | ) | 120 | (186 | ) | |||||||||||
Net change in unrealized foreign currency translation gains (losses) on investments in foreign operations, net of hedging activities | ||||||||||||||||
Unrealized gains (losses) on investments in foreign operations | (1,289 | ) | 838 | (62 | ) | 543 | ||||||||||
Net gains (losses) on hedges of investments in foreign operations | 452 | (182 | ) | 133 | (104 | ) | ||||||||||
| (837 | ) | 656 | 71 | 439 | ||||||||||||
Net change in gains (losses) on derivatives designated as cash flow hedges | ||||||||||||||||
Change in gains (losses) on derivatives designated as cash flow hedges | (29 | ) | 524 | 2,625 | (1,478 | ) | ||||||||||
Reclassification to earnings of losses (gains) on cash flow hedges | 1,036 | (594 | ) | 566 | (259 | ) | ||||||||||
| 1,007 | (70 | ) | 3,191 | (1,737 | ) | |||||||||||
Items that will not be subsequently reclassified to net income | ||||||||||||||||
Actuarial gains (losses) on employee benefit plans | (264 | ) | 290 | (688 | ) | 363 | ||||||||||
Change in net unrealized gains (losses) on equity securities designated at fair value throughother comprehensive income | (6 | ) | 25 | (90 | ) | 53 | ||||||||||
Change in fair value due to credit risk on financial liabilities designated at fair value throughprofit or loss | 14 | – | 2 | – | ||||||||||||
| (256 | ) | 315 | (776 | ) | 416 | |||||||||||
Total other comprehensive income (loss), net of income taxes | (74 | ) | 865 | 2,606 | (1,068 | ) | ||||||||||
Total comprehensive income (loss) | $ | 3,174 | $ | 3,970 | $ | 11,436 | $ | 7,306 | ||||||||
Attributable to: | ||||||||||||||||
Common shareholders | $ | 3,112 | $ | 3,893 | $ | 11,234 | $ | 7,089 | ||||||||
Preferred shareholders | 62 | 59 | 184 | 163 | ||||||||||||
Non-controlling interests in subsidiaries | – | 18 | 18 | 54 | ||||||||||||
| 1 | The amounts are net of income tax provisions (recoveries) presented in the following table. |
| Income Tax Provisions (Recoveries) in the Interim Consolidated Statement of Comprehensive Income | ||||||||||||||||
| (millions of Canadian dollars) | For the three months ended | For the nine months ended | ||||||||||||||
| July 31 2019 | July 31 2018 | July 31 2019 | July 31 2018 | |||||||||||||
Change in unrealized gains (losses) on debt securities at fair value throughother comprehensive income | $ | 4 | $ | (2 | ) | $ | 32 | $ | (115 | ) | ||||||
Less: Reclassification to earnings of net losses (gains) in respect of debt securities at fair value through other comprehensive income | 1 | 4 | (5 | ) | 5 | |||||||||||
Less: Reclassification to earnings of changes in allowance for credit losses on debt securitiesat fair value through other comprehensive income | – | 4 | – | – | ||||||||||||
Unrealized gains (losses) on investments in foreign operations | – | – | – | – | ||||||||||||
Net gains (losses) on hedges of investments in foreign operations | 163 | (66 | ) | 48 | (37 | ) | ||||||||||
Change in gains (losses) on derivatives designated as cash flow hedges | (102 | ) | 223 | 930 | (462 | ) | ||||||||||
Less: Reclassification to earnings of losses (gains) on cash flow hedges | (451 | ) | 246 | (193 | ) | 173 | ||||||||||
Actuarial gains (losses) on employee benefit plans | (91 | ) | 106 | (244 | ) | 150 | ||||||||||
Change in net unrealized gains (losses) on equity securities designated at fair value through other comprehensive income | (2 | ) | 9 | (33 | ) | 25 | ||||||||||
Change in fair value due to credit risk on financial liabilities designated at fair value throughprofit or loss | 5 | – | – | – | ||||||||||||
Total income taxes | $ | 427 | $ | 16 | $ | 931 | $ | (617 | ) | |||||||
The accompanying Notes are an integral part of these Interim Consolidated Financial Statements.
| TD BANK GROUP• THIRD QUARTER 2019• REPORT TO SHAREHOLDERS | Page 48 |
Table of Contents
INTERIM CONSOLIDATED STATEMENT OF CHANGES IN EQUITY(unaudited)
| (millions of Canadian dollars) | For the three months ended | For the nine months ended | ||||||||||||||
| July 31, 2019 | July 31, 2018 | July 31, 2019 | July 31, 2018 | |||||||||||||
Common shares(Note 14) | ||||||||||||||||
Balance at beginning of period | $ | 21,718 | $ | 21,203 | $ | 21,221 | $ | 20,931 | ||||||||
Proceeds from shares issued on exercise of stock options | 45 | 28 | 97 | 124 | ||||||||||||
Shares issued as a result of dividend reinvestment plan | 92 | 89 | 289 | 272 | ||||||||||||
Shares issued in connection with acquisitions(Notes 8, 14) | – | – | 366 | – | ||||||||||||
Purchase of shares for cancellationand other | (133 | ) | (221 | ) | (251 | ) | (228 | ) | ||||||||
Balance at end of period | 21,722 | 21,099 | 21,722 | 21,099 | ||||||||||||
Preferred shares(Note 14) | ||||||||||||||||
Balance at beginning of period | 5,350 | 5,100 | 5,000 | 4,750 | ||||||||||||
Issue of shares | 450 | – | 800 | 350 | ||||||||||||
Redemption of shares | – | (250 | ) | – | (250 | ) | ||||||||||
Balance at end of period | 5,800 | 4,850 | 5,800 | 4,850 | ||||||||||||
Treasury shares – common(Note 14) | ||||||||||||||||
Balance at beginning of period | (49 | ) | (108 | ) | (144 | ) | (176 | ) | ||||||||
Purchase of shares | (2,330 | ) | (2,571 | ) | (7,528 | ) | (6,161 | ) | ||||||||
Sale of shares | 2,335 | 2,511 | 7,628 | 6,169 | ||||||||||||
Balance at end of period | (44 | ) | (168 | ) | (44 | ) | (168 | ) | ||||||||
Treasury shares – preferred(Note 14) | ||||||||||||||||
Balance at beginning of period | (6 | ) | (5 | ) | (7 | ) | (7 | ) | ||||||||
Purchase of shares | (42 | ) | (24 | ) | (111 | ) | (103 | ) | ||||||||
Sale of shares | 44 | 26 | 114 | 107 | ||||||||||||
Balance at end of period | (4 | ) | (3 | ) | (4 | ) | (3 | ) | ||||||||
Contributed surplus | ||||||||||||||||
Balance at beginning of period | 162 | 194 | 193 | 214 | ||||||||||||
Net premium (discount) on sale of treasury shares | 1 | 8 | (25 | ) | (2 | ) | ||||||||||
Issuance of stock options, net of options exercised | (4 | ) | (2 | ) | (6 | ) | (11 | ) | ||||||||
Other | (2 | ) | (5 | ) | (5 | ) | (6 | ) | ||||||||
Balance at end of period | 157 | 195 | 157 | 195 | ||||||||||||
Retained earnings | ||||||||||||||||
Balance at beginning of period | 47,980 | 43,363 | 46,145 | 40,489 | ||||||||||||
Impact on adoption of IFRS 151 (Note 2) | – | n/a | 2 | (41 | ) | n/a | ||||||||||
Impact on adoption of IFRS 93 | – | – | – | 53 | ||||||||||||
Net income attributable to shareholders | 3,248 | 3,087 | 8,812 | 8,320 | ||||||||||||
Common dividends | (1,347 | ) | (1,222 | ) | (3,924 | ) | (3,563 | ) | ||||||||
Preferred dividends | (62 | ) | (59 | ) | (184 | ) | (163 | ) | ||||||||
Share issue expenses and others | (5 | ) | – | (9 | ) | (4 | ) | |||||||||
Net premium on repurchase of common shares, redemption of preferred shares, and other | (732 | ) | (1,236 | ) | (1,342 | ) | (1,273 | ) | ||||||||
Actuarial gains (losses) on employee benefit plans | (264 | ) | 290 | (688 | ) | 363 | ||||||||||
Realized gains (losses) on equity securities designated at fair value throughother comprehensive income | – | – | 49 | 1 | ||||||||||||
Balance at end of period | 48,818 | 44,223 | 48,818 | 44,223 | ||||||||||||
Accumulated other comprehensive income (loss) | ||||||||||||||||
Net unrealized gain (loss) on debt securities at fair value through other comprehensive income: | ||||||||||||||||
Balance at beginning of period | 353 | 379 | 245 | 510 | ||||||||||||
Impact on adoption of IFRS 9 | – | – | – | 19 | ||||||||||||
Other comprehensive income (loss) | 12 | (20 | ) | 122 | (186 | ) | ||||||||||
Allowance for credit losses | – | (16 | ) | (2 | ) | – | ||||||||||
Balance at end of period | 365 | 343 | 365 | 343 | ||||||||||||
Net unrealized gain (loss) on equity securities designated at fair value throughother comprehensive income: | ||||||||||||||||
Balance at beginning of period | (29 | ) | 45 | 55 | 113 | |||||||||||
Impact on adoption of IFRS 9 | – | – | – | (96 | ) | |||||||||||
Other comprehensive income (loss) | (6 | ) | 25 | (41 | ) | 54 | ||||||||||
Reclassification of loss (gain) to retained earnings | – | – | (49 | ) | (1 | ) | ||||||||||
Balance at end of period | (35 | ) | 70 | (35 | ) | 70 | ||||||||||
Change in fair value due to credit risk on financial liabilities designated at fair value throughprofit or loss: | ||||||||||||||||
Balance at beginning of period | (12 | ) | – | – | – | |||||||||||
Other comprehensive income (loss) | 14 | – | 2 | – | ||||||||||||
Balance at end of period | 2 | – | 2 | – | ||||||||||||
Net unrealized foreign currency translation gain (loss) on investments in foreign operations, net of hedging activities: | ||||||||||||||||
Balance at beginning of period | 9,734 | 7,574 | 8,826 | 7,791 | ||||||||||||
Other comprehensive income (loss) | (837 | ) | 656 | 71 | 439 | |||||||||||
Balance at end of period | 8,897 | 8,230 | 8,897 | 8,230 | ||||||||||||
Net gain (loss) on derivatives designated as cash flow hedges: | ||||||||||||||||
Balance at beginning of period | (303 | ) | (2,075 | ) | (2,487 | ) | (408 | ) | ||||||||
Other comprehensive income (loss) | 1,007 | (70 | ) | 3,191 | (1,737 | ) | ||||||||||
Balance at end of period | 704 | (2,145 | ) | 704 | (2,145 | ) | ||||||||||
Total accumulated other comprehensive income | 9,933 | 6,498 | 9,933 | 6,498 | ||||||||||||
Total shareholders' equity | 86,382 | 76,694 | 86,382 | 76,694 | ||||||||||||
Non-controlling interests in subsidiaries(Note 14) | ||||||||||||||||
Balance at beginning of period | – | 992 | 993 | 983 | ||||||||||||
Net income attributable tonon-controlling interests in subsidiaries | – | 18 | 18 | 54 | ||||||||||||
Redemption ofnon-controlling interests in subsidiaries | – | – | (1,000 | ) | – | |||||||||||
Other | – | (17 | ) | (11 | ) | (44 | ) | |||||||||
Balance at end of period | – | 993 | – | 993 | ||||||||||||
Total equity | $ | 86,382 | $ | 77,687 | $ | 86,382 | $ | 77,687 | ||||||||
1 IFRS 15,Revenue from Contracts with Customers(IFRS 15).
2 Not applicable.
3 IFRS 9,Financial Instruments(IFRS 9).
The accompanying Notes are an integral part of these Interim Consolidated Financial Statements.
| TD BANK GROUP• THIRD QUARTER 2019• REPORT TO SHAREHOLDERS | Page 49 |
Table of Contents
INTERIM CONSOLIDATED STATEMENT OF CASH FLOWS (unaudited)
| (millions of Canadian dollars) | For the three months ended | For the nine months ended | ||||||||||||||
| July 31 2019 | July 31 2018 | July 31 2019 | July 31 2018 | |||||||||||||
Cash flows from (used in) operating activities | ||||||||||||||||
Net income before income taxes, including equity in net income of an investment in TD Ameritrade | $ | 4,061 | $ | 3,810 | $ | 10,919 | $ | 10,865 | ||||||||
Adjustments to determine net cash flows from (used in) operating activities | ||||||||||||||||
Provision for credit losses(Note 6) | 655 | 561 | 2,138 | 1,810 | ||||||||||||
Depreciation | 150 | 150 | 439 | 427 | ||||||||||||
Amortization of other intangibles | 195 | 186 | 589 | 598 | ||||||||||||
Net securities losses (gains)(Note 5) | (23 | ) | (41 | ) | (47 | ) | (77 | ) | ||||||||
Equity in net income of an investment in TD Ameritrade(Note 7) | (303 | ) | (230 | ) | (891 | ) | (508 | ) | ||||||||
Deferred taxes | (3 | ) | (138 | ) | 47 | 406 | ||||||||||
Changes in operating assets and liabilities | ||||||||||||||||
Interest receivable and payable(Notes 10, 12) | (46 | ) | (71 | ) | (59 | ) | (160 | ) | ||||||||
Securities sold under repurchase agreements | 15,323 | (1,568 | ) | 29,819 | 6,018 | |||||||||||
Securities purchased under reverse repurchase agreements | (12,695 | ) | 11,895 | (35,265 | ) | 5,410 | ||||||||||
Securities sold short | (1,066 | ) | 1,949 | (4,179 | ) | 3,872 | ||||||||||
Trading loans and securities | (9,356 | ) | (10,044 | ) | (14,264 | ) | (20,229 | ) | ||||||||
Loans net of securitization and sales | (12,978 | ) | (13,757 | ) | (31,624 | ) | (33,893 | ) | ||||||||
Deposits | (21,195 | ) | 12,973 | (58,021 | ) | 33,403 | ||||||||||
Derivatives | 2,439 | 2,592 | 9,740 | 380 | ||||||||||||
Non-trading financial assets at fair value through profit or loss | (1,831 | ) | 222 | (1,927 | ) | 5,407 | ||||||||||
Financial assets and liabilities designated at fair value through profit or loss | 37,352 | 201 | 95,358 | (81 | ) | |||||||||||
Securitization liabilities | 170 | (315 | ) | (373 | ) | (1,519 | ) | |||||||||
Current taxes | 142 | 200 | (688 | ) | (901 | ) | ||||||||||
Brokers, dealers and clients amounts receivable and payable | 328 | (1,575 | ) | (748 | ) | (2,446 | ) | |||||||||
Other | 3,130 | 760 | (1,489 | ) | (4,935 | ) | ||||||||||
Net cash from (used in) operating activities | 4,449 | 7,760 | (526 | ) | 3,847 | |||||||||||
Cash flows from (used in) financing activities | ||||||||||||||||
Issuance of subordinated notes and debentures(Note 13) | 1,749 | – | 1,749 | – | ||||||||||||
Redemption or repurchase of subordinated notes and debentures | (105 | ) | (618 | ) | (82 | ) | (2,437 | ) | ||||||||
Common shares issued(Note 14) | 38 | 23 | 82 | 104 | ||||||||||||
Repurchase of common shares(Note 14) | (865 | ) | (1,457 | ) | (1,593 | ) | (1,501 | ) | ||||||||
Preferred shares issued(Note 14) | 445 | – | 791 | 346 | ||||||||||||
Preferred shares redeemed | – | (250 | ) | – | (250 | ) | ||||||||||
Sale of treasury shares(Note 14) | 2,380 | 2,545 | 7,717 | 6,274 | ||||||||||||
Purchase of treasury shares(Note 14) | (2,372 | ) | (2,595 | ) | (7,639 | ) | (6,264 | ) | ||||||||
Dividends paid | (1,317 | ) | (1,192 | ) | (3,819 | ) | (3,454 | ) | ||||||||
Redemption ofnon-controlling interests in subsidiaries(Note 14) | – | – | (1,000 | ) | – | |||||||||||
Distributions tonon-controlling interests in subsidiaries | – | (18 | ) | (11 | ) | (54 | ) | |||||||||
Net cash from (used in) financing activities | (47 | ) | (3,562 | ) | (3,805 | ) | (7,236 | ) | ||||||||
Cash flows from (used in) investing activities | ||||||||||||||||
Interest-bearing deposits with banks | (6,244 | ) | 1,809 | (3,977 | ) | 16,607 | ||||||||||
Activities in financial assets at fair value through other comprehensive income(Note 5) | ||||||||||||||||
Purchases | (5,941 | ) | (3,817 | ) | (17,292 | ) | (12,178 | ) | ||||||||
Proceeds from maturities | 12,358 | 8,314 | 28,212 | 22,434 | ||||||||||||
Proceeds from sales | 1,439 | 660 | 6,353 | 1,831 | ||||||||||||
Activities in debt securities at amortized cost(Note 5) | ||||||||||||||||
Purchases | (12,821 | ) | (15,658 | ) | (27,391 | ) | (39,502 | ) | ||||||||
Proceeds from maturities | 6,973 | 5,855 | 18,680 | 15,744 | ||||||||||||
Proceeds from sales | 1 | 127 | 1,133 | 328 | ||||||||||||
Net purchases of land, buildings, equipment, and other depreciable assets | (113 | ) | (175 | ) | (578 | ) | (326 | ) | ||||||||
Net cash acquired from (paid for) divestitures and acquisitions(Note 8) | (4 | ) | – | (540 | ) | – | ||||||||||
Net cash from (used in) investing activities | (4,352 | ) | (2,885 | ) | 4,600 | 4,938 | ||||||||||
Effect of exchange rate changes on cash and due from banks | (47 | ) | 31 | 8 | 21 | |||||||||||
Net increase (decrease) in cash and due from banks | 3 | 1,344 | 277 | 1,570 | ||||||||||||
Cash and due from banks at beginning of period | 5,009 | 4,197 | 4,735 | 3,971 | ||||||||||||
Cash and due from banks at end of period | $ | 5,012 | $ | 5,541 | $ | 5,012 | $ | 5,541 | ||||||||
Supplementary disclosure of cash flows from operating activities | ||||||||||||||||
Amount of income taxes paid (refunded) during the period | $ | 848 | $ | 614 | $ | 2,798 | $ | 3,031 | ||||||||
Amount of interest paid during the period | 4,649 | 3,838 | 13,644 | 9,863 | ||||||||||||
Amount of interest received during the period | 10,244 | 9,076 | 30,240 | 25,327 | ||||||||||||
Amount of dividends received during the period | 420 | 364 | 1,099 | 857 | ||||||||||||
The accompanying Notes are an integral part of these Interim Consolidated Financial Statements.
Certain comparative amounts have been reclassified to conform with the presentation adopted in the current period.
| TD BANK GROUP• THIRD QUARTER 2019• REPORT TO SHAREHOLDERS | Page 50 |
Table of Contents
NOTES TO INTERIM CONSOLIDATED FINANCIAL STATEMENTS(unaudited)
NOTE 1: NATURE OF OPERATIONS
CORPORATE INFORMATION
The Toronto-Dominion Bank is a bank chartered under theBank Act. The shareholders of a bank are not, as shareholders, liable for any liability, act, or default of the bank except as otherwise provided under theBank Act. The Toronto-Dominion Bank and its subsidiaries are collectively known as TD Bank Group ("TD" or the "Bank"). The Bank was formed through the amalgamation on February 1, 1955, of The Bank of Toronto (chartered in 1855) and The Dominion Bank (chartered in 1869). The Bank is incorporated and domiciled in Canada with its registered and principal business offices located at 66 Wellington Street West, Toronto, Ontario. TD serves customers in three business segments operating in a number of locations in key financial centres around the globe: Canadian Retail, U.S. Retail, and Wholesale Banking.
BASIS OF PREPARATION
The accompanying Interim Consolidated Financial Statements and accounting principles followed by the Bank have been prepared in accordance with International Financial Reporting Standards (IFRS), as issued by the International Accounting Standards Board (IASB), including the accounting requirements of the Office of the Superintendent of Financial Institutions Canada (OSFI). The Interim Consolidated Financial Statements are presented in Canadian dollars, unless otherwise indicated.
These Interim Consolidated Financial Statements were prepared on a condensed basis in accordance with International Accounting Standard 34,Interim Financial Reporting using the accounting policies as described in Note 2 of the Bank's 2018 Annual Consolidated Financial Statements except for the changes in accounting policies described in Note 2 of this report. Certain comparative amounts have been revised to conform with the presentation adopted in the current period.
The preparation of the Interim Consolidated Financial Statements requires that management make estimates, assumptions, and judgments regarding the reported amount of assets, liabilities, revenue and expenses, and disclosure of contingent assets and liabilities, as further described in Note 3 of the Bank's 2018 Annual Consolidated Financial Statements and Note 3 of this report. Accordingly, actual results may differ from estimated amounts as future confirming events occur.
The Bank's Interim Consolidated Financial Statements have been prepared using uniform accounting policies for like transactions and events in similar circumstances. All intercompany transactions, balances, and unrealized gains and losses on transactions are eliminated on consolidation.
The Interim Consolidated Financial Statements for the three and nine months ended July 31, 2019, were approved and authorized for issue by the Bank's Board of Directors, in accordance with a recommendation of the Audit Committee, on August 28, 2019.
As the Interim Consolidated Financial Statements do not include all of the disclosures normally provided in the Annual Consolidated Financial Statements, it should be read in conjunction with the Bank's 2018 Annual Consolidated Financial Statements and the accompanying Notes, and the shaded sections of the 2018 Management's Discussion and Analysis (MD&A). Certain disclosures are included in the shaded sections of the "Managing Risk" section of the MD&A in this report, as permitted by IFRS, and form an integral part of the Interim Consolidated Financial Statements. The Interim Consolidated Financial Statements were prepared under a historical cost basis, except for certain items carried at fair value as discussed in Note 2 of the Bank's 2018 Annual Consolidated Financial Statements.
NOTE 2: CURRENT AND FUTURE CHANGES IN ACCOUNTING POLICIES
CURRENT CHANGES IN ACCOUNTING POLICY
The following new standards have been adopted by the Bank on November 1, 2018.
Revenue from Contracts with Customers
On November 1, 2018, the Bank adopted IFRS 15,Revenue from Contracts with Customers(IFRS 15), which establishes the principles for recognizing revenue and cash flows arising from contracts with customers and prescribes the application of a five-step recognition and measurement model. The standard excludes from its scope, revenue arising from items such as financial instruments, insurance contracts, and leases. The Bank adopted the standard on a modified retrospective basis, recognizing the cumulative effect of initially applying the standard as an adjustment to opening retained earnings without restating comparative period financial information.
The adoption of IFRS 15 resulted in a reduction to Shareholders' Equity of $41 million related to certain expenses not eligible for deferral under IFRS 15. The presentation of certain revenue and expense items is changed due to IFRS 15 and reclassified prospectively. These presentation changes are not significant and do not have an impact on net income.
In addition to the above changes related to the adoption of IFRS 15, the Bank also changed its accounting policy on securities lending and borrowing transactions. Where securities are received or pledged as collateral, securities lending income and securities borrowing fees are recorded inNon-interest income andNon-interest expenses, respectively, on the Interim Consolidated Statement of Income. This change has been applied retrospectively.
Revenue Recognition
Revenue is recognized at an amount that reflects the consideration the Bank expects to be entitled to in exchange for transferring services to a customer, excluding amounts collected on behalf of third parties. The Bank recognizes revenue when it transfers control of a good or a service to a customer at a point in time or over time. The determination of when performance obligations are satisfied requires the use of judgment. Refer to Note 3 for further details.
The Bank identifies contracts with customers subject to IFRS 15, which create enforceable rights and obligations. The Bank determines the performance obligations based on distinct services promised to the customers in the contracts. The Bank's contracts generally have a term of one year or less, consist of a single performance obligation, and the performance obligations generally reflect services.
For each contract, the Bank determines the transaction price, which includes estimating variable consideration and assessing whether the price is constrained. Variable consideration is included in the transaction price to the extent that it is highly probable that a significant reversal of the amount will not occur when the uncertainty associated with the amount of variable consideration is subsequently resolved. As such, the estimate of the variable consideration is constrained until
| TD BANK GROUP• THIRD QUARTER 2019• REPORT TO SHAREHOLDERS | Page 51 |
Table of Contents
the end of the invoicing period. The uncertainty is generally resolved at the end of the reporting period and as such, no significant judgment is required when recognizing variable consideration in revenues.
The Bank's receipt of payment from customers generally occurs subsequent to the satisfaction of performance obligations or a short time thereafter. As such, the Bank has not recognized any material contract assets (unbilled receivables) or contract liabilities (deferred revenues) and there is no significant financing component associated with the consideration due to the Bank.
When another party is involved in the transfer of services to a customer, an assessment is made to evaluate whether the Bank is the principal such that revenues are reported on a gross basis or the agent such that revenues are reported on a net basis. The Bank is the principal when it controls the services in the contract promised to the customer before they are transferred. Control is demonstrated by the Bank being primarily responsible for fulfilling the transfer of the services to the customer, having discretion in establishing pricing of the services, or both.
Refer to Note 2 of the Bank's 2018 Annual Consolidated Financial Statements for additional revenue policy disclosures.
Share-based Payment
In June 2016, the IASB published amendments to IFRS 2,Share-based Payment(IFRS 2), which provide additional guidance on the classification and measurement of share-based payment transactions. The amendments clarify the accounting for cash-settled share-based payment transactions that include a performance condition, the classification of share-based payment transactions with net settlement features for withholding tax obligations, and the accounting for modifications of share-based payment transactions from cash-settled to equity-settled. The amendments to IFRS 2 are effective for annual periods beginning on or after January 1, 2018, which was November 1, 2018 for the Bank. These amendments have been applied prospectively and did not have a significant impact on the Bank.
FUTURE CHANGES IN ACCOUNTING POLICIES
The following standards have been issued but are not yet effective on the date of issuance of the Bank's Interim Consolidated Financial Statements. The Bank is currently assessing the impact of the application of these standards on the Interim Consolidated Financial Statements and will adopt these standards when they become effective.
Leases
In January 2016, the IASB issued IFRS 16,Leases (IFRS 16), which will replace IAS 17,Leases, introducing a single lessee accounting model for all leases by eliminating the distinction between operating and financing leases. IFRS 16 requires lessees to recognizeright-of-use assets and lease liabilities for most leases on the balance sheet. Lessees will also recognize depreciation expense on theright-of-use asset, interest expense on the lease liability, and a shift in the timing of expense recognition in the statement of income. Short-term leases, which are defined as those that have a lease term of twelve months or less, and leases oflow-value assets are exempt. Lessor accounting remains substantially unchanged. IFRS 16 is effective for annual periods beginning on or after January 1, 2019, which will be November 1, 2019 for the Bank. The Bank will adopt the new standard using the modified retrospective approach by recognizing the cumulative effect of any transitional impacts in opening retained earnings within the Consolidated Balance Sheet at November 1, 2019, with no restatement of the comparative periods. The Bank's IFRS 16 program is governed by a formal multi-functional enterprise-wide governance structure and project delivery plan. In support of the program, the Bank continues to analyze the full impact of this standard upon its financial statements and regulatory metrics, upgrade its lease administration and accounting systems, and develop future processes and internal controls over financial reporting.
Insurance Contracts
In May 2017, the IASB issued IFRS 17,Insurance Contracts (IFRS 17), which replaces the guidance in IFRS 4,Insurance Contractsand establishes principles for recognition, measurement, presentation, and disclosure of insurance contracts. IFRS 17 is currently effective for the Bank's annual reporting period beginning November 1, 2021. In June 2019, the IASB issued an Exposure Draft which proposes targeted amendments to IFRS 17 including, amongst other matters, a deferral of the effective date by one year. It is expected that the IASB will finalize the amendments to the standard in mid-2020. Any change to the Bank's effective date is subject to updates of OSFI's related Advisory. The Bank is currently assessing the impact of adopting this standard and the proposed amendments.
Conceptual Framework for Financial Reporting
In March 2018, the IASB issued the revised Conceptual Framework for Financial Reporting (Revised Conceptual Framework), which provides a set of concepts to assist the IASB in developing standards and to help preparers consistently apply accounting policies where specific accounting standards do not exist. The framework is not an accounting standard and does not override the requirements that exist in other IFRS standards. The Revised Conceptual Framework describes that financial information must be relevant and faithfully represented to be useful, provides revised definitions and recognition criteria for assets and liabilities, and confirms that different measurement bases are useful and permitted. The Revised Conceptual Framework is effective for annual periods beginning on or after January 1, 2020, which will be November 1, 2020 for the Bank, with early adoption permitted. The Bank is currently assessing the impact of adopting the revised framework.
Business Combinations
In October 2018, the IASB issued a narrow-scope amendment to IFRS 3,Business Combinations (IFRS 3). The amendments provide additional guidance on the definition of a business which determines whether an acquisition is of a business or a group of assets. An acquirer recognizes goodwill only when acquiring a business, not when acquiring a group of assets. The amendments to IFRS 3 are effective for annual reporting periods beginning on or after January 1, 2020, which will be November 1, 2020 for the Bank, with early adoption permitted and is to be applied prospectively. The Bank will assess the impact of the amendments on future acquisitions.
Presentation of Financial Statements and Accounting Policies, Changes in Accounting Estimates and Errors
In October 2018, the IASB issued amendments to IAS 1,Presentation of Financial Statements and IAS 8,Accounting Policies, Changes in Accounting Estimates and Errors, which clarify the definition of "material". Specifically, the amendments clarify that information is material if omitting, misstating, or obscuring it could reasonably be expected to influence the decisions that the primary users of general purpose financial statements make on the basis of those financial statements. Accompanying explanations to the definition have also been improved. The amendments are effective for annual periods beginning on or after January 1, 2020, which will be November 1, 2020 for the Bank, and are to be applied prospectively with early application permitted. The Bank is currently assessing the impact of adopting these amendments.
| TD BANK GROUP• THIRD QUARTER 2019• REPORT TO SHAREHOLDERS | Page 52 |
Table of Contents
NOTE 3: SIGNIFICANT ACCOUNTING JUDGMENTS, ESTIMATES, AND ASSUMPTIONS
The estimates used in the Bank's accounting policies are essential to understanding its results of operations and financial condition. Some of the Bank's policies require subjective, complex judgments and estimates as they relate to matters that are inherently uncertain. Changes in these judgments or estimates and changes to accounting standards and policies could have a materially adverse impact on the Bank's Interim Consolidated Financial Statements. The Bank has established procedures to ensure that accounting policies are applied consistently and that the processes for changing methodologies, determining estimates, and adopting new accounting standards are well-controlled and occur in an appropriate and systematic manner. Refer to Note 3 of the Bank's 2018 Annual Consolidated Financial Statements for a description of significant accounting judgments, estimates, and assumptions, in addition to those described below.
Revenue from Contracts with Customers
The Bank applies judgment to determine the timing of satisfaction of performance obligations which affects the timing of revenue recognition, by evaluating the pattern in which the Bank transfers control of services promised to the customer. A performance obligation is satisfied over time when the customer simultaneously receives and consumes the benefits as the Bank performs the service. For performance obligations satisfied over time, revenue is generally recognized using the time-elapsed method which is based on time elapsed in proportion to the period over which the service is provided, for example, personal deposit account bundle fees. The time-elapsed method is a faithful depiction of the transfer of control for these services as control is transferred evenly to the customer when the Bank provides a stand-ready service or effort is expended evenly by the Bank to provide a service over the contract period. In contracts where the Bank has a right to consideration from a customer in an amount that corresponds directly with the value to the customer of the Bank's performance completed to date, the Bank recognizes revenue in the amount to which it has a right to invoice.
The Bank satisfies a performance obligation at a point in time if the customer obtains control of the promised services at that date. Determining when control is transferred requires the use of judgment. For transaction-based services, the Bank determines that control is transferred to the customer at a point in time when the customer obtains substantially all of the benefits from the service rendered and the Bank has a present right to payment, which generally coincides with the moment the transaction is executed.
The Bank exercises judgment in determining whether costs incurred in connection with acquiring new revenue contracts would meet the requirement to be capitalized as incremental costs to obtain or fulfil a contract with customers.
NOTE 4: FAIR VALUE MEASUREMENTS
There have been no significant changes to the Bank's approach and methodologies used to determine fair value measurements during the three and nine months ended July 31, 2019. Refer to Note 5 of the Bank's 2018 Annual Consolidated Financial Statements for a description of the valuation techniques and inputs used in the fair value measurement of the Bank's financial instruments.
Carrying Value and Fair Value of Financial Instruments not carried at Fair Value
The fair values in the following table exclude assets that are not financial instruments, such as land, buildings, and equipment, as well as goodwill and other intangible assets, including customer relationships, which are of significant value to the Bank.
Financial Assets and Liabilities not carried at Fair Value1
| (millions of Canadian dollars) | As at | |||||||||||||||
| July 31, 2019 | October 31, 2018 | |||||||||||||||
| Carrying value | Fair value | Carrying value | Fair value | |||||||||||||
FINANCIAL ASSETS | ||||||||||||||||
Debt securities at amortized cost, net of allowance for credit losses | ||||||||||||||||
Government and government-related securities | $ | 67,973 | $ | 68,112 | $ | 60,535 | $ | 59,948 | ||||||||
Other debt securities | 48,417 | 48,563 | 46,636 | 46,316 | ||||||||||||
Total debt securities at amortized cost, net of allowance for credit losses | 116,390 | 116,675 | 107,171 | 106,264 | ||||||||||||
Total loans, net of allowance for loan losses | 675,932 | 678,698 | 646,393 | 642,542 | ||||||||||||
Total financial assets not carried at fair value | $ | 792,322 | $ | 795,373 | $ | 753,564 | $ | 748,806 | ||||||||
FINANCIAL LIABILITIES | ||||||||||||||||
Deposits | $ | 870,326 | $ | 874,269 | $ | 851,439 | $ | 846,148 | ||||||||
Securitization liabilities at amortized cost | 14,179 | 14,347 | 14,683 | 14,654 | ||||||||||||
Subordinated notes and debentures | 10,596 | 11,192 | 8,740 | 9,027 | ||||||||||||
Total financial liabilities not carried at fair value | $ | 895,101 | $ | 899,808 | $ | 874,862 | $ | 869,829 | ||||||||
| 1 | This table excludes financial assets and liabilities where the carrying amount is a reasonable approximation of fair value. |
Fair Value Hierarchy and Valuation of Assets and Liabilities Classified as Level 3
IFRS requires disclosure of a three-level hierarchy for fair value measurements based upon the observability of inputs to the valuation of an asset or liability as of the measurement date. Refer to Note 5 of the Bank's 2018 Annual Consolidated Financial Statements for a description of the three levels.
There have been no significant changes to the valuation techniques, unobservable inputs, and sensitivities during the three and nine months ended July 31, 2019. The significant valuation techniques and significant unobservable inputs used in the fair value measurements of Level 3 financial assets and financial liabilities are described and quantified within the "Valuation of Assets and Liabilities Classified as Level 3" section in Note 5 of the Bank's 2018 Annual Consolidated Financial Statements.
| TD BANK GROUP• THIRD QUARTER 2019• REPORT TO SHAREHOLDERS | Page 53 |
Table of Contents
The following table presents the levels within the fair value hierarchy for each of the assets and liabilities measured at fair value on a recurring basis as at July 31, 2019 and October 31, 2018.
Fair Value Hierarchy for Assets and Liabilities Measured at Fair Value on a Recurring Basis |
| |||||||||||||||||||||||||||||||
(millions of Canadian dollars) | As at | |||||||||||||||||||||||||||||||
| July 31, 2019 | October 31, 2018 | |||||||||||||||||||||||||||||||
| Level 1 | Level 2 | Level 3 | Total | 1 | Level 1 | Level 2 | Level 3 | Total | 1 | |||||||||||||||||||||||
FINANCIAL ASSETS AND COMMODITIES | ||||||||||||||||||||||||||||||||
Trading loans, securities, and other2 | ||||||||||||||||||||||||||||||||
Government and government-related securities | ||||||||||||||||||||||||||||||||
Canadian government debt | ||||||||||||||||||||||||||||||||
Federal | $ | 607 | $ | 8,394 | $ | – | $ | 9,001 | $ | 127 | $ | 14,335 | $ | – | $ | 14,462 | ||||||||||||||||
Provinces | – | 7,037 | – | 7,037 | – | 7,535 | 3 | 7,538 | ||||||||||||||||||||||||
U.S. federal, state, municipal governments, and agencies debt | – | 15,440 | – | 15,440 | – | 19,732 | – | 19,732 | ||||||||||||||||||||||||
Other OECD government guaranteed debt | – | 5,355 | – | 5,355 | – | 3,324 | – | 3,324 | ||||||||||||||||||||||||
Mortgage-backed securities | – | 1,866 | – | 1,866 | – | 2,029 | – | 2,029 | ||||||||||||||||||||||||
Other debt securities | ||||||||||||||||||||||||||||||||
Canadian issuers | – | 5,361 | 1 | 5,362 | – | 5,630 | 1 | 5,631 | ||||||||||||||||||||||||
Other issuers | – | 14,933 | 4 | 14,937 | – | 14,459 | 16 | 14,475 | ||||||||||||||||||||||||
Equity securities | ||||||||||||||||||||||||||||||||
Common shares | 56,566 | 19 | – | 56,585 | 43,699 | 53 | – | 43,752 | ||||||||||||||||||||||||
Preferred shares | 30 | – | – | 30 | 33 | 26 | – | 59 | ||||||||||||||||||||||||
Trading loans | – | 11,848 | – | 11,848 | – | 10,990 | – | 10,990 | ||||||||||||||||||||||||
Commodities | 14,361 | 318 | – | 14,679 | 5,540 | 340 | – | 5,880 | ||||||||||||||||||||||||
Retained interests | – | 21 | – | 21 | – | 25 | – | 25 | ||||||||||||||||||||||||
| 71,564 | 70,592 | 5 | 142,161 | 49,399 | 78,478 | 20 | 127,897 | |||||||||||||||||||||||||
Non-trading financial assets at fair value through profit or loss | ||||||||||||||||||||||||||||||||
Securities | 192 | 3,245 | 519 | 3,956 | 176 | 2,095 | 408 | 2,679 | ||||||||||||||||||||||||
Loans | – | 2,072 | 5 | 2,077 | – | 1,317 | 19 | 1,336 | ||||||||||||||||||||||||
| 192 | 5,317 | 524 | 6,033 | 176 | 3,412 | 427 | 4,015 | |||||||||||||||||||||||||
Derivatives | ||||||||||||||||||||||||||||||||
Interest rate contracts | 20 | 12,900 | – | 12,920 | 33 | 12,365 | – | 12,398 | ||||||||||||||||||||||||
Foreign exchange contracts | 34 | 36,244 | 2 | 36,280 | 24 | 39,647 | 4 | 39,675 | ||||||||||||||||||||||||
Credit contracts | – | 27 | – | 27 | – | 9 | – | 9 | ||||||||||||||||||||||||
Equity contracts | 1 | 1,388 | 521 | 1,910 | – | 3,170 | 453 | 3,623 | ||||||||||||||||||||||||
Commodity contracts | 229 | 1,175 | 14 | 1,418 | 144 | 1,112 | 35 | 1,291 | ||||||||||||||||||||||||
| 284 | 51,734 | 537 | 52,555 | 201 | 56,303 | 492 | 56,996 | |||||||||||||||||||||||||
Financial assets designated at fair value through profit or loss | ||||||||||||||||||||||||||||||||
Securities2 | – | 4,018 | – | 4,018 | – | 3,618 | – | 3,618 | ||||||||||||||||||||||||
| – | 4,018 | – | 4,018 | – | 3,618 | – | 3,618 | |||||||||||||||||||||||||
Financial assets at fair value through other comprehensive income | ||||||||||||||||||||||||||||||||
Government and government-related securities | ||||||||||||||||||||||||||||||||
Canadian government debt | ||||||||||||||||||||||||||||||||
Federal | – | 10,129 | – | 10,129 | – | 12,731 | – | 12,731 | ||||||||||||||||||||||||
Provinces | – | 12,401 | – | 12,401 | – | 9,507 | – | 9,507 | ||||||||||||||||||||||||
U.S. federal, state, municipal governments, and agencies debt | – | 43,381 | – | 43,381 | – | 45,766 | – | 45,766 | ||||||||||||||||||||||||
Other OECD government guaranteed debt | – | 16,359 | – | 16,359 | – | 19,896 | 200 | 20,096 | ||||||||||||||||||||||||
Mortgage-backed securities | – | 5,726 | – | 5,726 | – | 6,633 | – | 6,633 | ||||||||||||||||||||||||
Other debt securities | ||||||||||||||||||||||||||||||||
Asset-backed securities | – | 17,086 | – | 17,086 | – | 21,407 | 562 | 21,969 | ||||||||||||||||||||||||
Non-agency collateralized mortgage obligation portfolio | – | 277 | – | 277 | – | 472 | – | 472 | ||||||||||||||||||||||||
Corporate and other debt | – | 7,636 | 23 | 7,659 | – | 8,483 | 24 | 8,507 | ||||||||||||||||||||||||
Equity securities | ||||||||||||||||||||||||||||||||
Common shares | 88 | 2 | 1,506 | 1,596 | 309 | 3 | 1,492 | 1,804 | ||||||||||||||||||||||||
Preferred shares | 203 | – | 46 | 249 | 235 | – | 135 | 370 | ||||||||||||||||||||||||
Loans | – | 1,837 | – | 1,837 | – | 2,745 | – | 2,745 | ||||||||||||||||||||||||
| 291 | 114,834 | 1,575 | 116,700 | 544 | 127,643 | 2,413 | 130,600 | |||||||||||||||||||||||||
Securities purchased under reverse repurchase agreements | – | 2,860 | – | 2,860 | – | 3,920 | – | 3,920 | ||||||||||||||||||||||||
FINANCIAL LIABILITIES | ||||||||||||||||||||||||||||||||
Trading deposits | – | 33,977 | 3,819 | 37,796 | – | 111,680 | 3,024 | 114,704 | ||||||||||||||||||||||||
Derivatives | ||||||||||||||||||||||||||||||||
Interest rate contracts | 14 | 12,534 | 86 | 12,634 | 24 | 9,646 | 63 | 9,733 | ||||||||||||||||||||||||
Foreign exchange contracts | 47 | 35,558 | 2 | 35,607 | 18 | 34,897 | 3 | 34,918 | ||||||||||||||||||||||||
Credit contracts | – | 406 | – | 406 | – | 386 | – | 386 | ||||||||||||||||||||||||
Equity contracts | – | 2,314 | 1,314 | 3,628 | – | 1,319 | 1,077 | 2,396 | ||||||||||||||||||||||||
Commodity contracts | 205 | 1,069 | 20 | 1,294 | 134 | 695 | 8 | 837 | ||||||||||||||||||||||||
| 266 | 51,881 | 1,422 | 53,569 | 176 | 46,943 | 1,151 | 48,270 | |||||||||||||||||||||||||
Securitization liabilities at fair value | – | 12,749 | – | 12,749 | – | 12,618 | – | 12,618 | ||||||||||||||||||||||||
Financial liabilities designated at fair value through profit or loss | – | 95,744 | 30 | 95,774 | – | 2 | 14 | 16 | ||||||||||||||||||||||||
Obligations related to securities sold short2 | 1,915 | 33,384 | – | 35,299 | 1,142 | 38,336 | – | 39,478 | ||||||||||||||||||||||||
Obligations related to securities sold under repurchase agreements | – | 1,447 | – | 1,447 | – | 3,797 | – | 3,797 | ||||||||||||||||||||||||
| 1 | Fair value is the same as carrying value. |
| 2 | Balances reflect the reduction of securities owned (long positions) by the amount of identical securities sold but not yet purchased (short positions). |
| TD BANK GROUP• THIRD QUARTER 2019• REPORT TO SHAREHOLDERS | Page 54 |
Table of Contents
The Bank's policy is to record transfers of assets and liabilities between the different levels of the fair value hierarchy using the fair values as at the end of each reporting period. Assets are transferred between Level 1 and Level 2 depending on if there is sufficient frequency and volume in an active market.
There were no significant transfers between Level 1 and Level 2 during the three and nine months ended July 31, 2019 and July 31, 2018.
Movements of Level 3 instruments
Significant transfers into and out of Level 3 occur mainly due to the following reasons:
| • | Transfers from Level 3 to Level 2 occur when techniques used for valuing the instrument incorporate significant observable market inputs or broker-dealer quotes which were previously not observable. |
| • | Transfers from Level 2 to Level 3 occur when an instrument's fair value, which was previously determined using valuation techniques with significant observable market inputs, is now determined using valuation techniques with significantnon-observable inputs. |
Due to the unobservable nature of the inputs used to value Level 3 financial instruments, there may be uncertainty about the valuation of these instruments. The fair value of Level 3 instruments may be drawn from a range of reasonably possible alternatives. In determining the appropriate levels for these unobservable inputs, parameters are chosen so that they are consistent with prevailing market evidence and management judgment.
| TD BANK GROUP• THIRD QUARTER 2019• REPORT TO SHAREHOLDERS | Page 55 |
Table of Contents
The following tables reconcile changes in fair value of all assets and liabilities measured at fair value using significant Level 3non-observable inputs for the three and nine months ended July 31.
| Reconciliation of Changes in Fair Value for Level 3 Assets and Liabilities | ||||||||||||||||||||||||||||||||||||||||
| (millions of Canadian dollars) | Fair May 1 | Total realized and unrealized gains (losses) | Movements | Transfers | Fair value July 31 | Change in instruments | ||||||||||||||||||||||||||||||||||
| Included in income1 | Included in OCI2,3 | Purchases | Issuances | Other4 | Into Level 3 | Out of Level 3 | ||||||||||||||||||||||||||||||||||
FINANCIAL ASSETS | ||||||||||||||||||||||||||||||||||||||||
Trading loans, securities, and other | ||||||||||||||||||||||||||||||||||||||||
Government and government- | ||||||||||||||||||||||||||||||||||||||||
Canadian government debt | ||||||||||||||||||||||||||||||||||||||||
Provinces | $ | 46 | $ | – | $ | – | $ | – | $ | – | $ | (46 | ) | $ | – | $ | – | $ | – | $ | – | |||||||||||||||||||
Other debt securities | ||||||||||||||||||||||||||||||||||||||||
Canadian issuers | 2 | – | – | 1 | – | (2 | ) | 1 | (1 | ) | 1 | – | ||||||||||||||||||||||||||||
Other issuers | 18 | – | – | 2 | – | (4 | ) | – | (12 | ) | 4 | – | ||||||||||||||||||||||||||||
| 66 | – | – | 3 | – | (52 | ) | 1 | (13 | ) | 5 | – | |||||||||||||||||||||||||||||
Non-trading financialassets at fair valuethrough profit or loss | ||||||||||||||||||||||||||||||||||||||||
Securities | 447 | 24 | (1 | ) | 75 | – | (26 | ) | – | – | 519 | 11 | ||||||||||||||||||||||||||||
Loans | 20 | 3 | – | 3 | – | (21 | ) | – | – | 5 | – | |||||||||||||||||||||||||||||
| 467 | 27 | (1 | ) | 78 | – | (47 | ) | – | – | 524 | 11 | |||||||||||||||||||||||||||||
Financial assets at fair value through other comprehensive income | ||||||||||||||||||||||||||||||||||||||||
Government and government- | ||||||||||||||||||||||||||||||||||||||||
Other OECD government guaranteed debt | – | – | – | – | – | – | – | – | – | – | ||||||||||||||||||||||||||||||
Other debt securities | ||||||||||||||||||||||||||||||||||||||||
Asset-backed securities | – | – | – | – | – | – | – | – | – | – | ||||||||||||||||||||||||||||||
Corporate and other debt | 23 | – | – | – | – | – | – | – | 23 | �� | – | |||||||||||||||||||||||||||||
Equity securities | ||||||||||||||||||||||||||||||||||||||||
Common shares | 1,532 | – | (1 | ) | 5 | – | (30 | ) | – | – | 1,506 | (1 | ) | |||||||||||||||||||||||||||
Preferred shares | 50 | – | (4 | ) | – | – | – | – | – | 46 | (4 | ) | ||||||||||||||||||||||||||||
| $ | 1,605 | $ | – | $ | (5 | ) | $ | 5 | $ | – | $ | (30 | ) | $ | – | $ | – | $ | 1,575 | $ | (5 | ) | ||||||||||||||||||
Fair May 1 | Total realized and unrealized losses (gains) | Movements | Transfers | Fair July 31 2019 | Change in instruments | |||||||||||||||||||||||||||||||||||
| Included in income1 | Included in OCI3 | Purchases | Issuances | Other4 | Into Level 3 | Out of Level 3 | ||||||||||||||||||||||||||||||||||
FINANCIAL LIABILITIES | ||||||||||||||||||||||||||||||||||||||||
Trading deposits6 | $ | 3,679 | $ | (11 | ) | $ | – | $ | (117 | ) | $ | 552 | $ | (284 | ) | $ | – | $ | – | $ | 3,819 | $ | (36 | ) | ||||||||||||||||
Derivatives7 | ||||||||||||||||||||||||||||||||||||||||
Interest rate contracts | 77 | 4 | – | – | – | 5 | – | – | 86 | 7 | ||||||||||||||||||||||||||||||
Foreign exchange contracts | 2 | 1 | – | – | – | – | – | (3 | ) | – | 1 | |||||||||||||||||||||||||||||
Equity contracts | 825 | 24 | – | (17 | ) | 41 | (80 | ) | – | – | 793 | 24 | ||||||||||||||||||||||||||||
Commodity contracts | (15 | ) | 21 | – | – | �� | – | – | – | – | 6 | 17 | ||||||||||||||||||||||||||||
| 889 | 50 | – | (17 | ) | 41 | (75 | ) | – | (3 | ) | 885 | 49 | ||||||||||||||||||||||||||||
Financial liabilities designatedat fair valuethrough profit or loss | 13 | (26 | ) | – | – | 59 | (16 | ) | – | – | 30 | (13 | ) | |||||||||||||||||||||||||||
Obligations related to securitiessold short | – | – | – | – | – | – | – | – | – | – | ||||||||||||||||||||||||||||||
| 1 | Gains (losses) on financial assets and liabilities are recognized in Net securities gains (losses), Trading income (loss), and Other income (loss) on the Interim Consolidated Statement of Income. |
| 2 | Other comprehensive income. |
| 3 | Includes realized gains (losses) transferred to retained earnings on disposal of equities designated at fair value through other comprehensive income (FVOCI). Refer to Note 5 for further details. |
| 4 | Consists of sales, settlements, and foreign exchange. |
| 5 | Changes in unrealized gains (losses) on financial assets at FVOCI are recognized in accumulated other comprehensive income (AOCI). |
| 6 | Issuances and repurchases of trading deposits are reported on a gross basis. |
| 7 | As at July 31, 2019, consists of derivative assets of $0.5 billion (May 1, 2019 – $0.6 billion) and derivative liabilities of $1.4 billion (May 1, 2019 – $1.5 billion), which have been netted on this table for presentation purposes only. |
| TD BANK GROUP• THIRD QUARTER 2019• REPORT TO SHAREHOLDERS | Page 56 |
Table of Contents
| Reconciliation of Changes in Fair Value for Level 3 Assets and Liabilities | ||||||||||||||||||||||||||||||||||||||||
| (millions of Canadian dollars) | Fair value as at November 1 2018 | Total realized and unrealized gains (losses) | Movements | Transfers | Fair value as at | Change in unrealized gains (losses) on instruments still held4 | ||||||||||||||||||||||||||||||||||
| Included in income1 | Included in OCI2 | Purchases | Issuances | Other3 | Into Level 3 | Out of Level 3 | ||||||||||||||||||||||||||||||||||
FINANCIAL ASSETS | ||||||||||||||||||||||||||||||||||||||||
Trading loans, securities, and other | ||||||||||||||||||||||||||||||||||||||||
Government andgovernment- | ||||||||||||||||||||||||||||||||||||||||
Canadian government debt | ||||||||||||||||||||||||||||||||||||||||
Provinces | $ | 3 | $ | – | $ | – | $ | – | $ | – | $ | (50 | ) | $ | 47 | $ | – | $ | – | $ | – | |||||||||||||||||||
Other debt securities | ||||||||||||||||||||||||||||||||||||||||
Canadian issuers | 1 | – | – | 1 | – | (2 | ) | 2 | (1 | ) | 1 | – | ||||||||||||||||||||||||||||
Other issuers | 16 | 1 | – | 2 | – | (20 | ) | 19 | (14 | ) | 4 | – | ||||||||||||||||||||||||||||
| 20 | 1 | – | 3 | – | (72 | ) | 68 | (15 | ) | 5 | – | |||||||||||||||||||||||||||||
Non-trading financial assets at fair value through profit or loss | ||||||||||||||||||||||||||||||||||||||||
Securities | 408 | 82 | 1 | 234 | – | (206 | ) | – | – | 519 | 17 | |||||||||||||||||||||||||||||
Loans | 19 | 4 | – | 5 | – | (23 | ) | – | – | 5 | 1 | |||||||||||||||||||||||||||||
| 427 | 86 | 1 | 239 | – | (229 | ) | – | – | 524 | 18 | ||||||||||||||||||||||||||||||
Financial assets at fair value through other comprehensive income | ||||||||||||||||||||||||||||||||||||||||
Government andgovernment- | ||||||||||||||||||||||||||||||||||||||||
Other OECD government guaranteed debt | 200 | 24 | – | – | – | (224 | ) | – | – | – | – | |||||||||||||||||||||||||||||
Other debt securities | ||||||||||||||||||||||||||||||||||||||||
Asset-backed securities | 562 | – | – | – | – | – | – | (562 | ) | – | – | |||||||||||||||||||||||||||||
Corporate and other debt | 24 | – | (1 | ) | – | – | – | – | – | 23 | (1 | ) | ||||||||||||||||||||||||||||
Equity securities | ||||||||||||||||||||||||||||||||||||||||
Common shares | 1,492 | – | (1 | ) | 23 | – | (8 | ) | – | – | 1,506 | (2 | ) | |||||||||||||||||||||||||||
Preferred shares | 135 | – | (14 | ) | 1 | – | (75 | ) | – | (1 | ) | 46 | (21 | ) | ||||||||||||||||||||||||||
| $ | 2,413 | $ | 24 | $ | (16 | ) | $ | 24 | $ | – | $ | (307 | ) | $ | – | $ | (563 | ) | $ | 1,575 | $ | (24 | ) | |||||||||||||||||
| Fair value as at November 1 2018 | Total realized and unrealized losses (gains) | Movements | Transfers | Fair value as at July 31 2019 | Change in unrealized losses (gains) on instruments still held4 | |||||||||||||||||||||||||||||||||||
| Included in income1 | Included in OCI2 | Purchases | Issuances | Other3 | Into Level 3 | Out of Level 3 | ||||||||||||||||||||||||||||||||||
FINANCIAL LIABILITIES | ||||||||||||||||||||||||||||||||||||||||
Trading deposits5 | $ | 3,024 | $ | 275 | $ | – | $ | (350 | ) | $ | 1,321 | $ | (451 | ) | $ | – | $ | – | $ | 3,819 | $ | 185 | ||||||||||||||||||
Derivatives6 | ||||||||||||||||||||||||||||||||||||||||
Interest rate contracts | 63 | 20 | – | – | – | 3 | – | – | 86 | 22 | ||||||||||||||||||||||||||||||
Foreign exchange contracts | (1 | ) | 2 | – | – | – | (2 | ) | 4 | (3 | ) | – | 2 | |||||||||||||||||||||||||||
Equity contracts | 624 | 319 | – | (58 | ) | 155 | (247 | ) | – | – | 793 | 304 | ||||||||||||||||||||||||||||
Commodity contracts | (27 | ) | 25 | – | – | – | 8 | – | – | 6 | 14 | |||||||||||||||||||||||||||||
| 659 | 366 | – | (58 | ) | 155 | (238 | ) | 4 | (3 | ) | 885 | 342 | ||||||||||||||||||||||||||||
Financial liabilities designated at fair value through profit or loss | 14 | (66 | ) | – | – | 108 | (26 | ) | – | – | 30 | (43 | ) | |||||||||||||||||||||||||||
Obligations related to securities sold short | – | – | – | – | – | – | – | – | – | – | ||||||||||||||||||||||||||||||
| 1 | Gains (losses) on financial assets and liabilities are recognized in Net securities gains (losses), Trading income (loss), and Other income (loss) on the Interim Consolidated Statement of Income. |
| 2 | Includes realized gains (losses) transferred to retained earnings on disposal of equities designated at FVOCI. Refer to Note 5 for further details. |
| 3 | Consists of sales, settlements, and foreign exchange. |
| 4 | Changes in unrealized gains (losses) on financial assets at FVOCI are recognized in AOCI. |
| 5 | Issuances and repurchases of trading deposits are reported on a gross basis. |
| 6 | As at July 31, 2019, consists of derivative assets of $0.5 billion (November 1, 2018 – $0.5 billion) and derivative liabilities of $1.4 billion (November 1, 2018 – $1.2 billion), which have been netted on this table for presentation purposes only. |
| TD BANK GROUP• THIRD QUARTER 2019• REPORT TO SHAREHOLDERS | Page 57 |
Table of Contents
| Reconciliation of Changes in Fair Value for Level 3 Assets and Liabilities | ||||||||||||||||||||||||||||||||||||||||
| (millions of Canadian dollars) | Fair value as at May 1 2018 | Total realized and unrealized gains (losses) | Movements | Transfers | Fair value as at July 31 2018 | Change in instruments | ||||||||||||||||||||||||||||||||||
| Included in income1 | Included in OCI2 | Purchases | Issuances | Other3 | Into Level 3 | Out of Level 3 | ||||||||||||||||||||||||||||||||||
FINANCIAL ASSETS | ||||||||||||||||||||||||||||||||||||||||
Trading loans, securities, and other | ||||||||||||||||||||||||||||||||||||||||
Government and government- | ||||||||||||||||||||||||||||||||||||||||
Canadian government debt | ||||||||||||||||||||||||||||||||||||||||
Provinces | $ | – | $ | – | $ | – | $ | 1 | $ | – | $ | – | $ | – | $ | – | $ | 1 | $ | – | ||||||||||||||||||||
Other debt securities | ||||||||||||||||||||||||||||||||||||||||
Canadian issuers | 1 | – | – | – | – | – | – | – | 1 | – | ||||||||||||||||||||||||||||||
Other issuers | 149 | – | – | 35 | – | (16 | ) | 26 | (127 | ) | 67 | – | ||||||||||||||||||||||||||||
| 150 | – | – | 36 | – | (16 | ) | 26 | (127 | ) | 69 | – | |||||||||||||||||||||||||||||
Non-trading financialassets at fair valuethrough profit or loss | ||||||||||||||||||||||||||||||||||||||||
Securities | 356 | 9 | – | 15 | – | (7 | ) | – | – | 373 | 7 | |||||||||||||||||||||||||||||
Loans | 19 | – | – | 1 | – | – | – | – | 20 | – | ||||||||||||||||||||||||||||||
| 375 | 9 | – | 16 | – | (7 | ) | – | – | 393 | 7 | ||||||||||||||||||||||||||||||
Financial assets at fair valuethrough other comprehensive income | ||||||||||||||||||||||||||||||||||||||||
Government and government- | ||||||||||||||||||||||||||||||||||||||||
Other OECD governmentguaranteed debt | 204 | 6 | (9 | ) | – | – | – | – | – | 201 | (9 | ) | ||||||||||||||||||||||||||||
Other debt securities | ||||||||||||||||||||||||||||||||||||||||
Asset-backed securities | 549 | – | (1 | ) | – | – | 8 | – | – | 556 | (1 | ) | ||||||||||||||||||||||||||||
Corporate and other debt | 103 | 5 | (3 | ) | – | – | (24 | ) | – | – | 81 | (3 | ) | |||||||||||||||||||||||||||
Equity securities | ||||||||||||||||||||||||||||||||||||||||
Common shares | 1,455 | – | (2 | ) | 5 | – | 15 | – | – | 1,473 | (2 | ) | ||||||||||||||||||||||||||||
Preferred shares | 130 | – | 6 | – | – | – | – | – | 136 | 6 | ||||||||||||||||||||||||||||||
| $ | 2,441 | $ | 11 | $ | (9 | ) | $ | 5 | $ | – | $ | (1 | ) | $ | – | $ | – | $ | 2,447 | $ | (9 | ) | ||||||||||||||||||
Fair value as at May 1 2018 | Total realized and unrealized losses (gains) | Movements | Transfers | Fair value as at July 31 2018 | Change in instruments | |||||||||||||||||||||||||||||||||||
| Included in income1 | Included in OCI2 | Purchases | Issuances | Other3 | Into Level 3 | Out of Level 3 | ||||||||||||||||||||||||||||||||||
FINANCIAL LIABILITIES | ||||||||||||||||||||||||||||||||||||||||
Trading deposits5 | $ | 2,940 | $ | 86 | $ | – | $ | (112 | ) | $ | 321 | $ | (137 | ) | $ | – | $ | (48 | ) | $ | 3,050 | $ | 72 | |||||||||||||||||
Derivatives6 | ||||||||||||||||||||||||||||||||||||||||
Interest rate contracts | 69 | (6 | ) | – | – | – | 4 | – | – | 67 | (4 | ) | ||||||||||||||||||||||||||||
Foreign exchange contracts | (1 | ) | 1 | – | – | – | 3 | (1 | ) | 1 | 3 | 2 | ||||||||||||||||||||||||||||
Equity contracts | 711 | 87 | – | (16 | ) | 48 | (26 | ) | – | 2 | 806 | 82 | ||||||||||||||||||||||||||||
Commodity contracts | (23 | ) | | (16 | ) | – | – | – | 8 | – | – | (31 | ) | | (14 | ) | ||||||||||||||||||||||||
| 756 | 66 | – | (16 | ) | 48 | (11 | ) | (1 | ) | 3 | 845 | 66 | ||||||||||||||||||||||||||||
Financial liabilities designatedat fair valuethrough profit or loss | 16 | (9 | ) | – | – | 34 | (19 | ) | – | – | 22 | (5 | ) | |||||||||||||||||||||||||||
Obligations related to securitiessold short | 4 | – | – | – | – | (4 | ) | – | – | – | – | |||||||||||||||||||||||||||||
| 1 | Gains (losses) on financial assets and liabilities are recognized in Net securities gains (losses), Trading income (loss), and Other income (loss) on the Interim Consolidated Statement of Income. |
| 2 | Includes realized gains (losses) transferred to retained earnings on disposal of equities designated at FVOCI. Refer to Note 5 for further details. |
| 3 | Consists of sales, settlements, and foreign exchange. |
| 4 | Changes in unrealized gains (losses) on financial assets at FVOCI are recognized in AOCI. |
| 5 | Issuances and repurchases of trading deposits are reported on a gross basis. |
| 6 | As at July 31, 2018, consists of derivative assets of $0.7 billion (May 1, 2018 – $0.7 billion) and derivative liabilities of $1.5 billion (May 1, 2018 – $1.4 billion), which have been netted on this table for presentation purposes only. |
| TD BANK GROUP• THIRD QUARTER 2019• REPORT TO SHAREHOLDERS | Page 58 |
Table of Contents
| Reconciliation of Changes in Fair Value for Level 3 Assets and Liabilities | ||||||||||||||||||||||||||||||||||||||||
| (millions of Canadian dollars) | Fair value as at November 1 | Total realized and unrealized gains (losses) | Movements | Transfers | Fair value as at July 31 | Change in (losses) on instruments | ||||||||||||||||||||||||||||||||||
| Included in income1 | Included in OCI2 | Purchases | Issuances | Other3 | Into Level 3 | Out of Level 3 | ||||||||||||||||||||||||||||||||||
FINANCIAL ASSETS | ||||||||||||||||||||||||||||||||||||||||
Trading loans, securities, and other | ||||||||||||||||||||||||||||||||||||||||
Government and government-related securities | ||||||||||||||||||||||||||||||||||||||||
Canadian government debtProvinces | $ | – | $ | – | $ | – | $ | 1 | $ | – | $ | – | $ | – | $ | – | $ | 1 | $ | – | ||||||||||||||||||||
Other debt securities | ||||||||||||||||||||||||||||||||||||||||
Canadian issuers | 6 | – | – | – | – | (4 | ) | 1 | (2 | ) | 1 | (1 | ) | |||||||||||||||||||||||||||
Other issuers | 8 | (2 | ) | – | 37 | – | (12 | ) | 171 | (135 | ) | 67 | (1 | ) | ||||||||||||||||||||||||||
| 14 | (2 | ) | – | 38 | – | (16 | ) | 172 | (137 | ) | 69 | (2 | ) | |||||||||||||||||||||||||||
Non-trading financialassets at fair valuethrough profit or loss | ||||||||||||||||||||||||||||||||||||||||
Securities | 305 | 34 | – | 42 | – | (8 | ) | – | – | 373 | 28 | |||||||||||||||||||||||||||||
Loans | 15 | (2 | ) | – | 7 | – | – | – | – | 20 | (2 | ) | ||||||||||||||||||||||||||||
| 320 | 32 | – | 49 | – | (8 | ) | – | – | 393 | 26 | ||||||||||||||||||||||||||||||
Financial assets at fair valuethrough other comprehensive income | ||||||||||||||||||||||||||||||||||||||||
Government and government-related securities | ||||||||||||||||||||||||||||||||||||||||
Other OECD governmentguaranteed debt | 203 | 9 | (11 | ) | – | – | – | – | – | 201 | (11 | ) | ||||||||||||||||||||||||||||
Other debt securities | ||||||||||||||||||||||||||||||||||||||||
Asset-backed securities | 553 | – | (2 | ) | – | – | 5 | – | – | 556 | (2 | ) | ||||||||||||||||||||||||||||
Corporate and other debt | 95 | 9 | 3 | – | – | (26 | ) | – | – | 81 | 3 | |||||||||||||||||||||||||||||
Equity securities | ||||||||||||||||||||||||||||||||||||||||
Common shares | 1,469 | – | (4 | ) | 12 | – | (4 | ) | – | – | 1,473 | (6 | ) | |||||||||||||||||||||||||||
Preferred shares | 108 | – | 27 | – | – | 1 | – | – | 136 | 27 | ||||||||||||||||||||||||||||||
| $ | 2,428 | $ | 18 | $ | 13 | $ | 12 | $ | – | $ | (24 | ) | $ | – | $ | – | $ | 2,447 | $ | 11 | ||||||||||||||||||||
Fair value as at November 1 | Total realized and unrealized losses (gains) | Movements | Transfers | Fair July 31 | Change in (gains) on instruments | |||||||||||||||||||||||||||||||||||
| Included in income1 | Included in OCI2 | Purchases | Issuances | Other3 | Into Level 3 | Out of Level 3 | ||||||||||||||||||||||||||||||||||
FINANCIAL LIABILITIES | ||||||||||||||||||||||||||||||||||||||||
Trading deposits5 | $ | 2,521 | $ | 78 | $ | – | $ | (321 | ) | $ | 1,421 | $ | (587 | ) | $ | 4 | $ | (66 | ) | $ | 3,050 | $ | 41 | |||||||||||||||||
Derivatives6 | ||||||||||||||||||||||||||||||||||||||||
Interest rate contracts | 70 | (6 | ) | – | – | – | 3 | – | – | 67 | (6 | ) | ||||||||||||||||||||||||||||
Foreign exchange contracts | (1 | ) | 1 | – | – | – | 3 | (1 | ) | 1 | 3 | 2 | ||||||||||||||||||||||||||||
Equity contracts | 893 | 17 | – | (63 | ) | 150 | (195 | ) | – | 4 | 806 | 16 | ||||||||||||||||||||||||||||
Commodity contracts | (2 | ) | | (41 | ) | – | – | – | 12 | – | – | (31 | ) | (30 | ) | |||||||||||||||||||||||||
| 960 | (29 | ) | – | (63 | ) | 150 | (177 | ) | (1 | ) | 5 | 845 | (18 | ) | ||||||||||||||||||||||||||
Financial liabilities designatedat fair value through profit or loss | 7 | 9 | – | – | 94 | (88 | ) | – | – | 22 | 6 | |||||||||||||||||||||||||||||
Obligations related to securities sold short | – | – | – | – | – | (4 | ) | 4 | – | – | – | |||||||||||||||||||||||||||||
| 1 | Gains (losses) on financial assets and liabilities are recognized in Net securities gains (losses), Trading income (loss), and Other income (loss) on the Interim Consolidated Statement of Income. |
| 2 | Includes realized gains (losses) transferred to retained earnings on disposal of equities designated at FVOCI. Refer to Note 5 for further details. |
| 3 | Consists of sales, settlements, and foreign exchange. |
| 4 | Changes in unrealized gains (losses) on financial assets at FVOCI are recognized in AOCI. |
| 5 | Issuances and repurchases of trading deposits are reported on a gross basis. |
| 6 | As at July 31, 2018, consists of derivative assets of $0.7 billion (November 1, 2017 – $0.9 billion) and derivative liabilities of $1.5 billion (November 1, 2017 – $1.9 billion), which have been netted on this table for presentation purposes only. |
| TD BANK GROUP• THIRD QUARTER 2019• REPORT TO SHAREHOLDERS | Page 59 |
Table of Contents
NOTE 5: SECURITIES
Unrealized Securities Gains (Losses)
The following table summarizes the unrealized gains and losses as at July 31, 2019 and October 31, 2018.
| Unrealized Gains (Losses) for Securities at Fair Value Through Other Comprehensive Income | ||||||||||||||||||||||||||||||||
| (millions of Canadian dollars) | As at | |||||||||||||||||||||||||||||||
| July 31, 2019 | October 31, 2018 | |||||||||||||||||||||||||||||||
| Cost/ amortized cost1 | Gross unrealized gains | Gross unrealized (losses) | Fair value | Cost/ amortized cost1 | Gross unrealized gains | Gross unrealized (losses) | Fair value | |||||||||||||||||||||||||
Securities at Fair Value Through Other Comprehensive Income | ||||||||||||||||||||||||||||||||
Government and government-relatedsecurities | ||||||||||||||||||||||||||||||||
Canadian government debt | ||||||||||||||||||||||||||||||||
Federal | �� | $ | 10,073 | $ | 57 | $ | (1 | ) | $ | 10,129 | $ | 12,740 | $ | 38 | $ | (47 | ) | $ | 12,731 | |||||||||||||
Provinces | 12,319 | 95 | (13 | ) | 12,401 | 9,443 | 75 | (11 | ) | 9,507 | ||||||||||||||||||||||
U.S. federal, state, municipal governments, andagencies debt | 43,356 | 97 | (72 | ) | 43,381 | 45,857 | 265 | (356 | ) | 45,766 | ||||||||||||||||||||||
Other OECD government guaranteed debt | 16,335 | 31 | (7 | ) | 16,359 | 20,034 | 65 | (3 | ) | 20,096 | ||||||||||||||||||||||
Mortgage-backed securities | 5,687 | 40 | (1 | ) | 5,726 | 6,575 | 59 | (1 | ) | 6,633 | ||||||||||||||||||||||
| 87,770 | 320 | (94 | ) | 87,996 | 94,649 | 502 | (418 | ) | 94,733 | |||||||||||||||||||||||
Other debt securities | ||||||||||||||||||||||||||||||||
Asset-backed securities | 17,068 | 43 | (25 | ) | 17,086 | 21,901 | 87 | (19 | ) | 21,969 | ||||||||||||||||||||||
Non-agency collateralized mortgage obligationportfolio | 277 | – | – | 277 | 471 | 1 | – | 472 | ||||||||||||||||||||||||
Corporate and other debt | 7,645 | 40 | (26 | ) | 7,659 | 8,534 | 31 | (58 | ) | 8,507 | ||||||||||||||||||||||
| 24,990 | 83 | (51 | ) | 25,022 | 30,906 | 119 | (77 | ) | 30,948 | |||||||||||||||||||||||
Total debt securities | 112,760 | 403 | (145 | ) | 113,018 | 125,555 | 621 | (495 | ) | 125,681 | ||||||||||||||||||||||
Equity securities | ||||||||||||||||||||||||||||||||
Common shares | 1,592 | 31 | (27 | ) | 1,596 | 1,725 | 118 | (39 | ) | 1,804 | ||||||||||||||||||||||
Preferred shares | 303 | 4 | (58 | ) | 249 | 376 | 20 | (26 | ) | 370 | ||||||||||||||||||||||
| 1,895 | 35 | (85 | ) | 1,845 | 2,101 | 138 | (65 | ) | 2,174 | |||||||||||||||||||||||
Total securities at fair value throughother comprehensive income | $ | 114,655 | $ | 438 | $ | (230 | ) | $ | 114,863 | $ | 127,656 | $ | 759 | $ | (560 | ) | $ | 127,855 | ||||||||||||||
| 1 | Includes the foreign exchange translation of amortized cost balances at theperiod-end spot rate. |
Equity Securities Designated at Fair Value Through Other Comprehensive Income
The Bank designated certain equity securities shown in the following table as equity securities at FVOCI. The designation was made because the investments are held for purposes other than trading.
| Equity Securities Designated at Fair Value Through Other Comprehensive Income | ||||||||||||||||||||||||||||
| (millions of Canadian dollars) | As at | For the three months ended | For the nine months ended | |||||||||||||||||||||||||
| July 31, 2019 | October 31, 2018 | July 31, 2019 | July 31, 2018 | July 31, 2019 | July 31, 2018 | |||||||||||||||||||||||
| Fair value | Dividend income recognized | Dividend income recognized | ||||||||||||||||||||||||||
Common shares | $ | 1,596 | $ | 1,804 | $ | 12 | $ | 20 | $ | 52 | $ | 53 | ||||||||||||||||
Preferred shares | 249 | 370 | 4 | 4 | 11 | 12 | ||||||||||||||||||||||
Total | $ | 1,845 | $ | 2,174 | $ | 16 | $ | 24 | $ | 63 | $ | 65 | ||||||||||||||||
The Bank disposed of certain equity securities in line with the Bank's investment strategy with a fair value of $4 million and $316 million during the three and nine months ended July 31, 2019, respectively (three and nine months ended July 31, 2018 – $3 million and $17 million, respectively). The Bank realized a cumulative gain (loss) of $(1) million and $67 million during the three and nine months ended July 31, 2019, respectively (three and nine months ended July 31, 2018 – $1 million and $3 million, respectively) on disposal of these equity securities and recognized dividend income of nil and $3 million during the three and nine months ended July 31, 2019, respectively (three and nine months ended July 31, 2018 – nil).
| Net Securities Gains (Losses) | ||||||||||||||||
| (millions of Canadian dollars) | For the three months ended | For the nine months ended | ||||||||||||||
July 31 2019 | July 31 2018 | July 31 2019 | July 31 2018 | |||||||||||||
Debt securities at amortized cost | ||||||||||||||||
Net realized gains (losses) | $ | 1 | $ | 25 | $ | 45 | $ | 55 | ||||||||
Debt securities at fair value through other comprehensive income | ||||||||||||||||
Net realized gains (losses) | 22 | 16 | 2 | 22 | ||||||||||||
Total | $ | 23 | $ | 41 | $ | 47 | $ | 77 | ||||||||
| TD BANK GROUP• THIRD QUARTER 2019• REPORT TO SHAREHOLDERS | Page 60 |
Table of Contents
Credit Quality of Debt Securities
The Bank evaluatesnon-retail credit risk on an individual borrower basis, using both a borrower risk rating and facility risk rating, as detailed in the shaded area of the "Managing Risk" section of the 2018 MD&A. This system is used to assess allnon-retail exposures, including debt securities.
The following table provides the gross carrying amounts of debt securities measured at amortized cost and debt securities at FVOCI by internal risk ratings for credit risk management purposes, presenting separately those debt securities that are subject to Stage 1, Stage 2, and Stage 3 allowances.
Debt Securities by Risk Ratings
| (millions of Canadian dollars) | As at | |||||||||||||||||||||||||||||||
| July 31, 2019 | October 31, 2018 | |||||||||||||||||||||||||||||||
| Stage 1 | Stage 2 | Stage 3 | Total | Stage 1 | Stage 2 | Stage 3 | Total | |||||||||||||||||||||||||
Debt securities | ||||||||||||||||||||||||||||||||
Investment grade | $ | 227,236 | $ | – | $ | n/a | $ | 227,236 | $ | 230,488 | $ | – | $ | n/a | $ | 230,488 | ||||||||||||||||
Non-Investment grade | 2,157 | 16 | n/a | 2,173 | 2,140 | 54 | n/a | 2,194 | ||||||||||||||||||||||||
Watch and classified | – | – | – | – | – | 11 | – | 11 | ||||||||||||||||||||||||
Default | n/a | n/a | – | – | n/a | n/a | 234 | 234 | ||||||||||||||||||||||||
Total debt securities | 229,393 | 16 | – | 229,409 | 232,628 | 65 | 234 | 232,927 | ||||||||||||||||||||||||
Allowance for credit losses on debt securities at amortized cost | 1 | – | – | 1 | 1 | 4 | 70 | 75 | ||||||||||||||||||||||||
Debt securities, net of allowance | $ | 229,392 | $ | 16 | $ | – | $ | 229,408 | $ | 232,627 | $ | 61 | $ | 164 | $ | 232,852 | ||||||||||||||||
As at July 31, 2019, the allowance for credit losses on debt securities was $4 million (October 31, 2018 – $80 million), comprised of $1 million (October 31, 2018 – $75 million) for debt securities at amortized cost (DSAC) and $3 million (October 31, 2018 – $5 million) for debt securities at FVOCI. For both the three and nine months ended July 31, 2019, the Bank reported a provision (recovery) for credit losses of nil (three and nine months ended July 31, 2018 – provision (recovery) of credit losses of nil and $(2) million, respectively) on DSAC. For the three and nine months ended July 31, 2019, the Bank reported a provision (recovery) of credit losses of nil and $(2) million, respectively (three and nine months ended July 31, 2018 – provision (recovery) for credit losses of $(9) million and $11 million, respectively) on debt securities at FVOCI.
| TD BANK GROUP• THIRD QUARTER 2019• REPORT TO SHAREHOLDERS | Page 61 |
Table of Contents
NOTE 6: LOANS, IMPAIRED LOANS, AND ALLOWANCE FOR CREDIT LOSSES
The following tables provide the gross carrying amounts of loans and credit risk exposures on loan commitments and financial guarantee contracts by internal risk ratings for credit risk management purposes, presenting separately those that are subject to Stage 1, Stage 2, and Stage 3 allowances.
Loans by Risk Ratings1
(millions of Canadian dollars) | As at | |||||||||||||||||||||||||||||||
| July 31, 2019 | October 31, 2018 | |||||||||||||||||||||||||||||||
| Stage 1 | Stage 2 | Stage 3 | Total | Stage 1 | Stage 2 | Stage 3 | Total | |||||||||||||||||||||||||
Residential mortgages2,3,4 | ||||||||||||||||||||||||||||||||
Low Risk | $ | 179,288 | $ | 52 | $ | n/a | $ | 179,340 | $ | 168,690 | $ | 32 | $ | n/a | $ | 168,722 | ||||||||||||||||
Normal Risk | 42,285 | 247 | n/a | 42,532 | 47,821 | 176 | n/a | 47,997 | ||||||||||||||||||||||||
Medium Risk | 5,821 | 447 | n/a | 6,268 | 5,106 | 267 | n/a | 5,373 | ||||||||||||||||||||||||
High Risk | 935 | 1,419 | 237 | 2,591 | 892 | 1,264 | 317 | 2,473 | ||||||||||||||||||||||||
Default | n/a | n/a | 618 | 618 | n/a | n/a | 626 | 626 | ||||||||||||||||||||||||
Total | 228,329 | 2,165 | 855 | 231,349 | 222,509 | 1,739 | 943 | 225,191 | ||||||||||||||||||||||||
Allowance for loan losses | 29 | 30 | 53 | 112 | 24 | 34 | 52 | 110 | ||||||||||||||||||||||||
Loans, net of allowance | 228,300 | 2,135 | 802 | 231,237 | 222,485 | 1,705 | 891 | 225,081 | ||||||||||||||||||||||||
Consumer instalment and other personal5 | ||||||||||||||||||||||||||||||||
Low Risk | 92,519 | 906 | n/a | 93,425 | 87,906 | 983 | n/a | 88,889 | ||||||||||||||||||||||||
Normal Risk | 45,483 | 1,215 | n/a | 46,698 | 48,008 | 1,190 | n/a | 49,198 | ||||||||||||||||||||||||
Medium Risk | 26,828 | 1,012 | n/a | 27,840 | 23,008 | 1,063 | n/a | 24,071 | ||||||||||||||||||||||||
High Risk | 6,719 | 2,484 | 583 | 9,786 | 6,158 | 2,386 | 817 | 9,361 | ||||||||||||||||||||||||
Default | n/a | n/a | 473 | 473 | n/a | n/a | 560 | 560 | ||||||||||||||||||||||||
Total | 171,549 | 5,617 | 1,056 | 178,222 | 165,080 | 5,622 | 1,377 | 172,079 | ||||||||||||||||||||||||
Allowance for loan losses | 647 | 368 | 159 | 1,174 | 574 | 349 | 180 | 1,103 | ||||||||||||||||||||||||
Loans, net of allowance | 170,902 | 5,249 | 897 | 177,048 | 164,506 | 5,273 | 1,197 | 170,976 | ||||||||||||||||||||||||
Credit card | ||||||||||||||||||||||||||||||||
Low Risk | 6,956 | 6 | n/a | 6,962 | 7,234 | 11 | n/a | 7,245 | ||||||||||||||||||||||||
Normal Risk | 10,925 | 83 | n/a | 11,008 | 9,780 | 66 | n/a | 9,846 | ||||||||||||||||||||||||
Medium Risk | 11,508 | 275 | n/a | 11,783 | 11,347 | 246 | n/a | 11,593 | ||||||||||||||||||||||||
High Risk | 4,874 | 1,699 | 303 | 6,876 | 4,435 | 1,445 | 333 | 6,213 | ||||||||||||||||||||||||
Default | n/a | n/a | 127 | 127 | n/a | n/a | 121 | 121 | ||||||||||||||||||||||||
Total | 34,263 | 2,063 | 430 | 36,756 | 32,796 | 1,768 | 454 | 35,018 | ||||||||||||||||||||||||
Allowance for loan losses | 409 | 309 | 313 | 1,031 | 379 | 283 | 341 | 1,003 | ||||||||||||||||||||||||
Loans, net of allowance | 33,854 | 1,754 | 117 | 35,725 | 32,417 | 1,485 | 113 | 34,015 | ||||||||||||||||||||||||
Business and government2,3,4,6 | ||||||||||||||||||||||||||||||||
Investment grade or Low/Normal Risk | 121,934 | 193 | n/a | 122,127 | 118,414 | 57 | n/a | 118,471 | ||||||||||||||||||||||||
Non-Investment grade or Medium Risk | 117,231 | 4,781 | n/a | 122,012 | 108,678 | 5,272 | n/a | 113,950 | ||||||||||||||||||||||||
Watch and classified or High Risk | 747 | 4,600 | 118 | 5,465 | 666 | 3,746 | 97 | 4,509 | ||||||||||||||||||||||||
Default | n/a | n/a | 826 | 826 | n/a | n/a | 736 | 736 | ||||||||||||||||||||||||
Total | 239,912 | 9,574 | 944 | 250,430 | 227,758 | 9,075 | 833 | 237,666 | ||||||||||||||||||||||||
Allowance for loan losses | 632 | 623 | 197 | 1,452 | 651 | 551 | 131 | 1,333 | ||||||||||||||||||||||||
Loans, net of allowance | 239,280 | 8,951 | 747 | 248,978 | 227,107 | 8,524 | 702 | 236,333 | ||||||||||||||||||||||||
Total loans6,7 | 674,053 | 19,419 | 3,285 | 696,757 | 648,143 | 18,204 | 3,607 | 669,954 | ||||||||||||||||||||||||
Total allowance for loan losses7 | 1,717 | 1,330 | 722 | 3,769 | 1,628 | 1,217 | 704 | 3,549 | ||||||||||||||||||||||||
Total loans, net of allowance6,7 | $ | 672,336 | $ | 18,089 | $ | 2,563 | $ | 692,988 | $ | 646,515 | $ | 16,987 | $ | 2,903 | $ | 666,405 | ||||||||||||||||
| 1 | Certain comparative amounts have been reclassified to conform with presentation adopted in the current period. |
| 2 | As at July 31, 2019, impaired loans with a balance of $163 million (October 31, 2018 – $124 million) did not have a related allowance for loan losses. An allowance was not required for these loans as the balance relates to loans where the realizable value of the collateral exceeded the loan amount. |
| 3 | As at July 31, 2019, excludes trading loans andnon-trading loans at fair value through profit or loss with a fair value of $12 billion (October 31, 2018 – $11 billion) and $2 billion (October 31, 2018 – $1 billion), respectively. |
| 4 | As at July 31, 2019, includes insured mortgages of $90 billion (October 31, 2018 – $95 billion). |
| 5 | As at July 31, 2019, includes Canadian government-insured real estate personal loans of $13 billion (October 31, 2018 – $14 billion). |
| 6 | As at July 31, 2019, includes loans that are measured at FVOCI of $2 billion (October 31, 2018 – $3 billion) and customers' liability under acceptances of $15 billion (October 31, 2018 – $17 billion). |
| 7 | As at July 31, 2019, Stage 3 includes acquired credit-impaired (ACI) loans of $340 million (October 31, 2018 – $453 million) and a related allowance for loan losses of $14 million (October 31, 2018 – $18 million), which have been included in the "Default" risk rating category as they were impaired at acquisition. |
| TD BANK GROUP• THIRD QUARTER 2019• REPORT TO SHAREHOLDERS | Page 62 |
Table of Contents
| Loans by Risk Ratings –Off-Balance Sheet Credit Instruments1,2 | ||||||||||||||||||||||||||||||||
| (millions of Canadian dollars) | As at | |||||||||||||||||||||||||||||||
| July 31, 2019 | October 31, 2018 | |||||||||||||||||||||||||||||||
| Stage 1 | Stage 2 | Stage 3 | Total | Stage 1 | Stage 2 | Stage 3 | Total | |||||||||||||||||||||||||
Retail Exposures3 | ||||||||||||||||||||||||||||||||
Low Risk | $ | 229,898 | $ | 734 | $ | n/a | $ | 230,632 | $ | 236,456 | $ | 1,007 | $ | n/a | $ | 237,463 | ||||||||||||||||
Normal Risk | 62,385 | 627 | n/a | 63,012 | 50,116 | 654 | n/a | 50,770 | ||||||||||||||||||||||||
Medium Risk | 12,314 | 286 | n/a | 12,600 | 12,005 | 349 | n/a | 12,354 | ||||||||||||||||||||||||
High Risk | 1,762 | 838 | – | 2,600 | 1,423 | 986 | – | 2,409 | ||||||||||||||||||||||||
Default | n/a | n/a | – | – | n/a | n/a | – | – | ||||||||||||||||||||||||
Non-Retail Exposures4 | ||||||||||||||||||||||||||||||||
Investment grade | 175,431 | – | n/a | 175,431 | 166,769 | – | n/a | 166,769 | ||||||||||||||||||||||||
Non-Investment grade | 64,640 | 3,080 | n/a | 67,720 | 61,763 | 1,957 | n/a | 63,720 | ||||||||||||||||||||||||
Watch and classified | 2 | 2,081 | – | 2,083 | – | 2,004 | – | 2,004 | ||||||||||||||||||||||||
Default | n/a | n/a | 101 | 101 | n/a | n/a | 96 | 96 | ||||||||||||||||||||||||
Totaloff-balance sheet credit instruments | 546,432 | 7,646 | 101 | 554,179 | 528,532 | 6,957 | 96 | 535,585 | ||||||||||||||||||||||||
Allowance foroff-balance sheet credit instruments | 608 | 470 | 7 | 1,085 | 550 | 477 | 2 | 1,029 | ||||||||||||||||||||||||
Totaloff-balance sheet credit instruments, net of allowance | $ | 545,824 | $ | 7,176 | $ | 94 | $ | 553,094 | $ | 527,982 | $ | 6,480 | $ | 94 | $ | 534,556 | ||||||||||||||||
| 1 | Certain comparative amounts have been recast to conform with the presentation adopted in the current period. |
| 2 | Exclude mortgage commitments. |
| 3 | As at July 31, 2019, includes $308 billion (October 31, 2018 – $302 billion) of personal lines of credit and credit card lines, which are unconditionally cancellable at the Bank's discretion at any time. |
| 4 | As at July 31, 2019, includes $39 billion (October 31, 2018 – $37 billion) of the undrawn component of uncommitted credit and liquidity facilities. |
| TD BANK GROUP• THIRD QUARTER 2019• REPORT TO SHAREHOLDERS | Page 63 |
Table of Contents
The changes to the Bank's allowance for loan losses, as at and for the three and nine months ended July 31 are shown in the following tables.
(millions of Canadian dollars) | For the three months ended | |||||||||||||||||||||||||||||||
July 31, 2019 | July 31, 2018 | |||||||||||||||||||||||||||||||
| Stage 1 | Stage 2 | Stage 3 | 2 | Total | Stage 1 | Stage 2 | Stage 3 | 2 | Total | |||||||||||||||||||||||
Residential Mortgages | ||||||||||||||||||||||||||||||||
Balance at beginning of period | $ | 27 | $ | 32 | $ | 51 | $ | 110 | $ | 23 | $ | 24 | $ | 48 | $ | 95 | ||||||||||||||||
Provision for credit losses | ||||||||||||||||||||||||||||||||
Transfer to Stage 13 | 10 | (9 | ) | (1 | ) | – | 6 | (6 | ) | – | – | |||||||||||||||||||||
Transfer to Stage 2 | (2 | ) | 4 | (2 | ) | – | (1 | ) | 2 | (1 | ) | – | ||||||||||||||||||||
Transfer to Stage 3 | (1 | ) | (2 | ) | 3 | – | – | (2 | ) | 2 | – | |||||||||||||||||||||
Net remeasurement due to transfers4 | (5 | ) | 2 | – | (3 | ) | (3 | ) | 1 | – | (2 | ) | ||||||||||||||||||||
New originations or purchases5 | 4 | n/a | n/a | 4 | 4 | n/a | n/a | 4 | ||||||||||||||||||||||||
Net repayments6 | – | – | – | – | – | – | (1 | ) | (1 | ) | ||||||||||||||||||||||
Derecognition of financial assets (excluding disposals and write-offs)7 | (2 | ) | (2 | ) | (5 | ) | (9 | ) | (2 | ) | – | (2 | ) | (4 | ) | |||||||||||||||||
Changes to risk, parameters, and models8 | (2 | ) | 5 | 15 | 18 | (3 | ) | 6 | 8 | 11 | ||||||||||||||||||||||
Disposals | – | – | – | – | – | – | – | – | ||||||||||||||||||||||||
Write-offs | – | – | (10 | ) | (10 | ) | – | – | (8 | ) | (8 | ) | ||||||||||||||||||||
Recoveries | – | – | 1 | 1 | – | – | – | – | ||||||||||||||||||||||||
| Foreign exchange and other adjustments | – | – | 1 | 1 | – | 1 | – | 1 | ||||||||||||||||||||||||
| Balance at end of period | $ | 29 | $ | 30 | $ | 53 | $ | 112 | $ | 24 | $ | 26 | $ | 46 | $ | 96 | ||||||||||||||||
Consumer Instalment and Other Personal | ||||||||||||||||||||||||||||||||
Balance, includingoff-balance sheet instruments, at beginning of period | $ | 647 | $ | 401 | $ | 181 | $ | 1,229 | $ | 572 | $ | 382 | $ | 174 | $ | 1,128 | ||||||||||||||||
Provision for credit losses | ||||||||||||||||||||||||||||||||
Transfer to Stage 13 | 99 | (94 | ) | (5 | ) | – | 80 | (74 | ) | (6 | ) | – | ||||||||||||||||||||
Transfer to Stage 2 | (32 | ) | 43 | (11 | ) | – | (27 | ) | 36 | (9 | ) | – | ||||||||||||||||||||
Transfer to Stage 3 | (3 | ) | (27 | ) | 30 | – | (4 | ) | (38 | ) | 42 | – | ||||||||||||||||||||
Net remeasurement due to transfers4 | (42 | ) | 45 | 3 | 6 | (33 | ) | 36 | 3 | 6 | ||||||||||||||||||||||
New originations or purchases5 | 92 | n/a | n/a | 92 | 104 | n/a | n/a | 104 | ||||||||||||||||||||||||
Net repayments6 | (23 | ) | (7 | ) | (3 | ) | (33 | ) | (18 | ) | (4 | ) | (4 | ) | (26 | ) | ||||||||||||||||
Derecognition of financial assets (excluding disposals and write-offs)7 | (21 | ) | (9 | ) | (5 | ) | (35 | ) | (46 | ) | (24 | ) | (12 | ) | (82 | ) | ||||||||||||||||
Changes to risk, parameters, and models8 | (34 | ) | 62 | 209 | 237 | (33 | ) | 80 | 187 | 234 | ||||||||||||||||||||||
Disposals | – | – | – | – | – | – | – | – | ||||||||||||||||||||||||
Write-offs | – | – | (300 | ) | (300 | ) | – | – | (270 | ) | (270 | ) | ||||||||||||||||||||
Recoveries | – | – | 63 | 63 | – | – | 64 | 64 | ||||||||||||||||||||||||
| Foreign exchange and other adjustments | (4 | ) | (3 | ) | (3 | ) | (10 | ) | 4 | 3 | 2 | 9 | ||||||||||||||||||||
Balance, includingoff-balance sheet instruments, at end of period | 679 | 411 | 159 | 1,249 | 599 | 397 | 171 | 1,167 | ||||||||||||||||||||||||
| Less: Allowance foroff-balance sheet instruments9 | 32 | 43 | – | 75 | 26 | 48 | – | 74 | ||||||||||||||||||||||||
| Balance at end of period | $ | 647 | $ | 368 | $ | 159 | $ | 1,174 | $ | 573 | $ | 349 | $ | 171 | $ | 1,093 | ||||||||||||||||
Credit Card10 | ||||||||||||||||||||||||||||||||
Balance, includingoff-balance sheet instruments, at beginning of period | $ | 880 | $ | 627 | $ | 382 | $ | 1,889 | $ | 764 | $ | 582 | $ | 348 | $ | 1,694 | ||||||||||||||||
Provision for credit losses | ||||||||||||||||||||||||||||||||
Transfer to Stage 13 | 201 | (192 | ) | (9 | ) | – | 195 | (153 | ) | (42 | ) | – | ||||||||||||||||||||
Transfer to Stage 2 | (59 | ) | 77 | (18 | ) | – | (47 | ) | 68 | (21 | ) | – | ||||||||||||||||||||
Transfer to Stage 3 | (6 | ) | (124 | ) | 130 | – | (7 | ) | (122 | ) | 129 | – | ||||||||||||||||||||
Net remeasurement due to transfers4 | (76 | ) | 84 | 8 | 16 | (65 | ) | 66 | 12 | 13 | ||||||||||||||||||||||
New originations or purchases5 | 30 | n/a | n/a | 30 | 27 | n/a | n/a | 27 | ||||||||||||||||||||||||
Net repayments6 | 28 | 1 | 4 | 33 | 21 | (48 | ) | 52 | 25 | |||||||||||||||||||||||
Derecognition of financial assets (excluding disposals and write-offs)7 | (27 | ) | (25 | ) | (137 | ) | (189 | ) | (23 | ) | (25 | ) | (121 | ) | (169 | ) | ||||||||||||||||
Changes to risk, parameters, and models8 | (57 | ) | 189 | 301 | 433 | (73 | ) | 172 | 303 | 402 | ||||||||||||||||||||||
Disposals | – | – | – | – | (11 | ) | (4 | ) | (5 | ) | (20 | ) | ||||||||||||||||||||
Write-offs | – | – | (419 | ) | (419 | ) | – | – | (382 | ) | (382 | ) | ||||||||||||||||||||
Recoveries | – | – | 75 | 75 | – | – | 67 | 67 | ||||||||||||||||||||||||
| Foreign exchange and other adjustments | (9 | ) | (6 | ) | (4 | ) | (19 | ) | 6 | 2 | 4 | 12 | ||||||||||||||||||||
Balance, includingoff-balance sheet instruments, at end of period | 905 | 631 | 313 | 1,849 | 787 | 538 | 344 | 1,669 | ||||||||||||||||||||||||
| Less: Allowance foroff-balance sheet instruments9 | 496 | 322 | – | 818 | 415 | 269 | – | 684 | ||||||||||||||||||||||||
Balance at end of period | $ | 409 | $ | 309 | $ | 313 | $ | 1,031 | $ | 372 | $ | 269 | $ | 344 | $ | 985 | ||||||||||||||||
| 1 | Certain comparative amounts have been reclassified to conform with the presentation adopted in the current period. |
| 2 | Includes allowance for loan losses related to ACI loans. |
| 3 | Transfers represent stage transfer movements prior to expected credit loss (ECL) remeasurement. |
| 4 | Represents the remeasurement between twelve-month and lifetime ECLs due to stage transfers, excluding the change to risk, parameters, and models. |
| 5 | Represents the increase in the allowance resulting from loans that were newly originated, purchased, or renewed. |
| 6 | Represents the changes in the allowance related to cash flow changes associated with new draws or repayments on loans outstanding. |
| 7 | Represents the decrease in the allowance resulting from loans that were fully repaid and excludes the decrease associated with loans that were disposed or fully written off. |
| 8 | Represents the change in the allowance related to changes in risk including changes to macroeconomic factors, level of risk, associated parameters, and models. |
| 9 | The allowance for loan losses foroff-balance sheet instruments is recorded in Other liabilities on the Interim Consolidated Balance Sheet. |
| 10 | Credit cards are considered impaired and migrate to Stage 3 when they are 90 days past due and written off at 180 days past due. Refer to Note 2 of the Bank's 2018 Annual Consolidated Financial Statements for further details. |
| TD BANK GROUP• THIRD QUARTER 2019• REPORT TO SHAREHOLDERS | Page 64 |
Table of Contents
Allowance for Loan Losses(Continued)1,2 |
| |||||||||||||||||||||||||||||||
(millions of Canadian dollars) | For the three months ended | |||||||||||||||||||||||||||||||
July 31, 2019 | July 31, 2018 | |||||||||||||||||||||||||||||||
| Stage 1 | Stage 2 | Stage 3 | 3 | Total | Stage 1 | Stage 2 | Stage 3 | 3 | Total | |||||||||||||||||||||||
Business and Government | ||||||||||||||||||||||||||||||||
Balance, includingoff-balance sheet instruments, at beginning of period | $ | 717 | $ | 755 | $ | 183 | $ | 1,655 | $ | 696 | $ | 639 | $ | 162 | $ | 1,497 | ||||||||||||||||
Provision for credit losses | ||||||||||||||||||||||||||||||||
Transfer to Stage 14 | 54 | (54 | ) | – | – | 32 | (31 | ) | (1 | ) | – | |||||||||||||||||||||
Transfer to Stage 2 | (32 | ) | 36 | (4 | ) | – | (23 | ) | 26 | (3 | ) | – | ||||||||||||||||||||
Transfer to Stage 3 | (6 | ) | (57 | ) | 63 | – | – | (14 | ) | 14 | – | |||||||||||||||||||||
Net remeasurement due to transfers4 | (24 | ) | 44 | (1 | ) | 19 | (9 | ) | 18 | 1 | 10 | |||||||||||||||||||||
New originations or purchases4 | 91 | n/a | n/a | 91 | 136 | n/a | n/a | 136 | ||||||||||||||||||||||||
Net repayments4 | 3 | 6 | (14 | ) | (5 | ) | (2 | ) | (4 | ) | (8 | ) | (14 | ) | ||||||||||||||||||
Derecognition of financial assets (excluding disposals and write-offs)4 | (77 | ) | (125 | ) | (25 | ) | (227 | ) | (70 | ) | (107 | ) | (18 | ) | (195 | ) | ||||||||||||||||
Changes to risk, parameters, and models4 | (5 | ) | 127 | 55 | 177 | (53 | ) | 118 | 26 | 91 | ||||||||||||||||||||||
Disposals | – | (3 | ) | – | (3 | ) | – | – | – | – | ||||||||||||||||||||||
Write-offs | – | – | (61 | ) | (61 | ) | – | – | (39 | ) | (39 | ) | ||||||||||||||||||||
Recoveries | – | – | 17 | 17 | – | – | 16 | 16 | ||||||||||||||||||||||||
| Foreign exchange and other adjustments | (9 | ) | (1 | ) | (9 | ) | (19 | ) | 8 | 6 | (2 | ) | 12 | |||||||||||||||||||
Balance, includingoff-balance sheet instruments, at end of period | 712 | 728 | 204 | 1,644 | 715 | 651 | 148 | 1,514 | ||||||||||||||||||||||||
Less: Allowance foroff-balance sheet instruments5 | 80 | 105 | 7 | 192 | 70 | 83 | – | 153 | ||||||||||||||||||||||||
| Balance at end of period | 632 | 623 | 197 | 1,452 | 645 | 568 | 148 | 1,361 | ||||||||||||||||||||||||
Total Allowance for Loan Losses at end of period | $ | 1,717 | $ | 1,330 | $ | 722 | $ | 3,769 | $ | 1,614 | $ | 1,212 | $ | 709 | $ | 3,535 | ||||||||||||||||
| 1 | Certain comparative amounts have been reclassified to conform with the presentation adopted in the current period. |
| 2 | Includes the allowance for loan losses related to customers' liability under acceptances. |
| 3 | Includes allowance for loan losses related to ACI loans. |
| 4 | For explanations regarding this line item, refer to the "Allowance for Loan Losses" table on the previous page in this Note. |
| 5 | The allowance for loan losses foroff-balance sheet instruments is recorded in Other liabilities on the Interim Consolidated Balance Sheet. |
| TD BANK GROUP• THIRD QUARTER 2019• REPORT TO SHAREHOLDERS | Page 65 |
Table of Contents
Allowance for Loan Losses1 | ||||||||||||||||||||||||||||||||
(millions of Canadian dollars) | For the nine months ended | |||||||||||||||||||||||||||||||
July 31, 2019 | July 31, 2018 | |||||||||||||||||||||||||||||||
| Stage 1 | Stage 2 | Stage 3 | 2 | Total | Stage 1 | Stage 2 | Stage 3 | 2 | Total | |||||||||||||||||||||||
Residential Mortgages | ||||||||||||||||||||||||||||||||
Balance at beginning of period | $ | 24 | $ | 34 | $ | 52 | $ | 110 | $ | 24 | $ | 26 | $ | 57 | $ | 107 | ||||||||||||||||
Provision for credit losses | ||||||||||||||||||||||||||||||||
Transfer to Stage 13 | 27 | (25 | ) | (2 | ) | – | 17 | (17 | ) | – | – | |||||||||||||||||||||
Transfer to Stage 2 | (4 | ) | 10 | (6 | ) | – | (3 | ) | 6 | (3 | ) | – | ||||||||||||||||||||
Transfer to Stage 3 | (2 | ) | (6 | ) | 8 | – | – | (6 | ) | 6 | – | |||||||||||||||||||||
Net remeasurement due to transfers4 | (11 | ) | 5 | – | (6 | ) | (10 | ) | 4 | – | (6 | ) | ||||||||||||||||||||
New originations or purchases5 | 9 | n/a | n/a | 9 | 10 | n/a | n/a | 10 | ||||||||||||||||||||||||
Net repayments6 | – | (1 | ) | – | (1 | ) | (1 | ) | (1 | ) | (5 | ) | (7 | ) | ||||||||||||||||||
Derecognition of financial assets (excluding disposals and write-offs)7 | (3 | ) | (4 | ) | (13 | ) | (20 | ) | (3 | ) | (1 | ) | (3 | ) | (7 | ) | ||||||||||||||||
Changes to risk, parameters, and models8 | (11 | ) | 17 | 35 | 41 | (10 | ) | 15 | 14 | 19 | ||||||||||||||||||||||
Disposals | – | – | – | – | – | – | – | – | ||||||||||||||||||||||||
Write-offs | – | – | (23 | ) | (23 | ) | – | – | (22 | ) | (22 | ) | ||||||||||||||||||||
Recoveries | – | – | 1 | 1 | – | – | 2 | 2 | ||||||||||||||||||||||||
| Foreign exchange and other adjustments | – | – | 1 | 1 | – | – | – | – | ||||||||||||||||||||||||
| Balance at end of period | $ | 29 | $ | 30 | $ | 53 | $ | 112 | $ | 24 | $ | 26 | $ | 46 | $ | 96 | ||||||||||||||||
Consumer Instalment and Other Personal | ||||||||||||||||||||||||||||||||
Balance, includingoff-balance sheet instruments, at beginning of period | $ | 599 | $ | 392 | $ | 180 | $ | 1,171 | $ | 529 | $ | 355 | $ | 171 | $ | 1,055 | ||||||||||||||||
Provision for credit losses | ||||||||||||||||||||||||||||||||
Transfer to Stage 13 | 266 | (252 | ) | (14 | ) | – | 226 | (212 | ) | (14 | ) | – | ||||||||||||||||||||
Transfer to Stage 2 | (89 | ) | 121 | (32 | ) | – | (87 | ) | 116 | (29 | ) | – | ||||||||||||||||||||
Transfer to Stage 3 | (12 | ) | (133 | ) | 145 | – | (17 | ) | (126 | ) | 143 | – | ||||||||||||||||||||
Net remeasurement due to transfers4 | (110 | ) | 123 | 8 | 21 | (92 | ) | 104 | 8 | 20 | ||||||||||||||||||||||
New originations or purchases5 | 231 | n/a | n/a | 231 | 246 | n/a | n/a | 246 | ||||||||||||||||||||||||
Net repayments6 | (66 | ) | (22 | ) | (9 | ) | (97 | ) | (31 | ) | (17 | ) | (13 | ) | (61 | ) | ||||||||||||||||
Derecognition of financial assets (excluding disposals and write-offs)7 | (59 | ) | (61 | ) | (38 | ) | (158 | ) | (100 | ) | (71 | ) | (32 | ) | (203 | ) | ||||||||||||||||
Changes to risk, parameters, and models8 | (82 | ) | 242 | 614 | 774 | (79 | ) | 246 | 539 | 706 | ||||||||||||||||||||||
Disposals | – | – | – | – | – | – | – | – | ||||||||||||||||||||||||
Write-offs | – | – | (886 | ) | (886 | ) | – | – | (798 | ) | (798 | ) | ||||||||||||||||||||
Recoveries | – | – | 191 | 191 | – | – | 195 | 195 | ||||||||||||||||||||||||
| Foreign exchange and other adjustments | 1 | 1 | – | 2 | 4 | 2 | 1 | 7 | ||||||||||||||||||||||||
Balance, includingoff-balance sheet instruments, at end of period | 679 | 411 | 159 | 1,249 | 599 | 397 | 171 | 1,167 | ||||||||||||||||||||||||
| Less: Allowance foroff-balance sheet instruments9 | 32 | 43 | – | 75 | 26 | 48 | – | 74 | ||||||||||||||||||||||||
| Balance at end of period | $ | 647 | $ | 368 | $ | 159 | $ | 1,174 | $ | 573 | $ | 349 | $ | 171 | $ | 1,093 | ||||||||||||||||
Credit Card10 | ||||||||||||||||||||||||||||||||
Balance, includingoff-balance sheet instruments, at beginning of period | $ | 819 | $ | 580 | $ | 341 | $ | 1,740 | $ | 763 | $ | 521 | $ | 321 | $ | 1,605 | ||||||||||||||||
Provision for credit losses | ||||||||||||||||||||||||||||||||
Transfer to Stage 13 | 564 | (488 | ) | (76 | ) | – | 449 | (387 | ) | (62 | ) | – | ||||||||||||||||||||
Transfer to Stage 2 | (170 | ) | 220 | (50 | ) | – | (140 | ) | 194 | (54 | ) | – | ||||||||||||||||||||
Transfer to Stage 3 | (22 | ) | (440 | ) | 462 | – | (31 | ) | (344 | ) | 375 | – | ||||||||||||||||||||
Net remeasurement due to transfers4 | (187 | ) | 238 | 31 | 82 | (156 | ) | 179 | 51 | 74 | ||||||||||||||||||||||
New originations or purchases5 | 95 | n/a | n/a | 95 | 139 | n/a | n/a | 139 | ||||||||||||||||||||||||
Net repayments6 | 66 | 2 | (26 | ) | 42 | 105 | (52 | ) | 35 | 88 | ||||||||||||||||||||||
Derecognition of financial assets (excluding disposals and write-offs)7 | (74 | ) | (79 | ) | (332 | ) | (485 | ) | (80 | ) | (82 | ) | (257 | ) | (419 | ) | ||||||||||||||||
Changes to risk, parameters, and models8 | (187 | ) | 598 | 1,017 | 1,428 | (246 | ) | 515 | 882 | 1,151 | ||||||||||||||||||||||
Disposals | – | – | – | – | (19 | ) | (11 | ) | (8 | ) | (38 | ) | ||||||||||||||||||||
Write-offs | – | – | (1,280 | ) | (1,280 | ) | – | – | (1,139 | ) | (1,139 | ) | ||||||||||||||||||||
Recoveries | – | – | 224 | 224 | – | – | 196 | 196 | ||||||||||||||||||||||||
| Foreign exchange and other adjustments | 1 | – | 2 | 3 | 3 | 5 | 4 | 12 | ||||||||||||||||||||||||
Balance, includingoff-balance sheet instruments, at end of period | 905 | 631 | 313 | 1,849 | 787 | 538 | 344 | 1,669 | ||||||||||||||||||||||||
| Less: Allowance foroff-balance sheet instruments9 | 496 | 322 | – | 818 | 415 | 269 | – | 684 | ||||||||||||||||||||||||
Balance at end of period | $ | 409 | $ | 309 | $ | 313 | $ | 1,031 | $ | 372 | $ | 269 | $ | 344 | $ | 985 | ||||||||||||||||
| 1 | Certain comparative amounts have been reclassified to conform with the presentation adopted in the current period. |
| 2 | Includes allowance for loan losses related to ACI loans. |
| 3 | Transfers represent stage transfer movements prior to ECL remeasurement. |
| 4 | Represents the remeasurement between twelve-month and lifetime ECLs due to stage transfers, excluding the change to risk, parameters, and models. |
| 5 | Represents the increase in the allowance resulting from loans that were newly originated, purchased, or renewed. |
| 6 | Represents the changes in the allowance related to cash flow changes associated with new draws or repayments on loans outstanding. |
| 7 | Represents the decrease in the allowance resulting from loans that were fully repaid and excludes the decrease associated with loans that were disposed or fully written off. |
| 8 | Represents the change in the allowance related to changes in risk including changes to macroeconomic factors, level of risk, associated parameters, and models. |
| 9 | The allowance for loan losses foroff-balance sheet instruments is recorded in Other liabilities on the Interim Consolidated Balance Sheet. |
| 10 | Credit cards are considered impaired and migrate to Stage 3 when they are 90 days past due and written off at 180 days past due. Refer to Note 2 of the Bank's 2018 Annual Consolidated Financial Statements for further details. |
| TD BANK GROUP• THIRD QUARTER 2019• REPORT TO SHAREHOLDERS | Page 66 |
Table of Contents
Allowance for Loan Losses(Continued)1,2 |
| |||||||||||||||||||||||||||||||
| (millions of Canadian dollars) | For the nine months ended | |||||||||||||||||||||||||||||||
| July 31, 2019 | July 31, 2018 | |||||||||||||||||||||||||||||||
| Stage 1 | Stage 2 | Stage 33 | Total | Stage 1 | Stage 2 | Stage 33 | Total | |||||||||||||||||||||||||
Business and Government | ||||||||||||||||||||||||||||||||
Balance, includingoff-balance sheet instruments, at beginning of period | $ | 736 | $ | 688 | $ | 133 | $ | 1,557 | $ | 706 | $ | 627 | $ | 192 | $ | 1,525 | ||||||||||||||||
Provision for credit losses | ||||||||||||||||||||||||||||||||
Transfer to Stage 14 | 139 | (136 | ) | (3 | ) | – | 98 | (95 | ) | (3 | ) | – | ||||||||||||||||||||
Transfer to Stage 2 | (100 | ) | 108 | (8 | ) | – | (75 | ) | 81 | (6 | ) | – | ||||||||||||||||||||
Transfer to Stage 3 | (9 | ) | (105 | ) | 114 | – | (4 | ) | (43 | ) | 47 | – | ||||||||||||||||||||
Net remeasurement due to transfers4 | (51 | ) | 91 | 1 | 41 | (27 | ) | 50 | 4 | 27 | ||||||||||||||||||||||
New originations or purchases4 | 304 | n/a | n/a | 304 | 341 | n/a | n/a | 341 | ||||||||||||||||||||||||
Net repayments4 | 5 | (16 | ) | (21 | ) | (32 | ) | (8 | ) | (26 | ) | (20 | ) | (54 | ) | |||||||||||||||||
Derecognition of financial assets (excluding disposals and write-offs)4 | (245 | ) | (308 | ) | (62 | ) | (615 | ) | (264 | ) | (291 | ) | (43 | ) | (598 | ) | ||||||||||||||||
Changes to risk, parameters, and models4 | (69 | ) | 407 | 148 | 486 | (56 | ) | 344 | 47 | 335 | ||||||||||||||||||||||
Disposals | – | (3 | ) | – | (3 | ) | – | – | (5 | ) | (5 | ) | ||||||||||||||||||||
Write-offs | – | – | (136 | ) | (136 | ) | – | – | (113 | ) | (113 | ) | ||||||||||||||||||||
Recoveries | – | – | 41 | 41 | – | – | 51 | 51 | ||||||||||||||||||||||||
Foreign exchange and other adjustments | 2 | 2 | (3 | ) | 1 | 4 | 4 | (3 | ) | 5 | ||||||||||||||||||||||
Balance, includingoff-balance sheet instruments, at end of period | 712 | 728 | 204 | 1,644 | 715 | 651 | 148 | 1,514 | ||||||||||||||||||||||||
Less: Allowance foroff-balance sheet instruments5 | 80 | 105 | 7 | 192 | 70 | 83 | – | 153 | ||||||||||||||||||||||||
Balance at end of period | 632 | 623 | 197 | 1,452 | 645 | 568 | 148 | 1,361 | ||||||||||||||||||||||||
Total Allowance for Loan Losses at end of period | $ | 1,717 | $ | 1,330 | $ | 722 | $ | 3,769 | $ | 1,614 | $ | 1,212 | $ | 709 | $ | 3,535 | ||||||||||||||||
| 1 | Certain comparative amounts have been reclassified to conform with the presentation adopted in the current period. |
| 2 | Includes the allowance for loan losses related to customers' liability under acceptances. |
| 3 | Includes allowance for loan losses related to ACI loans. |
| 4 | For explanations regarding this line item, refer to the "Allowance for Loan Losses" table on the previous page in this Note. |
| 5 | The allowance for loan losses foroff-balance sheet instruments is recorded in Other liabilities on the Interim Consolidated Balance Sheet. |
The allowance for credit losses on all remaining financial assets is not significant.
FORECLOSED ASSETS
Foreclosed assets are repossessednon-financial assets where the Bank gains title, ownership, or possession of individual properties, such as real estate properties, which are managed for sale in an orderly manner with the proceeds used to reduce or repay any outstanding debt. The Bank does not generally occupy foreclosed properties for its business use. The Bank predominantly relies on third-party appraisals to determine the carrying value of foreclosed assets. Foreclosed assets held for sale were $81 million as at July 31, 2019 (October 31, 2018 – $81 million), and were recorded in Other assets on the Interim Consolidated Balance Sheet.
LOANS PAST DUE BUT NOT IMPAIRED
A loan is classified as past due when a borrower has failed to make a payment by the contractual due date. The following table summarizes loans that are contractually past due but not impaired as at July 31, 2019 and October 31, 2018.
Loans Past Due but not Impaired1,2 | ||||||||||||||||||||||||||||||||
(millions of Canadian dollars) | As at | |||||||||||||||||||||||||||||||
| July 31, 2019 | October 31, 2018 | |||||||||||||||||||||||||||||||
| 1-30 days | | 31-60 days | | | 61-89 days | | Total | 1-30 days | | 31-60 days | | | 61-89 days | | Total | |||||||||||||||||
Residential mortgages | $ | 1,309 | $ | 408 | $ | 104 | $ | 1,821 | $ | 1,471 | $ | 358 | $ | 101 | $ | 1,930 | ||||||||||||||||
Consumer instalment and other personal | 6,254 | 824 | 248 | 7,326 | 5,988 | 811 | 241 | 7,040 | ||||||||||||||||||||||||
Credit card | 1,378 | 322 | 214 | 1,914 | 1,403 | 340 | 213 | 1,956 | ||||||||||||||||||||||||
Business and government | 1,434 | 763 | 38 | 2,235 | 1,314 | 444 | 28 | 1,786 | ||||||||||||||||||||||||
Total | $ | 10,375 | $ | 2,317 | $ | 604 | $ | 13,296 | $ | 10,176 | $ | 1,953 | $ | 583 | $ | 12,712 | ||||||||||||||||
| 1 | Includes loans that are measured at FVOCI. |
| 2 | Balances as at July 31, 2019 and October 31, 2018 exclude all ACI loans. |
| TD BANK GROUP• THIRD QUARTER 2019• REPORT TO SHAREHOLDERS | Page 67 |
Table of Contents
NOTE 7: INVESTMENT IN ASSOCIATES AND JOINT VENTURES
INVESTMENT IN TD AMERITRADE HOLDING CORPORATION
The Bank has significant influence over TD Ameritrade Holding Corporation (TD Ameritrade) and accounts for its investment in TD Ameritrade using the equity method. The Bank's equity share in TD Ameritrade's earnings, excluding dividends, is reported on aone-month lag basis. The Bank takes into account changes in the subsequent period that would significantly affect the results.
As at July 31, 2019, the Bank's reported investment in TD Ameritrade was 42.69% (October 31, 2018 – 41.61%) of the outstanding shares of TD Ameritrade with a fair value of $16 billion (US$12 billion) (October 31, 2018 – $16 billion (US$12 billion)) based on the closing price of US$51.10 (October 31, 2018 – US$51.72) on the New York Stock Exchange.
During the nine months ended July 31, 2019, TD Ameritrade repurchased 15.0 million shares (for the year ended October 31, 2018 – 5.5 million shares). Pursuant to the Stockholders Agreement in relation to the Bank's equity investment in TD Ameritrade, if stock repurchases by TD Ameritrade cause the Bank's ownership percentage to exceed 45%, the Bank is required to use reasonable efforts to sell or dispose of such excess stock, subject to the Bank's commercial judgment as to the optimal timing, amount, and method of sales with a view to maximizing proceeds from such sales. However, in the event that stock repurchases by TD Ameritrade cause the Bank's ownership percentage to exceed 45%, the Bank has no absolute obligation to reduce its ownership percentage to 45%. In addition, stock repurchases by TD Ameritrade cannot result in the Bank's ownership percentage exceeding 47%.
Pursuant to the Stockholders Agreement in relation to the Bank's equity investment in TD Ameritrade, the Bank has the right to designate five of twelve members of TD Ameritrade's Board of Directors. The Bank's designated directors currently include the Bank's Group President and Chief Executive Officer and four independent directors of TD or TD's U.S. subsidiaries.
TD Ameritrade has no significant contingent liabilities to which the Bank is exposed. During the nine months ended July 31, 2019 and July 31, 2018, TD Ameritrade did not experience any significant restrictions to transfer funds in the form of cash dividends, or repayment of loans or advances.
The condensed financial statements of TD Ameritrade, based on its consolidated financial statements, are included in the following tables.
| Condensed Consolidated Balance Sheets1 | ||||||||
(millions of Canadian dollars) | As at | |||||||
| | June 30 2019 |
| | September 30 2018 | | |||
Assets | ||||||||
Receivables from brokers, dealers, and clearing organizations | $ | 2,349 | $ | 1,809 | ||||
Receivables from clients, net | 27,514 | 29,773 | ||||||
Other assets, net | 24,406 | 17,811 | ||||||
Total assets | $ | 54,269 | $ | 49,393 | ||||
Liabilities | ||||||||
Payable to brokers, dealers, and clearing organizations | $ | 4,237 | $ | 3,923 | ||||
Payable to clients | 32,451 | 30,126 | ||||||
Other liabilities | 6,372 | 4,809 | ||||||
Total liabilities | 43,060 | 38,858 | ||||||
Stockholders' equity2 | 11,209 | 10,535 | ||||||
Total liabilities and stockholders' equity | $ | 54,269 | $ | 49,393 | ||||
| 1 | Customers' securities are reported on a settlement date basis whereas the Bank reports customers' securities on a trade date basis. |
| 2 | The difference between the carrying value of the Bank's investment in TD Ameritrade and the Bank's share of TD Ameritrade's stockholders' equity is comprised of goodwill, other intangibles, and the cumulative translation adjustment. |
| Condensed Consolidated Statements of Income | ||||||||||||||||
(millions of Canadian dollars, except as noted) | For the three months ended | For the nine months ended | ||||||||||||||
| June 30 2019 | June 30 2018 | June 30 2019 | June 30 2018 | |||||||||||||
Revenues | ||||||||||||||||
Net interest revenue | $ | 512 | $ | 429 | $ | 1,490 | $ | 1,170 | ||||||||
Fee-based and other revenue | 1,482 | 1,356 | 4,435 | 4,003 | ||||||||||||
Total revenues | 1,994 | 1,785 | 5,925 | 5,173 | ||||||||||||
Operating expenses | ||||||||||||||||
Employee compensation and benefits | 435 | 454 | 1,306 | 1,565 | ||||||||||||
Other | 597 | 515 | 1,668 | 1,864 | ||||||||||||
Total operating expenses | 1,032 | 969 | 2,974 | 3,429 | ||||||||||||
Other expense (income) | (31 | ) | 36 | 42 | 108 | |||||||||||
Pre-tax income | 993 | 780 | 2,909 | 1,636 | ||||||||||||
Provision for income taxes | 251 | 196 | 706 | 332 | ||||||||||||
Net income1,2 | $ | 742 | $ | 584 | $ | 2,203 | $ | 1,304 | ||||||||
Earnings per share – basic (Canadian dollars) | $ | 1.34 | $ | 1.03 | $ | 3.94 | $ | 2.29 | ||||||||
Earnings per share – diluted (Canadian dollars) | 1.34 | 1.02 | 3.93 | 2.28 | ||||||||||||
| 1 | The Bank's equity share of net income of TD Ameritrade is based on the published consolidated financial statements of TD Ameritrade after converting into Canadian dollars and is subject to adjustments relating to the amortization of certain intangibles. |
| 2 | The Bank's equity share in TD Ameritrade earnings for the three and nine months ended July 31, 2019 includes an adjustment of nil (three and nine months ended July 31, 2018 – a net favourable adjustment of nil and $41 million (US$32 million), respectively) primarily representing the Bank's share of TD Ameritrade's remeasurement of its deferred income tax balances as a result of the reduction in the U.S. federal corporate income tax rate. |
| TD BANK GROUP• THIRD QUARTER 2019• REPORT TO SHAREHOLDERS | Page 68 |
Table of Contents
NOTE 8: SIGNIFICANT ACQUISITIONS AND DISPOSALS
Agreement for Air Canada Credit Card Loyalty Program
On January 10, 2019, the Bank's long-term loyalty program agreement (the "Loyalty Agreement") with Air Canada became effective in conjunction with Air Canada completing its acquisition of Aimia Canada Inc., which operates the Aeroplan loyalty business (the "Transaction"). Under the terms of the Loyalty Agreement, the Bank will become the primary credit card issuer for Air Canada's new loyalty program when it launches in 2020 through to 2030. TD Aeroplan cardholders will become members of Air Canada's new loyalty program and their miles will be transitioned when Air Canada's new loyalty program launches in 2020.
In connection with the Transaction, the Bank paid $622 million plus applicable sales tax to Air Canada, of which $547 million ($446 million after sales and income taxes) was recognized inNon-interest expenses – Other on the Interim Consolidated Statement of Income during the first quarter of 2019, and $75 million was recognized as an intangible asset which will be amortized over the Loyalty Agreement term. In addition, the Bank prepaid $308 million plus applicable sales tax for the future purchase of loyalty points over aten-year period.
Acquisition of Greystone Managed Investments Inc.
On November 1, 2018, the Bank acquired 100% of the outstanding equity of Greystone Capital Management Inc., the parent company of Greystone Managed Investments Inc. ("Greystone") for consideration of $821 million, of which $479 million was paid in cash and $342 million was paid in the Bank's common shares. The value of 4.7 million common shares issued as consideration was based on the volume weighted-average market price of the Bank's common shares over the 10 trading day period immediately preceding the fifth business day prior to the acquisition date and was recorded based on market price at close. Common shares of $167 million issued to employee shareholders in respect of the purchase price are being held in escrow for two years post-acquisition, subject to their continued employment, and are being recorded as a compensation expense over thetwo-year escrow period.
The acquisition was accounted for as a business combination under the purchase method. As at November 1, 2018, the acquisition contributed $165 million of assets and $46 million of liabilities. The excess of accounting consideration over the fair value of the identifiable net assets has been allocated to customer relationship intangibles of $140 million, deferred tax liability of $37 million, and goodwill of $432 million. Goodwill is not deductible for tax purposes. The results of the acquisition have been consolidated from the acquisition date and reported in the Canadian Retail segment.
NOTE 9: GOODWILL
Goodwill by Segment
| (millions of Canadian dollars) | Canadian Retail | U.S. Retail1 | Wholesale Banking | Total | ||||||||||||
Carrying amount of goodwill as at November 1, 2017 | $ | 2,303 | $ | 13,693 | $ | 160 | $ | 16,156 | ||||||||
Additions | 82 | – | – | 82 | ||||||||||||
Foreign currency translation adjustments and other | 18 | 280 | – | 298 | ||||||||||||
Carrying amount of goodwill as at October 31, 20182 | 2,403 | 13,973 | 160 | 16,536 | ||||||||||||
Additions | 432 | – | – | 432 | ||||||||||||
Foreign currency translation adjustments and other | 3 | 35 | – | 38 | ||||||||||||
Carrying amount of goodwill as at July 31, 20192 | $ | 2,838 | $ | 14,008 | $ | 160 | $ | 17,006 | ||||||||
| 1 | Goodwill predominantly relates to U.S. personal and commercial banking. |
| 2 | Impairment losses for the three and nine months ended July 31, 2019 were nil (three and nine months ended July 31, 2018 – nil), and accumulated impairment as at July 31, 2019 was nil (October 31, 2018 – nil). |
NOTE 10: OTHER ASSETS
Other Assets
| (millions of Canadian dollars) | As at | |||||||
July 31 2019 | October 31 2018 | |||||||
Accounts receivable and other items | $ | 9,108 | $ | 8,938 | ||||
Accrued interest | 2,463 | 2,343 | ||||||
Current income tax receivable | 2,325 | 1,614 | ||||||
Defined benefit asset | 10 | 113 | ||||||
Insurance-related assets, excluding investments | 1,663 | 1,638 | ||||||
Prepaid expenses | 1,303 | 950 | ||||||
Total | $ | 16,872 | $ | 15,596 | ||||
| TD BANK GROUP• THIRD QUARTER 2019• REPORT TO SHAREHOLDERS | Page 69 |
Table of Contents
NOTE 11: DEPOSITS
Demand deposits are those for which the Bank does not have the right to require notice prior to withdrawal. These deposits are in general chequing accounts.
Notice deposits are those for which the Bank can legally require notice prior to withdrawal. These deposits are in general savings accounts.
Term deposits are those payable on a fixed date of maturity purchased by customers to earn interest over a fixed period. The terms are from one day to ten years. The deposits are generally term deposits, guaranteed investment certificates, senior debt, and similar instruments. The aggregate amount of term deposits in denominations of $100,000 or more as at July 31, 2019, was $316 billion (October 31, 2018 – $293 billion).
Certain deposit liabilities are classified as Trading deposits on the Interim Consolidated Balance Sheet and accounted for at fair value with the change in fair value recognized on the Interim Consolidated Statement of Income.
Certain deposits have been designated at fair value through profit or loss on the Interim Consolidated Balance Sheet to reduce an accounting mismatch from related economic hedges. These deposits are accounted for at fair value with the change in fair value recognized on the Interim Consolidated Statement of Income, except for the amount of change in fair value attributable to changes in the Bank's own credit risk, which is recognized on the Interim Consolidated Statement of Comprehensive Income. Changes in fair value attributable to changes in the Bank's own credit risk are measured as the difference between: (i) the period-over-period change in the present value of the expected cash flows using anall-in discount curve reflecting the interest rate benchmark curve and the Bank's own credit risk; and (ii) the period-over-period change in the present value of the same expected cash flows using a discount curve based on the interest rate benchmark curve.
For deposits designated at fair value through profit or loss, the estimated amount that the Bank would be contractually required to pay at maturity, which is based on notional amounts, was $287 million less than its fair value as at July 31, 2019.
| Deposits | ||||||||||||||||||||||||||||||||||||
| (millions of Canadian dollars) | As at | |||||||||||||||||||||||||||||||||||
| By Type | By Country | July 31 2019 | October 31 2018 | |||||||||||||||||||||||||||||||||
| Demand | Notice | Term1 | Canada | United States | International | Total | Total | |||||||||||||||||||||||||||||
Personal | $ | 13,723 | $ | 420,200 | $ | 57,615 | $ | 228,411 | $ | 263,100 | $ | 27 | $ | 491,538 | $ | 477,644 | ||||||||||||||||||||
Banks2 | 6,353 | 369 | 9,838 | 11,055 | 70 | 5,435 | 16,560 | 16,712 | ||||||||||||||||||||||||||||
Business and government3,4 | 76,787 | 135,745 | 149,696 | 264,011 | 93,482 | 4,735 | 362,228 | 357,083 | ||||||||||||||||||||||||||||
Trading2 | – | – | 37,796 | 20,797 | 8,853 | 8,146 | 37,796 | 114,704 | ||||||||||||||||||||||||||||
Designated at fair value through profit or loss2,5 | – | – | 95,737 | 46,720 | 42,224 | 6,793 | 95,737 | – | ||||||||||||||||||||||||||||
Total | $ | 96,863 | $ | 556,314 | $ | 350,682 | $ | 570,994 | $ | 407,729 | $ | 25,136 | $ | 1,003,859 | $ | 966,143 | ||||||||||||||||||||
Non-interest-bearing deposits included above | ||||||||||||||||||||||||||||||||||||
In domestic offices | $ | 42,134 | $ | 42,402 | ||||||||||||||||||||||||||||||||
In foreign offices | 53,475 | 54,488 | ||||||||||||||||||||||||||||||||||
Interest-bearing deposits included above | ||||||||||||||||||||||||||||||||||||
In domestic offices | 528,860 | 505,295 | ||||||||||||||||||||||||||||||||||
In foreign offices | 378,324 | 362,890 | ||||||||||||||||||||||||||||||||||
U.S. federal funds deposited2 | 1,066 | 1,068 | ||||||||||||||||||||||||||||||||||
Total3,6 | $ | 1,003,859 | $ | 966,143 | ||||||||||||||||||||||||||||||||
| 1 | Includes $12.7 billion (October 31, 2018 – $53million) of senior debt which is subject to the bank recapitalization"bail-in" regime. This regime provides certain statutory powers to the Canada Deposit Insurance Corporation, including the ability to convert specified eligible shares and liabilities into common shares in the event that the Bank becomesnon-viable. |
| 2 | Includes deposits and advances with the Federal Home Loan Bank. |
| 3 | As at July 31, 2019, includes $42 billion relating to covered bondholders (October 31, 2018 – $36 billion) and $1 billion (October 31, 2018 – $2 billion) due to TD Capital Trust lV. |
| 4 | TD Capital Trust IV redeemed all of the outstanding TD Capital Trust IV Notes – Series 1 on June 30, 2019. |
| 5 | Financial liabilities designated at fair value through profit or loss on the Interim Consolidated Balance Sheet consist of deposits designated at fair value through profit or loss and $37 million (October 31, 2018 – $16 million) of loan commitments and financial guarantees designated at fair value through profit or loss. |
| 6 | As at July 31, 2019, includes deposits of $578 billion (October 31, 2018 – $548 billion) denominated in U.S. dollars and $54 billion (October 31, 2018 – $55 billion) denominated in other foreign currencies. |
NOTE 12: OTHER LIABILITIES
Other Liabilities1 | ||||||||
(millions of Canadian dollars) | As at | |||||||
| | July 31 2019 | | | October 31 2018 | | |||
Accounts payable, accrued expenses, and other items | $ | 5,004 | $ | 4,958 | ||||
Accrued interest | 1,344 | 1,283 | ||||||
Accrued salaries and employee benefits | 2,930 | 3,344 | ||||||
Cheques and other items in transit | 2,743 | 454 | ||||||
Current income tax payable | 109 | 84 | ||||||
Deferred tax liabilities | 195 | 175 | ||||||
Defined benefit liability | 2,520 | 1,747 | ||||||
Liabilities related to structured entities | 5,381 | 5,627 | ||||||
Provisions | 1,461 | 1,502 | ||||||
Total | $ | 21,687 | $ | 19,174 | ||||
| 1 | Certain comparative amounts have been reclassified to conform with the presentation adopted in the current period. |
| TD BANK GROUP• THIRD QUARTER 2019• REPORT TO SHAREHOLDERS | Page 70 |
Table of Contents
NOTE 13: SUBORDINATED NOTES AND DEBENTURES
Issues
On June 25, 2019, the Bank issued $1.75 billion of medium-term notes (non-viability contingent capital (NVCC)) constituting subordinated indebtedness of the Bank (the "Notes"). The Notes will bear interest at a fixed rate of 3.06% per annum (paid semi-annually) until January 26, 2027, and at the three-month Bankers' Acceptance rate plus 1.33% thereafter (paid quarterly) until maturity on January 26, 2032. With the prior approval of OSFI, the Bank may, at its option, redeem the Notes on or after January 26, 2027, in whole or in part, at par plus accrued and unpaid interest. Not more than 60 nor less than 30 days' notice is required to be given to the Notes' holders for such redemptions.
NOTE 14: EQUITY
The following table summarizes the shares issued and outstanding, and treasury shares held as at July 31, 2019 and October 31, 2018.
Common and Preferred Shares Issued and Outstanding and Treasury Shares Held |
| |||||||||||||||
(millions of shares and millions of Canadian dollars) | July 31, 2019 | October 31, 2018 | ||||||||||||||
| | Number of shares | | Amount | | Number of shares | | Amount | |||||||||
Common Shares | ||||||||||||||||
Balance as at beginning of year | 1,830.4 | $ | 21,221 | 1,842.5 | $ | 20,931 | ||||||||||
Proceeds from shares issued on exercise of stock options | 1.8 | 97 | 2.9 | 152 | ||||||||||||
Shares issued as a result of dividend reinvestment plan | 3.8 | 289 | 5.0 | 366 | ||||||||||||
Shares issued in connection with acquisitions1 | 5.0 | 366 | – | – | ||||||||||||
Purchase of shares for cancellation and other | (21.2 | ) | (251 | ) | (20.0 | ) | (228 | ) | ||||||||
Balance as at end of period – common shares | 1,819.8 | $ | 21,722 | 1,830.4 | $ | 21,221 | ||||||||||
Preferred Shares – Class A | ||||||||||||||||
Balance as at beginning of year | 200.0 | $ | 5,000 | 190.0 | $ | 4,750 | ||||||||||
Shares issued2,3 | 32.0 | 800 | 30.0 | 750 | ||||||||||||
Shares redeemed | – | – | (20.0 | ) | (500 | ) | ||||||||||
Balance as at end of period – preferred shares4 | 232.0 | $ | 5,800 | 200.0 | $ | 5,000 | ||||||||||
Treasury shares – common5 | ||||||||||||||||
Balance as at beginning of year | 2.1 | $ | (144 | ) | 2.9 | $ | (176 | ) | ||||||||
Purchase of shares | 102.0 | (7,528 | ) | 110.6 | (8,295 | ) | ||||||||||
Sale of shares | (103.5 | ) | 7,628 | (111.4 | ) | 8,327 | ||||||||||
Balance as at end of period – treasury shares – common | 0.6 | $ | (44 | ) | 2.1 | $ | (144 | ) | ||||||||
Treasury shares – preferred5 | ||||||||||||||||
Balance as at beginning of year | 0.3 | $ | (7 | ) | 0.3 | $ | (7 | ) | ||||||||
Purchase of shares | 5.0 | (111 | ) | 5.2 | (129 | ) | ||||||||||
Sale of shares | (5.1 | ) | 114 | (5.2 | ) | 129 | ||||||||||
Balance as at end of period – treasury shares – preferred | 0.2 | $ | (4 | ) | 0.3 | $ | (7 | ) | ||||||||
| 1 | Includes 4.7 million shares issued for $342 million that form part of the consideration paid for Greystone, as well as 0.3 million shares issued for $24 million as share-based compensation to replace share-based payment awards of Greystone. Refer to Note 8 for a discussion on the acquisition of Greystone. |
| 2 | Non-Cumulative5-Year Rate Reset Preferred Shares NVCC, Series 22 (the "Series 22 Shares") issued by the Bank on January 28, 2019, at a price of $25 per share, with quarterlynon-cumulative cash dividends on these shares, if declared, payable at a per annum rate of 5.20% for the initial period ending April 30, 2024. Thereafter, the dividend rate will reset every five years equal to the then five-year Government of Canada bond yield plus 3.27%. Holders of these shares will have the right to convert their shares intonon-cumulative NVCC Floating Rate Preferred Shares, Series 23, subject to certain conditions, on April 30, 2024, and on April 30 every five years thereafter. Holders of the Series 23 Shares will be entitled to receive quarterly floating rate dividends, if declared, at a rate equal to the three-month Government of Canada Treasury Bill yield plus 3.27%. The Series 22 Shares are redeemable by the Bank, subject to regulatory consent, at $25 per share on April 30, 2024, and on April 30 every five years thereafter. |
| 3 | Non-Cumulative 5-Year Rate Reset Preferred Shares NVCC, Series 24 (the "Series 24 Shares") issued by the Bank on June 4, 2019, at a price of $25 per share, with quarterly non-cumulative cash dividends on these shares, if declared, payable at a per annum rate of 5.10% for the initial period ending July 31, 2024. Thereafter, the dividend rate will reset every five years equal to the then five-year Government of Canada bond yield plus 3.56%. Holders of these shares will have the right to convert their shares into non-cumulative NVCC Floating Rate Preferred Shares, Series 25, subject to certain conditions, on July 31, 2024, and on July 31 every five years thereafter. Holders of the Series 25 Shares will be entitled to receive quarterly floating rate dividends, if declared, at a rate equal to the three-month Government of Canada Treasury Bill yield plus 3.56%. The Series 24 Shares are redeemable by the Bank, subject to regulatory consent, at $25 per share on July 31, 2024, and on July 31 every five years thereafter. |
| 4 | On July 18, 2019, the Bank announced that none of its 20 million Non-Cumulative 5-Year Rate Reset Preferred Shares NVCC, Series 3 (the "Series 3 Shares") would be converted on July 31, 2019, into Non-Cumulative 5-Year Rate Reset Preferred Shares NVCC, Series 4. As previously announced on July 2, 2019, the dividend rate for the Series 3 Shares for the 5-year period from and including July 31, 2019, but excluding July 31, 2024, will be 3.681%. |
| 5 | When the Bank purchases its own shares as part of its trading business, they are classified as treasury shares and the cost of these shares is recorded as a reduction in equity. |
Normal Course Issuer Bid
On June 14, 2019, the Bank announced that the Toronto Stock Exchange (TSX) and OSFI have approved the Bank's previously announced normal course issuer bid (NCIB) to repurchase for cancellation up to 20 million of its common shares.
The Bank's previous NCIB, which was announced on April 19, 2018 and as amended on December 10, 2018, expired on April 12, 2019. The Bank repurchased an aggregate of 30 million common shares under its previous NCIB, at an average price of $74.29 per share for a total amount of $2.2 billion.
During the three months ended July 31, 2019, the Bank repurchased 11.25 million common shares under its NCIB, at an average price of $76.91 per share for a total amount of $865 million. During the nine months ended July 31, 2019, the Bank repurchased an aggregate of 21.25 million common shares under its NCIB and its previous NCIB, at an average price of $74.95 per share, for a total amount of $1.6 billion.
During the year ended October 31, 2018, the Bank repurchased 20 million common shares under its previous NCIB at an average price of $75.07 per share for a total amount of $1.5 billion.
| TD BANK GROUP• THIRD QUARTER 2019• REPORT TO SHAREHOLDERS | Page 71 |
Table of Contents
Non-Controlling Interests in Subsidiaries
Redemption of TD CaTS III Securities
On December 31, 2018, TD Capital Trust III, a subsidiary of the Bank, redeemed all of the outstanding TD Capital Trust III Securities – Series 2008 (TD CaTS III) at a price of $1 billion plus the unpaid distribution payable on the redemption date. TD CaTS III were included inNon-controlling interests in subsidiaries on the Interim Consolidated Balance Sheet.
NOTE 15: SHARE-BASED COMPENSATION
For the three and nine months ended July 31, 2019, the Bank recognized compensation expense for stock option awards of $2.7 million and $9.0 million, respectively (three and nine months ended July 31, 2018 – $2.5 million and $9.0 million, respectively).
During the three months ended July 31, 2019 and July 31, 2018, nil stock options were granted by the Bank. During the nine months ended July 31, 2019, 2.2 million stock options (nine months ended July 31, 2018 – 1.9 million stock options) were granted by the Bank at a weighted-average fair value of $5.64 per option (July 31, 2018 – $6.28 per option).
The following table summarizes the assumptions used for estimating the fair value of options for the nine months ended July 31.
| Assumptions Used for Estimating the Fair Value of Options | ||||||||
| (in Canadian dollars, except as noted) | For the nine months ended | |||||||
July 31 2019 | July 31 2018 | |||||||
Risk-free interest rate | 2.03 | % | 1.71 | % | ||||
Expected option life | 6.3 years | 6.3 years | ||||||
Expected volatility1 | 12.64 | % | 13.91 | % | ||||
Expected dividend yield | 3.48 | % | 3.50 | % | ||||
Exercise price/share price | $ | 69.39 | $ | 72.64 | ||||
| 1 | Expected volatility is calculated based on the average daily volatility measured over a historical period corresponding to the expected option life. |
NOTE 16: EMPLOYEE BENEFITS
The following table summarizes expenses for the Bank's principal pension andnon-pension post-retirement benefit plans and the Bank's significant other pension and retirement plans, for the three and nine months ended July 31.
Employee Benefit Plans' Expenses | ||||||||||||||||||||||||
(millions of Canadian dollars) | | Principal pension plans |
| | Principal non-pension post-retirement benefit plan |
| | Other pension and retirement plans1 |
| |||||||||||||||
| For the three months ended | ||||||||||||||||||||||||
| | July 31 2019 | | July 31 2018 | | July 31 2019 | | July 31 2018 | | July 31 2019 | | July 31 2018 |
| ||||||||||||
Net employee benefits expense | ||||||||||||||||||||||||
Service cost – benefits earned | $ | 81 | $ | 102 | $ | 4 | $ | 4 | $ | 2 | $ | 2 | ||||||||||||
Net interest cost on net defined benefit liability | (3 | ) | 2 | 5 | 4 | 8 | 7 | |||||||||||||||||
Past service cost (credit) | 1 | – | – | – | – | 1 | ||||||||||||||||||
Defined benefit administrative expenses | 3 | 2 | – | – | 2 | 1 | ||||||||||||||||||
Total expense | $ | 82 | $ | 106 | $ | 9 | $ | 8 | $ | 12 | $ | 11 | ||||||||||||
| For the nine months ended | ||||||||||||||||||||||||
| | July 31 2019 | | July 31 2018 | | July 31 2019 | | July 31 2018 | | July 31 2019 | | July 31 2018 |
| ||||||||||||
Net employee benefits expense | ||||||||||||||||||||||||
Service cost – benefits earned | $ | 244 | $ | 305 | $ | 11 | $ | 12 | $ | 7 | $ | 7 | ||||||||||||
Net interest cost on net defined benefit liability | (9 | ) | 6 | 15 | 13 | 24 | 22 | |||||||||||||||||
Past service cost (credit) | 1 | – | – | – | 2 | (2 | ) | |||||||||||||||||
Defined benefit administrative expenses | 8 | 7 | – | – | 5 | 3 | ||||||||||||||||||
Total expense | $ | 244 | $ | 318 | $ | 26 | $ | 25 | $ | 38 | $ | 30 | ||||||||||||
| 1 | Includes Canada Trust (CT) defined benefit pension plan, TD Banknorth defined benefit pension plan, TD Auto Finance retirement plans, and supplemental employee retirement plans. Other employee benefit plans operated by the Bank and certain of its subsidiaries are not considered material for disclosure purposes. The TD Banknorth defined benefit pension plan was frozen as of December 31, 2008, and no service credits can be earned after that date. Certain TD Auto Finance defined benefit pension plans were frozen as of April 1, 2012, and no service credits can be earned after March 31, 2012. |
| TD BANK GROUP• THIRD QUARTER 2019• REPORT TO SHAREHOLDERS | Page 72 |
Table of Contents
CASH FLOWS
The following table summarizes the Bank's contributions to its principal pension andnon-pension post-retirement benefit plans and the Bank's significant other pension and retirement plans during the three and nine months ended July 31.
| Plan Contributions | ||||||||||||||||
| (millions of Canadian dollars) | For the three months ended | For the nine months ended | ||||||||||||||
July 31 2019 | July 31 2018 | July 31 2019 | July 31 2018 | |||||||||||||
Principal pension plans | $ | 89 | $ | 69 | $ | 267 | $ | 259 | ||||||||
Principalnon-pension post-retirement benefit plan | 3 | 4 | 11 | 11 | ||||||||||||
Other pension and retirement plans1 | 69 | 13 | 88 | 29 | ||||||||||||
Total | $ | 161 | $ | 86 | $ | 366 | $ | 299 | ||||||||
| 1 | Includes CT defined benefit pension plan, TD Banknorth defined benefit pension plan, TD Auto Finance retirement plans, and supplemental employee retirement plans. Other employee benefit plans operated by the Bank and certain of its subsidiaries are not considered material for disclosure purposes. |
As at July 31, 2019, the Bank expects to contribute an additional $86 million to its principal pension plans, $5 million to its principalnon-pensionpost-retirement benefit plan, and $13 million to its other pension and retirement plans by the end of the fiscal year. However, future contribution amounts may change upon the Bank's review of current contribution levels during fiscal 2019.
NOTE 17: INCOME TAXES
The Canada Revenue Agency (CRA) and Alberta Tax and Revenue Administration (TRA) are denying certain dividend deductions claimed by the Bank. On August 9, 2019, the Bank received a proposal letter from the CRA for additional income tax of $225 million for 2014, excluding interest. As at July 31, 2019, the CRA and TRA have reassessed the Bank for approximately $553 million of income tax and interest for the years 2011 to 2013. The Bank expects the CRA and TRA to reassess subsequent years on the same basis and that Revenu Québec will also reassess all open years. The Bank is of the view that its tax filing positions were appropriate and intends to challenge all reassessments.
NOTE 18: EARNINGS PER SHARE
Basic earnings per share is calculated by dividing net income attributable to common shareholders by the weighted-average number of common shares outstanding for the period.
Diluted earnings per share is calculated using the same method as basic earnings per share except that certain adjustments are made to net income attributable to common shareholders and the weighted-average number of shares outstanding for the effects of all dilutive potential common shares that are assumed to be issued by the Bank.
The following table presents the Bank's basic and diluted earnings per share for the three and nine months ended July 31.
| Basic and Diluted Earnings Per Share | ||||||||||||||||
| (millions of Canadian dollars, except as noted) | For the three months ended | For the nine months ended | ||||||||||||||
July 31 2019 | July 31 2018 | July 31 2019 | July 31 2018 | |||||||||||||
Basic earnings per share | ||||||||||||||||
Net income attributable to common shareholders | $ | 3,186 | $ | 3,028 | $ | 8,628 | $ | 8,157 | ||||||||
Weighted-average number of common shares outstanding (millions) | 1,825.3 | 1,830.0 | 1,828.4 | 1,838.4 | ||||||||||||
Basic earnings per share(Canadian dollars) | $ | 1.75 | $ | 1.65 | $ | 4.72 | $ | 4.44 | ||||||||
Diluted earnings per share | ||||||||||||||||
Net income attributable to common shareholders | $ | 3,186 | $ | 3,028 | $ | 8,628 | $ | 8,157 | ||||||||
Net income available to common shareholders includingimpact of dilutive securities | 3,186 | 3,028 | 8,628 | 8,157 | ||||||||||||
Weighted-average number of common shares outstanding (millions) | 1,825.3 | 1,830.0 | 1,828.4 | 1,838.4 | ||||||||||||
Effect of dilutive securitiesStock options potentially exercisable (millions)1 | 3.3 | 4.0 | 3.2 | 4.2 | ||||||||||||
Weighted-average number of common shares outstanding –diluted (millions) | 1,828.6 | 1,834.0 | 1,831.6 | 1,842.6 | ||||||||||||
Diluted earnings per share(Canadian dollars)1 | $ | 1.74 | $ | 1.65 | $ | 4.71 | $ | 4.43 | ||||||||
| 1 | For the three and nine months ended July 31, 2019 and July 31, 2018, no outstanding options were excluded from the computation of diluted earnings per share. |
| TD BANK GROUP• THIRD QUARTER 2019• REPORT TO SHAREHOLDERS | Page 73 |
Table of Contents
NOTE 19: CONTINGENT LIABILITIES
Other than as described below, there have been no new significant events or transactions as previously identified in Note 27 of the Bank's 2018 Annual Consolidated Financial Statements.
LITIGATION
In the ordinary course of business, the Bank and its subsidiaries are involved in various legal and regulatory actions. The Bank establishes legal provisions when it becomes probable that the Bank will incur a loss and the amount can be reliably estimated. The Bank also estimates the aggregate range of reasonably possible losses (RPL) in its legal and regulatory actions (that is, those which are neither probable nor remote), in excess of provisions. As at July 31, 2019, the Bank's RPL is from zero to approximately $608 million (October 31, 2018 – from zero to approximately $763 million). The Bank's provisions and RPL represent the Bank's best estimates based upon currently available information for actions for which estimates can be made, but there are a number of factors that could cause the Bank's provisions and/or RPL to be significantly different from its actual or reasonably possible losses. For example, the Bank's estimates involve significant judgment due to the varying stages of the proceedings, the existence of multiple defendants in many proceedings whose share of liability has yet to be determined, the numerousyet-unresolved issues in many of the proceedings, some of which are beyond the Bank's control and/or involve novel legal theories and interpretations, the attendant uncertainty of the various potential outcomes of such proceedings, and the fact that the underlying matters will change from time to time. In addition, some actions seek very large or indeterminable damages.
In management's opinion, based on its current knowledge and after consultation with counsel, the ultimate disposition of these actions, individually or in the aggregate, will not have a material adverse effect on the consolidated financial condition or the consolidated cash flows of the Bank. However, because of the factors listed above, as well as other uncertainties inherent in litigation and regulatory matters, there is a possibility that the ultimate resolution of legal or regulatory actions may be material to the Bank's consolidated results of operations for any particular reporting period.
Stanford Litigation – On February 28, 2019, the Bank, along with the other bank defendants, filed a motion for judgment on the pleadings in the Official Stanford Investors Committee's case seeking dismissal of three claims (aiding and abetting fraud, aiding and abetting conversion, and aiding and abetting breach of fiduciary duty). The motion was fully briefed as of April 4, 2019. On May 3, 2019, two groups of plaintiffs comprising more than 950 individual investors in certificates of deposit issued by Stanford International Bank, Limited filed motions to intervene in the Official Stanford Investors Committee's case against the Bank and the other bank defendants. Discovery against the bank defendants is ongoing. In the two cases in the Ontario Superior Court of Justice, the Bank is the sole defendant and a trial date has been scheduled for January 2021.
Overdraft Litigation – On February 1, 2019, the parties filed a Joint Notice of Settlement of all claims consolidated in MDL 2613 on a class-wide basis. In response to the Notice of Settlement, on February 4, 2019, the Court issued an order suspending all deadlines. On June 26, 2019, the Court issued an order preliminarily approving settlement of all claims consolidated in MDL 2613 on a class wide basis and directing notice to settlement class members. A final approval hearing is scheduled for January 8, 2020.
Credit Card Fees – The trial of the British Columbia action is scheduled for October 2020.
Consumer Class Actions – The Bank, along with several other Canadian financial institutions, is a defendant in a number of matters brought by consumers alleging provincial class claims in connection with various fees, interest rate calculations, and credit decisions. The cases are in various stages of maturity. In one matter, the Bank is the sole defendant and a trial date has been scheduled for November 2020.
| TD BANK GROUP• THIRD QUARTER 2019• REPORT TO SHAREHOLDERS | Page 74 |
Table of Contents
NOTE 20: SEGMENTED INFORMATION
For management reporting purposes, the Bank reports its results under three key business segments: Canadian Retail, which includes the results of the Canadian personal and commercial banking, wealth, and insurance businesses; U.S. Retail, which includes the results of the U.S. personal and business banking operations, wealth management services, and the Bank's investment in TD Ameritrade; and Wholesale Banking. The Bank's other activities are grouped into the Corporate segment.
Refer to Note 29 of the Bank's 2018 Annual Consolidated Financial Statements for additional segment disclosures.
The following table summarizes the segment results for the three and nine months ended July 31.
| Results by Business Segment1,2 | ||||||||||||||||||||||||||||||||||||||||||||
| (millions of Canadian dollars) | Canadian Retail | U.S. Retail | Wholesale Banking3 | Corporate3 | Total | |||||||||||||||||||||||||||||||||||||||
| For the three months ended | ||||||||||||||||||||||||||||||||||||||||||||
| July 31 2019 | July 31 2018 | July 31 2019 | July 31 2018 | July 31 2019 | July 31 2018 | July 31 2019 | July 31 2018 | July 31 2019 | July 31 2018 | |||||||||||||||||||||||||||||||||||
Net interest income (loss) | $ | 3,122 | $ | 2,948 | $ | 2,241 | $ | 2,114 | $ | 198 | $ | 276 | $ | 463 | $ | 317 | $ | 6,024 | $ | 5,655 | ||||||||||||||||||||||||
Non-interest income (loss) | 3,024 | 2,851 | 745 | 698 | 716 | 533 | (10 | ) | 162 | 4,475 | 4,244 | |||||||||||||||||||||||||||||||||
Total revenue4 | 6,146 | 5,799 | 2,986 | 2,812 | 914 | 809 | 453 | 479 | 10,499 | 9,899 | ||||||||||||||||||||||||||||||||||
Provision for (recovery of) credit losses | 316 | 246 | 255 | 222 | 1 | (14 | ) | 83 | 107 | 655 | 561 | |||||||||||||||||||||||||||||||||
Insurance claims and related expenses | 712 | 627 | – | – | – | – | – | – | 712 | 627 | ||||||||||||||||||||||||||||||||||
Non-interest expenses | 2,533 | 2,400 | 1,604 | 1,528 | 594 | 532 | 643 | 671 | 5,374 | 5,131 | ||||||||||||||||||||||||||||||||||
Income (loss) before income taxes | 2,585 | 2,526 | 1,127 | 1,062 | 319 | 291 | (273 | ) | (299 | ) | 3,758 | 3,580 | ||||||||||||||||||||||||||||||||
Provision for (recovery of) income taxes | 695 | 674 | 134 | 144 | 75 | 68 | (91 | ) | (181 | ) | 813 | 705 | ||||||||||||||||||||||||||||||||
Equity in net income of an investment in TD Ameritrade | – | – | 294 | 225 | – | – | 9 | 5 | 303 |
| 230 |
| ||||||||||||||||||||||||||||||||
Net income (loss) | $ | 1,890 | $ | 1,852 | $ | 1,287 | $ | 1,143 | $ | 244 | $ | 223 | $ | (173 | ) | $ | (113 | ) | $ | 3,248 | $ | 3,105 | ||||||||||||||||||||||
| For the nine months ended | ||||||||||||||||||||||||||||||||||||||||||||
| July 31 2019 | July 31 2018 | July 31 2019 | July 31 2018 | July 31 2019 | July 31 2018 | July 31 2019 | July 31 2018 | July 31 2019 | July 31 2018 | |||||||||||||||||||||||||||||||||||
Net interest income (loss) | $ | 9,176 | $ | 8,554 | $ | 6,719 | $ | 6,031 | $ | 633 | $ | 877 | $ | 1,228 | $ | 1,021 | $ | 17,756 | $ | 16,483 | ||||||||||||||||||||||||
Non-interest income (loss) | 8,917 | 8,307 | 2,123 | 2,055 | 1,750 | 1,709 | 179 | 202 | 12,969 | 12,273 | ||||||||||||||||||||||||||||||||||
Total revenue4 | 18,093 | 16,861 | 8,842 | 8,086 | 2,383 | 2,586 | 1,407 | 1,223 | 30,725 | 28,756 | ||||||||||||||||||||||||||||||||||
Provision for (recovery of) credit losses | 906 | 735 | 787 | 673 | 3 | (5 | ) | 442 | 407 | 2,138 | 1,810 | |||||||||||||||||||||||||||||||||
Insurance claims and related expenses | 2,082 | 1,760 | – | – | – | – | – | – | 2,082 | 1,760 | ||||||||||||||||||||||||||||||||||
Non-interest expenses | 8,098 | 6,943 | 4,742 | 4,463 | 1,793 | 1,574 | 1,844 | 1,849 | 16,477 | 14,829 | ||||||||||||||||||||||||||||||||||
Income (loss) before income taxes | 7,007 | 7,423 | 3,313 | 2,950 | 587 | 1,017 | (879 | ) | (1,033 | ) | 10,028 | 10,357 | ||||||||||||||||||||||||||||||||
Provision for (recovery of) income taxes | 1,889 | 1,981 | 386 | 341 | 139 | 249 | (325 | ) | (80 | ) | 2,089 | 2,491 | ||||||||||||||||||||||||||||||||
Equity in net income of an investment in TD Ameritrade | – | – | 863 | 465 | – | – | 28 | 43 | 891 | 508 | ||||||||||||||||||||||||||||||||||
Net income (loss) | $ | 5,118 | $ | 5,442 | $ | 3,790 | $ | 3,074 | $ | 448 | $ | 768 | $ | (526 | ) | $ | (910 | ) | $ | 8,830 | $ | 8,374 | ||||||||||||||||||||||
Total assets | $ | 447,921 | $ | 425,264 | $ | 426,548 | $ | 408,745 | $ | 466,080 | $ | 405,591 | $ | 64,893 | $ | 52,904 | $ | 1,405,442 | $ | 1,292,504 | ||||||||||||||||||||||||
| 1 | Certain comparative amounts have been recast to conform with the presentation adopted in the current period. |
| 2 | The retailer program partners' share of revenues and credit losses is presented in the Corporate segment, with an offsetting amount (representing the partners' net share) recorded inNon-interest expenses, resulting in no impact to Corporate reported Net income (loss). The Net income (loss) included in the U.S. Retail segment includes only the portion of revenue and credit losses attributable to the Bank under the agreements. |
| 3 | Net interest income within Wholesale Banking is calculated on a taxable equivalent basis (TEB). The TEB adjustment reflected in Wholesale Banking is reversed in the Corporate segment. |
| 4 | The impact from certain treasury and balance sheet management activities relating to the U.S. Retail segment is recorded in the Corporate segment. |
| TD BANK GROUP• THIRD QUARTER 2019• REPORT TO SHAREHOLDERS | Page 75 |
Table of Contents
NOTE 21: INTEREST INCOME AND EXPENSE
The following table presents interest income and interest expense by basis of accounting measurement. Please refer to Note 2 of the 2018 Annual Consolidated Financial Statements for the types of instruments measured at amortized cost and FVOCI.
| Interest Income and Expense | ||||||||||||||||
| (millions of Canadian dollars) | For the three months ended | |||||||||||||||
| July 31, 2019 | July 31, 2018 | |||||||||||||||
| Interest income | Interest expense | Interest income | Interest expense | |||||||||||||
Measured at amortized cost | $ | 8,050 | $ | 2,860 | $ | 7,053 | $ | 2,475 | ||||||||
Measured at FVOCI | 788 | – | 800 | – | ||||||||||||
| 8,838 | 2,860 | 7,853 | 2,475 | |||||||||||||
Not measured at amortized cost or FVOCI1 | 1,806 | 1,760 | 1,658 | 1,381 | ||||||||||||
Total | $ | 10,644 | $ | 4,620 | $ | 9,511 | $ | 3,856 | ||||||||
| For the nine months ended | ||||||||||||||||
| July 31, 2019 | July 31, 2018 | |||||||||||||||
| Interest income | Interest expense | Interest income | Interest expense | |||||||||||||
Measured at amortized cost | $ | 23,600 | $ | 8,611 | $ | 20,114 | $ | 6,581 | ||||||||
Measured at FVOCI | 2,477 | – | 2,150 | – | ||||||||||||
| 26,077 | 8,611 | 22,264 | 6,581 | |||||||||||||
Not measured at amortized cost or FVOCI1 | 5,384 | 5,094 | 4,164 | 3,364 | ||||||||||||
Total | $ | 31,461 | $ | 13,705 | $ | 26,428 | $ | 9,945 | ||||||||
| 1 | Includes interest income, interest expense, and dividend income for financial instruments that are measured or designated at fair value through profit or loss and equities designated at FVOCI. |
NOTE 22: REGULATORY CAPITAL
The Bank manages its capital under guidelines established by OSFI. The regulatory capital guidelines measure capital in relation to credit, market, and operational risks. The Bank has various capital policies, procedures, and controls which it utilizes to achieve its goals and objectives.
During the nine months ended July 31, 2019, the Bank complied with the OSFI Basel III guidelines related to capital ratios and the leverage ratio. Effective January 1, 2016, OSFI's target Common Equity Tier 1 (CET1), Tier 1, and Total Capital ratios for Canadian banks designated as domestic systemically important banks(D-SIBs) includes a 1% common equity capital surcharge bringing the targets to 8%, 9.5%, and 11.5%, respectively. In addition, on June 25, 2018, OSFI provided greater transparency related to previously undisclosed Pillar 2 CET1 capital buffers through the introduction of the public Domestic Stability Buffer, which is held byD-SIBs against Pillar 2 risks. The current buffer is set at 1.75% of total risk-weighted assets (RWA) and must be met with CET1 Capital, effectively raising the CET1 target to 9.75%.
The following table summarizes the Bank's regulatory capital positions as at July 31, 2019 and October 31, 2018.
| Regulatory Capital Position | ||||||||
| (millions of Canadian dollars, except as noted) | As at | |||||||
| July 31 2019 | October 31 2018 | |||||||
Capital | ||||||||
Common Equity Tier 1 Capital | $ | 54,478 | $ | 52,389 | ||||
Tier 1 Capital | 61,114 | 59,735 | ||||||
Total Capital | 73,369 | 70,434 | ||||||
Risk-weighted assets used in the calculation of capital ratios1 | ||||||||
Common Equity Tier 1 Capital | $ | 454,881 | $ | 435,632 | ||||
Tier 1 Capital | 454,881 | 435,780 | ||||||
Total Capital | 454,881 | 435,927 | ||||||
Capital and leverage ratios | ||||||||
Common Equity Tier 1 Capital ratio1 | 12.0 | % | 12.0 | % | ||||
Tier 1 Capital ratio1 | 13.4 | 13.7 | ||||||
Total Capital ratio1 | 16.1 | 16.2 | ||||||
Leverage ratio | 4.1 | 4.2 | ||||||
| 1 | In accordance with the final Capital Adequacy Requirements guideline, the Credit Valuation Adjustment (CVA) capital charge has been phased in until the first quarter of 2019. Each capital ratio has its own RWA measure due to the OSFI prescribed scalar for inclusion of the CVA. For fiscal 2019, the corresponding scalars are all 100%. For fiscal 2018, the scalars for inclusion of CVA for CET1, Tier 1, and Total Capital RWA were 80%, 83%, and 86%, respectively. |
NOTE 23: RISK MANAGEMENT
The risk management policies and procedures of the Bank are provided in the MD&A. The shaded sections of the "Managing Risk" section of the MD&A relating to market, liquidity, and insurance risks are an integral part of the Interim Consolidated Financial Statements.
| TD BANK GROUP• THIRD QUARTER 2019• REPORT TO SHAREHOLDERS | Page 76 |
Table of Contents
SHAREHOLDER AND INVESTOR INFORMATION
Shareholder Services
| If you: | And your inquiry relates to: | Please contact: | ||
| Are aregistered shareholder (your name appears on your TD share certificate) | Missing dividends, lost share certificates, estate questions, address changes to the share register, dividend bank account changes, the dividend reinvestment plan, eliminating duplicate mailings of shareholder materials, or stopping (or resuming) receiving annual and quarterly reports | Transfer Agent: AST Trust Company (Canada) Montréal, Québec H3B 3K3 1-800-387-0825 (Canada and U.S. only) or416-682-3860 Facsimile:1-888-249-6189 inquiries@astfinancial.com or www.astfinancial.com/ca.en
| ||
Hold your TD shares through the Direct Registration System in the United States | Missing dividends, lost share certificates, estate questions, address changes to the share register, eliminating duplicate mailings of shareholder materials, or stopping (or resuming) receiving annual and quarterly reports | Co-Transfer Agent and Registrar: Computershare Louisville, KY 40233, or
Computershare 462 South 4th Street, Suite 1600 Louisville, KY 40202 1-866-233-4836 TDD for hearing impaired:1-800-231-5469 Shareholders outside of U.S.:201-680-6578 TDD shareholders outside of U.S.:201-680-6610
| ||
Beneficially own TD shares that are held in the name of an intermediary, such as a bank, a trust company, a securities broker, or other nominee
| Your TD shares, including questions regarding the dividend reinvestment plan and mailings of shareholder materials | Your intermediary | ||
For all other shareholder inquiries, please contact TD Shareholder Relations at 416-944-6367 or 1-866-756-8936 or emailtdshinfo@td.com. Please note that by leaving us an e-mail or voicemail message, you are providing your consent for us to forward your inquiry to the appropriate party for response.
Normal Course Issuer Bid
On June 14, 2019, the Bank announced that the TSX and OSFI approved the Bank's previously announced Normal Course Issuer Bid (NCIB) to repurchase for cancellation up to 20 million of the Bank's common shares. Pursuant to the Notice of Intention filed with the TSX, the NCIB ends on June 17, 2020, such earlier date as the Bank may determine or such earlier date as the Bank may complete its purchases. A copy of the Notice may be obtained without charge by contacting TD Shareholder Relations by phone at 416-944-6367 or 1-866-756-8936 or by e-mail attdshinfo@td.com.
General Information
Products and services: Contact TD Canada Trust, 24 hours a day, seven days a week: 1-866-567-8888
French: 1-866-233-2323
Cantonese/Mandarin: 1-800-328-3698
Telephone device for the hearing impaired (TTY): 1-800-361-1180
Website:www.td.com
Email:customer.service@td.com
Quarterly Earnings Conference Call
TD Bank Group will host an earnings conference call in Toronto, Ontario on August 29, 2019. The call will be audio webcast live through TD's website at 1:30 p.m. ET. The call and audio webcast will feature presentations by TD executives on the Bank's financial results for the third quarter, discussions of related disclosures, and will be followed by a question-and-answer period with analysts. The presentation material referenced during the call will be available on the TD website atwww.td.com/investor/qr_2019.jsp on August 29, 2019, by approximately 12 p.m. ET. A listen-only telephone line is available at 416-641-6150 or 1-866-696-5894 (toll free) and the passcode is 2727354#.
The audio webcast and presentations will be archived atwww.td.com/investor/qr_2019.jsp. Replay of the teleconference will be available from 3:30 p.m. ET on August 29, 2019, until 11:59 p.m. ET on Thursday, September 26, 2019 by calling 905-694-9451 or 1-800-408-3053 (toll free). The passcode is 4990143#.
Annual Meeting
Thursday, April 2, 2020
Toronto, Ontario
| TD BANK GROUP• THIRD QUARTER 2019• REPORT TO SHAREHOLDERS | Page 77 |