UNITED STATES
SECURITIES AND EXCHANGE COMMISSION
Washington, D.C. 20549
FORM N-CSR
CERTIFIED SHAREHOLDER REPORT OF REGISTERED
MANAGEMENT INVESTMENT COMPANIES
Investment Company Act file number: 811-9060
HOLLAND SERIES FUND, INC.
(Exact name of registrant as specified in charter)
375 PARK AVENUE
NEW YORK, NEW YORK 10152
(Address of principal executive offices)(Zip code)
| | |
| (Name and Address of Agent for Service) | | Copy to: |
Michael Holland President and Treasurer Holland Series Fund, Inc. 375 Park Avenue New York, New York 10152 | | State Street Bank and Trust Company Andrew DeLorme, Esq. 4 Copley Place, 5th Floor Boston, Massachusetts 02116 and Timothy Diggins, Esq. Ropes & Gray 800 Boylston Street Boston, Massachusetts 02199-3600 |
Registrant’s telephone number, including area code: (800) 304-6552
Date of fiscal year end: September 30th
Date of reporting period: March 31, 2013
Item 1: Shareholder Report

Holland Series Fund, Inc.
| | |
| Holland Balanced Fund • | | LETTERFROMTHE PRESIDENT |
March 31, 2013

Dear Fellow Shareholders:
Our Fund has once again been rewarded for staying on course. Our Fund’s total return for the six months ended March 31, 2013 is 6.83% compared to 6.69% for the Lipper Balanced Fund Index and 10.60% for the Standard & Poor’s 500 Index. Our Fund’s cumulative total return since inception (October 2, 1995 through March 31, 2013) is 174.40%, so that an initial investment of $10,000 has grown to $27,440.
Moreover, the past twelve months have been among the most rewarding for our Fund on both a relative and absolute basis:
| | | | |
| | | 4/1/2012 – 3/31/2013 | |
Holland Balanced Fund | | | 11.15 | % |
Lipper Balanced Fund Index | | | 9.37 | % |
Standard & Poor’s 500 Index | | | 10.05 | % |
90 Day U.S. Treasury Bill | | | 0.08 | % |
Many of our portfolio companies have consistently performed well during a very challenging era. Meanwhile, we believe such companies’ market valuations remain relatively attractive when considering historically low interest rates. Our fixed income holdings remain relatively short in maturity.
As the Fund’s largest individual shareholder, I am pleased to be able to share this investment vehicle with you.
With Bullish Regards,

Michael F. Holland
President and Founder
Investing involves risk, including possible loss of principal.
Performance data quoted represents past performance. Past performance does not guarantee future results. All performance assumes reinvestment of dividends and capital gains. The investment return and principal value of an investment will fluctuate so that an investor’s shares, when redeemed, may be worth less than their original cost. Current performance may be lower than the performance data quoted. Performance data current to the most recent month-end may be obtained by calling: 1-800-304-6552.
1
Holland Series Fund, Inc.
| | |
| Holland Balanced Fund • | | CUMULATIVE PERFORMANCE (UNAUDITED) |
March 31, 2013
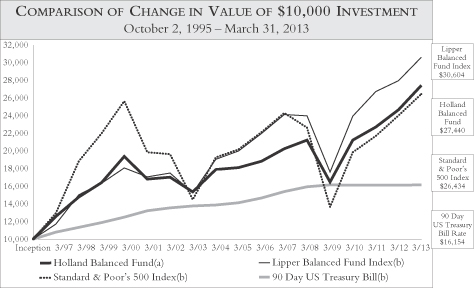
Set forth below are the cumulative total return figures for the periods indicated and a graph showing a hypothetical $10,000 investment made in the Holland Balanced Fund, Lipper Balanced Fund Index, Standard & Poors 500 Index and the 90 Day US Treasury Bill on October 2, 1995. The cumulative and annualized total return figures and the information in the graph represent past performance and are not indicative of future results. Cumulative performance is the aggregate amount that an investment has gained or lost over the specified time period. The total returns reflect changes in price of the Fund’s shares and assume that any income dividends and/or capital gain distributions made by the Fund during the period were reinvested in additional shares of the Fund. Investment return and principal value of an investment will fluctuate so that an investor’s shares, when redeemed, may be worth less than their original cost. Fund annual operating expenses gross of Advisory Fee waivers for the six month period ended March 31, 2013 were 2.04%.
| | | | | | | | | | | | | | | | | | | | |
| INVESTMENT PERFORMANCE | |
| For the Periods Ended March 31, 2013 | |
| Return over the period | | One Year | | | Average
Annualized
Five Year | | | Average
Annualized
Ten Year | | | Average
Annualized
Since
Inception
(10/2/95) | | | Total Return
Cumulative
Since
Inception
(10/2/95) | |
Holland Balanced Fund (a) | | | 11.15 | % | | | 5.28 | % | | | 5.96 | % | | | 5.94 | % | | | 174.40 | % |
Lipper Balanced Fund Index (b) | | | 9.37 | % | | | 5.04 | % | | | 7.27 | % | | | 6.60 | % | | | 206.04 | % |
Standard & Poor’s 500 Index (b) | | | 10.05 | % | | | 3.15 | % | | | 6.17 | % | | | 5.71 | % | | | 164.34 | % |
90 Day U.S. Treasury Bill (b) | | | 0.08 | % | | | 0.25 | % | | | 1.62 | % | | | 2.78 | % | | | 61.54 | % |
2
Holland Series Fund, Inc.
| | |
| Holland Balanced Fund • | | MANAGEMENTDISCUSSIONOF
FUNDPERFORMANCE (UNAUDITED) |
March 31, 2013
Since inception (October 2, 1995 through March 31, 2013), our Fund’s cumulative total return is 174.40%. This compares to 164.34% for the Standard & Poor’s 500 Index and 206.04% for the Lipper Balanced Fund Index. For the past six months, our Fund’s total return is 6.83% compared to 10.60% for the Standard & Poor’s 500 Index and 6.69% for the Lipper Balanced Fund Index.
During the past six months, the equities of some of the largest and strongest U.S. companies were among the top performers, and this was seen in our Fund’s performance. Companies such as 3M, Home Depot, and Walmart were among the positive contributors.
On the negative side, Exxon Mobil, which has generally been a positive contributor over the life of our Fund, was among the lowest — but positive — returns during the period.
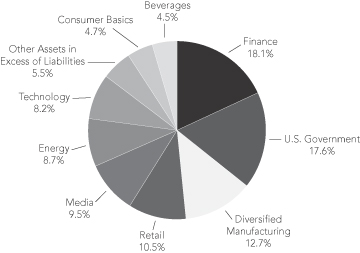
Portfolio composition by sector
(as a % of total net assets) – Unaudited
3
Holland Series Fund, Inc.
| | |
| Holland Balanced Fund • | | MANAGEMENT DISCUSSIONOF FUND PERFORMANCE (UNAUDITED) (concluded) |
NOTESTO PERFORMANCE
| (a) | Reflects waiver of fees by the investment adviser (“Advisory Fee waiver”). Absent such Advisory Fee waiver, the Fund’s total return would have been lower. |
| (b) | The Lipper Balanced Fund Index is an index of open-end mutual funds whose primary objective is to conserve principal by maintaining at all times a balanced portfolio of both stocks and bonds. Typically, the stock/bond ratio ranges around 60%/40%. The Standard & Poor’s 500 Index is a capitalization-weighted index of 500 widely held stocks recognized by investors to be representative of the stock market in general. The 90-Day U.S. Treasury Bill rate is the average return on three-month U.S. Treasury Bills. The Standard & Poor’s 500 Index and the Lipper Balanced Fund Index are unmanaged and do not reflect the actual cost of investing in the instruments that comprise the index; however, the Lipper Balanced Fund Index is composed of actively managed mutual funds and its returns reflect the costs of investing in those mutual funds. You cannot invest directly in an index. |
4
Holland Series Fund, Inc.
| | |
| Holland Balanced Fund • | | STATEMENTOF NET ASSETS |
| | | | | | | | |
| March 31, 2013 (Unaudited) | | Shares | | | Value† | |
Common Stocks(a)–76.9% | | | | | | | | |
| | |
Beverages–4.5% | | | | | | | | |
PepsiCo, Inc. | | | 16,000 | | | $ | 1,265,760 | |
| | | | | | | | |
| | |
Consumer Finance–4.4% | | | | | | | | |
American Express Co. | | | 18,500 | | | | 1,248,010 | |
| | | | | | | | |
| | |
Diversified Financial Services–3.3% | | | | | | | | |
JPMorgan Chase & Co. | | | 20,000 | | | | 949,200 | |
| | | | | | | | |
| | |
Energy Equipment & Services–4.2% | | | | | | | | |
Schlumberger, Ltd. | | | 15,800 | | | | 1,183,262 | |
| | | | | | | | |
| | |
Food & Staples Retailing–5.3% | | | | | | | | |
Wal-Mart Stores, Inc. | | | 20,000 | | | | 1,496,600 | |
| | | | | | | | |
| | |
Industrial Conglomerates–9.4% | | | | | | | | |
3M Co. | | | 13,600 | | | | 1,445,816 | |
General Electric Co. | | | 52,900 | | | | 1,223,048 | |
| | | | | | | | |
| | | | | | | 2,668,864 | |
| | | | | | | | |
| | |
Insurance–10.4% | | | | | | | | |
Berkshire Hathaway, Inc. Class A* | | | 10 | | | | 1,562,800 | |
Chubb Corp. | | | 16,000 | | | | 1,400,480 | |
| | | | | | | | |
| | | | | | | 2,963,280 | |
| | | | | | | | |
| | |
IT Services–4.4% | | | | | | | | |
International Business Machines Corp. | | | 5,900 | | | | 1,258,470 | |
| | | | | | | | |
| | |
Media–9.5% | | | | | | | | |
Comcast Corp. Class A | | | 34,000 | | | | 1,428,340 | |
The Walt Disney Co. | | | 22,400 | | | | 1,272,320 | |
| | | | | | | | |
| | | | | | | 2,700,660 | |
| | | | | | | | |
| | |
Oil, Gas & Consumable Fuels–4.5% | | | | | | | | |
Exxon Mobil Corp. | | | 14,300 | | | | 1,288,573 | |
| | | | | | | | |
| | |
Pharmaceuticals–4.7% | | | | | | | | |
Johnson & Johnson | | | 16,200 | | | | 1,320,786 | |
| | | | | | | | |
| |
Semiconductors & Semiconductor Equipment–3.3% | | | | | |
Intel Corp. | | | 42,700 | | | | 932,995 | |
| | | | | | | | |
| | |
Software–3.8% | | | | | | | | |
Microsoft Corp. | | | 37,900 | | | | 1,084,319 | |
| | | | | | | | |
|
See Accompanying Notes to Financial Statements | |
5
Holland Series Fund, Inc.
| | |
| Holland Balanced Fund • | | STATEMENTOF NET ASSETS (continued) |
| | | | | | | | |
| March 31, 2013 (Unaudited) | | Shares | | | Value† | |
| | |
Specialty Retail–5.2% | | | | | | | | |
Home Depot, Inc. | | | 21,000 | | | $ | 1,465,380 | |
| | | | | | | | |
Total Common Stocks (Cost–$14,019,166) | | | | | | | 21,826,159 | |
| | | | | | | | |
| | |
| | | Principal | | | Value† | |
U.S. Government Security–17.6% | | | | | | | | |
| | |
U.S. Treasury Bill–17.6% | | | | | | | | |
United States Treasury Bill, 0.150%
due 10/17/13 (Cost–$4,995,854) | | $ | 5,000,000 | | | | 4,995,854 | |
| | | | | | | | |
Total Investments–94.5% (Cost–$19,015,020) | | | | | | | 26,822,013 | |
| | | | | | | | |
Other Assets In Excess Of Liabilities–5.5% | | | | | | | 1,565,478 | |
| | | | | | | | |
Net Assets–100% | | | | | | | | |
Applicable to 1,630,190 outstanding $0.01 par value shares (authorized 1,000,000,000) | | | | | | $ | 28,387,491 | |
| | | | | | | | |
Net asset value, offering price and redemption price per share | | | | | | $ | 17.41 | |
| | | | | | | | |
|
See Accompanying Notes to Financial Statements | |
6
Holland Series Fund, Inc.
| | |
| Holland Balanced Fund • | | STATEMENTOF NET ASSETS (concluded) |
| | | | |
| March 31, 2013 (Unaudited) | | Value† | |
Components of Net Assets as of March 31, 2013 | | | | |
Capital stock at par value ($0.01) | | $ | 16,302 | |
Capital stock in excess of par value | | | 20,574,054 | |
Overdistributed net investment income | | | (9,858 | ) |
Net unrealized appreciation on investments in securities | | | 7,806,993 | |
| | | | |
Net Assets | | $ | 28,387,491 | |
| | | | |
See Accompanying Notes to Financial Statements
(a) All percentages are based on the net assets of the Holland Balanced Fund as of March 31, 2013.
* Non-income producing
† See Note 2 to Financial Statements
7
Holland Series Fund, Inc.
| | |
| Holland Balanced Fund • | | STATEMENTOF OPERATIONS |
| | | | |
| Six Months Ended March 31, 2013 (Unaudited) | | | |
Investment Income: | | | | |
Dividends | | $ | 238,957 | |
Interest income (Note 2) | | | 5,480 | |
| | | | |
Total investment income | | | 244,437 | |
| | | | |
Expenses: | | | | |
Investment advisory fees (Note 3) | | | 102,516 | |
Administration and custody fees (Note 4) | | | 74,702 | |
Transfer agent fees | | | 28,034 | |
Shareholder reports | | | 15,258 | |
Compliance service fees | | | 14,959 | |
Registration fees | | | 12,454 | |
Audit fees | | | 11,169 | |
Legal fees | | | 9,644 | |
Directors fees | | | 7,479 | |
Insurance fees | | | 1,052 | |
Miscellaneous expenses | | | 2,191 | |
| | | | |
Total operating expenses | | | 279,458 | |
Waiver of investment advisory fee (Note 3) | | | (46,137 | ) |
| | | | |
Net expenses | | | 233,321 | |
| | | | |
Net investment income | | | 11,116 | |
| | | | |
Net Realized and Unrealized Gain on Investments | | | | |
Net realized gain on investments | | | 91,770 | |
Net change in unrealized appreciation | | | 1,714,917 | |
| | | | |
Net realized and unrealized gain on investments | | | 1,806,687 | |
| | | | |
Net increase in net assets resulting from operations | | $ | 1,817,803 | |
| | | | |
See Accompanying Notes to Financial Statements
8
Holland Series Fund, Inc.
| | |
| Holland Balanced Fund • | | STATEMENTSOF CHANGESIN NET ASSETS |
| | | | | | | | |
| | | Six Months Ended
March 31, 2013
(Unaudited) | | | Year Ended
September 30,
2012 | |
Net Increase/(Decrease) in Net Assets
Resulting from Operations: | |
Net investment income | | $ | 11,116 | | | $ | 73,881 | |
Net realized gain | | | 91,770 | | | | 840,617 | |
Net change in unrealized appreciation on investments | | | 1,714,917 | | | | 4,415,984 | |
| | | | | | | | |
Increase in net assets from operations | | | 1,817,803 | | | | 5,330,482 | |
| | | | | | | | |
Dividends and Distributions to Shareholders from: | | | | | | | | |
Net investment income | | | (34,729 | ) | | | (92,574 | ) |
Net realized gains | | | (651,333 | ) | | | (1,232,548 | ) |
| | | | | | | | |
Total dividends and distributions | | | (686,062 | ) | | | (1,325,122 | ) |
| | | | | | | | |
Capital Share Transactions, Net (Note 9) | | | (483,948 | ) | | | (2,881,001 | ) |
| | | | | | | | |
Increase in Net Assets | | | 647,793 | | | | 1,124,359 | |
| | | | | | | | |
Net Assets: | | | | | | | | |
Beginning of period | | | 27,739,698 | | | | 26,615,339 | |
| | | | | | | | |
End of period | | $ | 28,387,491 | | | $ | 27,739,698 | |
| | | | | | | | |
Overdistributed Net Investment Income and Undistributed Net Investment Income, respectively, end of period | | $ | (9,858 | ) | | $ | 13,755 | |
| | | | | | | | |
See Accompanying Notes to Financial Statements
9
Holland Series Fund, Inc.
| | |
| Holland Balanced Fund • | | FINANCIAL HIGHLIGHTS |
| | | | | | | | | | | | | | | | | | | | | | | | |
For a capital share outstanding throughout each period | | Six Months Ended
March 31, 2013
(Unaudited) | | | For the Year Ended | |
| | | 9/30/12 | | | 9/30/11 | | | 9/30/10 | | | 9/30/09 | | | 9/30/08 | |
Per Share Data | | | | | | | | | | | | | | | | | | | | | | | | |
Net asset value, beginning of period | | $ | 16.73 | | | $ | 14.44 | | | $ | 14.54 | | | $ | 14.16 | | | $ | 15.29 | | | $ | 17.39 | |
| | | | | | | | | | | | | | | | | | | | | | | | |
| | | | | | |
Increase/(Decrease) from Investment Operations: | | | | | | | | | | | | | | | | | | | | | | | | |
Net investment income | | | 0.01 | | | | 0.05 | | | | 0.07 | | | | 0.17 | | | | 0.09 | | | | 0.35 | |
Net realized and unrealized gain (loss) on investments | | | 1.09 | | | | 3.04 | | | | 0.19 | | | | 0.60 | | | | (0.76 | ) | | | (1.60 | ) |
| | | | | | | | | | | | | | | | | | | | | | | | |
Total income (loss) from operations | | | 1.10 | | | | 3.09 | | | | 0.26 | | | | 0.77 | | | | (0.67 | ) | | | (1.25 | ) |
| | | | | | | | | | | | | | | | | | | | | | | | |
| | | | | | |
Less Dividends and Distributions From: | | | | | | | | | | | | | | | | | | | | | | | | |
Net investment income | | | (0.02 | ) | | | (0.06 | ) | | | (0.08 | ) | | | (0.20 | ) | | | (0.13 | ) | | | (0.29 | ) |
Net realized gain on investments | | | (0.40 | ) | | | (0.74 | ) | | | (0.28 | ) | | | (0.19 | ) | | | (0.33 | ) | | | (0.56 | ) |
| | | | | | | | | | | | | | | | | | | | | | | | |
Total Dividends and distributions | | | (0.42 | ) | | | (0.80 | ) | | | (0.36 | ) | | | (0.39 | ) | | | (0.46 | ) | | | (0.85 | ) |
| | | | | | | | | | | | | | | | | | | | | | | | |
Net asset value, end of period | | $ | 17.41 | | | $ | 16.73 | | | $ | 14.44 | | | $ | 14.54 | | | $ | 14.16 | | | $ | 15.29 | |
| | | | | | | | | | | | | | | | | | | | | | | | |
| | | | | | |
Total return(a) | | | 6.83 | %(b) | | | 22.03 | % | | | 1.73 | % | | | 5.46 | % | | | (3.97 | )% | | | (7.42 | )% |
| | | | | | |
Ratios/Supplemental Data | | | | | | | | | | | | | | | | | | | | | | | | |
Net assets, end of period (000’s) | | $ | 28,387 | | | $ | 27,740 | | | $ | 26,615 | | | $ | 30,049 | | | $ | 31,296 | | | $ | 36,975 | |
Ratio of expenses to average net assets before fee waivers | | | 2.04 | %(c) | | | 2.09 | % | | | 1.87 | % | | | 1.92 | % | | | 1.88 | % | | | 1.63 | % |
Ratio of expenses to average net assets after fee waivers | | | 1.71 | %(c) | | | 1.50 | % | | | 1.50 | % | | | 1.50 | % | | | 1.50 | % | | | 1.50 | % |
Ratio of net investment income to average net assets after fee waivers | | | 0.08 | %(c) | | | 0.27 | % | | | 0.46 | % | | | 1.14 | % | | | 0.69 | % | | | 2.09 | % |
Portfolio turnover | | | 0.00 | %(b) | | | 0.00 | % | | | 30.00 | % | | | 0.00 | % | | | 2.54 | % | | | 1.96 | % |
See Accompanying Notes to Financial Statements
(a) Total return would have been lower had certain expenses not been waived or reimbursed.
(b) Not annualized.
(c) Annualized.
10
Holland Series Fund, Inc.
| | |
| Holland Balanced Fund • | | NOTESTO FINANCIAL STATEMENTS |
March 31, 2013 (Unaudited)
The Holland Series Fund, Inc. (the “Company”) was organized as a Maryland corporation on June 26, 1995 and is registered under the Investment Company Act of 1940, as amended (the “1940 Act”), as an open-end management investment company. The Company currently has one portfolio, the Holland Balanced Fund (the “Fund”).
Investment Objective
The objective of the Fund is to provide a high total investment return.
The total investment return is a combination of, among other things, 1) income from interest and dividends on securities owned by the Fund and 2) capital gains and losses on securities owned by the Fund. In seeking this objective, Holland & Company, L.L.C., the Fund’s investment adviser (the “Investment Adviser”), gives consideration to risk and volatility.
| 2. | SUMMARYOFSIGNIFICANTACCOUNTINGPOLICIES |
In preparing financial statements in conformity with accounting principles generally accepted in the United States of America (“GAAP”), management makes estimates and assumptions that affect the reported amounts of assets and liabilities at the date of the financial statements as well as the reported amounts of revenue and expenses during the reporting period. Actual results could differ from those estimates.
Management has determined that there were no events or transactions occurring after period end through the date of these financial statements requiring recognition or disclosure.
Securities
Securities transactions are accounted for as of the trade date. Interest income and expenses are recorded on an accrual basis. The Fund amortizes discount or premium using the effective yield-to-maturity method on a daily basis, except for securities having a maturity date of sixty days or less at the time of acquisition which are amortized on a straight-line basis. Dividend income is recorded on the ex-dividend date. The Fund uses the specific identification method for determining gain or loss on sales of securities.
The Fund may invest in Treasury Inflation-Protection Securities (“TIPS”), Treasury securities that are indexed to inflation. The principal value and interest payout of TIPS are periodically adjusted according to the rate of inflation based on the Consumer Price Index. Adjustments for interest income due to inflation are reflected in interest income in the Statement of Operations.
Indemnifications
Under the Fund’s organizational documents, its Officers and Directors are indemnified against certain liabilities arising out of the performance of their
11
Holland Series Fund, Inc.
| | |
| Holland Balanced Fund • | | NOTESTO FINANCIAL STATEMENTS (continued) |
March 31, 2013 (Unaudited)
| 2. | SUMMARYOFSIGNIFICANTACCOUNTINGPOLICIES (continued) |
duties to the Fund. In addition, in the normal course of business the Fund enters into contracts that provide general indemnifications to other parties. The Fund’s maximum exposure under these arrangements is unknown as this would involve future claims that may be made against the Fund that have not yet occurred.
Income Tax
The Fund has made no provision for federal income or excise tax since the Fund continues to qualify as a regulated investment company (“RIC”) and intends to comply with the requirements of Subchapter M of the Internal Revenue Code of 1986, as amended (the “Code”), applicable to RICs and to distribute substantially all of its taxable income and realized gains.
Valuation
Equity securities traded on an exchange are valued at their last sales price on that exchange with the exception of equity securities listed on NASDAQ where the NASDAQ Official Closing Price is used. Debt securities for which over-the-counter market quotations are available are valued at the latest bid price. Debt securities purchased with sixty days or less remaining to maturity are valued at amortized cost which approximates fair value.
Securities for which market quotations are not readily available or are deemed unreliable are valued at fair value as determined in good faith under procedures adopted by the Directors of the Fund.
In accordance with the authoritative guidance on fair value measurements and disclosures under GAAP, the Fund discloses the fair value of its investments in a hierarchy that prioritizes the inputs to valuation techniques used to measure the fair value. The three-tier hierarchy of inputs is summarized in the three broad levels listed below. The Fund’s hierarchy can be found below.
| | • | | Level 1 — quoted prices in active markets for identical investments |
| | • | | Level 2 — other significant observable inputs (including quoted prices for similar investments, interest rates, prepayment speeds, credit risk, etc.) |
| | • | | Level 3 — significant unobservable inputs (including the Fund’s own assumptions in determining the fair value of investments) |
The inputs or methodology used for valuing securities are not necessarily an indication of the risk associated with investing in those securities.
12
Holland Series Fund, Inc.
| | |
| Holland Balanced Fund • | | NOTESTO FINANCIAL STATEMENTS (continued) |
March 31, 2013 (Unaudited)
| 2. | SUMMARYOFSIGNIFICANTACCOUNTINGPOLICIES (continued) |
The following is a summary of the inputs used as of March 31, 2013 in valuing the Fund’s investments at value:
| | | | | | | | | | | | | | | | |
| | | Level 1 | | | Level 2 | | | Level 3 | | | Total | |
Investments in Securities | | | | | | | | | | | | | | | | |
Common Stocks | | $ | 21,826,159 | | | $ | — | | | $ | — | | | $ | 21,826,159 | |
U.S. Government Securities | | | — | | | | 4,995,854 | | | | — | | | | 4,995,854 | |
| | | | | | | | | | | | | | | | |
Total | | $ | 21,826,159 | | | $ | 4,995,854 | | | $ | — | | | $ | 26,822,013 | |
| | | | | | | | | | | | | | | | |
For a further break down of each investment by type please refer to the Statement of Net Assets.
The Fund’s policy is to disclose transfers between Levels based on valuations at the end of the reporting period. The portfolio may hold securities which are periodically fair valued in accordance with the Fund’s Fair Value Procedures. This may result in movements between Level 1 and Level 2 throughout the period. During the six-month period ended March 31, 2013, there were no transfers between Level 1, 2 or 3 based on the valuation input levels.
Distributions to Shareholders
The Fund distributes income dividends quarterly and capital gains annually. Distributions from net short-term capital gains and net long-term capital gains, if any, will typically be declared and paid in December. To the extent that a net realized capital gain can be reduced by a capital loss carryover, such gain will not be distributed.
Distributions to shareholders are recorded on the ex-date of the dividend or the distribution. Distributions from net investment income and net realized capital gains are determined in accordance with federal income tax regulations, which may differ from those amounts determined under GAAP. These book/tax differences are either temporary or permanent in nature. To the extent these differences are permanent in nature, such amounts are reclassified within the capital accounts based on their federal tax-basis treatment; temporary differences do not require reclassification.
Distributions that exceed net investment income or net realized capital gains for financial reporting purposes, but not for tax purposes, are reported as distributions in excess of net investment income or distributions in excess of net realized gains on investments. To the extent they exceed net investment income and/or net realized gains for tax purposes, they are reported as distributions of capital.
| 3. | INVESTMENT ADVISORY AGREEMENT |
The Company’s Board of Directors has approved an investment advisory agreement with the Investment Adviser. For its services as Investment Adviser, the Company pays the Investment Adviser a monthly fee at an annual rate of 0.75%
13
Holland Series Fund, Inc.
| | |
| Holland Balanced Fund • | | NOTESTO FINANCIAL STATEMENTS (continued) |
March 31, 2013 (Unaudited)
| 3. | INVESTMENT ADVISORY AGREEMENT (continued) |
of the Fund’s average daily net assets. The Investment Adviser has agreed to voluntarily waive its fee to the extent necessary to keep the Fund’s expenses from exceeding 1.75% of average daily net assets. The Investment Adviser may discontinue this cap on total expenses at any time, in its sole discretion. Prior to November 1, 2012, the Investment Advisor agreed to voluntarily waive its fee to the extent necessary to keep the Fund’s expenses from exceeding 1.50% of average daily net assets. During the six months ended March 31, 2013, the Investment Adviser waived $46,137 in advisory fees. The Investment Adviser is controlled by Michael F. Holland, its managing member and owner of an approximately 99% interest in the Investment Adviser.
As of March 31, 2013, Michael F. Holland and affiliates owned 121,198 shares (7.43% of the shares outstanding) of the Fund.
| 4. | ACCOUNTING, CUSTODY, ADMINISTRATION, AND DISTRIBUTION AGREEMENTS |
State Street Bank and Trust Company (“State Street”), pursuant to its Administration Agreement with the Fund, provides or arranges for the provision of, certain administrative and accounting services for the Company, including maintaining the books and records of the Company, and preparing certain reports and other documents required by federal and/or state laws and regulations.
For these services, the Company pays State Street a fee at the annual rate of 0.10% of the Fund’s average daily net assets up to $100 million, 0.08% of the next $100 million, and 0.06% of those assets in excess of $200 million, subject to certain minimum requirements, and reimbursement for out-of-pocket expenses pursuant to the Administration Agreement. Pursuant to the Administration Agreement, State Street is entitled to a minimum fee of $8,000 per month unless waived by State Street. State Street also serves as the Fund’s custodian and accounting agent. Fees paid for custody and accounting services rendered by State Street are based upon an annual rate of 0.04% of the Fund’s average daily net assets up to $100 million, 0.03% of the next $100 million and 0.02% of those assets in excess of $200 million, subject to certain minimum requirements, and reimbursement for out-of-pocket expenses pursuant to the Custody and Accounting Agreement. Pursuant to the Custody and Accounting Agreement, State Street is entitled to a minimum fee of $3,833 per month unless waived by State Street. Transactions entered into by the Fund during the period are part of services rendered and are included in the administration and custody fees in the Statement of Operations.
ALPS Distributors, Inc., pursuant to a distribution agreement with the Fund, acts as distributor of the Fund’s shares. The Investment Adviser bears the distribution cost.
14
Holland Series Fund, Inc.
| | |
| Holland Balanced Fund • | | NOTESTO FINANCIAL STATEMENTS (continued) |
March 31, 2013 (Unaudited)
The Fund pays each Independent Director an annual fee, paid quarterly, of $3,000, plus $500 per meeting attended and pays all Directors’ actual out-of-pocket expenses relating to attendance at meetings. The Fund does not provide any pension or retirement benefits to its Directors or Officers.
At March 31, 2013, the Fund had the following liabilities:
| | | | |
Administration and custody fees payable | | $ | 9,280 | |
Other payable and accrued expenses | | | 41,279 | |
| | | | |
Total liabilities | | $ | 50,559 | |
| | | | |
| 7. | INVESTMENT TRANSACTIONS |
Purchases and sales of investment securities, other than short-term investments and U.S. Government securities, for the six months ended March 31, 2013 aggregated $0 and $213,197, respectively. Purchases and sales of U.S. Government securities for the six months ended March 31, 2013 aggregated $0 and $6,750,000, respectively.
The Fund may enter into repurchase agreements under which a bank or securities firm that is a primary or reporting dealer in U.S. Government securities agrees, upon entering into a contract, to sell U.S. Government securities to the Fund and repurchase such securities from the Fund at a mutually agreed upon price and date. The Fund will engage in repurchase transactions with parties selected on the basis of such parties’ creditworthiness. The collateral on repurchase agreements must have an aggregate market value greater than or equal to the repurchase price plus accrued interest at all times. If the value of the underlying securities falls below the value of the repurchase price plus accrued interest, the Fund will require the seller to deposit additional collateral by the next business day. If the request for additional collateral is not met, or the seller defaults on its repurchase obligation, the Fund maintains the right to sell the underlying securities at market value and may claim any resulting loss against the seller. However, in the event of default or bankruptcy by the counterparty to the agreement, realization and/or retention of the collateral may be difficult or impossible.
15
Holland Series Fund, Inc.
| | |
| Holland Balanced Fund • | | NOTESTO FINANCIAL STATEMENTS (concluded) |
March 31, 2013 (Unaudited)
| 9. | CAPITAL SHARE TRANSACTIONS |
As of March 31, 2013, there were 1,000,000,000 shares of $0.01 par value capital stock authorized. Transactions in capital stock were as follows:
| | | | | | | | | | | | | | | | |
| | | Six Months Ended 3/31/2013 | | | Year Ended 9/30/2012 | |
| | | Shares | | | Amount | | | Shares | | | Amount | |
Shares Sold | | | 10,428 | | | $ | 173,571 | | | | 48,160 | | | $ | 755,919 | |
Shares Reinvested | | | 40,888 | | | | 653,234 | | | | 83,370 | | | | 1,245,031 | |
| | | | | | | | | | | | | | | | |
| | | 51,316 | | | | 826,805 | | | | 131,530 | | | | 2,000,950 | |
Shares Redeemed | | | (78,891 | ) | | | (1,310,753 | ) | | | (316,500 | ) | | | (4,881,951 | ) |
| | | | | | | | | | | | | | | | |
Net Increase/(Decrease) | | | (27,575 | ) | | $ | (483,948 | ) | | | (184,970 | ) | | $ | (2,881,001 | ) |
| | | | | | | | | | | | | | | | |
The components of net unrealized appreciation/ (depreciation) of investments based on federal tax cost at March 31, 2013 for the Fund were as follows:
| | | | | | | | | | | | | | |
| Appreciation | | | Depreciation | | | Net Appreciation | | | Cost for Federal
Tax Purposes | |
| $ | 8,504,605 | | | $ | 697,612 | | | $ | 7,806,993 | | | $ | 19,015,020 | |
The Fund recognizes the tax benefits of uncertain tax positions only where the position is “more likely than not” to be sustained assuming examination by tax authorities. Management has analyzed the Fund’s tax positions, and has concluded that no liability for unrecognized tax benefits should be recorded related to uncertain tax positions taken on returns filed for open tax years (2010-2012), or expected to be taken in the Fund’s 2013 tax returns. The Fund remains subject to review by its major tax jurisdictions, which include, but are not necessarily limited to, the United States of America and the State of Maryland.
16
Holland Series Fund, Inc.
| | |
| Holland Balanced Fund • | | UNAUDITED INFORMATION |
PROXY VOTING POLICIES
A description of the policies that the Fund uses to determine how to vote proxies relating to portfolio securities is available (i) without charge, upon request, by calling 1-800-30-HOLLAND and (ii) on the Securities and Exchange Commission’s website at http://www.sec.gov. Information regarding how the Fund voted proxies related to portfolio securities during the most recent 12-month period ending June 30 is filed with the Securities and Exchange Commission on Form N-PX each year by August 31. Once filed, the most recent Form N-PX will be available without charge, upon request, by calling 1-800-30-HOLLAND or on the Securities and Exchange Commission’s website at http://www.sec.gov.
QUARTERLY PORTFOLIOOF INVESTMENTS
A Portfolio of Investments is filed as of the end of the first and third quarter of each fiscal year on Form N-Q and is available on the Security and Exchange Commission’s website at http://www.sec.gov. Additionally, the Portfolio of Investments may be reviewed and copied at the Commission’s Public Reference Room in Washington, D.C. Information on the operation of the Public Reference Room may be obtained by calling 1-800-SEC-0330. The quarterly Portfolio of Investments will be made available without charge, upon request, by calling 1-800-30-HOLLAND.
SHAREHOLDER EXPENSES
As a shareholder of the Fund, you incur two types of costs: (1) transaction costs and (2) ongoing costs, including management fees and other Fund expenses. This example is intended to help you understand your ongoing costs of investing in the Fund and to compare these costs with the ongoing costs of investing in other mutual funds. It is based on an investment of $1,000 invested at the beginning of the period and held for the entire six-month period ended March 31, 2013.
Actual Expenses. The first table below provides information about actual account values and actual expenses. You may use the information in this line, together with the amount you invested, to estimate the expenses that you incurred over the period. Simply divide your account value at the end of the period by $1,000 (for example, an $8,600 account value divided by $1,000 = 8.6), then multiply the result by the number under the heading entitled “Expenses Paid during the Period” to estimate the expenses attributable to your investment during this period.
Hypothetical Example for Comparison Purposes. The second table below provides information about hypothetical account values and hypothetical expenses based on the Fund’s actual expense ratios and an assumed rate of return of 5% per year before expenses, which is not the Fund’s actual return. Thus, you should not use the hypothetical account values and expenses to estimate the actual ending account balance or your expenses for the period. Rather, these figures are provided to enable you to compare the ongoing costs of investing in the Fund and other funds. To do so, compare the 5% hypothetical examples with the 5% hypothetical examples that appear in the shareholder reports of the other funds.
17
Holland Series Fund, Inc.
| | |
| Holland Balanced Fund • | | UNAUDITED INFORMATION (concluded) |
SHAREHOLDER EXPENSES (continued)
| | | | | | | | |
| For the Six Months Ended March 31, 2013 | |
| Actual | | Value of a $1,000 Investment at End of Period | | | Expenses* Paid During the Period | |
| | $ | 1,068.32 | | | $ | 8.80 | |
| | | | | | | | |
| For the Six Months Ended March 31, 2013 | |
Hypothetical
(assuming a 5%
return before
expenses) | | Value of a $1,000 Investment at End of Period | | | Expenses* Paid During the Period | |
| | $ | 1,016.42 | | | $ | 8.58 | |
| * | Expenses are equal to the Fund’s annualized net expense ratio of 1.71% multiplied by the average account value over the period multiplied by 182/365 to reflect the one-half year period. |
18
Holland Series Fund, Inc.
ADVISER
Holland & Company L.L.C.
375 Park Avenue
New York, NY 10152
| email | mike@thehollandfund.com |
| website | www.thehollandfund.com |
FUND ADMINISTRATOR,
CUSTODIANAND FUND
ACCOUNTING AGENT
State Street Bank and Trust Co.
4 Copley Place
Boston, MA 02116
DISTRIBUTOR
ALPS Distributors, Inc.
1290 Broadway, Suite 1100
Denver, CO 80203
TRANSFER AGENT & DIVIDEND
DISBURSING AGENT
ALPS Fund Services, Inc.
1290 Broadway, Suite 1100
Denver, CO 80203
LEGAL COUNSEL
Ropes & Gray LLP
Prudential Tower
800 Boylston Street
Boston, MA 02199
INDEPENDENT REGISTERED
PUBLIC ACCOUNTING FIRM
BBD, LLP
1835 Market St., 26th Floor
Philadelphia, PA 19103
Holland & Company L.L.C.
375 Park Avenue
New York, New York 10152
| Email | mike@thehollandfund.com |
| Website | www.thehollandfund.com |
This report has been prepared for the Holland Balanced Fund’s Shareholders and may be distributed to others only if preceded or accompanied by a prospectus.
Item 2. Code of Ethics
Not required for this filing.
Item 3. Audit Committee Financial Expert
Not required for this filing.
Item 4. Principal Accountant Fees and Services
Not required for this filing.
Item 5. Audit Committee of Listed Registrants
Not applicable to the Registrant.
Item 6. Schedule of Investments
| | (a) | Schedule of Investments is included as part of Item 1 of the Form N-CSR. |
Item 7. Disclosure of Proxy Voting Policies and Procedures for Closed-End Management Investment Companies.
Not applicable to the Registrant.
Item 8. Portfolio Managers of Closed-End Management Investment Companies.
Not applicable to the Registrant.
Item 9. Purchases of Equity Securities by Closed-End Management Investment Company and Affiliated Purchasers.
Not applicable to the Registrant.
Item 10. Submission of Matters to a Vote of Security Holders.
There were no materials changes to the procedures by which shareholders may recommend nominees to the Fund’s Board of Directors.
Item 11. Controls and Procedures.
(a) Within 90 days of the filing date of this Form N-CSR, Michael Holland, the Fund’s President and Treasurer, reviewed the registrant’s disclosure controls and procedures (the “Procedures”) and evaluated their effectiveness. Based on his review, Mr. Holland determined that the Procedures adequately ensure that information required to be disclosed by the Fund in its periodic reports is recorded, processed, summarized and reported within the time periods required by the Securities and Exchange Commission’s rules and regulations.
(b) There were no significant changes in the Fund’s internal controls or in other factors that could significantly affect these controls subsequent to the date of their evaluation, including any corrective actions with regard to significant deficiencies and material weaknesses.
Item 12. Exhibits
(a)(1) Not applicable to the Filing.
(a)(2) The certifications required by Rule 30a-2 of the Investment Company Act of 1940, as amended (the “1940 Act”) are attached hereto.
(a)(3) Not applicable to the Filing.
(b) The certifications required by Rule 30a-2(b) of the 1940 Act and Sections 906 of the Sarbanes-Oxley Act of 2002 are attached hereto.
SIGNATURES
Pursuant to the requirements of the Securities Exchange Act of 1934 and the Investment Company Act of 1940, the registrant has duly caused this report to be signed on its behalf by the undersigned, thereunto duly authorized.
HOLLAND SERIES FUND, INC.
| | |
| By: | | /s/ Michael F. Holland |
| | Michael Holland |
| | President and Treasurer of Holland Series Fund, Inc. |
Date: May 24, 2013
Pursuant to the requirements of the Securities Exchange Act of 1934 and the Investment Company Act of 1940, this report has been signed below by the following persons on behalf of the registrant and in the capacities and on the dates indicated.
| | |
| By: | | /s/ Michael F. Holland |
| | Michael Holland |
| | President and Treasurer of Holland Series Fund, Inc. |
Date: May 24, 2013