UNITED STATES
SECURITIES AND EXCHANGE COMMISSION
Washington, D.C. 20549
FORM N-CSR
CERTIFIED SHAREHOLDER REPORT OF REGISTERED
MANAGEMENT INVESTMENT COMPANIES
Investment Company Act file number: 811-09060
HOLLAND SERIES FUND, INC.
(Exact name of registrant as specified in charter)
375 PARK AVENUE
NEW YORK, NEW YORK 10152
(Address of principal executive offices)(Zip code)
| | |
| (Name and Address of Agent for Service) | | Copy to: |
| |
Michael F. Holland President and Treasurer Holland Series Fund, Inc. 375 Park Avenue New York, New York 10152 | | State Street Bank and Trust Company Kristin Schantz, Esq. 1 Lincoln Street, SUM0703 Boston, Massachusetts 02111 |
| | and |
| |
| | Timothy Diggins, Esq. Ropes & Gray 800 Boylston Street Boston, Massachusetts 02199-3600 |
Registrant’s telephone number, including area code: (800) 304-6552
Date of fiscal year end: September 30th
Date of reporting period: September 30, 2016
Item 1: Shareholder Report

Holland Series Fund, Inc.
| | |
| Holland Balanced Fund • | | LETTERFROMTHE PRESIDENT |
September 30, 2016

Dear Fellow Shareholders:
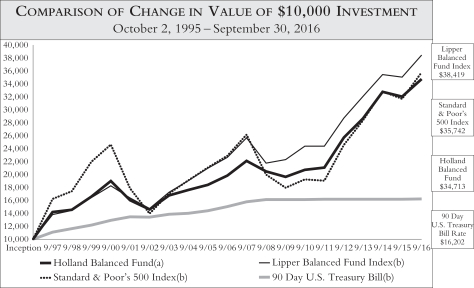
Our Fund’s total return for the year ended September 30, 2016 was 8.49%. Our Fund’s cumulative total return since inception (October 2, 1995 through September 30, 2016) was 247.13%, meaning that an initial investment of $10,000 has grown to $34,713.(a)
Our positive return in the face of slow global growth, an unsettling political environment, Brexit, terrorism, and negative interest rates, has been gratifying. Nevertheless, caution is warranted as these chal-
lenges persist. Our balanced portfolio remains invested in what I believe to be some of the financially strongest and best managed companies in the world. And our fixed income holdings remain in the highest rated securities with short maturities.
As the Fund’s largest shareholder, I believe our investment strategy of seeking to balance potential rewards from our equity portfolio while reducing the risks associated with continued volatility is an intelligent strategy.
With Bullish Regards,

Michael F. Holland
President and Founder
Investing involves risk, including possible loss of principal.
Performance data quoted represents past performance. Past performance does not guarantee future results. All performance assumes reinvestment of dividends and capital gains. The investment return and principal value of an investment will fluctuate so that an investor’s shares, when redeemed, may be worth less than their original cost. Current performance may be lower than the performance data quoted. Performance data current to the most recent month-end may be obtained by calling: 1-800-304-6552.
(a) Please see “Cumulative Performance (Unaudited)” on page 2 for more information.
1
Holland Series Fund, Inc.
| | |
| Holland Balanced Fund • | | CUMULATIVE PERFORMANCE (UNAUDITED) |
September 30, 2016
Set forth below are the cumulative total return figures for the periods indicated and a graph showing a hypothetical $10,000 investment made in the Holland Balanced Fund, Lipper Balanced Fund Index, Standard & Poor’s 500 Index and the 90 Day U.S. Treasury Bill on October 2, 1995. The cumulative and annualized total return figures and the information in the graph represent past performance and are not indicative of future results. The graph and table do not reflect the deduction of taxes that a shareholder would pay on Fund distributions or the redemption of Fund shares. Cumulative performance is the aggregate amount that an investment has gained or lost over the specified time period. The total returns reflect changes in price of the Fund’s shares and assume that any income dividends and/or capital gain distributions made by the Fund during the period were reinvested in additional shares of the Fund. Investment return and principal value of an investment will fluctuate so that an investor’s shares, when redeemed, may be worth less than their original cost.
| | | | | | | | | | | | | | | | | | | | | | | | | | | | |
| Return over the period | | Quarter to Date
6/30/2016-
9/30/2016 | | | Calendar
Ytd | | | 1 Year | | | 3 Years | | | 5 Years | | | 10 Years | | | Inception | |
Holland Balanced Fund | | | 0.63 | % | | | 3.48 | % | | | 8.49 | % | | | 21.15 | % | | | 64.93 | % | | | 75.13 | % | | | 247.13 | % |
Lipper Balanced Fund Index | | | 3.07 | % | | | 6.47 | % | | | 9.64 | % | | | 19.89 | % | | | 57.72 | % | | | 70.17 | % | | | 284.19 | % |
Standard & Poor’s 500 Index | | | 3.31 | % | | | 6.08 | % | | | 12.93 | % | | | 26.18 | % | | | 88.08 | % | | | 56.36 | % | | | 257.42 | % |
90 Day U.S. Treasury Bill | | | 0.07 | % | | | 0.20 | % | | | 0.23 | % | | | 0.28 | % | | | 0.39 | % | | | 7.83 | % | | | 62.02 | % |
| Annualized | | | | | | | | | | | | | | | | | | | | | |
Holland Balanced Fund | | | N.A. | | | | N.A. | | | | 8.49 | % | | | 6.60 | % | | | 10.52 | % | | | 5.76 | % | | | 6.11 | % |
Lipper Balanced Fund Index | | | N.A. | | | | N.A. | | | | 9.64 | % | | | 6.23 | % | | | 9.53 | % | | | 5.46 | % | | | 6.63 | % |
Standard & Poor’s 500 Index | | | N.A. | | | | N.A. | | | | 12.93 | % | | | 8.07 | % | | | 13.49 | % | | | 4.58 | % | | | 6.27 | % |
90 Day U.S. Treasury Bill | | | N.A. | | | | N.A. | | | | 0.23 | % | | | 0.09 | % | | | 0.08 | % | | | 0.76 | % | | | 2.33 | % |
2
Holland Series Fund, Inc.
| | |
| Holland Balanced Fund • | | MANAGEMENT DISCUSSIONOF FUND PERFORMANCE (UNAUDITED) |
September 30, 2016
Since inception (October 2, 1995 through September 30, 2016), our Fund’s cumulative total return was 247.13%. This compares to 257.42% for the Standard & Poor’s 500 Index, and 284.19% for the Lipper Balanced Fund Index, both of which are unmanaged indices. For the year ended September 30, 2016, our Fund’s total return was 8.49%. The Standard & Poor’s 500 Index was 12.93%, and the Lipper Balanced Fund Index was 9.64%.
During the year, small and mid-sized companies equities rose more than large company equities. Within the large company advance, some of the previous year’s equity laggards moved up smartly, as evidenced by two of our holdings, Schlumberger, Ltd. and JPMorgan Chase & Co., as dire predictions for the energy and financial sectors proved to be off the mark. On the other hand, our holding of The Walt Disney Co. proved a negative for the Fund, as concern about ESPN’s growth and “cord cutting” weighed.
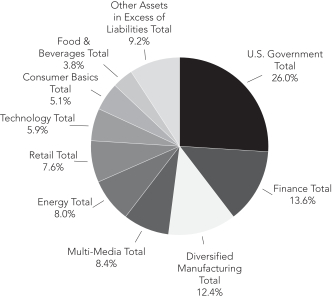
Portfolio composition by sector
(as a % of total net assets) – Unaudited
3
Holland Series Fund, Inc.
| | |
| Holland Balanced Fund • | | MANAGEMENT DISCUSSIONOF FUND PERFORMANCE (UNAUDITED) (concluded) |
NOTESTO PERFORMANCE
| (a) | Reflects waiver of fees by the investment adviser (“Advisory Fee waiver”). Absent such Advisory Fee waiver, the Fund’s total return would have been lower. |
| (b) | The Lipper Balanced Fund Index is an index of open-end mutual funds whose primary objective is to conserve principal by maintaining at all times a balanced portfolio of both stocks and bonds. Typically, the stock/bond ratio ranges around 60%/40%. The Standard & Poor’s 500 Index is a capitalization-weighted index of 500 widely held stocks recognized by investors to be representative of the stock market in general. The 90-Day U.S. Treasury Bill rate is the average return on three month U.S. Treasury Bills. The Standard & Poor’s 500 Index is unmanaged and does not reflect the actual cost of investing in the instruments that comprise the index. You cannot invest directly in an index. |
4
Holland Series Fund, Inc.
| | |
| Holland Balanced Fund • | | STATEMENTOF NET ASSETS |
| | | | | | | | |
| September 30, 2016 | | Shares | | | Value† | |
Common Stocks(a)–64.8% | | | | | | | | |
| | |
Beverages–3.8% | | | | | | | | |
PepsiCo, Inc. | | | 10,700 | | | $ | 1,163,839 | |
| | | | | | | | |
| | |
Consumer Finance–2.6% | | | | | | | | |
American Express Co. | | | 12,400 | | | | 794,096 | |
| | | | | | | | |
| | |
Diversified Financial Services–4.3% | | | | | | | | |
JPMorgan Chase & Co. | | | 20,000 | | | | 1,331,800 | |
| | | | | | | | |
| | |
Energy Equipment & Services–4.0% | | | | | | | | |
Schlumberger, Ltd. | | | 15,800 | | | | 1,242,512 | |
| | | | | | | | |
| | |
Food & Staples Retailing–2.7% | | | | | | | | |
Wal-Mart Stores, Inc. | | | 11,400 | | | | 822,168 | |
| | | | | | | | |
| | |
Industrial Conglomerates–8.6% | | | | | | | | |
3M Co. | | | 6,200 | | | | 1,092,626 | |
General Electric Co. | | | 52,900 | | | | 1,566,898 | |
| | | | | | | | |
| | | | 2,659,524 | |
| | | | | | | | |
| | |
Insurance–6.7% | | | | | | | | |
Berkshire Hathaway, Inc. Class A* | | | 5 | | | | 1,081,100 | |
Chubb Ltd. | | | 7,824 | | | | 983,086 | |
| | | | | | | | |
| | | | 2,064,186 | |
| | | | | | | | |
| | |
Media–8.4% | | | | | | | | |
Comcast Corp. Class A | | | 24,000 | | | | 1,592,160 | |
The Walt Disney Co. | | | 10,900 | | | | 1,012,174 | |
| | | | | | | | |
| | | | 2,604,334 | |
| | | | | | | | |
| | |
Oil, Gas & Consumable Fuels–4.0% | | | | | | | | |
Exxon Mobil Corp. | | | 14,300 | | | | 1,248,104 | |
| | | | | | | | |
| | |
Pharmaceuticals–5.1% | | | | | | | | |
Johnson & Johnson | | | 13,200 | | | | 1,559,316 | |
| | | | | | | | |
| | |
Semiconductors & Semiconductor Equipment–3.8% | | | | | | | | |
Intel Corp. | | | 30,700 | | | | 1,158,925 | |
| | | | | | | | |
| | |
Software–5.9% | | | | | | | | |
Microsoft Corp. | | | 31,500 | | | | 1,814,400 | |
| | | | | | | | |
| | |
Specialty Retail–4.9% | | | | | | | | |
Home Depot, Inc. | | | 11,700 | | | | 1,505,556 | |
| | | | | | | | |
Total Common Stocks (Cost–$10,371,707) | | | | | | | 19,968,760 | |
| | | | | | | | |
|
See Accompanying Notes to Financial Statements | |
5
Holland Series Fund, Inc.
| | |
| Holland Balanced Fund • | | STATEMENTOF NET ASSETS (continued) |
| | | | | | | | |
| September 30, 2016 | | Principal | | | Value† | |
U.S. Government Securities(a)–26.0% | | | | | | | | |
| | |
U.S. Treasury Notes–26.0% | | | | | | | | |
United States Treasury Note/Bond,
0.625% due 12/31/16 | | $ | 3,000,000 | | | $ | 3,002,571 | |
United States Treasury Note/Bond,
0.875% due 4/15/17 | | | 5,000,000 | | | | 5,009,570 | |
| | | | | | | | |
Total U.S. Government Securities (Cost–$8,010,359) | | | | | | | 8,012,141 | |
| | | | | | | | |
Total Investments–90.8% (Cost–$18,382,066) | | | | | | | 27,980,901 | |
| | | | | | | | |
Other Assets In Excess Of Liabilities–9.2% | | | | | | | 2,846,202 | |
| | | | | | | | |
Net Assets–100% | | | | | | | | |
Applicable to 1,618,322 outstanding $0.01 par
value shares (authorized 1,000,000,000) | | | | | | $ | 30,827,103 | |
| | | | | | | | |
Net asset value, offering price and redemption
price per share | | | | | | $ | 19.05 | |
| | | | | | | | |
|
See Accompanying Notes to Financial Statements | |
6
Holland Series Fund, Inc.
| | |
| Holland Balanced Fund • | | STATEMENTOF NET ASSETS (concluded) |
| | | | |
| September 30, 2016 | | Value† | |
Components of Net Assets as of September 30, 2016 | | | | |
Capital stock at par value ($0.01) | | $ | 16,183 | |
Capital stock in excess of par value | | | 20,136,867 | |
Accumulated net investment loss | | | (27,256 | ) |
Net accumulated realized gain on investments in securities | | | 1,102,474 | |
Net unrealized appreciation on investments in securities | | | 9,598,835 | |
| | | | |
Net Assets(b) | | $ | 30,827,103 | |
| | | | |
See Accompanying Notes to Financial Statements
(a) All percentages are based on the net assets of the Holland Balanced Fund as of September 30, 2016.
(b) As of September 30, 2016, there were no outstanding payables on Director’s fees.
* Non-income producing
† See Note 2 to Financial Statements
7
Holland Series Fund, Inc.
| | |
| Holland Balanced Fund • | | STATEMENT OF OPERATIONS |
| | | | |
| Year Ended September 30, 2016 | |
Investment Income: | | | | |
Dividends | | $ | 466,647 | |
Interest income (Note 2) | | | 41,525 | |
| | | | |
Total investment income | | | 508,172 | |
| | | | |
Expenses: | | | | |
Investment advisory fees (Note 3) | | | 232,055 | |
Administration and custody fees (Note 4) | | | 156,434 | |
Transfer agent fees | | | 69,219 | |
Compliance service fees | | | 30,000 | |
Registration fees | | | 29,244 | |
Legal fees | | | 23,536 | |
Shareholder reports | | | 23,468 | |
Audit fees | | | 22,400 | |
Directors’ fees | | | 15,000 | |
Insurance fees | | | 13,769 | |
Miscellaneous expenses | | | 2,158 | |
| | | | |
Total operating expenses | | | 617,283 | |
Waiver of investment advisory fee (Note 3) | | | (75,821 | ) |
| | | | |
Net expenses | | | 541,462 | |
| | | | |
Net investment loss | | | (33,290 | ) |
| | | | |
Net Realized and Unrealized Gain on Investments | | | | |
Net realized gain on investments | | | 1,102,488 | |
Net change in unrealized appreciation | | | 1,480,864 | |
| | | | |
Net realized and unrealized gain on investments | | | 2,583,352 | |
| | | | |
Net increase in net assets resulting from operations | | $ | 2,550,062 | |
| | | | |
See Accompanying Notes to Financial Statements
8
Holland Series Fund, Inc.
| | |
| Holland Balanced Fund • | | STATEMENTSOF CHANGESIN NET ASSETS |
| | | | | | | | |
| | | Year Ended
September 30,
2016 | | | Year Ended
September 30,
2015 | |
Net Increase/(Decrease) in Net Assets
Resulting from Operations: | | | | | | | | |
Net investment loss | | $ | (33,290 | ) | | $ | (41,957 | ) |
Net realized gain | | | 1,102,488 | | | | 3,667,786 | |
Net change in unrealized appreciation/(depreciation) on investments | | | 1,480,864 | | | | (4,293,995 | ) |
| | | | | | | | |
Increase/(Decrease) in net assets resulting from operations | | | 2,550,062 | | | | (668,166 | ) |
| | | | | | | | |
Dividends and Distributions to Shareholders
from: | | | | | | | | |
Net realized gains | | | (2,167,454 | ) | | | (1,500,344 | ) |
| | | | | | | | |
Capital Share Transactions, Net (Note 9) | | | 1,032,534 | | | | 307,599 | |
| | | | | | | | |
Increase/(Decrease) in Net Assets | | | 1,415,142 | | | | (1,860,911 | ) |
| | | | | | | | |
| | |
Net Assets: | | | | | | | | |
Beginning of year | | | 29,411,961 | | | | 31,272,872 | |
| | | | | | | | |
End of year | | $ | 30,827,103 | | | $ | 29,411,961 | |
| | | | | | | | |
| | |
Accumulated Net Investment Loss, end of year | | $ | (27,256 | ) | | $ | (39,591 | ) |
| | | | | | | | |
See Accompanying Notes to Financial Statements
9
Holland Series Fund, Inc.
| | |
| Holland Balanced Fund • | | FINANCIAL HIGHLIGHTS |
| | | | | | | | | | | | | | | | | | | | |
For a capital share outstanding throughout each year | | Year Ended
September 30,
2016 | | | Year Ended
September 30,
2015 | | | Year Ended
September 30,
2014 | | | Year Ended
September 30,
2013 | | | Year Ended
September 30,
2012 | |
Per Share Data | | | | | | | | | | | | | | | | | | | | |
Net asset value, beginning of year | | $ | 18.89 | | | $ | 20.30 | | | $ | 18.18 | | | $ | 16.73 | | | $ | 14.44 | |
| | | | | | | | | | | | | | | | | | | | |
| | | | | |
Increase/(Decrease) from Investment Operations: | | | | | | | | | | | | | | | | | | | | |
Net investment income (loss) | | | (0.02 | ) | | | (0.03 | ) | | | — | (a) | | | — | (a) | | | 0.05 | |
Net realized and unrealized gain (loss) on investments | | | 1.59 | | | | (0.38 | ) | | | 2.57 | | | | 1.87 | | | | 3.04 | |
| | | | | | | | | | | | | | | | | | | | |
Total income (loss) from operations | | | 1.57 | | | | (0.41 | ) | | | 2.57 | | | | 1.87 | | | | 3.09 | |
| | | | | | | | | | | | | | | | | | | | |
| | | | | |
Less Dividends and Distributions From: | | | | | | | | | | | | | | | | | | | | |
Net investment income | | | — | | | | — | | | | — | | | | (0.02 | ) | | | (0.06 | ) |
Net realized gain | | | (1.41 | ) | | | (1.00 | ) | | | (0.45 | ) | | | (0.40 | ) | | | (0.74 | ) |
Return of capital | | | — | | | | — | | | | — | (a) | | | — | | | | — | |
| | | | | | | | | | | | | | | | | | | | |
Total dividends and distributions | | | (1.41 | ) | | | (1.00 | ) | | | (0.45 | ) | | | (0.42 | ) | | | (0.80 | ) |
| | | | | | | | | | | | | | | | | | | | |
Net asset value, end of year | | $ | 19.05 | | | $ | 18.89 | | | $ | 20.30 | | | $ | 18.18 | | | $ | 16.73 | |
| | | | | | | | | | | | | | | | | | | | |
| | | | | |
Total return(b) | | | 8.49 | % | | | (2.30 | )% | | | 14.30 | % | | | 11.56 | % | | | 22.03 | % |
| | | | | |
Ratios/Supplemental Data | | | | | | | | | | | | | | | | | | | | |
Net assets, end of year (000’s) | | $ | 30,827 | | | $ | 29,412 | | | $ | 31,273 | | | $ | 28,673 | | | $ | 27,740 | |
Ratio of expenses to average net assets before fee waivers | | | 2.00 | % | | | 1.95 | % | | | 1.93 | % | | | 2.01 | % | | | 2.09 | % |
Ratio of expenses to average net assets after fee waivers | | | 1.75 | % | | | 1.75 | % | | | 1.75 | % | | | 1.73 | % | | | 1.50 | % |
Ratio of net investment income (loss) to average net assets after fee waivers | | | (0.11 | )% | | | (0.14 | )% | | | (0.03 | )% | | | (0.01 | )% | | | 0.27 | % |
Portfolio turnover | | | 0.00 | % | | | 27.81 | % | | | 0.00 | % | | | 0.00 | % | | | 0.00 | % |
See Accompanying Notes to Financial Statements
(a) Amount rounds to less than $0.01.
(b) Total return would have been lower had certain expenses not been waived or reimbursed.
10
Holland Series Fund, Inc.
| | |
| Holland Balanced Fund • | | NOTESTO FINANCIAL STATEMENTS |
September 30, 2016
The Holland Series Fund, Inc. (the “Company”) was organized as a Maryland corporation on June 26, 1995 and is registered under the Investment Company Act of 1940, as amended (the “1940 Act”), as a diversified open-end management investment company. The Company currently has one portfolio, the Holland Balanced Fund (the “Fund”).
Investment Objective
The objective of the Fund is to provide a high total investment return.
The total investment return is a combination of, among other things, 1) income from interest and dividends on securities owned by the Fund, 2) capital gains and losses on securities owned by the Fund; and 3) the Fund’s expenses. In seeking this objective, Holland & Company, LLC, the Fund’s investment adviser (the “Investment Adviser”), gives consideration to risk and volatility.
| 2. | SUMMARYOF SIGNIFICANT ACCOUNTING POLICIES |
In preparing financial statements in conformity with accounting principles generally accepted in the United States of America (“GAAP”), management makes estimates and assumptions that affect the reported amounts of assets and liabilities at the date of the financial statements as well as the reported amounts of revenue and expenses during the reporting period. Actual results could differ from those estimates. The Fund is considered an investment company under GAAP and follows the accounting and reporting guidance applicable to investment companies in the Financial Accounting Standards Board (“FASB”) Accounting Standards Codification (“ASC”) 946, Financial Services – Investment Companies.
Management has evaluated the impact of all events or transactions occurring after year end through the date these financial statements were issued, and has determined that there were no subsequent events requiring recognition or disclosure.
Securities
Securities transactions are accounted for as of the trade date. Interest income and expenses are recorded on an accrual basis. The Fund amortizes discount or premium using the effective yield-to-maturity method on a daily basis, except for securities having a maturity date of sixty days or less at the time of acquisition which are amortized on a straight-line basis. Dividend income is recorded on the ex-dividend date. The Fund uses the specific identification method for determining gain or loss on sales of securities.
The Fund may invest in Treasury Inflation-Protection Securities (“TIPS”), Treasury securities that are indexed to inflation. The principal value and interest payout of TIPS are periodically adjusted according to the rate of inflation based on the Consumer Price Index. Adjustments for interest income due to inflation are reflected in interest income in the Statement of Operations.
11
Holland Series Fund, Inc.
| | |
| Holland Balanced Fund • | | NOTESTO FINANCIAL STATEMENTS (continued) |
September 30, 2016
| 2. | SUMMARYOF SIGNIFICANT ACCOUNTING POLICIES (continued) |
Indemnifications
Under the Fund’s organizational documents, its Officers and Directors are indemnified against certain liabilities arising out of the performance of their duties to the Fund. In addition, in the normal course of business, the Fund enters into contracts that provide general indemnifications to other parties. The Fund’s maximum exposure under these arrangements is unknown as this would involve future claims that may be made against the Fund that have not yet occurred.
Income Tax
The Fund has made no provision for federal income or excise tax since the Fund continues to qualify as a regulated investment company (“RIC”) and intends to comply with the requirements of Subchapter M of the Internal Revenue Code of 1986, as amended (the “Code”), applicable to RICs and to distribute substantially all of its taxable income and realized gains.
Valuation
Equity securities traded on an exchange are valued at their last sales price on that exchange with the exception of equity securities listed on NASDAQ where the NASDAQ Official Closing Price is used. Debt securities for which over-the-counter market quotations are available are valued at the latest bid price.
Securities for which market quotations are not readily available are valued at fair value as determined in good faith under procedures adopted by the Directors of the Fund.
In accordance with the authoritative guidance on fair value measurements and disclosures under GAAP, the Fund discloses the fair value of its investments in a hierarchy that prioritizes the inputs to valuation techniques used to measure the fair value. The three-tier hierarchy of inputs is summarized in the three broad levels listed below. The Fund’s hierarchy can be found below.
| | • | | Level 1 — quoted prices in active markets for identical investments |
| | • | | Level 2 — other significant observable inputs (including quoted prices for similar investments, interest rates, prepayment speeds, credit risk, etc.) |
| | • | | Level 3 — significant unobservable inputs (including the Fund’s own assumptions in determining the fair value of investments) |
The inputs or methodology used for valuing securities are not necessarily an indication of the risk associated with investing in those securities.
12
Holland Series Fund, Inc.
| | |
| Holland Balanced Fund • | | NOTESTO FINANCIAL STATEMENTS (continued) |
September 30, 2016
| 2. | SUMMARYOF SIGNIFICANT ACCOUNTING POLICIES (continued) |
The following is a summary of the inputs used as of September 30, 2016 in valuing the Fund’s investments at value:
For a further break down of each investment by type please refer to the Statement of Net Assets.
| | | | | | | | | | | | | | | | |
| | | Level 1 | | | Level 2 | | | Level 3 | | | Total | |
Investments in Securities | | | | | | | | | | | | | | | | |
Common Stocks | | $ | 19,968,760 | | | $ | — | | | $ | — | | | $ | 19,968,760 | |
U.S. Government Securities | | | — | | | | 8,012,141 | | | | — | | | | 8,012,141 | |
| | | | | | | | | | | | | | | | |
Total | | $ | 19,968,760 | | | $ | 8,012,141 | | | $ | — | | | $ | 27,980,901 | |
| | | | | | | | | | | | | | | | |
The Fund’s policy is to disclose transfers between Levels based on valuations at the end of the reporting period. The portfolio may hold securities which are periodically fair valued in accordance with the Fund’s Fair Value Procedures. This may result in movements between Level 1 and Level 2 throughout the period. For the period ended September 30, 2016, there were no transfers between Level 1, 2 or 3 based on the valuation input levels.
Distributions to Shareholders
The Fund distributes income dividends quarterly and capital gains annually. Distributions from net short-term capital gains and net long-term capital gains, if any, will typically be declared and paid in December. To the extent that a net realized capital gain can be reduced by a capital loss carryover, such gain will not be distributed.
Distributions to shareholders are recorded on the ex-date of the dividend or the distribution. Distributions from net investment income and net realized capital gains are determined in accordance with federal income tax regulations, which may differ from those amounts determined under GAAP. These book/tax differences are either temporary or permanent in nature. To the extent these differences are permanent in nature, such amounts are reclassified within the capital accounts based on their federal tax-basis treatment; temporary differences do not require reclassification.
Distributions that exceed net investment income or net realized capital gains for financial reporting purposes, but not for tax purposes, are reported as distributions in excess of net investment income or distributions in excess of net realized gains on investments. To the extent they exceed net investment income and/or net realized gains for tax purposes, they are reported as distributions of capital.
13
Holland Series Fund, Inc.
| | |
| Holland Balanced Fund • | | NOTESTO FINANCIAL STATEMENTS (continued) |
September 30, 2016
| 3. | INVESTMENT ADVISORY AGREEMENT |
The Company’s Board of Directors has approved an investment advisory agreement with the Investment Adviser. For its services as Investment Adviser, the Company pays the Investment Adviser a monthly fee at an annual rate of 0.75% of the Fund’s average daily net assets. The Investment Adviser has agreed to voluntarily waive its fee to the extent necessary to keep the Fund’s expenses from exceeding 1.75% (on an annualized basis) of average daily net assets. The Investment Adviser may discontinue this cap on total expenses at any time, in its sole discretion. During the year ended September 30, 2016, the Investment Adviser waived $75,821 in advisory fees. The Investment Adviser is controlled by Michael F. Holland, its managing member and owner of an approximately 99% interest in the Investment Adviser.
As of September 30, 2016, Michael F. Holland and affiliates owned 134,687 shares (8.32% of the shares outstanding) of the Fund.
| 4. | ACCOUNTING, CUSTODY, ADMINISTRATION AND DISTRIBUTION AGREEMENTS |
State Street Bank and Trust Company (“State Street”), pursuant to its Administration Agreement with the Fund, provides or arranges for the provision of, certain administrative and accounting services for the Company, including maintaining the books and records of the Company, and preparing certain reports and other documents required by federal and/or state laws and regulations.
For these services, the Company pays State Street a fee at the annual rate of 0.10% of the Fund’s average daily net assets up to $100 million, 0.08% of the next $100 million, and 0.06% of those assets in excess of $200 million, subject to certain minimum requirements, and reimbursement for out-of-pocket expenses pursuant to the Administration Agreement. Pursuant to the Administration Agreement, State Street is entitled to a minimum fee of $8,500 per month unless waived by State Street. State Street also serves as the Fund’s custodian and accounting agent. Fees paid for custody and accounting services rendered by State Street are based upon an annual rate of 0.04% of the Fund’s average daily net assets up to $100 million, 0.03% of the next $100 million and 0.02% of those assets in excess of $200 million, subject to certain minimum requirements, and reimbursement for out-of-pocket expenses pursuant to the Custodian Agreement. Pursuant to the Custodian Agreement, State Street was entitled to a minimum fee of $3,833 per month unless waived by State Street. Transactions entered into by the Fund during the period are part of services rendered and are included in the administration and custody fees in the Statement of Operations.
ALPS Distributors, Inc., pursuant to a distribution agreement with the Fund, acts as distributor of the Fund’s shares. The Investment Adviser bears the distribution cost.
14
Holland Series Fund, Inc.
| | |
| Holland Balanced Fund • | | NOTESTO FINANCIAL STATEMENTS (continued) |
September 30, 2016
The Fund pays each Independent Director an annual fee, paid quarterly, of $3,000, plus $500 per meeting attended and pays all Directors’ actual out-of-pocket expenses relating to attendance at meetings. The Fund does not provide any pension or retirement benefits to its Directors or Officers.
At September 30, 2016, the Fund had the following liabilities:
| | | | |
Payable for Fund shares repurchased | | $ | 2,287 | |
Investment Advisory fees payable | | | 13,444 | |
Shareholder Report fees payable | | | 8,171 | |
Administration and custody fees payable | | | 29,147 | |
Other payable and accrued expenses | | | 42,734 | |
| | | | |
Total liabilities | | $ | 95,783 | |
| | | | |
| 7. | INVESTMENT TRANSACTIONS |
Purchases and sales of investment securities, other than short-term investments and U.S. Government securities, for the year ended September 30, 2016 aggregated $0 and $0 respectively. Purchases and sales of long-term U.S. Government securities for the year ended September 30, 2016 aggregated $0 and $0, respectively.
The Fund may enter into repurchase agreements under which a bank or securities firm that is a primary or reporting dealer in U.S. Government securities agrees, upon entering into a contract, to sell U.S. Government securities to the Fund and repurchase such securities from the Fund at a mutually agreed upon price and date. The Fund will engage in repurchase transactions with parties selected on the basis of such parties’ creditworthiness. The collateral on repurchase agreements must have an aggregate market value greater than or equal to the repurchase price plus accrued interest at all times. If the value of the underlying securities falls below the value of the repurchase price plus accrued interest, the Fund will require the seller to deposit additional collateral by the next business day. If the request for additional collateral is not met, or the seller defaults on its repurchase obligation, the Fund maintains the right to sell the underlying securities at market value and may claim any resulting loss against the seller. However, in the event of default or bankruptcy by the counterparty to the agreement, realization and/or retention of the collateral may be difficult or impossible. During the year ended September 30, 2016, the Fund did not enter into any repurchase agreements.
15
Holland Series Fund, Inc.
| | |
| Holland Balanced Fund • | | NOTESTO FINANCIAL STATEMENTS (concluded) |
September 30, 2016
| 9. | CAPITAL SHARE TRANSACTIONS |
As of September 30, 2016, there were 1,000,000,000 shares of $0.01 par value capital stock authorized. Transactions in capital stock were as follows:
| | | | | | | | | | | | | | | | |
| | | Year Ended 9/30/2016 | | | Year Ended
9/30/2015 | |
| | | Shares | | | Amount | | | Shares | | | Amount | |
Shares sold | | | 127,884 | | | $ | 2,335,733 | | | | 74,196 | | | $ | 1,461,528 | |
Shares reinvested | | | 113,384 | | | | 2,106,674 | | | | 72,807 | | | | 1,456,135 | |
| | | | | | | | | | | | | | | | |
| | | 241,268 | | | | 4,442,407 | | | | 147,003 | | | | 2,917,663 | |
Shares redeemed | | | (179,667 | ) | | | (3,409,873 | ) | | | (130,822 | ) | | | (2,610,064 | ) |
| | | | | | | | | | | | | | | | |
Net Increase | | | 61,601 | | | $ | 1,032,534 | | | | 16,181 | | | $ | 307,599 | |
| | | | | | | | | | | | | | | | |
The components of net unrealized appreciation/(depreciation) of investments based on federal tax cost at September 30, 2016 for the Fund were as follows:
As of September 30, 2016, the Fund recorded the following reclassifications primarily due to net operating losses and differing book to tax treatment on realized gains and losses, to increase (decrease) the accounts listed below:
| | | | |
Accumulated net investment loss | | $ | 45,625 | |
Capital stock in excess of par value | | | (45,625 | ) |
As of September 30, 2016, the components of distributable earnings on a tax basis were $1,102,476 of undistributed long term capital gains and $(27,256) of Post December late year Loss Deferrals.
The tax character of distributions paid during the year ended September 30, 2016, was $2,167,454 from long term capital gains. The tax character of distributions paid during the year ended September 30, 2015, was $1,500,344 from long term capital gains.
The Fund recognizes the tax benefits of uncertain tax positions only where the position is “more likely than not” to be sustained assuming examination by tax authorities. Management has analyzed the Fund’s tax positions, and has concluded that no liability for unrecognized tax benefits should be recorded related to uncertain tax positions taken on returns filed for open tax years (2013-2015), or expected to be taken in the Fund’s 2016 tax returns. The Fund remains subject to review by its major tax jurisdictions, which include the United States of America and the State of Maryland.
16
Holland Series Fund, Inc.
| | |
| |
| Holland Balanced Fund • | | REPORTOF INDEPENDENT REGISTERED PUBLIC ACCOUNTING FIRM |
To the Board of Directors of Holland Series Fund, Inc.
and the Shareholders of Holland Balanced Fund
We have audited the accompanying statement of net assets of the Holland Balanced Fund (the “Fund”), a series of shares of Holland Series Fund, Inc., as of September 30, 2016, and the related statement of operations for the year then ended, the statements of changes in net assets for each of the years in the two year period then ended and the financial highlights for each of the years in the five-year period then ended. These financial statements and financial highlights are the responsibility of the Fund’s management. Our responsibility is to express an opinion on these financial statements and financial highlights based on our audits.
We conducted our audits in accordance with the standards of the Public Company Accounting Oversight Board (United States). Those standards require that we plan and perform the audits to obtain reasonable assurance about whether the financial statements and financial highlights are free of material misstatement. An audit includes examining, on a test basis, evidence supporting the amounts and disclosures in the financial statements. Our procedures included confirmation of securities owned as of September 30, 2016 by correspondence with the custodian. An audit also includes assessing the accounting principles used and significant estimates made by management, as well as evaluating the overall financial statement presentation. We believe that our audits provide a reasonable basis for our opinion.
In our opinion, the financial statements and financial highlights referred to above present fairly, in all material respects, the financial position of Holland Balanced Fund as of September 30, 2016, the results of its operations for the year then ended, the changes in its net assets for each of the years in the two-year period then ended and its financial highlights for each of the years in the five-year period then ended, in conformity with accounting principles generally accepted in the United States of America.
BBD, LLP
Philadelphia, Pennsylvania
November 22, 2016
17
Holland Series Fund, Inc.
| | |
| Holland Balanced Fund • | | UNAUDITED INFORMATION |
PROXY VOTING POLICIES
A description of the policies that the Fund uses to determine how to vote proxies relating to portfolio securities is available (i) without charge, upon request, by calling 1-800-30-HOLLAND and (ii) on the Securities and Exchange Commission’s website at http://www.sec.gov. Information regarding how the Fund voted proxies related to portfolio securities during the most recent 12-month period ending June 30 is filed with the Securities and Exchange Commission on Form N-PX each year by August 31. Once filed, the most recent Form N-PX will be available without charge, upon request, by calling 1-800-30-HOLLAND or on the Securities and Exchange Commission’s website at http://www.sec.gov.
QUARTERLY PORTFOLIO OF INVESTMENTS
A Portfolio of Investments is filed as of the end of the first and third quarter of each fiscal year on Form N-Q and is available on the Securities and Exchange Commission’s website at http://www.sec.gov. Additionally, the Portfolio of Investments may be reviewed and copied at the Commission’s Public Reference Room in Washington, D.C. Information on the operation of the Public Reference Room may be obtained by calling 1-800-SEC-0330. The quarterly Portfolio of Investments will be made available without charge, upon request, by calling 1-800-30-HOLLAND.
APPROVALOF CONTINUATIONOF INVESTMENT ADVISORYAGREEMENT
General Background. On May 4, 2016, the Board of Directors, including all of the Independent Directors (collectively, the “Directors”), approved the renewal of the Fund’s Advisory Agreement with Holland & Company LLC (the “Adviser”) for an additional one-year term. During the course of each year, the Directors receive a wide variety of materials relating to the services provided by the Adviser, including reports on the Fund’s investment results, portfolio composition, compliance with applicable regulations, portfolio trading practices, and shareholder services. In determining whether to renew the Advisory Agreement, the Board also reviewed additional information provided by the Adviser.
The information below summarizes the Board’s considerations and conclusions in connection with its approving the renewal of the Advisory Agreement. In considering the continuation of the Agreement, the Directors did not identify any particular information that was all-important or controlling and each Director attributed different weights to various factors. In considering these matters, the Directors were advised with respect to relevant legal standards by counsel to the Fund.
Quality of Services. In reviewing the services that the Adviser provides to the Fund, the Directors considered Michael Holland’s extensive experience in the securities and investment management industries. They noted that Mr. Holland is one of the largest shareholders of the Fund. The Directors also noted that the Adviser’s commitment to the Fund, as evidenced by, among other things, that the Fund is the Adviser’s sole investment company client.
18
Holland Series Fund, Inc.
| | |
| Holland Balanced Fund • | | UNAUDITED INFORMATION (continued) |
APPROVALOF CONTINUATIONOF INVESTMENT ADVISORY AGREEMENT (continued)
In reviewing the quality of services provided to the Fund, the Directors reviewed the performance of the Fund compared with the returns of the Standard & Poor’s 500 Index, the Lipper Balanced Fund Index and the average returns of all funds in the balanced funds category of Lipper Inc. (the “Performance Universe”). The funds comprising the Performance Universe had been selected by Broadridge with no input from the Adviser. The Directors reviewed the Fund’s performance against the Lipper Balanced Fund Index and the Standard & Poor’s 500 Index benchmarks over the one-, three-, five- and ten-year periods ended March 31, 2016. The Directors noted that the Fund had achieved favorable relative performance, due in large part to its maintaining investments in large capitalization equities. The Directors also noted that the Fund has historically been positioned for a market that favors large capitalization growth stocks, and considered that such stocks had relatively underperformed over the past ten years, a period of underperformance for the Fund as compared to the Performance Universe. They observed that the Fund appeared unusual among balanced funds because the allocation of assets among asset categories (equity securities vs. investment grade fixed-income securities and money market instruments) is fixed within prescribed ranges under ordinary market conditions thereby limiting the Adviser’s ability to take advantage of outperformance, or to avoid underperformance, in a particular asset category. They noted that such an approach might generally be expected to lead to periods of underperformance and that the Fund is intended as a long-term investment. The Directors further noted that the shareholder base appeared generally to be made up of people who desire Mr. Holland’s expertise and judgment and are committed to the Fund’s investment mandate.
Advisory Fees and Total Expenses. In reviewing the advisory fees borne by the Fund, the Directors reviewed information regarding the advisory fees of funds included in a group of mixed asset target allocation growth funds considered to be comparable to the Fund by Broadridge (the “Broadridge Expense Group”), and all funds in the retail no-load balanced fund category of Broadridge (the “Broadridge Expense Universe”). They noted that the Fund’s advisory fees were above the median of the Broadridge Expense Group and greater than the Broadridge Expense Universe, and that the total expenses were greater than the average expense ratios of the other funds in the Broadridge Expense Group and the Broadridge Expense Universe.
The Directors observed that, in the interest of limiting the expenses of the Fund, the Adviser had voluntarily capped the Fund’s total expenses at 1.50% of the Fund’s average daily net assets, on an annualized basis, since the Fund’s inception, and had increased the voluntary cap to 1.75% of the Fund’s average daily net assets, on an annualized basis, as of November 1, 2012. Under the voluntary cap, the Adviser reimburses the Fund when the actual expenses of the Fund exceed this cap and thus, so long as the voluntary cap remains in place, the total expenses paid by the Fund’s shareholders never exceed 1.75%. They noted that the Fund’s total expense ratio was higher than the total expense ratios of other similar funds.
19
Holland Series Fund, Inc.
| | |
| Holland Balanced Fund • | | UNAUDITED INFORMATION (continued) |
APPROVALOF CONTINUATIONOF INVESTMENT ADVISORY AGREEMENT (continued)
The Directors noted that the Fund is the Adviser’s only client and therefore comparisons to other funds or accounts advised or sub-advised by the Adviser were unavailable.
Profitability and Economies of Scale. The Directors considered information prepared by the Adviser with respect to the profitability of its relationship with the Fund, the extent to which economies of scale are realized by the Adviser in managing the Fund, and whether the Fund should implement advisory fee breakpoints to reflect any such economies of scale.
The Directors discussed in detail the analysis presented regarding the Adviser’s profitability in providing services to the Fund, and concluded that the level of profitability did not appear to be unreasonably high.
The Directors agreed with the Adviser’s assertion that due to the Fund’s small asset size and the fact that the Adviser only manages the Fund, the Fund has not to date realized appreciable economies of scale. The Independent Directors expressed their belief that the Fund will not likely be of sufficient size to realize economies of scale in the foreseeable future. For the same reasons, the Directors also found that the lack of breakpoints in the Fund’s management fee was not unreasonable.
Ancillary Benefits and Other Factors. The Directors also considered that the Adviser appears to receive no significant benefits other than investment advisory fees as a result of the Adviser’s relationship with the Fund. The Directors observed that the Adviser had never entered into soft dollar, revenue sharing or directed brokerage arrangements.
Conclusions. After reviewing various materials and reports provided, the Directors concluded, in the exercise of their business judgment, that: (i) the Adviser and Mr. Holland were sufficiently experienced and qualified to provide investment advisory services for the Fund; (ii) the Adviser is committed to the Fund, as evidenced by, among other things, the fee cap and the fact that the Fund is the Adviser’s sole client; (iii) Mr. Holland is committed to the Fund, as evidenced by his large ownership in the Fund; (iv) the profitability of the Adviser for providing services to the Fund does not appear unreasonable; (v) the Fund’s expenses and performance are disclosed in the Fund’s registration statement and/or reports to shareholders, allowing investors to make informed decisions about an investment in the Fund; (vi) the Fund’s small asset size limits the Fund’s potential to generate economies of scale; and (vii) the lack of breakpoints in the Fund’s advisory fees is reasonable given the Fund’s anticipated continued small asset size.
The Directors also noted generally that the Fund had been in existence for a substantial period of time, that investors in the Fund appear to appreciate the expertise and judgment Mr. Holland brings to the Fund from his long experience in the securities and investment management industries, and that, from their apparent commitment to the Fund, shareholders appear satisfied with the level of fees charged by the Adviser to access Mr. Holland’s expertise and judgment.
20
Holland Series Fund, Inc.
| | |
| Holland Balanced Fund • | | UNAUDITED INFORMATION (continued) |
APPROVALOF CONTINUATIONOF INVESTMENT ADVISORY AGREEMENT (continued)
In light of the information presented to them and the other factors described above, the Directors concluded, in the exercise of their business judgment, that the fee paid by the Fund under the Advisory Agreement generally appeared reasonable and voted to approve the continuation of the Agreement for the coming year.
FEDERAL TAX INFORMATION
Certain tax information for the Fund is required to be provided to shareholders based on the Fund’s income and distributions for the taxable year ended September 30, 2016. The amounts shown may differ from those elsewhere in this report due to differences between tax and financial reporting requirements. In January 2017, shareholders will receive Form 1099-DIV which will include their share of qualified dividends, and capital gains distributed during the calendar year 2016. Shareholders are advised to check with their tax advisors for information on the treatment of these amounts on their individual income tax returns.
The Holland Balanced Fund designated 100% of ordinary income dividends as income qualifying for dividends received deduction for the fiscal year ended September 30, 2014.
Under Section 854(b)(2) of the Code, the Holland Balanced Fund designates $2,167,454 for long term capital gains, for the fiscal year ended September 30, 2016.
SHAREHOLDER EXPENSES
As a shareholder of the Fund, you incur two types of costs: (1) transaction costs and (2) ongoing costs, including management fees and other Fund expenses. This example is intended to help you understand your ongoing costs of investing in the Fund and to compare these costs with the ongoing costs of investing in other mutual funds. It is based on an investment of $1,000 invested at the beginning of the period and held for the entire six-month period ended September 30, 2016.
Actual Expenses. The first table below provides information about actual account values and actual expenses. You may use the information in this line, together with the amount you invested, to estimate the expenses that you incurred over the period. Simply divide your account value at the end of the period by $1,000 (for example, an $8,600 account value divided by $1,000 = 8.6), then multiply the result by the number under the heading entitled “Expenses Paid during the Period” to estimate the expenses attributable to your investment during this period.
Hypothetical Example for Comparison Purposes. The second table below provides information about hypothetical account values and hypothetical expenses based on the Fund’s actual expense ratios and an assumed rate of return of 5% per year before expenses, which is not the Fund’s actual return. Thus, you should not use the hypothetical account values and expenses to estimate the actual ending account balance or your expenses for the period. Rather, these figures are
21
Holland Series Fund, Inc.
| | |
| Holland Balanced Fund • | | UNAUDITED INFORMATION (concluded) |
SHAREHOLDER EXPENSES (continued)
provided to enable you to compare the ongoing costs of investing in the Fund and other funds. To do so, compare the 5% hypothetical examples with the 5% hypothetical examples that appear in the shareholder reports of the other funds.
| | | | | | | | |
| For the Six Months Ended September 30, 2016 | |
| Actual | | Value of a $1,000 Investment at End of Period | | | Expenses* Paid During the Period | |
| | $ | 1,025.80 | | | $ | 8.86 | |
| | | | | | | | |
| For the Six Months Ended September 30, 2016 | |
Hypothetical
(assuming a 5%
return before
expenses) | | Value of a $1,000 Investment at End of Period | | | Expenses* Paid During the Period | |
| | $ | 1,016.25 | | | $ | 8.82 | |
| * | Expenses are equal to the Fund’s annualized net expense ratio of 1.75% multiplied by the average account value over the period multiplied by 183/366 to reflect the one-half year period. |
22
Holland Series Fund, Inc.
| | |
| Holland Balanced Fund • | | DIRECTORSAND OFFICERS (UNAUDITED) |
| | | | | | | | | | | | |
| Name, Address, and Age | | Position(s)
Held with
Fund | | Term of Office
and Length of
Time Served | | Principal Occupation During Past Five Years | | Number of Portfolios in Fund Complex Overseen by Director | | | Other
Directorships
Held by
Director |
Interested Director: | | | | | | | | | | | | |
Michael F. Holland 375 Park Avenue New York, NY 10152 Age: 72 | | Director, Chairman of the Board, President and Treasurer | | Term: Unlimited Elected: 9/95 | | Holland & Company L.L.C., Chairman, 1995 – present. | | | 1 | | | Trustee, SSgA Mutual Funds and Director, The China Fund, Inc., The Taiwan Fund, Inc., Reaves Utility Income Fund; Blackstone Funds. |
Independent Directors: | | | | | | | | | | | | |
Desmond G. FitzGerald 375 Park Avenue New York, NY 10152 Age: 72 | | Director | | Term: Unlimited Elected: 9/95 | | Chairman, North American Properties Group (Real Estate), 1987 – Present; Founding Managing Member, Holyoke Partners LLC (Fund of Hedge Funds), 2005 – present; Managing Member Neural Pathways LLC (Medical Devices), 2011 – present. | | | 1 | | | Trustee Williams Capital Management Trust. Director, Ren Technologies; President, Hope for Poor Children Foundation; Vice Chairman, Helen Keller International; Trustee, ORBIS International; Trustee, Aquaya Institute; Trustee, Water Aid America |
| | | | | |
James Lee 900 South Bay View Avenue Seaside Park, NJ 08752 Age: 75 | | Director | | Term: Unlimited Elected 5/08 | | President, James J. Lee Investment Advisors LLC, 1995 – present. | | | 1 | | | Trustee, Scholarship Fund for Inner City Children. |
| | | | | |
Jeff C. Tarr Junction Advisors Apartment 25C 145 Central Park West New York, NY 10023 Age: 72 | | Director | | Term: Unlimited Elected: 9/95 | | Chairman, Junction Advisors (Financial Services), 1981 – present. | | | 1 | | | Trustee, Edward P. Evans Foundation. |
| | | | | |
Officers: | | | | | | | | | | | | |
Tana Tselepis 375 Park Avenue New York, NY 10152 Age: 80 | | Vice President, Chief Compliance Officer, Anti-Money Laundering Compliance Officer | | Term: Unlimited Elected Vice President: 5/02 Elected Chief Compliance Officer: 9/04 Elected Anti-Money Laundering Compliance Officer: 5/09 | | Consultant to Holland & Company, LLC, 1997 – 1999. | | | — | | | Member of the Board of Governors of Tufts Medical Center; Director and Vice President of Malden Kiwanis |
| | | | | |
Kristin Schantz State Street Bank and Trust Company One Lincoln Street Boston, MA 02111 Age: 37 | | Secretary | | Term: Indefinite Elected: 5/16 | | Vice President and Senior Counsel, State Street Bank and Trust Company (2013 to Present); Vice President, Citi Fund Services Ohio, Inc., (2008 to 2013) | | | — | | | — |
| | | | | |
David James State Street Bank and Trust Company One Lincoln Street Boston, MA 02111 Age: 45 | | Assistant Secretary | | Term: Indefinite Elected: 7/14 | | Managing Director and Managing Counsel, State Street Bank and Trust Company (2009 to present). | | | — | | | — |
23
Holland Series Fund, Inc.
ADVISER
Holland & Company LLC
375 Park Avenue
New York, NY 10152
| email | mike@thehollandfund.com |
| website | www.thehollandfund.com |
FUND ADMINISTRATOR,
CUSTODIANAND FUND
ACCOUNTING AGENT
State Street Bank and Trust Co.
1 Iron Street
Boston, MA 02210
DISTRIBUTOR
ALPS Distributors, Inc.
1290 Broadway, Suite 1100
Denver, CO 80203
TRANSFER AGENT & DIVIDEND
DISBURSING AGENT
ALPS Fund Services, Inc.
1290 Broadway, Suite 1100
Denver, CO 80203
LEGAL COUNSEL
Ropes & Gray LLP
Prudential Tower
800 Boylston Street
Boston, MA 02119-3600
INDEPENDENT REGISTERED
PUBLIC ACCOUNTING FIRM
BBD, LLP
1835 Market St., 26th Floor
Philadelphia, PA 19103
Holland & Company LLC
375 Park Avenue
New York, New York 10152
| Email | mike@thehollandfund.com |
| Website | www.thehollandfund.com |
This report has been prepared for the Holland Balanced Fund’s Shareholders and may be distributed to others only
if preceded or accompanied by a prospectus.
Item 2. Code of Ethics
As of September 30, 2016, Holland Series Fund, Inc. (the “Fund”) has adopted a code of ethics, as defined in Item 2(b) of Form N-CSR, that applies to the Fund’s principal executive officer and principal financial officer. The Fund has not made any amendments to its code of ethics during the covered period. The Fund has not granted any waivers from any provisions of the code of ethics during the covered period. A copy of the Fund’s code of ethics has been posted on www.hollandbalancedfund.com, the Fund’s website.
Item 3. Audit Committee Financial Expert
The Board of Directors of the Fund has determined that the Fund has one Audit Committee financial expert serving on its Audit Committee. The Audit Committee financial expert serving on the Fund’s Audit Committee is Desmond G. FitzGerald, who is independent.
Item 4. Principal Accountant Fees and Services
Audit Fees
For the fiscal year ending September 30, 2016 and September 30, 2015, the aggregate audit fees billed for professional services rendered by BBD, LLP (“BBD”), the Fund’s principal accountant, for the audit of the Fund’s annual financial statements and services normally provided by BBD in connection with the Fund’s statutory and regulatory filings or engagement were $19,900 and $19,900.
For the fiscal year ending September 30, 2016 and September 30, 2015, there were no fees for assurance and related services by BBD reasonably related to the performance of the audit of the Fund’s financial statements that were not reported under (a) of this Item.
For the fiscal year ending September 30, 2016 and September 30, 2015, the aggregate tax fees billed for professional services rendered by BBD for tax compliance, tax advice, and tax planning were $2,500 and $2,500. Services included the review of income and excise tax returns for the Fund.
For the fiscal year ending September 30, 2016 and September 30, 2015, there were no fees billed for professional services rendered by BBD for products and services provided by BBD, other than the services reported in (a) through (c).
For the fiscal year ended September 30, 2016 and September 30, 2015, there were no fees billed for professional services rendered by BBD for products and services provided by BBD to Holland & Company, LLC (the “Adviser”) and any entity controlling, controlled by, or under common control with the Adviser that provides ongoing services to the Fund that (i) relate directly to the operations and financial reporting of the Fund and (ii) were pre-approved by the Fund’s Audit Committee.
| | (e)(1) | Audit Committee Pre-Approval Policies and Procedures |
The Fund’s Audit Committee Charter states the following with respect to pre-approval procedures:
Pre-Approval Requirements. Before the independent accountants are engaged by the Fund to render audit or non-audit services, either:
| | 1. | The Audit Committee shall pre-approve all auditing services and permissible non-audit services (e.g., tax services) provided to the Fund. The Audit Committee may delegate to one or more of its members the authority to grant pre-approvals. Any decision of any member to whom authority is delegated under this section shall be presented to the full Audit Committee at its next regularly scheduled meeting; |
or
| | 2. | The engagement to render the auditing service or permissible non-audit service is entered into pursuant to pre-approval policies and procedures established by the Audit Committee. Any such policies and procedures must (1) be detailed as to the particular service and (2) not involve any delegation of the Audit Committee’s responsibilities to the investment adviser. The Audit Committee must be informed of each service entered into pursuant to the policies and procedures. A copy of any such policies and procedures shall be attached as an exhibit to the Audit Committee Charter. |
De Minimis Exceptions to Pre-Approval Requirements. Pre-Approval for a service provided to the Fund other than audit, review or attest services is not required if: (1) the aggregate amount of all such non-audit services provided to the Fund constitutes not more than 5 percent of the total amount of revenues paid by the Fund to the independent accountants during the fiscal year in which the non-audit services are provided; (2) such services were not
recognized by the Fund at the time of the engagement to be non-audit services; and (3) such services are promptly brought to the attention of the Audit Committee and are approved by the Audit Committee or by one or more members of the Audit Committee to whom authority to grant such approvals has been delegated by the Audit Committee prior to the completion of the audit.
Pre-Approval of Non-Audit Services Provided to the Adviser and Certain Control Persons. The Audit Committee shall pre-approve any non-audit services proposed to be provided by the independent accountants to (a) the investment adviser and (b) any entity controlling, controlled by, or under common control with the investment adviser that provides ongoing services to the Fund, if the independent accountants’ engagement with the investment adviser or any such control persons relates directly to the operations and financial reporting of the Fund. It shall be the responsibility of the independent accountants to notify the Audit Committee of any non-audit services that need to be pre-approved.
Application of De Minimis Exception: The De Minimis exception set forth above applies to pre-approvals under this Section as well, except that the “total amount of revenues” calculation is based on the total amount of revenues paid to the independent accountants by the Fund and any other entity that has its services approved under this Section (i.e., the investment adviser or any control person).
| | (e)(2) | Percentages of Services |
None of the services described in paragraphs (b) through (d) of this Item were performed in reliance on paragraph (c)(7)(i)(C) of Rule 2-01 of Regulation S-X during the period for time for which such was effective.
| | (g) | Total Fees Paid By Adviser and Certain Affiliates |
For the fiscal year ending September 30, 2016 and September 30, 2015, the aggregate non-audit fees billed by BBD for services rendered to the Fund and Holland & Company, LLC (the “Adviser”) and any entity controlling, controlled by, or under common control with the Adviser that provided ongoing services to the Fund were $0 and $0.
Item 5. Audit Committee of Listed Registrants
Not applicable to the Registrant.
Item 6. Schedule of Investments
| | (a) | Schedule of Investments is included as part of Item 1 of the Form N-CSR. |
Item 7. Disclosure of Proxy Voting Policies and Procedures for Closed-End Management Investment Companies.
Not applicable to the Registrant.
Item 8. Portfolio Managers of Closed-End Management Investment Companies.
Not applicable to the Registrant.
Item 9. Purchases of Equity Securities by Closed-End Management Investment Company and Affiliated Purchasers.
Not applicable to the Registrant.
Item 10. Submission of Matters to a Vote of Security Holders.
There were no material changes to the procedures by which shareholders may recommend nominees to the Fund’s Board of Directors.
Item 11. Controls and Procedures.
(a) Within 90 days of the filing date of this Form N-CSR, Michael Holland, the Fund’s President and Treasurer, reviewed the registrant’s disclosure controls and procedures (the “Procedures”) and evaluated their effectiveness. Based on his review, Mr. Holland determined that the Procedures adequately ensure that information required to be disclosed by the Fund in its periodic reports is recorded, processed, summarized and reported within the time periods required by the Securities and Exchange Commission’s rules and regulations.
(b) There were no significant changes in the Fund’s internal controls or in other factors that could significantly affect these controls subsequent to the date of their evaluation, including any corrective actions with regard to significant deficiencies and material weaknesses.
Item 12. Exhibits
(a)(1) Not applicable to the Filing.
(a)(2) The certifications required by Rule 30a-2 of the Investment Company Act of 1940, as amended (the “1940 Act”) are attached hereto.
(a)(3) Not applicable to the Filing.
(b) The certifications required by Rule 30a-2(b) of the 1940 Act and Sections 906 of the Sarbanes-Oxley Act of 2002 are attached hereto.
SIGNATURES
Pursuant to the requirements of the Securities Exchange Act of 1934 and the Investment Company Act of 1940, the registrant has duly caused this report to be signed on its behalf by the undersigned, thereunto duly authorized.
| | |
| HOLLAND SERIES FUND, INC. |
| |
| By: | | /s/ Michael F. Holland |
| | Michael F. Holland |
| | President and Treasurer of Holland Series Fund, Inc. |
Date: November 22, 2016
Pursuant to the requirements of the Securities Exchange Act of 1934 and the Investment Company Act of 1940, this report has been signed below by the following persons on behalf of the registrant and in the capacities and on the dates indicated.
| | |
| By: | | /s/ Michael F. Holland |
| | Michael F. Holland |
| | President and Treasurer of Holland Series Fund, Inc. |
Date: November 22, 2016