
October 2023 NASDAQ: FBMS

2 Safe Harbor & Forward Looking Statements ABOUT THE FIRST BANCSHARES, INC. The First Bancshares, Inc. (“FBMS” or the “Company”), headquartered in Hattiesburg, Mississippi, is the parent company of The First Bank. Founded in 1996, The First has operations in Mississippi, Louisiana, Alabama, Florida and Georgia. The Company’s stock is traded on NASDAQ Global Market under the symbol FBMS. Contact: Chandra Kidd, Corporate Secretary. NON-GAAP FINANCIAL MEASURES Our accounting and reporting policies conform to generally accepted accounting principles (“GAAP”) in the United States and prevailing practices in the banking industry. However, certain non-GAAP measures are used by management to supplement the evaluation of our performance. This presentation includes the following non-GAAP financial measures: Diluted Earnings Per Share, Operating; Net Income, Operating; Return on Average Assets (ROAA), Operating; Pre-Tax Pre-Provision Return on Average Assets (ROAA), Operating; Return on Average Tangible Common Equity (ROATCE); Return on Average Tangible Common Equity (ROATCE), Operating; Efficiency Ratio, Operating; Net Interest Margin, Fully Tax Equivalent (FTE); Core Net Interest Margin, Fully Tax Equivalent (FTE); Pre-Tax Pre Provision Income, Operating; Non-Interest Income, Operating; Adjusted Operating Revenue; Adjusted Operating Expense; Tangible Common Equity; Tangible Book Value per Share; Tangible Common Equity to Tangible Assets Ratio; Earnings per Share, Operating; and certain ratios derived from these non-GAAP financial measures. The Company believes that the non-GAAP financial measures included in this presentation allow management and investors to understand and compare results in a more consistent manner for the periods presented in this press release. Non-GAAP financial measures should be considered supplemental and not a substitute for the Company’s results reported in accordance with GAAP for the periods presented, and other bank holding companies may define or calculate these measures differently. These non-GAAP financial measures should not be considered in isolation and do not purport to be an alternative to their most comparable GAAP measures. A reconciliation of these non-GAAP financial measures to the most comparable GAAP measure is provided in the appendix to this presentation. FORWARD LOOKING STATEMENTS This communication contains statements that constitute “forward looking statements” within the meaning of, and subject to the protections of, Section 27A of the Securities Act of 1933, as amended, and Section 21E of the Securities Exchange Act of 1934, as amended. All statements other than statements of historical fact are forward-looking statements. Such statements can generally be identified by such words as “believes,” “anticipates,” “expects,” “may,” “will,” “assumes,” “should,” “predicts,” “could,” “would,” “intends,” “targets,” “estimates,” “projects,” “plans,” “potential,” “positioned” and other similar words and expressions of the future or otherwise regarding the outlook for the Company’s future business and financial performance and/or the performance of the banking industry and economy in general. Prospective investors are cautioned that any such forward-looking statements are not guarantees of future performance and involve known and unknown risk and uncertainties which may cause the actual results, performance or achievements of the Company to be materially different from the future results, performance or achievements expressed or implied by such forward-looking statements. Forward-looking statements are based on the information known to, and current beliefs and expectations of, the Company’s management and are subject to significant risks and uncertainties. Actual results may differ materially from those contemplated by such forward-looking statements. Factors that might cause such differences include, but are not limited to: (1) competitive pressures among financial institutions increasing significantly; (2) prevailing, or changes in economic or political conditions, either nationally or locally, particularly in areas in which the Company conducts operations, including the effects of declines in the real estate market, high unemployment rates, inflationary pressure, elevated interest rates and slowdowns in economic growth, as well as the financial stress on borrowers as a result of the foregoing; (3) interest rate risk, including the effects of rising interest rates; (4) developments in our mortgage banking business, including loan modifications, general demand, and the effects of judicial or regulatory requirements or guidance; (5) changes in applicable laws, rules, or regulations; (6) risks related to the Company’s recently completed acquisitions, including that the anticipated benefits from the recently completed acquisitions are not realized in the time frame anticipated or at all as a result of changes in general economic and market conditions or other unexpected factors or events; (7) changes in management’s plans for the future; (8) credit risk associated with our lending activities; (9) changes in loan demand, real estate values, or competition; (10) changes in accounting principles, policies, or guidelines; (11) adverse results from current or future litigation, regulatory examinations or other legal and/or regulatory actions, including as a result of the Company’s participation in and execution of government programs related to the COVID-19 pandemic and related variants; (12) higher inflation and its impacts; (13) significant turbulence or disruption in the capital or financial markets and the effect of a fall in stock market prices on our investment securities; (14) potential impacts of the recent adverse developments in the banking industry highlighted by high-profile bank failures, including impacts on customer confidence, deposit outflows, liquidity and the regulatory response thereto; (15) the effects of war or other conflicts including the impacts relating to or resulting from Russia’s military action in Ukraine or the conflict in Israel and surrounding areas; (16) a deterioration of the credit rating for U.S. long-term sovereign debt, actions that the U.S. government may take to avoid exceeding the debt ceiling, or uncertainties surrounding the debt ceiling and the federal budget; and (17) other general competitive, economic, political, and market factors, including those affecting our business, operations, pricing, products, or services. The Company does not undertake any obligation to update or revise any forward-looking statements, whether as a result of new information, future events or otherwise. For any forward-looking statements made in this communication, any exhibits hereto or any related documents, the Company claims protection of the safe harbor for forward-looking statements contained in the Private Securities Litigation Reform Act of 1995.
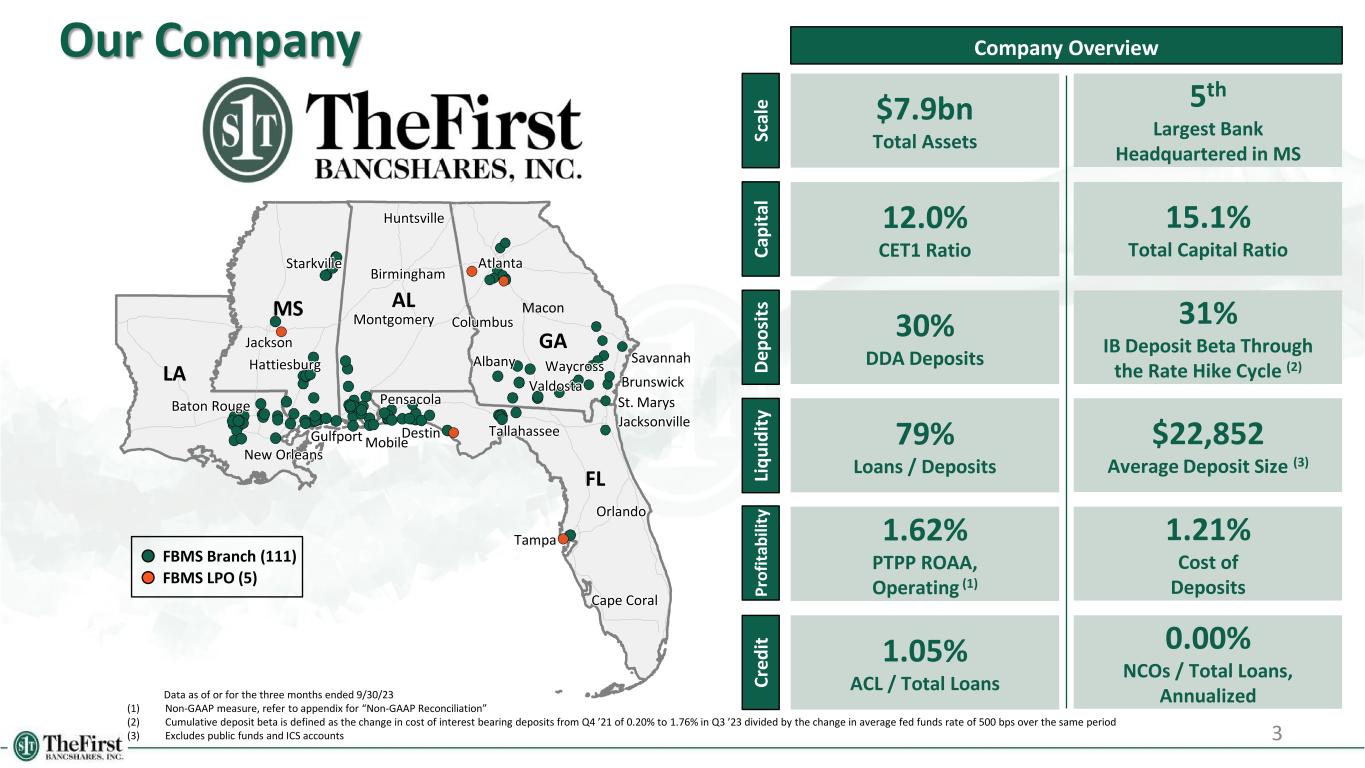
1.21% Cost of Deposits 15.1% Total Capital Ratio 5th Largest Bank Headquartered in MS $7.9bn Total Assets $22,852 Average Deposit Size (3) 3 Our Company Company Overview 79% Loans / Deposits 12.0% CET1 Ratio Data as of or for the three months ended 9/30/23 (1) Non-GAAP measure, refer to appendix for “Non-GAAP Reconciliation” (2) Cumulative deposit beta is defined as the change in cost of interest bearing deposits from Q4 ’21 of 0.20% to 1.76% in Q3 ’23 divided by the change in average fed funds rate of 500 bps over the same period (3) Excludes public funds and ICS accounts 1.62% PTPP ROAA, Operating (1) 0.00% NCOs / Total Loans, Annualized 1.05% ACL / Total Loans AL FL GA LA MS Pensacola Jacksonville Tallahassee New Orleans Baton Rouge Jackson Birmingham Columbus Orlando Huntsville Montgomery Atlanta Destin St. Marys Valdosta Waycross Gulfport Mobile Hattiesburg Starkville Savannah Brunswick Albany Cape Coral Macon FBMS Branch (111) FBMS LPO (5) Sc al e C ap it al C re d it 31% IB Deposit Beta Through the Rate Hike Cycle (2) 30% DDA DepositsD ep o si ts Li q u id it y P ro fi ta b ili ty Tampa
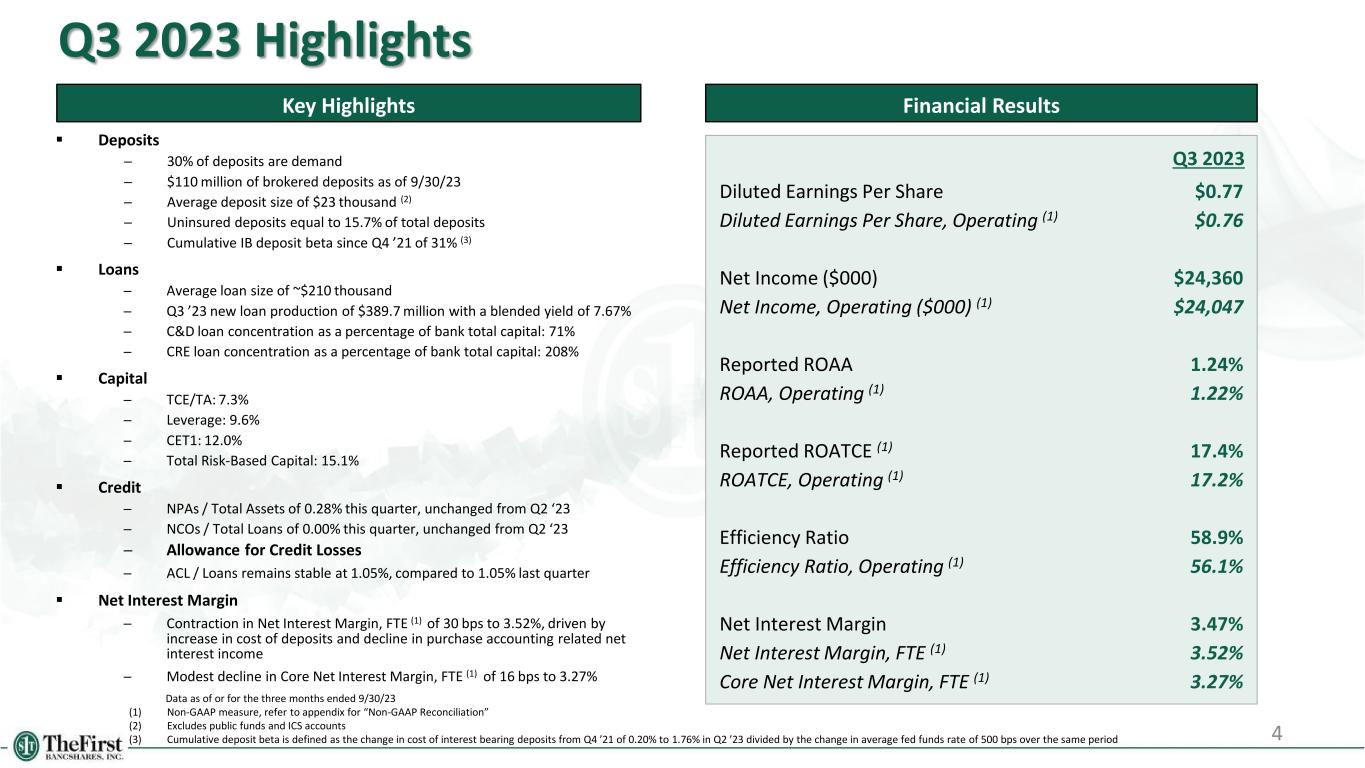
Q3 2023 Highlights Key Highlights Data as of or for the three months ended 9/30/23 (1) Non-GAAP measure, refer to appendix for “Non-GAAP Reconciliation” (2) Excludes public funds and ICS accounts (3) Cumulative deposit beta is defined as the change in cost of interest bearing deposits from Q4 ’21 of 0.20% to 1.76% in Q2 ’23 divided by the change in average fed funds rate of 500 bps over the same period 4 Financial Results Diluted Earnings Per Share Diluted Earnings Per Share, Operating (1) Net Income ($000) Net Income, Operating ($000) (1) Reported ROAA ROAA, Operating (1) Reported ROATCE (1) ROATCE, Operating (1) Efficiency Ratio Efficiency Ratio, Operating (1) Net Interest Margin Net Interest Margin, FTE (1) Core Net Interest Margin, FTE (1) Deposits ─ 30% of deposits are demand ─ $110 million of brokered deposits as of 9/30/23 ─ Average deposit size of $23 thousand (2) ─ Uninsured deposits equal to 15.7% of total deposits ─ Cumulative IB deposit beta since Q4 ’21 of 31% (3) Loans ─ Average loan size of ~$210 thousand ─ Q3 ’23 new loan production of $389.7 million with a blended yield of 7.67% ─ C&D loan concentration as a percentage of bank total capital: 71% ─ CRE loan concentration as a percentage of bank total capital: 208% Capital ─ TCE/TA: 7.3% ─ Leverage: 9.6% ─ CET1: 12.0% ─ Total Risk-Based Capital: 15.1% Credit ─ NPAs / Total Assets of 0.28% this quarter, unchanged from Q2 ‘23 ─ NCOs / Total Loans of 0.00% this quarter, unchanged from Q2 ‘23 ─ Allowance for Credit Losses ─ ACL / Loans remains stable at 1.05%, compared to 1.05% last quarter Net Interest Margin ─ Contraction in Net Interest Margin, FTE (1) of 30 bps to 3.52%, driven by increase in cost of deposits and decline in purchase accounting related net interest income ─ Modest decline in Core Net Interest Margin, FTE (1) of 16 bps to 3.27% $0.77 $0.76 $24,360 $24,047 1.24% 1.22% 17.4% 17.2% 58.9% 56.1% 3.47% 3.52% 3.27% Q3 2023
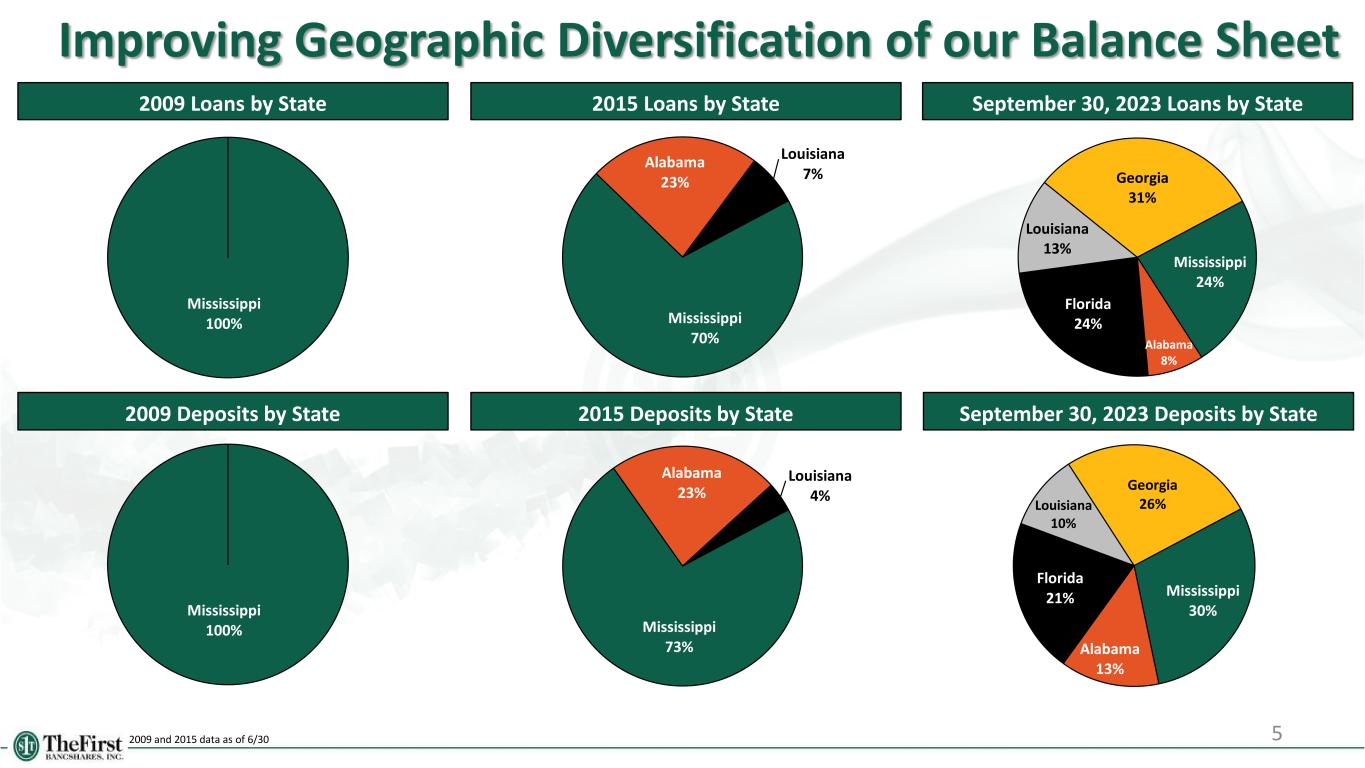
Improving Geographic Diversification of our Balance Sheet 5 2015 Deposits by State September 30, 2023 Deposits by State 2009 and 2015 data as of 6/30 2015 Loans by State September 30, 2023 Loans by State2009 Loans by State 2009 Deposits by State Mississippi 100% Mississippi 100% Mississippi 70% Alabama 23% Louisiana 7% Mississippi 73% Alabama 23% Louisiana 4% Mississippi 24% Alabama 8% Florida 24% Louisiana 13% Georgia 31% Mississippi 30% Alabama 13% Florida 21% Louisiana 10% Georgia 26%

6 FINANCIAL RESULTS

EPS Net Income ($mm) 7 Pre-tax Pre Provision Income ($mm), Operating (1) PTPP ROAA, Oper. (1) Annual data for the twelve months ended 12/31 of each respective year; quarterly data for the three months ended each respective quarter (1) Non-GAAP measure, refer to appendix for “Non-GAAP Reconciliation” Historical Performance Over Time Twelve Years of Record Earnings $0.82 $1.16 $0.96 $1.19 $1.55 $1.57 $1.11 $1.62 $2.55 $2.52 1.62%1.74% 1.61% 1.42% 1.49%$3.03 1.33% 1.24% 1.36% 1.63%$3.10 1.38% Operating Income $2.5 $3.6 $4.2 $6.3 $8.5 $9.7 $10.6 $21.2 $43.7 $52.5 $64.2 $62.9 $22.1 $20.8 $21.4 $19.4 $20.5 $18.9 $19.3 $20.8 $25.9 $22.2 $35.7 $35.7 $31.9 $68.3 $0.0 $12.0 $24.0 $36.0 $48.0 $60.0 $72.0 2011 2012 2013 2014 2015 2016 2017 2018 2019 2020 2021 2022 Q3 '20 Q4 '20 Q1 '21 Q2 '21 Q3 '21 Q4 '21 Q1 '22 Q2 '22 Q3 '22 Q4 '22 Q1 '23 Q2 '23 Q3'23 $5.4 1.78% 1.81% 1.62%
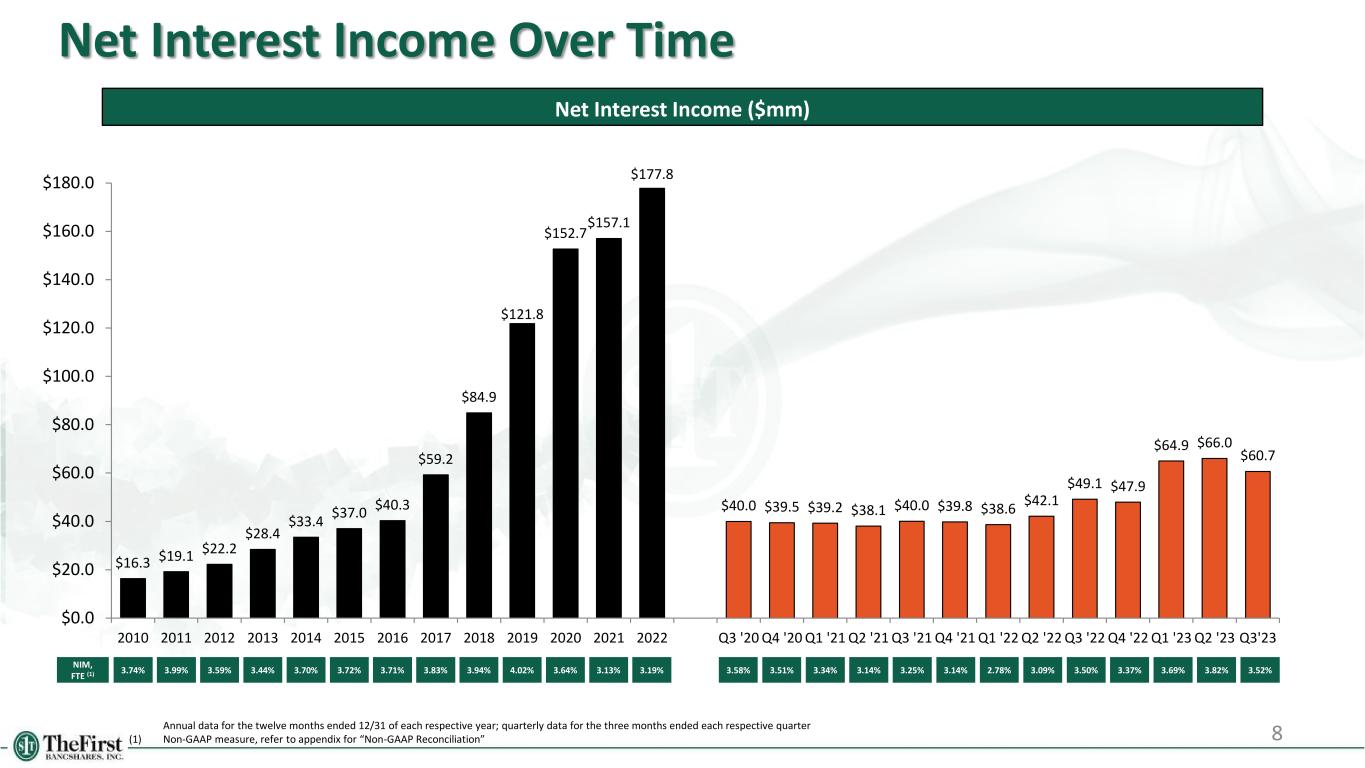
Net Interest Income Over Time 3.74% 3.99% 3.59% 3.44% 3.70% 3.72% 3.71% Net Interest Income ($mm) NIM, FTE (1) 3.34%3.83% 3.94% 3.58% 3.51%4.02% Annual data for the twelve months ended 12/31 of each respective year; quarterly data for the three months ended each respective quarter (1) Non-GAAP measure, refer to appendix for “Non-GAAP Reconciliation” $16.3 $19.1 $22.2 $28.4 $33.4 $37.0 $40.3 $59.2 $84.9 $121.8 $152.7 $157.1 $177.8 $40.0 $39.5 $39.2 $38.1 $40.0 $39.8 $38.6 $42.1 $49.1 $47.9 $64.9 $66.0 $60.7 $0.0 $20.0 $40.0 $60.0 $80.0 $100.0 $120.0 $140.0 $160.0 $180.0 2010 2011 2012 2013 2014 2015 2016 2017 2018 2019 2020 2021 2022 Q3 '20 Q4 '20 Q1 '21 Q2 '21 Q3 '21 Q4 '21 Q1 '22 Q2 '22 Q3 '22 Q4 '22 Q1 '23 Q2 '23 Q3'23 3.13% 3.14% 3.25% 8 3.64% 3.14% 2.78% 3.09% 3.50%3.19% 3.37% 3.69% 3.82% 3.52%

Historical Cost and Yield Analysis 9Data as of or for the three months ended each respective quarter (1) Non-GAAP measure, refer to appendix for “Non-GAAP Reconciliation” Quarterly Yields & Costs (%) 0.20% 0.51% 0.72% 0.91% 1.21% 3.50% 3.37% 3.69% 3.82% 3.52% 4.84% 4.98% 5.45% 5.99% 5.92% 2.40% 2.48% 2.51% 2.43% 2.47% 3.44% 3.29% 3.47% 3.43% 3.27% 0.00% 2.00% 4.00% 6.00% Q3 '22 Q4 '22 Q1 '23 Q2 '23 Q3 '23 Cost of Deposits Net Interest Margin (FTE) Yield on Loans Yield on Securities (FTE) Core Net Interest Margin (1)(1)
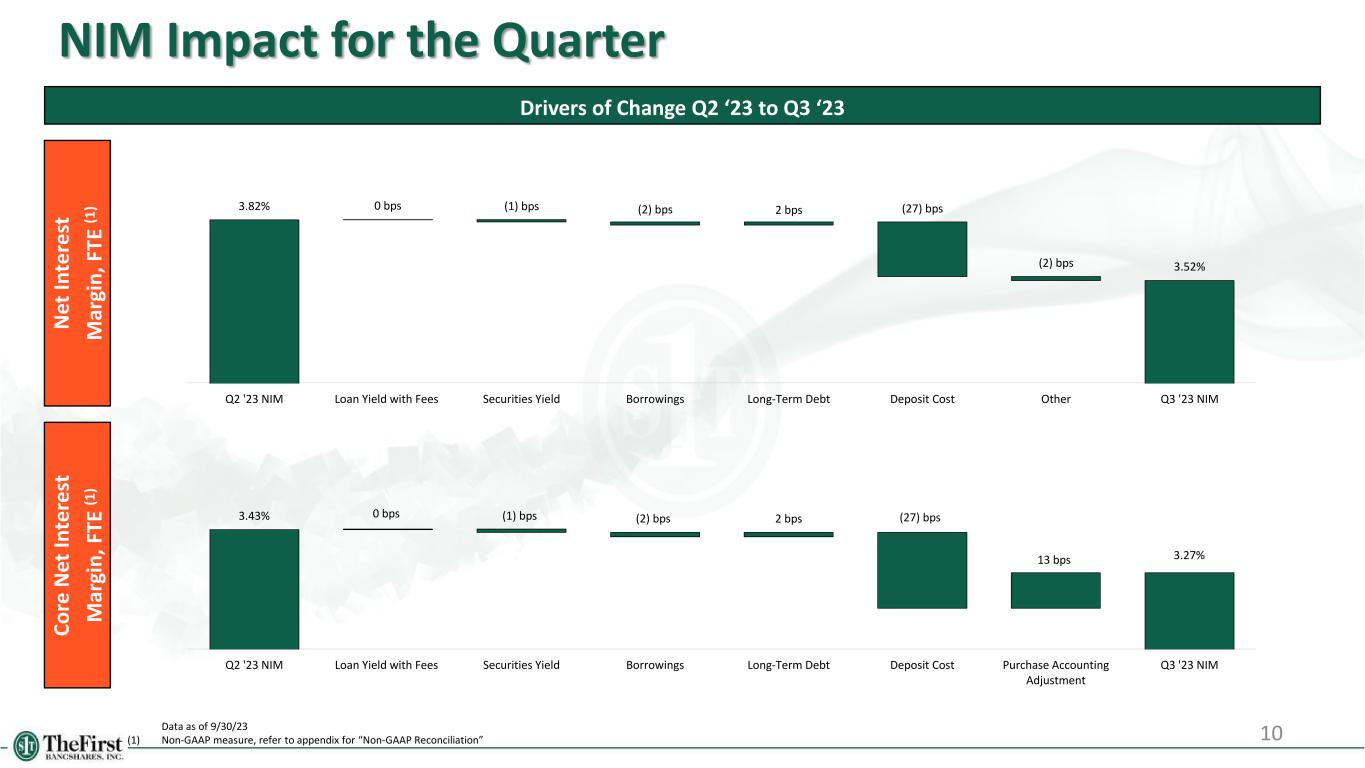
10 NIM Impact for the Quarter Drivers of Change Q2 ‘23 to Q3 ‘23 Data as of 9/30/23 (1) Non-GAAP measure, refer to appendix for “Non-GAAP Reconciliation” N et In te re st M ar gi n , F TE (1 ) C o re N et I n te re st M ar gi n , F TE (1 ) 3.82% 0 bps (1) bps (2) bps 2 bps (27) bps (2) bps 3.52% Q2 '23 NIM Loan Yield with Fees Securities Yield Borrowings Long-Term Debt Deposit Cost Other Q3 '23 NIM 3.43% 0 bps (1) bps (2) bps 2 bps (27) bps 13 bps 3.27% Q2 '23 NIM Loan Yield with Fees Securities Yield Borrowings Long-Term Debt Deposit Cost Purchase Accounting Adjustment Q3 '23 NIM

Historical Profitability Trends 11Data as of or for the three months ended each respective quarter (1) Non-GAAP measure, refer to appendix for “Non-GAAP Reconciliation” Reported ROAA (%) ROAA, Operating (%) (1) Reported ROATCE (%) (1) ROATCE, Operating (%) (1) PTPP ROAA, Oper. (1) 1.23% 1.07% 1.36% 1.36% 1.22% 0.50% 0.75% 1.00% 1.25% 1.50% Q3 '22 Q4 '22 Q1 '23 Q2 '23 Q3 '23 13.2% 16.0% 12.1% 17.1% 17.4% 0.0% 5.0% 10.0% 15.0% 20.0% 25.0% Q3 '22 Q4 '22 Q1 '23 Q2 '23 Q3 '23 18.5% 16.8% 20.1% 19.4% 17.2% 0.0% 5.0% 10.0% 15.0% 20.0% 25.0% Q3 '22 Q4 '22 Q1 '23 Q2 '23 Q3 '23 0.88% 1.01% 0.81% 1.21% 1.24% 0.50% 0.75% 1.00% 1.25% 1.50% Q3 '22 Q4 '22 Q1 '23 Q2 '23 Q3 '23 1.63% 1.38% 1.78% 1.81% 1.62%

12 Historical Profitability Trends Non-interest Income, Oper. / Adj. Operating Revenue (%) (1) Non-interest Income Q3 ‘23 (%) Efficiency Ratio, Operating (%) (1) Adjusted Operating Expense / Average Assets (%) (1) Data as of or for the three months ended each respective quarter (1) Non-GAAP measure, refer to appendix for “Non-GAAP Reconciliation” 54.6% 59.3% 53.3% 53.9% 56.1% 40.0% 45.0% 50.0% 55.0% 60.0% 65.0% Q3 '22 Q4 '22 Q1 '23 Q2 '23 Q3 '23 15.3% 14.3% 16.1% 15.6% 17.5% 10.0% 12.0% 14.0% 16.0% 18.0% 20.0% Q3 '22 Q4 '22 Q1 '23 Q2 '23 Q3 '23 2.02% 2.10% 2.09% 2.17% 2.13% 1.00% 1.50% 2.00% 2.50% Q3 '22 Q4 '22 Q1 '23 Q2 '23 Q3 '23 Service Charges on Deposits 19% Mortgage 11% Interchange Fee Income 27% Other Charges and Fees 43%

13 DEPOSIT AND LOAN INFORMATION

0.30% 0.23% 0.19% 0.18% 0.15% 0.21% 0.52% 0.72% 0.91% 1.21% 1.10% 1.22% 1.31% Q2 '21 Q3 '21 Q4 '21 Q1 '22 Q2 '22 Q3 '22 Q4 '22 Q1 '23 Q2 '23 Q3 '23 July '23 Aug '23 Sept '23 14 Deposit Composition Growth Historical Deposit Composition Cost of Total Deposits Over Time (%) Dollars in millions unless otherwise noted Annual data as of or for the twelve months ended each respective year; quarterly data as of or for the three months ended each respective quarter (1) Excludes public funds and ICS accounts (2) Cumulative deposit beta is defined as the change in cost of interest bearing deposits from Q4 ’21 of 0.20% to 1.76% in Q3 ’23 divided by the change in average fed funds rate of 500 bps over the same period (3) Southeast median includes banks headquartered in the Southeast with total assets between $1 billion to $25 billion; Excludes merger targets DDA / Total Deposits Over Time (%) (3) Q3 ’23 Deposit Portfolio Summary and Composition MonthlyQuarterlyDeposits: $6.5B Uninsured Deposits (1): 15.7% Average Deposit Size (1): ~$23,000 Total Deposit Accounts (1): ~218,000 Commercial Accounts: ~35,000 Personal Accounts: ~183,000 Cumulative IB Deposit Beta Since Q4 ’21 (2): 31% $0.6 $0.7 $1.2 $1.5 $1.6 $2.0 $0.5 $0.6 $1.3 $1.8 $1.8 $2.0 $0.9 $1.1 $1.1 $1.3 $1.4 $1.5 $0.4 $0.5 $0.4 $0.4 $0.6 $0.8 $0.1 $0.2 $0.1 $0.1 $0.1 $0.3 $2.5 $3.1 $4.2 $5.2 $5.5 $6.5 2018 2019 2020 2021 2022 Q3 '23 Demand Deposits NOW Accounts Money Market & Savings Retail Time Deposits Jumbo Time Deposits Demand Deposits 30% NOW Accounts 30% Money Market & Savings 24% Retail Time Deposits 12% Jumbo Time Deposits 4% 31.3% 31.9% 29.7% 31.2% 32.1% 30.4%31.2% 31.3% 28.7% 27.4% 26.3% Q2 '22 Q3 '22 Q4 '22 Q1 '23 Q2 '23 Q3 '23 FBMS DDA % Southeast Median DDA %
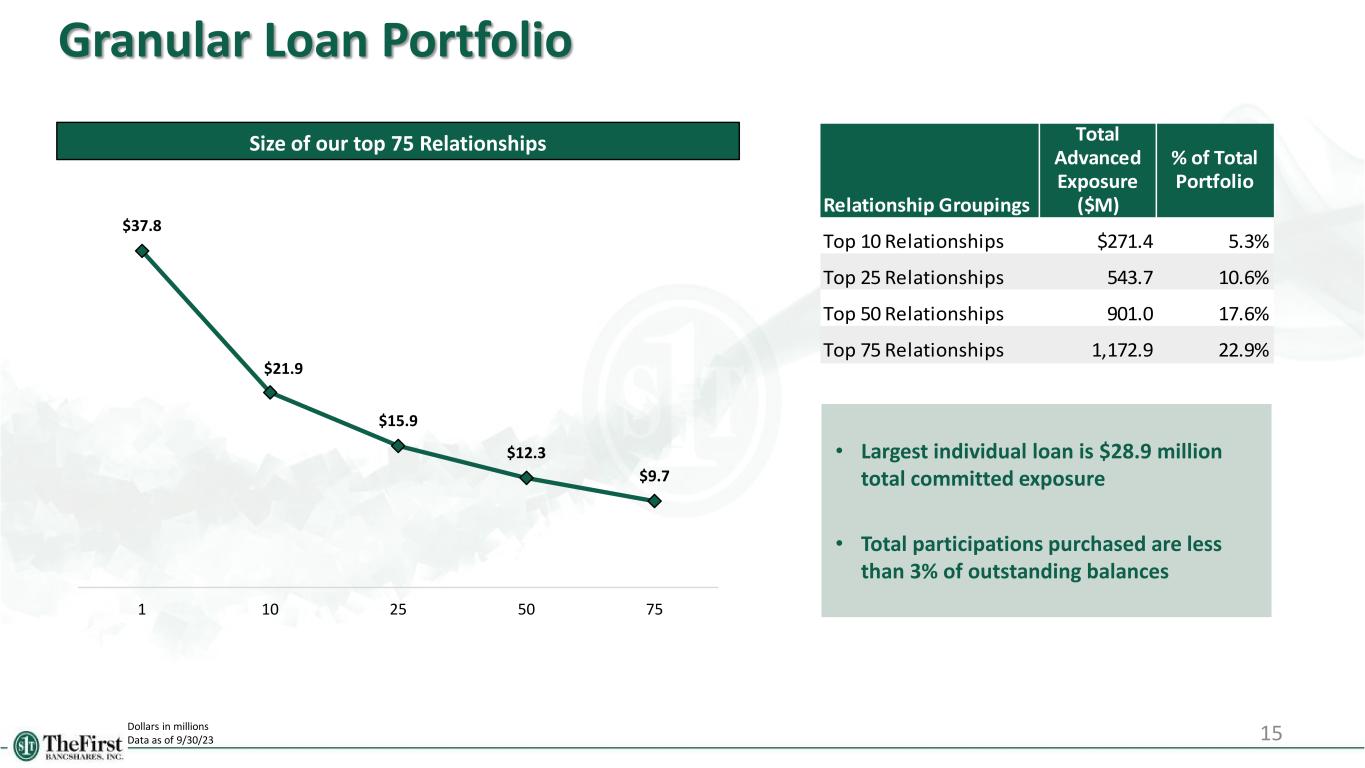
15 Granular Loan Portfolio Dollars in millions Data as of 9/30/23 Size of our top 75 Relationships • Largest individual loan is $28.9 million total committed exposure • Total participations purchased are less than 3% of outstanding balances $37.8 $21.9 $15.9 $12.3 $9.7 1 10 25 50 75 Total Advanced % of Total Exposure Portfolio Relationship Groupings ($M) Top 10 Relationships $271.4 5.3% Top 25 Relationships 543.7 10.6% Top 50 Relationships 901.0 17.6% Top 75 Relationships 1,172.9 22.9%

16 Balanced Loan Portfolio Data as of 9/30/23 (1) Excludes owner-occupied CRE Loan Portfolio Mix CRE (1) Exposure by Type Granular loan portfolio, average loan size excluding PPP is ~$210 thousand Top 25 loans represent ~9% of total portfolio De Minimis consumer credit card loans ($1.4 million or 0.03% of total loans) Limited energy exposure ($25.5 million or 0.5% of total loans) De Minimis Shared National Credits (“SNCs”) of $15.1 million Criticized & classified loans decreased by $15.6 million in Q3 compared to Q2, an 11.7% decrease; includes loan payoffs of $9.6 million Retail Center 17% Hotel 14% Professional Office 25% Retail Stand- Alone 10% Warehouse / Indust 10% Multi-Family 5% Medical Facilities 9% C-Stores - Gas Stations 6% Mobile Home Parks 2% Mini-Storage 1% C&D Exposure by Type Residential 1-4 20% Multi-Family 17% Retail 3% Warehouse / Indust. 1% Office 4% Land Development 33% Other 22% 1-4 Family 19% Other 4% 1-4 Family HELOC 2% Multifamily 2% Owner Occ. CRE 24% Non- Owner Occ. CRE 21% C&D 12% C&I 15%

17 Office Exposure Data as of 9/30/23; Dollars in millions Professional Office by GeographyOffice Portfolio Maturity Florida 42% Georgia 27% Mississippi 15% Louisiana 10% Alabama 6% Office Portfolio Non-Owner Occupied % of Total Cumulative % Maturing in 2023 $10.2 5% 3% Maturing in 2024 8.7 4% 9% Maturing in 2025 14.5 7% 15% Maturing in 2026 20.2 10% 23% Maturing in 2027 41.3 20% 39% Maturing Beyond 2027 115.0 55% 100% Total $210.0 100% Office Exposure Highlights Average professional office loan size — Non-Owner Occupied: $737 thousand 15.4% of the total office portfolio matures through 2025 Professional office space comprises 9.7% of total loans Substandard office loans / total office loans: 4.4%

18 Loan Concentrations Over Time C&D Loan Concentration Over Time CRE Loan Concentration Over Time Yearly data as of 12/31 each respective year; quarterly data for the three months ended each respective quarter Note: 100% and 300% are the interagency guidance figures for C&D Concentration and CRE Concentration of a banking institution’s total risk-based capital, respectively 204% 195% 153% 149% 171% 207% 208% 208% 0% 100% 200% 300% 400% 2018 2019 2020 2021 2022 Q1 '23 Q2 '23 Q3 '23 86% 80% 49% 55% 63% 80% 74% 71% 0% 50% 100% 150% 200% 2018 2019 2020 2021 2022 Q1 '23 Q2 '23 Q3 '23

19 Asset Quality Over Time NPAs / Loans + OREO (%) NCOs / Average Loans (%) ACL / NPLs (%)ACL / Loans (%) Yearly data as of or for the twelve months ended each respective year; quarterly data for the three months ended each respective quarter 2.1% 1.5% 1.0% 0.5% 0.5% 0.4% 0.4% 2019 2020 2021 2022 Q1 '23 Q2 '23 Q3' 23 (0.00%) 0.11% 0.13% (0.05%) 0.01% 0.07% 0.00% 2019 2020 2021 2022 Q1 '23 Q2 '23 Q3' 23 0.53% 1.14% 1.04% 1.03% 1.06% 1.05% 1.05% 2019 2020 2021 2022 Q1 '23 Q2 '23 Q3' 23 30% 89% 110% 302% 302% 328% 307% 2019 2020 2021 2022 Q1 '23 Q2 '23 Q3' 23
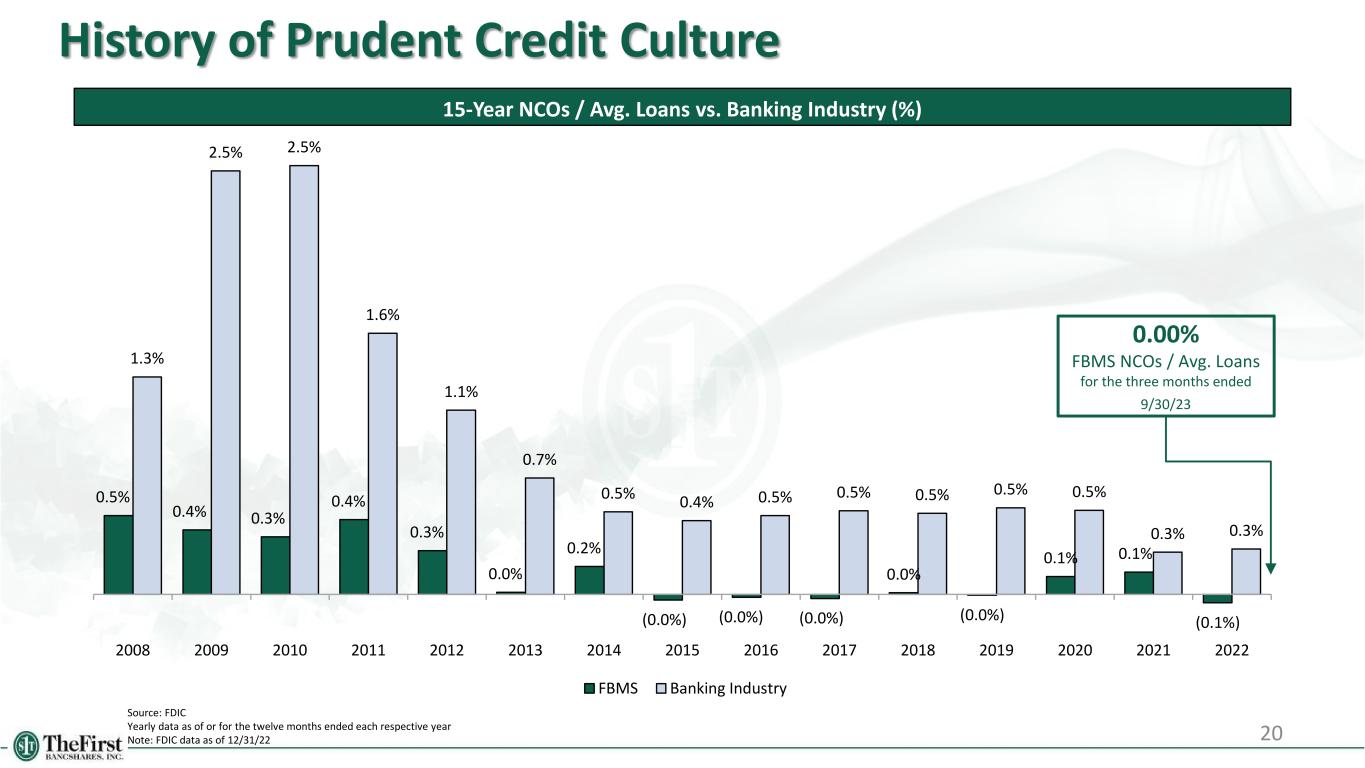
0.5% 0.4% 0.3% 0.4% 0.3% 0.0% 0.2% (0.0%) (0.0%) (0.0%) 0.0% (0.0%) 0.1% 0.1% (0.1%) 1.3% 2.5% 2.5% 1.6% 1.1% 0.7% 0.5% 0.4% 0.5% 0.5% 0.5% 0.5% 0.5% 0.3% 0.3% 2008 2009 2010 2011 2012 2013 2014 2015 2016 2017 2018 2019 2020 2021 2022 FBMS Banking Industry 20 History of Prudent Credit Culture 15-Year NCOs / Avg. Loans vs. Banking Industry (%) Source: FDIC Yearly data as of or for the twelve months ended each respective year Note: FDIC data as of 12/31/22 0.00% FBMS NCOs / Avg. Loans for the three months ended 9/30/23

21 CAPITAL & LIQUIDITY

22 Capital Position TCE / TA (%) (1) Leverage Ratio (%) Total Risk Based Capital Ratio (%)CET1 Ratio (%) Data as of 12/31 of each year, respectively; quarterly data for the three months ended each respective quarter (1) Non-GAAP measure, refer to appendix for “Non-GAAP Reconciliation” 9.5% 9.2% 8.3% 6.9% 7.2% 7.4% 7.3% 0.0% 5.0% 10.0% 15.0% 20.0% 2019 2020 2021 2022 Q1 '23 Q2 '23 Q3 '23 10.3% 9.2% 9.2% 9.4% 8.8% 9.1% 9.6% 0.0% 5.0% 10.0% 15.0% 20.0% 2019 2020 2021 2022 Q1 '23 Q2 '23 Q3 '23 12.5% 13.5% 13.7% 12.7% 11.2% 11.5% 12.0% 0.0% 5.0% 10.0% 15.0% 20.0% 2019 2020 2021 2022 Q1 '23 Q2 '23 Q3 '23 15.8% 19.1% 18.6% 16.7% 14.7% 14.5% 15.1% 0.0% 5.0% 10.0% 15.0% 20.0% 2019 2020 2021 2022 Q1 '23 Q2 '23 Q3 '23

23 Capital Position Including Unrealized Losses Data as of or for the three months ended 9/30/23 (1) Non-GAAP measure, refer to appendix for “Non-GAAP Reconciliation” (2) Assumes AOCI adjustments related to market valuations on securities and related hedges are included for regulatory capital calculations (3) Assumes AOCI adjustments related to market valuations on securities and related hedges as well as the fair value adjustment on HTM securities are included for regulatory capital calculations Reflected above is the hypothetical impact on capital if the mark on Accumulated Other Comprehensive Income (AOCI) Losses (2) and AOCI + Held- to-Maturity (HTM) (3) were included in the regulatory capital calculations Neither scenario is currently included, nor required to be included in the Company’s regulatory capital ratios As Reported Inc luding AOCI Losses ( 2 ) Inc luding AOCI + HTM Losses ( 3 ) TCE / TA Ratio ( 1 ) 7.3% 7.3% 6.6% Leverage Ratio 9.6% 7.4% 6.8% CET1 Ratio 12.0% 9.2% 8.3% Tier 1 Ratio 12.4% 9.6% 8.7% Total Risk-Based Capital Ratio 15.1% 12.3% 11.4% Regulatory Capital & Adjusted Capital as of 9/30/23
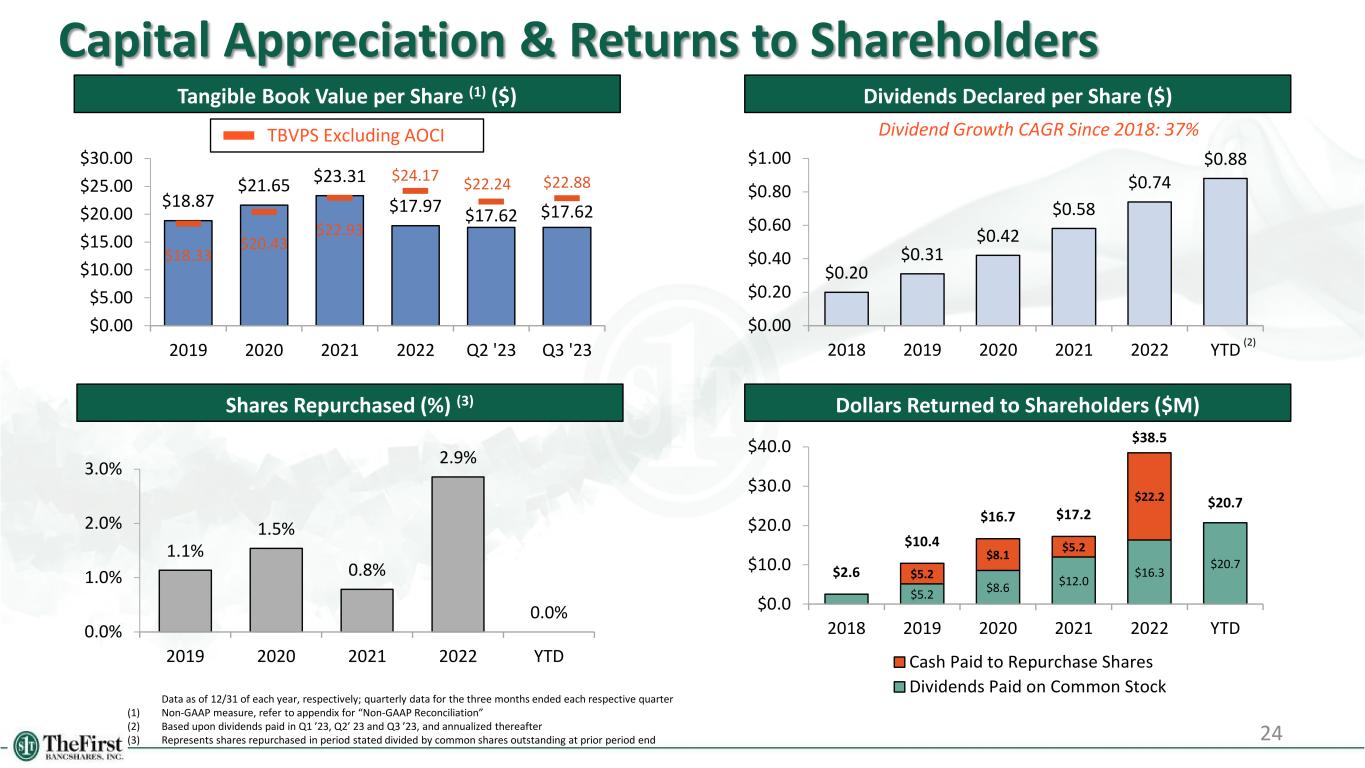
24 Capital Appreciation & Returns to Shareholders Tangible Book Value per Share (1) ($) Dividends Declared per Share ($) Shares Repurchased (%) (3) Data as of 12/31 of each year, respectively; quarterly data for the three months ended each respective quarter (1) Non-GAAP measure, refer to appendix for “Non-GAAP Reconciliation” (2) Based upon dividends paid in Q1 ’23, Q2’ 23 and Q3 ’23, and annualized thereafter (3) Represents shares repurchased in period stated divided by common shares outstanding at prior period end $0.20 $0.31 $0.42 $0.58 $0.74 $0.88 $0.00 $0.20 $0.40 $0.60 $0.80 $1.00 2018 2019 2020 2021 2022 YTD 1.1% 1.5% 0.8% 2.9% 0.0% 0.0% 1.0% 2.0% 3.0% 2019 2020 2021 2022 YTD Dollars Returned to Shareholders ($M) $5.2 $8.6 $12.0 $16.3 $20.7 $5.2 $8.1 $5.2 $22.2 $2.6 $10.4 $16.7 $17.2 $38.5 $20.7 $0.0 $10.0 $20.0 $30.0 $40.0 2018 2019 2020 2021 2022 YTD Cash Paid to Repurchase Shares Dividends Paid on Common Stock Dividend Growth CAGR Since 2018: 37%TBVPS Excluding AOCI (2) $18.87 $21.65 $23.31 $17.97 $17.62 $17.62 $18.33 $20.43 $22.93 $24.17 $22.24 $22.88 $0.00 $5.00 $10.00 $15.00 $20.00 $25.00 $30.00 2019 2020 2021 2022 Q2 '23 Q3 '23
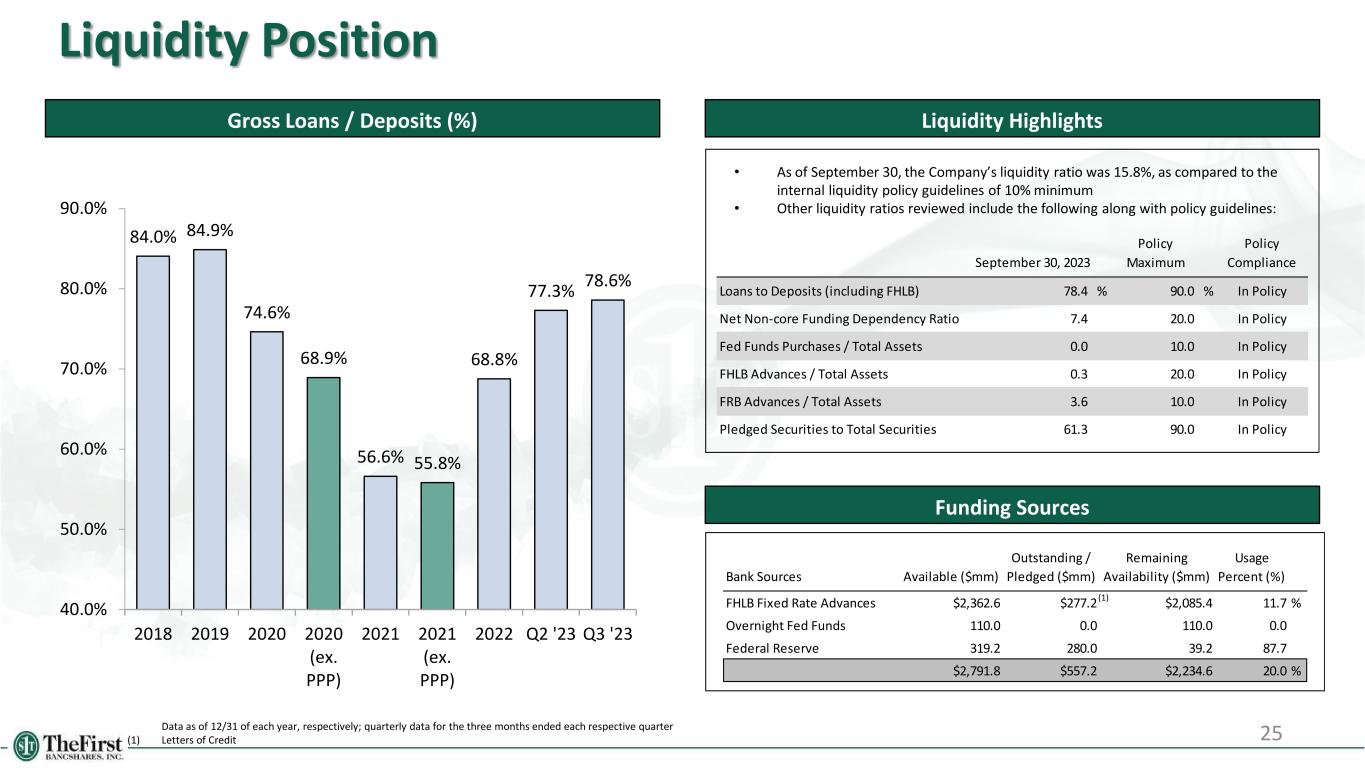
25 Liquidity Position Gross Loans / Deposits (%) Funding Sources 84.0% 84.9% 74.6% 68.9% 56.6% 55.8% 68.8% 77.3% 78.6% 40.0% 50.0% 60.0% 70.0% 80.0% 90.0% 2018 2019 2020 2020 (ex. PPP) 2021 2021 (ex. PPP) 2022 Q2 '23 Q3 '23 Outstanding / Remaining Usage Bank Sources Available ($mm) Pledged ($mm) Availability ($mm) Percent (%) FHLB Fixed Rate Advances $2,362.6 $277.2 $2,085.4 11.7 % Overnight Fed Funds 110.0 0.0 110.0 0.0 Federal Reserve 319.2 280.0 39.2 87.7 $2,791.8 $557.2 $2,234.6 20.0 % Policy Policy September 30, 2023 Maximum Compliance Loans to Deposits (including FHLB) 78.4 % 90.0 % In Policy Net Non-core Funding Dependency Ratio 7.4 20.0 In Policy Fed Funds Purchases / Total Assets 0.0 10.0 In Policy FHLB Advances / Total Assets 0.3 20.0 In Policy FRB Advances / Total Assets 3.6 10.0 In Policy Pledged Securities to Total Securities 61.3 90.0 In Policy Liquidity Highlights • As of September 30, the Company’s liquidity ratio was 15.8%, as compared to the internal liquidity policy guidelines of 10% minimum • Other liquidity ratios reviewed include the following along with policy guidelines: (1) Data as of 12/31 of each year, respectively; quarterly data for the three months ended each respective quarter (1) Letters of Credit
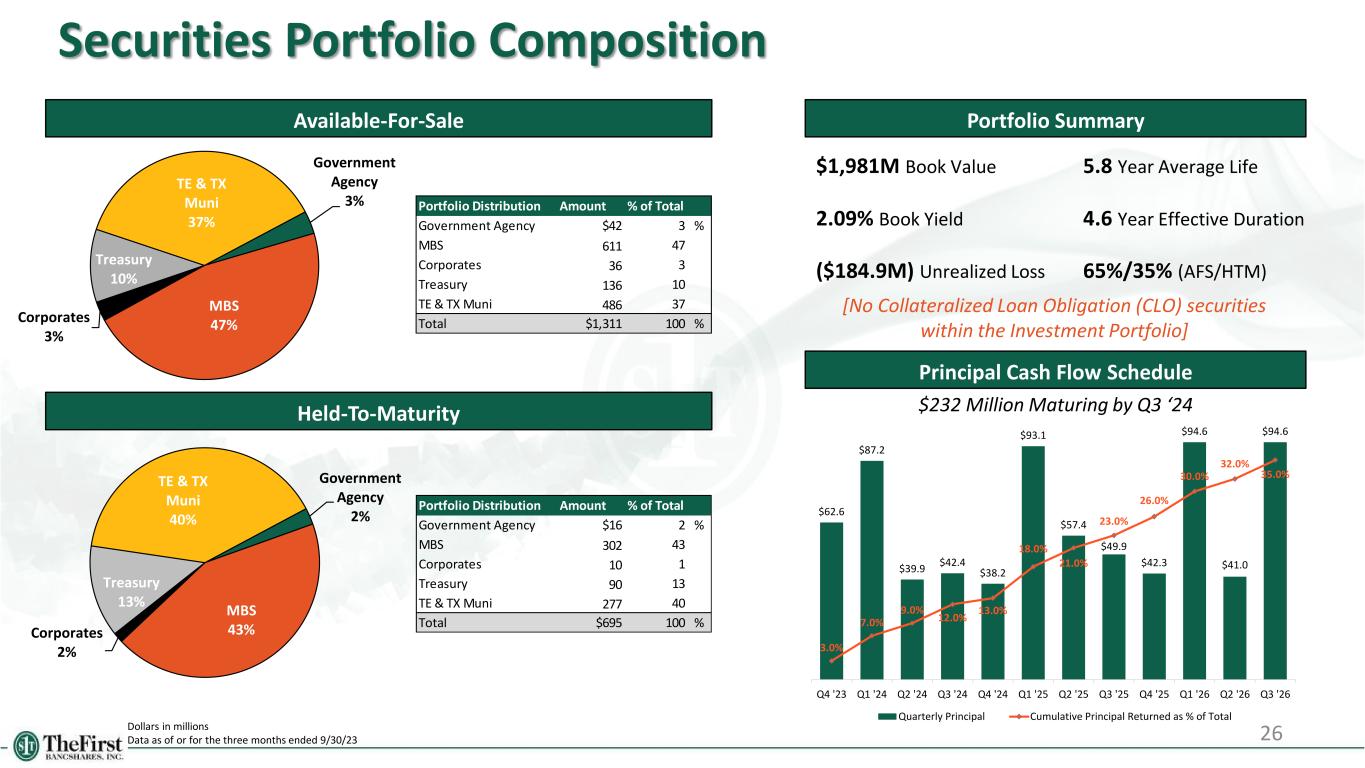
26 Securities Portfolio Composition Dollars in millions Data as of or for the three months ended 9/30/23 Available-For-Sale Portfolio Summary Held-To-Maturity Government Agency 3% MBS 47%Corporates 3% Treasury 10% TE & TX Muni 37% Government Agency 2% MBS 43%Corporates 2% Treasury 13% TE & TX Muni 40% Portfolio Distribution Amount % of Total Government Agency $42 3 % MBS 611 47 Corporates 36 3 Treasury 136 10 TE & TX Muni 486 37 Total $1,311 100 % Portfolio Distribution Amount % of Total Government Agency $16 2 % MBS 302 43 Corporates 10 1 Treasury 90 13 TE & TX Muni 277 40 Total $695 100 % $1,981M Book Value 2.09% Book Yield ($184.9M) Unrealized Loss 5.8 Year Average Life 4.6 Year Effective Duration 65%/35% (AFS/HTM) Principal Cash Flow Schedule $232 Million Maturing by Q3 ‘24 $62.6 $87.2 $39.9 $42.4 $38.2 $93.1 $57.4 $49.9 $42.3 $94.6 $41.0 $94.6 3.0% 7.0% 9.0% 12.0% 13.0% 18.0% 21.0% 23.0% 26.0% 30.0% 32.0% 35.0% Q4 '23 Q1 '24 Q2 '24 Q3 '24 Q4 '24 Q1 '25 Q2 '25 Q3 '25 Q4 '25 Q1 '26 Q2 '26 Q3 '26 Quarterly Principal Cumulative Principal Returned as % of Total [No Collateralized Loan Obligation (CLO) securities within the Investment Portfolio]

27 APPENDIX
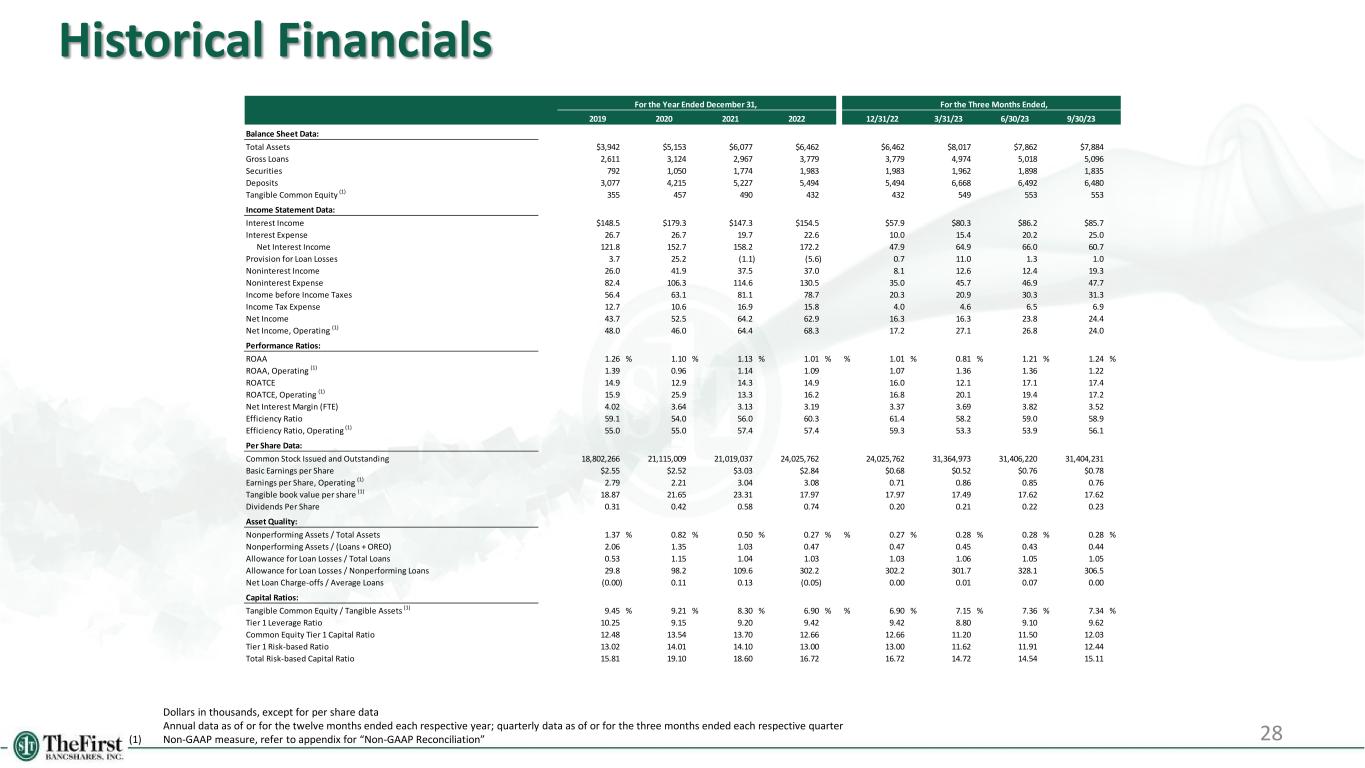
Historical Financials 28 Dollars in thousands, except for per share data Annual data as of or for the twelve months ended each respective year; quarterly data as of or for the three months ended each respective quarter (1) Non-GAAP measure, refer to appendix for “Non-GAAP Reconciliation” For the Year Ended December 31, For the Three Months Ended, 2019 2020 2021 2022 12/31/22 3/31/23 6/30/23 9/30/23` ` Balance Sheet Data: Total Assets $3,942 $5,153 $6,077 $6,462 $6,462 $8,017 $7,862 $7,884 Gross Loans 2,611 3,124 2,967 3,779 3,779 4,974 5,018 5,096 Securities 792 1,050 1,774 1,983 1,983 1,962 1,898 1,835 Deposits 3,077 4,215 5,227 5,494 5,494 6,668 6,492 6,480 Tangible Common Equity (1) 355 457 490 432 432 549 553 553 Income Statement Data: Interest Income $148.5 $179.3 $147.3 $154.5 $57.9 $80.3 $86.2 $85.7 Interest Expense 26.7 26.7 19.7 22.6 10.0 15.4 20.2 25.0 Net Interest Income 121.8 152.7 158.2 172.2 47.9 64.9 66.0 60.7 Provision for Loan Losses 3.7 25.2 (1.1) (5.6) 0.7 11.0 1.3 1.0 Noninterest Income 26.0 41.9 37.5 37.0 8.1 12.6 12.4 19.3 Noninterest Expense 82.4 106.3 114.6 130.5 35.0 45.7 46.9 47.7 Income before Income Taxes 56.4 63.1 81.1 78.7 20.3 20.9 30.3 31.3 Income Tax Expense 12.7 10.6 16.9 15.8 4.0 4.6 6.5 6.9 Net Income 43.7 52.5 64.2 62.9 16.3 16.3 23.8 24.4 Net Income, Operating (1) 48.0 46.0 64.4 68.3 17.2 27.1 26.8 24.0 Performance Ratios: ROAA 1.26 % 1.10 % 1.13 % 1.01 % % 1.01 % 0.81 % 1.21 % 1.24 % ROAA, Operating (1) 1.39 0.96 1.14 1.09 1.07 1.36 1.36 1.22 ROATCE 14.9 12.9 14.3 14.9 16.0 12.1 17.1 17.4 ROATCE, Operating (1) 15.9 25.9 13.3 16.2 16.8 20.1 19.4 17.2 Net Interest Margin (FTE) 4.02 3.64 3.13 3.19 3.37 3.69 3.82 3.52 Efficiency Ratio 59.1 54.0 56.0 60.3 61.4 58.2 59.0 58.9 Efficiency Ratio, Operating (1) 55.0 55.0 57.4 57.4 59.3 53.3 53.9 56.1 Per Share Data: Common Stock Issued and Outstanding 18,802,266 21,115,009 21,019,037 24,025,762 24,025,762 31,364,973 31,406,220 31,404,231 Basic Earnings per Share $2.55 $2.52 $3.03 $2.84 $0.68 $0.52 $0.76 $0.78 Earnings per Share, Operating (1) 2.79 2.21 3.04 3.08 0.71 0.86 0.85 0.76 Tangible book value per share (1) 18.87 21.65 23.31 17.97 17.97 17.49 17.62 17.62 Dividends Per Share 0.31 0.42 0.58 0.74 0.20 0.21 0.22 0.23 Asset Quality: Nonperforming Assets / Total Assets 1.37 % 0.82 % 0.50 % 0.27 % % 0.27 % 0.28 % 0.28 % 0.28 % Nonperforming Assets / (Loans + OREO) 2.06 1.35 1.03 0.47 0.47 0.45 0.43 0.44 Allowance for Loan Losses / Total Loans 0.53 1.15 1.04 1.03 1.03 1.06 1.05 1.05 Allowance for Loan Losses / Nonperforming Loans 29.8 98.2 109.6 302.2 302.2 301.7 328.1 306.5 Net Loan Charge-offs / Average Loans (0.00) 0.11 0.13 (0.05) 0.00 0.01 0.07 0.00 Capital Ratios: Tangible Common Equity / Tangible Assets (1) 9.45 % 9.21 % 8.30 % 6.90 % % 6.90 % 7.15 % 7.36 % 7.34 % Tier 1 Leverage Ratio 10.25 9.15 9.20 9.42 9.42 8.80 9.10 9.62 Common Equity Tier 1 Capital Ratio 12.48 13.54 13.70 12.66 12.66 11.20 11.50 12.03 Tier 1 Risk-based Ratio 13.02 14.01 14.10 13.00 13.00 11.62 11.91 12.44 Total Risk-based Capital Ratio 15.81 19.10 18.60 16.72 16.72 14.72 14.54 15.11
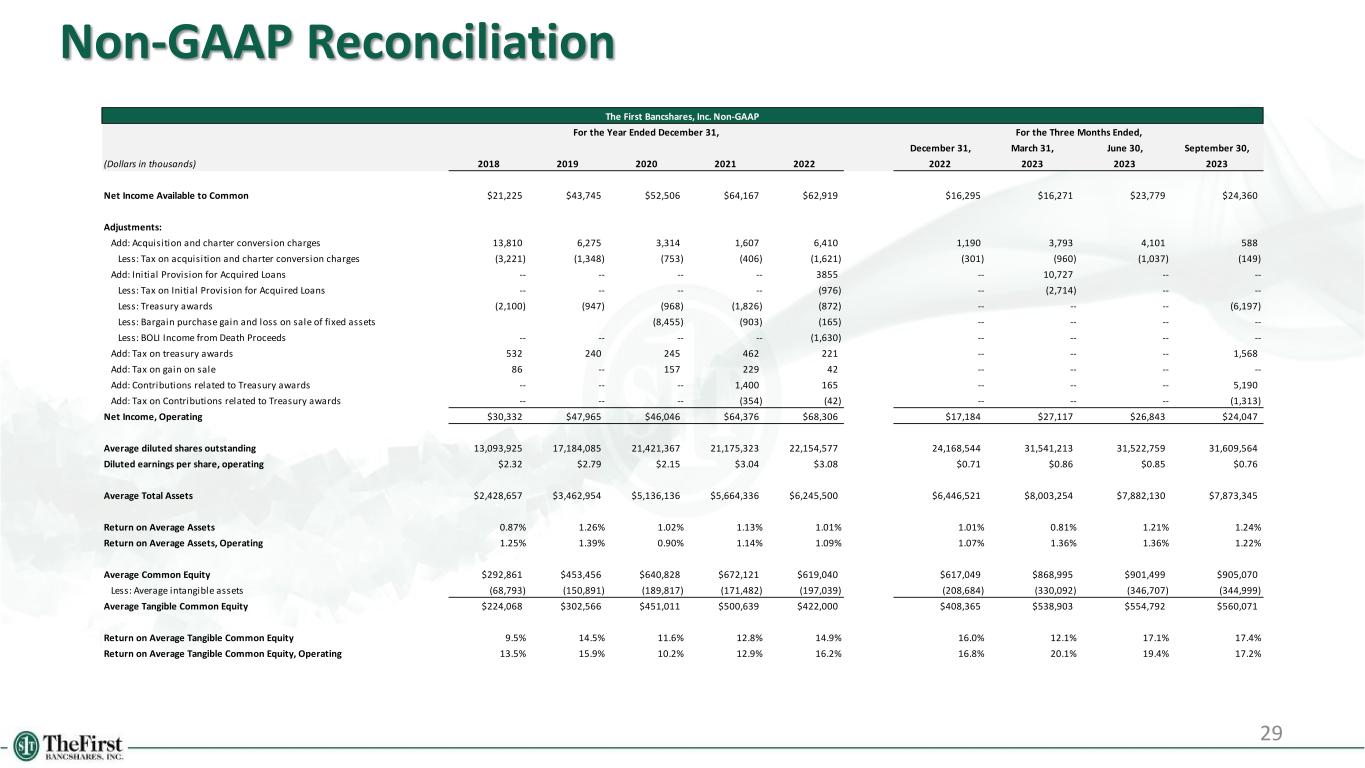
29 Non-GAAP Reconciliation The First Bancshares, Inc. Non-GAAP For the Year Ended December 31, For the Three Months Ended, December 31, March 31, June 30, September 30, (Dollars in thousands) 2018 2019 2020 2021 2022 2022 2023 2023 2023 Net Income Available to Common $21,225 $43,745 $52,506 $64,167 $62,919 $16,295 $16,271 $23,779 $24,360 Adjustments: Add: Acquisition and charter conversion charges 13,810 6,275 3,314 1,607 6,410 1,190 3,793 4,101 588 Less: Tax on acquisition and charter conversion charges (3,221) (1,348) (753) (406) (1,621) (301) (960) (1,037) (149) Add: Initial Provision for Acquired Loans -- -- -- -- 3855 -- 10,727 -- -- Less: Tax on Initial Provision for Acquired Loans -- -- -- -- (976) -- (2,714) -- -- Less: Treasury awards (2,100) (947) (968) (1,826) (872) -- -- -- (6,197) Less: Bargain purchase gain and loss on sale of fixed assets (8,455) (903) (165) -- -- -- -- Less: BOLI Income from Death Proceeds -- -- -- -- (1,630) -- -- -- -- Add: Tax on treasury awards 532 240 245 462 221 -- -- -- 1,568 Add: Tax on gain on sale 86 -- 157 229 42 -- -- -- -- Add: Contributions related to Treasury awards -- -- -- 1,400 165 -- -- -- 5,190 Add: Tax on Contributions related to Treasury awards -- -- -- (354) (42) -- -- -- (1,313) Net Income, Operating $30,332 $47,965 $46,046 $64,376 $68,306 $17,184 $27,117 $26,843 $24,047 Average diluted shares outstanding 13,093,925 17,184,085 21,421,367 21,175,323 22,154,577 24,168,544 31,541,213 31,522,759 31,609,564 Diluted earnings per share, operating $2.32 $2.79 $2.15 $3.04 $3.08 $0.71 $0.86 $0.85 $0.76 Average Total Assets $2,428,657 $3,462,954 $5,136,136 $5,664,336 $6,245,500 $6,446,521 $8,003,254 $7,882,130 $7,873,345 Return on Average Assets 0.87% 1.26% 1.02% 1.13% 1.01% 1.01% 0.81% 1.21% 1.24% Return on Average Assets, Operating 1.25% 1.39% 0.90% 1.14% 1.09% 1.07% 1.36% 1.36% 1.22% Average Common Equity $292,861 $453,456 $640,828 $672,121 $619,040 $617,049 $868,995 $901,499 $905,070 Less: Average intangible assets (68,793) (150,891) (189,817) (171,482) (197,039) (208,684) (330,092) (346,707) (344,999) Average Tangible Common Equity $224,068 $302,566 $451,011 $500,639 $422,000 $408,365 $538,903 $554,792 $560,071 Return on Average Tangible Common Equity 9.5% 14.5% 11.6% 12.8% 14.9% 16.0% 12.1% 17.1% 17.4% Return on Average Tangible Common Equity, Operating 13.5% 15.9% 10.2% 12.9% 16.2% 16.8% 20.1% 19.4% 17.2%

30 Non-GAAP Reconciliation (cont.) The First Bancshares, Inc. Non-GAAP For the Three Months Ended, September 30, December 31, March 31, June 30, September 30, (Dollars in thousands) 2022 2022 2023 2023 2023 Net Interest Income After Provision for Credit Losses $44,848 $47,216 $53,926 $64,780 $59,704 Non Interest Income 9,022 8,131 12,612 12,423 19,324 Non Interest Expense (35,903) (35,040) (45,670) (46,899) (47,724) Adjustments: Add: Acquisition charges 3,641 1,190 3,793 4,101 588 Add: Contributions related to Treasury Awards -- -- -- -- 5,190 Less: Treasury Awards and Gains -- -- -- -- (6,197) Add: Provision for Loan Losses 4,300 705 11,000 1,250 1,000 Pre-tax Pre Provision Income, Operating $25,908 $22,202 $35,661 $35,655 $31,885 Average Total Assets $6,372,872 $6,446,521 $8,003,254 $7,882,130 $7,873,345 Pre-tax Pre Provision Return on Average Assets, Operating 1.63% 1.38% 1.78% 1.81% 1.62%

31 Non-GAAP Reconciliation (cont.) The First Bancshares, Inc. Non-GAAP For the Year Ended December 31, For the Three Months Ended, December 31, March 31, June 30, September 30, (Dollars in thousands) 2018 2019 2020 2021 2022 2022 2023 2023 2023 Operating Expense Total non-interest expense $76,309 $88,569 $106,341 $114,558 $130,488 $35,040 $45,670 $46,899 $47,724 Pre-tax non-operating expenses (13,810) (6,275) (3,314) (3,007) (6,576) (1,190) (3,793) (4,101) (5,777) Adjusted operating expense 62,499 82,294 103,027 111,551 123,912 33,850 41,877 42,798 41,947 Operating Revenue Net interest income, FTE $85,884 $123,014 $155,025 $159,678 $181,539 $48,916 $65,924 $67,028 $61,696 Total non-interest income 20,561 26,947 41,876 37,473 36,974 8,131 12,612 12,423 19,324 Pre-tax non-operating items (2442) (947) (9,423) (2,729) (2,667) -- -- -- (6,197) Adjusted operating revenue 104,003 149,014 187,478 194,422 215,846 $57,047 $78,536 $79,451 $74,823 Efficiency Ratio, Operating 60.1% 55.2% 55.0% 57.4% 57.4% 59.3% 53.3% 53.9% 56.1%
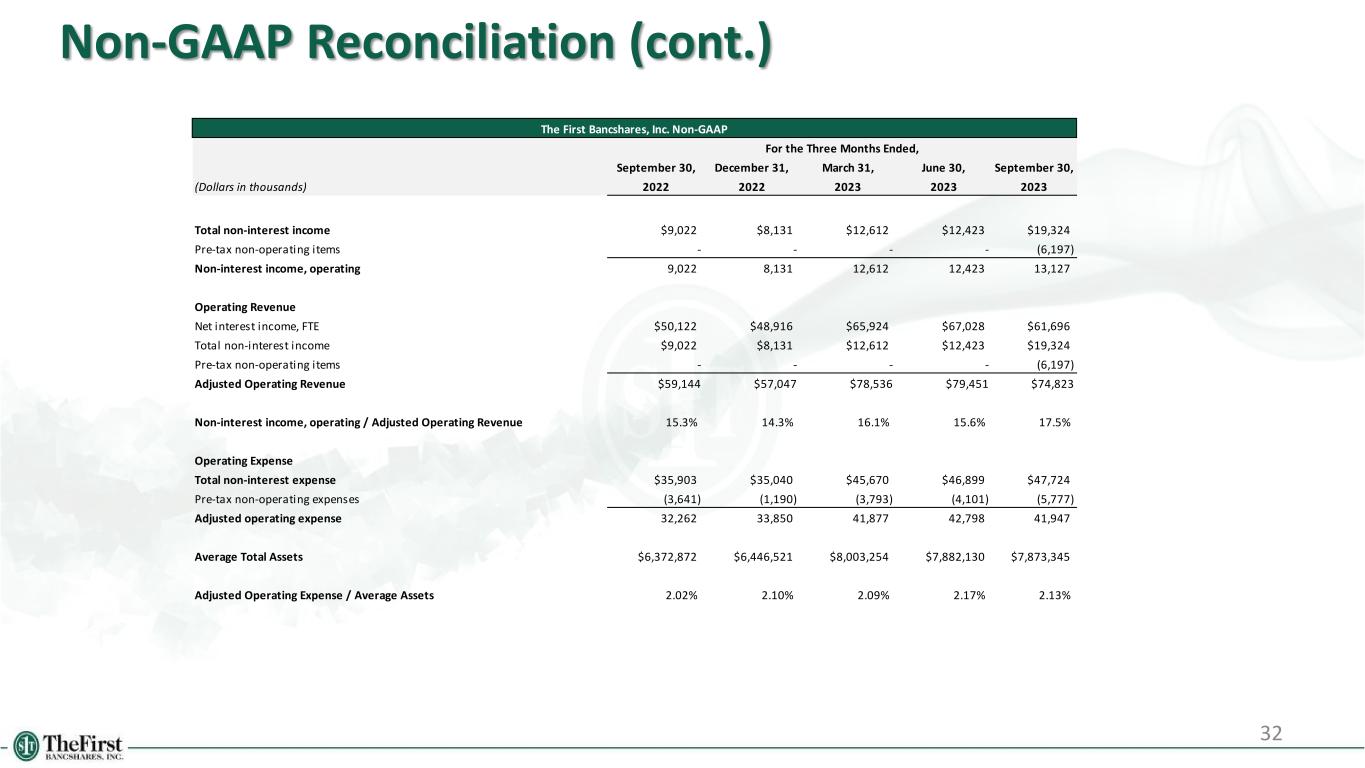
32 Non-GAAP Reconciliation (cont.) The First Bancshares, Inc. Non-GAAP For the Three Months Ended, September 30, December 31, March 31, June 30, September 30, (Dollars in thousands) 2022 2022 2023 2023 2023 Total non-interest income $9,022 $8,131 $12,612 $12,423 $19,324 Pre-tax non-operating items - - - - (6,197) Non-interest income, operating 9,022 8,131 12,612 12,423 13,127 Operating Revenue Net interest income, FTE $50,122 $48,916 $65,924 $67,028 $61,696 Total non-interest income $9,022 $8,131 $12,612 $12,423 $19,324 Pre-tax non-operating items - - - - (6,197) Adjusted Operating Revenue $59,144 $57,047 $78,536 $79,451 $74,823 Non-interest income, operating / Adjusted Operating Revenue 15.3% 14.3% 16.1% 15.6% 17.5% Operating Expense Total non-interest expense $35,903 $35,040 $45,670 $46,899 $47,724 Pre-tax non-operating expenses (3,641) (1,190) (3,793) (4,101) (5,777) Adjusted operating expense 32,262 33,850 41,877 42,798 41,947 Average Total Assets $6,372,872 $6,446,521 $8,003,254 $7,882,130 $7,873,345 Adjusted Operating Expense / Average Assets 2.02% 2.10% 2.09% 2.17% 2.13%

33 Non-GAAP Reconciliation (cont.) The First Bancshares, Inc. Non-GAAP For the Year Ended December 31, For the Three Months Ended, December 31, March 31, June 30, September 30, (Dollars in thousands) 2018 2019 2020 2021 2022 2022 2023 2023 2023 Total common equity $363,254 $543,658 $644,815 $676,172 $646,663 $646,663 $896,427 $899,446 $897,221 Less: Goodwill and other intangibles (112,916) (188,865) (187,700) (186,171) (214,890) (214,890) (347,777) (346,104) (343,869) Tangible common equity $250,338 $354,793 $457,115 $490,001 $431,773 $431,773 $548,650 $553,342 $553,352 Total assets $3,003,986 $3,941,863 $5,152,760 $6,077,414 $6,461,717 $6,461,717 $8,017,316 $7,862,108 $7,884,285 Less: Goodwill and other intangibles (112,916) (188,865) (187,700) (186,171) (214,890) (214,890) (347,777) (346,104) (343,869) Tangible assets $2,891,070 $3,752,998 $4,965,060 $5,891,243 $6,246,827 $6,246,827 $7,669,539 $7,516,004 $7,540,416 Tangible common equity / Tangible assets 8.7% 9.5% 9.2% 8.3% 6.9% 6.9% 7.2% 7.4% 7.3% Common shares outstanding $14,830,598.00 18,802,266 21,115,009 21,019,037 24,025,762 24,025,762 31,364,973 31,406,220 31,404,231 Tangible book value per common share $16.88 $18.87 $21.65 $23.31 $17.97 $17.97 $17.49 $17.62 $17.62 Accumulated Other Comprehensive Income (AOCI) ($1,796) $10,089 $25,816 $7,978 ($148,957) ($148,957) ($130,774) ($145,239) ($165,168) Tangible book value per common share excluding AOCI $17.00 $18.33 $20.43 $22.93 $24.17 $24.17 $21.66 $22.24 $22.88

34 Non-GAAP Reconciliation (cont.) The First Bancshares, Inc. Non-GAAP For the Three Months Ended, September 30, December 31, March 31, June 30, September 30, (Dollars in thousands) 2022 2022 2023 2023 2023 Net Interest Income $49,148 $47,921 $64,926 $66,030 $60,704 Tax-Exempt Investment Income (2,875) (2,939) (2,948) (2,948) (2,929) Taxable Investment Income 3,849 3,934 3,946 3,946 3,921 Net Interest Income, Fully Tax Equivalent 50,122 48,916 65,924 67,028 61,696 Less: Purchase accounting adjustments 818 1,086 3,469 6,533 4,276 Net Interest Income, Net of purchase accounting adjustments 49,304 47,830 62,455 60,495 57,420 Total Average Earning Assets $5,727,211 $5,799,075 $7,150,667 $7,019,740 $7,001,048 Add: Average balance of loan valuation discount 2,681 10,928 42,945 38,306 31,269 Average Earning Assets, Excluding loan valuation discount 5,729,892 5,810,003 7,193,612 7,058,046 7,032,317 Net Interest Margin (Annualized) 3.43% 3.31% 3.63% 3.76% 3.47% Net Interest Margin, Fully Tax Equivalent (Annualized) 3.50% 3.37% 3.69% 3.82% 3.52% Core Net Interest Margin, Fully Tax Equivalent (Annualized) 3.44% 3.29% 3.47% 3.43% 3.27%


