Exhibit 99.1
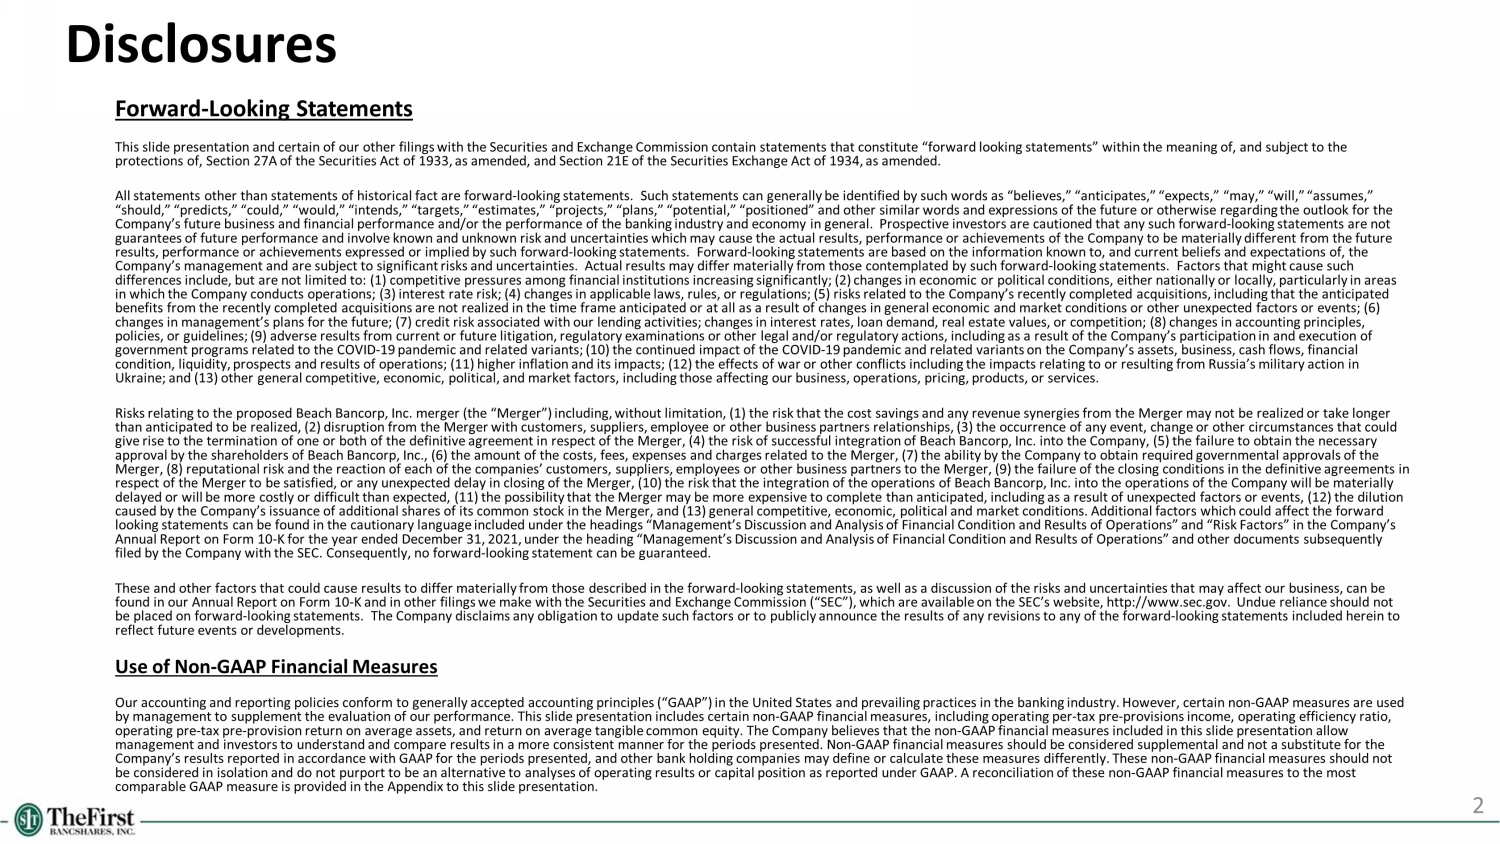
2 Disclosures Forward - Looking Statements This slide presentation and certain of our other filings with the Securities and Exchange Commission contain statements that con stitute “forward looking statements” within the meaning of, and subject to the protections of, Section 27A of the Securities Act of 1933, as amended, and Section 21E of the Securities Exchange Act of 1934 , a s amended. All statements other than statements of historical fact are forward - looking statements. Such statements can generally be identi fied by such words as “believes,” “anticipates,” “expects,” “may,” “will,” “assumes,” “should,” “predicts,” “could,” “would,” “intends,” “targets,” “estimates,” “projects,” “plans,” “potential,” “positioned” and ot her similar words and expressions of the future or otherwise regarding the outlook for the Company’s future business and financial performance and/or the performance of the banking industry and economy in general. P ros pective investors are cautioned that any such forward - looking statements are not guarantees of future performance and involve known and unknown risk and uncertainties which may cause the actual results, per for mance or achievements of the Company to be materially different from the future results, performance or achievements expressed or implied by such forward - looking statements. Forward - looking statements are ba sed on the information known to, and current beliefs and expectations of, the Company’s management and are subject to significant risks and uncertainties. Actual results may differ materially from those co ntemplated by such forward - looking statements. Factors that might cause such differences include, but are not limited to: (1) competitive pressures among financial institutions increasing significantly; (2 ) changes in economic or political conditions, either nationally or locally, particularly in areas in which the Company conducts operations; (3) interest rate risk; (4) changes in applicable laws, rules, or regulations; (5) ris ks related to the Company’s recently completed acquisitions, including that the anticipated benefits from the recently completed acquisitions are not realized in the time frame anticipated or at all as a result of cha nge s in general economic and market conditions or other unexpected factors or events; (6) changes in management’s plans for the future; (7) credit risk associated with our lending activities; changes in interest rat es, loan demand, real estate values, or competition; (8) changes in accounting principles, policies, or guidelines; (9) adverse results from current or future litigation, regulatory examinations or other legal and/or re gulatory actions, including as a result of the Company’s participation in and execution of government programs related to the COVID - 19 pandemic and related variants; (10) the continued impact of the COVID - 19 pandemic an d related variants on the Company’s assets, business, cash flows, financial condition, liquidity, prospects and results of operations; (11) higher inflation and its impacts; (12) the effects of war or oth er conflicts including the impacts relating to or resulting from Russia’s military action in Ukraine; and (13) other general competitive, economic, political, and market factors, including those affecting our business, op erations, pricing, products, or services. Risks relating to the proposed Beach Bancorp, Inc. merger (the “Merger”) including, without limitation, (1) the risk that the co st savings and any revenue synergies from the Merger may not be realized or take longer than anticipated to be realized, (2) disruption from the Merger with customers, suppliers, employee or other business partner s r elationships, (3) the occurrence of any event, change or other circumstances that could give rise to the termination of one or both of the definitive agreement in respect of the Merger, (4) the risk of successful int egration of Beach Bancorp, Inc. into the Company, (5) the failure to obtain the necessary approval by the shareholders of Beach Bancorp, Inc., (6) the amount of the costs, fees, expenses and charges related to the M erg er, (7) the ability by the Company to obtain required governmental approvals of the Merger, (8) reputational risk and the reaction of each of the companies’ customers, suppliers, employees or other business pa rtn ers to the Merger, (9) the failure of the closing conditions in the definitive agreements in respect of the Merger to be satisfied, or any unexpected delay in closing of the Merger, (10) the risk that the integration o f t he operations of Beach Bancorp, Inc. into the operations of the Company will be materially delayed or will be more costly or difficult than expected, (11) the possibility that the Merger may be more expensive to comp let e than anticipated, including as a result of unexpected factors or events, (12) the dilution caused by the Company’s issuance of additional shares of its common stock in the Merger, and (13) general competitive, econom ic, political and market conditions. Additional factors which could affect the forward looking statements can be found in the cautionary language included under the headings “Management’s Discussion and Analysis of Financial Condition and Results of Operations” and “Risk Factors” in the Company’s Annual Report on Form 10 - K for the year ended December 31, 2021, under the heading “Management’s Discussion and Analysis of Fina ncial Condition and Results of Operations” and other documents subsequently filed by the Company with the SEC. Consequently, no forward - looking statement can be guaranteed. These and other factors that could cause results to differ materially from those described in the forward - looking statements, as well as a discussion of the risks and uncertainties that may affect our business, can be found in our Annual Report on Form 10 - K and in other filings we make with the Securities and Exchange Commission (“SEC”), which are available on the SEC’s website, http://www.sec.gov. Undue reliance should not be placed on forward - looking statements. The Company disclaims any obligation to update such factors or to publicly announce th e results of any revisions to any of the forward - looking statements included herein to reflect future events or developments. Use of Non - GAAP Financial Measures Our accounting and reporting policies conform to generally accepted accounting principles (“GAAP”) in the United States and p rev ailing practices in the banking industry. However, certain non - GAAP measures are used by management to supplement the evaluation of our performance. This slide presentation includes certain non - GAAP financial measu res, including operating per - tax pre - provisions income, operating efficiency ratio, operating pre - tax pre - provision return on average assets, and return on average tangible common equity. The Company believes tha t the non - GAAP financial measures included in this slide presentation allow management and investors to understand and compare results in a more consistent manner for the periods presented. Non - GAAP finan cial measures should be considered supplemental and not a substitute for the Company’s results reported in accordance with GAAP for the periods presented, and other bank holding companies may define or cal culate these measures differently. These non - GAAP financial measures should not be considered in isolation and do not purport to be an alternative to analyses of operating results or capital position as re por ted under GAAP. A reconciliation of these non - GAAP financial measures to the most comparable GAAP measure is provided in the Appendix to this slide presentation.

3 THE FIRST BANCSHARES: BUILDING SHAREHOLDER VALUE

58.4% Efficiency Ratio, Operating (3) 18.2% Total Capital Ratio 5 th Largest Bank Headquartered in MS $6.8bn (2) Assets 13 # of Closed Transactions since 2010 (1) 4 Our Company We have the track record, scale, liquidity, capital & profitability of a top - performing community bank Company Overview 54.6% Loans / Deposits 1996 Bank Established in Hattiesburg, MS Source: S&P Global Market Intelligence, Company documents (1) Includes 10 whole bank acquisitions, 2 branch acquisitions and 1 mortgage company acquisition (2) Pro forma for recent acquisition of Beach Bancorp (3) Non - GAAP Measure -- refer to appendix for “Non - GAAP Reconciliation” 1.24% PTPP ROAA, Operating (3) F L O R I D A M I S S I S S I P P I L O U I S I A N A A L A B A M A G E O R G I A FBMS Location ( 97 ) (2) STARKVILLE

$503 $500 $540 $571 $647 $698 $830 $986 $1,080 $1,166 $1,889 $2,413 $2,532 $181 $181 $370 $447 $447 $447 $827 $1,924 $2,307 $3,264 $3,664 $4,284 $681 $721 $941 $1,094 $1,145 $1,277 $1,813 $3,004 $3,473 $5,153 $6,077 $6,816 2010 2011 2012 2013 2014 2015 2016 2017 2018 2019 2020 2021 Q1 '22 Acquired Organic Atlanta Tampa Mobile Montgomery New Orleans Baton Rouge Jackson Shreveport Tallahassee Houston Jacksonville Birmingham Columbus Orlando COLUMBIA New Orleans Mobile Baton Rouge Jackson Tallahassee Montgomery Shreveport Columbus Evolution of Our Franchise December 31, 2009 March 31, 2022 (1) Total Assets ($mm) – Organic and Acquisitive Growth (1) FBMS Branch (9) Hattiesburg Source: S&P Global Market Intelligence Data as of 12/31 of each year, respectively; Q1 ’22 data as of 3/31/22 (1) Pro forma for recent acquisition of Beach Bancorp 5 FBMS Branch ( 95 ) FBMS LPO (2)

Mississippi 29% Alabama 10% Florida 30% Louisiana 16% Georgia 15% Improving Geographic Diversification of our Balance Sheet 6 2015 Deposits by State March 31, 2022 Deposits by State Source: S&P Global Market Intelligence, Company documents 3/31/22 data pro forma for the recent acquisition of Beach Bancorp 2009 and 2015 data as of 6/30 2015 Loans by State March 31, 2022 Loans by State 2009 Loans by State 2009 Deposits by State Mississippi 100% Mississippi 100% Mississippi 70% Alabama 23% Louisiana 7% Mississippi 73% Alabama 23% Louisiana 4% Mississippi 33% Alabama 15% Florida 28% Louisiana 14% Georgia 10%

Expansion into Mississippi’s Golden Triangle A CQUISITION H IGHLIGHTS 7 Note: Deposit data as of June 30, 2021 Source: S&P Global Market Intelligence and Company Documents AL FL GA LA MS Albany Hattiesburg Valdosta Panama City Beach Moultrie Tallahassee Destin Pensacola New Orleans Baton Rouge Shreveport Jackson Huntsville Birmingham Montgomery Mobile Atlanta Columbus Jacksonville Starkville P RO F ORMA F OOTPRINT Columbus West Point Aberdeen Starkville Oktibbeha Lowndes Clay Monroe FBMS Branch (82) Acquired Branches (7) FBMS LPO (2) ▪ Branches: 7 ▪ Total Deposits: ~$451 Million ▪ Number of Deposit Accounts: ~ 17,500 ▪ Average Cost of Deposits: 0.22% ▪ Average Non - Time Deposit Account Tenure: 15 Year s ▪ Gross Loans: ~$42 Million ▪ Average Loan Yield: 3.82% ▪ Current Branch Personnel: 26
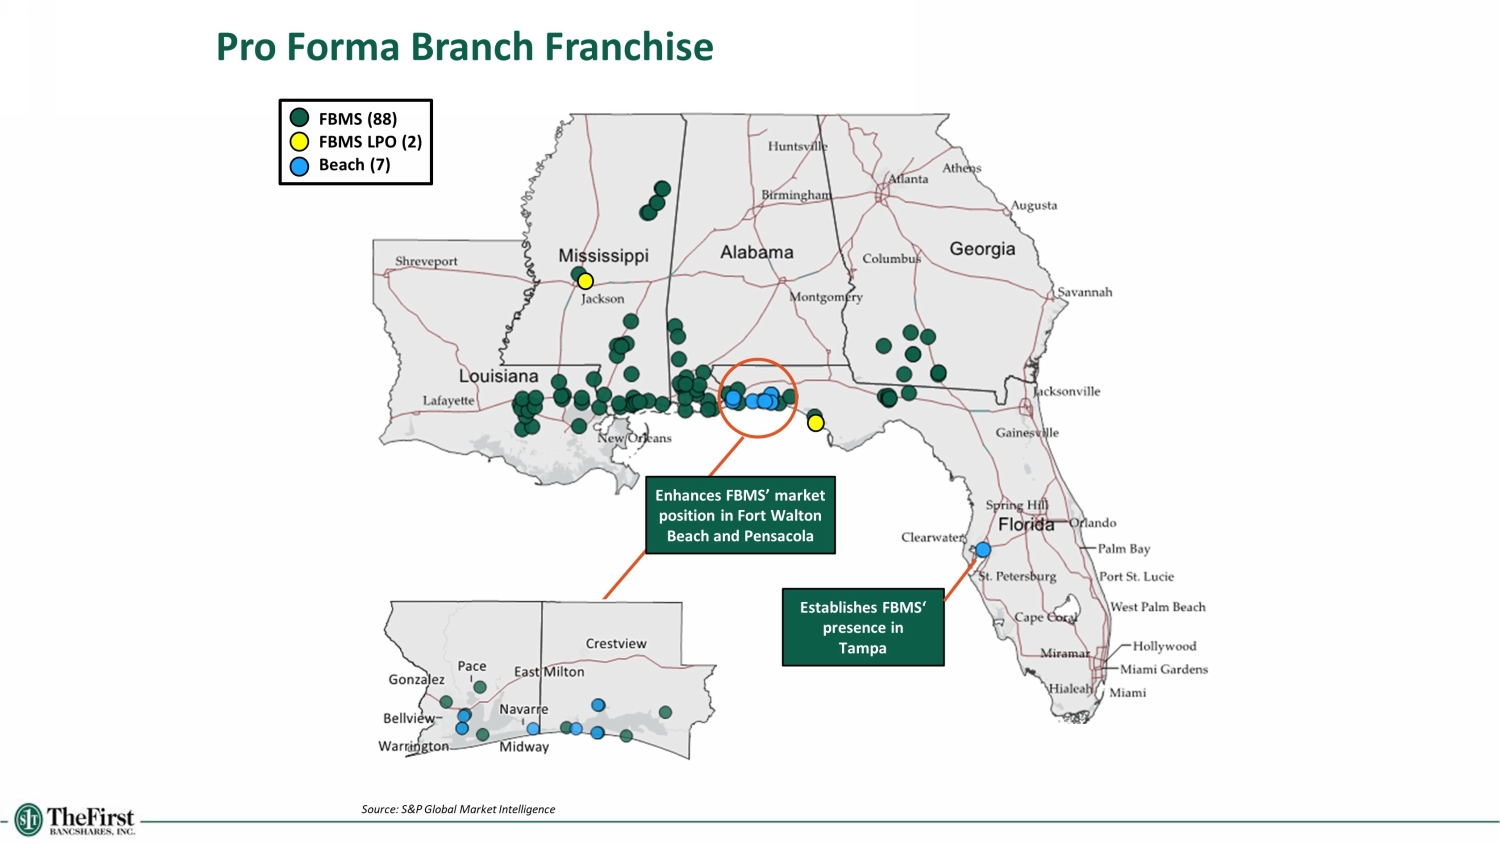
Pro Forma Branch Franchise FBMS (88) FBMS LPO (2) Beach (7) Source: S&P Global Market Intelligence Establishes FBMS‘ presence in Tampa Enhances FBMS’ market position in Fort Walton Beach and Pensacola
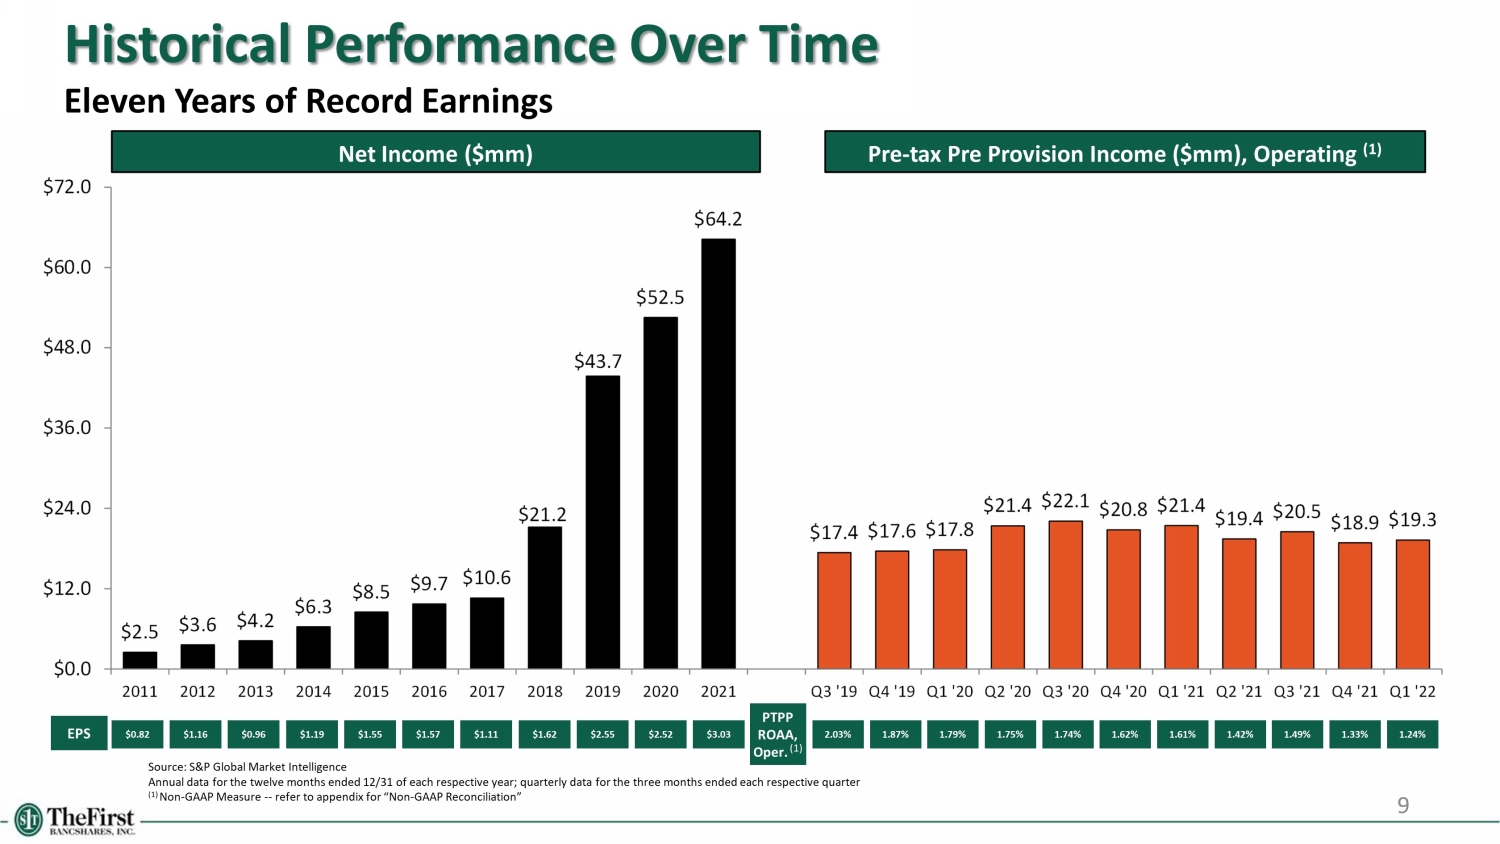
$2.5 $3.6 $4.2 $6.3 $8.5 $9.7 $10.6 $21.2 $43.7 $52.5 $64.2 $17.4 $17.6 $17.8 $21.4 $22.1 $20.8 $21.4 $19.4 $20.5 $18.9 $19.3 $0.0 $12.0 $24.0 $36.0 $48.0 $60.0 $72.0 2011 2012 2013 2014 2015 2016 2017 2018 2019 2020 2021 Q3 '19 Q4 '19 Q1 '20 Q2 '20 Q3 '20 Q4 '20 Q1 '21 Q2 '21 Q3 '21 Q4 '21 Q1 '22 EPS Net Income ($mm) 9 Pre - tax Pre Provision Income ($mm), Operating (1) PTPP ROAA, Oper . (1) Source: S&P Global Market Intelligence Annual d ata for the twelve months ended 12/31 of each respective year; quarterly data for the three months ended each respective quarter (1) Non - GAAP Measure -- refer to appendix for “Non - GAAP Reconciliation” Historical Performance Over Time Eleven Years of Record Earnings $0.82 $1.16 $0.96 $1.19 $1.55 $1.57 $1.11 $1.62 $2.55 $2.52 1.62% 1.74% 1.75% 1.79% 1.87% 2.03% 1.61% 1.42% 1.49% $3.03 1.33% 1.24%
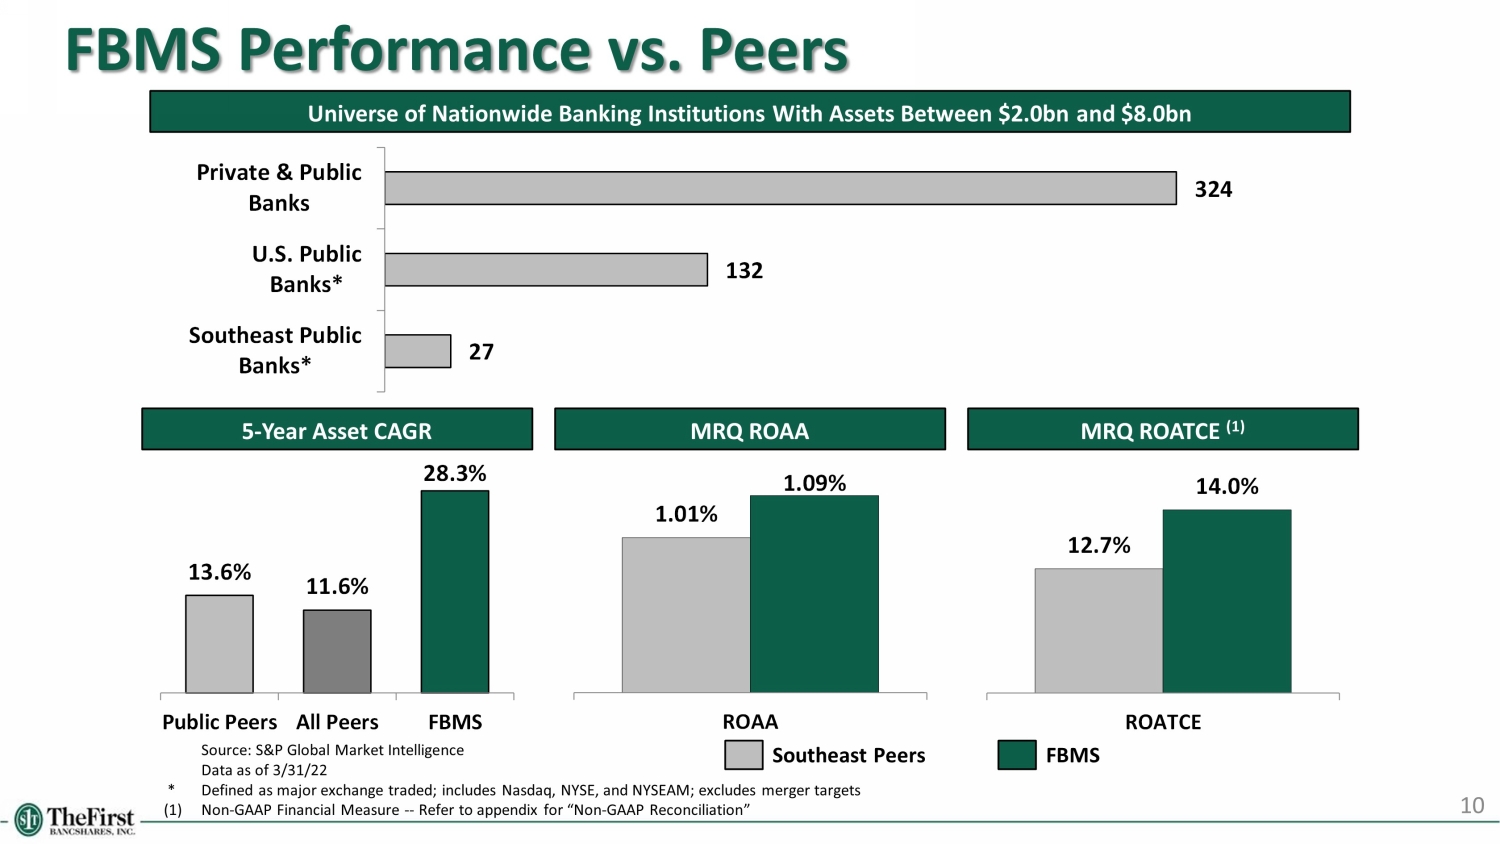
1.01% 1.09% ROAA FBMS Performance vs. Peers 10 27 132 324 Southeast Public Banks* U.S. Public Banks* Private & Public Banks Universe of Nationwide Banking Institutions With Assets Between $2.0bn and $8.0bn 13.6% 11.6% 28.3% Public Peers All Peers FBMS 5 - Year Asset CAGR MRQ ROAA Source: S&P Global Market Intelligence Data as of 3/31/22 * Defined as major exchange traded; includes Nasdaq, NYSE, and NYSEAM; excludes merger targets (1) Non - GAAP Financial Measure -- Refer to appendix for “Non - GAAP Reconciliation” Southeast Peers FBMS 12.7% 14.0% ROATCE MRQ ROATCE (1)
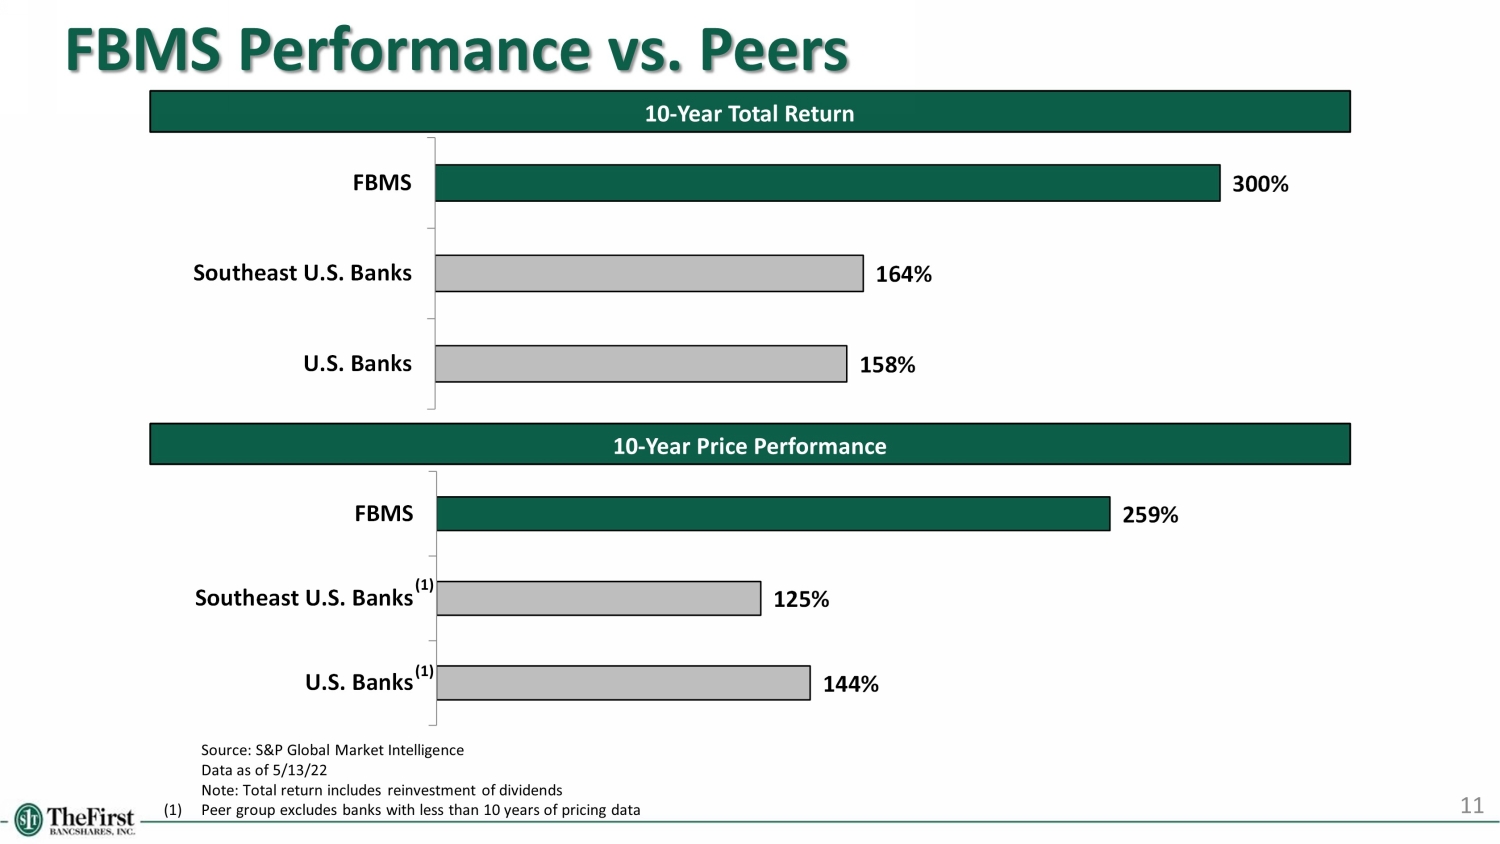
144% 125% 259% U.S. Banks Southeast U.S. Banks FBMS FBMS Performance vs. Peers 11 Source: S&P Global Market Intelligence Data as of 5/13/22 Note: Total return includes reinvestment of dividends (1) Peer group excludes banks with less than 10 years of pricing data 10 - Year Price Performance 10 - Year Total Return (1) 158% 164% 300% U.S. Banks Southeast U.S. Banks FBMS (1)
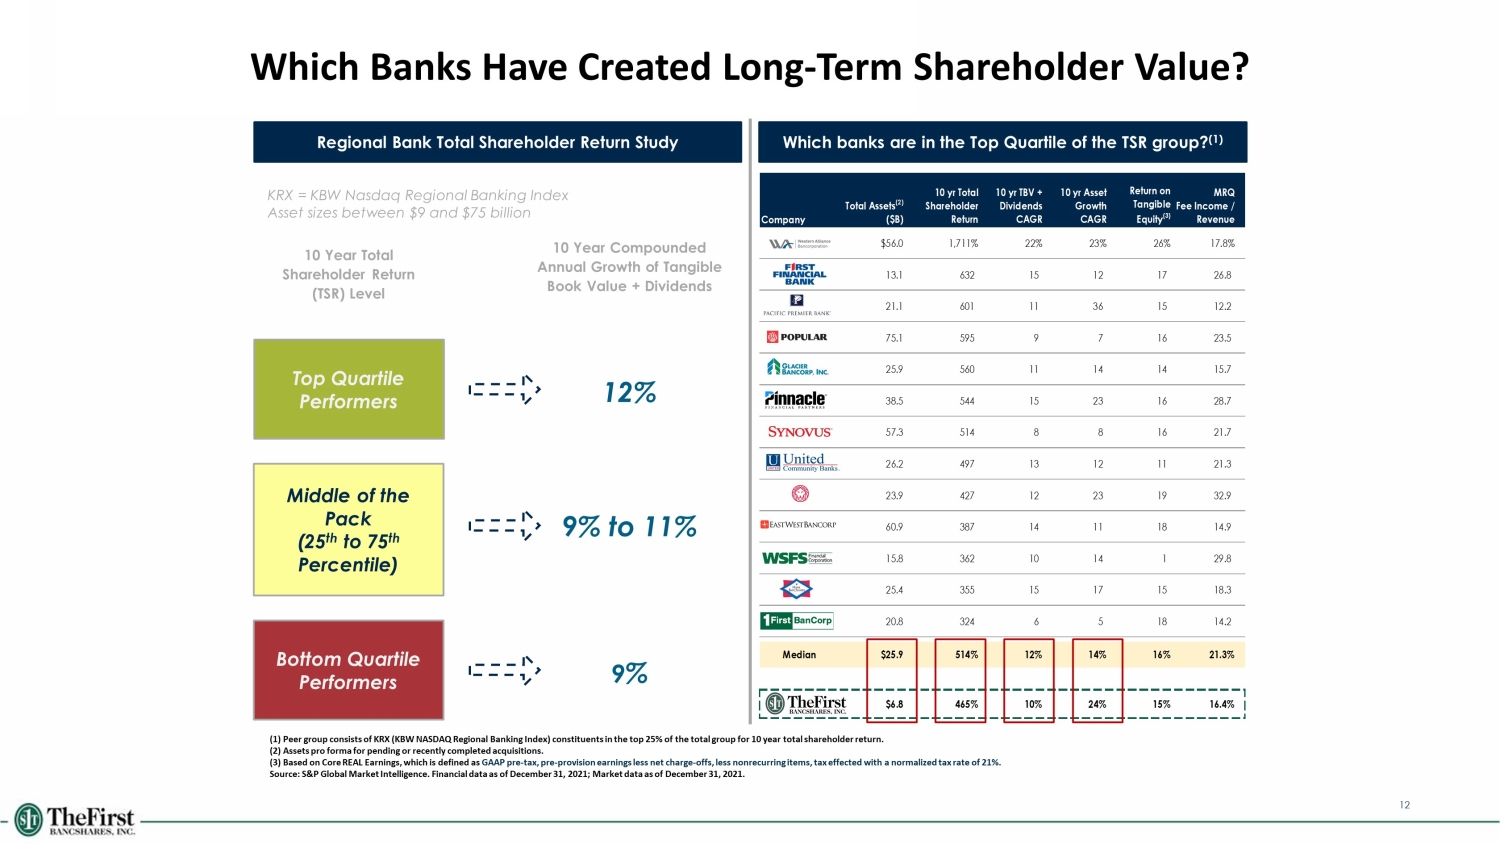
Company Total Assets (2) ($B) 10 yr Total Shareholder Return 10 yr TBV + Dividends CAGR 10 yr Asset Growth CAGR Return on Tangible Equity (3) MRQ Fee Income / Revenue $56.0 1,711% 22% 23% 26% 17.8% 13.1 632 15 12 17 26.8 21.1 601 11 36 15 12.2 75.1 595 9 7 16 23.5 25.9 560 11 14 14 15.7 38.5 544 15 23 16 28.7 57.3 514 8 8 16 21.7 26.2 497 13 12 11 21.3 23.9 427 12 23 19 32.9 60.9 387 14 11 18 14.9 15.8 362 10 14 1 29.8 25.4 355 15 17 15 18.3 20.8 324 6 5 18 14.2 Median $25.9 514% 12% 14% 16% 21.3% FBMS $6.8 465% 10% 24% 15% 16.4% Which Banks Have Created Long - Term Shareholder Value? (1) Peer group consists of KRX (KBW NASDAQ Regional Banking Index) constituents in the top 25% of the total group for 10 year to tal shareholder return. (2) Assets pro forma for pending or recently completed acquisitions. (3) Based on Core REAL Earnings, which is defined as GAAP pre - tax, pre - provision earnings less net charge - offs, less nonrecurring items, tax effected with a normalized tax rate of 2 1%. Source: S&P Global Market Intelligence. Financial data as of December 31, 2021; Market data as of December 31, 2021. Regional Bank Total Shareholder Return Study KRX = KBW Nasdaq Regional Banking Index Asset sizes between $9 and $75 billion 10 Year Total Shareholder Return (TSR) Level Top Quartile Performers 10 Year Compounded Annual Growth of Tangible Book Value + Dividends Bottom Quartile Performers 12% 9 % Middle of the Pack (25 th to 75 th Percentile) 9% to 11% Which banks are in the Top Quartile of the TSR group? (1) 12

13 NASDAQ: FBMS

Appendix
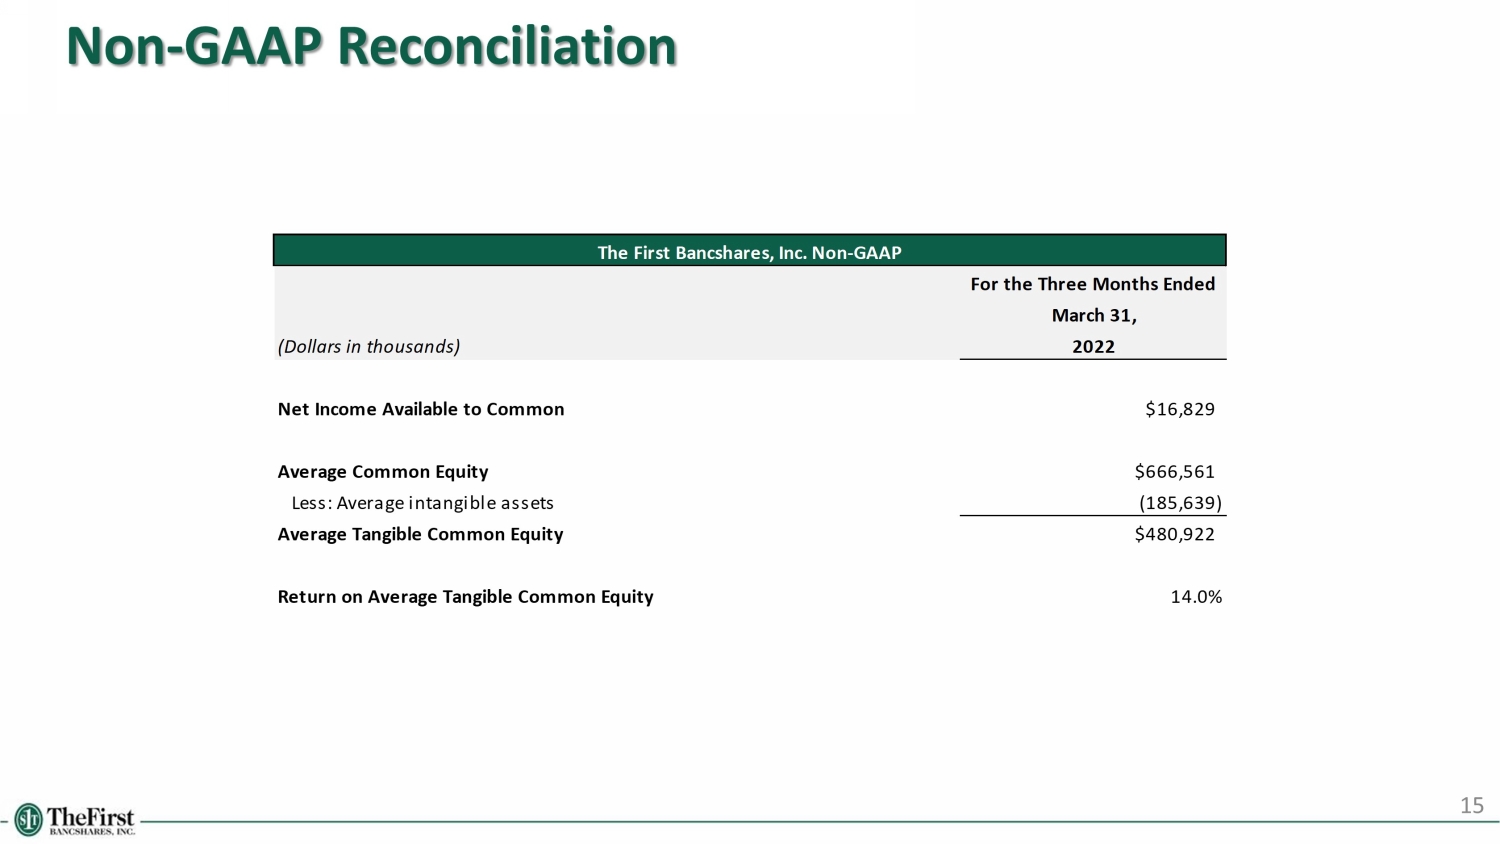
Non - GAAP Reconciliation 15 The First Bancshares, Inc. Non-GAAP For the Three Months Ended March 31, (Dollars in thousands) 2022 Net Income Available to Common $16,829 Average Common Equity $666,561 Less: Average intangible assets (185,639) Average Tangible Common Equity $480,922 Return on Average Tangible Common Equity 14.0%
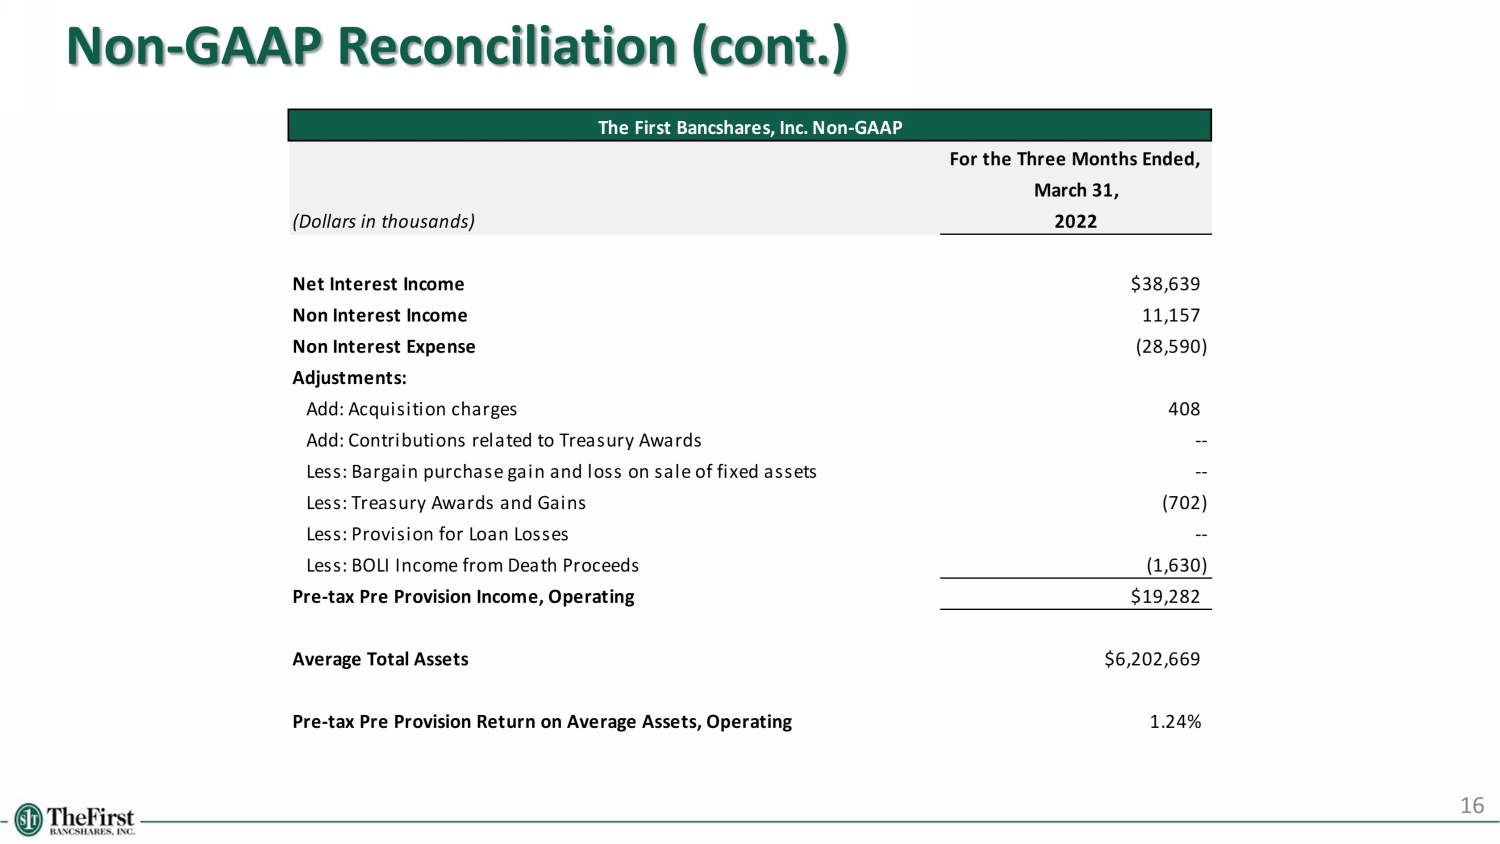
Non - GAAP Reconciliation (cont.) 16 The First Bancshares, Inc. Non-GAAP For the Three Months Ended, March 31, (Dollars in thousands) 2022 Net Interest Income $38,639 Non Interest Income 11,157 Non Interest Expense (28,590) Adjustments: Add: Acquisition charges 408 Add: Contributions related to Treasury Awards -- Less: Bargain purchase gain and loss on sale of fixed assets -- Less: Treasury Awards and Gains (702) Less: Provision for Loan Losses -- Less: BOLI Income from Death Proceeds (1,630) Pre-tax Pre Provision Income, Operating $19,282 Average Total Assets $6,202,669 Pre-tax Pre Provision Return on Average Assets, Operating 1.24%

The First Bancshares, Inc. Non-GAAP Three Months Ended, March 31, (Dollars in thousands) 2022 Operating Expense Total non-interest expense $28,590 Pre-tax non-operating expenses (408) Adjusted operating expense 28,182 Operating Revenue Net interest income, FTE $39,459 Total non-interest income 11,157 Pre-tax non-operating items (2,331) Adjusted operating revenue $48,285 Efficiency Ratio, Operating 58.4% Non - GAAP Reconciliation (cont.) 17