| Exhibit 99.2 |
May 2022 NASDAQ: FBMS
2 Safe Harbor ABOUT THE FIRST BANCSHARES, INC.The First Bancshares, Inc. (“FBMS” or the “Company”), headquartered in Hattiesburg, Mississippi, is the parent company of The First Bank. Founded in 1996, The First has operations in Mississippi, Louisiana, Alabama, Florida and Georgia. The Company’s stock is traded on NASDAQ Global Market under the symbol FBMS. Contact: Chandra Kidd, Corporate Secretary. ADDITIONAL INFORMATION ABOUT THE MERGER & WHERE TO FIND ITIn connection with the proposed merger of FBMS and Beach, FBMS will file with the Securities and Exchange Commission (the “SEC”) a registration statement on Form S-4 that will include a proxy statement of Beach and a prospectus of FBMS, as well as other relevant documents concerning the proposed transaction. This communication does not constitute an offer to sell or the solicitation of an offer to buy any securities or a solicitation of any vote or approval. WE URGE INVESTORS AND SECURITY HOLDERS TO READ THE REGISTRATION STATEMENT ON FORM S-4, THE PROXY STATEMENT/PROSPECTUS INCLUDED WITHIN THE REGISTRATION STATEMENT ON FORM S-4 AND ANY OTHER RELEVANT DOCUMENTS WHEN FILED WITH THE SEC IN CONNECTION WITH THE PROPOSED MERGER BECAUSE THEY WILL CONTAIN IMPORTANT INFORMATION ABOUT FBMS, BEACH AND THE PROPOSED MERGER. The proxy statement/prospectus will be sent to the shareholders of Beach seeking the required shareholder approvals. Investors and security holders will be able to obtain free copies of the registration statement and the proxy statement/prospectus (when available) and other documents filed with the SEC by FBMS through the website maintained by the SEC at http://www.sec.gov. Copies of the documents filed PARTICIPANTS IN THE TRANSACTIONFBMS, Beach Bancorp, Inc. (“Beach”) and certain of their respective directors and executive officers may be deemed to be participants in the solicitation of proxies from the shareholders of Beach in connection with the proposed merger of FBMS and Beach. Information about the directors and executive officers of FBMS may be found in the definitive proxy statement of FBMS filed with the SEC on April 6, 2022. Additional information regarding the interests of these participants and the directors and executive officers of Beach will also be included in the proxy statement/prospectus regarding the proposed transaction when it become available. The definitive proxy statement can be obtained free of charge from the sources described above. This communication does not constitute an offer to sell or the solicitation of an offer to buy any securities or a solicitation of any vote or approval.
3 Forward Looking Statements This slide presentation and certain of our other filings with the Securities and Exchange Commission contain statements that constitute “forward looking statements” within the meaning of, and subject to the protections of, Section 27A of the Securities Act of 1933, as amended, and Section 21E of the Securities Exchange Act of 1934, as amended. All statements other than statements of historical fact are forward-looking statements. Such statements can generally be identified by such words as “believes,” “anticipates,” “expects,” “may,” “will,” “assumes,” “should,” “predicts,” “could,” “would,” “intends,” “targets,” “estimates,” “projects,” “plans,” “potential,” “positioned” and other similar words and expressions of the future or otherwise regarding the outlook for the Company’s future business and financial performance and/or the performance of the banking industry and economy in general. Prospective investors are cautioned that any such forward-looking statements are not guarantees of future performance and involve known and unknown risk and uncertainties which may cause the actual results, performance or achievements of the Company to be materially different from the future results, performance or achievements expressed or implied by such forward-looking statements. Forward-looking statements are based on the information known to, and current beliefs and expectations of, the Company’s management and are subject to significant risks and uncertainties. Actual results may differ materially from those contemplated by such forward-looking statements. Factors that might cause such differences include, but are not limited to: (1) competitive pressures among financial institutions increasing significantly; (2) changes in economic or political conditions, either nationally or locally, particularly in areas in which the Company conducts operations; (3) interest rate risk; (4) changes in applicable laws, rules, or regulations; (5) risks related to the Company’s recently completed acquisitions, including that the anticipated benefits from the recently completed acquisitions are not realized in the time frame anticipated or at all as a result of changes in general economic and market conditions or other unexpected factors or events; (6) changes in management’s plans for the future; (7) credit risk associated with our lending activities; changes in interest rates, loan demand, real estate values, or competition; (8) changes in accounting principles, policies, or guidelines; (9) adverse results from current or future litigation, regulatory examinations or other legal and/or regulatory actions, including as a result of the Company’s participation in and execution of government programs related to the COVID-19 pandemic and related variants; (10) the continued impact of the COVID-19 pandemic and related variants on the Company’s assets, business, cash flows, financial condition, liquidity, prospects and results of operations; (11) higher inflation and its impacts; (12) the effects of war or other conflicts including the impacts relating to or resulting from Russia’s military action in Ukraine; and (13) other general competitive, economic, political, and market factors, including those affecting our business, operations, pricing, products, or services. Statements about the potential effects of the COVID-19 pandemic and related variants on the Company’s assets, business, liquidity, financial condition, prospects, and results of operations may constitute forward-looking statements and are subject to the risks that the actual effects may differ, possibly materially, from what is reflected in these forward-looking statements due to factors and future developments that are uncertain, unpredictable and in many cases beyond our control, including the depth, dispersion and duration of the pandemic, actions taken by governmental authorities in response to the pandemic, and the direct and indirect impact of the pandemic on customers, employees, third parties and the Company.Risks relating to the proposed Beach Bancorp, Inc. merger (the “Merger”) including, without limitation, (1) the risk that the cost savings and any revenue synergies from the Merger may not be realized or take longer than anticipated to be realized, (2) disruption from the Merger with customers, suppliers, employee or other business partners relationships, (3) the occurrence of any event, change or other circumstances that could give rise to the termination of one or both of the definitive agreement in respect of the Merger, (4) the risk of successful integration of Beach Bancorp, Inc. into the Company, (5) the failure to obtain the necessary approval by the shareholders of Beach Bancorp, Inc., (6) the amount of the costs, fees, expenses and charges related to the Merger, (7) the ability by the Company to obtain required governmental approvals of the Merger, (8) reputational risk and the reaction of each of the companies’ customers, suppliers, employees or other business partners to the Merger, (9) the failure of the closing conditions in the definitive agreements in respect of the Merger to be satisfied, or any unexpected delay in closing of the Merger, (10) the risk that the integration of the operations of Beach Bancorp, Inc. into the operations of the Company will be materially delayed or will be more costly or difficult than expected, (11) the possibility that the Merger may be more expensive to complete than anticipated, including as a result of unexpected factors or events, (12) the dilution caused by the Company’s issuance of additional shares of its common stock in the Merger, and (13) general competitive, economic, political and market conditions. Additional factors which could affect the forward looking statements can be found in the cautionary language included under the headings “Management’s Discussion and Analysis of Financial Condition and Results of Operations” and “Risk Factors” in the Company’s Annual Report on Form 10-K for the year ended December 31, 2021, under the heading “Management’s Discussion and Analysis of Financial Condition and Results of Operations” and other documents subsequently filed by the Company with the SEC. Consequently, no forward-looking statement can be guaranteed.These and other factors that could cause results to differ materially from those described in the forward-looking statements, as well as a discussion of the risks and uncertainties that may affect our business, can be found in our Annual Report on Form 10-K and in other filings we make with the Securities and Exchange Commission (“SEC”), which are available on the SEC’s website, http://www.sec.gov. Undue reliance should not be placed on forward-looking statements. The Company disclaims any obligation to update such factors or to publicly announce the results of any revisions to any of the forward-looking statements included herein to reflect future events or developments.

4 The First Bancshares: Building Shareholder Value
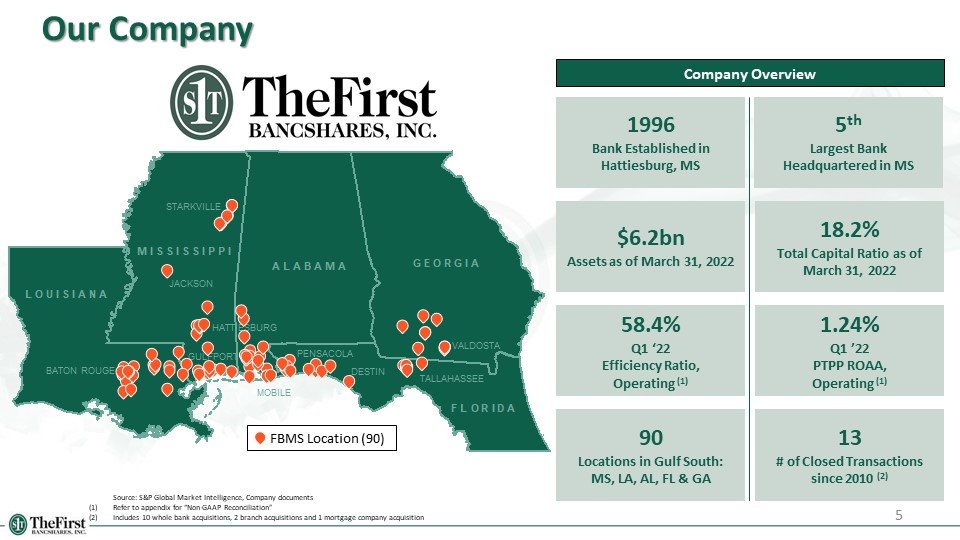
58.4%Q1 ‘22 Efficiency Ratio, Operating (1) 18.2%Total Capital Ratio as of March 31, 2022 5thLargest Bank Headquartered in MS $6.2bnAssets as of March 31, 2022 13# of Closed Transactions since 2010 (2) 5 Our Company Company Overview 90Locations in Gulf South: MS, LA, AL, FL & GA 1996Bank Established in Hattiesburg, MS Source: S&P Global Market Intelligence, Company documents(1) Refer to appendix for “Non-GAAP Reconciliation”(2) Includes 10 whole bank acquisitions, 2 branch acquisitions and 1 mortgage company acquisition 1.24% Q1 ’22PTPP ROAA, Operating (1) VALDOSTA TALLAHASSEE DESTIN PENSACOLA MOBILE GULFPORT BATON ROUGE JACKSON HATTIESBURG FBMS Location (90) STARKVILLE
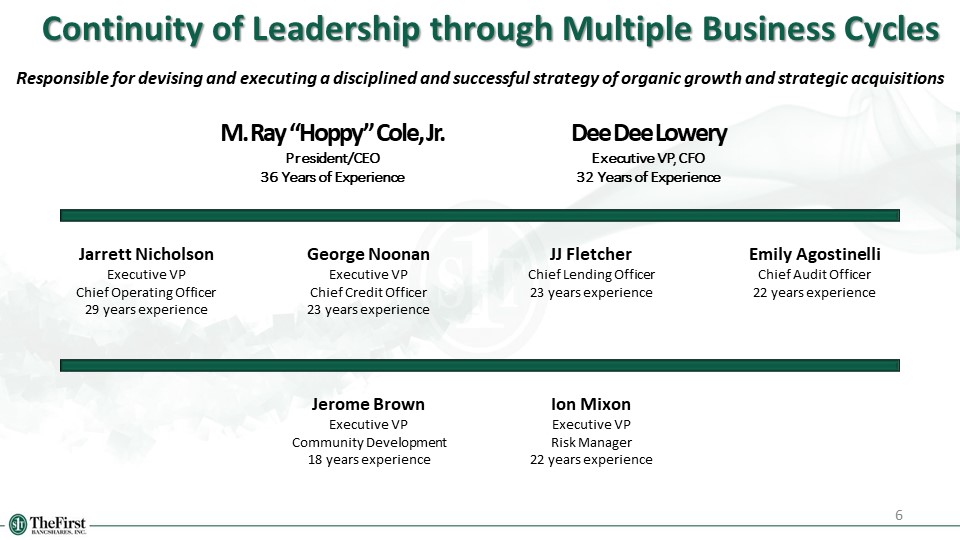
Continuity of Leadership through Multiple Business Cycles 6 Responsible for devising and executing a disciplined and successful strategy of organic growth and strategic acquisitions Jarrett NicholsonExecutive VPChief Operating Officer29 years experience M. Ray “Hoppy” Cole, Jr.President/CEO36 Years of Experience Dee Dee LoweryExecutive VP, CFO32 Years of Experience George NoonanExecutive VPChief Credit Officer23 years experience Jerome BrownExecutive VPCommunity Development18 years experience Ion MixonExecutive VPRisk Manager22 years experience JJ FletcherChief Lending Officer23 years experience Emily AgostinelliChief Audit Officer22 years experience
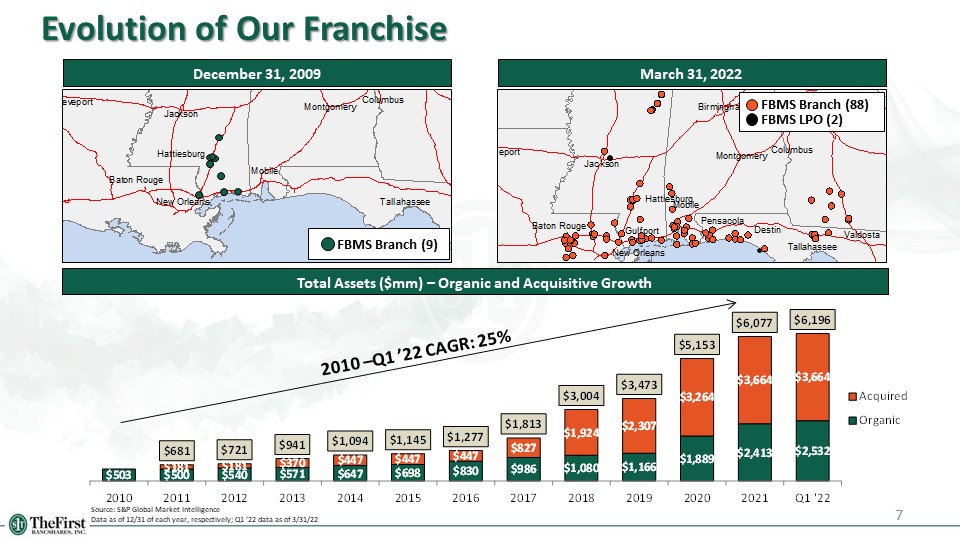
Evolution of Our Franchise December 31, 2009 March 31, 2022 Total Assets ($mm) – Organic and Acquisitive Growth FBMS Branch (9) Hattiesburg Source: S&P Global Market IntelligenceData as of 12/31 of each year, respectively; Q1 ’22 data as of 3/31/22 7 2010 –Q1 ’22 CAGR: 25% Hattiesburg Destin Gulfport Pensacola FBMS Branch (88) FBMS LPO (2)
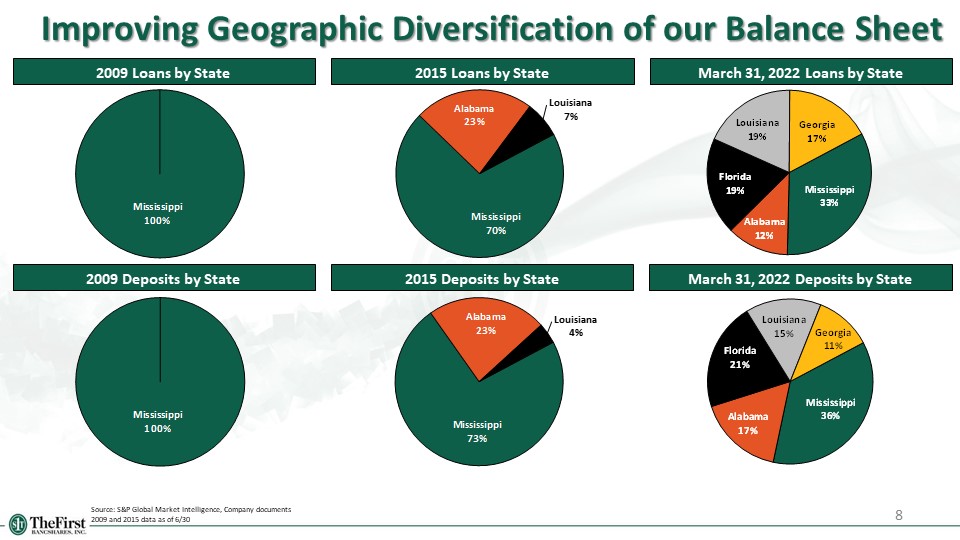
Improving Geographic Diversification of our Balance Sheet 8 2015 Deposits by State March 31, 2022 Deposits by State Source: S&P Global Market Intelligence, Company documents2009 and 2015 data as of 6/30 2015 Loans by State March 31, 2022 Loans by State 2009 Loans by State 2009 Deposits by State

Our Market Demographics 9 Source: S&P Global Market Intelligence Note: Demographic information may not be indicative of the characteristics of the particular markets in which we operate(1) Demographic data deposit weighted by county; deposit data as of 6/30/21 ‘22 – ‘27 Projected Population Growth (%) ‘22 – ‘27 Projected Median HHI Growth (%) 2027 Projected Median HHI ($) November 2021 Unemployment Rate (%) (1) (1) (1) (1)
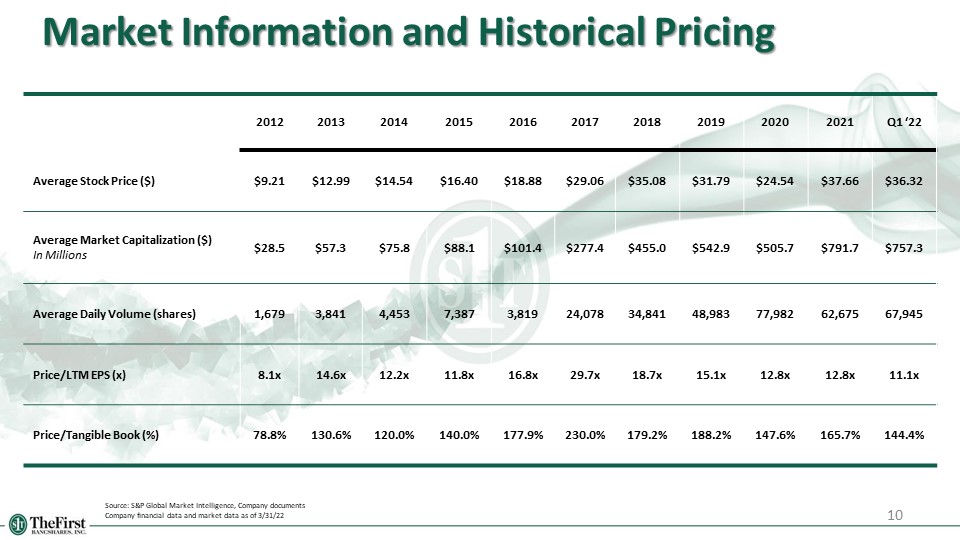
10 2012 2013 2014 2015 2016 2017 2018 2019 2020 2021 Q1 ‘22 Average Stock Price ($) $9.21 $12.99 $14.54 $16.40 $18.88 $29.06 $35.08 $31.79 $24.54 $37.66 $36.32 Average Market Capitalization ($)In Millions $28.5 $57.3 $75.8 $88.1 $101.4 $277.4 $455.0 $542.9 $505.7 $791.7 $757.3 Average Daily Volume (shares) 1,679 3,841 4,453 7,387 3,819 24,078 34,841 48,983 77,982 62,675 67,945 Price/LTM EPS (x) 8.1x 14.6x 12.2x 11.8x 16.8x 29.7x 18.7x 15.1x 12.8x 12.8x 11.1x Price/Tangible Book (%) 78.8% 130.6% 120.0% 140.0% 177.9% 230.0% 179.2% 188.2% 147.6% 165.7% 144.4% Market Information and Historical Pricing Source: S&P Global Market Intelligence, Company documentsCompany financial data and market data as of 3/31/22

11 Overview of Potential Whole Bank Opportunities Source: S&P Global Market Intelligence Data as of 3/31/22(1) Select Florida markets include banks and thrifts headquartered north of and including the Orlando, FL MSA; excludes merger targets and MHCs Opportunities by State Opportunities by Asset Size Includes all banks and thrifts headquartered in Alabama, Georgia, Louisiana, Mississippi, Tennessee, and select Florida (1) markets with total assets between $450 million and $3.0 billion LA MS AL FL GA TN New Orleans Baton Rouge Jacksonville Tallahassee Huntsville Birmingham Chattanooga Columbus Atlanta Knoxville Nashville Memphis Orlando Jackson Shreveport Tampa Mobile Montgomery

Eleven Years of Record Earnings Superior Performance and Execution Strategically Focused on Acquisitive and Organic Growth Strong Capital Structure Situated in Growing Markets Shareholder Value and Return Demonstrated Successful Leadership Team 12 Seven ReasonsTo Invest in The First
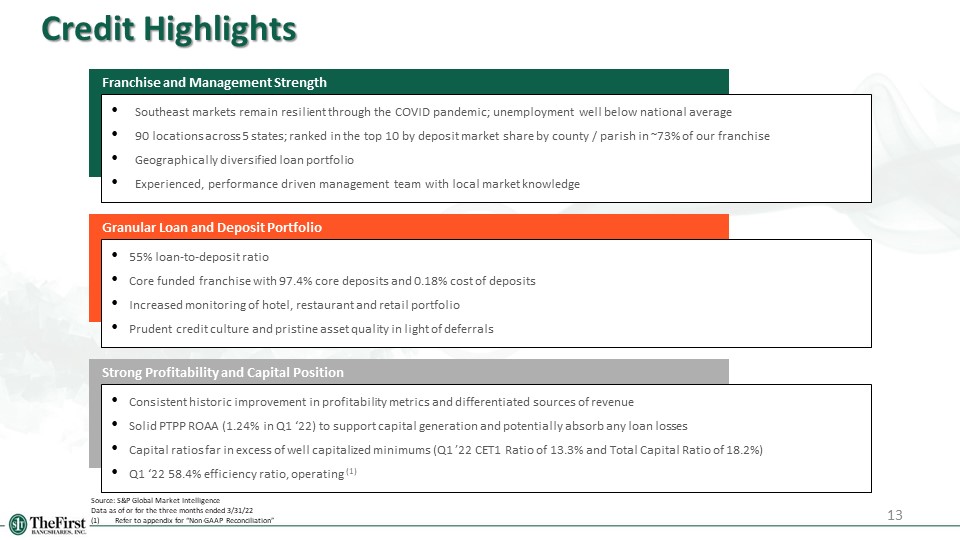
13 Credit Highlights Franchise and Management Strength Southeast markets remain resilient through the COVID pandemic; unemployment well below national average90 locations across 5 states; ranked in the top 10 by deposit market share by county / parish in ~73% of our franchiseGeographically diversified loan portfolioExperienced, performance driven management team with local market knowledge Granular Loan and Deposit Portfolio 55% loan-to-deposit ratioCore funded franchise with 97.4% core deposits and 0.18% cost of depositsIncreased monitoring of hotel, restaurant and retail portfolioPrudent credit culture and pristine asset quality in light of deferrals Strong Profitability and Capital Position Consistent historic improvement in profitability metrics and differentiated sources of revenueSolid PTPP ROAA (1.24% in Q1 ‘22) to support capital generation and potentially absorb any loan lossesCapital ratios far in excess of well capitalized minimums (Q1 ’22 CET1 Ratio of 13.3% and Total Capital Ratio of 18.2%)Q1 ‘22 58.4% efficiency ratio, operating (1) Source: S&P Global Market IntelligenceData as of or for the three months ended 3/31/22(1) Refer to appendix for “Non-GAAP Reconciliation”
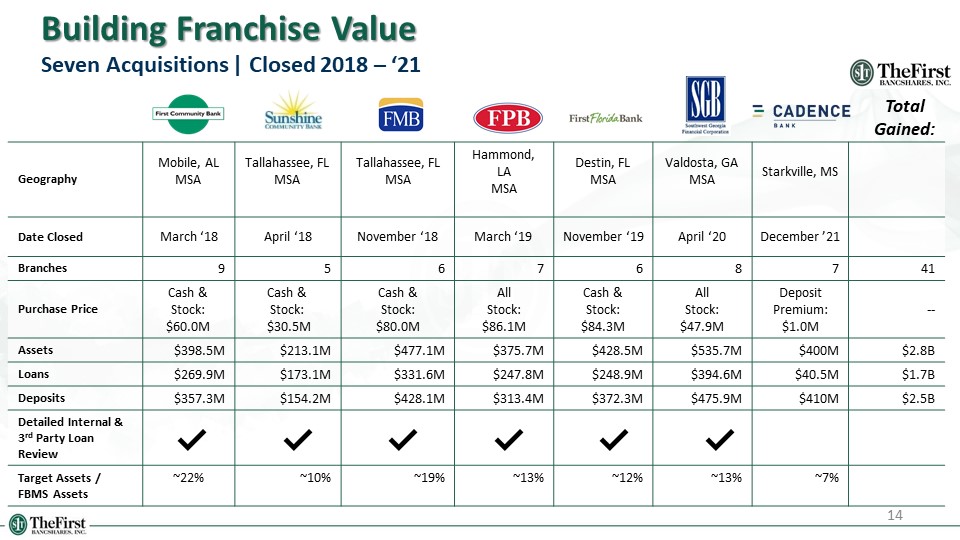
Building Franchise ValueSeven Acquisitions | Closed 2018 – ‘21 14 Geography Mobile, AL MSA Tallahassee, FL MSA Tallahassee, FL MSA Hammond, LAMSA Destin, FLMSA Valdosta, GA MSA Starkville, MS Date Closed March ‘18 April ‘18 November ‘18 March ‘19 November ‘19 April ‘20 December ’21 Branches 9 5 6 7 6 8 7 41 Purchase Price Cash & Stock: $60.0M Cash & Stock: $30.5M Cash & Stock: $80.0M All Stock: $86.1M Cash & Stock: $84.3M All Stock: $47.9M Deposit Premium:$1.0M -- Assets $398.5M $213.1M $477.1M $375.7M $428.5M $535.7M $400M $2.8B Loans $269.9M $173.1M $331.6M $247.8M $248.9M $394.6M $40.5M $1.7B Deposits $357.3M $154.2M $428.1M $313.4M $372.3M $475.9M $410M $2.5B Detailed Internal & 3rd Party Loan Review Target Assets / FBMS Assets ~22% ~10% ~19% ~13% ~12% ~13% ~7% TotalGained:

15 Financial results
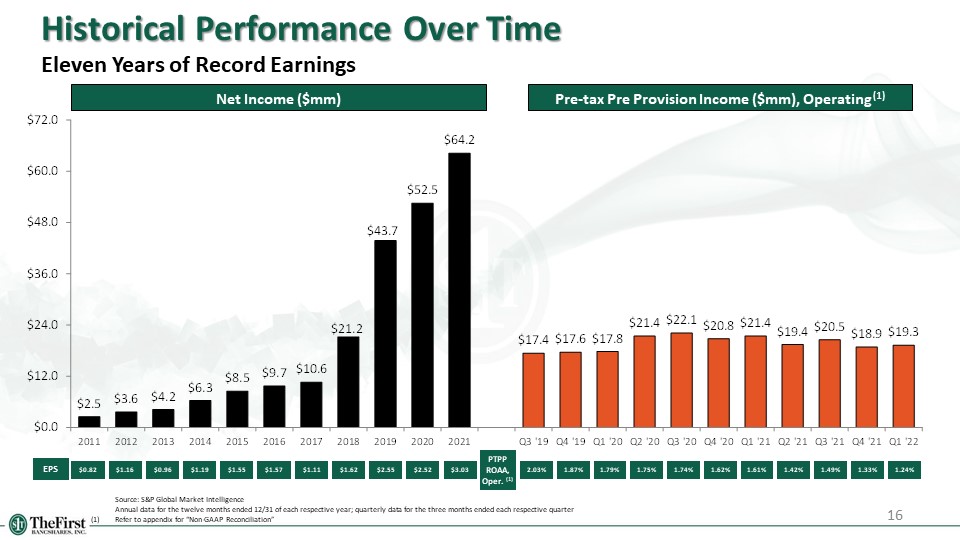
EPS Net Income ($mm) 16 Pre-tax Pre Provision Income ($mm), Operating (1) PTPP ROAA, Oper. (1) Source: S&P Global Market Intelligence Annual data for the twelve months ended 12/31 of each respective year; quarterly data for the three months ended each respective quarter(1) Refer to appendix for “Non-GAAP Reconciliation” Historical Performance Over TimeEleven Years of Record Earnings $0.82 $1.16 $0.96 $1.19 $1.55 $1.57 $1.11 $1.62 $2.55 $2.52 1.62% 1.74% 1.75% 1.79% 1.87% 2.03% 1.61% 1.42% 1.49% $3.03 1.33% 1.24%
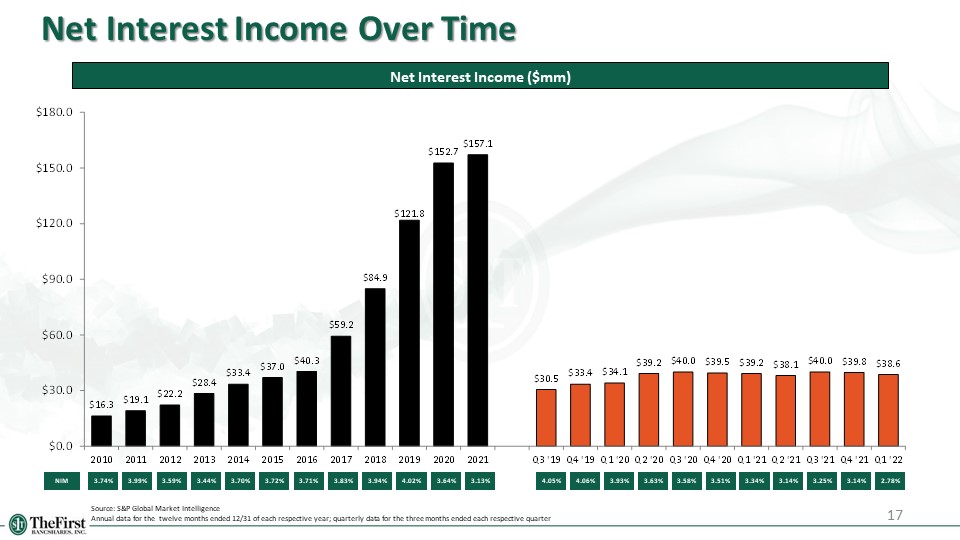
4.05% Net Interest Income Over Time 3.74% 3.99% 3.59% 3.44% 3.70% 3.72% 3.71% Net Interest Income ($mm) NIM 3.34% 3.83% 3.94% 4.06% 3.93% 3.63% 3.58% 3.51% 4.02% Source: S&P Global Market IntelligenceAnnual data for the twelve months ended 12/31 of each respective year; quarterly data for the three months ended each respective quarter 3.13% 3.14% 3.25% 17 3.64% 3.14% 2.78%
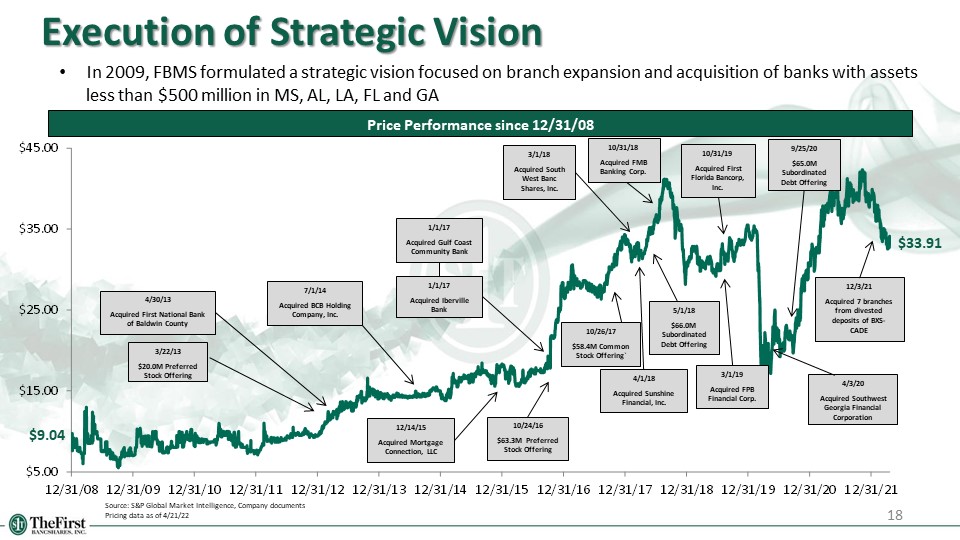
Execution of Strategic Vision 18 Source: S&P Global Market Intelligence, Company documentsPricing data as of 4/21/22 Price Performance since 12/31/08 In 2009, FBMS formulated a strategic vision focused on branch expansion and acquisition of banks with assets less than $500 million in MS, AL, LA, FL and GA $9.04 $33.91 3/22/13$20.0M Preferred Stock Offering 4/30/13Acquired First National Bank of Baldwin County 7/1/14Acquired BCB Holding Company, Inc. 12/14/15Acquired Mortgage Connection, LLC 10/24/16$63.3M Preferred Stock Offering 1/1/17Acquired Gulf Coast Community Bank 1/1/17Acquired Iberville Bank 10/26/17$58.4M Common Stock Offering` 3/1/18Acquired South West Banc Shares, Inc. 4/1/18Acquired Sunshine Financial, Inc. 5/1/18$66.0M Subordinated Debt Offering 10/31/18Acquired FMB Banking Corp. 3/1/19Acquired FPB Financial Corp. 10/31/19 Acquired First Florida Bancorp, Inc. 4/3/20 Acquired Southwest Georgia Financial Corporation 9/25/20$65.0M Subordinated Debt Offering 12/3/21Acquired 7 branches from divested deposits of BXS-CADE
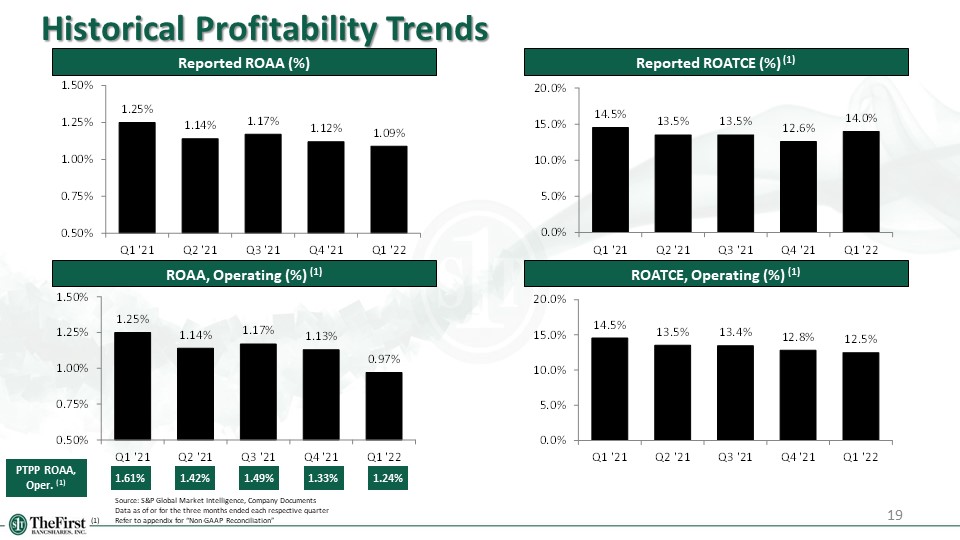
Historical Profitability Trends 19 Source: S&P Global Market Intelligence, Company Documents Data as of or for the three months ended each respective quarter(1) Refer to appendix for “Non-GAAP Reconciliation” Reported ROAA (%) ROAA, Operating (%) (1) Reported ROATCE (%) (1) ROATCE, Operating (%) (1) PTPP ROAA, Oper. (1) 1.61% 1.42% 1.49% 1.33% 1.24%
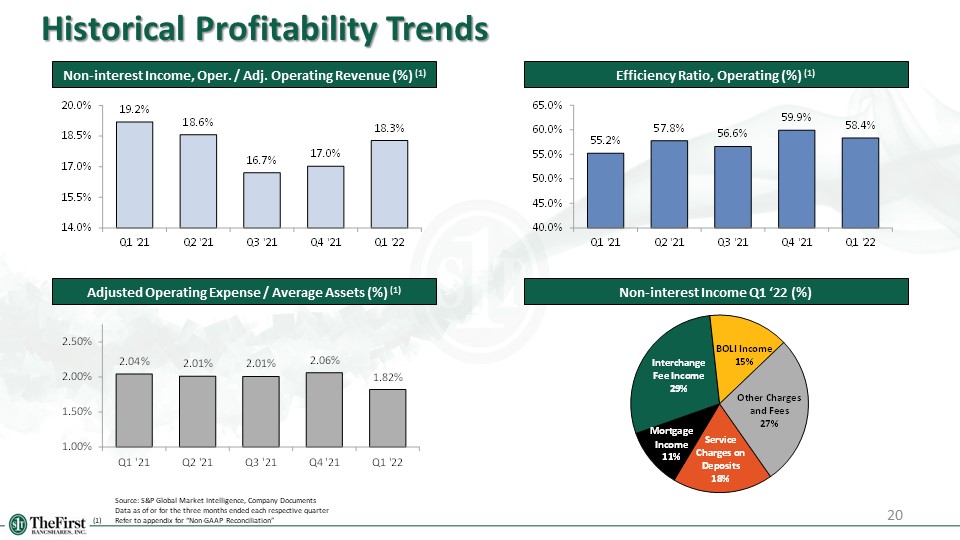
20 Historical Profitability Trends Non-interest Income, Oper. / Adj. Operating Revenue (%) (1) Non-interest Income Q1 ‘22 (%) Efficiency Ratio, Operating (%) (1) Adjusted Operating Expense / Average Assets (%) (1) Source: S&P Global Market Intelligence, Company Documents Data as of or for the three months ended each respective quarter (1) Refer to appendix for “Non-GAAP Reconciliation”
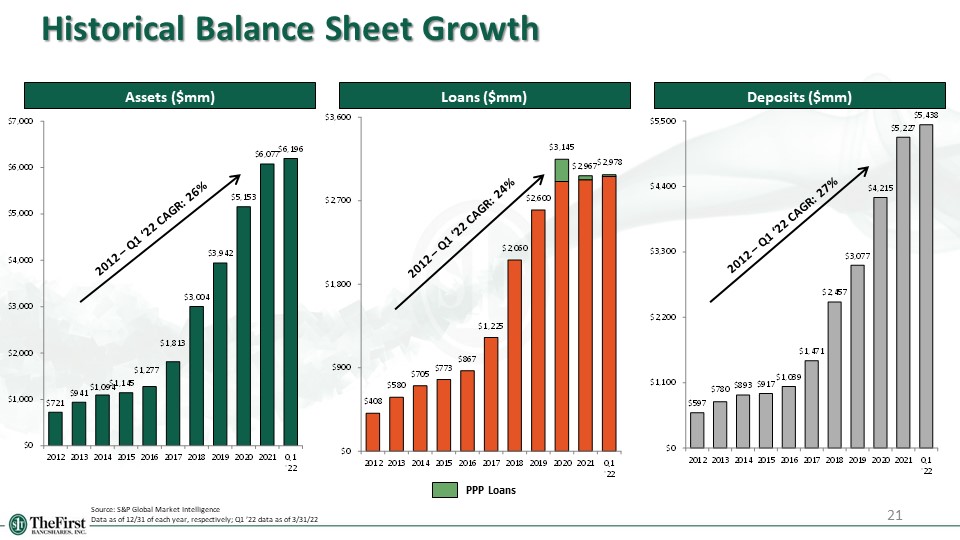
Historical Balance Sheet Growth 21 Assets ($mm) Source: S&P Global Market IntelligenceData as of 12/31 of each year, respectively; Q1 ’22 data as of 3/31/22 Loans ($mm) Deposits ($mm) PPP Loans 2012 – Q1 ‘22 CAGR: 24% 2012 – Q1 ‘22 CAGR: 26% 2012 – Q1 ‘22 CAGR: 27%

Source: S&P Global Market Intelligence Note: Assets shown as of next quarter after close; dates are as of transaction close, unless otherwise specified(1) Tangible book value per share as of 3/31/22 inclusive of ($76.8 million) change in accumulated other comprehensive income and the repurchase of 600,000 shares during the quarter 3/22/2013$22.0M Equity OfferingAssets: $789 million 4/23/2013Acquired First Baldwin Bancshares, Inc. Assets: $965 million 7/1/2014Acquired BCB Holding Company, Inc. Assets: $989 million 1/1/2017Acquired Gulf Coast Community BankAssets: $1.8 billion 12/14/2015Acquired Mortgage Connection, LLCAssets: $1.1 billion 10/24/2016$63.3M Equity OfferingAssets: $1.3 billion 1/1/2017Acquired Iberville BankAssets: $1.8 billion 10/26/2017$58.4M Common Stock OfferingAssets: $1.8 billion 3/1/2018Acquired South West Banc Shares, Inc.Assets: $2.3 billion 4/1/2018Acquired Sunshine Financial, Inc. Assets: $2.5 billion 5/1/2018$66.0M Subordinated Debt OfferingAssets: $2.5 billion 10/31/2018Acquired FMB Banking CorporationAssets: $3.0 billion 3/2/2019Acquired FPB Financial Corp.Assets: $3.5 billion 10/31/2019Acquired First Florida BancorpAssets: $3.9 billion 4/3/2020Acquired SGBAssets: $5.1 billion Executing Upon Growth Strategy Tangible Book Value Per Share Growth (1) 22 Building Upon a Proven Track Record 9/25/2020$65.0M Subordinated Debt OfferingAssets: $5.2 billion 12/3/2021Acquired 7 MS Branches from CADEAssets: $400 million
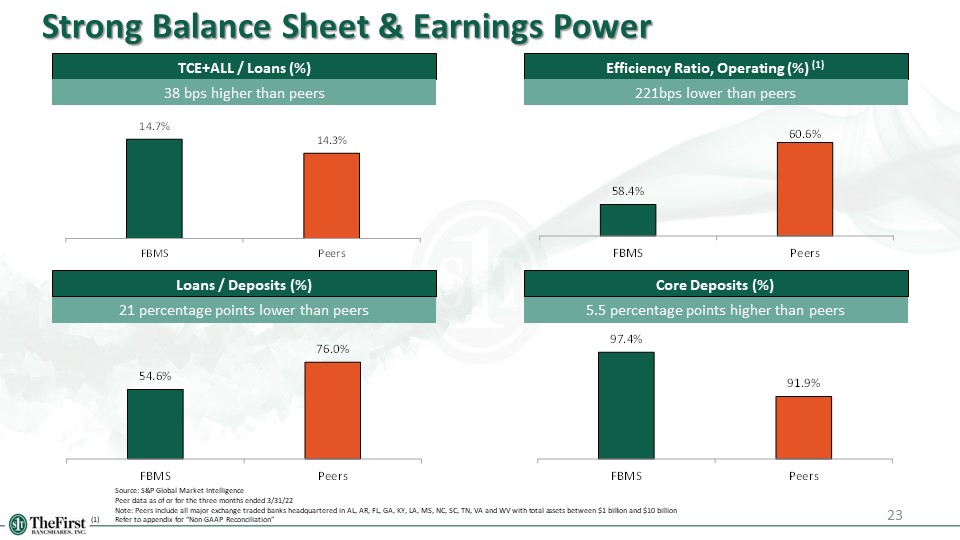
23 Strong Balance Sheet & Earnings Power TCE+ALL / Loans (%) Core Deposits (%) Efficiency Ratio, Operating (%) (1) Loans / Deposits (%) 38 bps higher than peers 221bps lower than peers 21 percentage points lower than peers 5.5 percentage points higher than peers Source: S&P Global Market Intelligence Peer data as of or for the three months ended 3/31/22 Note: Peers include all major exchange traded banks headquartered in AL, AR, FL, GA, KY, LA, MS, NC, SC, TN, VA and WV with total assets between $1 billion and $10 billion(1) Refer to appendix for “Non-GAAP Reconciliation”

24 Loan & deposit information
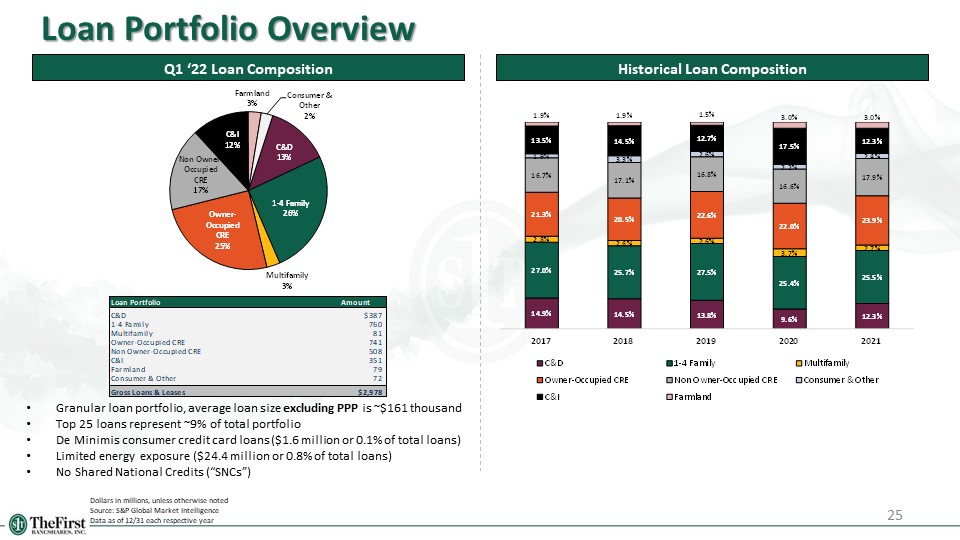
25 Loan Portfolio Overview Q1 ‘22 Loan Composition Historical Loan Composition Dollars in millions, unless otherwise notedSource: S&P Global Market IntelligenceData as of 12/31 each respective year Granular loan portfolio, average loan size excluding PPP is ~$161 thousandTop 25 loans represent ~9% of total portfolioDe Minimis consumer credit card loans ($1.6 million or 0.1% of total loans)Limited energy exposure ($24.4 million or 0.8% of total loans)No Shared National Credits (“SNCs”)
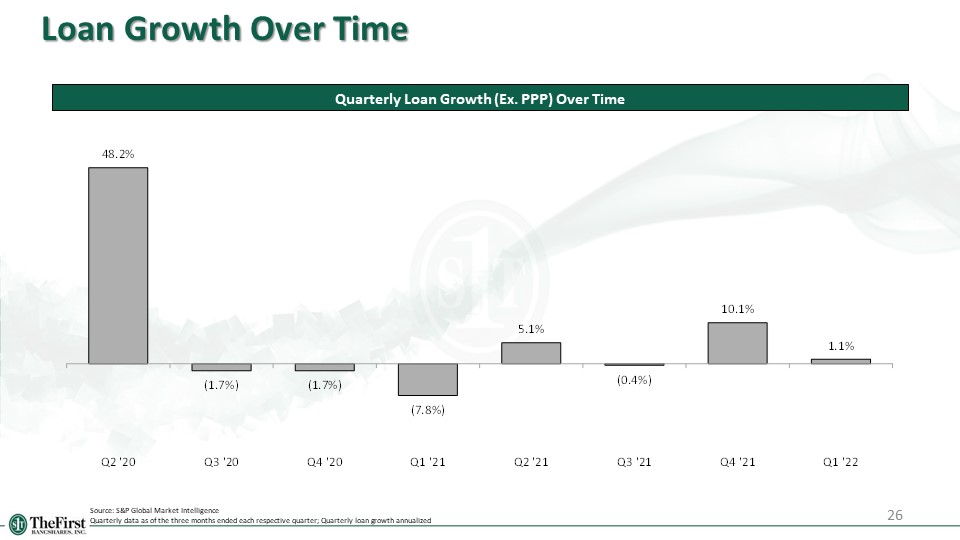
26 Loan Growth Over Time Quarterly Loan Growth (Ex. PPP) Over Time Source: S&P Global Market IntelligenceQuarterly data as of the three months ended each respective quarter; Quarterly loan growth annualized
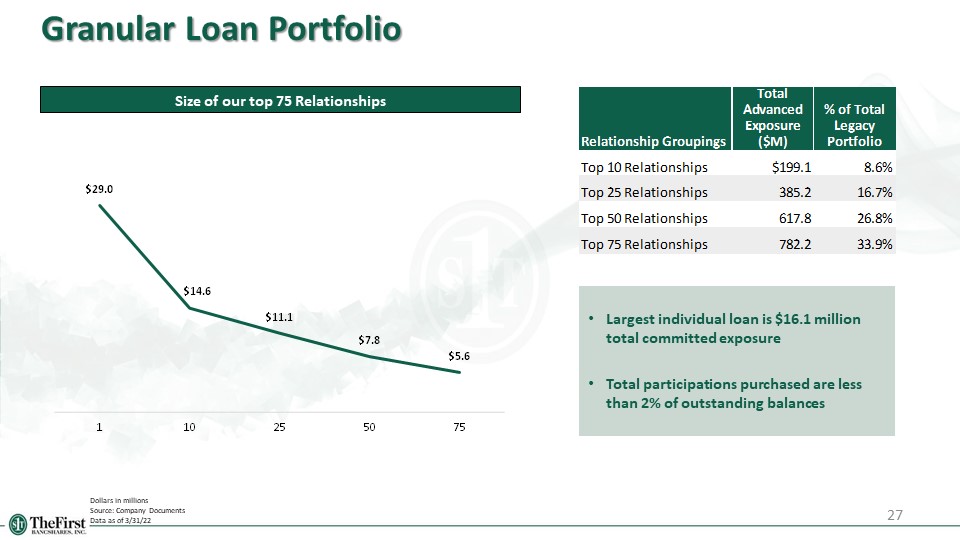
27 Granular Loan Portfolio Dollars in millionsSource: Company DocumentsData as of 3/31/22 Size of our top 75 Relationships Largest individual loan is $16.1 million total committed exposureTotal participations purchased are less than 2% of outstanding balances

28 Escalated MonitoringMarch 31, 2022 Dollars in millionsSource: Company DocumentsData as of 3/31/22 SECTOR TOTAL COMMITTED % OF LOANS LTV % HOTELS $135.8 MILLION 4.6% 61.6% FLAGGED $73.6 MILLION NON-FLAGGED $62.2 MILLION RESTAURANTS $ 90.9 MILLION 3.1% 47.1% CHAIN $70.4 MILLION NON-CHAIN $18.7 MILLION CONSTRUCTION $ 1.8 MILLION RETAIL $207.6 MILLION 7.0% 51.5% CONSTRUCTION $26.6 MILLION NON-OWNER OCCUPIED $46.0 MILLION RETAIL STRIP W/ ANCHOR $50.3 MILLION RETAIL STRIP NO ANCHOR $84.7 MILLION
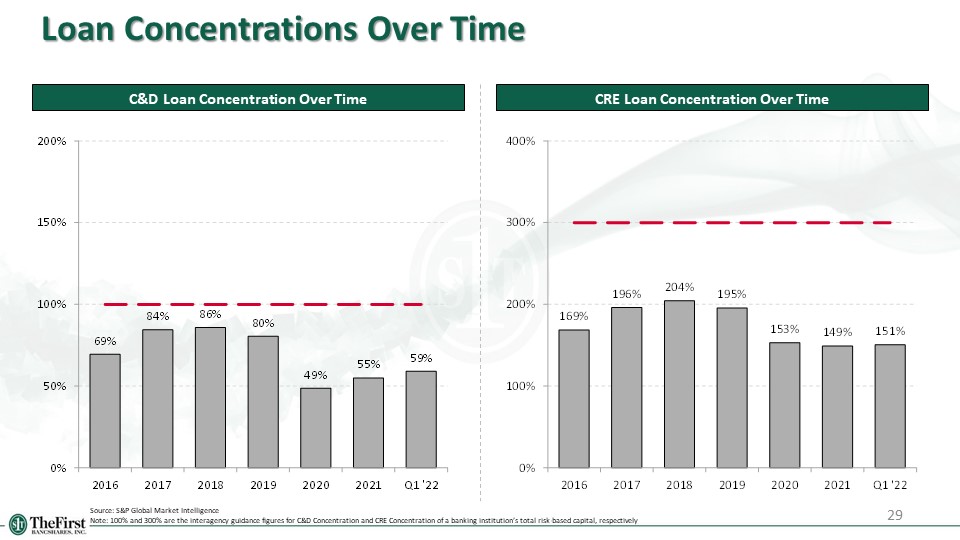
29 Loan Concentrations Over Time C&D Loan Concentration Over Time CRE Loan Concentration Over Time Source: S&P Global Market IntelligenceNote: 100% and 300% are the interagency guidance figures for C&D Concentration and CRE Concentration of a banking institution’s total risk-based capital, respectively
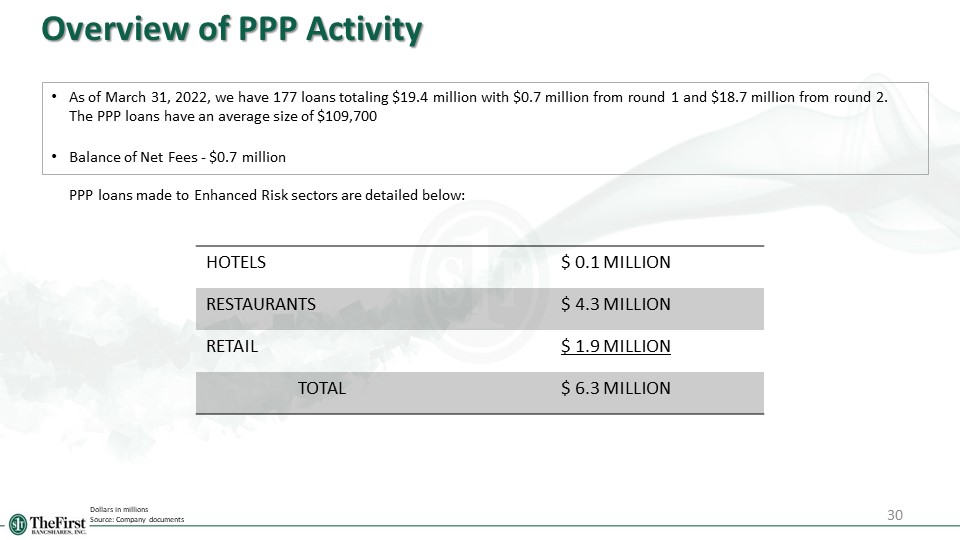
30 Overview of PPP Activity As of March 31, 2022, we have 177 loans totaling $19.4 million with $0.7 million from round 1 and $18.7 million from round 2. The PPP loans have an average size of $109,700Balance of Net Fees - $0.7 million PPP loans made to Enhanced Risk sectors are detailed below: Dollars in millionsSource: Company documents HOTELS $ 0.1 MILLION RESTAURANTS $ 4.3 MILLION RETAIL $ 1.9 MILLION TOTAL $ 6.3 MILLION
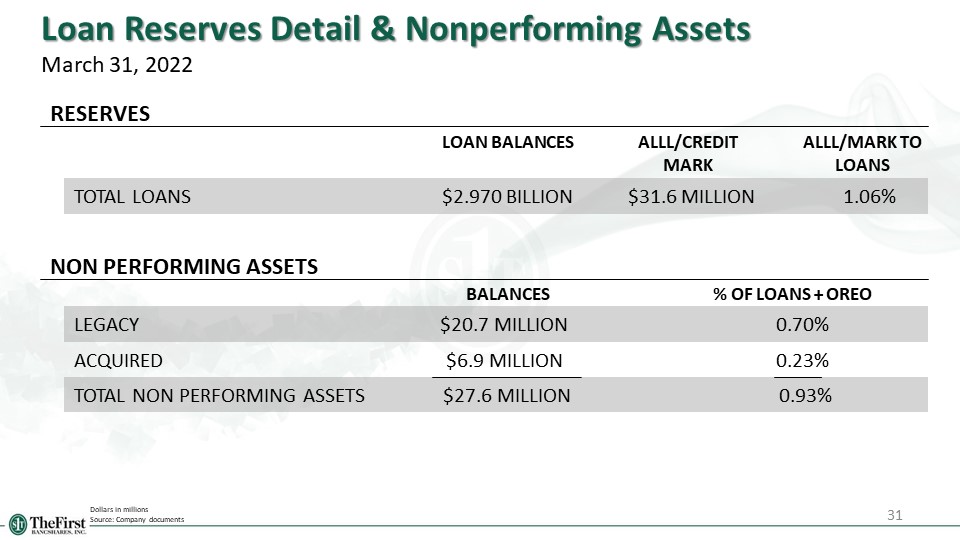
31 Loan Reserves Detail & Nonperforming AssetsMarch 31, 2022 Dollars in millionsSource: Company documents RESERVES TOTAL LOANS $2.970 BILLION $31.6 MILLION 1.06% LOAN BALANCES ALLL/CREDIT MARK ALLL/MARK TO LOANS NON PERFORMING ASSETS BALANCES % OF LOANS + OREO LEGACY $20.7 MILLION 0.70% TOTAL NON PERFORMING ASSETS $27.6 MILLION 0.93% ACQUIRED $6.9 MILLION 0.23%
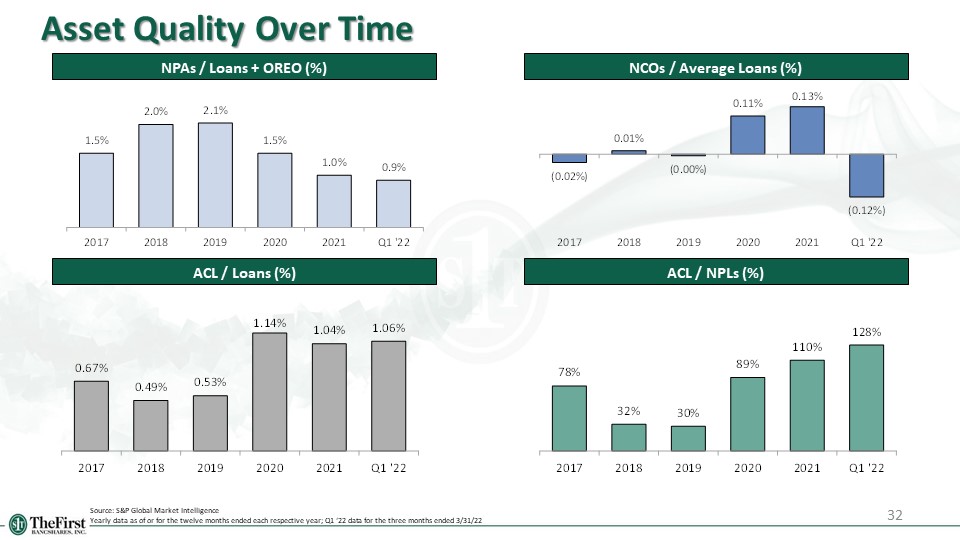
32 Asset Quality Over Time NPAs / Loans + OREO (%) NCOs / Average Loans (%) ACL / NPLs (%) ACL / Loans (%) Source: S&P Global Market IntelligenceYearly data as of or for the twelve months ended each respective year; Q1 ‘22 data for the three months ended 3/31/22
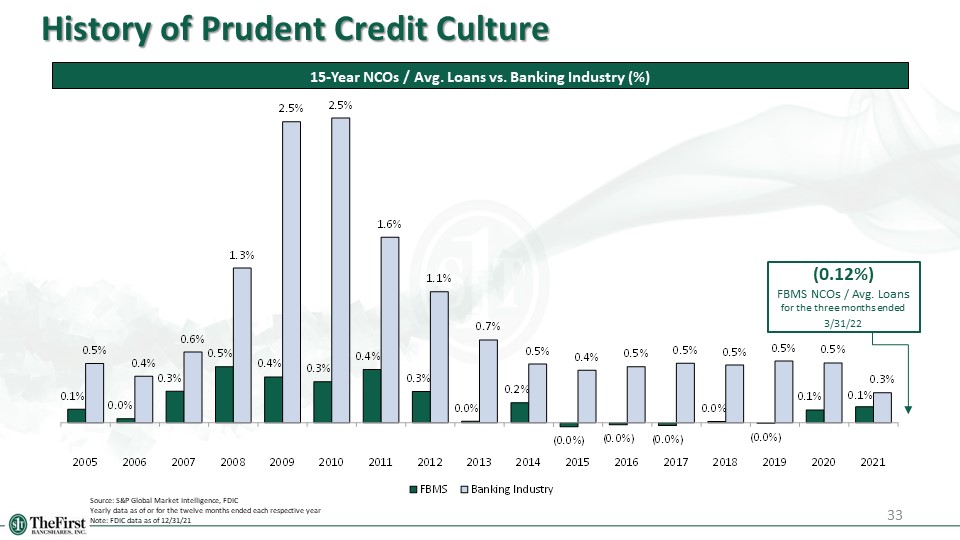
33 History of Prudent Credit Culture 15-Year NCOs / Avg. Loans vs. Banking Industry (%) Source: S&P Global Market Intelligence, FDICYearly data as of or for the twelve months ended each respective year Note: FDIC data as of 12/31/21 (0.12%)FBMS NCOs / Avg. Loans for the three months ended 3/31/22

34 Attractive Deposit Portfolio Historical Deposit Composition ($bn) Cost of Total Deposits Over Time (%) Dollars in millions unless otherwise noted Source: S&P Global Market Intelligence; company documents Annual data as of or for the twelve months ended each respective year; Quarterly data as of or for the three months ended each respective quarter; deposit mix as of 3/31/22(1) Deposits without reclassification; At March 31, 2022, $837.7 million of NOW accounts were reclassified as money market accounts 97.4% core deposits14.9% non-interest bearing demand deposits Q1 ‘22 Deposit Composition (1)

35 Capital & Liquidity
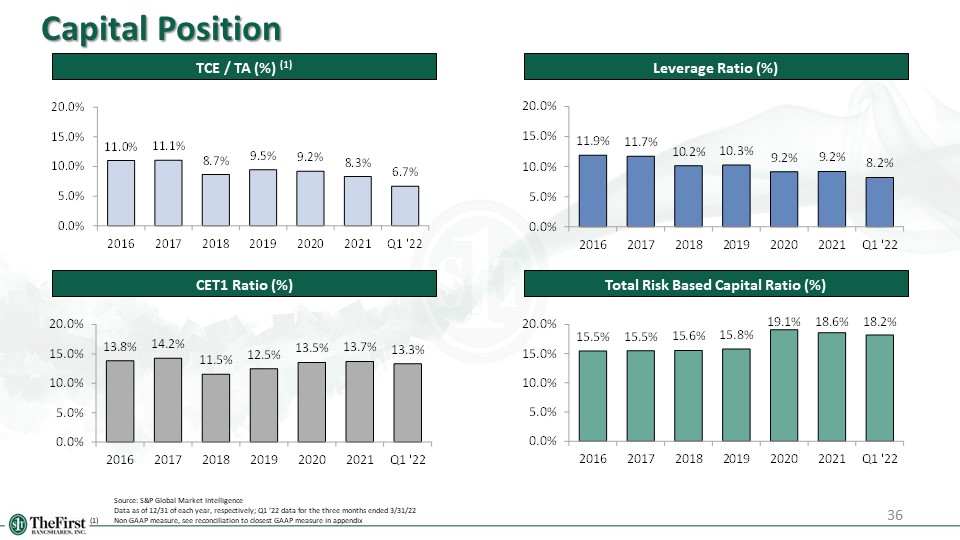
36 Capital Position TCE / TA (%) (1) Leverage Ratio (%) Total Risk Based Capital Ratio (%) CET1 Ratio (%) Source: S&P Global Market Intelligence Data as of 12/31 of each year, respectively; Q1 ’22 data for the three months ended 3/31/22(1) Non-GAAP measure, see reconciliation to closest GAAP measure in appendix
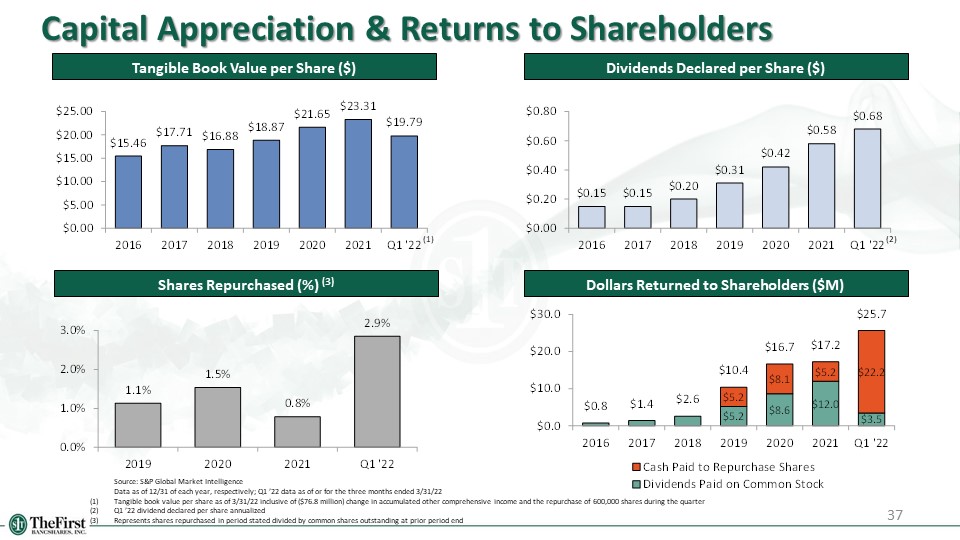
37 Capital Appreciation & Returns to Shareholders Tangible Book Value per Share ($) Dividends Declared per Share ($) Shares Repurchased (%) (3) Source: S&P Global Market Intelligence Data as of 12/31 of each year, respectively; Q1 ’22 data as of or for the three months ended 3/31/22(1) Tangible book value per share as of 3/31/22 inclusive of ($76.8 million) change in accumulated other comprehensive income and the repurchase of 600,000 shares during the quarter(2) Q1 ’22 dividend declared per share annualized(3) Represents shares repurchased in period stated divided by common shares outstanding at prior period end (2) Dollars Returned to Shareholders ($M) (1)
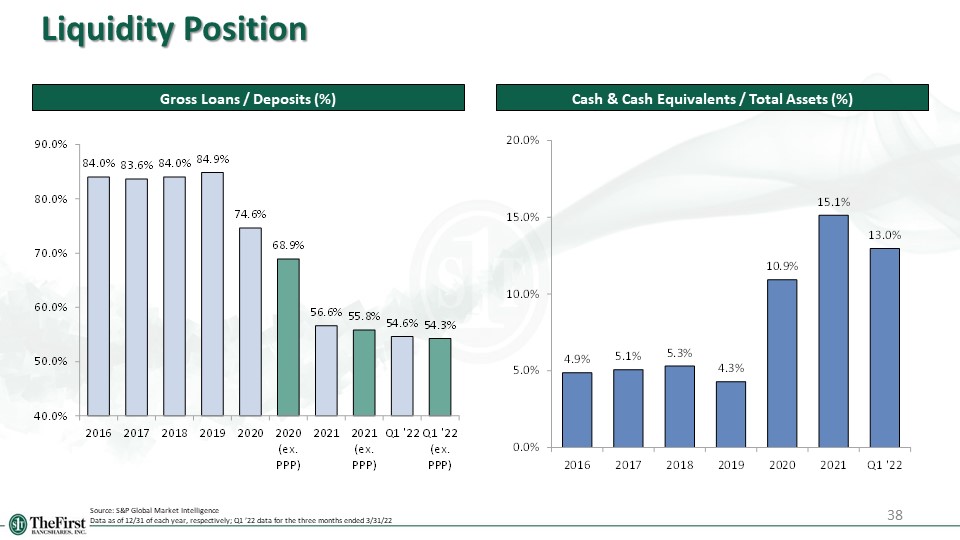
38 Liquidity Position Source: S&P Global Market IntelligenceData as of 12/31 of each year, respectively; Q1 ’22 data for the three months ended 3/31/22 Gross Loans / Deposits (%) Cash & Cash Equivalents / Total Assets (%)

39 Appendix
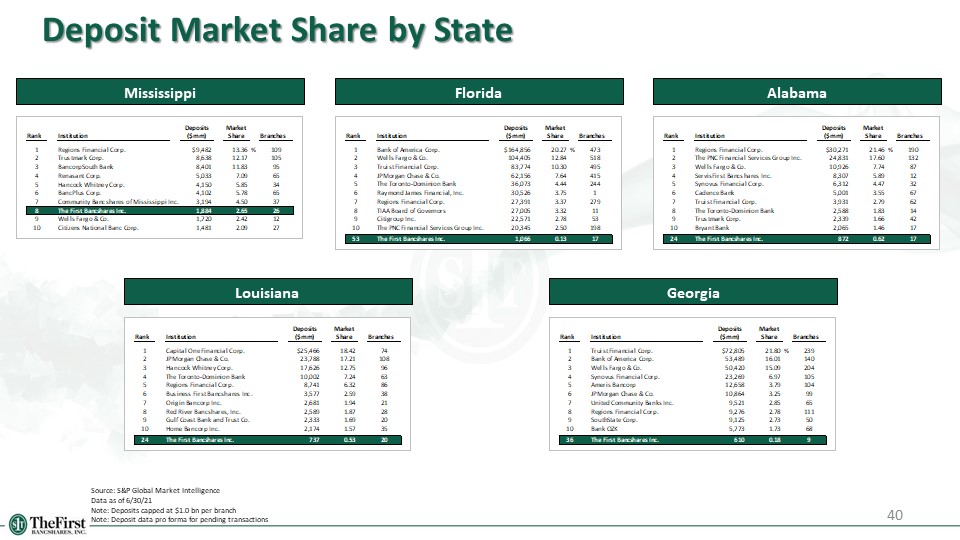
40 Deposit Market Share by State Mississippi Florida Alabama Louisiana Georgia Source: S&P Global Market IntelligenceData as of 6/30/21Note: Deposits capped at $1.0 bn per branchNote: Deposit data pro forma for pending transactions
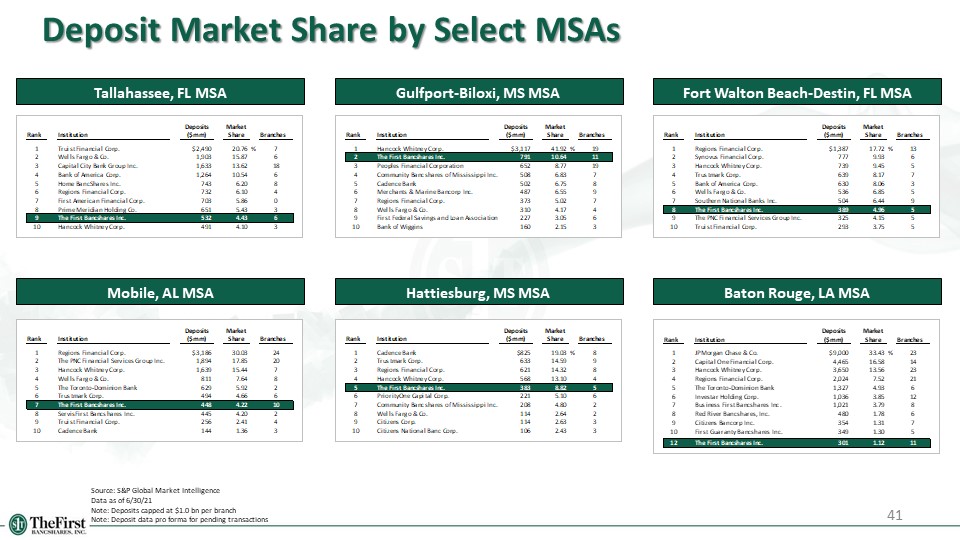
41 Deposit Market Share by Select MSAs Tallahassee, FL MSA Gulfport-Biloxi, MS MSA Fort Walton Beach-Destin, FL MSA Mobile, AL MSA Baton Rouge, LA MSA Hattiesburg, MS MSA Source: S&P Global Market IntelligenceData as of 6/30/21Note: Deposits capped at $1.0 bn per branchNote: Deposit data pro forma for pending transactions
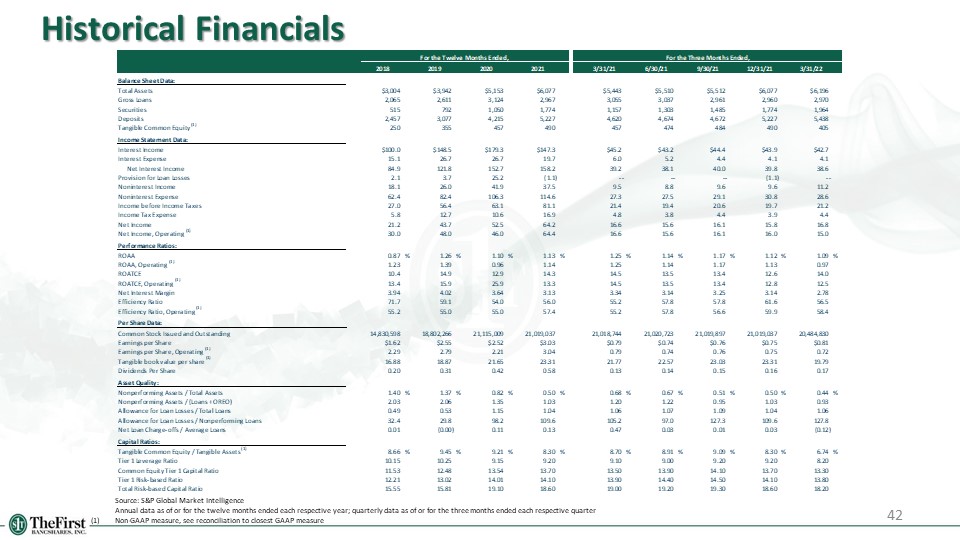
Historical Financials 42 Source: S&P Global Market Intelligence Annual data as of or for the twelve months ended each respective year; quarterly data as of or for the three months ended each respective quarter(1) Non-GAAP measure, see reconciliation to closest GAAP measure
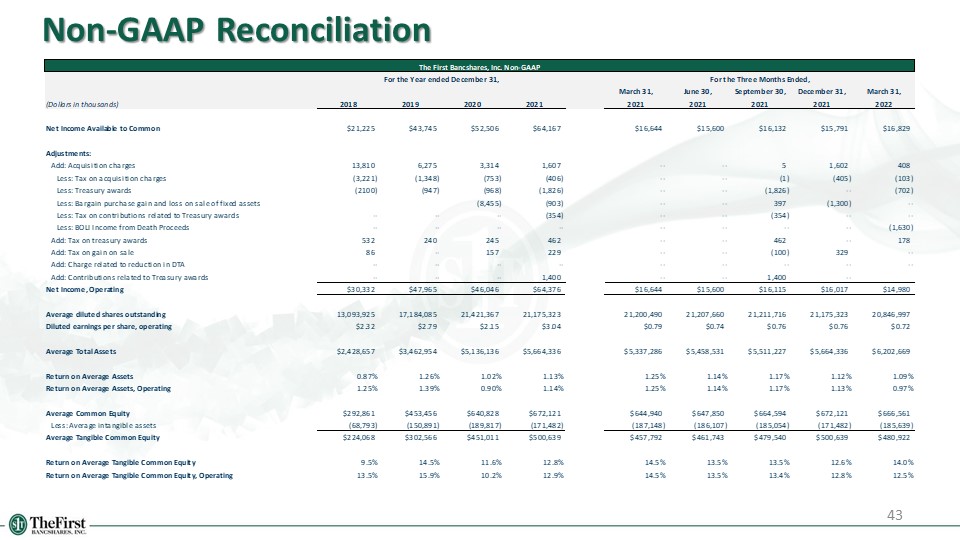
43 Non-GAAP Reconciliation
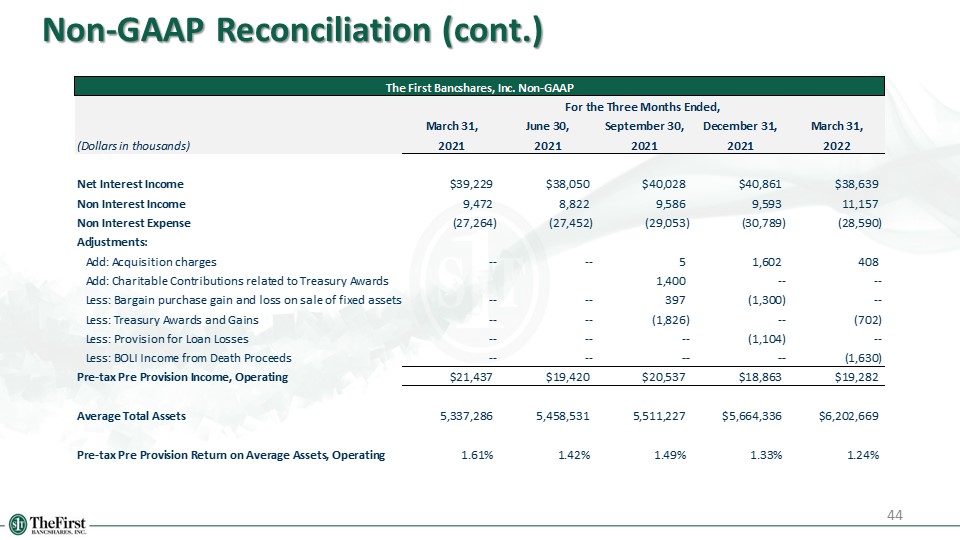
44 Non-GAAP Reconciliation (cont.)
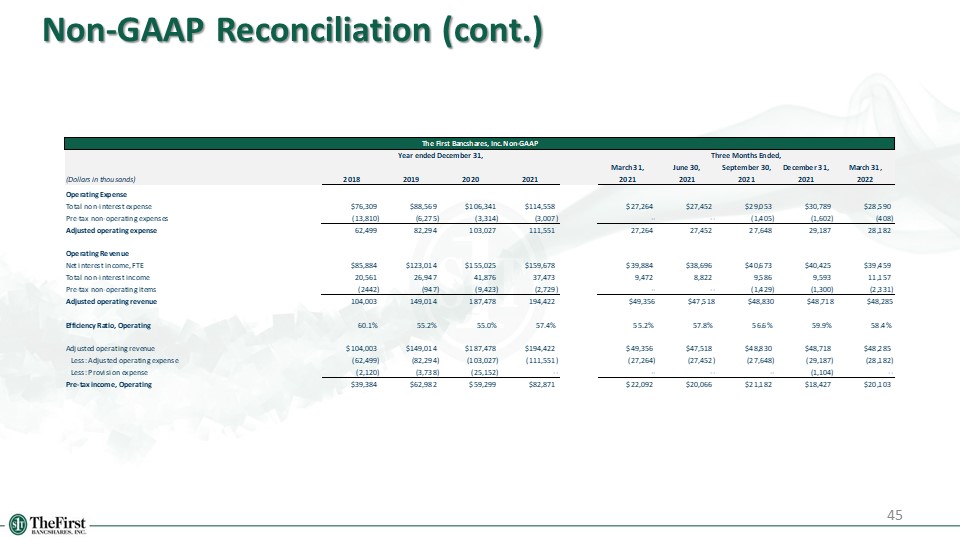
45 Non-GAAP Reconciliation (cont.)

46 Non-GAAP Reconciliation (cont.)
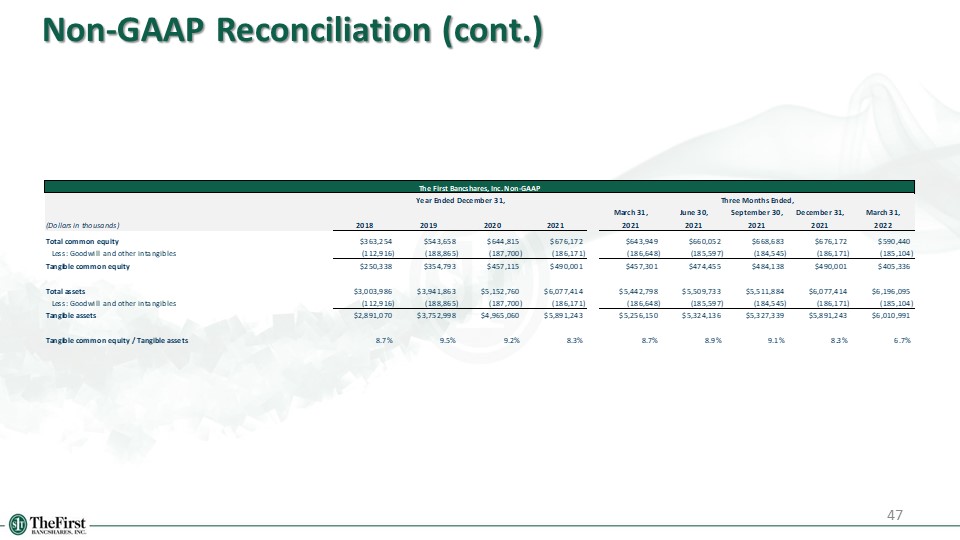
47 Non-GAAP Reconciliation (cont.)