| Exhibit 99.2 |

April 2023 NASDAQ: FBMS
2 Safe Harbor & Forward Looking Statements ABOUT THE FIRST BANCSHARES, INC. The First Bancshares, Inc. (“FBMS” or the “Company”), headquartered in Hattiesburg, Mississippi, is the parent company of The First Bank. Founded in 1996, The First has operations in Mississippi, Louisiana, Alabama, Florida and Georgia. The Company’s stock is traded on NASDAQ Global Market under the symbol FBMS. Contact: Chandra Kidd, Corporate Secretary. NON-GAAP FINANCIAL MEASURES FBMS reports its results in accordance with United States generally accepted accounting principles (“GAAP”). However, management believes that certain non-GAAP performance measures used in managing the business may provide meaningful information about underlying trends in its business. Non-GAAP financial measures should be viewed in addition to, and not as an alternative for, FBMS’s reported results prepared in accordance with GAAP. NON-GAAP FINANCIAL MEASURES This communication contains “forward-looking statements” as defined in the Private Securities Litigation Reform Act of 1995. In general, forward-looking statements usually use words such as “may,” “believe,” “expect,” “anticipate,” “intend,” “will,” “should,” “plan,” “estimate,” “predict,” “continue” and “potential” or the negative of these terms or other comparable terminology. Forward-looking statements represent management’s beliefs, based upon information available at the time the statements are made, with regard to the matters addressed. Such forward-looking statements are not guarantees of future performance. Actual results may differ materially from those contemplated by such forward-looking statements. Factors that might cause such differences include, but are not limited to: (1) competitive pressures among financial institutions increasing significantly; (2) prevailing, or changes in economic or political conditions, either nationally or locally, particularly in areas in which the Company conducts operations, including the effects of declines in the real estate market, high unemployment rates, inflationary pressure, elevated interest rates and slowdowns in economic growth, as well as the financial stress on borrowers as a result of the foregoing; (3) interest rate risk, including the effects of rising interest rates; (4) developments in our mortgage banking business, including loan modifications, general demand, and the effects of judicial or regulatory requirements or guidance; (5) changes in applicable laws, rules, or regulations; (6) risks related to the Company’s recently completed and pending acquisitions, including that the anticipated benefits from the recently completed acquisitions are not realized in the time frame anticipated or at all as a result of changes in general economic and market conditions or other unexpected factors or events; (7) changes in management’s plans for the future; (8) credit risk associated with our lending activities; (9) changes in loan demand, real estate values, or competition; (10) changes in accounting principles, policies, or guidelines; (11) adverse results from current or future litigation, regulatory examinations or other legal and/or regulatory actions, including as a result of the Company’s participation in and execution of government programs related to the COVID-19 pandemic and related variants; (12) higher inflation and its impacts; (13) significant turbulence or disruption in the capital or financial markets and the effect of a fall in stock market prices on our investment securities; (14) potential impacts of the recent adverse developments in the banking industry highlighted by high-profile bank failures, including impacts on customer confidence, deposit outflows, liquidity and the regulatory response thereto; (15) the effects of war or other conflicts including the impacts relating to or resulting from Russia’s military action in Ukraine; (16) a deterioration of the credit rating for U.S. long-term sovereign debt, actions that the U.S. government may take to avoid exceeding the debt ceiling, or uncertainties surrounding the debt ceiling and the federal budget; and (17) other general competitive, economic, political, and market factors, including those affecting our business, operations, pricing, products, or services. The Company does not undertake any obligation to update or revise any forward-looking statements, whether as a result of new information, future events or otherwise. For any forward-looking statements made in this communication, any exhibits hereto or any related documents, the Company claims protection of the safe harbor for forward-looking statements contained in the Private Securities Litigation Reform Act of 1995.
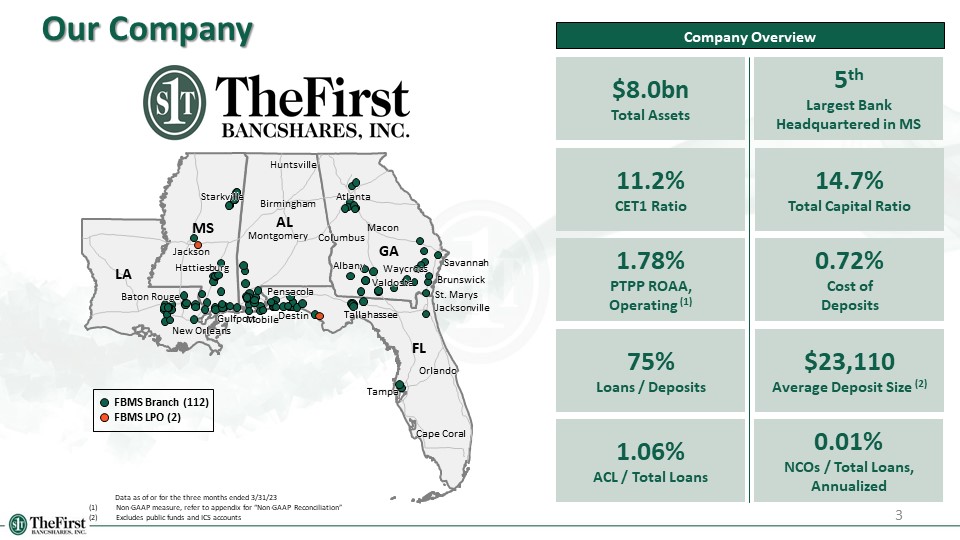
0.72% Cost of Deposits 14.7% Total Capital Ratio 5th Largest Bank Headquartered in MS $8.0bn Total Assets $23,110 Average Deposit Size (2) 3 Our Company Company Overview 75% Loans / Deposits 11.2% CET1 Ratio Data as of or for the three months ended 3/31/23 Non-GAAP measure, refer to appendix for “Non-GAAP Reconciliation” Excludes public funds and ICS accounts 1.78% PTPP ROAA, Operating (1) 0.01% NCOs / Total Loans, Annualized 1.06% ACL / Total Loans AL FL GA LA MS Pensacola Jacksonville Tallahassee Tampa New Orleans Baton Rouge Jackson Birmingham Columbus Orlando Huntsville Montgomery Atlanta Destin St. Marys Valdosta Waycross Gulfport Mobile Hattiesburg Starkville Savannah Brunswick Albany Cape Coral Pensacola Jacksonville Tallahassee Tampa New Orleans Baton Rouge Jackson Birmingham Columbus Orlando Huntsville Montgomery Atlanta Destin St. Marys Valdosta Waycross Gulfport Mobile Hattiesburg Starkville Savannah Brunswick Albany Cape Coral Macon FBMS Branch (112) FBMS LPO (2)

Q1 2023 Highlights Key Highlights Data as of or for the three months ended 3/31/23 Non-GAAP measure, refer to appendix for “Non-GAAP Reconciliation” Excludes public funds and ICS accounts 4 Financial Results Diluted Earnings Per Share Diluted Earnings Per Share, Operating (1) Net Income ($000) Net Income, Operating ($000) (1) Reported ROAA ROAA, Operating (1) Reported ROATCE (1) ROATCE, Operating (1) Efficiency Ratio Efficiency Ratio, Operating (1) Net Interest Margin Net Interest Margin, FTE (1) Closed and converted acquisition of Heritage Southeast Bancorporation, Inc. Deposits 31% demand deposits, an increase from 30% in Q4 standalone Pro forma for the Heritage Southeast acquisition, deposits declined 3.2% linked quarter and 2.1% when adjusted for the targeted run-off of $77 million in brokered deposits $27.4 million brokered deposits as of 3/31/23 Average deposit size of $23 thousand (2) Uninsured deposits equal to 16.9% of total deposits Loans Average loan size of $202,000 Q1 ’23 new loan production of $245.7 million with a blended yield of 7.36% C&D loan concentration as a percentage of bank total capital: 80% CRE loan concentration as a percentage of bank total capital: 207% Capital TCE/TA: 7.2% Leverage: 8.8% CET1: 11.2% Total Risk-Based Capital: 14.7% Credit NPAs / Total Assets of 0.28% this quarter versus 0.27% in Q4 ‘22 NCOs / Total Loans of 0.01% this quarter versus 0.004% in Q4 ‘22 Allowance for Credit Losses ACL / Loans of 1.06% inclusive of Day 2 Current Expected Credit Losses (CECL) provision from the Heritage Southeast acquisition, compared to 1.03% last quarter $0.52 $0.86 $16,271 $27,117 0.81% 1.36% 12.1% 20.1% 58.2% 53.3% 3.63% 3.69% Q1 2023
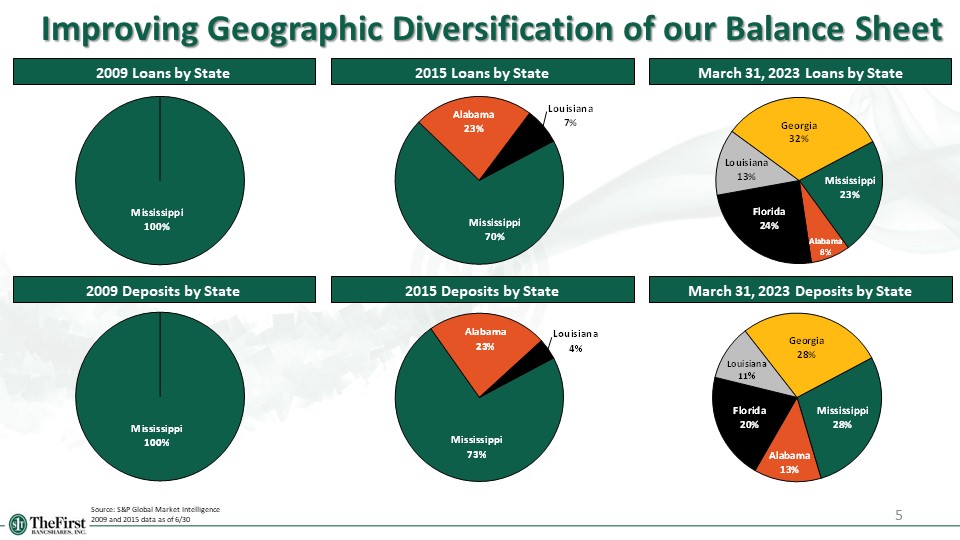
Improving Geographic Diversification of our Balance Sheet 5 2015 Deposits by State March 31, 2023 Deposits by State Source: S&P Global Market Intelligence 2009 and 2015 data as of 6/30 2015 Loans by State March 31, 2023 Loans by State 2009 Loans by State 2009 Deposits by State

6 Financial results
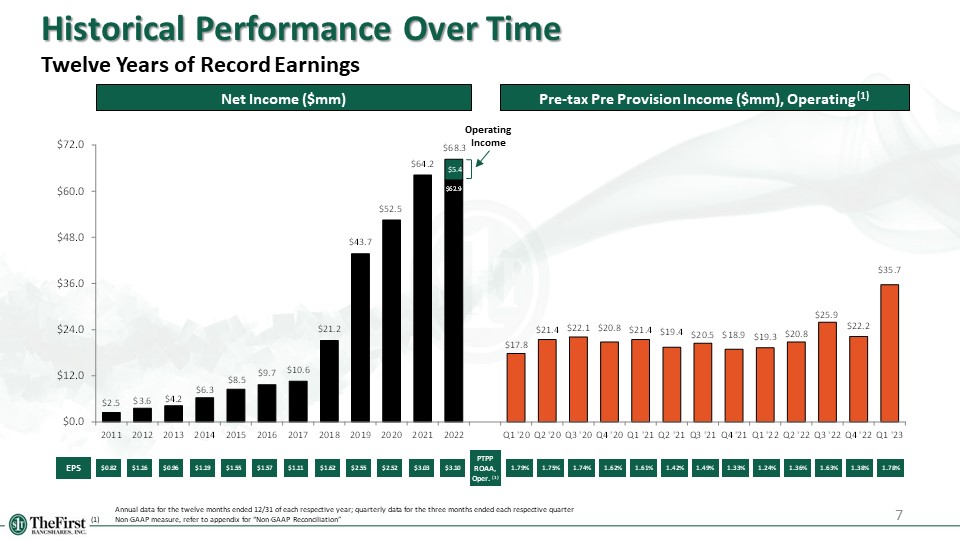
EPS Net Income ($mm) 7 Pre-tax Pre Provision Income ($mm), Operating (1) PTPP ROAA, Oper. (1) Annual data for the twelve months ended 12/31 of each respective year; quarterly data for the three months ended each respective quarter (1) Non-GAAP measure, refer to appendix for “Non-GAAP Reconciliation” Historical Performance Over Time Twelve Years of Record Earnings $0.82 $1.16 $0.96 $1.19 $1.55 $1.57 $1.11 $1.62 $2.55 $2.52 1.62% 1.74% 1.75% 1.79% 1.61% 1.42% 1.49% $3.03 1.33% 1.24% 1.36% 1.63% $3.10 1.38% Operating Income $5.4 1.78%
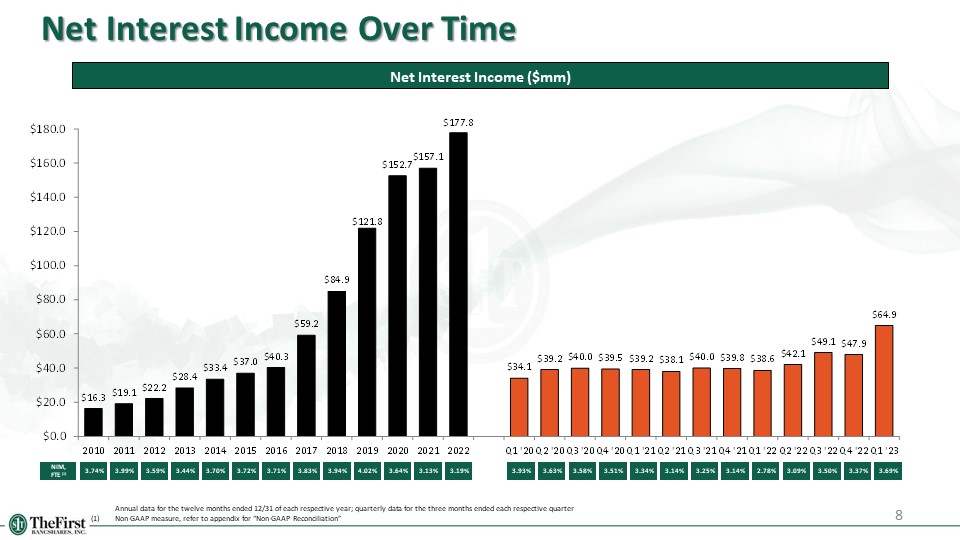
Net Interest Income Over Time 3.74% 3.99% 3.59% 3.44% 3.70% 3.72% 3.71% Net Interest Income ($mm) NIM, FTE (1) 3.34% 3.83% 3.94% 3.93% 3.63% 3.58% 3.51% 4.02% Annual data for the twelve months ended 12/31 of each respective year; quarterly data for the three months ended each respective quarter (1) Non-GAAP measure, refer to appendix for “Non-GAAP Reconciliation” 3.13% 3.14% 3.25% 8 3.64% 3.14% 2.78% 3.09% 3.50% 3.19% 3.37% 3.69%

Historical Cost and Yield Analysis 9 Data as of or for the three months ended each respective quarter Quarterly Yields & Costs (%)
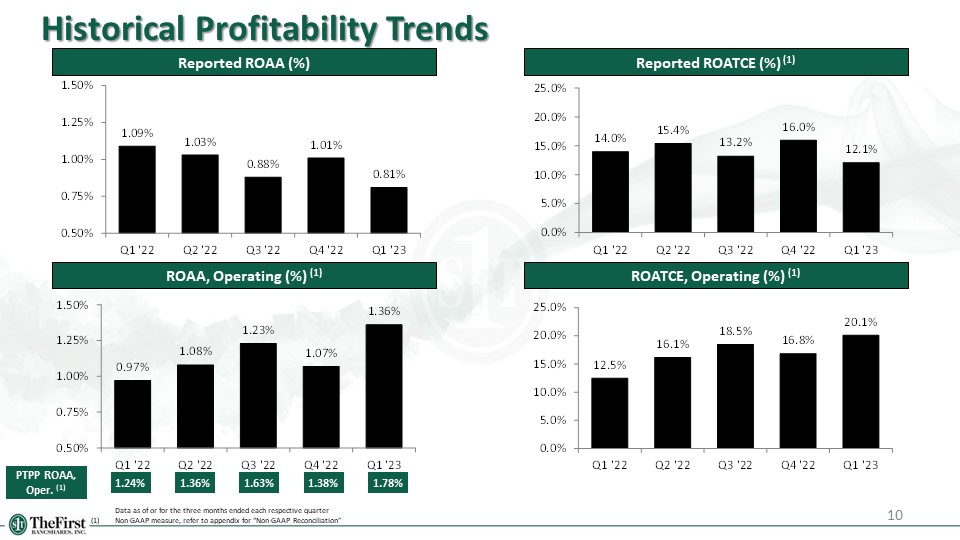
Historical Profitability Trends 10 Data as of or for the three months ended each respective quarter (1) Non-GAAP measure, refer to appendix for “Non-GAAP Reconciliation” Reported ROAA (%) ROAA, Operating (%) (1) Reported ROATCE (%) (1) ROATCE, Operating (%) (1) PTPP ROAA, Oper. (1) 1.24% 1.36% 1.63% 1.38% 1.78%

11 Historical Profitability Trends Non-interest Income, Oper. / Adj. Operating Revenue (%) (1) Non-interest Income Q1 ‘23 (%) Efficiency Ratio, Operating (%) (1) Adjusted Operating Expense / Average Assets (%) (1) Data as of or for the three months ended each respective quarter (1) Non-GAAP measure, refer to appendix for “Non-GAAP Reconciliation”

12 Deposit AND Loan information
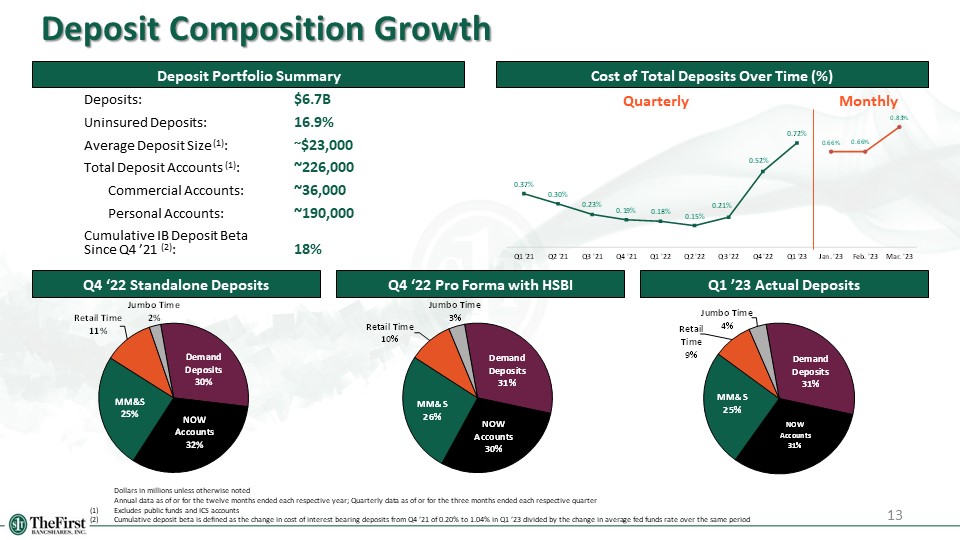
13 Deposit Composition Growth Q1 ’23 Actual Deposits Cost of Total Deposits Over Time (%) Dollars in millions unless otherwise noted Annual data as of or for the twelve months ended each respective year; Quarterly data as of or for the three months ended each respective quarter (1) Excludes public funds and ICS accounts (2) Cumulative deposit beta is defined as the change in cost of interest bearing deposits from Q4 ’21 of 0.20% to 1.04% in Q1 ’23 divided by the change in average fed funds rate over the same period Q4 ‘22 Standalone Deposits Q4 ‘22 Pro Forma with HSBI Deposit Portfolio Summary Monthly Quarterly Deposits: $6.7B Uninsured Deposits: 16.9% Average Deposit Size (1): ~$23,000 Total Deposit Accounts (1): ~226,000 Commercial Accounts: ~36,000 Personal Accounts: ~190,000 Cumulative IB Deposit Beta Since Q4 ’21 (2): 18%
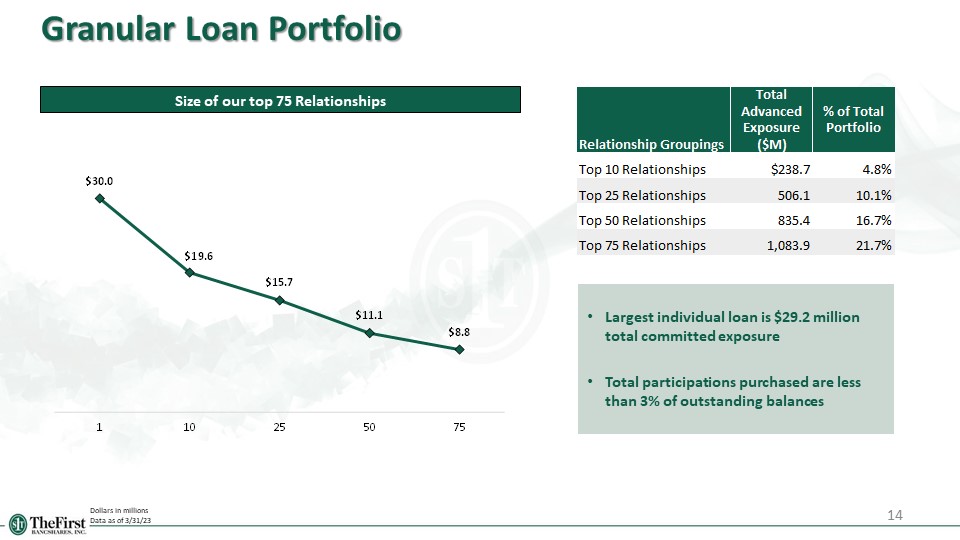
14 Granular Loan Portfolio Dollars in millions Data as of 3/31/23 Size of our top 75 Relationships Largest individual loan is $29.2 million total committed exposure Total participations purchased are less than 3% of outstanding balances
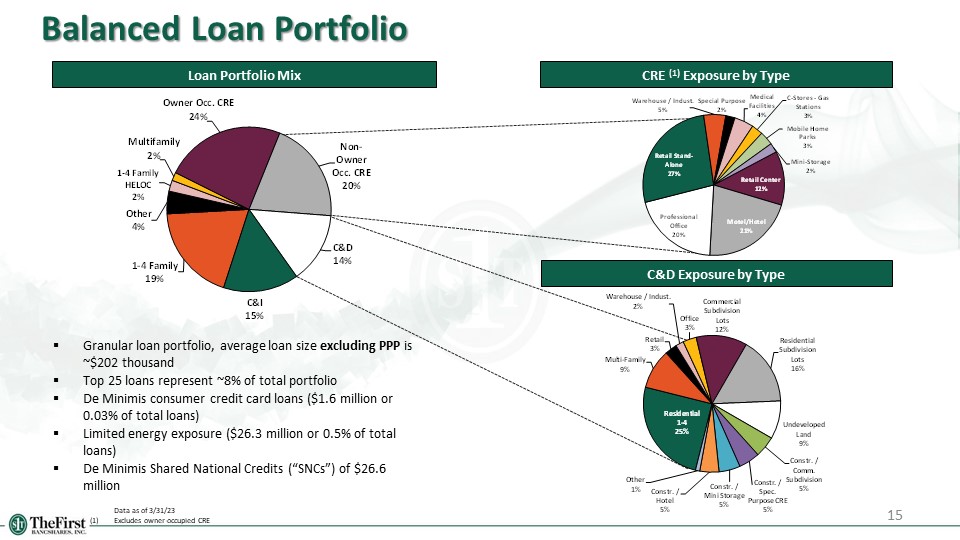
15 Balanced Loan Portfolio Data as of 3/31/23 (1) Excludes owner-occupied CRE Loan Portfolio Mix CRE (1) Exposure by Type Granular loan portfolio, average loan size excluding PPP is ~$202 thousand Top 25 loans represent ~8% of total portfolio De Minimis consumer credit card loans ($1.6 million or 0.03% of total loans) Limited energy exposure ($26.3 million or 0.5% of total loans) De Minimis Shared National Credits (“SNCs”) of $26.6 million C&D Exposure by Type
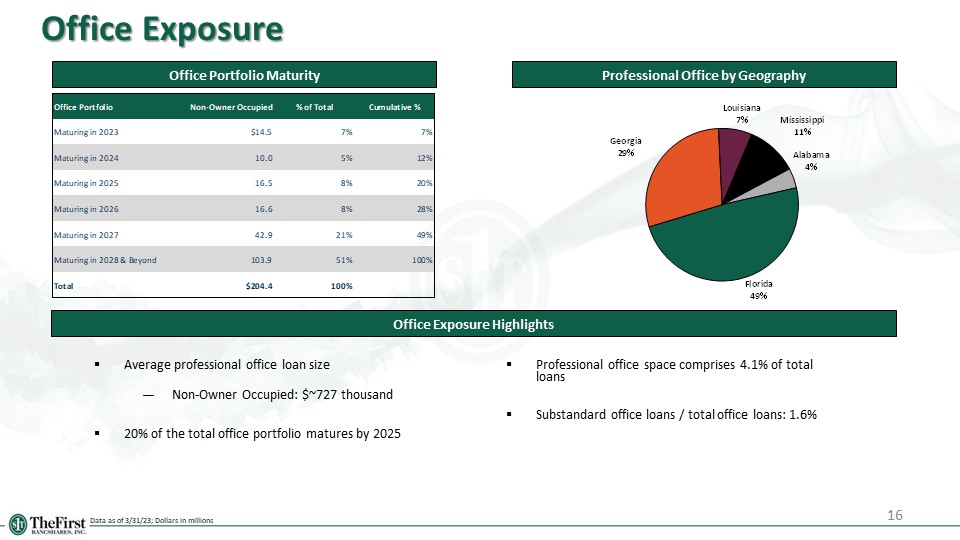
16 Office Exposure Data as of 3/31/23; Dollars in millions Professional Office by Geography Office Portfolio Maturity Average professional office loan size Non-Owner Occupied: $~727 thousand 20% of the total office portfolio matures by 2025 Office Exposure Highlights Professional office space comprises 4.1% of total loans Substandard office loans / total office loans: 1.6%
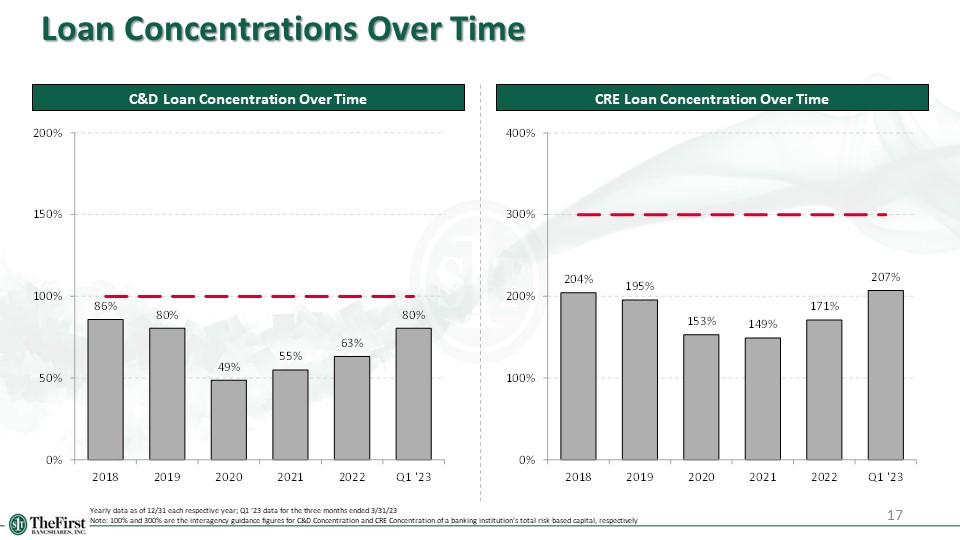
17 Loan Concentrations Over Time C&D Loan Concentration Over Time CRE Loan Concentration Over Time Yearly data as of 12/31 each respective year; Q1 ‘23 data for the three months ended 3/31/23 Note: 100% and 300% are the interagency guidance figures for C&D Concentration and CRE Concentration of a banking institution’s total risk-based capital, respectively
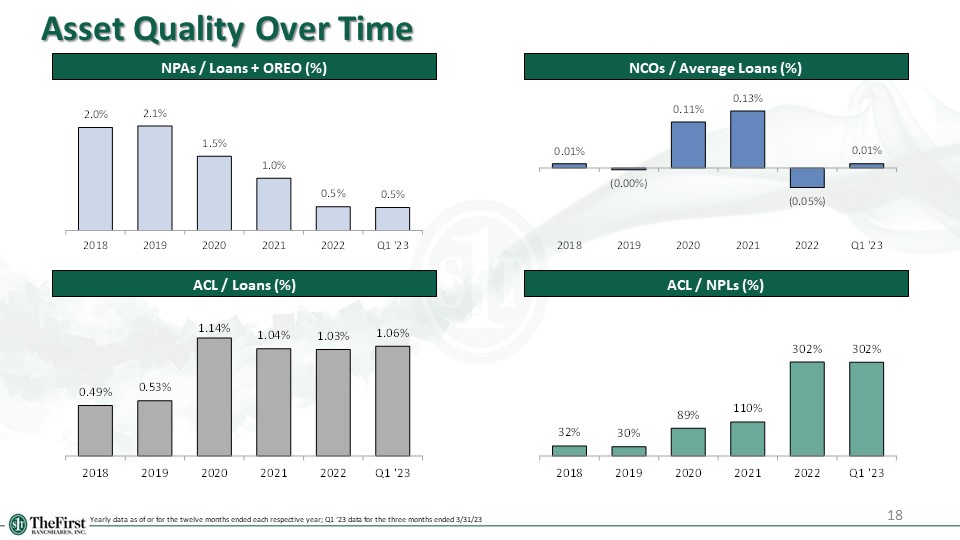
18 Asset Quality Over Time NPAs / Loans + OREO (%) NCOs / Average Loans (%) ACL / NPLs (%) ACL / Loans (%) Yearly data as of or for the twelve months ended each respective year; Q1 ‘23 data for the three months ended 3/31/23
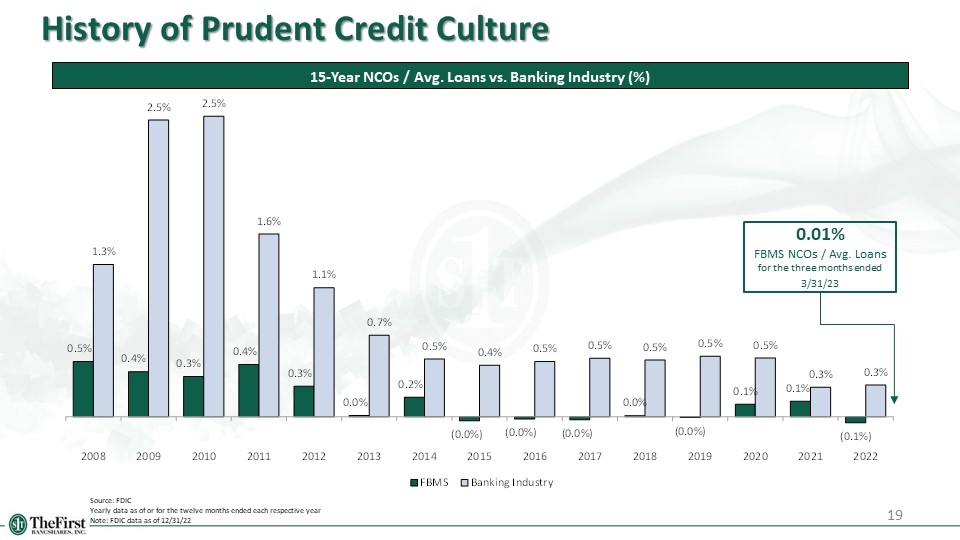
19 History of Prudent Credit Culture 15-Year NCOs / Avg. Loans vs. Banking Industry (%) Source: FDIC Yearly data as of or for the twelve months ended each respective year Note: FDIC data as of 12/31/22 0.01% FBMS NCOs / Avg. Loans for the three months ended 3/31/23

20 Capital & Liquidity
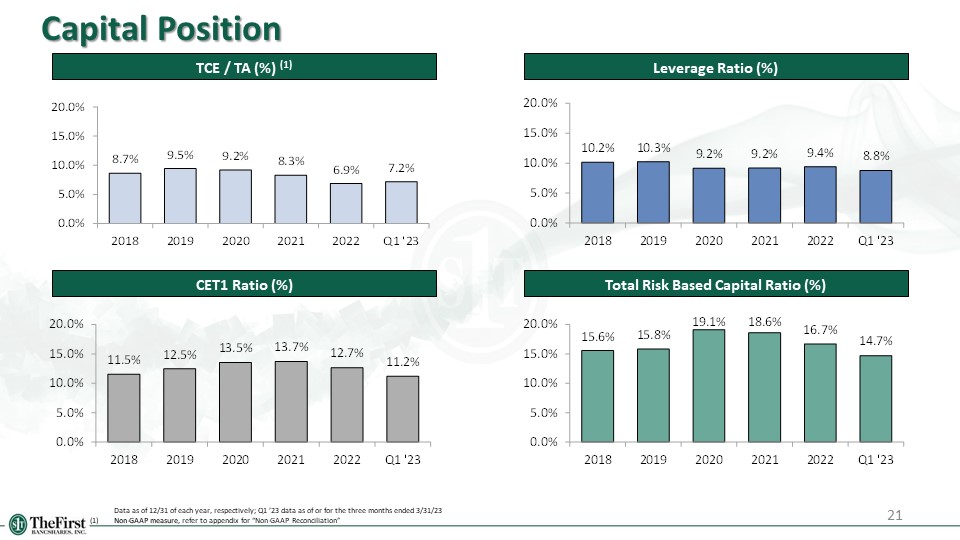
21 Capital Position TCE / TA (%) (1) Leverage Ratio (%) Total Risk Based Capital Ratio (%) CET1 Ratio (%) Data as of 12/31 of each year, respectively; Q1 ’23 data as of or for the three months ended 3/31/23 (1) Non-GAAP measure, refer to appendix for “Non-GAAP Reconciliation”
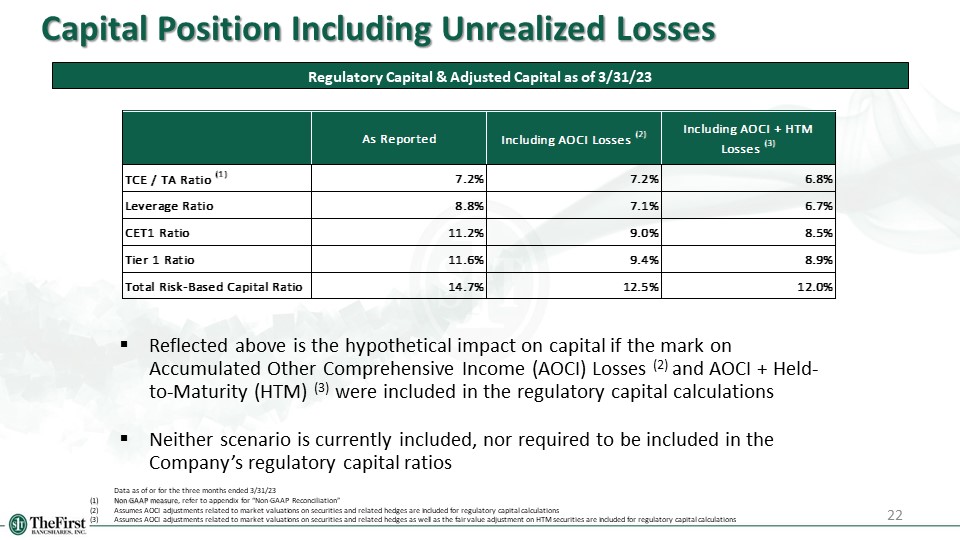
22 Capital Position Including Unrealized Losses Data as of or for the three months ended 3/31/23 (1) Non-GAAP measure, refer to appendix for “Non-GAAP Reconciliation” (2) Assumes AOCI adjustments related to market valuations on securities and related hedges are included for regulatory capital calculations (3) Assumes AOCI adjustments related to market valuations on securities and related hedges as well as the fair value adjustment on HTM securities are included for regulatory capital calculations Reflected above is the hypothetical impact on capital if the mark on Accumulated Other Comprehensive Income (AOCI) Losses (2) and AOCI + Held-to-Maturity (HTM) (3) were included in the regulatory capital calculations Neither scenario is currently included, nor required to be included in the Company’s regulatory capital ratios Regulatory Capital & Adjusted Capital as of 3/31/23
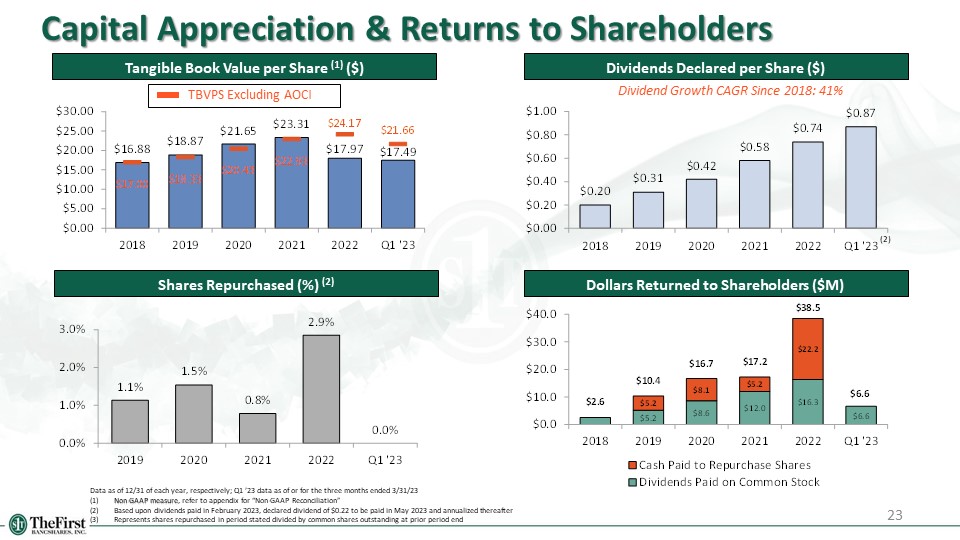
23 Capital Appreciation & Returns to Shareholders Tangible Book Value per Share (1) ($) Dividends Declared per Share ($) Shares Repurchased (%) (2) Data as of 12/31 of each year, respectively; Q1 ’23 data as of or for the three months ended 3/31/23 (1) Non-GAAP measure, refer to appendix for “Non-GAAP Reconciliation” (2) Based upon dividends paid in February 2023, declared dividend of $0.22 to be paid in May 2023 and annualized thereafter (3) Represents shares repurchased in period stated divided by common shares outstanding at prior period end (2) Dollars Returned to Shareholders ($M) Dividend Growth CAGR Since 2018: 41% TBVPS Excluding AOCI

24 Liquidity Position Data as of 12/31 of each year, respectively; Q1 ’23 data as of or for the three months ended 3/31/23 Gross Loans / Deposits (%) Funding Sources Liquidity Highlights As of March 31, the Company’s liquidity ratio was 19.6%, as compared to the internal liquidity policy guidelines of 10% minimum Other liquidity ratios reviewed include the following along with policy guidelines:
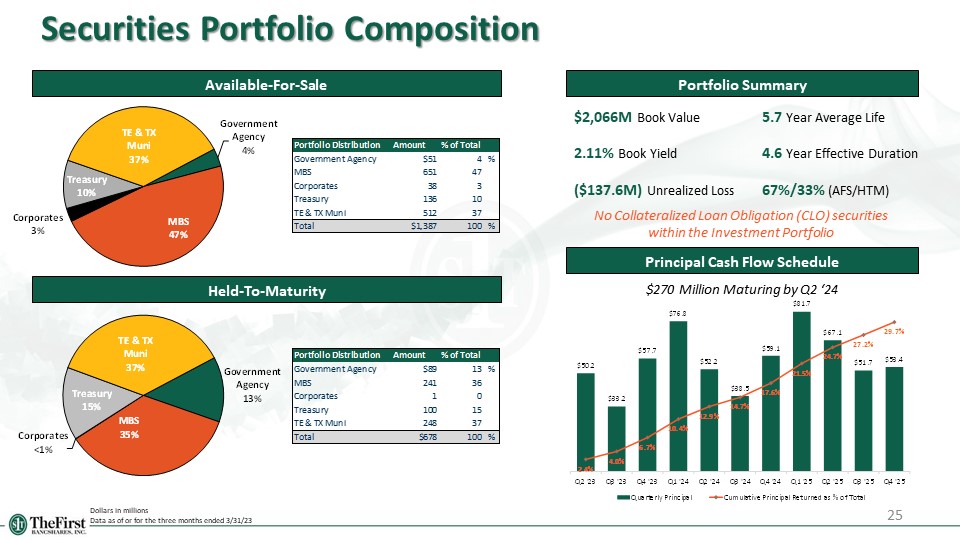
25 Securities Portfolio Composition Dollars in millions Data as of or for the three months ended 3/31/23 Available-For-Sale Portfolio Summary Held-To-Maturity $2,066M Book Value 2.11% Book Yield ($137.6M) Unrealized Loss 5.7 Year Average Life 4.6 Year Effective Duration 67%/33% (AFS/HTM) Principal Cash Flow Schedule $270 Million Maturing by Q2 ‘24 No Collateralized Loan Obligation (CLO) securities within the Investment Portfolio

26 Appendix
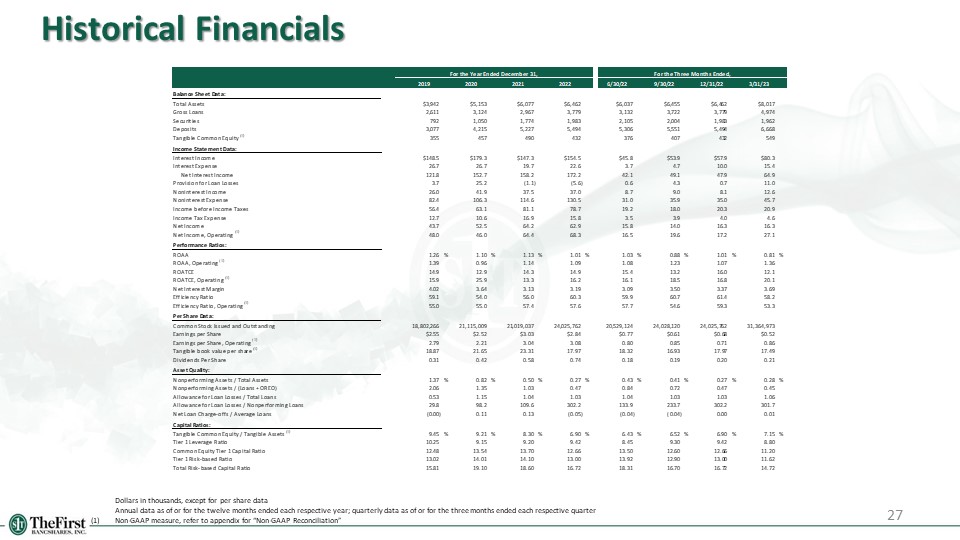
Historical Financials 27 Dollars in thousands, except for per share data Annual data as of or for the twelve months ended each respective year; quarterly data as of or for the three months ended each respective quarter (1) Non-GAAP measure, refer to appendix for “Non-GAAP Reconciliation”

28 Non-GAAP Reconciliation
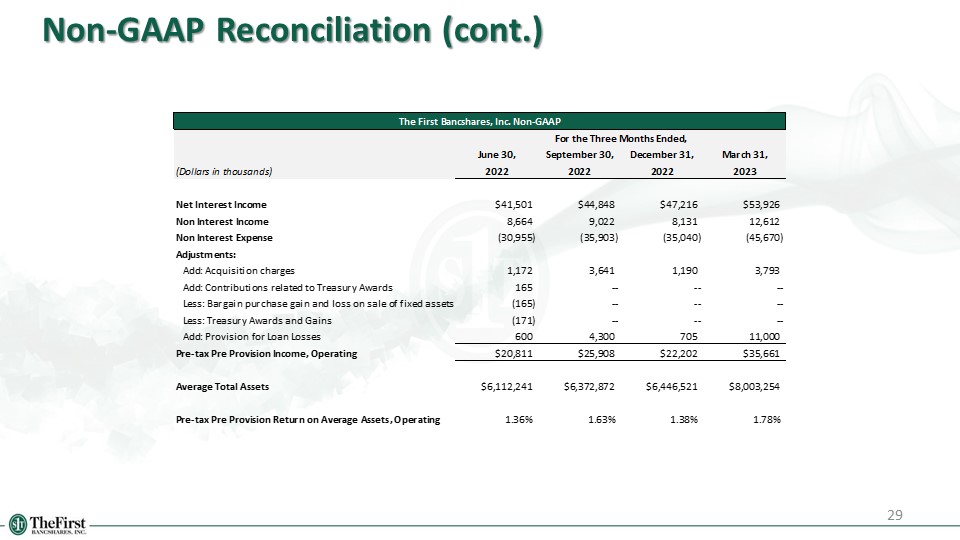
29 Non-GAAP Reconciliation (cont.)

30 Non-GAAP Reconciliation (cont.)
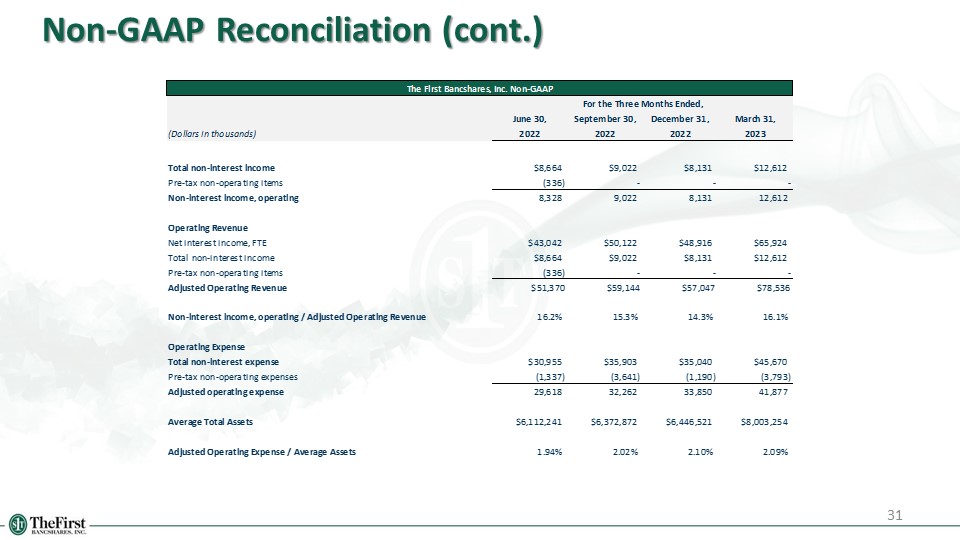
31 Non-GAAP Reconciliation (cont.)
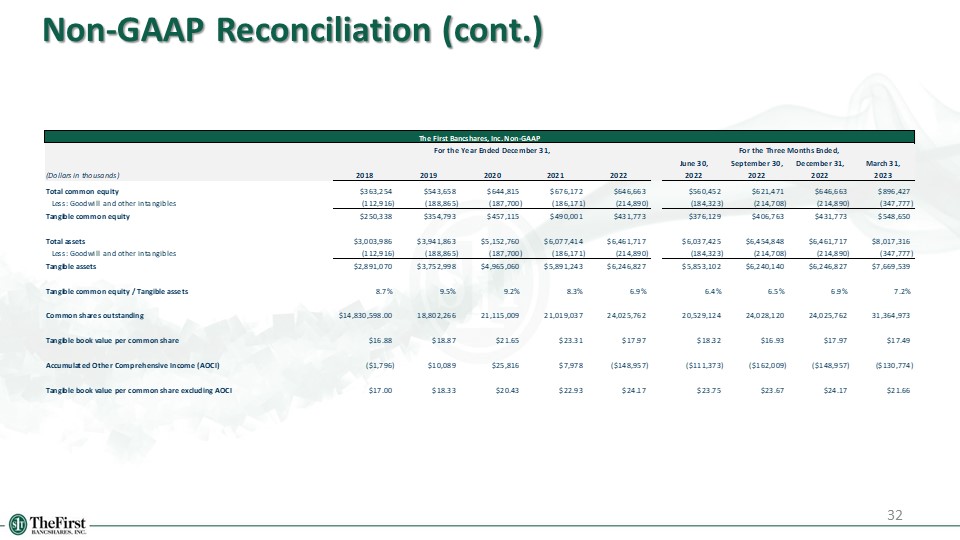
32 Non-GAAP Reconciliation (cont.)