Exhibit 99.2
Levi Strauss & Co.
Third-Quarter Results
Presented by:
Hans Ploos van Amstel
Chief Financial Officer
October 11, 2005
This presentation should be read in conjunction with Levi Strauss & Co.’s
report on Form 10-Q for the quarterly period ended August 28, 2005.
LS&CO. Q3 2005 Results – Introduction
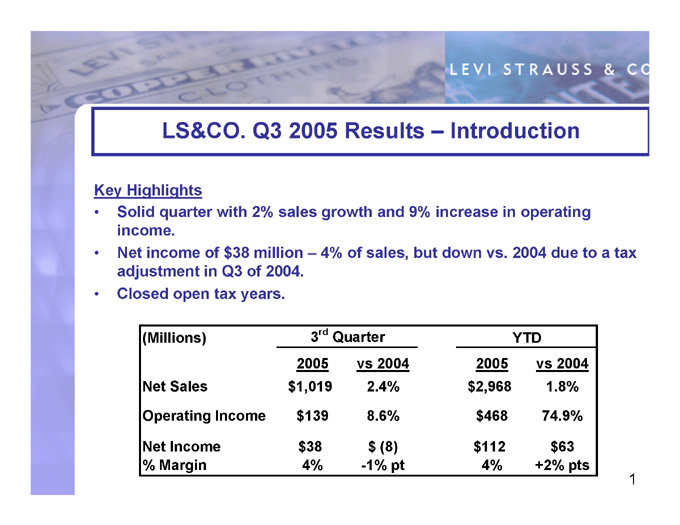
Key Highlights
Solid quarter with 2% sales growth and 9% increase in operating income.
Net income of $38 million – 4% of sales, but down vs. 2004 due to a tax adjustment in Q3 of 2004.
Closed open tax years.
3rd Quarter
YTD
(Millions)
2005
vs 2004
2005
vs 2004
$2,968
2.4%
$1,019
Net Sales
1.8%
$468
8.6%
$139
Operating Income
74.9%
$112
$ (8)
$38
Net Income
$63
4%
-1% pt
4%
% Margin
+2% pts
1
LS&CO. Q3 2005 Results – Net Sales to Net Income
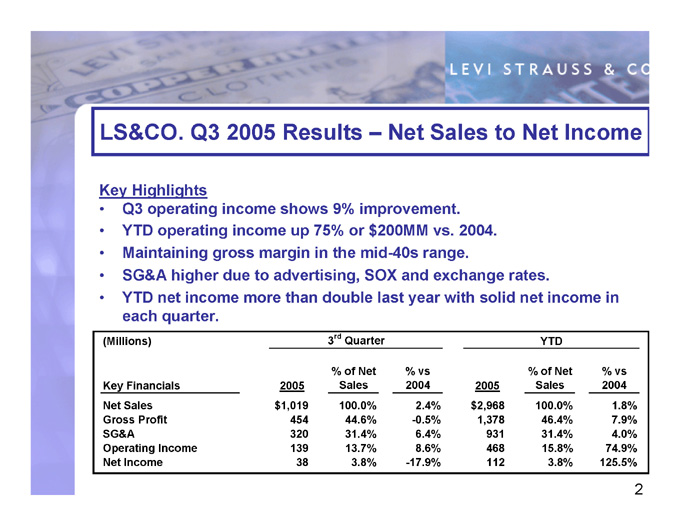
Key Highlights
Q3 operating income shows 9% improvement.
YTD operating income up 75% or $200MM vs. 2004.
Maintaining gross margin in the mid-40s range.
SG&A higher due to advertising, SOX and exchange rates.
YTD net income more than double last year with solid net income in each quarter.
3rd Quarter
YTD
(Millions)
% of Net
% vs
% of Net
% vs
Sales
2004
Sales
2005
2005
Key Financials
2004
100.0%
$2,968
2.4%
100.0%
$1,019
Net Sales
1.8%
46.4%
1,378
-0.5%
44.6%
454
Gross Profit
7.9%
31.4%
931
6.4%
31.4%
320
SG&A
4.0%
15.8%
468
8.6%
13.7%
139
Operating Income
74.9%
3.8%
112
-17.9%
3.8%
38
Net Income
125.5%
2
LS&CO. Q3 2005 Results – SG&A
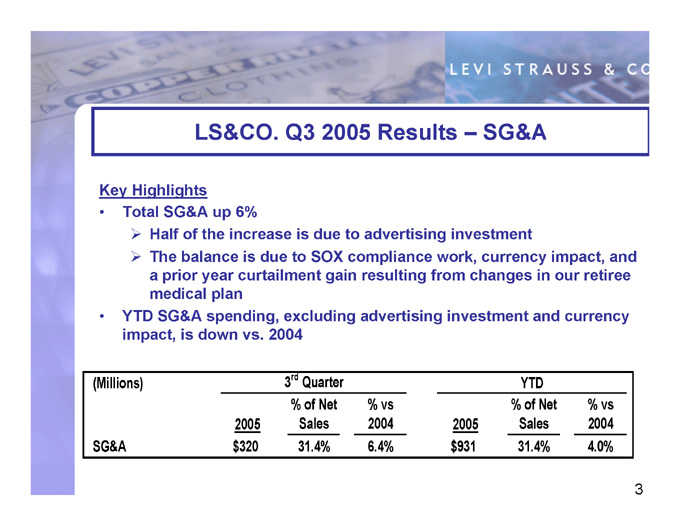
Key Highlights
Total SG&A up 6%
Half of the increase is due to advertising investment
The balance is due to SOX compliance work, currency impact, and a prior year curtailment gain resulting from changes in our retiree medical plan
YTD SG&A spending, excluding advertising investment and currency impact, is down vs. 2004
3 rd Quarter
YTD
(Millions)
% vs
% of Net
% vs
% of Net
Sales
2004
Sales
2005
2005
2004
4.0%
31.4%
$931
6.4%
31.4%
$320
SG&A
3
LS&CO. Q3 2005 Results – YTD Cash Flow vs. 2004
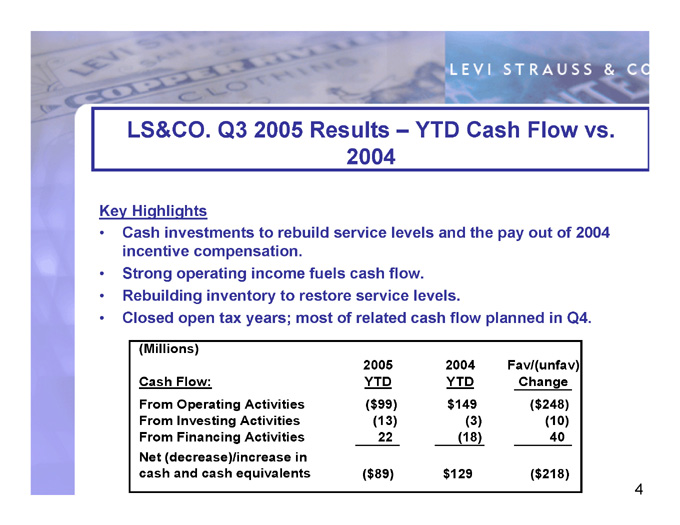
Key Highlights
Cash investments to rebuild service levels and the pay out of 2004 incentive compensation.
Strong operating income fuels cash flow.
Rebuilding inventory to restore service levels.
Closed open tax years; most of related cash flow planned in Q4.
(Millions)
2004
2005
Fav/(unfav)
YTD
YTD
Cash Flow:
Change
$149
($99)
From Operating Activities
($248)
(3)
(13)
From Investing Activities
(10)
(18)
22
From Financing Activities
40
Net (decrease)/increase in
($218)
$129
($89)
cash and cash equivalents
4
LS&CO. Q3 2005 Results – Inventory
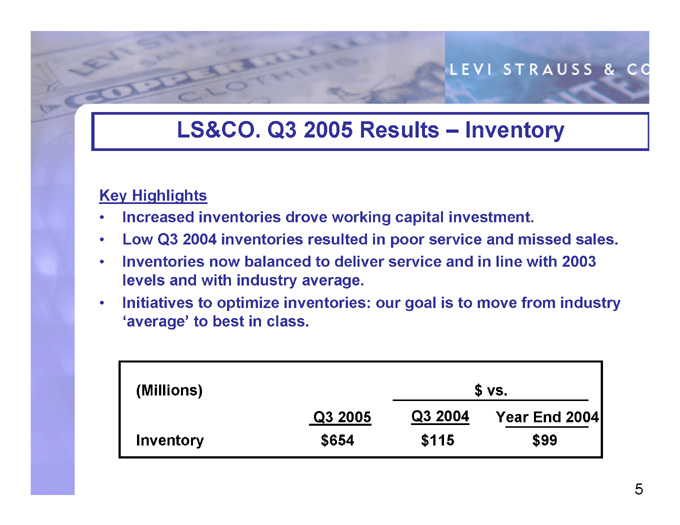
Key Highlights
Increased inventories drove working capital investment.
Low Q3 2004 inventories resulted in poor service and missed sales.
Inventories now balanced to deliver service and in line with 2003 levels and with industry average.
Initiatives to optimize inventories: our goal is to move from industry ‘average’ to best in class.
(Millions)
$ vs.
Year End 2004
Q3 2005
Q3 2004
$115
$654
Inventory
$99
5
LS&CO. Q3 2005 Results – Business Unit Performance
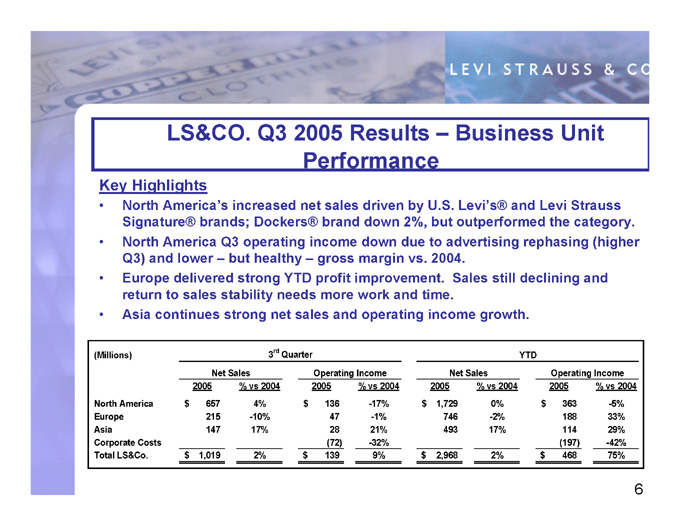
Key Highlights
North America’s increased net sales driven by U.S. Levi’s® and Levi Strauss Signature® brands; Dockers® brand down 2%, but outperformed the category.
North America Q3 operating income down due to advertising rephasing (higher Q3) and lower – but healthy – gross margin vs. 2004.
Europe delivered strong YTD profit improvement. Sales still declining and return to sales stability needs more work and time.
Asia continues strong net sales and operating income growth.
3 rd Quarter
YTD
(Millions)
Operating Income
Net Sales
Operating Income
Net Sales
% vs 2004
2005
% vs 2004
2005
% vs 2004
2005
% vs 2004
2005
$ 363
0%
$ 1,729
-17%
$ 136
4%
$ 657
North America
-5%
188
-2%
746
-1%
47
-10%
$ 215
Europe
33%
114
17%
493
21%
28
17%
147
Asia
29%
(197)
-32%
(72)
Corporate Costs
-42%
75%
$ 468
2%
$ 2,968
9%
$ 139
2%
$ 1,019
Total LS&Co.
6
LS&CO. Q3 2005 Results – Key Conclusions
Solid quarter and continued progress in building financial strength.
Net sales stability to modest growth.
Healthy gross margin in the mid-40s.
Strong and improved profitability: operating and net income.
Resolutions of ’86 –’99 tax years and bond refinancing.
7