QuickLinks -- Click here to rapidly navigate through this document
SECURITIES AND EXCHANGE COMMISSION
Washington, D.C. 20549
FORM 6-K
Report of Foreign Issuer
Pursuant to Rule 13a-16 or 15d-16 of
the Securities Exchange Act of 1934
For the month of March, 2003
FALCONBRIDGE LIMITED
(Translation of registrant's name into English)
BCE Place, Suite 200, 181 Bay Street
Toronto, Ontario
M5J 2T3
(Address of principal executive offices)
[Indicate by check mark whether the registrant files or will file annual reports under cover Form 20-F or Form 40-F]
Form 20-F o Form 40-F ý
[Indicate by check mark whether the registrant by furnishing the information contained in this Form is also thereby furnishing the information to the Commission pursuant to Rule 12g3-2(b) under the Securities Exchange Act of 1934.]
Yes ý No o
[If "Yes" is marked, indicate below the file number assigned to the registrant in connection with Rule 12g3-2(b): 82-3920.
Pursuant to the requirements of the Securities Exchange Act of 1934, the registrant has duly caused this report to be signed on its behalf by the undersigned, thereunto duly authorized.
| FALCONBRIDGE LIMITED (Registrant) | |||
March 21, 2003 | By: | /s/ P. D. LAFRANCE P. D. Lafrance — Assistant Secretary | |

FALCONBRIDGE LIMITED
Annual Report 2002
ENVISIONING OPPORTUNITIES
OUR OPERATIONS
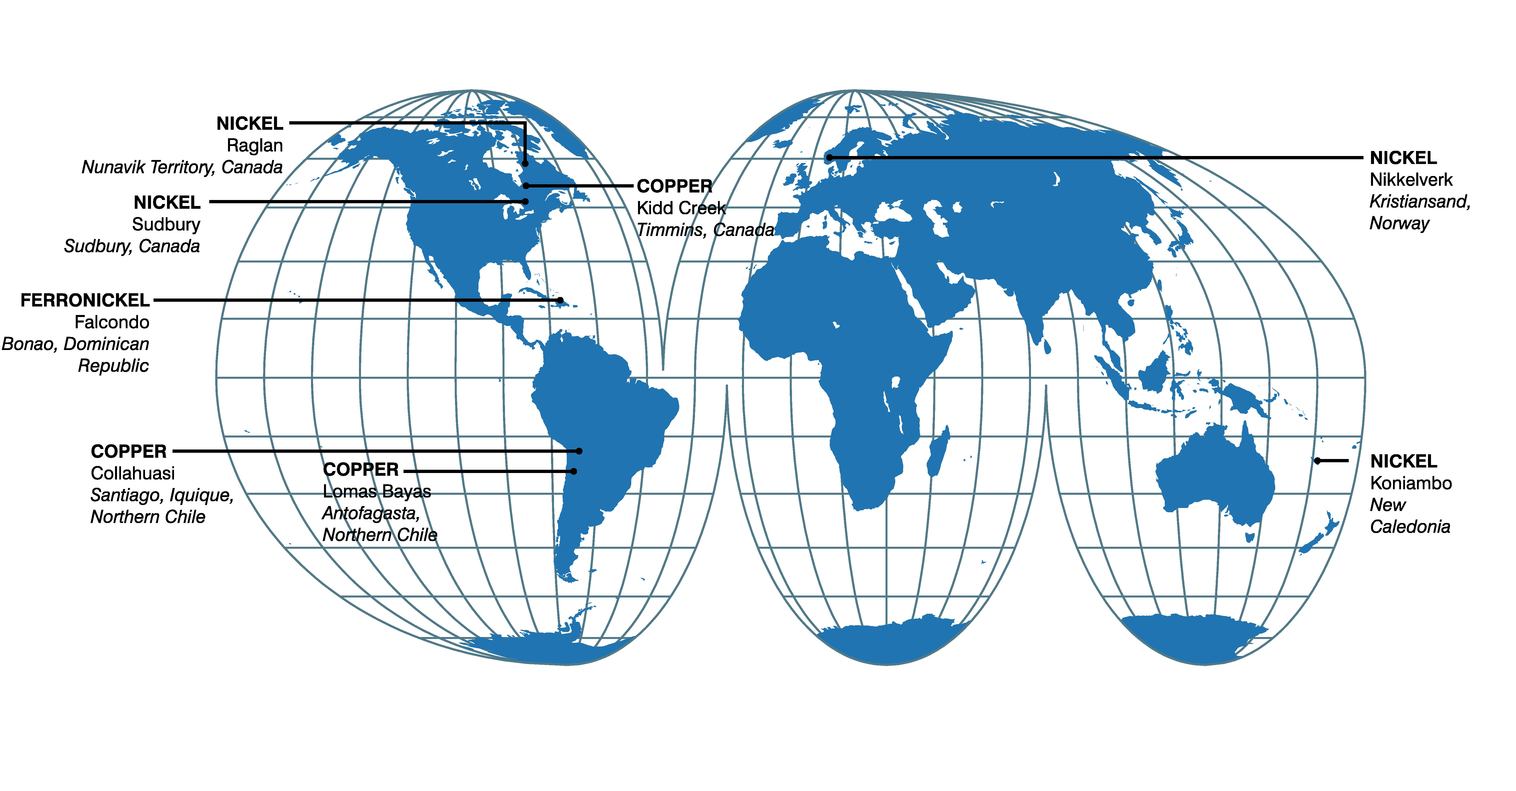
NICKEL
Sudbury (Sudbury, Ontario)
- •
- Mines and mills nickel-copper ores from four mines (Craig, Fraser, Lindsley and Lockerby); smelts nickel-copper concentrate from Sudbury's mines and from Raglan, and processes custom feed materials.
Raglan (Rouyn-Noranda, Nunavik, Quebec)
- •
- Mines and mills nickel-copper ores from open pits and an underground mine.
Nikkelverk A/S (Kristiansand, Norway)
- •
- Refines nickel, copper, cobalt, precious and platinum group metals from Sudbury, Raglan and from custom feeds.
Falconbridge Dominicana, C. por A. (85.26%) (Bonao, Dominican Republic)
- •
- Mines, mills, smelts and refines its own nickel laterite ores.
Custom Feed (Brussels, Belgium; Pittsburgh, Pennsylvania; Christ Church, Barbados)
- •
- Acquires custom feeds for processing in Sudbury and Nikkelverk.
COPPER
Compañia Minera Doña Ines de Collahuasi S.C.M. (44%) (Santiago, Iquique and Northern Chile)
- •
- Mines and mills copper sulphide ores into concentrate; mines and leaches copper oxide ores to produce cathodes.
Kidd Mining Division (Timmins, Ontario)
- •
- Mines copper-zinc ores from the Kidd Mine.
Kidd Metallurgical Division (Timmins, Ontario)
- •
- Mills, smelts and refines copper-zinc ores from the Kidd Mine and processes Sudbury copper concentrate and custom feed materials, including some Collahuasi feed.
Compañia Minera Falconbridge Lomas Bayas (Antofagasta and Northern Chile)
- •
- Mines copper oxide ores from an open pit; refines into copper cathode through the solvent extraction-electrowinning process (SX-EW).
CORPORATE
Corporate Office (Toronto, Ontario)
Project Offices (Kone and Noumea, New Caledonia; Brisbane, Australia)
Exploration Offices (Sudbury, Timmins and Toronto, Ontario; Laval, Quebec; Pretoria, South Africa; Belo Horizonte, Brazil; Brisbane, Australia)
Business Development (Toronto, Ontario)
- •
- Searches worldwide for attractive investment opportunities to support Falconbridge's business plans.
Marketing and Sales (Brussels, Belgium; Pittsburgh, Pennsylvania; Tokyo, Japan)
- •
- Markets and sells nickel, cobalt and other Falconbridge products worldwide.
Technology
- •
- Conducts research, development and engineering at all operation sites.
Falconbridge is a leading low-cost producer of nickel, copper, cobalt and platinum group metals. We are also a major recycler and processor of metal-bearing materials. Falconbridge is committed to improving shareholder returns through the responsible and profitable growth of our core nickel and copper businesses. We will accomplish this by focusing on high-quality and long-life ore bodies, by optimizing returns from our current assets, and by preparing to take advantage of market opportunities when they present themselves.
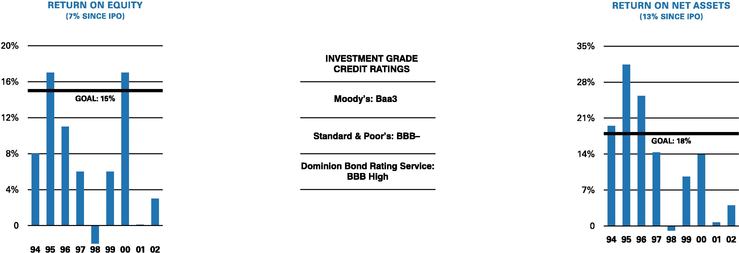
We target a minimum after-tax return on equity of 15% and an 18% return on net assets. Falconbridge entered the mining business in 1928 and today employs 6,400 people in 13 countries. Our common shares are listed on the Toronto Stock Exchange under the symbol FL. As of December 31, 2002, Falconbridge was owned by Noranda Inc. of Toronto (59.5%) and by other investors (40.5%).
FALCONBRIDGE LIMITED 2002 ANNUAL REPORT / PAGE 1
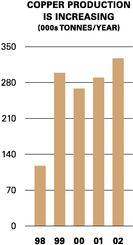
Falconbridge advanced its development programs at Collahuasi, Kidd Creek
and Lomas Bayas, ensuring that our copper production levels are maintained
for the next 20 years. Now, our focus turns to growth opportunities
in nickel, including the advancement of the Koniambo, Nickel Rim South,
Montcalm and Fraser Morgan projects.
- •
- Construction began on new grinding circuit at Ujina concentrator as part of the Ujina to Rosario transition project, increasing Collahuasi's concentrator design capacity to 110,000 tonnes per day and compensating for expected decline in ore grade in coming years.
- •
- Development work at Kidd Mine D continued on schedule and on budget, with shaft sinking, ramp development and hoist installation underway. Production expected to begin in late 2004.
- •
- Lomas Bayas had record year, producing 59,300 tonnes of copper.
- •
- Exceptional drill results released from Nickel Rim South property in Sudbury. Current resource estimates stand at 6.3 million tonnes grading 1.7% nickel and 3.4% copper, with significant showings of platinum and palladium.
- •
- Montcalm feasibility study neared completion. If approved, production could begin in late 2004, adding 8,000 tonnes of nickel production annually.
- •
- Koniambo project advanced with completion of pre-feasibility study. Bankable feasibility study will begin later in 2003, positioning partners to make development decision in late 2004.
- •
- Falconbridge and Noranda intensified efforts to improve operational and financial performances of North and South American copper businesses and corporate office activities. Working together, cost savings of $8 million have been identified, with further savings anticipated.
- •
- Over 375 employees received Six Sigma training and stage-gate process introduced to enhance efficiency and effectiveness of allocation and management of capital expenditures, to ensure returns are maximized.
FALCONBRIDGE LIMITED 2002 ANNUAL REPORT / PAGE 2
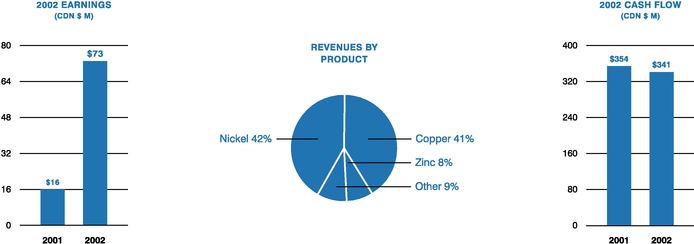
2002 FINANCIAL HIGHLIGHTS
The world economic expansion continued but at a much slower pace than originally anticipated. Nickel outperformed all other base metals, with prices rising 25% over the year. While Western demand for copper remained weak, the market outlook is improving. For 2003, we are cautiously optimistic that we will realize higher metal prices on the back of an economic recovery in the second half of the year.
| MILLIONS, EXCEPT PER SHARE DATA | 2002 | 2001 | ||||
|---|---|---|---|---|---|---|
| OPERATING HIGHLIGHTS | ||||||
| Revenues | $ | 2,394 | $ | 2,138 | ||
| Operating income | 137 | 26 | ||||
| Earnings | 73 | 16 | ||||
| Cash provided by operating activities | 341 | 354 | ||||
| Capital expenditures and deferred project costs | 358 | 348 | ||||
FINANCIAL POSITION AT DECEMBER 31 | ||||||
| Cash and cash equivalents | 260 | 198 | ||||
| Working capital | 627 | 482 | ||||
| Total assets | 5,204 | 5,069 | ||||
| Long-term debt | 2,023 | 1,867 | ||||
| Shareholders' equity | 2,285 | 2,280 | ||||
| Return on common shareholders' equity | 3% | 0% | ||||
| Return on net assets | 4% | 1% | ||||
| Ratio of net debt to net debt plus equity | 44% | 42% | ||||
PER COMMON SHARE | ||||||
| Earnings | $ | 0.34 | $ | 0.02 | ||
| Cash provided by operating activities | 1.86 | 1.93 | ||||
| Book value | 11.75 | 11.76 | ||||
| Shares outstanding | 177.6 | 177.0 | ||||
FALCONBRIDGE LIMITED 2002 ANNUAL REPORT / PAGE 3
Aaron Regent, our new President and Chief Executive Officer, provides an outlook for nickel and copper, and outlines the progress our operations made on improving their performance, as well as his strategy for increasing shareholder value at Falconbridge.
FALCONBRIDGE LIMITED 2002 ANNUAL REPORT / PAGE 4
The past year was a challenging one for Falconbridge as we continued to adapt to and operate in an uncertain economic climate. This uncertainty negatively impacted demand for some of our products, leading to depressed metal prices, particularly for copper and zinc. Lower treatment charges for purchased concentrates at our Kidd Metallurgical facilities also impacted our profitability. The bright spot was nickel where positive fundamentals supported the nickel price over the course of the year.
As we look forward, we are optimistic that we will begin to see a broader recovery in metal prices. However, the timing of this recovery will be dependent on an overall improvement in the economy and resolution of uncertainty in the Middle East. In the longer term, we are very optimistic about the future for both nickel and copper due to positive demand growth rates and the increased challenge the industry faces in profitably adding new supply.
Our focus continues to be on nickel and copper, which offer the best fundamentals of all the base metals. Future demand is expected to be strong, particularly from China. Over the past five years, China has surpassed the United States as the world's largest consumer of copper, with consumption growing by 14% annually. China's nickel consumption has also grown rapidly, increasing by 17% annually. These growth rates are expected to continue as China develops its infrastructure and increases its consumption of durable goods. To meet its requirements, China must continue importing substantial quantities of both copper and nickel.
2002 PERFORMANCE VERSUS
OBJECTIVES
OBJECTIVE 1
Forge stronger links with potential partners in the mining industry and accelerate the delivery of additional synergies with Noranda
PERFORMANCE
Closer ties with Noranda established and further links developed with numerous junior exploration companies on nickel and pgm properties
OBJECTIVE 2
Advance development of Kidd Mine D and keep project on budget and on schedule
PERFORMANCE
Kidd Mine D remains on target to begin production in late 2004
OBJECTIVE 3
Achieve annual copper production rate of 58,000 tonnes at Lomas Bayas
PERFORMANCE
Lomas Bayas produced a record 59,300 tonnes of copper cathode in 2002
The mining industry's ability to meet future demand will become an increasing challenge. Expansion of current nickel production is limited and therefore future demand must be met with new projects. Copper expansion is possible but will largely compensate for a decrease in ore grades. For both nickel and copper, new projects are limited and the large size and scale of these projects, along with more stringent environmental standards, will increase the time required to construct and bring them into operation.
Falconbridge is well positioned to benefit from this positive outlook. We have a substantial asset base of high-quality copper and nickel operations with upside potential. We also have one of the most promising nickel projects in the world at Koniambo. And in copper, Collahuasi has further expansion potential.
Our strategy is to maximize the returns from our existing operations, advance the development of new growth opportunities in nickel and copper, and to maintain a strong financial position. Our fundamental goal is to maximize returns for shareholders with a 15% return on equity target.
In 2002, we made meaningful progress toward achieving these goals.
FALCONBRIDGE LIMITED 2002 ANNUAL REPORT / PAGE 5
Maximizing returns from existing assets
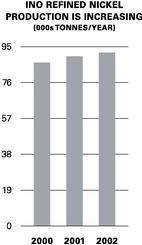
Refined nickel production from our Integrated Nickel Operations (INO) was 68,500 tonnes. Production was affected by lower volumes of available feeds and was below our annual refining capacity of 85,000 tonnes. We are focused on increasing the utilization rates of our smelting and refining facilities by increasing production from our own assets, acquiring additional properties and custom feeds, and by adding reserves, particularly in Sudbury and Raglan, through exploration.
The Nickel Rim South discovery continues to reinforce the potential of the Sudbury Basin and will help us maintain our current production levels into the future. The Montcalm property, acquired in 2001, is moving forward and a development decision is expected in 2003. When in operation, Montcalm will add 8,000 tonnes of nickel annually, beginning in late 2004.
In 2003 we expect our INO production to increase to 72,000 tonnes and to 77,000 tonnes in 2004. While still short of our goal, we are closing the gap.
Falcondo's profitability continues to be negatively impacted by high oil prices. Our efforts are focused on increasing energy efficiency to help manage these costs. In 2003 we expect to increase Falcondo's production by 15% to 27,000 tonnes.
In copper, we achieved record levels of production — 13% higher than last year — at a very competitive consolidated cash cost of U.S.$0.42 per pound.
2002 PERFORMANCE
VERSUS OBJECTIVES (CONT'D)
OBJECTIVE 4
Ensure Koniambo is in position to complete bankable feasibility study in 2003
PERFORMANCE
Bankable feasibility study scheduled for third quarter of 2003
OBJECTIVE 5
Begin expansion of Collahuasi milling capacity in line with market needs
PERFORMANCE
Construction of new grinding circuit at Ujina concentrator approved in late 2002 and mechanical completion scheduled for June 2004
OBJECTIVE 6
Fill INO capacity with most profitable feeds
PERFORMANCE
Accessed profitable feeds from Sudbury mines, Raglan and custom feeds
OBJECTIVE 7
Continue to increase INO reserve base
PERFORMANCE
Nickel Rim South, Fraser Morgan and Montcalm added to Sudbury's resources
Over the next two years we are investing significant capital in our copper assets to further develop available resources and maintain our current production levels. At Collahuasi, the transition project and mill expansion remains on schedule with completion targeted for mid-2004. Once finished, production levels will be restored to around the 400,000-tonne level. At Kidd, the development of Mine D is 40% complete and will be finished in late 2004. Mine D will extend the mine life of Kidd to 2024.
Improving returns
We are also focused on making our operations more efficient. Six Sigma, a performance-enhancing program made famous by General Electric, is now being widely applied across Falconbridge. To date, over 375 people have received training and that number will expand to over 600 by the end of 2003. We are also using Six Sigma tools to improve the selection and management of capital expenditures.
FALCONBRIDGE LIMITED 2002 ANNUAL REPORT / PAGE 6
In addition, we are working more closely with Noranda to capture cost-saving opportunities and operational enhancements. In Toronto, we are sharing corporate support services to reduce costs. To improve efficiencies at our Kidd Metallurgical facilities, we are working closely with Noranda's Horne smelter and CCR copper refinery to coordinate operating activities, as well as feed procurement and supplies, and to share our technical and operating resources. In South America, our Lomas Bayas copper mine is working closely with Noranda's Altonorte copper smelter to achieve synergies in logistics, procurement and sulphuric acid. We have identified savings for Falconbridge of $8 million annually, with further benefits anticipated.
Growth opportunities — Koniambo
The most significant growth opportunity in our nickel business is the development of the Koniambo property. Koniambo is a world-class resource and on completion, it would increase Falconbridge's nickel production by 30,000 tonnes per year.
The pre-feasibility study is largely completed and it continues to support the attractive economics of the project. A bankable feasibility study will begin in the third quarter of 2003, with a development decision expected in late 2004.
Our financial position
During the year, debt levels increased but our liquidity remains high. We renewed our corporate credit facilities, as well as our Lomas Bayas and Collahuasi project loans, and accessed the U.S. debt markets successfully, issuing new 10-year corporate debentures.
- •
- Achieve efficiency, production and cost objectives set by each operation
- •
- Increase asset utilization within INO by increasing profitable feed volumes
- •
- Review Montcalm feasibility study and make development decision on this nickel deposit
- •
- Begin Koniambo bankable feasibility study
- •
- Grow nickel resource base through exploration, acquisitions, business partnerships and technology
- •
- Improve profitability of Kidd through cooperative activities with Horne smelter and CCR refinery
- •
- Advance development of Kidd Mine D and Collahuasi expansion and keep projects on budget and on schedule
- •
- Deliver cost savings and increased profits by working with Noranda and other mining companies
2003 OBJECTIVES
For 2003, we are optimistic that we will realize higher metal prices, particularly for nickel. With increased nickel production and copper production similar to 2002 levels, we expect an improvement in our earnings and cash flows. Capital expenditures are estimated to be $600 million and will be funded by increased cash flow from operations, cash on hand and credit facilities. Current debt levels are higher than our targets but continue to be manageable, particularly against a backdrop of improved metal prices. Our objective is to maintain our investment grade rating. Should the anticipated improvement in metal prices not materialize, consideration will be given to deferring some expenditures into future years.
Conclusion
The future for Falconbridge is bright. We are positioned to benefit from an improvement in future metal prices and continue to develop attractive growth opportunities. We remain committed to responsibly maximize the returns we deliver to shareholders. Our ability to deliver on this objective comes down to the thousands of people working within the company. I want to take this opportunity to thank them for their dedication, support and enthusiasm.
FALCONBRIDGE LIMITED 2002 ANNUAL REPORT / PAGE 7

Aaron Regent
President and
Chief Executive Officer
FALCONBRIDGE LIMITED 2002 ANNUAL REPORT / PAGE 8
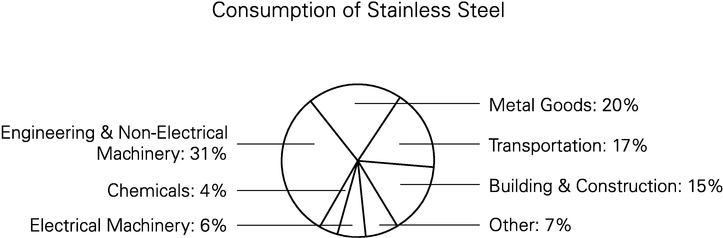
Jet engines, power plants, medical instruments, satellites, electronics.
All these things have one element in common:nickel. World consumption
of nickel, which is mainly used by stainless steel makers, is increasing
at an exceptional rate. Falconbridge is well positioned to take advantage
of these tremendous opportunities.
FALCONBRIDGE LIMITED 2002 ANNUAL REPORT / PAGE 9

FALCONBRIDGE LIMITED 2002 ANNUAL REPORT / PAGE 10
WE UNCOVERED ONE OF THEHIGHEST GRADE
DEPOSITS EVER FOUNDIN THE SUDBURY
BASIN AT NICKEL RIM SOUTH.
The discovery is just one of many exciting nickel projects we're working on.
Our portfolio also includes Koniambo, Montcalm and Fraser Morgan.
Together, these projects will help Falconbridge increase its production of nickel
to meet the growing global demand for this important metal.
FALCONBRIDGE LIMITED 2002 ANNUAL REPORT / PAGE 11
Nickel Rim South yields exceptional drill results
A key focus is to increase Falconbridge's ore reserve base. By refocusing our efforts on small and medium size targets in the Sudbury Basin, we've identified two key properties near our existing facilities. Nickel Rim South's resources now stand at 6.3 million tonnes grading 1.7% nickel and 3.4% copper, with significant showings of platinum and palladium. By the end of June 2003, we should be in a position to decide whether to move forward with shaft sinking. We are also encouraged by an underground exploration drilling program we have underway near the Fraser Morgan resource.
Integrated Nickel Operations (INO) aim to profitably optimize smelting and refining capacities
In order to meet this challenge, we must intensify our focus on securing ownership of resources and custom feed. This objective will be met through resource acquisition, joint ventures, exploration opportunities, the further optimization of Raglan and growth in custom feeds.
The Montcalm property near Timmins is another attractive property in our portfolio. Montcalm's feasibility study is nearing completion and if approved, production could begin to flow into the refinery starting in late 2004 which would add 8,000 tonnes of nickel production annually.
Nickel objectives for 2003
- •
- Achieve efficiency, production and cost objectives set by each operation
- •
- Increase asset utilization within INO by increasing volumes from Sudbury, Raglan and custom feeds
- •
- Review Montcalm feasibility study and make development decision
- •
- Begin Koniambo bankable feasibility study
- •
- Grow nickel resource base through acquisitions, exploration, business partnerships and technology
REFINED NICKEL
PRODUCTION IS INCREASING
(000s TONNES/YEAR)
FALCONBRIDGE LIMITED 2002 ANNUAL REPORT / PAGE 12
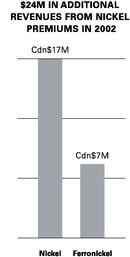
Falcondo is a major producer of ferronickel and provides a direct link to stainless steel markets
With the rapid growth in stainless steel production, Falcondo's ferro-nickel production strongly positions us in this important market. The stand-alone nature of this facility also provides us with the flexibility to take ferronickel production out of the market during periods of low nickel prices. This enables us to manage our reserves for the long-term benefit of all of our stakeholders.
Significant progress made on advancing our New Caledonian property
The pre-feasibility study was completed this year with a bankable feasibility study to begin later in 2003, positioning Falconbridge and its joint venture partner Société Minière du Sud Pacifique (SMSP) to make a development decision in late 2004. Should it proceed, the 60,000-tonne-per-year nickel-in-ferronickel project would enter production in 2008.
The project's strength rests on the size and quality of its resource and its substantial expansion potential — at a grade of 2.15%, Koniambo represents one of the world's best undeveloped nickel laterite deposits. The choice of a proven smelting process with modern technology and equipment will help reduce project risk and will also support a rapid and successful start-up. Strongly endorsed by government and local community leaders, Koniambo will be operated respecting community, cultural and environmental values.
FALCONBRIDGE LIMITED 2002 ANNUAL REPORT / PAGE 13
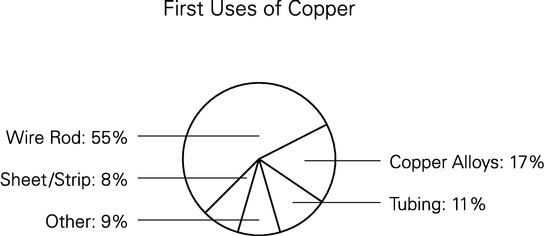
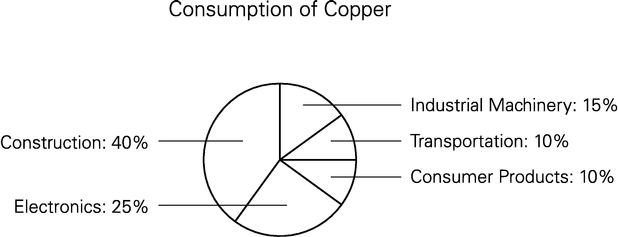
Cell phones, satellites, cars, high-speed Internet and electronics.
All these things have one element in common:copper. World consumption
of copper is increasing at a healthy rate of over 3% annually.
Falconbridge is well positioned to benefit from this growth and take
advantage of market opportunities.
FALCONBRIDGE LIMITED 2002 ANNUAL REPORT / PAGE 14
FALCONBRIDGE LIMITED 2002 ANNUAL REPORT / PAGE 15
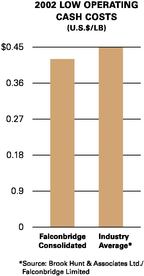
WE HAVE MAINTAINED OUR POSITION AS A
LOW-COST COPPER PRODUCER,OPERATING
BELOW THE INDUSTRY AVERAGE.
As the market outlook for copper improves, we remain focused on advancing
our development programs at our three copper operations — Kidd Creek in
northern Ontario and Collahuasi and Lomas Bayas, both located in northern Chile.
These development projects will ensure our copper production levels are
maintained for the next 20 years.
FALCONBRIDGE LIMITED 2002 ANNUAL REPORT / PAGE 16
Collahuasi posts another strong year
Collahuasi continues to be a strong performer, exceeding targeted production and operating costs. This continues a track record of exceptional performance and an impressive record of continuous improvement. Since its start-up in 1999, ore grades have fallen by 22%, but copper in concentrate production has only fallen by 3%. In addition, the oxide plant is running 20% ahead of design capacity. And, cash operating costs remain very competitive at around U.S.$0.39 per pound.
In 2002, the Collahuasi Board approved the construction of a new grinding circuit at the Ujina concentrator as part of the Ujina to Rosario transition project. This project will increase Collahuasi's concentrator design capacity to 110,000 tonnes per day from 60,000 tonnes per day, compensating for the expected decline in ore grade. The total capital cost of the project is estimated at U.S.$654 million, with Falconbridge's 44% share of this cost totalling U.S.$288 million. The project is scheduled to achieve mechanical completion in June 2004.
Copper objectives for 2003
| | | |
|---|---|---|
| • | Achieve efficiency, production and cost objectives set by each operation | |
| • | Improve profitability of Kidd Creek through cooperative activities with Horne smelter and CCR refinery | |
| • | Advance development of Kidd Mine D and Collahuasi expansion and keep projects on budget and on schedule | |
| • | Maximize production at Lomas Bayas and continue evaluation of Fortuna de Cobre development |
FALCONBRIDGE LIMITED 2002 ANNUAL REPORT / PAGE 17
Lomas Bayas producing beyond expectations
This Chilean mine has been a successful acquisition, meeting both its production and cost targets. Purchased in 2001 at 60% of its original construction cost, Lomas Bayas has continued to increase its production output and lower its costs. The potential development of the nearby Fortuna de Cobre copper deposit — which Falconbridge has the right to retain for U.S.$15 million — is currently under review. The operation recently agreed to purchase 100% of its sulphuric acid from Noranda's nearby Altonorte smelter and the two sites will continue to seek opportunities to coordinate their business activities.
Kidd Creek focuses on improving profitability
This asset, along with Noranda's Horne smelter and CCR refinery, has struggled this year as low copper and zinc prices, as well as low treatment and refining charges for feed have reduced profitability. In response, the management teams at Falconbridge and Noranda are focused on improving the overall profitability of these sites through combined cost reduction initiatives, materials management activities and capital expenditure rationalization.
At the Kidd Mine, development work at Mine D continued on schedule and on budget, with shaft sinking, ramp development and hoist installation underway. The mine will give access to an additional 10 million tonnes of reserves and 14 million tonnes of resources. Once Mine D is in full production, total Kidd Mine annual ore production will be back at the 2.4 million tonne level.
FALCONBRIDGE LIMITED 2002 ANNUAL REPORT / PAGE 18
SUMMARY OF MINERAL RESERVES AND MINERAL RESOURCES1
| Operation | Percentage Ownership | Category | Thousand Tonnes | % Nickel | % Copper | % Zinc | g/t Silver | |||||||
|---|---|---|---|---|---|---|---|---|---|---|---|---|---|---|
| MINERAL RESERVES | ||||||||||||||
| NICKEL DEPOSITS | ||||||||||||||
| Sudbury | 100% | Proven | 7,914 | 1.45 | 1.36 | — | — | |||||||
| Probable | 9,212 | 1.22 | 1.21 | — | — | |||||||||
| Total | 17,126 | 1.33 | 1.28 | — | — | |||||||||
| Raglan | 100% | Proven | 6,691 | 3.04 | 0.81 | — | — | |||||||
| Probable | 11,418 | 2.78 | 0.78 | — | — | |||||||||
| Total | 18,109 | 2.88 | 0.79 | — | — | |||||||||
| Falcondo2 | 85.26% | Proven | 52,484 | 1.19 | — | — | — | |||||||
| Probable | 11,636 | 0.96 | — | — | — | |||||||||
| Total | 64,120 | 1.15 | — | — | — | |||||||||
| COPPER DEPOSITS | ||||||||||||||
| Kidd Creek | 100% | Proven | 13,409 | — | 2.01 | 5.77 | 76 | |||||||
| Probable | 10,285 | — | 2.25 | 6.98 | 54 | |||||||||
| Total | 23,694 | — | 2.11 | 6.30 | 66 | |||||||||
| Lomas Bayas | 100% | Proven | 77,914 | — | 0.37 | — | — | |||||||
| Probable | 319,435 | — | 0.31 | — | — | |||||||||
| Total | 397,349 | — | 0.32 | — | — | |||||||||
| Collahuasi2 | 44% | Proven | 310,254 | — | 1.02 | — | — | |||||||
| Probable | 1,528,494 | — | 0.90 | — | — | |||||||||
| Total | 1,838,748 | — | 0.92 | — | — | |||||||||
| MINERAL RESOURCES (in addition to mineral reserves) | ||||||||||||||
| NICKEL DEPOSITS | ||||||||||||||
| Sudbury | 100% | Measured | 85 | 2.38 | 1.27 | — | — | |||||||
| Indicated | 16,748 | 2.38 | 1.10 | — | — | |||||||||
| Total | 16,833 | 2.38 | 1.10 | — | — | |||||||||
| Inferred | 22,100 | 1.8 | 2.4 | — | — | |||||||||
| Raglan | 100% | Measured | 289 | 1.62 | 0.41 | — | — | |||||||
| Indicated | 2,587 | 1.98 | 0.76 | — | — | |||||||||
| Total | 2,876 | 1.95 | 0.72 | — | — | |||||||||
| Inferred | 3,400 | 2.7 | 0.87 | — | — | |||||||||
| Falcondo2 | 85.26% | Measured | — | — | — | — | — | |||||||
| Indicated | 13,840 | 1.53 | — | — | — | |||||||||
| Total | 13,840 | 1.53 | — | — | — | |||||||||
| Inferred | 6,400 | 1.4 | — | — | — | |||||||||
| COPPER DEPOSITS | ||||||||||||||
| Kidd Creek | 100% | Measured | — | — | — | — | — | |||||||
| Indicated | 100 | — | 2.96 | 6.79 | 50 | |||||||||
| Total | 100 | — | 2.96 | 6.79 | 50 | |||||||||
| Inferred | 14,100 | — | 3.4 | 4.9 | 91 | |||||||||
| Lomas Bayas | 100% | Measured | 13,754 | — | 0.27 | — | — | |||||||
| Indicated | 157,607 | — | 0.27 | — | — | |||||||||
| Total | 171,361 | — | 0.27 | — | — | |||||||||
| Inferred | 73,400 | — | 0.28 | — | — | |||||||||
| Collahuasi2 | 44% | Measured | 48,205 | — | 0.57 | — | — | |||||||
| Indicated | 429,766 | — | 0.63 | — | — | |||||||||
| Total | 477,971 | — | 0.63 | — | — | |||||||||
| Inferred | 1,840,000 | — | 0.72 | — | — |
Notes:
FALCONBRIDGE LIMITED 2002 ANNUAL REPORT / PAGE 19
- 1.
- The mineral reserve and resource estimates are prepared in accordance with the "CIM Standards On Mineral Resources and Mineral Reserves, Definitions And Guidelines", adopted by CIM Council on August 20, 2000, using classical and/or geostatistical methods, plus economic and mining parameters appropriate to each project.
- 2.
- The mineral reserves and resources at Collahuasi and Falcondo are shown on a 100% basis.
There are no known environmental, permitting, legal, taxation, political or other relevant issue that would materially affect the estimates of the mineral reserves.The mineral resources have reasonable prospects for economic extraction but have not yet had complete formal evaluation, or do not have demonstrated economic viability under current conditions. The mineral reserve and mineral resource estimates are compiled and verified by Chester Moore, Director, Mineral Reserve Estimation and Reporting, a member of the Professional Geoscientists of Ontario with 30 years experience as a geologist.
The mineral reserves and resources at Collahuasi are estimated and provided by the operator of the joint venture based on a copper price of $U.S.0.95. They are estimated and classified to industry standards following the Australasian Institute of Mining and Metallurgy's Joint Ore Reserve Committee code. These estimates have been restated to conform to the latest CIM mineral reserve and resource definitions. The estimates are inspected annually by Chester Moore.
MANAGEMENT'S DISCUSSION AND ANALYSIS
In 2002, as a result of higher metal prices and higher sales volumes, Falconbridge achieved net earnings of $73.4 million as compared to $16.0 million in 2001. Cash flow from operations before working capital changes was $411.5 million compared with $258.3 million in 2001. Our objective is to deliver a 15% return on equity to shareholders over the commodity price cycle.
OVERVIEW
Falconbridge's strategy remains focused on the exploration, development and production of nickel and copper metals. This is based on nickel's and copper's positive fundamentals and high growth rates, as well as Falconbridge's strong competitive position.
Over the cycle, our financial objective is a 15% return on equity and an 18% return on net assets. Our objective is to maintain a conservative capital structure and investment grade credit ratings.
In 2002, as a result of higher metal prices and higher sales volumes, Falconbridge achieved net earnings of $73.4 million as compared to $16.0 million in 2001. Cash flow from operations before working capital changes was $411.5 million compared with $258.3 million in 2001.
Since the Initial Public Offering (IPO) in 1994, Falconbridge has achieved an average return on net assets of 13%, which is below our 18% target. Low metal prices negatively impacted our returns particularly for copper, where substantial amounts of new capital have been invested from 1998 to 2002 — a period of depressed copper prices. Over the same period, our return on equity has been 7%, again largely impacted by low metal prices.
In 2002, Falconbridge advanced its development programs at Collahuasi, Kidd Creek and Lomas Bayas, ensuring that our copper production levels are maintained for the next 20 years. In particular, work continued on the Mine D project at Kidd Creek and on the expansion of the Collahuasi mill. Going forward, our focus turns to growth opportunities in nickel, including the advancement of the Koniambo, Nickel Rim South, Montcalm and Fraser Morgan projects.
The Corporation believes that financial flexibility is important and plans for the cyclical nature of the business.
In 2002, the net debt to net debt plus equity increased to 44% from 42%. The average net debt to net debt plus equity ratio since the IPO is 31%. Working capital stood at $626.6 million and cash resources were $259.9 million at December 31, 2002.
Falconbridge has significant liquidity and financial flexibility. We have an active Canadian commercial paper program which is supported by cash and unused Credit Facilities. At December 31, 2002, the Corporation had $259.9 million of cash and cash equivalents and $153.9 million of commercial paper and
FALCONBRIDGE LIMITED 2002 ANNUAL REPORT / PAGE 20
bank borrowings outstanding. The Corporation's Credit Facilities total U.S.$415 million. In addition, the Corporation has no major debt maturities until 2005.
We are also working more closely with Noranda to capture cost-saving opportunities and operational enhancements. In Toronto, we are sharing corporate support services to reduce costs. To improve efficiencies at our Kidd Metallurgical facilities, we are working closely with Noranda's Horne smelter and CCR copper refinery to coordinate operating activities, as well as feed procurement and supplies, and to share our technical and operating resources. In South America, our Lomas Bayas copper mine is working closely with Noranda's Altonorte copper smelter to achieve synergies in logistics, procurement and sulphuric acid. We have identified savings for Falconbridge of $8 million annually, with further benefits anticipated.
Procedures are in place to record and ensure that transactions between Falconbridge and Noranda are on commercial terms. The Committee of Independent Directors of the Board of Falconbridge Limited review these transactions to ensure they are conducted on terms which are fair and equitable to Falconbridge and reflect fair market terms.
This discussion provides a review of the financial performance and position of Falconbridge for the years ended December 31, 2002 and 2001. It should be read in conjunction with the Corporation's audited financial statements and notes to those statements. All amounts are expressed in Canadian dollars, except where indicated. In addition, this discussion contains certain forward-looking statements regarding Falconbridge's businesses and operations. Actual results may differ materially from those contemplated by these statements depending on, among others, such key factors as supply and demand for metals to be produced, production levels, exchange rates and metals prices.
RESULTS OF OPERATIONS
Earnings for the year ended December 31, 2002 increased by $57.4 million (32 cents per common share) from 2001 to $73.4 million (34 cents per common share).
Operating income of $136.7 million in 2002 increased by $110.6 million from $26.1 million in 2001. The significant increase in operating income was attributable to the following factors:
- •
- Revenues for the year ended December 31, 2002 increased by $255.8 million to $2,394.0 million. The increased revenues result from higher realized prices for nickel and copper offset by lower zinc and cobalt prices; higher sales volumes for nickel, copper, zinc and cobalt which increased by 9%, 15%, 5% and 27%, respectively; and a more favourable exchange rate. Lower deliveries and lower prices for platinum and palladium offset the impact of higher sales volumes and prices of gold and silver resulting in a decrease of $66.3 million in total precious metals revenues during the year ended December 31, 2002.
- •
- Costs of metal and other product sales increased by $139.5 million.
- •
- Selling, general and administrative costs increased by $15.1 million.
- •
- Depreciation and amortization costs of $348.7 million increased by $17.9 million compared with $330.9 million in 2001.
- •
- Exploration, research and process development expenditures of $46.6 million were $9.8 million lower than in 2001.
- •
- Foreign exchange gains of $13.3 million in 2002 compared to a loss of $1.0 million in 2001.
- •
- Other expenses of $6.1 million compared with $9.3 million in 2001. The decrease in expense of $3.2 million is primarily due to a reduced loss of $9.9 million from futures/options and forward metal positions offset by an increase of $6.7 million in other expenses. The reduced loss from futures/options and forward metal positions in the current year reflects the non-recurrence of mark-to-market valuation losses recorded in 2001 on call options for nickel and copper.
Income and expenses were provided from the following non-operating sources:
- •
- Interest of $88.2 million in 2002 was $1.5 million higher than 2001. Lower interest rates were offset by slightly higher average net debt balances.
FALCONBRIDGE LIMITED 2002 ANNUAL REPORT / PAGE 21
- •
- Income and mining tax recovery of $24.8 million compared with a recovery of $75.4 million in 2001. Further details concerning income taxes can be found in note 7, page 40 of this annual report.
- •
- Losses at Falcondo in 2002 were lower than in 2001, reducing the non-controlling interest in the loss of subsidiaries by $1.1 million.
Earnings in 2002 were not affected by unusual charges as occurred in 2001. A strike at the Sudbury Operations reduced earnings in 2001 by $35.6 million. The 2001 results also included a tax benefit of $20.0 million.
The following table summarizes the results of operations for 2002 and 2001, including contributions from the reportable segments:
| | Year Ended December 31 | |||||||
|---|---|---|---|---|---|---|---|---|
| | 2002 | 2001 | ||||||
| | (Millions) | |||||||
| Nickel operations | ||||||||
| Integrated Nickel Operations (INO) | $ | 146.6 | $ | 84.6 | ||||
| Falconbridge Dominicana, C. por A. | 1.0 | (18.2 | ) | |||||
| 147.6 | 66.4 | |||||||
| Copper operations | ||||||||
| Kidd Creek Operations | (77.8 | ) | (64.0 | ) | ||||
| Collahuasi | 132.1 | 122.4 | ||||||
| Lomas Bayas | 28.0 | 7.6 | ||||||
| 82.3 | 66.0 | |||||||
| Corporate and other | (93.2 | ) | (106.4 | ) | ||||
| Operating Income | 136.7 | 26.0 | ||||||
| Interest | 88.2 | 86.6 | ||||||
| Income and mining taxes | (24.8 | ) | (75.4 | ) | ||||
| Non-controlling interest | 0.1 | 1.2 | ||||||
| Earnings for the year | 73.4 | 16.0 | ||||||
| Dividends on preferred shares | 12.6 | 12.1 | ||||||
| Earnings attributable to common shares | $ | 60.8 | $ | 3.9 | ||||
NICKEL OPERATIONS:
Falconbridge is the third-largest producer of refined nickel in the world, accounting for roughly 8% of world supply in 2002. Nickel operations include: the Integrated Nickel Operations (INO) which includes mines and plants in Sudbury and Raglan in Canada, a refinery at Nikkelverk in Norway and a significant custom feed business; and Falcondo, a ferronickel operation in the Dominican Republic.
Operating income of the nickel business was $147.6 million in 2002 compared with $66.4 million in 2001. Refined nickel production was 91,800 tonnes in 2002 compared with 89,900 tonnes in 2001. The operating cash cost per pound of nickel was U.S.$2.19 per pound for all of Falconbridge's mined nickel compared with U.S.$1.86 in 2001.
FALCONBRIDGE LIMITED 2002 ANNUAL REPORT / PAGE 22
Integrated Nickel Operations (INO)
The INO includes mines and plants in Sudbury and Raglan in Canada, a refinery at Nikkelverk in Norway and a significant custom feed business.
| | 2002 | 2001 | ||
|---|---|---|---|---|
| Sales (tonnes) | ||||
| Nickel | 71,200 | 65,200 | ||
| Copper | 54,500 | 34,500 | ||
| Cobalt | 2,900 | 2,300 | ||
| Revenues ($ millions) | 1,088 | 969 | ||
| Operating cash cost | ||||
| (U.S.$ per pound of nickel)* | 1.96 | 1.52 | ||
| Operating income ($ millions) | 147 | 85 | ||
- *
- Operating cash cost includes all cash production and selling costs, net of by-product credits, but excludes interest, corporate, exploration costs and custom feed profits. Continuing costs incurred during shutdowns or strikes are excluded.
Revenues: Sales volumes of base metals increased in 2002. In 2001, volumes were affected by reduced productivity related to a strike by the production and maintenance workers at Sudbury Operations. Realized nickel prices in 2002 increased by 13%, copper prices remained the same, and cobalt prices decreased by 27%. Precious metals revenues decreased by $74.0 million. In 2002, consolidated revenues for the INO increased to $1,088.2 million from $968.7 million in 2001.
Costs: The operating cash cost (after by-product credits) of producing a pound of nickel from the mines in the INO, was U.S.$1.96 per pound of nickel. The U.S.$0.44, or 29%, increase over 2001 costs was the result of lower by-product credits and higher unit operating costs.
Operating income: The INO's 2002 operating income was $146.6 million compared with $84.6 million for 2001. The $62.0 million increase was attributable to the impact of increased sales volumes, higher nickel prices, the Cdn$/U.S.$ exchange rate, and the impact of strike costs on 2001 results, which were partially offset by lower precious metals revenues and higher unit production costs.
Production: Ore production at the Sudbury mines was 18% higher than in 2001. Nickel in concentrate production increased from 25,200 tonnes in 2001 to 27,800 tonnes in 2002 but some of the ore tonnage increase was offset by lower ore grades. Nickel in concentrate production in Sudbury in 2003 is planned at 26,500 tonnes.
At Raglan, nickel in concentrate production in 2002 remained unchanged at 24,600 tonnes. Production of nickel in concentrate in 2003 is planned at 24,500 tonnes as it is expected that the mine will return to an annual production level of approximately 950,000 tonnes of ore from 868,000 tonnes in 2001.
Productivity at Raglan, measured by the equivalent units of metals produced per hour worked, improved by 5% as the impact of higher ore grades more than offset the decline in ore tonnage.
At the smelter, nickel in matte production increased from 54,900 tonnes to 57,900 tonnes in 2002. Production records were established for matte production during the fourth quarter. Production of nickel in matte in 2003 is planned at 57,000 tonnes.
Production of nickel at the refinery in Kristiansand was 68,500 tonnes in 2002 or roughly the same as in 2001. Based on planned increases in custom feed deliveries and forecast mine feeds, production of nickel in 2003 is planned at 72,000 tonnes. Fourth quarter 2002 production of nickel, cobalt and precious metals established new production records. These production levels confirmed the refinery's annual production capacities of 85,000 tonnes for nickel, 4,500 tonnes for cobalt and 38,000 tonnes for copper.
Productivity at the refinery, measured by the equivalent units of metals produced per hour worked, improved by 4% as a result of increased throughput.
FALCONBRIDGE LIMITED 2002 ANNUAL REPORT / PAGE 23
During 2002, a new collective agreement was reached with the production and maintenance workers at Raglan.
INTEGRATED NICKEL OPERATIONS
| | 2002 | 2001 | ||||||||||
|---|---|---|---|---|---|---|---|---|---|---|---|---|
| | Ore tonnes (x 1,000) | Ni % | Cu % | Ore tonnes (x 1,000) | Ni % | Cu % | ||||||
| Production | ||||||||||||
| Sudbury — Mine | ||||||||||||
| Craig | 980 | 1.77 | 0.57 | 892 | 1.94 | 0.69 | ||||||
| Fraser | 639 | 1.08 | 3.48 | 581 | 1.26 | 2.52 | ||||||
| Lindsley | 418 | 1.19 | 1.16 | 317 | 1.13 | 1.18 | ||||||
| Lockerby | 258 | 2.10 | 1.18 | 156 | 1.99 | 1.09 | ||||||
| Total mined | 2,295 | 1,946 | ||||||||||
| Total — ore processed | 2,295 | 1.51 | 1.56 | 1,946 | 1.61 | 1.35 | ||||||
| Raglan mine | 868 | 3.35 | 0.97 | 961 | 2.98 | 0.91 | ||||||
| | Ni | Cu | Co | Ni | Cu | Co | |||||||
|---|---|---|---|---|---|---|---|---|---|---|---|---|---|
| Metal in concentrate (tonnes) | |||||||||||||
| Sudbury mine output | 27,833 | 31,050 | 690 | 25,226 | 22,858 | 630 | |||||||
| Raglan mine output | 24,636 | 6,500 | 386 | 24,570 | 6,915 | 318 | |||||||
| Metal in copper concentrate | 94 | 21,666 | — | 60 | 14,009 | — | |||||||
| Smelter, refinery | |||||||||||||
| Smelter (tonnes) | |||||||||||||
| Mines — Sudbury | 28,243 | 11,166 | 691 | 24,534 | 8,890 | 590 | |||||||
| — Raglan | 25,211 | 6,617 | 370 | 26,914 | 7,165 | 419 | |||||||
| Custom | 4,400 | 2,735 | 894 | 3,444 | 1,837 | 779 | |||||||
| Total | 57,854 | 20,518 | 1,955 | 54,892 | 17,892 | 1,788 | |||||||
| Refinery (tonnes) | |||||||||||||
| Mines — Sudbury | 27,170 | 11,108 | 621 | 22,059 | 7,144 | 496 | |||||||
| — Raglan | 24,305 | 6,741 | 344 | 29,375 | 7,818 | 439 | |||||||
| Custom | 17,055 | 12,783 | 3,029 | 16,787 | 11,760 | 2,379 | |||||||
| Total | 68,530 | 30,632 | 3,994 | 68,221 | 26,722 | 3,314 | |||||||
| | Ni | Cu | Co | Ni | Cu | Co | |||||||
|---|---|---|---|---|---|---|---|---|---|---|---|---|---|
| Sales (tonnes) | |||||||||||||
| Mines — Sudbury | 28,035 | 34,352 | 637 | 20,104 | 15,185 | 480 | |||||||
| — Raglan | 25,250 | 6,905 | 358 | 29,419 | 7,599 | 446 | |||||||
| Custom | 17,472 | 13,238 | 1,937 | 14,696 | 11,057 | 1,365 | |||||||
| Purchased product | 396 | — | — | 1,020 | 673 | 25 | |||||||
| Total | 71,153 | 54,495 | 2,932 | 65,239 | 34,514 | 2,316 | |||||||
Reserves & exploration: The December 31, 2002 total proven and probable mineral reserves in Sudbury remained essentially unchanged at 17.1 million tonnes despite production of 2.2 million tonnes of ore during 2002. The 2002 production was replaced with an increase in reserves of 1.2 million tonnes at Craig Mine due to a lower cut-off grade, the upgrading and discovery of 0.8 million tonnes at Thayer Lindsley Mine and an additional 0.3 million tonnes due to the reinterpretation of 6 Zone at Fraser Mine.
FALCONBRIDGE LIMITED 2002 ANNUAL REPORT / PAGE 24
Exploration at Sudbury has resulted in the discovery of a new mineral resource, Nickel Rim South. Surface diamond drilling to date has defined an inferred resource consisting of 6.3 million tonnes of 1.7% nickel, 3.4% copper, 2.2 grams/tonne platinum, 2.5 grams/tonne palladium and 1.5 grams/tonne gold. A decision concerning an underground exploration program will be made in 2003. Underground drilling at Fraser Mine added 0.7 million tonnes grading 1.5% nickel and 0.4% copper in the Fraser Morgan zone. Total inferred mineral resources in Sudbury increased significantly to 22.1 million tonnes with Nickel Rim South and Fraser Mine being the main additions.
In combination with production and other reserve adjustments, the December 31, 2002 total proven and probable mineral reserves at Raglan decreased by 1.4 million tonnes, in 2002, to 18.1 million tonnes. Exploration in 2002 resulted in the discovery of approximately 0.25 million tonnes of probable mineral reserves in two individual lenses at Zone 2 and Katinniq. When added to mining gains and losses, these discoveries replaced part of the annual production of 869,000 tonnes.
Falconbridge Dominicana, C. por A. (Falcondo)
Located in the Dominican Republic, Falcondo mines, mills, smelts and refines its own nickel laterite ores. Falconbridge owns 85.26% of Falcondo.
| | 2002 | 2001 | |||
|---|---|---|---|---|---|
| Sales of ferronickel (tonnes) | 21,400 | 24,600 | |||
| Production (tonnes) | 23,300 | 21,700 | |||
| Revenues ($ millions) | 234 | 237 | |||
| Operating cash cost | |||||
| (U.S.$ per pound of nickel)* | 2.76 | 2.63 | |||
| Operating income (loss) ($ millions) | 1 | (18 | ) | ||
- *
- Excludes shutdown costs.
Revenues: Revenues at Falcondo in 2002 were $233.6 million compared with $237.8 million in 2001 as the decrease in sales to 21,400 tonnes from 24,600 tonnes offset the impact of an 11% increase in the realized ferronickel price.
Costs: Falcondo's operating cash cost per pound of ferronickel increased by 5% in 2002, to U.S.$2.76 per pound due to the increase in oil prices and costs associated with maintenance at the power plant and the electric furnaces.
Operating income: The Corporation's share of Falcondo's 2002 operating income was $0.9 million, compared with an operating loss of $18.2 million in 2001. The $19.1 million higher contribution reflects a higher ferronickel selling price which offset the impact of decreased sales volumes, higher oil costs and shutdown costs.
Production: Falcondo's planned production rate in 2003 is expected to return to normal levels of approximately 27,000 tonnes of nickel in ferronickel compared with 23,300 tonnes in 2002 and 21,700 tonnes in 2001. Production during 2002 and 2001 was reduced largely as a result of planned shutdowns.
Productivity at Falcondo, measured by the nickel units produced per hour worked, was unchanged in 2002.
Reserves & exploration: The December 31, 2002 total proven and probable mineral reserves at Falcondo increased by 3.4 million tonnes to 64.1 million tonnes. During the year, only 3.0 million tonnes of ore were mined due to a production shutdown in the early part of the year.
FALCONBRIDGE LIMITED 2002 ANNUAL REPORT / PAGE 25
COPPER OPERATIONS:
Falconbridge is also an important copper producer, ranking twelfth in the world in mined production during 2002. Our copper operations include Kidd Creek in Canada and Collahuasi and Lomas Bayas in Chile.
Operating income of the copper business was $82.3 million in 2002 compared with $66.0 million in 2001. Copper in concentrate production from the mines was 327,000 tonnes in 2002 compared with 290,000 tonnes in 2001. The operating cash cost per pound of copper was U.S.$0.42 per pound of copper compared with U.S.$0.43 per pound in 2001.
Kidd Creek Operations
Kidd Creek is engaged in the mining, milling, smelting and refining of its own copper/zinc ores and in the processing of custom feed.
| | 2002 | 2001 | ||
|---|---|---|---|---|
| Sales (tonnes) | ||||
| Copper (in metal and concentrate) | 110,600 | 105,100 | ||
| Zinc (in metal and concentrate) | 148,400 | 141,700 | ||
| Revenues ($ millions) | 534 | 505 | ||
| Operating cash cost | ||||
| (U.S.$ per pound of copper) | 0.62 | 0.74 | ||
| Operating loss ($ millions) | 78 | 64 | ||
Revenues: Revenues at the Kidd Creek Operations were $533.7 million in 2002, a 6% increase from 2001 due to higher sales volumes of copper and zinc, offset in part by lower copper and zinc prices. Relative to 2001, a higher proportion of the sales of zinc now comes from Kidd ores. As in 2001, custom feed sources account for a higher proportion of copper sales.
Costs: The operating cash cost at the Kidd Mine decreased in 2002, to U.S.$0.62 per pound of copper from U.S.$0.74 per pound of copper in 2001. The 2002 decrease is due largely to ground movement costs incurred in 2001 that were not incurred in 2002.
FALCONBRIDGE LIMITED 2002 ANNUAL REPORT / PAGE 26
Operating income: Kidd Creek Operations reported an operating loss of $78.0 million in 2002 compared with an operating loss of $64.0 million for 2001. The $14.0 million increase in the operating loss largely reflects lower metal prices at Kidd, and the impact of higher volumes of custom feed with lower profit margins.
| | 2002 | 2001 | |||||||||||||||||||
|---|---|---|---|---|---|---|---|---|---|---|---|---|---|---|---|---|---|---|---|---|---|
| | | Ore tonnes (x 1,000) | Cu % | Zn % | Ag g/t | | Ore tonnes (x 1,000) | Cu % | Zn % | Ag g/t | |||||||||||
| Production | |||||||||||||||||||||
| Kidd Mining Division | |||||||||||||||||||||
| No. 1 Mine | 902 | 1.80 | 7.78 | 92 | 703 | 1.80 | 6.75 | 78 | |||||||||||||
| No. 2 Mine | 216 | 2.87 | 0.99 | 27 | 281 | 4.05 | 0.25 | 22 | |||||||||||||
| No. 3 Mine | 1,112 | 2.11 | 5.89 | 78 | 993 | 2.11 | 5.98 | 61 | |||||||||||||
| Total mined | 2,230 | 1,977 | |||||||||||||||||||
| Total — ore processed | 2,245 | 2.12 | 5.89 | 78 | 1,950 | 2.31 | 5.38 | 61 | |||||||||||||
| | Cu | Cu Cathode | Cu Blister | Zn | Ag | Cu | Cu Cathode | Cu Blister | Zn | Ag | |||||||||||
|---|---|---|---|---|---|---|---|---|---|---|---|---|---|---|---|---|---|---|---|---|---|
| Metal in concentrate from mines | |||||||||||||||||||||
| (tonnes except 000 troy ounces of Ag) | 45,434 | — | — | 104,083 | 3,671 | 42,340 | — | — | 81,670 | 2,865 | |||||||||||
| Kidd Metallurgical Division | |||||||||||||||||||||
| (tonnes except 000 troy ounces of Ag) | |||||||||||||||||||||
| Mines | 46,945 | 44,513 | 103,609 | 2,638 | 41,758 | 46,034 | 67,399 | 2,909 | |||||||||||||
| Custom — Sudbury | 23,083 | 23,083 | — | 125 | 8,430 | 8,430 | — | 23 | |||||||||||||
| Custom — Other | 76,498 | 76,498 | 41,700 | 1,084 | 77,636 | 77,636 | 72,674 | 347 | |||||||||||||
| Total | 146,526 | 144,094 | 145,309 | 3,847 | 127,824 | 132,100 | 140,073 | 3,279 | |||||||||||||
| | Cu | Cu in conc. | Zn | Zn in conc. | Ag | Cu | Cu in conc. | Zn | Zn in conc. | Ag | |||||||||||
|---|---|---|---|---|---|---|---|---|---|---|---|---|---|---|---|---|---|---|---|---|---|
| Sales | |||||||||||||||||||||
| (tonnes except 000s troy ounces Ag) | |||||||||||||||||||||
| Mines | 47,190 | — | 103,711 | 3,007 | 2,638 | 38,758 | — | 68,997 | — | 2,909 | |||||||||||
| Custom — other | 57,553 | — | 41,700 | — | 1,085 | 66,385 | — | 72,674 | — | 347 | |||||||||||
| Purchased metal | 5,832 | — | — | — | — | — | — | — | — | — | |||||||||||
| Total | 110,575 | — | 145,411 | 3,007 | 3,723 | 105,143 | — | 141,671 | — | 3,256 | |||||||||||
Production: At the Kidd Mining Division, ore hoisted and milled in 2002 increased by 13% and 15%, respectively, from 2001 volumes. Copper metal in concentrate increased by 3,100 tonnes to 45,400 tonnes due to the higher tonnage which was offset by lower ore grades. Zinc in concentrate was also higher by 22,400 tonnes at 104,100 tonnes due to increased tonnage and improved grades. Recoveries for both zinc and copper were lower than in 2001. In 2003, copper in concentrate from the mine is expected to total 48,000 tonnes while zinc in concentrate is forecast at 95,000 tonnes.
At Kidd Metallurgical Division, numerous production records were established including: copper smelter on-line time, copper smelter feed throughput volumes, blister copper output, copper cathode production and zinc metal production. Copper blister and cathode production at 144,100 tonnes and 146,500 tonnes were 9% and 15% higher than in 2001. Zinc metal production at 145,300 tonnes was 5,200 tonnes higher than last year. Sulphuric acid production at 584,200 tonnes was 69,900 tonnes above the 2001 volume. Copper cathode production in 2003 is estimated at 132,000 tonnes while production of zinc is estimated at 145,000 tonnes.
FALCONBRIDGE LIMITED 2002 ANNUAL REPORT / PAGE 27
During 2002, a new collective agreement was reached with the production and maintenance workers at the Kidd Metallurgical Division.
Reserves & exploration: After production of 2.2 million tonnes in 2002, the December 31, 2002 total proven and probable mineral reserves decreased by 1.3 million tonnes to 23.7 million tonnes. Approximately 0.9 million tonnes of proven mineral reserves were added in 2002 by the complete re-estimation of stope blocks in No. 3 Mine.
Collahuasi
Compañia Minera Doña Inés de Collahuasi S.C.M., in which Falconbridge holds a 44% interest, operates the Collahuasi mine in northern Chile. Collahuasi mines and mills copper sulphide ores into concentrate and mines and leaches copper oxide ores to produce cathodes.
| Falconbridge share | 2002 | 2001 | |||
|---|---|---|---|---|---|
| Sales of copper (tonnes) | 187,500 | 191,900 | |||
| Production (tonnes) | 185,000 | 193,100 | |||
| Revenues ($ millions) | 386 | 366 | |||
| Operating cash cost | |||||
| (U.S.$ per pound of copper) | 0.39 | 0.38 | |||
| Operating income ($ millions) | 132 | 122 | |||
Revenues: Falconbridge's share of revenues at Collahuasi in 2002 was $386.6 million compared with $365.7 million in 2001. The increase of $20.9 million is due to an increase in the realized copper price from U.S.$0.68 a pound to U.S.$0.71 a pound.
Costs: The operating cash cost of producing a pound of copper in 2002 was U.S.$0.39 per pound compared with U.S.$0.38 in 2001 due largely to the impact of lower ore grades and recoveries.
Operating income: The Corporation's share of Collahuasi's 2002 operating income was $132.1 million compared with $122.4 million in 2001.
Production: Falconbridge's share of annual copper production totalled 185,000 tonnes, which compared with 193,100 tonnes in 2001. Falconbridge's share of cathode from the oxide plant reached 26,700 tonnes (or 20% above design capacity), while production of copper in concentrate was 158,300 tonnes. Falconbridge's share of total copper production in 2003 is forecast at 168,000 tonnes.
During the year, the Board of Directors of Compañia Minera Doña Inés de Collahuasi approved the construction of a new grinding circuit at the Ujina concentrator. This is part of the Ujina to Rosario transition project, which also involves transferring mine production from the Ujina to the Rosario ore body in June of 2004. The project will increase Collahuasi's concentrator design capacity to 110,000 tonnes per day from 60,000 tonnes per day, compensating for an expected decline in ore grade and thereby enabling Collahuasi to maintain copper production at historical levels. The total capital cost of the transition and concentrator expansion project is estimated at U.S.$654 million, with Falconbridge's 44% share of this cost totalling U.S.$288 million.
Reserves & exploration: The December 31, 2002 total proven and probable mineral reserves at Collahuasi were 1,838.7 million tonnes, down by 28.9 million tonnes. Production of 30.7 million tonnes was slightly offset by mining gains in the various ore types of 1.8 million tonnes.
FALCONBRIDGE LIMITED 2002 ANNUAL REPORT / PAGE 28
Lomas Bayas
In 2001, Falconbridge acquired Compañia Minera Falconbridge Lomas Bayas (Lomas Bayas). The results of operations have been included in the consolidated statements from that date forward. Lomas Bayas mines and leaches copper oxide ores to produce cathodes.
| | 2002 | Since acquisition 2001 | Calendar 2001 | ||||
|---|---|---|---|---|---|---|---|
| Sales of copper (tonnes) | 60,300 | 27,400 | N/A | ||||
| Production (tonnes) | 59,300 | 24,700 | 56,300 | ||||
| Revenues ($ millions) | 152 | 61 | N/A | ||||
| Operating cash cost | |||||||
| (U.S.$ per pound of copper) | 0.45 | 0.45 | N/A | ||||
| Operating income ($ millions) | 28 | 8 | N/A | ||||
N/A — not applicable.
Revenues: Falconbridge's revenues for the year 2002 were $151.9 million compared with $61.0 million from the date of acquisition to December 31, 2001.
Costs: The operating cash cost of producing a pound of copper in 2002 remained constant at the 2001 cost of U.S.$0.45 per pound.
Operating income: Lomas Bayas' 2002 operating income was $28.0 million, compared with $7.6 million from the date of acquisition to December 31, 2001.
Production: Lomas Bayas produced 59,300 tonnes of copper cathode in 2002 compared with 56,300 tonnes in calendar year 2001. Copper production in 2003 is forecast at 58,000 tonnes.
Reserves & exploration: The December 31, 2002 total proven and probable mineral reserves at Lomas Bayas decreased by 48.2 million tonnes due to mine production of 26.7 million tonnes and the decrease in the long-term copper price from U.S.$0.95 to U.S.$0.90. Much of the material dropped from the reserves was added to the mineral resources, which increased by 19.4 million tonnes.
Corporate and other
Corporate and other includes corporate costs, exploration, research and development expenditures, foreign exchange gains and losses and other income and expenses.
Corporate and other costs in 2002 of $93.2 million were $13.1 million lower than in 2001. Increases in general and administrative expenditures were offset by reductions in exploration and research and development expenditures, as well as reduced losses from futures and forward metal positions and higher foreign exchange gains. Included in other income and expenses are losses on metals trading of $4.9 million in 2002 and $14.8 million in 2001. Since implementation of the program in 1999, trading has contributed $53.1 million to pre-tax profits.
FALCONBRIDGE LIMITED 2002 ANNUAL REPORT / PAGE 29
LIQUIDITY AND CAPITAL RESOURCES
The cash position and changes in cash in each of the last two years ended December 31 are summarized below:
| | Year Ended December 31 | ||||||
|---|---|---|---|---|---|---|---|
| | 2002 | 2001 | |||||
| | (millions) | ||||||
| Cash provided by operating activities | $ | 341.4 | $ | 354.5 | |||
| Cash used in investing activities | (373.4 | ) | (448.2 | ) | |||
| Cash provided by financing activities | 93.6 | 41.6 | |||||
| Cash provided (used) during the year | 61.6 | (52.1 | ) | ||||
| Cash and cash equivalents, beginning of year | 198.3 | 250.4 | |||||
| Cash and cash equivalents, end of year | $ | 259.9 | $ | 198.3 | |||
Liquidity and cash flow
Consolidated cash and cash equivalents increased by $61.6 million to $259.9 million at December 31, 2002, compared with $198.3 million at the end of last year. These items were invested primarily in high-quality short-term money market instruments.
The Corporation has a commercial paper program. Unused lines of credit and cash on hand are used to support the commercial paper program. Borrowings against the lines of credit may be in the form of letters of credit which offset amounts available under the Credit Facility. The Corporation's Credit Facilities at December 31, 2002 totalled U.S.$415 million. As at December 31, 2002, the Corporation had borrowed U.S.$63.5 million and had drawn letters of credit totalling U.S.$36.5 million under a Credit Facility. As at December 31, 2002, the Corporation had commercial paper outstanding of U.S.$27.6 million and Cdn$10.0 million.
Working capital increased by $144.2 million to $626.6 million at the end of 2002 from $482.4 million primarily due to the impact of higher metal prices.
Cash generated from operations totalled $341.4 million compared with $354.5 million for 2001.
The ratio of current assets to current liabilities improved to 2.5:1 from 2.1:1 in 2001.
Based on planned production levels, estimated LME prices and forecasted Canadian/U.S. dollar exchange rates, it is anticipated that funds provided from operations, available cash, and proceeds from existing lines of credit will be sufficient to finance planned capital expenditures in 2003 and the dividends declared to date.
Outstanding indebtedness
Total debt increased to $2,022.5 million at December 31, 2002 from $1,867.3 million at the end of 2001. The increase was attributable to the issue of $383.4 million of new debt offset by debt repayments of $219.9 million and foreign exchange gains of $8.3 million, on U.S. dollar-denominated debt, from the strengthening of the Canadian dollar at December 31, 2002 relative to December 31, 2001. The current portion of long-term debt is $99.7 million.
The ratio of net debt (debt minus cash and temporary investments) to net debt plus equity rose to 44% at the end of 2002 from 42% in 2001.
FALCONBRIDGE LIMITED 2002 ANNUAL REPORT / PAGE 30
Capital expenditures and deferred project costs
The following table summarizes the expenditures incurred or planned for the periods indicated:
| | | Year Ended December 31 | |||||||
|---|---|---|---|---|---|---|---|---|---|
| | Planned in 2003 | ||||||||
| | 2002 | 2001 | |||||||
| | (millions) | ||||||||
| Sudbury | $ | 60 | $ | 26 | $ | 37 | |||
| Nikkelverk | 16 | 8 | 14 | ||||||
| Raglan | 35 | 37 | 47 | ||||||
| Falcondo | 18 | 22 | 23 | ||||||
| Kidd Creek | 113 | 124 | 150 | ||||||
| Collahuasi | 268 | 84 | 29 | ||||||
| New Caledonia | 32 | 32 | 33 | ||||||
| Montcalm | 62 | 5 | 12 | ||||||
| Lomas Bayas | 18 | 17 | 2 | ||||||
| Other | 5 | 3 | 1 | ||||||
| Total | $ | 627 | $ | 358 | $ | 348 | |||
Expenditures in 2002 were directed towards development of Mine D at the Kidd Mining Division, the Collahuasi transition from Ujina to Rosario, the debottlenecking of the SX/EW plant at Lomas Bayas, evaluation work at New Caledonia and to maintain and improve productive capacity at all locations.
Expenditures in 2003 will primarily be used to proceed with the continued development of Mine D at the Kidd Mining Division, the Collahuasi transition from Ujina to Rosario, the development of the Nickel Rim South deposit, continued evaluation work at New Caledonia and to maintain and improve productive capacity at all locations. Expenditures will be financed from internal sources and existing lines of credit. Capital expenditures over the next few years will be focused on providing sustaining capital for existing operations and planned developments at Mine D, the Collahuasi transition and expansions, the development of Montcalm, Nickel Rim South and New Caledonia.
Energy
In 2002, Falconbridge continued developing and implementing business processes focused on managing energy procurement from global markets and providing load response to price fluctuations. Notably, Central Energy Services located in Falconbridge, Ontario coordinates the procurement, risk management and delivery of electricity and natural gas from competitive provincial and national energy markets for four non-contiguous provincial sites. The operations in Norway, Chile and the Dominican Republic address their supply of energy with similar attention to price, risk and security of supply.
Overall, energy expenditures continue to represent a significant percentage of operating costs. During 2002, Falconbridge reduced its over all energy costs by about $5.0 million as part of its three-year 10% cost reduction plan. Nikkelverk, through ongoing efforts to improve energy intensity, achieved its lowest energy consumption per unit of production ever.
The estimated liability for future site restoration costs remained constant at $225 million at December 31, 2002 relative to the prior year-end. This estimate is based on information currently available, including preliminary closure plans and alternatives, applicable regulations, planned spending on site restoration and the remaining life of Falconbridge's ore reserves. At December 31, 2002, Falconbridge had provided $93.3 million compared with $85.2 million last year, in addition to ongoing capital and operating expenditures. The remaining balance will be accrued and expensed during the remaining lives of the operations.
Our "Report on Sustainable Development" is scheduled for release in April 2003.
FALCONBRIDGE LIMITED 2002 ANNUAL REPORT / PAGE 31
EXPLORATION AND BUSINESS DEVELOPMENT
Exploration
Falconbridge's exploration program is largely focused on nickel and platinum group metals. The mandate is to discover mineral deposits, delineate inferred/indicated mineral resources and advance them through pre-feasibility and feasibility stages. In order for a project to advance, the mineral resource is generally expected to be of strategic size, provide an after-tax return on equity of 15%, have operating costs below the industry mid-point, and be in a location with acceptable country risk. The use of joint ventures to share cost, spread risk and to increase the level of focused activity is preferred.
Exploration at Sudbury, Ontario has resulted in the discovery of a new mineral resource, Nickel Rim South. Surface diamond drilling to date has defined an inferred resource consisting of 6.3 million tonnes of 1.7% nickel, 3.4% copper, 2.2 grams/tonne platinum, 2.5 grams/tonne palladium and 1.5 grams/tonne gold. This project has entered the stage-gate process and a decision on whether or not to proceed with an underground exploration program will be made in 2003.
ADVANCED PROJECTS — Mineral Resources 1
| (December 31, 2002) Project | Resource location | Percentage ownership | Category | Million tonnes | % Nickel | % Copper | % Cobalt | % Zinc | ||||||||
|---|---|---|---|---|---|---|---|---|---|---|---|---|---|---|---|---|
| Nickel deposits | ||||||||||||||||
| Nickel Rim South 2 | Sudbury | 100% | Inferred | 6.3 | 1.7 | 3.4 | 0.03 | — | ||||||||
| Onaping Depth 2 | Sudbury | 100% | Indicated | 14.6 | 2.52 | 1.15 | 0.06 | — | ||||||||
| Inferred | 1.2 | 3.6 | 1.2 | 0.07 | — | |||||||||||
Montcalm | Ontario | 100% | Indicated | 7.0 | 1.36 | 0.67 | 0.06 | — | ||||||||
| Inferred | 0.7 | 1.7 | 0.70 | 0.07 | — | |||||||||||
Côte d'Ivoire | Ivory Coast | 85% | Indicated | 123.9 | 1.57 | — | 0.10 | — | ||||||||
| Inferred | 134 | 1.4 | — | 0.12 | — | |||||||||||
Koniambo 3 | New Caledonia | 49% | Measured | 2.2 | 2.20 | — | 0.05 | — | ||||||||
| Indicated | 118.8 | 2.15 | — | 0.06 | — | |||||||||||
| Total | 121.0 | 2.15 | — | 0.06 | — | |||||||||||
| Inferred | 190.0 | 2.1 | — | 0.08 | — | |||||||||||
Copper deposits | ||||||||||||||||
| Mine D 4 | Timmins | 100% | Inferred | 14.1 | — | 3.4 | — | 4.9 | ||||||||
Fortuna de Cobre 5 | Chile | 100% | Measured | 61.0 | — | 0.35 | — | — | ||||||||
| Indicated | 206.0 | — | 0.31 | — | — | |||||||||||
| Total | 267.0 | — | 0.32 | — | — | |||||||||||
| Inferred | 127.0 | — | 0.26 | — | — | |||||||||||
Notes:
- 1.
- The mineral resource estimates were prepared in accordance with the "CIM Standards on Mineral Resources and Mineral Reserves, Definitions and Guidelines", adopted by CIM Council on August 20, 2000, using classical and/or geostatistical methods, plus economic and mining parameters appropriate to each project.
The mineral resources have been compiled under the supervision of Chester Moore, Director, Mineral Reserve Estimation and Reporting, a member of the Professional Geoscientists of Ontario with 30 years experience as a geologist.
The mineral resources have reasonable prospects for economic extraction but have not yet had complete formal evaluation, or do not have demonstrated economic viability under current conditions.
- 2.
- Also included as part of the Sudbury mineral resources on the Mineral Reserves and Mineral Resources table.
- 3.
- Option to earn. Cut-off grade used to estimate the 2002 mineral resources was decreased to 1.5% nickel from 2.0% nickel in 2001.
FALCONBRIDGE LIMITED 2002 ANNUAL REPORT / PAGE 32
- 4.
- Also included as part of the Kidd Creek mineral resources on the Mineral Reserves and Mineral Resources table.
- 5.
- Option to purchase.
In addition to the exploration programs at Falconbridge's current operations, exploration projects are in progress in Canada, Africa, Australia and Brazil.
The table below summarizes exploration expenditures incurred or planned for the periods indicated:
| | | Year Ended December 31 | |||||||
|---|---|---|---|---|---|---|---|---|---|
| | Planned in 2003 | ||||||||
| | 2002 | 2001 | |||||||
| | (Millions of Canadian Dollars) | ||||||||
| Support of core operations in Canada | $ | 19 | $ | 19 | $ | 22 | |||
| New exploration projects in Canada | 4 | 5 | 5 | ||||||
| Collahuasi | 0 | 0 | 1 | ||||||
| Other exploration projects outside Canada | 6 | 10 | 12 | ||||||
| $ | 29 | $ | 34 | $ | 40 | ||||
Business development
A number of potential acquisition opportunities were evaluated during the course of the year. While most were rejected for failing to meet the company's investment criteria, the evaluation of a number of nickel acquisition opportunities was ongoing at year-end.
Work continued throughout the year on the Koniambo ferronickel project in New Caledonia. In 1998, Falconbridge entered into a joint venture agreement with Société Minière du Sud Pacifique S.A. and its controlling shareholder, Société de Financement et d'Investissement de la Province Nord, for the evaluation and development of a 60,000 tonne per year nickel in ferronickel mining and smelting complex. The project is based on the Koniambo deposit located in the Northern Province of New Caledonia near the provincial capital of Kone. Falconbridge has a right to earn a 49% interest in the project.
KEY ASSUMPTIONS FOR MINERAL RESOURCE AND RESERVE ESTIMATION
Refer to Summary of Mineral Reserves and Mineral Resources on page 16
Bulk density: the factor used to convert volume into tonnage. This factor is a function of the mineralogy and physical characteristics of a deposit. Formulae are developed using regression analyses on a suitably large number of individual determinations.
Cut-off grade: the grade that ensures the revenue from the metal content of the lowest grade parcel included in a deposit will be at least equal to the anticipated prime operating costs of producing this revenue. These costs include mining, milling, smelting, refining, selling and all transportation and administration costs. The cut-off grade will vary greatly from property to property due to a range of factors including deposit size and shape, metal content and prime cost structure.
Exchange rate (U.S.$ to Cdn$): 1.50
Long-term metal prices (U.S.$ per pound): Nickel $3.25, Copper $0.90, Zinc $0.50
Minimum mining width: the smallest horizontal thickness used in an estimation based on the selected mining method and the minimum opening size required by mining equipment used. The grade across this minimum width must equal or exceed the cut-off grade.
FALCONBRIDGE LIMITED 2002 ANNUAL REPORT / PAGE 33
Mining dilution*: all external material with grades lower than the cut-off grade that must be removed with the ore. The amount of this diluting material can vary considerably and depends upon mining method and the location, attitude, size, shape and wall rocks of the ore zone.
Mining recovery*: the proportion of the ore that is extracted after accounting for mining losses. The mining recovery can vary widely both within a single mine and from property to property due to a range of factors including deposit geometry and mining method.
- *
- Used for mineral reserve estimation only.
A work program leading to the production of a bankable feasibility study began in the fourth quarter of 1998. The pre-feasibility study was completed in the second half of 2002 and is currently under review. Further geological drilling has been undertaken in order to delineate a minimum of 10 years of measured resources and 15 years of indicated resources at a 2.0% nickel cut-off grade. This drilling will be completed by March 2003. The environmental impact assessment is also expected to be issued by the end of the first quarter of 2003.
U.S.$20.3 million was spent on the program in 2002, bringing the total expenditure to date to U.S.$87.5 million. It is expected that the bankable feasibility study will begin in the second half of 2003 and be completed by mid-2004. Total project cost through to the completion of the bankable feasibility study is expected to be U.S.$123 million.
A feasibility study for the Montcalm nickel-copper property located near Timmins, Ontario is now tentatively scheduled for completion during the second quarter of 2003. The study is based on a mineral resource of 7.7 million tonnes grading 1.39% nickel and 0.67% copper. Montcalm has the potential to produce 5 million tonnes at a rate of 750,000 tonnes annually. The ore would be milled and concentrated at the Kidd Metallurgical Division, and could contribute up to 8,000 tonnes annually to nickel output from the Sudbury smelter.
The world economic expansion continued in 2002, albeit at a much slower pace than originally anticipated. The base metals market surprised the bears with stronger-than-expected prices from October 2001 into the first quarter of 2002. But the rally quickly fizzled as inventories climbed and the U.S. and European economies experienced a false start. The improvement in metal prices during the fourth quarter of 2002 was based on a perception that end-use demand would improve into 2003.
On the basis of improved fundamentals, the nickel price rose 25% from the end of 2001 to reach U.S.$3.22/lb at the end of 2002. It was the only metal to have traded near its average long-term price towards the end of 2002. Refined nickel supply increased by 3.5% mainly as the result of a return to normal output for some producers and continued brownfield ramp-ups. Demand grew a healthy 5.4% on the back of average growth in stainless steel production partly due to restocking and a tight scrap supply. The positive effects of these two factors more than offset the negative growth of 1.5% in the non-stainless steel sector. In particular, the high nickel alloy and battery markets were very weak due to not only poor demand but also a destocking of inventory was necessary to realign sales with production. Consequently, the nickel market was finely balanced for the year. In addition, the nickel market received a boost by Norilsk choosing to collateralize 60,000 tonnes of nickel it held in inventory for a period of three years in exchange for a loan agreement, which was viewed as very price supportive by the market. LME stocks ended the year at 21,990 tonnes, which is seen as quite low by historical standards.
The Western World refined copper market was close to balance in 2002, as the mine production cuts announced late in 2001 flowed through directly to lower metal production the following year. The decrease in mine production resulted in the concentrate market becoming extremely tight towards the end of 2002. Refined metal production fell in 2002 corresponding to the lower availability of concentrates and a shortage of scrap, with the result that last year's large surplus shrank down significantly. The large influx of copper metal from the Eastern bloc seen in previous years disappeared in 2002 due to a combination of record
FALCONBRIDGE LIMITED 2002 ANNUAL REPORT / PAGE 34
imports of refined copper into China, and lower exports of copper metal out of Russia. Imports into China were augmented by a reported build-up in official stockpiles.
The copper market moved closer to a balanced market due to mine production cuts, rather than a recovery in demand. Copper demand remained weak in 2002. European and American demand recovery failed to occur and, in Japan, the deteriorating economic outlook has translated into continued poor demand for copper. The bright spot was Asia, which has experienced tremendous growth in demand for copper, partly due to improved economic activity and hence domestic demand, and partly due to a surge in exports, particularly to China. LME inventories increased by 57,725 from the end of last year, ending 2002 at 856,400 tonnes. On the basis of improved supply fundamentals, the LME cash settlement price for copper was U.S.$0.70 per pound at the end of December, an increase from last year.
The following table indicates the average metal price and the Canadian/U.S. dollar exchange rate realized by Falconbridge and on the London Metal Exchange in 2002 and 2001:
Average U.S. prices and Canadian/U.S. dollar exchange rates
| | | Realized by Falconbridge | London Metal Exchange | ||||||||||||
|---|---|---|---|---|---|---|---|---|---|---|---|---|---|---|---|
| | Pricing unit | ||||||||||||||
| | 2002 | 2001 | 2002 | 2001 | |||||||||||
| Nickel | pound | $ | 3.14 | $ | 2.79 | $ | 3.07 | $ | 2.70 | ||||||
| Ferronickel | pound | 3.16 | 2.85 | — | — | ||||||||||
| Copper | pound | 0.72 | 0.70 | 0.71 | 0.72 | ||||||||||
| Zinc | pound | 0.39 | 0.44 | 0.35 | 0.40 | ||||||||||
| Cobalt | pound | 7.02 | 9.66 | 6.76* | 9.29* | ||||||||||
| Average exchange rate realized U.S.$1 = Cdn$ | |||||||||||||||
| pre-hedge | 1.57 | 1.55 | |||||||||||||
| post-hedge | 1.56 | 1.52 | |||||||||||||
- *
- As perMetal Bulletin 99.3%.
As a significant portion of Falconbridge's revenues are derived from the sale of nickel, copper, cobalt and zinc, Falconbridge's earnings are directly related to fluctuations in the prices of these metals. Market prices can be affected by numerous factors beyond Falconbridge's control, including expectations for inflation, speculative activities, relative exchange rates to the U.S. dollar, global and regional demand and production, political and economic conditions and production costs in major producing regions.
In order to minimize metal price risk exposure on purchased metals, fluctuations in inventory levels, and to obtain the average LME prices, the Corporation periodically uses futures and options contracts to hedge these risks. Generally, Falconbridge does not hedge the price it realizes on the sale of its own production and accepts market prices prevailing at the time of sale. From time to time, however, the Corporation may fix the price associated with its own future production to lock in certain profits or cash flows. The Corporation may buy call options to maintain the upside potential for price movements. The Board of Directors of the Corporation has approved a policy to address the philosophy, implementation, control and limits on metal trading.
Another facet of commodity price risk involves the potential for prices to decline to sufficiently low levels, and for markets to become sufficiently uncertain, that the company decides it must reduce the carrying values of affected assets. These reductions can result from decisions to cease production at existing operations, to cancel or postpone the development of new mining projects, to reduce reserves based on lower price assumptions, or the belief that future cash flows from operating assets will be inadequate to support existing carrying values.
Fluctuations in currency exchange rates, principally the Canadian/U.S. dollar exchange rate, can significantly impact Falconbridge's earnings and cash flows. Most of Falconbridge's revenues and debt are
FALCONBRIDGE LIMITED 2002 ANNUAL REPORT / PAGE 35
denominated in U.S. dollars, whereas most of the operating costs at the Canadian sites are incurred in Canadian dollars. The costs at Falcondo, Lomas Bayas and Collahuasi are incurred mainly in U.S. dollars while Nikkelverk's costs are incurred in Norwegian kroner. From time to time, the Corporation will engage in financial risk management programs, approved by the Board of Directors, by entering into contractual arrangements which reduce exposures by creating an offsetting position. Further details are provided in note 14, page 46, of this annual report.
The business of mining and processing of metals is generally subject to a number of risks and hazards, including industrial accidents, labour disputes, unusual or unexpected geological conditions, ground conditions and phenomena such as inclement weather conditions, floods, earthquakes and the handling of hazardous substances and emissions of contaminants. Such occurrences could result in personal injury or death, damage to, or destruction of, mineral properties, processing or production facilities, or the environment, monetary losses and possible legal liability. Although Falconbridge maintains insurance against risks that are typical in the mining industry, such insurance may not provide adequate coverage under all circumstances.
In view of the uncertainties concerning future removal and site restoration costs on Falconbridge properties, the ultimate costs to Falconbridge could differ from the amounts estimated. The estimate for this future liability is subject to change based on amendments to applicable laws and legislation, the nature of ongoing operations and technological innovations. Future changes, if any, due to their nature and unpredictability, could have a significant impact and would be reflected prospectively as a change in an accounting estimate.
Falconbridge's earnings and cash flows are sensitive to changes in metal prices and the Canadian/U.S. dollar exchange rate. The following table shows the approximate impact on operating income, earnings and cash flow due to variations in these factors, based on Falconbridge's normal annual sales volumes, if the change was to remain in effect for the full year:
| | | Impact on | ||||||
|---|---|---|---|---|---|---|---|---|
| | Change in U.S.$ Realized Price | Operating Income | Earnings(a) | Cash Flow | ||||
| | ($ Millions) | |||||||
| Nickel | $0.10 per pound | 20 | 14 | 19 | ||||
| Ferronickel | 0.10 per pound | 8 | 4 | 4 | ||||
| Copper | 0.10 per pound | 108 | 71 | 102 | ||||
| Zinc | 0.05 per pound | 21 | 13 | 19 | ||||
| Cobalt | 1.00 per pound | 7 | 6 | 7 | ||||
| Platinum and Palladium | 100.00 per ounce | 19 | 13 | 18 | ||||
| Silver | 1.00 per ounce | 5 | 3 | 5 | ||||
| Exchange rate (on revenue) U.S.$1.00 = Cdn$ +/- 1¢ | 4 | 3 | 4 | |||||
- (a)
- Difference between earnings and cash flow relates to deferred tax amount.
Falconbridge periodically uses foreign exchange and options contracts to hedge the effect of exchange rate changes on identifiable foreign currency exposures and futures and option contracts to hedge the effect of price changes on a portion of the metals it sells from its mine production. The above sensitivities could accordingly be affected if such hedging programs were to be put in place.
Effective January 1, 2002, the Corporation adopted retroactively, without restatement of the prior-period comparative financial statements, the new CICA accounting standards for Stock-Based Compensation and Other Stock-Based Payments. Under this standard, the Corporation now accounts for stock options using the fair value method. Under this method, compensation expense for stock options granted since January 1,
FALCONBRIDGE LIMITED 2002 ANNUAL REPORT / PAGE 36
2002, that are direct awards of stock, is measured at the fair value at the grant date using the Black-Scholes valuation model and is recognized over the vesting period of the options granted. The effect of adopting the standard for Stock-Based Compensation and Other Stock-Based Payments was to decrease retained earnings by $0.2 million for those awards granted and outstanding before January 1, 2002. Selling, general and administrative expenses to December 31, 2002, include compensation costs of $4.0 million relating to outstanding options granted since January 1, 2002.
The global economy is expected to gain momentum in 2003, though downside risks to the global outlook are still high, particularly on the geopolitical stage. Macroeconomic fiscal and monetary policies are in place to spur demand growth, leading to further price improvement. Continued recovery in end-use demand is key for the sustainability of base metals prices.
For 2003, the nickel market is forecast to move into a deficit as nickel demand overtakes supply. Western World stainless steel production growth will be slightly lower at 4.6%, as production rates moderate, particularly in the U.S., but new expansions slated to come on-line in 2003 will require more nickel units to fill pipeline inventories. The non-stainless steel sectors will experience a modest recovery, as many industries are believed to have bottomed in 2002. If economic conditions improve more than anticipated, nickel prices can be expected to respond favourably.
For 2003, Western World copper mine production is forecast to increase sharply by about 4.5%. As a result, the concentrate market will rebalance into a slight surplus. The bulk of the increase will come from the Phase IV expansion at Escondida. For 2003, refined copper production is expected to rise modestly, as the balance of the mine production increase will go into alleviating the concentrates deficit. While strong Chinese buying is expected to continue next year, it is not expected to reach the record level of 2002, and net trade of copper metal from the East into the West will return. Following two years of negative growth in copper demand, the copper market is well positioned to take advantage of an eventual recovery in demand. A 3.9% growth rate is forecast for 2003, which will be sufficient to move the market into a deficit position.
Global demand for cobalt grew 7% in 2002 despite the lack of demand from the major end-use super alloys market. The aerospace industry is in the midst of a cyclical downturn and is not expected to see any pick-up until 2004. Overestimation of demand for land-based turbines by manufacturers as well as the financial crisis in the energy sector created by the Enron bankruptcy has resulted in significant reductions of production schedules. It is the other cobalt-consuming end-uses that performed well and contributed to growth — the tool steels sector, the electronics sector and cobalt chemicals. Demand is expected to moderate slightly next year, but will still come in at a respectable 5% growth.
The growth in demand combined with cuts in production moved the cobalt market to a deficit in 2002. In 2003, further cutbacks by existing producers are expected, but these will be more than offset by greater output from OMG's Big Hill and higher capacity as a result of modernization at the Anglovaal's Chambishi plant in Zambia. In addition, Defense Logistics Agency stockpile sales are expected to double in 2003. These releases, together with new production, will swing the market back into a surplus position for 2003.
FALCONBRIDGE LIMITED 2002 ANNUAL REPORT / PAGE 37
ACCOUNTING RESPONSIBILITIES, PROCEDURES AND POLICIES
The Board of Directors which, among other things, is responsible for the consolidated financial statements of the Corporation, delegates to management the responsibility for the preparation of the statements. Responsibility for their review is that of the Audit Committee. Each year the shareholders appoint independent auditors to audit and report directly to them on the financial statements.
In preparing the consolidated financial statements, great care is taken to use the appropriate generally accepted accounting principles and estimates considered necessary by management to present fairly and consistently the consolidated financial position and the results of operations. The principal accounting policies followed by Falconbridge are summarized on pages 37 and 38.
The accounting systems employed by Falconbridge include appropriate controls, checks and balances to provide reasonable assurance that Falconbridge's assets are safeguarded from loss or unauthorized use as well as facilitating the preparation of comprehensive, timely and accurate financial information. There are limits inherent in all systems based on the recognition that the cost of such systems should not exceed the benefits to be derived. Falconbridge believes its systems provide the appropriate balance in this respect.
The Corporation's Audit Committee is appointed by the Board of Directors annually and is currently comprised of five non-management directors. The Committee meets with management and with the independent auditors (who have free access to the Audit Committee) to satisfy itself that each group is properly discharging its responsibilities and to review the financial statements and the independent auditors' report. The Audit Committee reports its findings to the Board of Directors for consideration in approving the financial statements for issuance to the shareholders.
 | | |||
| David Race | Aaron Regent | Michael Doolan | ||
| Chairman of the Audit Committee | President and Chief Executive Officer | Senior Vice President and Chief Financial Officer |
FALCONBRIDGE LIMITED 2002 ANNUAL REPORT / PAGE 38
To the Shareholders of Falconbridge Limited:
We have audited the consolidated statements of financial position of Falconbridge Limited as at December 31, 2002 and 2001 and the consolidated statements of earnings, shareholders' equity and of cash flows for the years then ended. These financial statements are the responsibility of the Corporation's management. Our responsibility is to express an opinion on these financial statements based on our audits.
We conducted our audits in accordance with Canadian generally accepted auditing standards. Those standards require that we plan and perform an audit to obtain reasonable assurance whether the financial statements are free of material misstatement. An audit includes examining, on a test basis, evidence supporting the amounts and disclosures in the financial statements. An audit also includes assessing the accounting principles used and significant estimates made by management, as well as evaluating the overall financial statement presentation.
In our opinion, these consolidated financial statements present fairly, in all material respects, the financial position of the Corporation as at December 31, 2002 and 2001 and the results of its operations and its cash flows for the years then ended in accordance with Canadian generally accepted accounting principles.
| Toronto, Canada January 31, 2003 | Chartered Accountants |
FALCONBRIDGE LIMITED 2002 ANNUAL REPORT / PAGE 39
CONSOLIDATED STATEMENTS OF EARNINGS
| | Year Ended December 31 | ||||||
|---|---|---|---|---|---|---|---|
| | 2002 | 2001 | |||||
| | In Thousands of Canadian Dollars | ||||||
| REVENUES | $ | 2,394,035 | $ | 2,138,249 | |||
| OPERATING EXPENSES | |||||||
| Costs of metal and other product sales | 1,732,828 | 1,593,350 | |||||
| Selling, general and administrative | 136,388 | 121,266 | |||||
| Amortization of development and preproduction expenditures | 88,337 | 89,061 | |||||
| Depreciation and depletion | 260,367 | 241,792 | |||||
| Exploration | 33,693 | 39,530 | |||||
| Research and process development | 12,941 | 16,919 | |||||
| Foreign exchange (gains) losses | (13,319 | ) | 979 | ||||
| Other expenses | 6,119 | 9,294 | |||||
| 2,257,354 | 2,112,191 | ||||||
| OPERATING INCOME | 136,681 | 26,058 | |||||
| Interest (note 11) | 88,198 | 86,673 | |||||
| Earnings (loss) before taxes and non-controlling interest | 48,483 | (60,615 | ) | ||||
| Income and mining taxes (note 7) | (24,819 | ) | (75,402 | ) | |||
| Non-controlling interest in loss of subsidiaries | (52 | ) | (1,180 | ) | |||
| EARNINGS FOR THE YEAR | $ | 73,354 | $ | 15,967 | |||
| Dividends on preferred shares | 12,509 | 12,038 | |||||
| Earnings attributable to common shares | $ | 60,845 | $ | 3,929 | |||
| BASIC AND FULLY DILUTED EARNINGS PER COMMON SHARE (NOTE 10(c)) | $ | 0.34 | $ | 0.02 | |||
See accompanying Notes to Consolidated Financial Statements.
FALCONBRIDGE LIMITED 2002 ANNUAL REPORT / PAGE 40
CONSOLIDATED STATEMENTS OF FINANCIAL POSITION
| | December 31 | |||||
|---|---|---|---|---|---|---|
| | 2002 | 2001 | ||||
| | In Thousands of Canadian Dollars | |||||
| ASSETS | ||||||
| CURRENT | ||||||
| Cash and cash equivalents | $ | 259,933 | $ | 198,315 | ||
| Accounts and metals settlements receivable (note 15) | 342,414 | 259,950 | ||||
| Inventories (note 3) | 447,889 | 460,891 | ||||
| TOTAL CURRENT ASSETS | 1,050,236 | 919,156 | ||||
| Property, plant and equipment (note 4) | 3,954,570 | 3,987,676 | ||||
| Deferred expenses and other assets (note 5) | 198,784 | 162,628 | ||||
| TOTAL ASSETS | $ | 5,203,590 | $ | 5,069,460 | ||
| LIABILITIES AND SHAREHOLDERS' EQUITY | ||||||
| CURRENT | ||||||
| Accounts payable and accrued charges | $ | 304,781 | $ | 312,663 | ||
| Income and other taxes payable | 19,164 | 10,964 | ||||
| Long-term debt due within one year (note 6) | 99,731 | 113,133 | ||||
| TOTAL CURRENT LIABILITIES | 423,676 | 436,760 | ||||
| Long-term debt (note 6) | 1,922,803 | 1,754,188 | ||||
| Future income and mining taxes (note 7) | 186,997 | 216,922 | ||||
| Employee future benefits (note 8) | 239,569 | 248,271 | ||||
| Other long-term liabilities (note 9) | 115,258 | 103,265 | ||||
| Non-controlling interest | 29,986 | 30,046 | ||||
| TOTAL LIABILITIES | 2,918,289 | 2,789,452 | ||||
| Commitments and contingencies (notes 6, 9, 14, 17) | ||||||
| SHAREHOLDERS' EQUITY | 2,285,301 | 2,280,008 | ||||
| TOTAL LIABILITIES AND SHAREHOLDERS' EQUITY | $ | 5,203,590 | $ | 5,069,460 | ||
See accompanying Notes to Consolidated Financial Statements.
On behalf of the Board:
 | | |
| Alex G. Balogh | Aaron Regent | |
| Director | Director |
FALCONBRIDGE LIMITED 2002 ANNUAL REPORT / PAGE 41
CONSOLIDATED STATEMENTS OF SHAREHOLDERS' EQUITY
| | Year Ended December 31 | ||||||||||||||
|---|---|---|---|---|---|---|---|---|---|---|---|---|---|---|---|
| | 2002 | 2001 | |||||||||||||
| | Number | Amount | Number | Amount | |||||||||||
| | In Thousands of Canadian Dollars | ||||||||||||||
| SHARE CAPITAL | |||||||||||||||
| AUTHORIZED | |||||||||||||||
| Unlimited preferred shares | |||||||||||||||
| Unlimited common shares | |||||||||||||||
| ISSUED | |||||||||||||||
| Common shares | |||||||||||||||
| Balance, beginning of year | 176,977,146 | $ | 2,176,622 | 176,976,628 | $ | 2,176,612 | |||||||||
| Issued (note 10(d)) | 583,386 | 12,105 | — | — | |||||||||||
| Issued pursuant to employee stock option plan (note 10(a)) | 42,900 | 738 | 518 | 10 | |||||||||||
| Balance, end of year | 177,603,432 | 2,189,465 | 176,977,146 | 2,176,622 | |||||||||||
| Preferred shares Series 1 (note 10(b)) | |||||||||||||||
| Balance, beginning and end of year | 89,835 | 899 | 89,835 | 899 | |||||||||||
| Preferred shares Series 2 (note 10(b)) | |||||||||||||||
| Balance, beginning and end of year | 7,910,165 | 197,753 | 7,910,165 | 197,753 | |||||||||||
| CONTRIBUTED SURPLUS | |||||||||||||||
| Balance, beginning of year | — | — | |||||||||||||
| Amortization of fair value of stock options granted | 3,059 | — | |||||||||||||
| Balance, end of year | 3,059 | — | |||||||||||||
| DEFICIT | |||||||||||||||
| Balance, beginning of year | (101,932 | ) | (34,966 | ) | |||||||||||
| Adjustment for change in accounting policy | |||||||||||||||
| Stock based compensation (note 2) | (245 | ) | — | ||||||||||||
| Earnings for the year | 73,354 | 15,967 | |||||||||||||
| Dividends — Common shares | (70,799 | ) | (70,790 | ) | |||||||||||
| — Preferred shares | (12,509 | ) | (12,038 | ) | |||||||||||
| Share issue costs, net of taxes | (410 | ) | — | ||||||||||||
| Stock option plan cash payments, net of taxes (notes 2, 10(a)) | — | (105 | ) | ||||||||||||
| Balance, end of year | (112,541 | ) | (101,932 | ) | |||||||||||
| CUMULATIVE TRANSLATION ADJUSTMENT | |||||||||||||||
| Balance, beginning and end of year | 6,666 | 6,666 | |||||||||||||
| TOTAL SHAREHOLDERS' EQUITY | $ | 2,285,301 | $ | 2,280,008 | |||||||||||
See accompanying Notes to Consolidated Financial Statements.
FALCONBRIDGE LIMITED 2002 ANNUAL REPORT / PAGE 42
CONSOLIDATED STATEMENTS OF CASH FLOWS
| | Year Ended December 31 | |||||||
|---|---|---|---|---|---|---|---|---|
| | 2002 | 2001 | ||||||
| | In Thousands of Canadian Dollars | |||||||
| OPERATING ACTIVITIES | ||||||||
| Earnings for the year | $ | 73,354 | $ | 15,967 | ||||
| Add (deduct) items not affecting cash | ||||||||
| Depreciation and depletion | 260,367 | 241,792 | ||||||
| Amortization of development and preproduction expenditures | 88,337 | 89,061 | ||||||
| Future income and mining taxes (note 7) | (39,977 | ) | (75,229 | ) | ||||
| Non-controlling interest in loss of subsidiaries | (52 | ) | (1,180 | ) | ||||
| Other | 38,204 | (2,641 | ) | |||||
| Contributions to pension fund in excess of amounts expensed | (8,701 | ) | (9,452 | ) | ||||
| CASH PROVIDED BY OPERATING ACTIVITIES BEFORE WORKING CAPITAL CHANGES | 411,532 | 258,318 | ||||||
| Net change in receivables, inventories and payables | (70,105 | ) | 96,129 | |||||
| CASH PROVIDED BY OPERATING ACTIVITIES | 341,427 | 354,447 | ||||||
| INVESTING ACTIVITIES | ||||||||
| Capital expenditures and deferred project costs | (357,740 | ) | (348,328 | ) | ||||
| Acquisition of Lomas Bayas (note 16) | — | (100,729 | ) | |||||
| Cash acquired on acquisition of Lomas Bayas (note 16) | — | 16,867 | ||||||
| Other | (15,623 | ) | (16,013 | ) | ||||
| CASH USED IN INVESTING ACTIVITIES | (373,363 | ) | (448,203 | ) | ||||
| FINANCING ACTIVITIES | ||||||||
| Long-term debt, including current portion (note 6): | ||||||||
| Issued | 383,400 | 486,320 | ||||||
| Repaid | (219,940 | ) | (339,366 | ) | ||||
| Short-term debt | — | (22,503 | ) | |||||
| Dividends paid | (82,339 | ) | (82,828 | ) | ||||
| Issue of common shares (note 10(a), (d)) | 12,433 | 10 | ||||||
| CASH PROVIDED BY FINANCING ACTIVITIES | 93,554 | 41,633 | ||||||
| CASH PROVIDED (USED) DURING THE YEAR | 61,618 | (52,123 | ) | |||||
| Cash and cash equivalents, beginning of year | 198,315 | 250,438 | ||||||
| CASH AND CASH EQUIVALENTS, END OF YEAR | $ | 259,933 | $ | 198,315 | ||||
| CASH FLOW PER COMMON SHARE FROM OPERATING ACTIVITIES (NOTE 10(c)) | $ | 1.86 | $ | 1.93 | ||||
| Supplementary information: | ||||||||
| Cash paid for interest | $ | 92,187 | $ | 92,328 | ||||
| Cash paid for income and mining taxes | $ | 834 | $ | 22,870 | ||||
See accompanying Notes to Consolidated Financial Statements.
FALCONBRIDGE LIMITED 2002 ANNUAL REPORT / PAGE 43
NOTES TO CONSOLIDATED FINANCIAL STATEMENTS
(Tabular figures in thousands of Canadian dollars, except where otherwise noted)
1. SUMMARY OF SIGNIFICANT ACCOUNTING POLICIES
The consolidated financial statements of Falconbridge Limited have been prepared in accordance with Canadian generally accepted accounting principles, consistently applied. In these consolidated financial statements, references to the Corporation mean only Falconbridge Limited, the parent company, and references to Falconbridge include the Corporation and its consolidated subsidiaries. The principal accounting policies followed by Falconbridge are summarized hereunder.
Basis of consolidation Falconbridge consolidates the financial statements of subsidiary companies and proportionately consolidates the financial statements of joint ventures.
Translation of foreign currencies Foreign currency balances, and the financial statements of integrated foreign operations, are translated into Canadian dollars using the temporal method. Under this method, monetary items are translated at the rate of exchange in effect at the year-end. Non-monetary items are translated at historical exchange rates. Revenue and expense items are translated at the weighted average exchange rates prevailing during the year, except for depreciation, depletion and amortization, which are translated at the same exchange rates as the assets to which they relate. Exchange gains and losses are included in income in the current year, except when hedged. Certain monetary items are hedged by foreign currency forward and option contracts.
Financial statements of self-sustaining foreign operations are translated into Canadian dollars using the current rate method. Under this method, assets and liabilities are translated at the rate of exchange in effect at the year-end while revenue and expense items (including depreciation, depletion and amortization) are translated at the weighted average exchange rates prevailing during the year. Exchange gains and losses from the translation of such financial statements are deferred and disclosed as a separate component of shareholders' equity. Falconbridge uses a combination of its U.S. dollar long-term debt and forward exchange contracts and options for the sale of U.S. dollars to fully hedge its net investments in self-sustaining foreign operations. Gains or losses on these hedge instruments are reported in the same manner as exchange gains and losses from the translation of the financial statements of its self-sustaining foreign operations.
Revenue recognition Revenues are generated from the sale of refined metals, concentrates and ferronickel and are recorded in the accounts when the ownership and control of goods passes to the buyer, which generally occurs upon shipment. Prices used for provisionally priced sales are based on market prices prevailing at the time of shipment and are adjusted upon final settlement with customers pursuant to the terms of sales contracts.
Cash and cash equivalents Cash and cash equivalents include cash on account, demand deposits and short-term investments with original maturities of three months or less and are stated at cost, which approximates market value.
Valuation of inventories Metals inventories are valued at the lower of cost, determined on a "first-in, first-out" basis, and net realizable value. Supplies inventories are valued at the lower of average cost of acquisition, less appropriate allowances for obsolescence, and replacement cost.
Financial instruments Falconbridge periodically uses forward foreign exchange and option contracts to hedge the effect of exchange rate changes on identifiable foreign currency exposures. Generally, Falconbridge does not hedge the price it realizes on the sale of its own production and accepts realizations based on market prices prevailing around the time of delivery of metals to customers. Under certain circumstances, Falconbridge enters into futures and option contracts to hedge the effect of price changes on a portion of the commodities it sells. Gains and losses on these contracts are reported as a component of the related transactions. Falconbridge may enter into futures and forward contracts for the purchase or sale of commodities and currencies not designated as hedges. These contracts are carried at estimated fair values and gains or losses arising from the changes in the market values of these contracts are recognized in the earnings of the period in which the changes occur.
FALCONBRIDGE LIMITED 2002 ANNUAL REPORT / PAGE 44
Falconbridge also enters into interest-rate swap agreements, including foreign exchange cross currency swaps, to modify the interest characteristics of its outstanding debt. The differential to be paid or received is accrued as interest rates change and recognized as an adjustment to interest expense related to the debt.
Interest Falconbridge capitalizes interest costs incurred, prior to the commencement of commercial production, for projects that are specifically financed by debt. Interest costs incurred after the commencement of commercial production are expensed.
Property, plant and equipment Property, plant and equipment and related capitalized development and preproduction expenditures are recorded at cost. Repairs and maintenance expenditures are charged to operations; major betterments and replacements are capitalized.
The Corporation generally depreciates plant and equipment on a straight-line basis over the lesser of their useful service lives or the lives of the producing mines to which they relate. At the Kidd Creek Operations, mine facilities are depreciated over the estimated lives of the mines based on the unit of production basis. Up to and including the period ended September 30, 2002, reduction and refining facilities were depreciated on the straight-line basis over 25 years, ending in 2010. Effective October 1, 2002, the straight-line depreciation period of the reduction and refining facilities was extended to 2022 to coincide with the revised estimated useful life of these facilities. Generally the subsidiary companies calculate depreciation on a straight-line basis at rates varying from 5% to 25%.
Depletion of resource properties is provided over the estimated lives of the resources recoverable from the properties on the unit of production basis.
Development and preproduction expenditures are capitalized until the commencement of commercial production. These, together with certain subsequent development expenditures, which are also capitalized, are amortized over periods not exceeding the lives of the producing mines and properties.
Exploration Exploration costs incurred to the date of establishing that a property has reserves, which have the potential of being economically recoverable, are charged against earnings. Further costs are generally deferred and, upon reaching commercial production, amortized as appropriate under the policy for property, plant and equipment as described above.
Employee future benefits The costs of retirement benefits and certain post-employment benefits are recognized over the period in which employees render services in return for the benefits.
Pension expense recorded for Falconbridge's defined benefit plans is the net of management's best estimate of the cost of benefits provided, the interest cost of projected benefits, return on pension plan assets and amortization of experience gains or losses and other pension plan surpluses or deficits. Pension fund assets are valued at current market values. Pension plan surpluses or deficits, experience gains or losses and the cost of pension plan improvements are amortized, on a straight-line basis, over the expected average remaining service life of the employee group or the term of the employment contract to which the items relate, depending on the nature of the item. Funding is subject to applicable government regulations.
Under its defined contribution retirement savings program, Falconbridge makes payments based on employee earnings and partially matches employee contributions, to a defined maximum. Employees may receive profit sharing credits based on earnings.
Falconbridge also provides certain health care and life insurance benefits for retired employees and their dependents. The cost of these benefits is expensed over the period in which the employees render services in return for the benefits.
Income and mining taxes Current income taxes are recognized for the estimated income and mining taxes payable for the current year. Future income tax assets and liabilities are recognized for temporary differences between the tax and accounting bases of assets and liabilities as well as for the benefit of losses, available to be carried forward to future years for tax purposes, that are likely to be realized. Where
FALCONBRIDGE LIMITED 2002 ANNUAL REPORT / PAGE 45
appropriate, income and withholding taxes are provided on the portion of any interest in consolidated foreign subsidiaries' undistributed net income, which it is reasonable to assume, will be transferred in a taxable distribution.
Environmental and reclamation costs Costs related to ongoing site restoration programs are expensed when incurred. A provision for mine closure and site closure costs is charged to earnings during the life of the operations.
Use of estimates The preparation of financial statements in conformity with generally accepted accounting principles requires management to make estimates and assumptions. These estimates affect the reported amounts of assets and liabilities and the disclosure of contingent assets and liabilities at the date of the financial statements and the reported amounts of revenues and expenses during the reporting period. Actual results could differ from those estimates.
Stock option plan The Corporation has a stock option plan, which is described in note 10. Effective January 1, 2002, the Corporation adopted retroactively, without restatement of the prior-period comparative financial statements, the new CICA accounting standards for Stock-Based Compensation and Other Stock-Based Payments. Under this standard, the Corporation now accounts for stock options using the fair value method. Under this method, compensation expense for stock options granted since January 1, 2002, that are direct awards of stock, is measured at the fair value at the grant date using the Black-Scholes valuation model and is recognized over the vesting period of the options granted.
2. ACCOUNTING CHANGES
The effect of adopting the standard for Stock-Based Compensation and Other Stock-Based Payments (note 1, Stock option plan) was to decrease retained earnings by $0.2 million for those awards granted and outstanding before January 1, 2002. Selling, general and administrative expenses to December 31, 2002, include compensation costs of $4.0 million relating to outstanding options granted since January 1, 2002.
3. INVENTORIES
Inventories of $447.9 million (2001 — $460.9 million) includes, in-process — $191.6 million (2001 — $203.6 million); finished metals — $126.9 million (2001 — $126.8 million); and supplies — $129.4 million (2001 — $130.5 million).
FALCONBRIDGE LIMITED 2002 ANNUAL REPORT / PAGE 46
4. PROPERTY, PLANT AND EQUIPMENT
Property, plant and equipment consist of the following:
| | | | December 31 | ||||||||||
|---|---|---|---|---|---|---|---|---|---|---|---|---|---|
| | | | 2002 | 2001 | |||||||||
| | Cost | Accumulated depreciation and amortization | Net book value | Net book value | |||||||||
| Plant and equipment: | |||||||||||||
| Mines, mining plants and ancillary mining assets | $ | 3,398,845 | $ | 1,470,712 | $ | 1,928,133 | $ | 1,934,596 | |||||
| Smelters | 715,057 | 425,773 | 289,284 | 303,733 | |||||||||
| Refineries | 900,650 | 522,655 | 377,995 | 391,670 | |||||||||
| Other | 224,537 | 171,481 | 53,056 | 50,021 | |||||||||
| 5,239,089 | 2,590,621 | 2,648,468 | 2,680,020 | ||||||||||
| Land and properties | 436,091 | 204,523 | 231,568 | 244,758 | |||||||||
| $ | 5,675,180 | $ | 2,795,144 | ||||||||||
| Development and preproduction expenditures, net | 1,074,534 | 1,062,898 | |||||||||||
| $ | 3,954,570 | $ | 3,987,676 | ||||||||||
5. DEFERRED EXPENSES AND OTHER ASSETS
Deferred expenses and other assets consist of the following:
| | December 31 | |||||
|---|---|---|---|---|---|---|
| | 2002 | 2001 | ||||
| Deferred pre-development costs | $ | 131,797 | $ | 99,592 | ||
| Inventories and supplies | 28,088 | 21,262 | ||||
| Employee housing advances | 6,065 | 9,349 | ||||
| Debt discount and issue expenses, net | 8,647 | 4,707 | ||||
| Portfolio investments | 306 | 2,484 | ||||
| Water rights | 8,891 | 9,678 | ||||
| Other | 14,990 | 15,556 | ||||
| $ | 198,784 | $ | 162,628 | |||
FALCONBRIDGE LIMITED 2002 ANNUAL REPORT / PAGE 47
6. LONG-TERM DEBT
Long-term debt consists of the following:
| | December 31 | |||||||
|---|---|---|---|---|---|---|---|---|
| | 2002 | 2001 | ||||||
| Falconbridge Limited | ||||||||
| 7.35% Debentures, due November 1, 2006 (U.S.$250.0 million) (b) | $ | 394,900 | $ | 398,150 | ||||
| 7.35% Debentures, due June 5, 2012 (U.S.$250.0 million) (a), (b) | 394,900 | — | ||||||
| 73/8% Debentures, due September 1, 2005 (U.S.$200.0 million) (b) | 315,920 | 318,520 | ||||||
| 8.5% Debentures, due December 8, 2008 (a), (c) | 175,000 | 175,000 | ||||||
| Credit Facilities (d) | 153,902 | 326,334 | ||||||
| Compañía Minera Doña Inés de Collahuasi S.C.M.: | ||||||||
| Senior Debt | ||||||||
| (U.S.$281.9 million, 2001 — U.S.$309.7 million) (e) | 445,274 | 493,242 | ||||||
| Compañía Minera | ||||||||
| Lomas Bayas: | ||||||||
| Senior Debt | ||||||||
| (U.S.$90.3 million, 2001 — U.S.$98.0 million) (f) | 142,638 | 156,075 | ||||||
| Total | $ | 2,022,534 | $ | 1,867,321 | ||||
| Less long-term debt due within one year | 99,731 | 113,133 | ||||||
| $ | 1,922,803 | $ | 1,754,188 | |||||
(a) In June 2002, the Corporation issued U.S.$250.0 million, 7.35% debentures repayable on June 5, 2012. These debentures, and the $175.0 million, 8.5% debentures repayable on December 8, 2008, were issued under a shelf prospectus that provides for the issuance, during a two-year period ending September 2003, of debt securities of up to U.S.$600.0 million. The debentures are subordinate to all indebtedness and other liabilities of subsidiaries.
(b) The Corporation has entered into a number of interest rate swap and option transactions with terms up to 9.5 years. As a result of these transactions, at December 31, 2002, interest costs on U.S.$425.0 million (2001 — U.S.$350.0 million) of the debentures were swapped to an average fixed interest rate of 6.28% (2001 — 6.61%) and interest costs on U.S.$275.0 million (2001 — U.S.$100.0 million) were swapped to a floating rate basis at an average interest rate of 3.91% (2001 — 2.78%). The weighted average interest rate on these debentures at December 31, 2002 was 5.35% (2001 — 5.76%). If these positions had been settled at December 31, 2002, the Corporation would have received $62.2 million (2001 — received $20.2 million).
(c) The Corporation has entered into several cross currency interest rate swap transactions with terms of six years. As a result of these transactions, at December 31, 2002, interest costs on U.S.$86.3 million (2001 — U.S.$111.3 million) of the debentures were swapped to an average floating interest rate of 5.55% (2001 — 5.31%) and interest costs on U.S.$25.0 million (2001 — Nil) were swapped to a fixed interest rate of 5.0%. If these positions had been settled at December 31, 2002 the Corporation would have received $1.5 million (2001 — paid $4.0 million).
(d) The Corporation has unsecured evergreen credit facilities with various banks outstanding at December 31, 2002 (individually a "Credit Facility" and collectively the "Credit Facilities"). These Credit Facilities include U.S.$390.0 million of three-year revolvers that mature on December 13, 2005 and a U.S.$25.0 million revolving/non-revolving term facility maturing on January 31, 2005. The aggregate principal amount of the Credit Facilities is U.S.$415.0 million (2001 — U.S.$475.0 million). The revolving period of the Credit Facilities may be renewed and extended annually to maintain the three-year term of the revolver.
FALCONBRIDGE LIMITED 2002 ANNUAL REPORT / PAGE 48
The Corporation has also established a commercial paper program. Unused lines of credit and cash on hand are used to support the commercial paper program.
Borrowings may be made under the Credit Facilities in Canadian dollars in the form of prime rate loans or bankers' acceptances or in U.S. dollars in the form of U.S. base rate loans or LIBOR loans. In some cases, borrowings may be in the form of letters of credit which offset amounts available under the Credit Facility. As at December 31, 2002, the Corporation had borrowed U.S.$63.5 million (2001 — Nil) and had drawn letters of credit totalling U.S.$36.5 million (2001 — Nil) under a Credit Facility. As at December 31, 2002, the Corporation had commercial paper outstanding of U.S.$27.6 million (2001 — U.S.$98.1 million) and Cdn$10.0 million (2001 — Cdn$170.1 million). Interest on U.S.$91.1 million (2001 — U.S.$98.1 million) was payable at 2.34% (2001 — 2.36%) and on Cdn$10.0 million (2001 — Cdn$170.1 million) was at 2.85% (2001 — 3.05%). Amounts outstanding under the commercial paper program are classified as debt not maturing within one year since the Corporation has both the intent and ability to refinance the borrowings on a long-term basis. The Corporation pays a standby fee, included with interest expense, on the unused portion of each Credit Facility.
(e) In November 2002, Collahuasi negotiated U.S.$270.0 million of additional replacement senior debt to partially finance the Ujina/Rosario transition/expansion project. The principal of the initial senior debt is repayable in successive, semi-annual installments which commenced in December 1999, continuing until December 2009. Proceeds from drawdowns from the replacement senior debt are used to make the scheduled initial senior debt interest and principal payments during project construction. The principal of the replacement debt is payable in 10 successive, semi-annual installments following completion of the project. The weighted average interest rate on the senior debt outstanding at December 31, 2002 was 2.69% (2001 — 3.19%).
As at December 31, 2001, Collahuasi had entered into interest rate swap agreements to partially hedge the exposure derived from the timing of LIBOR settings on loans outstanding. These swap agreements matured and were settled in December 2002. No new swap agreements were entered into during 2002.
(f) In December 2002, Lomas Bayas renegotiated the term loan due January 2003. The term was extended to January 31, 2008 with semi-annual principal repayments of U.S.$7.5 million, commencing July 31, 2003. Under the terms of the agreement the Corporation has guaranteed the repayment of the debt. Lomas Bayas has entered into two interest rate swap transactions. As a result of these transactions, at December 31, 2002, interest costs on U.S.$29.0 million (2001 — U.S.$47.0 million) were swapped to a fixed rate of 8.2% (2001 — 7.7%). The weighted average interest rate on the loan at December 31, 2002 was 6.54% (2001 — 5.39%). If these positions had been settled at December 31, 2002, Falconbridge would have paid $2.5 million (2001 — paid $3.8 million).
(g) The weighted average interest rate on the long-term debt portfolio, including the effect of interest rate swap agreements, at December 31, 2002 was 4.63% (2001 — 4.48%).
(h) Assuming that the Credit Facilities will continue to be renewed, long-term debt will mature as follows:
| Year ending December 31, 2003 | $ | 99,731 | |
| 2004 | 111,578 | ||
| 2005 | 443,775 | ||
| 2006 | 459,292 | ||
| 2007 | 64,392 | ||
| thereafter | 843,766 | ||
| $ | 2,022,534 | ||
FALCONBRIDGE LIMITED 2002 ANNUAL REPORT / PAGE 49
(i) At December 31, 2002, the market value of Falconbridge's total debt, excluding the effect of interest rate swap agreements, was $2,099.1 million (2001 — $1,873.1 million).
7. INCOME AND MINING TAXES
(a) Consolidated income and mining taxes consist of the following:
| | Year Ended December 31 | |||||||
|---|---|---|---|---|---|---|---|---|
| | 2002 | 2001 | ||||||
| Current | ||||||||
| Federal and provincial income taxes | $ | 5,824 | $ | 5,608 | ||||
| Foreign taxes | 9,334 | (5,781 | ) | |||||
| 15,158 | (173 | ) | ||||||
| Future | ||||||||
| Federal and provincial income taxes | (56,253 | ) | (82,165 | ) | ||||
| Provincial mining taxes | (4,708 | ) | (6,108 | ) | ||||
| Foreign taxes | 20,984 | 13,044 | ||||||
| (39,977 | ) | (75,229 | ) | |||||
| $ | (24,819 | ) | $ | (75,402 | ) | |||
(b) The difference between the amount of the reported consolidated income and mining taxes and the amount computed by multiplying the earnings before taxes by the Corporation's applicable tax rates is reconciled as follows:
| | Year Ended December 31 | |||||||
|---|---|---|---|---|---|---|---|---|
| | 2002 | 2001 | ||||||
| Taxes computed using the Corporation's tax rates* | $ | 19,392 | $ | (24,970 | ) | |||
| Adjust for — | ||||||||
| Foreign tax rates, net (i) | (42,195 | ) | (32,069 | ) | ||||
| Mining taxes | (4,708 | ) | (6,108 | ) | ||||
| Resource and depletion allowances | 1,892 | 4,600 | ||||||
| Non-taxable income | (5,300 | ) | (7,635 | ) | ||||
| Non-claimable expenses | 5,279 | 2,343 | ||||||
| Ontario income tax rate reduction | — | (20,033 | ) | |||||
| Other | 821 | 8,470 | ||||||
| Income and mining taxes | $ | (24,819 | ) | $ | (75,402 | ) | ||
| *Federal and provincial income tax rates | 40.12% | 41.12% | ||||||
- (i)
- The Corporation has non-resident subsidiaries that have undistributed earnings on which no taxes have been provided. These earnings, which amount to approximately U.S.$360.6 million (2001 — U.S.$343.9 million), have been permanently reinvested outside Canada and are used to finance non-Canadian investments, and exploration and development projects.
FALCONBRIDGE LIMITED 2002 ANNUAL REPORT / PAGE 50
(c) The components of the future income tax liability at December 31, 2002 are as follows:
| | Year Ended December 31 | ||||||
|---|---|---|---|---|---|---|---|
| | 2002 | 2001 | |||||
| Future income and mining tax liabilities | |||||||
| Property, plant and equipment | $ | 297,697 | $ | 324,223 | |||
| Development and preproduction | 165,259 | 175,200 | |||||
| Foreign exchange | 21,941 | 25,749 | |||||
| Other | 37,786 | 26,573 | |||||
| 522,683 | 551,745 | ||||||
| Future income and mining tax assets | |||||||
| Exploration | 14,489 | — | |||||
| Pensions | 9,802 | 12,373 | |||||
| Post-employment benefits | 69,214 | 66,149 | |||||
| Reclamation provisions | 28,019 | 24,767 | |||||
| Inventory obsolescence | 11,821 | 7,953 | |||||
| Non-capital losses | 152,083 | 153,488 | |||||
| Research and development | 16,404 | 13,424 | |||||
| Other | 33,854 | 56,669 | |||||
| 335,686 | 334,823 | ||||||
| Net future income and mining tax liability | $ | 186,997 | $ | 216,922 | |||
8. EMPLOYEE FUTURE BENEFITS
Falconbridge maintains defined benefit retirement plans providing retirement, death and termination benefits for certain salaried and hourly-rated employees. Pension benefits are calculated based upon length of service and either final average earnings or a specified amount per year of service. Funding and pension plan assets (which consist principally of cash, equity securities and fixed income securities) for the defined benefit plans are primarily governed by theOntario Pension Benefits Act. Pension benefits provided for certain employees through group annuity contracts are fully funded. The Kidd Creek Operations and Société minière Raglan du Québec ltée make monthly contributions on behalf of employees under a defined contribution retirement savings program.
Falconbridge provides retiree health, dental and life insurance benefits to certain employees. These plans require no contributions from employees. Other post-employment benefits are recognized when the event triggering the obligation occurs.
FALCONBRIDGE LIMITED 2002 ANNUAL REPORT / PAGE 51
The funded status of Falconbridge's defined benefit pension plans and post-employment benefit plans other than pensions are as follows:
Defined benefit pension plans
| | December 31 | ||||||||||||
|---|---|---|---|---|---|---|---|---|---|---|---|---|---|
| | 2002 | 2001 | |||||||||||
| | Plans where assets exceed accumulated benefits | Plans where accumulated benefits exceed assets | Plans where assets exceed accumulated benefits | Plans where accumulated benefits exceed assets | |||||||||
| Plan assets at fair value | $ | 40,987 | $ | 718,175 | $ | 45,299 | $ | 782,141 | |||||
| Projected benefit obligations | 27,026 | 1,010,582 | 28,484 | 997,120 | |||||||||
| Plan assets in excess of (less than) projected benefit obligations | $ | 13,961 | $ | (292,407 | ) | $ | 16,815 | $ | (214,979 | ) | |||
Post-employment benefit plans other than pensions
| | December 31 | ||||||
|---|---|---|---|---|---|---|---|
| | 2002 | 2001 | |||||
| Plan assets at fair value | $ | 16,121 | $ | 16,553 | |||
| Projected benefit obligation | 260,529 | 255,675 | |||||
| Plan assets less than projected benefit obligations | $ | (244,408 | ) | $ | (239,122 | ) | |
The differences between amounts expensed and amounts funded, which represent the accrued liability for employee future benefits on the Statements of Financial Position, are as follows:
| | December 31 | |||||
|---|---|---|---|---|---|---|
| | 2002 | 2001 | ||||
| Defined benefit pension plans | $ | 15,921 | $ | 33,984 | ||
| Post-employment benefit plans other than pensions | 223,648 | 214,287 | ||||
| Excess of amounts expensed over amounts funded | $ | 239,569 | $ | 248,271 | ||
FALCONBRIDGE LIMITED 2002 ANNUAL REPORT / PAGE 52
Falconbridge's post-employment benefit expense included the following components:
| | December 31 | ||||||||||||
|---|---|---|---|---|---|---|---|---|---|---|---|---|---|
| | 2002 | 2001 | |||||||||||
| | Pension benefit plans | Other benefit plans | Pension benefit pans | Other benefit plans | |||||||||
| Service cost | $ | 14,160 | $ | 6,729 | $ | 14,752 | $ | 5,668 | |||||
| Interest cost | 68,660 | 17,035 | 67,161 | 16,454 | |||||||||
| Expected return on plan assets | (56,803 | ) | (1,089 | ) | (60,503 | ) | (1,041 | ) | |||||
| Actuarial losses | 11,034 | 411 | 5,784 | — | |||||||||
| Valuation allowance provided against accrued benefit asset | 547 | — | 564 | — | |||||||||
| Curtailment losses | 128 | — | — | — | |||||||||
| Other | — | 2,031 | — | (1,057 | ) | ||||||||
| Defined benefit plan expense | 37,726 | 25,117 | 27,758 | 20,024 | |||||||||
| Defined contribution plan expense | 9,381 | — | 8,705 | — | |||||||||
| Post-employment benefit expense | $ | 47,107 | $ | 25,117 | $ | 36,463 | $ | 20,024 | |||||
FALCONBRIDGE LIMITED 2002 ANNUAL REPORT / PAGE 53
The change in the funded status of Falconbridge's post-retirement benefit plans was as follows:
| | December 31 | |||||||||||||
|---|---|---|---|---|---|---|---|---|---|---|---|---|---|---|
| | 2002 | 2001 | ||||||||||||
| | Pension benefit plans | Other benefit plans | Pension benefit pans | Other benefit plans | ||||||||||
| PROJECTED BENEFIT OBLIGATION | ||||||||||||||
| Balance at beginning of year | $ | 1,025,604 | $ | 255,675 | $ | 919,298 | $ | 226,683 | ||||||
| Current service cost | 14,160 | 6,729 | 14,752 | 5,668 | ||||||||||
| Benefits paid | (74,315 | ) | (17,859 | ) | (74,031 | ) | (15,868 | ) | ||||||
| Interest cost | 68,660 | 17,035 | 67,162 | 16,454 | ||||||||||
| Actuarial losses | 9,441 | 158 | 96,444 | 22,463 | ||||||||||
| Curtailments | (10,285 | ) | — | — | — | |||||||||
| Effect of exchange rate changes | 4,343 | (1,209 | ) | 1,979 | 275 | |||||||||
| Balance at end of year | $ | 1,037,608 | $ | 260,529 | $ | 1,025,604 | $ | 255,675 | ||||||
| PLAN ASSETS | ||||||||||||||
| Balance at beginning of year | $ | 827,440 | $ | 16,553 | $ | 873,744 | $ | 15,181 | ||||||
| Expected return on plan assets | 56,803 | 1,089 | 60,503 | 1,041 | ||||||||||
| Experience loss on fund assets | (102,018 | ) | — | (77,997 | ) | 956 | ||||||||
| Employer contributions | 52,325 | 16,338 | 39,858 | 15,243 | ||||||||||
| Benefits paid | (70,500 | ) | (17,859 | ) | (70,337 | ) | (15,868 | ) | ||||||
| Curtailments | (10,695 | ) | — | — | — | |||||||||
| Effect of exchange rate changes | 5,807 | — | 1,669 | — | ||||||||||
| Balance at end of year | $ | 759,162 | $ | 16,121 | $ | 827,440 | $ | 16,553 | ||||||
| Plan deficit | $ | 278,446 | $ | 244,408 | $ | 198,164 | $ | 239,122 | ||||||
| | December 31 | ||||||||||||
|---|---|---|---|---|---|---|---|---|---|---|---|---|---|
| | 2002 | 2001 | |||||||||||
| | Pension benefit plans | Other benefit plans | Pension benefit pans | Other benefit plans | |||||||||
| RECONCILIATION OF ACCRUED BENEFIT | |||||||||||||
| LIABILITY TO DEFICIT | |||||||||||||
| Accrued benefit liability | $ | 15,921 | $ | 223,648 | $ | 33,984 | $ | 214,287 | |||||
| Unamortized past service costs | 5,199 | 867 | 9,655 | — | |||||||||
| Unamortized net actuarial losses | 268,034 | 19,893 | 163,672 | 25,815 | |||||||||
| Projected benefit obligation | 289,154 | 244,408 | 207,311 | 240,102 | |||||||||
| Valuation allowance | (10,708 | ) | — | (10,594 | ) | — | |||||||
| Other | — | — | 1,447 | (980 | ) | ||||||||
| Plan deficit | $ | 278,446 | $ | 244,408 | $ | 198,164 | $ | 239,122 | |||||
FALCONBRIDGE LIMITED 2002 ANNUAL REPORT / PAGE 54
The significant actuarial assumptions used in measuring Falconbridge's post-retirement benefit obligations were as follows:
| | December 31 | ||||||||||
|---|---|---|---|---|---|---|---|---|---|---|---|
| | Pension benefit plans | Other benefit plans | |||||||||
| | 2002 | 2001 | 2002 | 2001 | |||||||
| Discount rate | 6.75% | 6.75% | 6.75% | 6.75% | |||||||
| Expected long-term rate of return on plan assets | 7.00% | 7.00% | |||||||||
| Rate of compensation increase | 3.50% | 3.50% | |||||||||
Effect of 1% increase in assumed health care cost trend rates | |||||||||||
| Total of service and interest cost components | $ | 2,691 | $ | 2,389 | |||||||
| Post-employment benefit obligation | 31,879 | 29,060 | |||||||||
Effect of 1% decrease in assumed health care cost trend rates | |||||||||||
| Total of service and interest cost components | $ | (2,153 | ) | $ | (1,877 | ) | |||||
| Post-employment benefit obligation | (22,771 | ) | (22,354 | ) | |||||||
The health care cost trend rate is assumed to start at 8.5% for 2002 (2001 — 9%), decreasing to an ultimate medical trend rate of 4% (2001 — 4%).
9. OTHER LONG-TERM LIABILITIES
Other long-term liabilities consist of the following:
| | December 31 | |||||
|---|---|---|---|---|---|---|
| | 2002 | 2001 | ||||
| Future removal and site restoration costs | $ | 93,344 | $ | 85,195 | ||
| Other | 21,914 | 18,070 | ||||
| $ | 115,258 | $ | 103,265 | |||
The business conducted by Falconbridge has been, and may in the future be, affected by changes in environmental legislation and other requirements including those related to future removal and site restoration costs. As Falconbridge operates in many countries, both the likelihood of changes in legislation and its impact upon Falconbridge are not predictable.
Falconbridge's policy is to meet and, if possible, surpass standards set by relevant legislation, through the application of innovative and technically proven economical measures in advance of prescribed deadlines. In addition, Falconbridge incurs substantial removal and site restoration costs on an ongoing basis, which it believes, will mitigate future removal and site restoration costs.
The total liability for future site restoration costs in relation to Falconbridge's worldwide operations, which will be incurred primarily after the cessation of operations, is estimated to be approximately $225.0 million (2001 — $225.0 million). This estimate is based on information currently available, including closure plans and alternatives, applicable regulations and planned spending on site restoration. At December 31, 2002, Falconbridge had provided $93.3 million (2001 — $85.2 million), in addition to ongoing capital and operating expenditures. The remaining balance will be accrued and expensed during the remaining lives of the operations.
In view of the uncertainties concerning future removal and site restoration costs, the ultimate costs to Falconbridge could differ materially from the amounts estimated. The estimate for the future liability is
FALCONBRIDGE LIMITED 2002 ANNUAL REPORT / PAGE 55
subject to change based on amendments to applicable laws and legislation, the nature of ongoing operations and technological innovations. Future changes, if any, due to their nature and unpredictability, could have a significant impact and would be reflected prospectively, as a change in an accounting estimate.
10. SHARE CAPITAL
(a) Employee stock option plan The Corporation has a stock option plan, through which options may be granted to officers and employees for the purchase of common shares. Options were granted at prices equal to the closing market value on the last trading day or period prior to the grant. Stock options granted from 1997 through December 31,1999 have a 10-year term and contain vesting provisions of 20% on the first anniversary date following the date of the grant, and a further 20% on each of the four subsequent anniversary dates. Stock options granted since January 1, 2000 have a 10-year term with the same vesting provisions; however, they also contain an accelerated vesting feature specifying that on the first day that the market price of the common shares is 20% greater than the exercise price of the option, the final tranche of unvested options outstanding on that date will immediately vest and be exercisable. In 2002, the Corporation amended the terms of its outstanding stock options to eliminate the cash settlement feature.
Deferred Share Unit Plan for Non-Employee Directors During 2002, the Corporation approved a deferred share unit plan for non-employee directors (DSUPD). Under the DSUPD, each eligible director may elect to be paid annual retainer fees and/or meeting attendance fees in deferred share units (DSU) rather than in cash. A DSU is a notional unit, equivalent to a common share. DSUs are credited with dividend equivalents when dividends are paid on the Corporation's common shares. Payment of DSUs is made in cash or common shares after the director leaves the Board. As of December 31, 2002 a total of 2,176 DSUs were held by participating directors.
A summary of the status of the stock option plan and changes during the years is presented below:
| | 2002 | 2001 | |||||||||
|---|---|---|---|---|---|---|---|---|---|---|---|
| | Options (000s) | Weighted-average exercise price | Options (000s) | Weighted-average exercise price | |||||||
| Outstanding, beginning of year | 3,658 | $ | 18.60 | 2,827 | $ | 20.35 | |||||
| Granted | 1,168 | 16.65 | 1,107 | 15.93 | |||||||
| Exercised | |||||||||||
| Purchase option | (43 | ) | 17.22 | (3 | ) | 15.67 | |||||
| Market growth option | (275 | ) | 16.56 | (37 | ) | 15.86 | |||||
| Cancelled | (95 | ) | 18.06 | (236 | ) | 27.48 | |||||
| Outstanding, end of year | 4,413 | $ | 18.24 | 3,658 | $ | 18.60 | |||||
FALCONBRIDGE LIMITED 2002 ANNUAL REPORT / PAGE 56
The following table summarizes information about the stock options outstanding at December 31, 2002:
| | Options outstanding | ||||||
|---|---|---|---|---|---|---|---|
| Range of exercise prices | Number (000s) at December 31, 2002 | Weighted-average remaining contractual life | Weighted-average exercise price | ||||
| $15.67 to $15.93 | 1,587 | 7.3 | $ | 15.83 | |||
| $16.58 to $17.45 | 1,086 | 8.3 | $ | 16.66 | |||
| $18.50 to $20.14 | 1,320 | 6.4 | $ | 18.80 | |||
| $26.25 to $31.10 | 420 | 4.4 | $ | 27.77 | |||
| $15.67 to $31.10 | 4,413 | 6.8 | $ | 18.24 | |||
| | Options exercisable | ||||
|---|---|---|---|---|---|
| Range of exercise prices | Number (000s) at December 31, 2002 | Weighted-average exercise price | |||
| $15.67 to $15.93 | 639 | $ | 15.80 | ||
| $16.58 to $17.45 | 163 | $ | 16.58 | ||
| $18.50 to $20.14 | 924 | $ | 19.38 | ||
| $26.25 to $31.10 | 420 | $ | 27.60 | ||
| $15.67 to $31.10 | 2,146 | $ | 19.71 | ||
(b) Preferred shares On March 7, 1997 the Corporation issued 8,000,000 Units, at a price of $10.00 per Unit, with each Unit consisting of one Cumulative Preferred Share Series 1 (a "Preferred Share Series 1") and one Cumulative Preferred Share Series 2 Purchase Warrant (a "Warrant"). Since September 1, 1998, the quarterly dividend on Preferred Share Series 1 has been $0.02 per share. The holders of the Units had the right to acquire on certain dates, for each Unit held, one Cumulative Preferred Share Series 2 (a "Preferred Share Series 2") of the Corporation by the combined effect of tendering for conversion one Preferred Share Series 1 and the exercise of one Warrant together with the cash payment of $15.00 per Warrant. A total of 7,910,165 units has been converted into Preferred Share Series 2.
Until March 1, 2004, the Preferred Share Series 2 will been titled to fixed cumulative preferential dividends, as and when declared by the Board of Directors, which will accrue from the date of issue and be payable quarterly in the amount of $0.3672 per share or $1.4688 per share per annum. From March 1, 2004, the Preferred Share Series 2 will been titled to floating adjustable cumulative preferential cash dividends as and when declared by the Board of Directors.
Holders of Preferred Share Series 2 will have the right to convert their shares into Cumulative Preferred Share Series 3 of the Corporation, subject to certain conditions on March 1, 2004 and every five years thereafter. On March 1, 2004, the Corporation may redeem for cash the Preferred Share Series 2, in whole but not in part, at the Corporation's option, at $25.00 per share plus accrued and unpaid dividends. Subsequent to March 1, 2004, the Corporation may redeem at any time for cash the Preferred Share Series 2, in whole but not in part, at the Corporation's option, at $25.50 per share plus accrued and unpaid dividends.
(c) Earnings and cash flow per common share In 2001, the Corporation adopted the new Canadian Institute of Chartered Accountants (CICA) accounting standard Earnings per Share, retro-actively with restatement of the prior year. The new standard requires the use of the treasury stock method to compute the dilutive effect of stock options. The adoption of the new standard did not have a material impact on the calculation of earnings per share.
Earnings and cash flow per common share have been calculated after deducting preferred share dividends of $12.5 million (2001 — $12.0 million) and have been based on the weighted average number of
FALCONBRIDGE LIMITED 2002 ANNUAL REPORT / PAGE 57
common shares outstanding during the year of 177,021,546 shares (2001 — 176,977,100 shares). Diluted earnings per share have been based on the weighted average number of common shares outstanding during the year of 181,434,246 shares (2001 — 177,060,100 shares).
(d) Flow-through shares In December 2002, the Corporation completed a private placement of 583,386 flow-through common shares at a price of $20.75 per share for gross proceeds of $12.1 million. The proceeds of the issue will be used to fund the Corporation's Canadian exploration expenditures.
(e) Repurchase of common shares The Corporation may repurchase for cancellation up to 750,000 common shares representing approximately 0.5% of its outstanding common shares under the rules of a normal course issuer bid through the facilities of the Toronto Stock Exchange (TSX). The bid commenced on January 15, 2003. The bid will terminate on the earlier of the repurchase of 750,000 common shares, the Corporation providing the TSX with a notice of termination, or January 14, 2004.
11. INTEREST
Interest includes the following:
| | Year Ended December 31 | ||||||
|---|---|---|---|---|---|---|---|
| | 2002 | 2001 | |||||
| Interest on long-term debt | $ | 96,985 | $ | 100,296 | |||
| Interest on short-term debt | — | 102 | |||||
| Interest income | (8,787 | ) | (13,725 | ) | |||
| $ | 88,198 | $ | 86,673 | ||||
There was no interest capitalized in either year.
12. COLLAHUASI JOINT VENTURE
Compañía Minera Doña Inés de Collahuasi S.C.M. (Collahuasi) is the corporation which owns the mining and water rights and other assets relating to Collahuasi and secured financing, conducts the operations and markets the products of the property.
FALCONBRIDGE LIMITED 2002 ANNUAL REPORT / PAGE 58
The consolidated financial statements include Falconbridge's 44% share of the financial position, operating results and cash flow of Collahuasi as follows:
| | December 31 | |||||||
|---|---|---|---|---|---|---|---|---|
| | 2002 | 2001 | ||||||
| Financial Position | ||||||||
| ASSETS | ||||||||
| Current assets (a) | $ | 224,191 | $ | 161,209 | ||||
| Property, plant and equipment | 1,240,025 | 1,248,031 | ||||||
| Other | 34,220 | 29,507 | ||||||
| Total assets | $ | 1,498,436 | $ | 1,438,747 | ||||
| LIABILITIES AND SHAREHOLDERS' EQUITY | ||||||||
| Current liabilities | $ | 127,911 | $ | 122,895 | ||||
| Long-term debt | ||||||||
| Senior debt | 357,390 | 404,635 | ||||||
| Intercompany debt | 407,183 | 395,967 | ||||||
| Other long-term liabilities | 113,961 | 87,247 | ||||||
| Shareholders' equity | 491,991 | 428,003 | ||||||
| Total liabilities and shareholders' equity | $ | 1,498,436 | $ | 1,438,747 | ||||
| Earnings | ||||||||
| Revenues | $ | 386,576 | $ | 365,718 | ||||
| Earnings for the year | $ | 71,514 | $ | 48,119 | ||||
Cash Flow | ||||||||
| Cash flow provided by (used in): | ||||||||
| Operating activities | $ | 199,429 | $ | 144,964 | ||||
| Investing activities | (102,795 | ) | (49,904 | ) | ||||
| Financing activities | (30,127 | ) | (61,049 | ) | ||||
| Increase in cash and cash equivalents | $ | 66,507 | $ | 34,011 | ||||
- (a)
- Current assets include cash of $139.7 million (2001 — $73.2 million) which is only available for use within the operation.
During the year, the Board of Directors of Compañía Minera Doña Inés de Collahuasi approved the construction of a new grinding circuit at the Ujina concentrator. This is part of the Ujina to Rosario transition project, which also involves transferring mine production from the Ujina pit to the Rosario ore body in June of 2004. The project will increase Collahuasi's concentrator design capacity to 110,000 tonnes per day. The total capital cost of the transition and concentrator expansion project is estimated at U.S.$654.0 million, with Falconbridge's 44% share of this cost totalling U.S.$288.0 million.
13. SEGMENTED DATA
Falconbridge operates in one industry — mining, processing and marketing of mineral products. These activities are conducted through six segments — the Integrated Nickel Operations (INO), Kidd Creek, Falcondo, Collahuasi, Lomas Bayas and Corporate. The INO includes the accounts of the Corporation and all of its wholly-owned subsidiaries engaged in the integrated operations of mining, milling, smelting, refining and marketing of metals mainly derived from Sudbury and Raglan nickel/copper ores and its custom feed business. Kidd Creek includes the mining, milling, smelting and refining of its own copper/zinc ores and its custom feed business. Falcondo mines, mills, smelts and refines its own nickel laterite ores. Collahuasi is a copper mine in which Falconbridge owns 44%. Lomas Bayas mines and refines its own copper ores.
FALCONBRIDGE LIMITED 2002 ANNUAL REPORT / PAGE 59
Corporate includes general and administrative expenditures, exploration, research and development expenditures, foreign exchange gains and losses, and other income and expenses.
The accounting policies used by these segments are the same as those described in the Summary of Significant Accounting Policies in note 1. Any sales and transfers between the segments are accounted for as if the sales or transfers were to third parties, that is, at current market prices. During the preparation of the financial statements the transfers between segments are eliminated.
As the products and services in each of the reportable segments, except for Corporate, are essentially the same, the reportable segments have been selected at the level where decisions are made on the provision of resources, capital and where performance is measured. For operations forming part of a reportable segment, performance is measured based on production targets, operating costs incurred and unit operating costs.
(a) Segmented information:
| | Nickel | Copper | | | ||||||||||||||||||
|---|---|---|---|---|---|---|---|---|---|---|---|---|---|---|---|---|---|---|---|---|---|---|
| (Millions) | INO | Falcondo | Kidd Creek | Collahuasi | Lomas Bayas | Corporate and other | Total | |||||||||||||||
| YEAR ENDED DECEMBER 31, 2002 | ||||||||||||||||||||||
| Ownership | (100% | ) | (85.26% | ) | (100% | ) | (44% | ) | (100% | ) | (100% | ) | ||||||||||
| Revenues (a) | $ | 1,088 | $ | 234 | $ | 534 | $ | 386 | $ | 152 | $ | — | $ | 2,394 | ||||||||
| Operating income (loss) | 147 | 1 | (78 | ) | 132 | 28 | (93 | ) | 137 | |||||||||||||
| Working capital | 322 | 58 | 66 | 95 | 41 | 45 | 627 | |||||||||||||||
| Depreciation, depletion and amortization | 152 | 11 | 79 | 81 | 23 | 3 | 349 | |||||||||||||||
| Property, plant & equipment | 1,294 | 131 | 928 | 1,372 | 222 | 8 | 3,955 | |||||||||||||||
| Capital expenditures & deferred project costs | 110 | 22 | 124 | 84 | 17 | 1 | 358 | |||||||||||||||
| YEAR ENDED DECEMBER 31, 2001 | ||||||||||||||||||||||
| Ownership | (100% | ) | (85.26% | ) | (100% | ) | (44% | ) | (100% | ) | (100% | ) | ||||||||||
| Revenues (a) | $ | 969 | $ | 237 | $ | 505 | $ | 366 | $ | 61 | $ | — | $ | 2,138 | ||||||||
| Operating income (loss) | 85 | (18 | ) | (64 | ) | 122 | 8 | (107 | ) | 26 | ||||||||||||
| Working capital | 269 | 76 | 58 | 67 | (6 | ) | 18 | 482 | ||||||||||||||
| Depreciation, depletion and amortization | 160 | 12 | 75 | 74 | 10 | — | 331 | |||||||||||||||
| Property, plant & equipment | 1,348 | 121 | 895 | 1,380 | 231 | 31 | 3,988 | |||||||||||||||
| Capital expenditures & deferred project costs | 99 | 23 | 162 | 29 | 2 | 33 | 348 | |||||||||||||||
| Principal base of operations | Canada | Dominican Republic | Canada | Chile | Chile | Canada | ||||||||||||||||
- (a)
- Inter-segment sales are eliminated during the preparation of the internal financial statements.
- (b)
- Identifiable assets by geographic location are as follows:
| | Total assets | Property, plant and equipment | ||||||||||
|---|---|---|---|---|---|---|---|---|---|---|---|---|
| | December 31 | |||||||||||
| (Millions) | ||||||||||||
| 2002 | 2001 | 2002 | 2001 | |||||||||
| Canada | $ | 2,485 | $ | 2,496 | $ | 2,036 | $ | 2,050 | ||||
| Chile | 1,909 | 1,874 | 1,565 | 1,585 | ||||||||
| Barbados | 92 | 60 | 2 | 1 | ||||||||
| Norway | 225 | 228 | 209 | 218 | ||||||||
| Dominican Republic | 272 | 222 | 131 | 121 | ||||||||
| Other | 221 | 189 | 12 | 13 | ||||||||
| $ | 5,204 | $ | 5,069 | $ | 3,955 | $ | 3,988 | |||||
FALCONBRIDGE LIMITED 2002 ANNUAL REPORT / PAGE 60
- (c)
- Consolidated sales revenues:
- (i)
- By geographic location of customers:
| | Year Ended December 31 | |||||||||
|---|---|---|---|---|---|---|---|---|---|---|
| | 2002 | 2001 | ||||||||
| (Millions) | ||||||||||
| Amount | % | Amount | % | |||||||
| Europe | $ | 1,038 | 43 | $ | 855 | 40 | ||||
| U.S. | 673 | 28 | 684 | 32 | ||||||
| Other | 443 | 19 | 405 | 19 | ||||||
| Total foreign* | $ | 2,154 | 90 | $ | 1,944 | 91 | ||||
| Canada | 240 | 10 | 194 | 9 | ||||||
| $ | 2,394 | 100 | $ | 2,138 | 100 | |||||
| *Includes sales by Canadian operations to foreign customers | $ | 1,155 | $ | 1,075 | ||||||
- (ii)
- By product category:
| | Year Ended December 31 | |||||||||
|---|---|---|---|---|---|---|---|---|---|---|
| | 2002 | 2001 | ||||||||
| (Millions) | ||||||||||
| Amount | % | Amount | % | |||||||
| Nickel | $ | 776 | 32 | $ | 638 | 30 | ||||
| Ferronickel | 234 | 10 | 238 | 11 | ||||||
| Copper | 970 | 41 | 794 | 37 | ||||||
| Zinc | 197 | 8 | 213 | 10 | ||||||
| Cobalt | 71 | 3 | 77 | 4 | ||||||
| Palladium | 53 | 2 | 124 | 6 | ||||||
| Other | 93 | 4 | 54 | 2 | ||||||
| $ | 2,394 | 100 | $ | 2,138 | 100 | |||||
14. FINANCIAL INSTRUMENTS
The Corporation's Board of Directors approved a financial risk management policy addressing the philosophy, implementation and control of financial risk management and investment activities. Falconbridge manages its exposures by entering into contractual arrangements (derivatives) which reduce (hedge) the exposures by creating an offsetting position.
Falconbridge has significant investments in foreign domiciled operations. In addition, the Corporation has foreign currency denominated monetary assets and liabilities. Consistent with the financial risk management policy, these items are hedged by issuing debt in the same currency as the investment, and by entering into forward exchange and option contracts. At December 31, 2002, the Corporation had outstanding foreign currency forward contracts relating to these exposures to sell a notional amount of U.S.$61.3 million, with maturity dates through April 2003 at an average exchange rate of Cdn$1.5637 (2001 — U.S.$283.9 million at Cdn$1.5757). If these contracts had been settled at December 31, 2002, the Corporation would have owed $1.1 million (2001 — owed $4.9 million). At December 31, 2002, Falconbridge also had foreign currency forward contracts to sell U.S.$94.2 million (2001 — U.S.$25.9 million) for Chilean pesos to hedge certain expenditures associated with its Chilean operations for periods extending through March 2004. If these contracts had been settled at December 31, 2002, Falconbridge would have paid $5.9 million (2001 — paid $0.8 million).
FALCONBRIDGE LIMITED 2002 ANNUAL REPORT / PAGE 61
Falconbridge's sales are denominated primarily in U.S. dollars and to a lesser extent in Euros, Yen and other foreign currencies, and it incurs expenses that are denominated in foreign currencies, which expose it to increased volatility in earnings due to fluctuations in foreign exchange rates. Falconbridge uses foreign currency forward exchange contracts and options to reduce these exposures by creating an offsetting position. The Corporation has foreign currency exchange contracts, designated as a hedge of its U.S. dollar sales revenue, to sell U.S.$415.0 million maturing over the next 24 months at an average exchange rate of Cdn$1.5734 (2001 — U.S.$400.0 million at Cdn$1.5485). In addition, the Corporation also has option contracts that if exercised, would result in additional sales of U.S.$125.0 million over the next five months (2001 — U.S.$105.0 million). If these contracts had been settled at December 31, 2002, the Corporation would have paid $10.9 million (2001 — paid $17.8 million). Falconbridge has foreign currency exchange contracts, designated as a hedge of its Norwegian Kroner expenditures, to purchase $333.0 million Norwegian Kroner, up to September 2007, at an average exchange rate of Cdn$0.1984 (2001 — $75.0 million Norwegian Kroner at Cdn$0.1690). In addition, the Corporation also has option contracts that if exercised, would result in additional purchases of $165.0 million Norwegian Kroner over the next 10 months (2001 — $75.0 million Norwegian Kroner). If these contracts had been settled at December 31, 2002, Falconbridge would have received $5.7 million (2001 — received $0.5 million).
Falconbridge's risk management policy provides for the limited use of financial instruments for discretionary trading purposes. However, Falconbridge normally does not acquire, hold or issue derivative financial instruments for trading purposes.
The fair value of Falconbridge's primary financial instruments, including cash and cash equivalents, accounts and metals settlements receivable, and accounts payable and accrued charges approximates their carrying value due to the short-term nature of these instruments. The fair value of the long-term debt and interest rate swaps is disclosed in note 6.
Falconbridge does not consider the credit risk associated with its financial instruments to be significant. Foreign currency and interest rate swap contracts are maintained with high-quality counterparties and Falconbridge does not anticipate that any counterparties will fail to meet their obligation. Falconbridge does not have significant exposure to any individual customer and these risks are further managed through a highly effective credit management program. Falconbridge's policy is to enter into short-term investments in high-quality debt obligations.
Falconbridge is exposed to interest rate risk as a result of its issuance of debt. Falconbridge reduces its borrowing costs and hedges its exposure to interest rate risk through the use of interest rate swaps and interest rate swap options, the details of which are disclosed in note 6.
15. RELATED PARTY TRANSACTIONS
At December 31, 2002, Noranda Inc. (Noranda) owned, directly and indirectly, approximately 59.5% of the common shares of the Corporation. Falconbridge has entered into an agreement with a subsidiary of Noranda, whereby it acts as sales agent for all products, other than sulphuric acid and indium, produced at Falconbridge's Kidd Creek Operations. Falconbridge has entered into a supply agreement with another subsidiary of Noranda which will purchase and resell Falconbridge's output of sulphuric acid. Accounts receivable, in the consolidated statements of financial position, includes $37.3 million (2001 — $41.3 million) receivable from Noranda relating to amounts being collected under the sales agreements and $9.7 million (2001 — $3.5 million) from purchases of material by Noranda. Falconbridge also has agreements with various other Noranda group companies for the purchase of custom feeds; the toll treatment of copper concentrates, blister copper and refinery slimes; and the sale of metals.
FALCONBRIDGE LIMITED 2002 ANNUAL REPORT / PAGE 62
The following table details related party production and marketing transactions with Noranda Group Companies:
| | Year Ended December 31 | |||||
|---|---|---|---|---|---|---|
| | 2002 | 2001 | ||||
| Sale of materials and technology to Noranda (a) | $ | 113,014 | $ | 45,908 | ||
| Purchase of materials from and smelting and refining fees paid to Noranda (b) | 58,530 | 2,791 | ||||
| Commissions and agency fees paid to Noranda (c) | 1,191 | 1,586 | ||||
| Fees paid relating to sulphuric acid (a) | 3,209 | 5,681 | ||||
| Other (a), (b), (d) | 694 | 4,760 | ||||
Included in the Corporation's Consolidated Financial Statements in (a) Revenues; (b) Cost of metal and other product sales; (c) Selling, general and administrative expenses; (d) Other (income) expenses.
During the year, a process was initiated to integrate certain activities of Noranda and Falconbridge with the objective of maximizing synergies. The initiatives undertaken have included the alignment of various corporate support services and the merging of management teams. Agreements between Falconbridge and the Noranda group companies are negotiated on terms which are fair and equitable to Falconbridge and reflect fair market terms.
16. ACQUISITION
On July 26, 2001 Falconbridge acquired all of the issued and outstanding shares of Compañía Minera Falconbridge Lomas Bayas (Lomas Bayas — formerly Compañía Minera Lomas Bayas) and Compañía Minera Falconbridge Limitada (formerly Compañía Minera Boliden Westmin Chile Limitada) for cash consideration of $100.7 million. The results of operations have been included in the consolidated financial statements from that date. Lomas Bayas is engaged in the exploration for and mining of copper in Chile.
The following table summarizes the estimated fair value of the assets acquired and liabilities assumed at the date of acquisition.
| Cash and cash equivalents | $ | 16,867 | |
| Other current assets | 23,637 | ||
| Capital assets | 220,601 | ||
| Future income and mining taxes | 17,777 | ||
| Intangibles | 7,363 | ||
| Other non-current assets | 3,486 | ||
| Total assets acquired | 289,731 | ||
| Current portion of long-term debt | 23,566 | ||
| Other current liabilities | 25,719 | ||
| Long-term debt | 138,187 | ||
| Other long-term liabilities | 1,530 | ||
| Total liabilities assumed | 189,002 | ||
| Net assets acquired | �� | $ | 100,729 |
The intangible assets represent water rights with an indefinite life that are not subject to amortization.
Falconbridge also has the right to retain the Fortuna de Cobre copper deposit by making a payment of U.S.$15.0 million before July 26, 2006.
FALCONBRIDGE LIMITED 2002 ANNUAL REPORT / PAGE 63
17. COMMITMENTS AND CONTINGENCIES
(a) The Corporation has received an exemption granted by the Ontario government, until December 31, 2009, from a requirement to refine in Canada ores mined from certain properties of the Corporation in Ontario. This exemption is limited to the quantity of nickel-copper matte capable of yielding not more than 100,000,000 pounds of refined nickel per year.
(b) From time to time, Falconbridge is involved in litigation, investigations or proceedings relating to claims arising out of its operations in the ordinary course of business. In the opinion of management, the aggregate amount of any potential liability is not expected to have a material adverse effect on Falconbridge's financial position or results.
18. COMPARATIVE AMOUNTS
Certain of the comparative figures have been restated to conform to the current year's presentation.
FALCONBRIDGE LIMITED 2002 ANNUAL REPORT / PAGE 64
| (Unaudited) | 2002 | 2001 | 2000 | 1999 | 1998 | 1997 | 1996 | 1995 | 1994 | 1993 | ||||||||||||
|---|---|---|---|---|---|---|---|---|---|---|---|---|---|---|---|---|---|---|---|---|---|---|
| Operating results ($000s) | ||||||||||||||||||||||
| Revenues | 2,394,035 | 2,138,249 | 2,614,596 | 2,173,479 | 1,673,756 | 2,092,597 | 2,145,003 | 2,323,608 | 1,960,335 | 1,432,953 | ||||||||||||
| EBITDA(1) | 485,385 | 356,911 | 826,397 | 589,632 | 176,114 | 441,770 | 609,643 | 709,116 | 455,200 | 194,848 | ||||||||||||
| Depreciation, depletion and amortization | 348,704 | 330,853 | 290,762 | 293,092 | 195,332 | 187,159 | 184,571 | 158,351 | 160,967 | 159,528 | ||||||||||||
| Earnings (loss) for the year | 73,354 | 15,967 | 368,273 | 153,097 | (36,398 | ) | 137,047 | 247,926 | 333,222 | 131,252 | (44,462 | ) | ||||||||||
| Operating cash flow | 341,427 | 354,447 | 657,350 | 349,053 | 176,926 | 391,775 | 540,377 | 554,230 | 329,044 | 188,149 | ||||||||||||
| Capital expenditures and deferred project costs | 357,740 | 348,328 | 249,628 | 169,687 | 658,554 | 1,023,962 | 686,404 | 251,017 | 102,441 | 85,606 | ||||||||||||
| Per common share data | ||||||||||||||||||||||
| Net income (loss) | 0.34 | 0.02 | 2.01 | 0.80 | (0.24 | ) | 0.75 | 1.40 | 1.89 | N/A | N/A | |||||||||||
| Cash dividends | 0.40 | 0.40 | 0.40 | 0.40 | 0.40 | 0.40 | 0.40 | 0.40 | N/A | N/A | ||||||||||||
| Operating cash flow | 1.86 | 1.93 | 3.65 | 1.91 | 0.96 | 2.19 | 3.05 | 3.14 | N/A | N/A | ||||||||||||
| Number of common shares issued at end of year (000s) | 177,603 | 176,977 | 176,977 | 176,971 | 176,968 | 176,968 | 176,946 | 176,848 | N/A | N/A | ||||||||||||
| Financial position ($000s) | ||||||||||||||||||||||
| Cash and equivalents | 259,933 | 198,315 | 250,438 | 101,485 | 99,805 | 129,702 | 316,815 | 464,266 | 307,548 | 31,829 | ||||||||||||
| Total assets | 5,203,590 | 5,069,460 | 4,809,995 | 4,737,044 | 4,798,741 | 4,313,907 | 3,595,248 | 3,309,130 | 2,901,903 | 2,536,939 | ||||||||||||
| Working capital | 626,560 | 482,396 | 639,891 | 527,139 | 425,434 | 479,085 | 696,470 | 928,805 | 640,903 | 153,157 | ||||||||||||
| Property, plant and equipment, net | 3,954,570 | 3,987,676 | 3,663,646 | 3,665,656 | 3,931,841 | 3,398,993 | 2,535,308 | 2,068,060 | 1,850,222 | 1,911,040 | ||||||||||||
| Long-term debt | 2,022,534 | 1,867,321 | 1,462,012 | 1,575,047 | 1,725,639 | 1,136,363 | 636,809 | 619,801 | 473,389 | 1,627,466 | ||||||||||||
| Shareholders' equity | 2,285,301 | 2,280,008 | 2,346,964 | 2,394,876 | 2,318,040 | 2,320,015 | 2,180,843 | 2,001,849 | 1,732,602 | 240,792 | ||||||||||||
| Total liabilities | 2,918,289 | 2,789,452 | 2,463,031 | 2,342,168 | 2,480,701 | 1,993,892 | 1,414,405 | 1,307,281 | 1,169,301 | 2,296,147 | ||||||||||||
| Net debt/net debt plus equity | 44% | 42% | 34% | 38% | 41% | 30% | 13% | 7% | N/A | N/A | ||||||||||||
| Return on common shareholders' equity | 3% | 0% | 17% | 6% | -2% | 6% | 11% | 17% | N/A | N/A | ||||||||||||
| Return on net assets employed | 4% | 1% | 14% | 10% | -1% | 14% | 25% | 31% | N/A | N/A | ||||||||||||
| Production statistics (tonnes) | ||||||||||||||||||||||
| Mine Nickel | ||||||||||||||||||||||
| — Sudbury | 27,833 | 25,226 | 23,234 | 35,678 | 38,348 | 38,225 | 42,546 | 34,254 | 37,313 | 38,223 | ||||||||||||
| — Raglan | 24,636 | 24,570 | 23,089 | 19,524 | 16,365 | — | — | — | — | — | ||||||||||||
| — Falcondo | 23,303 | 21,662 | 27,830 | 24,454 | 25,209 | 32,545 | 30,376 | 30,885 | 30,758 | 23,861 | ||||||||||||
| 75,772 | 71,458 | 74,153 | 79,656 | 79,922 | 70,770 | 72,922 | 65,139 | 68,071 | 62,084 | |||||||||||||
| Refined Nickel | ||||||||||||||||||||||
| — FNA | 68,530 | 68,221 | 58,679 | 74,137 | 70,152 | 62,702 | 61,584 | 53,238 | 67,955 | 56,817 | ||||||||||||
| — Falcondo | 23,303 | 21,662 | 27,830 | 24,454 | 25,209 | 32,545 | 30,376 | 30,885 | 30,758 | 23,861 | ||||||||||||
| 91,833 | 89,883 | 86,509 | 98,591 | 95,361 | 95,247 | 91,960 | 84,123 | 98,713 | 80,678 | |||||||||||||
| Mine Copper | ||||||||||||||||||||||
| — Sudbury | 31,050 | 22,858 | 20,990 | 40,999 | 46,235 | 42,663 | 48,890 | 41,588 | 44,388 | 44,046 | ||||||||||||
| — Raglan | 6,500 | 6,915 | 6,308 | 4,930 | 4,365 | — | — | — | — | — | ||||||||||||
| — Kidd Creek | 45,434 | 42,340 | 54,926 | 67,429 | 67,143 | 75,751 | 86,157 | 83,401 | 80,693 | 109,044 | ||||||||||||
| — Collahuasi | 185,014 | 193,135 | 186,073 | 185,739 | — | — | — | — | — | — | ||||||||||||
| — Lomas Bayas | 59,304 | 24,702 | — | — | — | — | — | — | — | — | ||||||||||||
| 327,302 | 289,950 | 268,297 | 299,097 | 117,743 | 118,414 | 135,047 | 124,989 | 125,081 | 153,090 | |||||||||||||
| Refined Copper | ||||||||||||||||||||||
| — FNA | 30,632 | 26,722 | 25,307 | 33,262 | 31,658 | 32,870 | 33,938 | 34,333 | 39,415 | 37,205 | ||||||||||||
| — Kidd Creek | 146,526 | 127,824 | 122,987 | 121,278 | 114,987 | 114,594 | 99,109 | 101,984 | 104,948 | 98,041 | ||||||||||||
| — Collahuasi | 26,678 | 26,180 | 25,579 | 22,573 | — | — | — | — | — | — | ||||||||||||
| — Lomas Bayas | 59,304 | 24,702 | — | — | — | — | — | — | — | — | ||||||||||||
| 263,140 | 205,428 | 173,873 | 177,113 | 146,645 | 147,464 | 133,047 | 136,317 | 144,363 | 135,246 | |||||||||||||
- (1)
- EBITDA — represents earnings before interest, income and mining taxes, depreciation and amortization, and non-controlling interest.
N/A — not applicable — prior to the IPO in 1994.
FALCONBRIDGE LIMITED 2002 ANNUAL REPORT / PAGE 65
CONSOLIDATED RESULTS — 2002 AND 2001 BY QUARTERS
| | 2002 | 2001 | ||||||||||||||||||||||||||||||
|---|---|---|---|---|---|---|---|---|---|---|---|---|---|---|---|---|---|---|---|---|---|---|---|---|---|---|---|---|---|---|---|---|
| (Unaudited) | ||||||||||||||||||||||||||||||||
| 1st Qtr. | 2nd Qtr. | 3rd Qtr. | 4th Qtr. | Year | 1st Qtr. | 2nd Qtr. | 3rd Qtr. | 4th Qtr. | Year | |||||||||||||||||||||||
| OPERATIONS (thousands, except per share data) | ||||||||||||||||||||||||||||||||
| Revenues | $ | 525,595 | $ | 634,439 | $ | 538,936 | $ | 695,065 | $ | 2,394,035 | $ | 532,466 | $ | 569,903 | $ | 522,192 | $ | 513,688 | $ | 2,138,249 | ||||||||||||
| Operating expenses | ||||||||||||||||||||||||||||||||
| Costs of metal and other product sales | 370,743 | 428,682 | 406,625 | 526,778 | 1,732,828 | 409,791 | 386,808 | 399,681 | 397,070 | 1,593,350 | ||||||||||||||||||||||
| Selling, general and administrative | 36,349 | 31,887 | 32,861 | 35,291 | 136,388 | 30,071 | 27,214 | 30,357 | 33,624 | 121,266 | ||||||||||||||||||||||
| Development and preproduction | 24,504 | 28,834 | 22,203 | 12,796 | 88,337 | 14,453 | 18,741 | 23,072 | 32,795 | 89,061 | ||||||||||||||||||||||
| Depreciation and depletion | 65,623 | 65,885 | 64,687 | 64,172 | 260,367 | 57,808 | 57,531 | 61,764 | 64,689 | 241,792 | ||||||||||||||||||||||
| Exploration | 6,369 | 8,565 | 12,623 | 6,136 | 33,693 | 5,543 | 9,918 | 12,501 | 11,568 | 39,530 | ||||||||||||||||||||||
| Research and process development | 3,186 | 3,376 | 2,696 | 3,683 | 12,941 | 3,525 | 3,765 | 3,528 | 6,101 | 16,919 | ||||||||||||||||||||||
| Other (income)/expenses | (9,971 | ) | (3,552 | ) | 15,035 | (8,712 | ) | (7,200 | ) | (5,671 | ) | 5,810 | 14,180 | (4,046 | ) | 10,273 | ||||||||||||||||
| 496,803 | 563,677 | 556,730 | 640,144 | 2,257,354 | 515,520 | 509,787 | 545,083 | 541,801 | 2,112,191 | |||||||||||||||||||||||
| Operating income (loss) | 28,792 | 70,762 | (17,794 | ) | 54,921 | 136,681 | 16,946 | 60,116 | (22,891 | ) | (28,113 | ) | 26,058 | |||||||||||||||||||
| Interest | 20,752 | 22,911 | 22,317 | 22,218 | 88,198 | 21,531 | 20,042 | 21,880 | 23,220 | 86,673 | ||||||||||||||||||||||
| Earnings (loss) before taxes and non-controlling interest | 8,040 | 47,851 | (40,111 | ) | 32,703 | 48,483 | (4,585 | ) | 40,074 | (44,771 | ) | (51,333 | ) | (60,615 | ) | |||||||||||||||||
| Income and mining taxes (credit) expense | (11,222 | ) | 5,826 | (19,209 | ) | (214 | ) | (24,819 | ) | (9,512 | ) | (16,061 | ) | (20,049 | ) | (29,780 | ) | (75,402 | ) | |||||||||||||
| Non-controlling interest in (loss) earnings of subsidiaries | (1,168 | ) | 879 | 419 | (182 | ) | (52 | ) | 325 | 338 | (820 | ) | (1,023 | ) | (1,180 | ) | ||||||||||||||||
| Earnings (loss) for the period | 20,430 | 41,146 | (21,321 | ) | 33,099 | 73,354 | 4,602 | 55,797 | (23,902 | ) | (20,530 | ) | 15,967 | |||||||||||||||||||
| Dividends on preferred shares | 3,128 | 3,127 | 3,127 | 3,127 | 12,509 | 2,970 | 2,971 | 2,970 | 3,127 | 12,038 | ||||||||||||||||||||||
| Earnings (loss) attributable to common shares | $ | 17,302 | $ | 38,019 | $ | (24,448 | ) | $ | 29,972 | $ | 60,845 | $ | 1,632 | $ | 52,826 | $ | (26,872 | ) | $ | (23,657 | ) | $ | 3,929 | |||||||||
| Earnings (loss) per common share (note 1) | $ | 0.10 | $ | 0.21 | $ | (0.14 | ) | $ | 0.17 | $ | 0.34 | $ | 0.01 | $ | 0.30 | $ | (0.15 | ) | $ | (0.13 | ) | $ | 0.02 | |||||||||
| Weighted average number of shares outstanding (thousands) | 176,977 | 177,018 | 177,020 | 177,092 | 177,022 | 176,977 | 176,977 | 176,977 | 176,977 | 176,977 | ||||||||||||||||||||||
| EARNINGS (LOSS) CONTRIBUTIONS (thousands) | ||||||||||||||||||||||||||||||||
| Principal operations — | ||||||||||||||||||||||||||||||||
| Integrated Nickel Operations (INO) | $ | 39,998 | $ | 45,590 | $ | 9,025 | $ | 52,023 | $ | 146,636 | $ | (3,032 | ) | $ | 64,605 | $ | 18,594 | $ | 4,439 | $ | 84,606 | |||||||||||
| Falconbridge Dominicana, C. por A. | (15,509 | ) | 12,055 | 6,189 | (1,813 | ) | 922 | 5,089 | 7,013 | (12,778 | ) | (17,499 | ) | (18,175 | ) | |||||||||||||||||
| Nickel Operations | 24,489 | 57,645 | 15,214 | 50,210 | 147,558 | 2,057 | 71,618 | 5,816 | (13,060 | ) | 66,431 | |||||||||||||||||||||
| Kidd Creek Operations | (20,827 | ) | (18,234 | ) | (14,889 | ) | (23,800 | ) | (77,750 | ) | (6,158 | ) | (14,553 | ) | (18,375 | ) | (24,903 | ) | (63,989 | ) | ||||||||||||
| Collahuasi | 33,210 | 44,045 | 19,778 | 35,098 | 132,131 | 35,416 | 32,177 | 25,921 | 28,840 | 122,354 | ||||||||||||||||||||||
| Lomas Bayas | 8,810 | 6,592 | 4,467 | 8,094 | 27,963 | — | — | 4,814 | 2,804 | 7,618 | ||||||||||||||||||||||
| Copper Operations | 21,193 | 32,403 | 9,356 | 19,392 | 82,344 | 29,258 | 17,624 | 12,360 | 6,741 | 65,983 | ||||||||||||||||||||||
| Corporate and other | (16,890 | ) | (19,286 | ) | (42,364 | ) | (14,681 | ) | (93,221 | ) | (14,369 | ) | (29,126 | ) | (41,067 | ) | (21,794 | ) | (106,356 | ) | ||||||||||||
| Operating income (loss) | 28,792 | 70,762 | (17,794 | ) | 54,921 | 136,681 | 16,946 | 60,116 | (22,891 | ) | (28,113 | ) | 26,058 | |||||||||||||||||||
| Interest | 20,752 | 22,911 | 22,317 | 22,218 | 88,198 | 21,531 | 20,042 | 21,880 | 23,220 | 86,673 | ||||||||||||||||||||||
| Income and mining taxes (credit) expense | (11,222 | ) | 5,826 | (19,209 | ) | (214 | ) | (24,819 | ) | (9,512 | ) | (16,061 | ) | (20,049 | ) | (29,780 | ) | (75,402 | ) | |||||||||||||
| Non-controlling interest in (loss) earnings of subsidiaries | (1,168 | ) | 879 | 419 | (182 | ) | (52 | ) | 325 | 338 | (820 | ) | (1,023 | ) | (1,180 | ) | ||||||||||||||||
| Earnings (loss) for the period | 20,430 | 41,146 | (21,321 | ) | 33,099 | 73,354 | 4,602 | 55,797 | (23,902 | ) | (20,530 | ) | 15,967 | |||||||||||||||||||
| Dividends on preferred shares | 3,128 | 3,127 | 3,127 | 3,127 | 12,509 | 2,970 | 2,971 | 2,970 | 3,127 | 12,038 | ||||||||||||||||||||||
| Earnings (loss) attributable to common shares | $ | 17,302 | $ | 38,019 | $ | (24,448 | ) | $ | 29,972 | $ | 60,845 | $ | 1,632 | $ | 52,826 | $ | (26,872 | ) | $ | (23,657 | ) | $ | 3,929 | |||||||||
| Earnings (loss) per common share (note 1) | $ | 0.10 | $ | 0.21 | $ | (0.14 | ) | $ | 0.17 | $ | 0.34 | $ | 0.01 | $ | 0.30 | (0.15 | ) | $ | (0.13 | ) | $ | 0.02 | ||||||||||
| METAL SALES (tonnes, except precious metal revenues and silver) | ||||||||||||||||||||||||||||||||
| | | | | | | | | | | | | |||||||||||||||||||||
|---|---|---|---|---|---|---|---|---|---|---|---|---|---|---|---|---|---|---|---|---|---|---|---|---|---|---|---|---|---|---|---|---|
| INO | — Nickel | 18,768 | 17,137 | 14,780 | 20,468 | 71,153 | 12,305 | 16,701 | 17,201 | 19,032 | 65,239 | |||||||||||||||||||||
| — Copper | 15,627 | 13,634 | 11,470 | 13,764 | 54,495 | 5,870 | 7,213 | 9,784 | 11,647 | 34,514 | ||||||||||||||||||||||
| — Precious metal revenues (thousands) | $ | 28,479 | $ | 30,888 | $ | 31,173 | $ | 26,526 | $ | 117,066 | $ | 53,827 | $ | 61,085 | $ | 36,099 | $ | 40,042 | $ | 191,053 | ||||||||||||
FALCONBRIDGE LIMITED 2002 ANNUAL REPORT / PAGE 65
| Kidd Creek | — Zinc (including metal in concentrate) | 35,073 | 39,118 | 34,508 | 39,719 | 148,418 | 36,599 | 38,088 | 34,613 | 32,371 | 141,671 | |||||||||||||||||||||
| — Copper (including metal in concentrate) | 25,410 | 24,096 | 29,699 | 31,370 | 110,575 | 29,686 | 26,796 | 23,316 | 25,345 | 105,143 | ||||||||||||||||||||||
| — Silver (thousands of ounces) | 378 | 1,124 | 986 | 1,235 | 3,723 | 1,004 | 613 | 858 | 781 | 3,256 | ||||||||||||||||||||||
| Nickel in ferronickel | 543 | 7,460 | 6,279 | 7,164 | 21,446 | 7,226 | 7,024 | 5,550 | 4,772 | 24,572 | ||||||||||||||||||||||
| Collahuasi | — Copper (including metal in concentrate) | 42,029 | 53,348 | 42,390 | 49,757 | 187,524 | 47,007 | 49,150 | 47,694 | 48,007 | 191,858 | |||||||||||||||||||||
| Lomas Bayas | — Copper | 15,939 | 14,324 | 14,402 | 15,600 | 60,265 | — | — | 13,149 | 14,266 | 27,415 | |||||||||||||||||||||
| | | | | | | | | | | | |||||||||||||||||||||
|---|---|---|---|---|---|---|---|---|---|---|---|---|---|---|---|---|---|---|---|---|---|---|---|---|---|---|---|---|---|---|---|
| AVERAGE PRICES REALIZED (U.S.$ per pound, except silver) | |||||||||||||||||||||||||||||||
| Nickel | $ | 2.84 | $ | 3.23 | $ | 3.23 | $ | 3.28 | $ | 3.14 | $ | 3.18 | $ | 3.13 | $ | 2.67 | $ | 2.36 | $ | 2.79 | |||||||||||
| Ferronickel | 2.68 | 3.12 | 3.22 | 3.19 | 3.16 | 3.19 | 2.97 | 2.76 | 2.29 | 2.85 | |||||||||||||||||||||
| Copper | 0.74 | 0.75 | 0.67 | 0.72 | 0.72 | 0.77 | 0.75 | 0.66 | 0.65 | 0.70 | |||||||||||||||||||||
| Zinc | 0.39 | 0.39 | 0.38 | 0.38 | 0.39 | 0.50 | 0.46 | 0.41 | 0.38 | 0.44 | |||||||||||||||||||||
| Silver (per ounce) | 4.44 | 4.70 | 4.70 | 4.54 | 4.61 | 4.54 | 4.41 | 4.21 | 4.35 | 4.39 | |||||||||||||||||||||
| Exchange rate before hedge (U.S.$1=Cdn$) | $ | 1.60 | $ | 1.56 | $ | 1.56 | $ | 1.57 | $ | 1.57 | $ | 1.52 | $ | 1.55 | $ | 1.54 | $ | 1.58 | $ | 1.55 | |||||||||||
| Exchange rate after hedge (U.S.$1=Cdn$) | $ | 1.58 | $ | 1.56 | $ | 1.55 | $ | 1.57 | $ | 1.56 | $ | 1.49 | $ | 1.52 | $ | 1.52 | $ | 1.54 | $ | 1.52 | |||||||||||
Note:
- 1.
- See note 10(c) to the Consolidated Financial Statements.
FALCONBRIDGE LIMITED 2002 ANNUAL REPORT / PAGE 66
CORPORATE GOVERNANCE PRACTICES
INTRODUCTION
Falconbridge Limited's Board of Directors believes that effective corporate governance contributes to improved corporate performance and enhanced shareholder value. The governance of the Corporation is the responsibility of Falconbridge's Board of Directors and six committees of the Board: the Audit Committee, the Corporate Governance and Nominating Committee, the Environment, Safety and Health Committee, the Human Resources and Compensation Committee, the Independent Directors' Committee, and the Pension Investment Committee.
BOARD MANDATE
The Board is responsible for supervising the management of the business and affairs of Falconbridge and to act with a view to the best interests of the Corporation. As part of the merging of certain management and business functions of Falconbridge and Noranda Inc., the Board has adopted specific policies and guidelines. These policies and guidelines ensure that the allocation of both the costs related to these common areas, as well as the allocation of new business opportunities, are fair and equitable to the Corporation.
The Board assumes the following stewardship responsibilities: the adoption of a strategic planning and budgeting process; the identification of the principal risks of the Corporation's business and ensuring the implementation of appropriate systems to manage these risks; succession planning, including appointing, training and monitoring senior management; the integrity of the Corporation's internal control and management information systems; a public disclosure policy for the Corporation; and, the adoption of an inter-company transactions policy whereby the Independent Directors' Committee reviews transactions between Noranda and Falconbridge to ensure they are conducted on terms which are fair and equitable to Falconbridge and reflect fair market terms.
SHAREHOLDER FEEDBACK
The Board believes that management should speak for the Corporation in its communications with its shareholders. Falconbridge has an investor relations department that is dedicated to working closely with members of the investment community, institutional investors and individual shareholders. Shareholders receive timely dissemination of information and the Corporation has procedures in place to obtain and respond to feedback from its shareholders. The Board reviews Falconbridge's major communications with shareholders and the public, including quarterly press releases, the annual management information circular and the annual report.
EXPECTATIONS OF MANAGEMENT
The Board believes that management is responsible for the development of long-term strategies for the Corporation. Special meetings of the Board of Directors are held from time to time to deal with long-term strategies of the Corporation. The Board appreciates the value of having selected senior officers attend board meetings to provide information and opinions to assist the directors in their deliberations.
Falconbridge's full statement of corporate governance practices can be found in the 2002 Management Information Circular. For a copy, contact our Corporate Secretary's department at (416) 982-7111.
FALCONBRIDGE LIMITED 2002 ANNUAL REPORT / PAGE 67
Alex Balogh Chairman of the Board Aaron Regent President & Chief Executive Officer Brent Chertow President, Canadian Copper & Recycling Joseph Laezza President, Nickel Fernando Porcile President, Copper Michael Doolan Senior Vice President & Chief Financial Officer Robert Burrow Vice President Finance — Nickel Operations Dean Chambers Treasurer Sergio Chavez President & General Manager Ferronickel Operations Denis Couture Vice President Communications & Public Affairs | Craig Duff Assistant Treasurer Anthony Hannaford Senior Vice President Technology Allen Hayward Vice President Nickel MiningDavid Holowack Vice President Strategy & Six Sigma Olle Johansson Vice President Marketing & Sales André Joron Vice President Human Resources Peter Kukielski Senior Vice President Projects Patrice Lafrance Assistant Secretary Ted Laks Vice President Performance/Six Sigma | Thomas Pugsley Senior Vice President Projects & Engineering Katherine Rethy Senior Vice President Procurement, Logistics, Transportation & Information Services Martin Schady Senior Vice President Business Development Paul Severin Senior Vice President Exploration Julia Sievwright Secretary & Assistant General Counsel Jeffery Snow Senior Vice President & General Counsel Robert Telewiak Vice President Environment, Safety & Health |
FALCONBRIDGE LIMITED 2002 ANNUAL REPORT / PAGE 68
Alex Balogh Chairman of the Board, Falconbridge Limited.Deputy Chairman, Noranda Inc. Corporate Director. Appointed 1989. (2, 4) Jack Cockwell Co-Chairman, Brascan Corporation. Appointed 1995. (4) Robert J. Harding Chairman, Brascan Corporation. Appointed 2000. (1, 3, 6) David Kerr Executive Chairman, Noranda Inc. Appointed 1989. (2, 4) Edmund King Deputy Chairman, Rockwater Capital Corporation. Appointed 1994. (2, 4, 5, 6) | Neville Kirchmann President & Chief Executive Officer, The Princess Margaret Hospital Foundation. Appointed 1997. (1, 4, 5) Mary Mogford Corporate Director & Partner, Mogford Campbell Associates Inc. Appointed 1995. (1, 2, 3, 5) Derek Pannell President & Chief Executive Officer, Noranda Inc. Appointed 2001. (3, 6) David Race Corporate Director. Appointed 1994. (1, 3, 5) | Aaron Regent President & Chief Executive Officer, Falconbridge Limited. Appointed 2002. (7) James Wallace President, Pioneer Construction, Inc. Appointed 2001. (1, 5, 6) Committees (1) Audit Committee (2) Corporate Governance and Nominating Committee (3) Environment, Safety and Health Committee (4) Human Resources and Compensation Committee (5) Independent Directors' Committee (6) Pension Investment Committee (7) Ex-officio non-voting member on all committees |
FALCONBRIDGE LIMITED 2002 ANNUAL REPORT / PAGE 69
HEAD OFFICE Falconbridge Limited BCE Place 181 Bay Street Suite 200 Toronto, Ontario M5J 2T3 Telephone: (416) 982-7111 Fax: (416) 982-7423 NICKEL Sudbury Mines/Mill Onaping, Ontario P0M 2R0 Telephone: (705) 966-3411 Fax: (705) 966-6544 Parviz Farsangi,General Manager Sudbury Smelter Falconbridge, Ontario P0M 1S0 Telephone: (705) 693-2761 Fax: (705) 699-3932 David Rae,General Manager Société minière Raglandu Québec ltée 120, avenue de l'Aéroport Rouyn-Noranda, Quebec J9X 5B7 Telephone: (819) 762-7800 Fax: (819) 797-0531 Denis Lachance,General Manager, Raglan Operations Falconbridge Nikkelverk A/S Serviceboks 604 N-4606 Kristiansand South, Norway Telephone: 47-38-10-10-10 Fax: 47-38-10-10-11 Edward Henriksen,Managing Director Falconbridge Dominicana, C. por A. Bonao, Dominican Republic Telephone: (809) 682-6041 Fax: (809) 221-8423 Sergio Chavez,President & General Manager | CUSTOM FEED Falconbridge International Limited Suite 201, Stevmar House Rockley, Christ Church, Barbados Telephone: (246) 435-9969 Fax: (246) 435-9978 Ric Lorrimer,President Falconbridge International S.A. Avenue Lloyd George 7, Box 2 B — 1000 Brussels, Belgium Telephone: (32-2) 401-8330 Fax: (32-2) 401-8331 Michael McSorley,Chairman COPPER Compañía Minera Doña Inés de Collahuasi S.C.M. Av. Andrés Bello 2687, Piso 11 Las Condes-Casilla 180 Santiago, Chile Telephone: (56-2) 362-6500 Fax: (56-2) 362-6562 Thomas Keller,Chief Executive Officer Kidd Mining Division Postal Bag 2002 Timmins, Ontario P4N 7K1 Telephone: (705) 264-5200 Fax: (705) 267-8709 Dan Gignac,General Manager Kidd Metallurgical Division Postal Bag 2002 Timmins, Ontario P4N 7K1 Telephone: (705) 235-8121 Fax: (705) 235-7318 Daniel Picard,General Manager Compañía Minera Falconbridge Lomas Bayas Galleguillos Lorca 1610 Antofagasta, Chile Telephone: (56) 55 252-577 Fax: (56) 55 227-348 Gerald Wolfe,General Manager | CORPORATE Marketing and Sales Subsidiaries and Offices Falconbridge Europe S. A. Avenue Lloyd George 7, Box 2 B — 1000 Brussels, Belgium Telephone: (32-2) 401-8200 Fax: (32-2) 401-8201 John Smillie,President Falconbridge (Japan) Ltd. Nihonbashi First Building 8F 2-19, Nihonbashi 1-Chome Chuo-ku, Tokyo 103, Japan Telephone: (81-3) 3272-0900 Fax: (81-3) 3272-0901 Toshiaki Oiwa,President Falconbridge U.S. Inc. Twin Towers — Suite 245 4955 Steubenville Pike Pittsburgh, Pennsylvania U.S.A. 15205-9604 Telephone: (412) 787-0220 Fax: (412) 787-0287 James Moore,President |
FALCONBRIDGE LIMITED 2002 ANNUAL REPORT / PAGE 70
Exploration Offices Queen's Quay Terminal 207 Queen's Quay West Suite 800 Toronto, Ontario M5J 1A7 Telephone: (416) 982-7111 Fax: (416) 982-7420 David Gower,General Manager, Nickel Exploration Tony Green,General Manager, Copper Exploration Technology Centre P.O. Box 40 Falconbridge, Ontario P0M 1S0 Telephone: (705) 693-2761 Fax: (705) 699-3600 Michael Welch,Manager of Geology, Sudbury Region P.O. Bag 2002 Timmins, Ontario P4N 7K1 Telephone: (705) 264-5200 Fax: (705) 267-8996 Damien Duff,Manager of Geology, Timmins Region 3296, Avenue Francis-Hugues Laval, Québec H7L 5A7 Telephone: (450) 668-2112 Fax: (450) 668-2929 James Robertson,Director of Exploration, North America | Falconbridge (Australia) Pty. Limited Exploration Division Suite 701, Level 7 Toowong Tower — 9 Sherwood Road Toowong, Queensland, 4066 Australia Telephone: (617) 3721-4222 Fax: (617) 3871-1379 Scott Bruce,Director of Exploration, Australasia Falconbridge Ventures of Africa (Pty.) Ltd. P.O. Box 12708 Hatfield 0028 Pretoria South Africa Telephone: 27(12) 348-2182 Fax: 27(12) 348-2117 Dean MacEachern,Regional Exploration Manager, Africa Falconbridge Brasil Ltda. Avenida Afonso Pena 2770 2nd Andar 30130-007 — Funcionarios Belo Horizonte — MG 30130 — BRASIL Telephone: (55-31) 3281-2800 ext. 111 Fax: (55-31) 3281-5595 Helio Diniz,Exploration Manager, Brazil | Subsidiaries, Project Offices and Associated Companies Noranda Chile Limitada — Falconbridge Chile S.A. Avenida 11 de Septiembre 2353 Piso 14 Providencia Santiago, Chile Telephone: (56-2) 337-0600 Fax: (56-2) 334-7220 Fernando Porcile,President, Copper Falconbridge Nouvelle Calédonie SAS 9 rue Austerlitz, 6e étage BP MGA 08 Nouméa Cedex 98802 Nouvelle Calédonie Telephone: (687) 246-040 Fax: (687) 246-049 Bruce Dumville,Project Director Falconbridge (Australia) Pty. Ltd. Suite 701, Level 7 Toowong Tower — 9 Sherwood Road Toowong, Queensland, 4066 Australia Telephone: (617) 3721-4222 Fax: (617) 3871-1379 Brian Hill,Managing Director Falconbridge France SAS 17 Square Edouard VII 75009 Paris Telephone: 33 (01) 53-43-51-60 Fax: 33 (01) 53-43-51-62 Derek Job,President |
FALCONBRIDGE LIMITED 2002 ANNUAL REPORT / PAGE 71
Stock Exchange Listing
Toronto, Trade Symbol:
FL (Common Shares)
FL.PR.A (Preferred Shares Series 2)
INDEX LISTINGS
S&P/TSX Composite
S&P/TSX Mining
S&P/TSX Materials
S&P/TSX MidCap
OUTSTANDING SHARES (MILLIONS)
| December 31, 2002 | ||
| Common Shares | 177.6 | |
| Preferred Shares Series 1 | 0.1 | |
| Preferred Shares Series 2 | 7.9 |
ANNUAL DIVIDEND PER SHARE
| Common Shares | 40¢ | ||
| Preferred Shares Series 1 | 8¢ | ||
| Preferred Shares Series 2 | $ | 1.4688 |
FALCONBRIDGE DIVIDEND POLICY
Falconbridge views common share dividends as an important part of a shareholder's return on investment. As a result, it aims to pay a common share dividend at all points of the economic cycle, as long as the payment does not impair the Corporation's financial position. It is expected that the common share dividend will increase or decrease to reflect the Corporation's operating results and financial position.
The preferred shares of each series issued by the Corporation rank in priority to the common shares with respect to the payment of dividends.
AUDITORS
Deloitte & Touche LLP
Toronto, Ontario
ANNUAL MEETING
The annual meeting of the shareholders will be held on April 17, 2003 at the Design Exchange, Trading Floor, 234 Bay Street, Toronto at 11 a.m.
TRANSFER AGENT & REGISTRAR
For information regarding dividend cheques, share certificates, stock transfers, etc., please contact: Computershare Trust Company of Canada
Telephone: 1-800-564-6253 or (514) 982-7270
Fax: 1-888-453-0330 or (416) 263-9394 caregistryinfo@computershare.com
FALCONBRIDGE LIMITED 2002 ANNUAL REPORT / PAGE 72
INQUIRIES
Denis Couture
Vice-President
Communications & Public Affairs
Telephone: (416) 982-7020
VISIT OUR WEBSITE
Browse www.falconbridge.com to learn more about Falconbridge and the mining industry.
VERSION FRANÇAISE
La version française du rapport annuel sera fournie sur demande.
SHARE TRADING INFORMATION
| | Quarter | Common Share Volume | Low | High | ||||||
|---|---|---|---|---|---|---|---|---|---|---|
| | | (Millions) | | | ||||||
| 2002 | First | 24 | $ | 17.00 | $ | 18.89 | ||||
| Second | 28 | 17.95 | 20.95 | |||||||
| Third | 23 | 14.25 | 20.15 | |||||||
| Fourth | 22 | 13.30 | 16.20 | |||||||
2001 | First | 23 | $ | 15.60 | $ | 19.30 | ||||
| Second | 25 | 16.00 | 20.15 | |||||||
| Third | 17 | 14.00 | 17.25 | |||||||
| Fourth | 26 | 13.90 | 15.93 | |||||||
FALCONBRIDGE LIMITED 2002 ANNUAL REPORT / PAGE 73
FALCONBRIDGE LIMITED
BCE Place
181 Bay Street, Suite 200
Toronto, Ontario
M5J 2T3
Notice of the Annual Meeting of Shareholders
NOTICE IS HEREBY GIVEN that the annual meeting of the shareholders of Falconbridge Limited (the "Corporation") will be held at the Design Exchange, Trading Floor, 234 Bay Street, Toronto, Ontario on Thursday, Apri1 17, 2003 commencing at 11:00 a.m. (Toronto time) for the following purposes:
- 1.
- to receive the consolidated financial statements of the Corporation for the year ended December 31, 2002 together with the report of the auditor thereon;
- 2.
- to elect directors;
- 3.
- to appoint an auditor and to authorize the directors to fix the auditor's remuneration; and
- 4.
- to transact such other business as may properly come before the meeting or any adjournment or adjournments thereof.
Full particulars of the foregoing matters are set forth in the accompanying management information circular. A copy of the 2002 Annual Report of the Corporation containing the consolidated financial statements of the Corporation as at and for the year ended December 31, 2002 together with the report of the auditor thereon accompanies this notice.
Shareholders are invited to attend the meeting. Shareholders who are unable to be present at the meeting are requested to date, complete, sign and return the accompanying proxy in the envelope provided for that purpose, not later than 48 hours prior to the meeting.
DATED at Toronto, Ontario, this 28th day of February, 2003.
By Order of the Board of Directors
Julia K. Sievwright
Secretary and Assistant General Counsel
FALCONBRIDGE LIMITED
Management Information Circular
SOLICITATION OF PROXIES
This management information circular (the "Circular") is furnished in connection with the solicitation by the management of Falconbridge Limited (the "Corporation") of proxies for use at the annual meeting of shareholders of the Corporation (the "Meeting") to be held on Thursday, April 17, 2003, at the Design Exchange, Trading Floor, 234 Bay Street, Toronto, Ontario commencing at 11:00 a.m. (Toronto time), and at any adjournment thereof, for the purposes set forth in the Notice of Meeting. The solicitation will be primarily by mail, but proxies may also be solicited personally or by telephone by directors, officers, employees or representatives of the Corporation. All costs of solicitation will be borne by the Corporation.
APPOINTMENT AND REVOCATION OF PROXIES
The persons named in the accompanying form of proxy are officers of the Corporation.A shareholder has the right to appoint a person (who need not be a shareholder) other than the persons named in the accompanying form of proxy to represent the shareholder at the Meeting and the shareholder may exercise this right either by inserting that person's name in the blank space provided in the form of proxy and striking out the other names or by completing another proper form of proxy. A form of proxy will not be valid unless it is completed and delivered to the Corporation at least 48 hours prior to the Meeting, or any adjournment thereof.
Proxies given by shareholders for use at the Meeting may be revoked at any time prior to their use. In addition to revocation in any other manner permitted by law, a proxy may be revoked by depositing an instrument in writing executed by the shareholder or his or her attorney authorized in writing or, where the shareholder is a corporation, by a duly authorized officer or attorney of the corporation, at the registered office of the Corporation, BCE Place, 181 Bay Street, Suite 200, Toronto, Ontario, M5J 2T3, at any time up to and including the last business day preceding the day of the Meeting, or any adjournment thereof, at which the proxy is to be used, or with the chairman of the Meeting on the day of the Meeting or any adjournment thereof, and upon either of such deposits the proxy is revoked.
VOTING AND DISCRETION OF PROXIES
On any ballot that may be called for, the shares represented by proxies in favour of the persons named by management of the Corporation will be voted for or against, or voted for or withheld from voting on, the matters identified in the proxy, in each case in accordance with the instructions of the shareholder.In the absence of any instructions on the proxy, it is the intention of the persons named by management in the accompanying form of proxy to vote (a) for the election of management's nominees as directors; (b) for the appointment of management's nominee as auditor and the authorization of the directors to fix the remuneration of the auditor; and (c) in accordance with management's recommendations with respect to amendments or variations of the matters set out in the Notice of Meeting or any other matters which may properly come before the Meeting.
The accompanying form of proxy confers discretionary authority upon the persons named therein with respect to amendments or variations of the matters identified in the Notice of Meeting or any other matters that may properly come before the Meeting. As at the date of this Circular, management of the Corporation knows of no such amendments, variations or other matters that may properly come before the Meeting other than the matters referred to in the Notice of Meeting.
VOTING SHARES AND PRINCIPAL SHAREHOLDERS
As at February 28, 2003, the authorized capital of the Corporation consisted of an unlimited number of common shares ("Common Shares"), of which 177,611,232 Common Shares were issued and outstanding and an unlimited number of preferred shares, issuable in series, of which 89,835 cumulative preferred shares series 1 and 7,910,165 cumulative preferred shares series 2 were issued and outstanding.
1
All Common Shares may be voted at the Meeting. A holder of record of Common Shares as at the close of business on February 27, 2003 (the "Record Date") is entitled to one vote for each Common Share held by him or her. The affirmative vote of a majority of the votes cast at the Meeting is required for approval of each matter set forth in this Circular.
To the knowledge of the directors and officers of the Corporation, as of the date of this Circular, Noranda Inc. ("Noranda"), which beneficially owns 105,759,100 Common Shares, representing approximately 59.5% of the issued and outstanding Common Shares, is the only person who owns beneficially, directly or indirectly, more than 10% of the outstanding Common Shares as at such date.
The management of the Corporation understands that Brascan Corporation ("Brascan") and associated companies own 96,604,783 common shares of Noranda (or approximately 40% of the common shares) and convertible debentures convertible into 2,722,323 common shares.
Brascan is a public company listed on the Toronto and New York stock exchanges. Brascan's major shareholder is EdperPartners ("EdperPartners") who, together with its shareholders, collectively own, directly or indirectly, exercise control or direction over, or have options and warrants to acquire, approximately 30 million Class A Limited Voting Shares of Brascan, representing approximately 16% of the outstanding Class A Limited Voting Shares of Brascan on a fully diluted basis, and 85,120 Class B Limited Voting Shares, representing all of the Class B Limited Voting Shares of Brascan.
Shareholders of EdperPartners, in addition to receiving dividends from their investments in EdperPartners, participate in an investment fund (the "Fund") that was formed and financed by EdperPartners in 2001 to invest in securities other than those issued by Brascan and its affiliates. In January 2003, the Fund distributed $3.0 million of investment income to participants with no individual participant receiving more than $178,200. Messrs. Balogh, Cockwell, Harding, Kerr, Pannell and Regent, directors of the Corporation, who are shareholders of EdperPartners collectively received a total of $892,948 of distributions from the Fund.
In accordance with theBusiness Corporations Act (Ontario), the Corporation will prepare a list of holders of Common Shares on the Record Date. Each holder of Common Shares named in the list will be entitled to vote the Common Shares shown opposite his or her name on the list at the Meeting, except to the extent that the holder has transferred any of his or her shares after the Record Date and the transferee of those shares produces properly endorsed certificates evidencing the transferred shares or otherwise establishes that he or she owns the transferred shares and requests in writing, not later than the close of business on April 7, 2003, that the Corporation's transfer agent include his or her name on the list of holders of Common Shares entitled to vote at the Meeting, in which case the transferee is entitled to vote the transferred shares at the Meeting.
The number of directors of the Corporation to be elected at the Meeting is 11. Each director will hold office until the next annual meeting of shareholders of the Corporation or until his or her successor is elected or appointed, unless his or her office is earlier vacated in accordance with the by-laws of the Corporation.
The 11 persons whose names are set forth in the following table are management's nominees for election as directors of the Corporation. All of such persons are currently directors of the Corporation. It is intended that, on any ballot that may be called for relating to the election of directors, the shares represented by proxies in favour of management will be voted for the election of such persons as directors of the Corporation, unless a shareholder has specified in his or her proxy that his or her shares are to be withheld from voting in the election of directors. If, prior to the Meeting, any of such persons becomes unable or unwilling to serve as a director, discretionary authority will be exercised and the shares represented by proxies in favour of management will be voted for the election of such other person or persons as directors in accordance with the best judgement of management, unless a shareholder has specified in his or her proxy that his or her shares are to be withheld from voting in the election of directors. Management is not aware that any of such persons will be unable or unwilling to serve as a director.
2
Those directors who are currently members of the Audit Committee, the Human Resources and Compensation Committee and the other committees of the Board of Directors are indicated in the following table. The Corporation does not have an Executive Committee.
NOMINEES FOR ELECTION AS DIRECTOR
| Name, Position and Office with the Corporation or Significant Affiliate | Period during which a Director of the Corporation | Principal Occupation and Name of Employer | Number of Common Shares Beneficially Owned or Controlled (directly or indirectly)(1) | Deferred Share Units Held | ||||
|---|---|---|---|---|---|---|---|---|
| Alex G. Balogh(3)(5) Director, Chairman of the Corporation and Deputy Chairman, Noranda Inc. | Since September 1989 | Corporate Director | 1,000 | Nil | ||||
| Jack L. Cockwell(5) Director of the Corporation and Group Chairman, Brascan Corporation | Since December 1995 | Group Chairman, Brascan Corporation | 2,000 | Nil | ||||
| Robert J. Harding F.C.A.(2)(4)(7) Director of the Corporation and Chairman, Brascan Corporation | Since July 2000 | Chairman, Brascan Corporation | 1,000 | Nil | ||||
| David W. Kerr(3)(5) Director of the Corporation and Chairman, Noranda Inc. | Since September 1989 | Chairman, Noranda Inc. | 1,000 | Nil | ||||
| G. Edmund King(3)(5)(6)(7) Director of the Corporation | Since June 1994 | Deputy Chairman, Rockwater Capital Corporation | 1,000 | Nil | ||||
| Neville W. Kirchmann(2)(5)(6) Director of the Corporation | Since December 1997 | President and Chief Executive Officer, The Princess Margaret Hospital Foundation | 1,000 | 710 | ||||
| Mary A. Mogford(2)(3)(4)(6) Director of the Corporation | Since December 1995 | Corporate Director and Partner, Mogford Campbell Inc. | 1,000 | Nil | ||||
| Derek G. Pannell(4)(7) Director, Deputy Chairman of the Corporation and President and Chief Executive Officer, Noranda Inc. | Since April 2001 | President and Chief Executive Officer, Noranda Inc. | Nil | Nil | ||||
| David H. Race(2)(4)(6) Director of the Corporation | Since April 1994 | Corporate Director | 1,000 | Nil | ||||
| Aaron W. Regent Director, President and Chief Executive Officer of the Corporation | Since February 2002 | President and Chief Executive Officer of the Corporation | Nil | 12,012 | ||||
| James D. Wallace(2)(6)(7) Director of the Corporation | Since January 2001 | President, Pioneer Construction Inc. | 10,000 | 1,466 |
NOTES:
- (1)
- THE INFORMATION AS TO COMMON SHARES BENEFICIALLY OWNED OR CONTROLLED IS NOT WITHIN THE KNOWLEDGE OF MANAGEMENT AND HAS BEEN FURNISHED BY THE RESPECTIVE NOMINEES FOR ELECTION AS DIRECTOR. THE INFORMATION IS AS OF DECEMBER 31, 2002.
- (2)
- MEMBER OF THE AUDIT COMMITTEE
- (3)
- MEMBER OF THE CORPORATE GOVERNANCE AND NOMINATING COMMITTEE
- (4)
- MEMBER OF THE ENVIRONMENT, SAFETY AND HEALTH COMMITTEE
- (5)
- MEMBER OF THE HUMAN RESOURCES AND COMPENSATION COMMITTEE
- (6)
- MEMBER OF THE INDEPENDENT DIRECTORS' COMMITTEE
- (7)
- MEMBER OF THE PENSION INVESTMENT COMMITTEE
3
Each of the proposed nominees was elected to his or her present term of office by the shareholders of the Corporation at a meeting in respect of which the Corporation circulated to shareholders a management information circular.
4
HUMAN RESOURCES AND COMPENSATION COMMITTEE
The Human Resources and Compensation Committee (the "Committee") of the Board of Directors is responsible for reviewing overall compensation strategy, objectives and policies; annually reviewing and assessing the Chief Executive Officer's performance against pre-agreed objectives; reviewing performance assessments of other senior executive officers; ensuring that appropriate succession plans are in place and reviewing executive appointments, and administering the Corporation's executive compensation program including providing recommendations to the Board of Directors with respect to the compensation of the senior officers of the Corporation. As at December 31, 2002, the members of the Committee were: David W. Kerr (Chair), Alex G. Balogh, Jack L. Cockwell, G. Edmund King and Neville W. Kirchmann. The Committee met three (3) times during the year ended December 31, 2002.
Messrs. Kerr, Balogh, Cockwell, King and Kirchmann were neither executive officers nor employees of the Corporation or any of its subsidiaries during the year ended December 31, 2002.
REPORT ON EXECUTIVE COMPENSATION
The Corporation's total compensation policy for executives is designed to attract, retain and motivate top quality people at the executive level, compensate executives for performance relative to the established plans and strategy of the business, and motivate executives to maximize the long-term value of the Corporation's assets and business operations. Information on the compensation practices of competitors is reviewed, but does not drive the philosophy or design of the Corporation's programs. The Committee focuses on rewarding performance, and not on entitlement or excessive levels of employment security. Performance incentives that are tied directly to increases in shareholder value are essential components of the program.
The Committee believes that a high proportion of an executive's compensation should be weighted to variable compensation tied to the Corporation's performance. For executives other than the Corporation's President and Chief Executive Officer, this is achieved by providing base salaries at the median level for comparable companies within the relevant industry and a total compensation package including base salary, incentive payments and other compensation, at or above the median of comparable industries, provided predetermined objectives are consistently met and that corporate financial goals are achieved and its performance is better than that of comparable industries. In the case of the President and Chief Executive Officer, this is achieved by maintaining base salary and incentive payments below the median level in return for an opportunity to participate at a higher level in the growth in the value of the Corporation's shares.
The individual components of executive compensation and the objectives of the Committee in each case are:
BASE SALARY
Base salaries of the Corporation's executives are reviewed annually to ensure that they reflect the contribution of each executive.
INCENTIVE PAYMENTS
Annual Incentive Bonus Program
The Annual Incentive Bonus Program (the "AIB") generates cash incentives based on corporate, divisional and individual performance. Target awards, expressed as a percentage of salary, have been established for each eligible position. Corporate performance is determined on the basis of the Corporation's return on capital employed (the "ROCE"). All of the Named Executive Officers participated in the Falconbridge AIB in 2002 except Mr. Regent.
5
LONG TERM INCENTIVE PLANS
Stock Option Plan
The objective of the Stock Option Plan, originally established in 1994 and amended in 1997 and 2002 (the "SOP"), is to advance the interests of the Corporation by providing executives and certain other employees with a financial incentive for the continued improvement in the performance of the Corporation and encouragement to continue employment with the Corporation.
All of the Named Executive Officers were granted Falconbridge options approved by the Board of Directors on February 5, 2003 (the "2003 Grant") and all of the Named Executive Officers, except Mr. Regent, were granted Falconbridge options approved by the Board of Directors on January 30, 2002 (the "2002 Grant").
The options granted in 2002 have an exercise price equal to the market price at the time of the 2002 Grants. The market price of an option for the 2002 Grants was defined as the simple average of the daily averages of the high and low prices at which a board lot of Common Shares traded on the Toronto Stock Exchange on each of the five trading days before the date of the grant of option and was calculated to be $16.58. These options vest 20% on each of the first five anniversaries of the date of the grant, and are exercisable over a ten year period from the date of grant.
The 2002 Grants also provided that, on the first day that the Market Price of the Corporation's shares, as defined in the SOP, exceeds the exercise price of the options by at least 20%, the unvested portion of the option that would otherwise in the normal course vest on the fifth anniversary of the 2002 Grants shall immediately vest and be exercisable by an employee.
Effective June 28, 2002, the "Market Growth Feature" under the SOP was discontinued and option holders may elect to exercise an option using the Purchase Method only. The "Market Price" for exercise purposes is defined as the actual market price at the time of sale or the participant's pre-determined sale price, valid for 30 calendar days; and for future option grant purposes, the closing price of the Common Shares on the Toronto Stock Exchange on the last trading day on which the Common Shares were traded on such exchange prior to the grant of an option.
The market price of an option for the 2003 Grants was the closing price of the shares on the Toronto Stock Exchange on the trading day immediately preceding the date of grant of these options by the Board of Directors and was calculated to be $16.65. These options vest 20% on each of the first five anniversaries of the date of the grant, and are exercisable over a ten year period from the date of grant.
In February 2003, in order to minimize any appearance of executives opportunistically exercising options for personal gains, the Board of Directors discontinued the accelerated vesting provision as noted above for options granted on or after February 5, 2003 and established a policy requiring key executives of the Corporation (including all Named Executive Officers) to hold, for at least one year, the "net shares" of the Corporation received from the exercise of an option granted on or after February 5, 2003. For this purpose "net shares" means the number of Common Shares obtained through the exercise of such option, less the number of Common Shares required to be sold in order to make payment of: (a) the exercise price of the option; and (b) any income taxes attributable to the gain on exercise of the option.
DEFERRED SHARE UNIT PLAN ("DSUP")
The DSUP was recommended and approved by the Board of Directors effective July 2002. Under this plan, senior officers designated by the Human Resources and Compensation Committee may, at their option, receive all or a portion of their annual performance awards in the form of deferred share units ("Units"). The annual bonus awards are converted to Units based on the closing price of the shares on the Toronto Stock Exchange on the last trading day immediately preceding the date of the award. The portion of the annual bonus award elected to be received in Units by the executive may, at the discretion of the Human Resources and Compensation Committee, be increased by a factor of up to two times for purposes of calculating the number of Units to be paid on the Common Shares of the Corporation. Deferred Share Units are credited with Dividend Equivalents when dividends are paid on the Corporation's Common Shares.
6
The Units vest over a five-year period and participants are only allowed to redeem the Units upon cessation of employment through retirement, resignation, termination or death, after which time the Units will terminate unless redeemed by the last day of the first calendar year that commences after retirement, resignation, termination or death. The cash value of the Units when redeemed will be equivalent to the market value of an equivalent number of Falconbridge Common Shares at the time of cessation of employment with the Corporation. In connection with 2002, the President and Chief Executive Officer elected to participate in the DSUP.
OTHER COMPENSATION
Other components of the total compensation program for executives are the Pension Plans, the Executive Benefit Plan, the Employee Share Savings Plan and other perquisites. These are taken into account in assessing the competitiveness of the overall executive compensation.
The Pension Plans provide comprehensive coverage through the defined benefit and defined contribution plans. All of the Named Executive Officers participate in the Falconbridge Retirement Income Plan (a defined benefit plan) except Mr. Regent, who participates in the Noranda Retirement Annuity Plan — Defined Contribution option.
The Executive Benefit Plan provides a broad range of health care (private hospital, major medical, vision care, drug plan, and dental care), short and long-term disability coverage, and three types of life insurance (group life, accidental death and dismemberment, and travel accident). All of the Named Executive Officers participated in the Executive Benefit Plan in 2002 except Mr. Regent.
Under the Employee Share Savings Plan, all eligible employees (including executives) may make a base contribution of up to 5% of their gross base salary and bonus payments, and a supplemental contribution of up to 5% of their gross base salary and bonus payments, towards the purchase of Common Shares, with the Corporation contributing 30% of the base contribution towards the purchase of additional Common Shares. All employees enrolled in the plan participate on the same basis.
COMPENSATION OF THE CHIEF EXECUTIVE OFFICER
Mr. Aaron Regent was appointed President and Chief Executive Officer of Falconbridge effective June 1, 2002.
Mr. Regent's annual salary was $325,000 and he was awarded an annual incentive bonus of $100,000. This incentive bonus takes into account his performance both as the President and Chief Executive Officer of Falconbridge for the period June 1, 2002 to December 31, 2002, as well as his performance as the Executive Vice President and Chief Financial Officer of Noranda, the position he held prior to June 1, 2002. Mr. Regent elected to receive Units pursuant to the DSUP in lieu of receiving his bonus award in cash and the Board exercised its discretion to increase the amount of the award by a factor of two times. Mr. Regent received 12,012 Units.
Prior to Mr. Regent's appointment, Mr. Derek Pannell held the position of President and Chief Executive Officer of the Corporation from February 27, 2002 to May 31, 2002. Mr. Pannell received no compensation from Falconbridge during the time he held the position of President and Chief Executive Officer of the Corporation and did not participate in any of the Falconbridge executive or other programs.
Mr. Øyvind Hushovd was President and Chief Executive Officer of the Corporation from January 1, 2002 until February 26, 2002. His arrangements with the Corporation are noted below in "Employment Agreement with Former Executive".
This report has been submitted by David W. Kerr (Chair), Alex G. Balogh, Jack L. Cockwell, G. Edmund King and Neville W. Kirchmann as members of the Committee.
7
SUMMARY COMPENSATION TABLE
The following table sets forth a summary of the compensation earned during the years ended December 31, 2002, 2001 and 2000 by Mr. Regent and the four other most highly compensated officers who served as executive officers at the end of 2002 (the "Named Executive Officers"):
| | | Annual Compensation | Long-Term Compensation | |||||||||||
|---|---|---|---|---|---|---|---|---|---|---|---|---|---|---|
| Name & Principal Position | Year | Salary ($) | Bonus ($) | Other Annual Compensation ($)(1) | Securities Under Options Granted (#)(2) | DSUP Units (#) | All Other Compensation ($)(3) | |||||||
| Aaron Regent(4) President and Chief Executive Officer | 2002 2001 2000 | 305,962 280,000 164,000 | — — 96,647 | 12,613 — — | 100,000 43,500 70,000 | 12,012 8,176 — | 13,750 — — | |||||||
| Joseph Laezza President, Nickel Business Unit | 2002 2001 2000 | 235,167 212,500 206,083 | 43,000 28,927 59,785 | 29,442 — — | 27,000 27,000 13,000 | — — — | 1,829 1,652 1,603 | |||||||
| Paul Severin Senior Vice President Exploration | 2002 2001 2000 | 230,167 212,350 203,000 | 30,100 26,266 45,371 | 21,061 — — | 27,000 27,000 13,000 | — — — | 1,790 1,650 1,579 | |||||||
| Brent Chertow President, Canadian Copper & Recycling Business Unit | 2002 2001 2000 | 227,500 191,933 184,208 | 43,000 23,616 52,987 | 31,748 — — | 27,000 24,000 11,500 | — — — | 1,769 1,492 1,432 | |||||||
| Thomas Pugsley Senior Vice President, Projects and Engineering | 2002 2001 2000 | 224,583 217,750 192,250 | 29,300 31,689 55,858 | 23,841 — — | 27,000 27,000 11,500 | — — — | 1,746 1,693 1,495 | |||||||
NOTES:
- (1)
- PERQUISITES AND BENEFITS VARY SOMEWHAT BY NAMED EXECUTIVE OFFICER AND INCLUDE ITEMS SUCH AS CAR BENEFIT, INTEREST ON LOANS, GAS REIMBURSEMENT, FINANCIAL/TAX PLANNING, ANNUAL EXECUTIVE MEDICAL, CLUB MEMBERSHIPS, PARKING AND THE EXECUTIVE HEALTH CARE PLAN IN 2002. THE VALUE OF PERQUISITES AND OTHER PERSONAL BENEFITS FOR EACH NAMED EXECUTIVE OFFICER DID NOT EXCEED THE LESSER OF $50,000 AND 10% OF THE TOTAL OF ANNUAL BASE SALARY AND BONUS IN 2001 AND 2000.
- (2)
- THESE CONSIST OF OPTIONS TO PURCHASE COMMON SHARES GRANTED UNDER THE FALCONBRIDGE SOP, EXCEPT FOR MR. REGENT WHOSE NUMBERS REFLECT OPTIONS TO PURCHASE COMMON SHARES GRANTED UNDER THE NORANDA SOP IN EACH OF 2000, 2001 AND 2002.
- (3)
- THE AMOUNTS SHOWN IN THIS COLUMN REFLECT THE DOLLAR VALUE OF PREMIUMS PAID FOR TERM LIFE INSURANCE FOR THE BENEFIT OF EACH NAMED EXECUTIVE OFFICER.
- (4)
- THE EARNINGS DISCLOSED IN THE TABLE ABOVE FOR 2002 REPRESENT MR. REGENT'S COMPENSATION IN 2002 FROM BOTH NORANDA AND FALCONBRIDGE. PRIOR TO HIS APPOINTMENT AS PRESIDENT AND CHIEF EXECUTIVE OFFICER OF FALCONBRIDGE, MR. REGENT HELD THE POSITION OF EXECUTIVE VICE PRESIDENT AND CHIEF FINANCIAL OFFICER OF NORANDA INC. HIS COMPENSATION FOR SERVICES IN 2002 TO NORANDA WAS $116,378 IN SALARY. THE AMOUNTS IN THE TABLE FOR 2001 REPRESENT MR. REGENT'S COMPENSATION FROM NORANDA INC. THE AMOUNTS SHOWN AS SALARY AND BONUS FOR 2000 REPRESENT A PARTIAL YEAR BASED ON AN ANNUAL SALARY OF $260,000 FOR SERVICES TO NORANDA. THE OPTION TO PURCHASE 70,000 COMMON SHARES OF NORANDA AT AN EXERCISE PRICE OF $15.46 IN 2000 WAS GRANTED IN CONNECTION WITH MR. REGENT'S EMPLOYMENT AT NORANDA IN 2000.
MR. REGENT DID NOT RECEIVE ANY FALCONBRIDGE STOCK OPTION GRANTS IN 2002, BUT DID RECEIVE A GRANT OF 100,000 NORANDA STOCK OPTIONS IN FEBRUARY 2002 AT A PRICE OF $15.55. THE AMOUNTS LISTED IN 2001 AND 2002 ARE STOCK OPTIONS GRANTED TO MR. REGENT BY NORANDA.
MR. REGENT ELECTED TO RECEIVE THIS BONUS IN THE FORM OF UNITS IN LIEU OF RECEIVING CASH. THE UNITS SHOWN FOR 2002 REPRESENT UNITS RECEIVED UNDER THE FALCONBRIDGE PLAN AT A PRICE OF $16.65 PER UNIT, AND THE UNITS SHOWN FOR 2001 REPRESENT UNITS RECEIVED UNDER THE NORANDA PLAN AT A PRICE OF $15.41 PER UNIT.
MR. REGENT PARTICIPATES IN NORANDA'S RETIREMENT ANNUITY PLAN DEFINED CONTRIBUTION SUB-PLAN; $13,500 WAS CONTRIBUTED BY NORANDA ON HIS BEHALF TO THE PLAN; $250 ABOVE THE CANADA CUSTOMS AND REVENUE AGENCY MAXIMUM OF $13,500 IS A NOTIONAL, UNFUNDED AMOUNT OWING TO MR. REGENT. THESE AMOUNTS ARE NOTED IN "ALL OTHER COMPENSATION" IN THE TABLE.
8
STOCK OPTION PLAN
The following table sets forth a summary of grants of options to the Named Executive Officers and includes the most recent grant issued in February 2003 and options granted during the financial year ended December 31, 2002:
| Name | Date of Grant | Securities Under Options Granted (#) | Percent of Total Options Granted to Employees in Financial Year | Exercise or Base Price ($/Security) | Expiration Date | Market Value of Securities Underlying Options on Date of Grant ($/Security) | ||||||
|---|---|---|---|---|---|---|---|---|---|---|---|---|
| Aaron Regent(1) | February 5, 2003 | 82,000 | 11.39% | 16.65 | February 4, 2013 | 16.65 | ||||||
| Joseph Laezza | February 5, 2003 | 32,000 | 4.44% | 16.65 | February 4, 2013 | 16.65 | ||||||
| January 30, 2002 | 27,000 | 2.31% | 16.58 | January 29, 2012 | 16.58 | |||||||
| Paul Severin(2) | February 5, 2003 | 15,000 | 2.08% | 16.65 | February 4, 2013 | 16.65 | ||||||
| January 30, 2002 | 27,000 | 2.31% | 16.58 | January 29, 2012 | 16.58 | |||||||
| Brent Chertow(2) | February 5, 2003 | 16,000 | 2.22% | 16.65 | February 4, 2013 | 16.65 | ||||||
| January 30, 2002 | 27,000 | 2.31% | 16.58 | January 29, 2012 | 16.58 | |||||||
| Thomas Pugsley | February 5, 2003 | 21,000 | 2.92% | 16.65 | February 4, 2013 | 16.65 | ||||||
| January 30, 2002 | 27,000 | 2.31% | 16.58 | January 29, 2012 | 16.58 |
NOTES:
- (1)
- MR. REGENT RECEIVED A GRANT OF 82,000 FALCONBRIDGE STOCK OPTIONS IN FEBRUARY 2003. MR. REGENT RECEIVED A GRANT OF 100,000 NORANDA STOCK OPTIONS IN FEBRUARY 2002 AND WAS NOT GRANTED ANY FALCONBRIDGE OPTIONS UPON HIS APPOINTMENT AS PRESIDENT AND CHIEF EXECUTIVE OFFICER OF FALCONBRIDGE EFFECTIVE JUNE 1, 2002.
- (2)
- MESSRS. SEVERIN AND CHERTOW WERE ALSO GRANTED NORANDA STOCK OPTIONS IN FEBRUARY 2003, TO RECOGNIZE THEIR DUAL MANAGEMENT RESPONSIBILITY FOR BUSINESS GROUPS UNDER BOTH FALCONBRIDGE AND NORANDA.
The following table sets forth, on an aggregate basis, details of each exercise of stock options and the number and value of the unexercised options as at February 28, 2003.
| Name | Securities Acquired on Exercise (#) | Aggregate Value Realized ($) | Unexercised Options at February 28, 2003 Exercisable/Unexercisable (#) | Value of Unexercised in the Money Options(2) at February 28, 2003 Exercisable/Unexercisable ($) | ||||
|---|---|---|---|---|---|---|---|---|
| Aaron Regent(1) | — | — | 0/82,000 | 0/62,320 | ||||
| Joseph Laezza | — | — | 74,000/68,000 | 59,388/60,362 | ||||
| Paul Severin | — | — | 68,800/51,000 | 59,388/47,442 | ||||
| Brent Chertow | — | — | 48,000/49,800 | 35,004/45,730 | ||||
| Thomas Pugsley | — | — | 64,700/56,000 | 56,604/51,306 |
NOTES:
- (1)
- MR. REGENT DID NOT HOLD ANY FALCONBRIDGE STOCK OPTIONS IN 2002. THE FIGURE SHOWN REPRESENTS THE 82,000 FALCONBRIDGE STOCK OPTIONS GRANTED TO MR. REGENT IN FEBRUARY 2003.
- (2)
- AN OPTION IS "IN THE MONEY" AT FEBRUARY 28, 2003 IF THE MARKET PRICE OF THE OPTION ON THAT DATE EXCEEDS THE EXERCISE PRICE OF THE OPTION. THE VALUE OF UNEXERCISED OPTIONS AT FEBRUARY 28, 2003 IS EQUAL TO THE DIFFERENCE BETWEEN THE MARKET PRICE OF THE OPTIONS AT FEBRUARY 28, 2003 AND THE EXERCISE PRICE OF THE OPTIONS. THE MARKET PRICE FOR FALCONBRIDGE IS THE CLOSING PRICE OF $17.41 ON FEBRUARY 28, 2003.
9
RETIREMENT INCOME PLAN ("RIP")
Messrs. Laezza, Severin, Chertow and Pugsley participate in the Retirement Income Plan ("RIP"), a defined benefit retirement plan for Canadian based salaried employees.
Credited service for these officers participating in the RIP as at December 31, 2002, was as follows: Joseph Laezza, 22.33 years; Paul Severin, 32.58 years; Brent Chertow, 27.58 years, and Thomas Pugsley, 27.50 years.
The RIP provides comprehensive coverage on a defined benefit basis and it includes features such as protection against inflation, several retirement options including retirement after 30 years of service, a supplemental temporary pension until age 65, and survivor benefit of 662/3% of the basic pension.
The Named Executive Officers who participate in the RIP have, to date, accrued retirement income benefits that exceed Canada Customs and Revenue Agency's maximum pension limits. The excess benefits of Messrs. Laezza, Severin, Chertow and Pugsley are payable directly by the Corporation.
Mr. Regent participates in the Retirement Annuity Plan ("RAP") — Noranda Group. In October 2001, the Noranda Board approved an amendment to the RAP. Effective January 1, 2002, the plan allowed members to elect conversion, on a voluntary basis, to a new defined contribution option on both a past and future service basis. Mr. Aaron Regent elected to participate in the defined contribution option (RAP-DC) on a non-contributory basis. The contributions made into Mr. Regent's RAP-DC account exceeded the contribution limit set ($13,500) by Canada Customs and Revenue Agency by $250.00. This amount was allocated to Mr. Regent in a notional, unfunded account, which will be payable directly by Noranda.
The following table sets forth the total annual retirement benefits payable under the Falconbridge RIP to participants in the specified compensation and years of service categories, assuming retirement at age 65:
| | Years of Service | |||||||||||
|---|---|---|---|---|---|---|---|---|---|---|---|---|
| Remuneration ($)(1) | ||||||||||||
| 15 | 20 | 25 | 30 | 35 | 40 | |||||||
| 200,000 | 45,000 | 60,000 | 75,000 | 90,000 | 105,000 | 120,000 | ||||||
| 300,000 | 67,500 | 90,000 | 112,500 | 135,000 | 157,500 | 180,000 | ||||||
| 400,000 | 90,000 | 120,000 | 150,000 | 180,000 | 210,000 | 240,000 | ||||||
| 500,000 | 112,500 | 150,000 | 187,500 | 225,000 | 262,500 | 300,000 | ||||||
| 600,000 | 135,000 | 180,000 | 225,000 | 270,000 | 315,000 | 360,000 | ||||||
| 700,000 | 157,500 | 210,000 | 262,500 | 315,000 | 367,500 | 420,000 | ||||||
NOTE:
- (1)
- REMUNERATION FOR A YEAR FOR THE PURPOSES OF THE RIP OF AN EXECUTIVE (INCLUDING THE NAMED EXECUTIVE OFFICERS) INCLUDES BASE SALARY AND THE LESSER OF THE ACTUAL AMOUNT OF THE ANNUAL INCENTIVE BONUS PROGRAM PAYMENT AND THE AMOUNT OF THE TARGET BONUS. THE PENSION BENEFITS ARE BASED ON 1.5% PER YEAR OF SERVICE. THERE IS NO REDUCTION IN AMOUNTS PAID UNDER THE RIP TO REFLECT SOCIAL SECURITY PAYMENTS.
EMPLOYMENT AGREEMENT WITH FORMER EXECUTIVE
Mr. Hushovd's employment with the Corporation terminated on February 26, 2002. Under the terms of the agreement between Øyvind Hushovd and the Corporation, Falconbridge will continue to pay an amount equivalent to Mr. Hushovd's annual salary at the time he left the Corporation of $500,000 for a period of twenty-eight (28) months following the termination of his employment, until June 30, 2004. Falconbridge also pays to Mr. Hushovd a monthly amount of $16,666 until June 30, 2004; this amount is in lieu of an annual bonus.
Certain health and automobile benefits have also been continued until the earlier of (a) the date Mr. Hushovd commences alternate employment, and (b) the expiry of the notice period. Mr. Hushovd continues to accrue service in the International Retirement Income Plan (the "I-RIP") until June 30, 2004 and will receive pension and other benefits in accordance with the governing terms of the Plan that are in
10
effect on June 30, 2004 or as may from time to time be amended. The benefits payable under the I-RIP are the same as the benefits payable under the RIP.
Mr. Hushovd was granted 100,000 Falconbridge stock options on March 22, 2002 based on the closing price of the shares on the Toronto Stock Exchange on March 21, 2002 of $17.45. The options vest in five (5) equal amounts on the anniversary date of the grant, commencing March 2003. Mr. Hushovd continues to have the opportunity to exercise any vested options until July 30, 2004 as well as any that may vest between February 6, 2002 and July 30, 2004 under the terms of the Falconbridge stock option plan, at which time all Falconbridge options held by Mr. Hushovd will be cancelled.
Mr. Hushovd exercised 12,500 Falconbridge stock options in 2002 for an aggregate value realized of $21,500.
PERFORMANCE GRAPH
The following graph compares the percentage change in the Corporation's cumulative total shareholder return on its Common Shares with the cumulative total return of the S&P/TSX Composite Index (the "S&P/TSX") and the TSE Metals and Minerals Group Index over the period from December 31, 1997 to December 31, 2002:
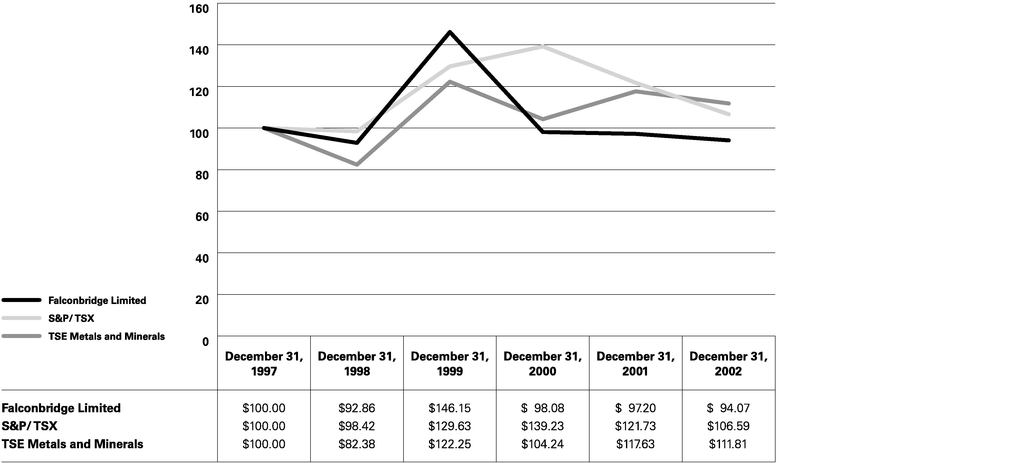
NOTE:
- (1)
- THE GRAPH ILLUSTRATES THE CUMULATIVE RETURN ON A $100 INVESTMENT IN COMMON SHARES MADE ON DECEMBER 31, 1997, AS COMPARED WITH THE CUMULATIVE RETURN ON A $100 INVESTMENT IN THE S&P/TSX AND THE TSE METALS AND MINERALS GROUP INDEX ON DECEMBER 31, 1997, CALCULATED USING CLOSING PRICES ON EACH OF THE DATES INDICATED. THE CALCULATIONS ASSUME REINVESTMENT OF DIVIDENDS.
COMPENSATION OF DIRECTORS
Directors of the Corporation who are not employees of the Corporation are compensated for their services as directors through a combination of retainer fees and meeting attendance fees. For the year ended December 31, 2002, the annual retainer paid to each director was $15,000 and the fee for each meeting of the Board of Directors attended (other than a meeting which may be held immediately following the annual meeting of shareholders) was $2,000. The annual retainer payable to each director who was a member of a committee of the Board of Directors was $3,000 and the fee for each committee meeting attended was $1,000. The annual fee payable to each director who was Chair of a committee was $1,000.
The retainer and attendance fees otherwise payable, during 2002, to Mr. Kerr, and to Messrs. Pannell and Regent (for a portion of the year) and those to Messrs. Cockwell and Harding, were paid to Noranda
11
and Brascan, respectively. The Corporation does not pay compensation for the President and Chief Executive Officer's services as a director. In 2002, the Corporation did not pay retainer and attendance fees for that portion of the year in which Mr. Pannell and Mr. Regent served as President and Chief Executive Officer. In recognition of his experience and knowledge of the Corporation, and its activities, Mr. Balogh, in addition to the directors' compensation referred to above, is paid $50,000 per annum as Chairman of the Corporation's Board of Directors and $8,000 as Falconbridge's nominee on the Board of Directors of Falconbridge Dominicana, C. por A. Mr. Balogh is also paid an annual fee of U.S.$8,000 by Falconbridge Dominicana, C. por A., a subsidiary of the Corporation, for his services as a director thereof.
In 2002, a deferred share unit plan for non-employee directors ("DSUPD") was instituted to enhance the Corporation's ability to attract and retain high quality individuals to serve as members of the Board and to promote a greater alignment of interests between non-employee members of the Board and the shareholders of the Corporation. Under the DSUPD non-employee directors (the "Eligible Directors") may, at their option, receive one of the following payment elections: (a) to receive his or her annual retainer fees and all meeting attendance fees in cash, (b) to receive his or her annual retainer fees in deferred share units and all meeting attendance fees in cash, or (c) to receive his or her annual retainer fees and all meeting attendance fees in deferred share units. Fees payable in the form of deferred share units are credited to an account maintained for the Eligible Director on the books of the Corporation as of the third business day following release of the Corporation's quarterly or annual results (the "Valuation Date"). The number of deferred share units (including fractions thereof) to be credited as of the Valuation Date is determined by dividing the amount of the fees to be deferred by the closing price of the Common Shares as reported on the Toronto Stock Exchange as of the Valuation Date. Deferred share units are credited with dividend equivalents when dividends are paid on the Corporation's Common Shares. An Eligible Director will receive a payment in cash or Common Shares on the fourth business day following the next release of the Corporation's quarterly results immediately following his or her termination of service on the Board of Directors.
DIRECTORS' AND OFFICERS' LIABILITY INSURANCE
The Corporation maintains directors' and officers' liability insurance coverage under a $25 million primary policy and a $25 million excess policy (each held by Brascan). Each of the policies extends coverage to the Corporation, certain of its subsidiary and associated companies and certain other companies designated by Brascan (in each case, an "Insured Organization"), which share the combined annual policy limit of $50 million, subject to a corporate deductible of $1 million per loss for the Corporation.
Generally, under this insurance coverage, an Insured Organization is reimbursed for indemnity payments made to directors or officers as required or permitted by law or under by-law indemnity provisions for losses, including legal costs, incurred by directors and officers in their capacity as such. This policy also provides coverage directly to individual directors and officers without any deductible if they are not indemnified by the Insured Organization. The insurance coverage for directors and officers has certain exclusions including, but not limited to, those acts determined to be deliberately fraudulent or dishonest or to have resulted in personal profit or advantage.
Both policies were effective November 1, 2002 at a combined aggregate premium to the Corporation of $59,100 of which an estimated $17,600 was payable in respect of its directors as a group and $41,500 was payable in respect of its officers as a group. Each policy is for a period of one year with terms and premiums established on each renewal.
Interests of Insiders and Others in Material Transactions
In April 2002, the Corporation and Noranda agreed to merge certain of their respective management functions. As a result there are a number of officers of the Corporation who are also officers of Noranda and a number of business functions of each company are managed jointly.
12
To ensure that all transactions between the Corporation and Noranda are fair and equitable, each company has adopted an Inter-Company Transactions Policy ("Policy"). This Policy sets forth the principles under which all dealings between the two companies are to be conducted including:
- •
- guidelines for the fair and equitable allocation of common costs as well as the appropriate sharing of synergy gains realized through the combination of resources;
- •
- guidelines for the handling of new business opportunities;
- •
- guidelines for the sharing of common employees and support functions and the appropriate allocation of the associated costs; and
- •
- procedures to be followed by Falconbridge management and employees to ensure all transactions with Noranda are fair and represent arms-length terms including the obtaining of market valuations and reference of specified transactions to the Independent Directors' Committee of the Corporation who ensure that the principles set forth in the Policy are adhered to and that the interests of the Corporation are protected in all dealings with Noranda.
The Corporation has an agreement with a subsidiary of Noranda whereby it acts as the sales agent for all products, other than sulphuric acid and indium, produced by the Corporation's Kidd Creek Operations. The Corporation has also entered into a supply agreement with another subsidiary of Noranda which will purchase and resell the Corporation's output of sulphuric acid. The Corporation also has agreements with various Noranda group companies for the purchase of custom feeds, the toll treatment of copper concentrates, blister copper and refinery slimes, and the sale of metals. The agreements with the Noranda group companies are negotiated in the best interest of the Corporation, on an arms-length basis at market terms.
Accounts receivable in the Corporation's consolidated statements of financial position as at December 31, 2002 includes $37.3 million receivable from Noranda under the sales agreements and $9.7 million from purchases of material by Noranda.
During the year ended December 31, 2002, the following amounts were paid in connection with transactions with Noranda group companies: $58.5 million in respect of materials purchased from and smelting and refining fees paid to Noranda; and $1.2 million in respect of commissions and agency fees. $3.2 million was paid to Noranda in fees relating to sulphuric acid sales during the year ended December 31, 2002. The Corporation received the following amounts in connection with transactions with Noranda group companies for the same period: $113.0 million in respect of sales of materials and technology; and $700,000 in other income.
Statement of Corporate Governance Practices
INTRODUCTION
The Board of Directors believes that effective corporate governance contributes to improved corporate performance and enhanced shareholder value.
The Board of Directors also believes that the Corporation's approach to corporate governance is comprehensive and generally consistent with the Toronto Stock Exchange's guidelines for effective corporate governance (the "TSX Guidelines"). The Corporation's specific disclosure relative to these guidelines is set out in Schedule "A" to this circular.
The Board of Directors will continue to critically assess the Corporation's governance systems to fulfill its commitment to ensure the continuance of effective corporate governance.
This Statement of Corporate Governance Practices has been prepared by the Corporate Governance and Nominating Committee and has been approved by the Board of Directors.
13
BOARD MANDATE
The responsibility of the Board of Directors is to supervise the management of the business and affairs of the Corporation and to act with a view to the best interests of the Corporation. In discharging its responsibility, the Board of Directors reviews the performance of the President and Chief Executive Officer and oversees and reviews the development and implementation of the following significant corporate plans and initiatives:
- •
- the Corporation's strategic planning and budgeting process;
- •
- the identification of the principal risks of the Corporation's business and the implementation of systems to manage these risks;
- •
- succession planning, including appointing, training and monitoring senior management;
- •
- the Corporation's public communications policies; and
- •
- the Corporation's internal control and management information systems.
The Board of Directors meets at least five times a year, and more frequently if required. In 2002, the Board met ten times, including five regularly scheduled meetings.
BOARD COMPOSITION
The Board of Directors is composed of 11 directors. All directors are elected annually.
Noranda holds 59.5% of the Common Shares of the Corporation and as such is the controlling shareholder of the Corporation.
The current slate of 11 directors includes Mr. Regent, the President and Chief Executive Officer of the Corporation, five directors who are officers or directors of Noranda (Messrs. Balogh, Cockwell, Harding, Kerr and Pannell) and five directors who have no interest in or relationship with either the Corporation or Noranda (Messrs. King, Kirchmann, Race, Wallace and Ms. Mogford).
Unrelated Directors
The Board of Directors believes that five of its current directors, Messrs. King, Kirchmann, Race, Wallace and Ms. Mogford, are unrelated directors as described in the TSX Guidelines (i.e., they are independent of management and free from any interest and any business or other relationship which could, or could reasonably be perceived to, materially interfere with their ability to act with a view to the best interests of the Corporation, other than interests and relationships arising from shareholding) and have no interest in or relationship with Noranda. In determining whether the directors are unrelated directors, the Board of Directors considers the circumstances of the directors and whether their interests and relationships could, or could reasonably be perceived to, materially interfere with their ability to act in the best interests of the Corporation.
Significant Shareholder
Noranda is a significant shareholder of the Corporation. The TSX Guidelines state that the board of a corporation having a significant shareholder (i.e., a person with the ability to exercise a majority of the votes for the election of directors) should include a number of directors who do not have interests in or relationships with either the corporation or the significant shareholder, and which fairly reflects the investment in the corporation by other shareholders. Five of the Corporation's directors do not have an interest in or other relationship with either the Corporation or Noranda. Accordingly, the Board of Directors believes that it is composed of the appropriate number of directors who are not related to the Corporation or Noranda.
14
INDEPENDENCE FROM MANAGEMENT
One way to ensure the independence of the Board of Directors from management is by separating the office of the Chairman of the Board of Directors from that of the Chief Executive Officer. Mr. Balogh, the Chairman of the Board of Directors, is not an executive officer of the Corporation.
BOARD COMMITTEES
There are six board committees: the Audit Committee, the Corporate Governance and Nominating Committee, the Environment, Safety and Health Committee, the Human Resources and Compensation Committee, the Independent Directors' Committee and the Pension Investment Committee. The Board of Directors may appoint other temporary or permanent committees from time to time for particular purposes.
The Chairman of the Board (who is an officer but not an executive officer of the Corporation) is a member of the Corporate Governance and Nominating Committee and the Human Resources and Compensation Committee.
The following is a description of the terms of reference of the board committees.
Audit Committee
The Audit Committee assists the Board of Directors in carrying out its responsibilities relating to corporate accounting and financial reporting practices. The duties and responsibilities of the committee include:
- •
- overseeing the adequacy and effectiveness of internal controls over the Corporation's accounting and financial reporting systems;
- •
- reviewing the scope and terms and the results of external audits of the Corporation; and
- •
- monitoring the actions taken by management with respect to any significant recommendations made by the Corporation's external auditor.
The committee also reviews the Corporation's quarterly and annual financial statements before they are approved by the Board of Directors. The committee maintains direct communications with the Corporation's external auditor and the Corporation's senior officers responsible for accounting and financial matters.
The Audit Committee met four times during 2002. The members of the committee during 2002 were David H. Race (Chair), Robert J. Harding, Neville W. Kirchmann, Mary A. Mogford and James D. Wallace.
Corporate Governance and Nominating Committee
The Corporate Governance and Nominating Committee assists the Board of Directors in carrying out its responsibilities in matters of corporate governance as they relate to the Board of Directors. The duties and responsibilities of the committee include:
- •
- ensuring that the appropriate policies and mechanisms are put in place to address the changing corporate governance requirements arising from regulations and evolving best practices in this area;
- •
- reviewing the role and conduct of the Board of Directors and its committees and the way in which the Board of Directors and its committees carry out their duties and responsibilities;
- •
- reviewing the composition and needs of the Board of Directors and identifying and recommending suitable candidates for election as directors;
- •
- ensuring that a suitable orientation program is available for new directors; and
- •
- reviewing the form and adequacy of compensation for directors.
The Board of Directors does not have a policy in respect of the engagement by directors of outside advisors. If circumstances arose in which a director considered such a retainer, at the Corporation's expense,
15
to be appropriate, the request would be considered by the Corporate Governance and Nominating Committee.
To date, the Corporate Governance and Nominating Committee has addressed the effectiveness of the Board of Directors and its committees, operating as a group, and has an informal process for assessing the performance of individual directors.
The Corporate Governance and Nominating Committee met four times during 2002. The members of the committee during 2002 were G. Edmund King (Chair), Alex G. Balogh, David W. Kerr and Mary A. Mogford (who was appointed to the Committee April 19, 2002).
Environment, Safety and Health Committee
The Environment, Safety and Health Committee assists the Board of Directors in carrying out its responsibilities relating to the promotion and management of environmental, occupational health and hygiene and safety matters. The duties and responsibilities of the committee include:
- •
- ensuring that appropriate and effective environmental, occupational health and hygiene and safety policies and procedures are in place, are operational and are supported by adequate resources;
- •
- reviewing any significant environmental, occupational health and hygiene and safety incidents and issues and making recommendations to management and the Board of Directors; and
- •
- providing support for and encouraging improvement of environmental, occupational health and hygiene and safety performance.
The Environment, Safety and Health Committee met three times in 2002. The members of the committee during 2002 were Mary A. Mogford (Chair), Robert J. Harding, Derek G. Pannell and David H. Race.
Human Resources and Compensation Committee
The Human Resources and Compensation Committee assists the Board of Directors in carrying out its responsibilities relating to personnel matters, including performance, compensation and succession. The duties and responsibilities of the committee include:
- •
- reviewing and making recommendations to the Board of Directors on management organization, management development, management succession and changes in management positions;
- •
- developing annual objectives against which to assess the President and Chief Executive Officer and assessing his performance against those objectives;
- •
- reviewing and making recommendations to the Board of Directors on the compensation of the President and Chief Executive Officer and approving the compensation of officers reporting to the President and Chief Executive Officer; and
- •
- reviewing and making recommendations to the Board of Directors with respect to the Corporation's employee compensation and benefit plans and arrangements, including the Corporation's stock option and share purchase plans.
The Human Resources and Compensation Committee met three times in 2002. The members of the committee during 2002 were David W. Kerr (Chair), Alex G. Balogh, Jack L. Cockwell, G. Edmund King and Neville W. Kirchmann.
Independent Directors' Committee
The Independent Directors' Committee is comprised exclusively of directors who do not have business or other relationships with the Corporation, Noranda and its subsidiaries. The committee assists the Board of
16
Directors in fulfilling its responsibilities relating to the assessment of related party transactions and their impact on the Corporation. The duties and responsibilities of the committee include:
- •
- ensuring that the principles set forth in the Inter-Company Transactions Policy are adhered to and that the interests of the Corporation are protected and advanced in all dealings with Noranda;
- •
- reviewing and assessing, on an annual basis or as may be required, any and all related party transactions between Noranda and its subsidiaries and the Corporation;
- •
- considering issues, should they arise, wherein the interests of the minority shareholders may differ or be seen to differ from those of Noranda and its subsidiaries; and
- •
- reviewing or providing recommendations to the Board of Directors on any other matter referred to the committee by the Board of Directors.
The Independent Directors' Committee met three times in 2002. The members of the Independent Directors' Committee in 2002 were James D. Wallace (Chair), G. Edmund King, Neville W. Kirchmann, Mary A. Mogford and David H.Race.
Pension Investment Committee
The Pension Investment Committee assists the Board of Directors in fulfilling its responsibilities relating to the retirement pension plans of the Corporation and its participating subsidiaries and the pension funds established under those plans. The duties and responsibilities of the committee include:
- •
- appointing and reviewing the performance of the trustee, custodian, actuary and investment managers of the plans and funds;
- •
- reviewing and making recommendations to the Board of Directors with respect to the investment policies and goals of the plans; and
- •
- overseeing the operation and administration of the plans and funds in relation to approved investment policies and goals, legal requirements and accepted standards and practices.
The Pension Investment Committee met twice in 2002. The members of the committee during 2002 were Robert J. Harding (Chair), G. Edmund King, Derek G. Pannell (who was appointed to the Committee effective June 1, 2002) and James D. Wallace.
DECISIONS REQUIRING BOARD APPROVAL
In addition to those matters which by law must be approved by the Board of Directors, board approval is required for major acquisitions or dispositions by the Corporation, capital expenditures and other commitments, that are not in the ordinary course of business, in excess of $8,000,000 and for changes in the senior management of the Corporation and its principal operating subsidiaries.
SHAREHOLDER FEEDBACK
The Board of Directors believes that management should speak for the Corporation in its communications with shareholders and others in the investment community and that the Board of Directors should ensure that appropriate investor relations programs and procedures are in place. The Corporation has an investor relations department to deal with investor relations. In addition, management meets regularly with shareholders and others in the investment community to receive and respond to shareholder feedback.
The Board of Directors reviews the Corporation's major communications with shareholders and the public including the quarterly press releases, the annual management information circular and the annual report.
17
EXPECTATIONS OF MANAGEMENT
The Board of Directors believes that management is responsible for the development of long-term strategies for the Corporation. Annual meetings and special meetings of the Board of Directors are held, as required, to review and deal with long-term strategies of the Corporation.
The Board of Directors appreciates the value of having selected senior officers attend board meetings to provide information and opinions to assist the directors in their deliberations. The Chair arranges for the attendance of senior officers at board meetings in consultation with the President and Chief Executive Officer.
PRINCIPAL ACCOUNTING FIRM FEES FOR FISCAL 2002
Deloitte & Touche LLP, the member firms of Deloitte Touche Tohmatsu, and their respective affiliates (collectively, Deloitte & Touche), which includes Deloitte Consulting, are the principal accountants of the Corporation and its subsidiaries. From time to time, Deloitte & Touche, as well as other accounting and consulting firms, provide information technology consulting and other audit and non-audit services to the Corporation and its subsidiaries. The Audit Committee of the Corporation's Board of Directors has instituted a policy to pre-approve audit and non-audit services and has considered whether the provision of non-audit services is compatible with maintaining Deloitte's independence.
AUDIT FEES AND EXPENSES
Fees and expenses for the audit of the consolidated annual statements of the Corporation and for the statements of its subsidiaries for the fiscal year ended December 31, 2002 were approximately $1,033,000.
TAX FEES
Fees for tax services for the fiscal year ended December 31, 2002 were approximately $173,000.
AUDIT RELATED FEES
Audit related fees for the fiscal year ended December 31, 2002 of approximately $82,000 include fees for consent and comfort letters in connection with the Corporation's prospectus filing.
ALL OTHER FEES
Fees of approximately $2,669,000 for other services rendered for the fiscal year ended December 31, 2002 include fees for e-procurement systems implementation support of $2,400,000 and other fees of $269,000.
Deloitte & Touche LLP, Chartered Accountants, currently serve as auditor of the Corporation. It is intended that, on any ballot that may be called for relating to the appointment of auditor, the shares represented by proxies in favour of management will be voted in favour of the reappointment of Deloitte & Touche LLP, Chartered Accountants, as auditor of the Corporation, to hold office until the next annual meeting of shareholders and to authorize the directors to fix the remuneration of the auditor, unless a shareholder has specified in his or her proxy that his or her shares are to be withheld from voting in the appointment of the auditor.
Information contained in this Circular is given as of February 28, 2003, except where otherwise indicated. The contents and the sending of the Notice of Meeting and this Circular have been approved by the Board of Directors.
18
DATED at Toronto this 28th day of February, 2003.
By Order of the Board of Directors
Julia K. Sievwright
Secretary and Assistant General Counsel
19
Management Information Circular
Schedule A — Corporate Governance Guidelines
The Board of Directors is of the view that the Corporation's corporate governance practices and procedures are comprehensive and generally consistent with the 14 guidelines for improved corporate governance in Canada adopted by the Toronto Stock Exchange (the "TSX Guidelines"). The following summarizes these guidelines and sets out the Corporation's current practices in each case.
- 1.
- The Board of Directors should explicitly assume responsibility for stewardship of the Corporation and specifically for:
- (a)
- Adoption of a strategic planning process
- (b)
- Identification of principal risks and the implementation of appropriate risk management systems
The Board meets annually and has special meetings as required to review the Corporation's overall business strategies and its annual business plan, and also reviews major strategic initiatives to ensure that the Corporation's proposed actions accord with shareholder objectives.
- (c)
- Succession planning including monitoring senior management
The Board, directly and through its Corporate Governance and Nominating Committee, Environment, Safety and Health Committee and Audit Committee, reviews the principal risks of the Corporation's business to ensure that appropriate systems are in place to manage these risks.
- (d)
- Communications policy
- (e)
- Integrity of internal controls and management information systems
The Board appoints the Chief Executive Officer and other members of senior management. The Board directly, and through its Human Resources and Compensation Committee, reviews succession planning.
The Board has approved a Corporate Disclosure Policy which summarizes its policies and practices regarding disclosure of material information to investors, analysts and the media.
The Audit Committee, through a process of enquiry with management and the auditors assures that the Corporation has adequate internal controls and management information systems.
- 2-3
- The Board should be composed of a majority of unrelated directors, that is directors who are independent of management and free from any business interests, other than shareholdings, which could interfere with his or her ability to act in the best interests of the Corporation. The Board has the responsibility to apply the definition of unrelated director and disclose annually the principles and conclusions of this application.
The Board considers that five of its 11 directors, Messrs. King, Kirchmann, Race, Wallace and Ms. Mogford, are unrelated directors within the meaning of the TSX Guidelines and have no relationship with or interest in Noranda. Of the remaining six directors, Mr. Regent is the President and Chief Executive Officer of the Corporation and Messrs. Balogh, Cockwell, Harding, Kerr and Pannell are officers or directors of Noranda. In relation to making this determination, the Board has examined the circumstances of each director in relation to a number of factors, including each director's current and past role in the management of the Corporation or its affiliates.
- 4-5
- The Board should appoint a Committee of non-management directors, a majority of whom are unrelated, to propose new nominees for election to the board and for assessing directors on an ongoing basis. The board should implement a process for assessing the effectiveness of the board as a whole, the committees of the board and the contribution of individual directors.
The Corporate Governance and Nominating Committee has the responsibility, among other things, for reviewing credentials of nominees for election or appointment to the Board and for recommending
20
candidates for Board membership. All of the members of the Corporate Governance and Nominating Committee are non-management directors and 50% of the members are unrelated directors. The Board considers this to be an appropriate mix, within the TSX Guidelines, taking into account Noranda's ownership interests. The Corporate Governance and Nominating Committee is responsible, among other things, for reviewing the effectiveness of the Board's operations and for assessing the performance of the Board and its directors and the contribution of individual directors. Individual members of the Board are also invited to raise questions and make suggestions regarding these matters for consideration by the Chairman of the Corporate Governance and Nominating Committee and by the Chairman of the Corporation. Board members complete a survey annually, which identifies areas requiring more information or attention. Attendance at Committee and Board meetings is appraised, and has been consistently exemplary.
- 6.
- The Board should provide an orientation and education program for new directors.
New directors are provided with comprehensive information about the Corporation and its affiliates. Directors have the opportunity to meet and participate in work sessions with senior management to obtain insight into the operations of the Corporation and its affiliates.
- 7.
- The Board should examine its size in relation to effective decision-making and adjust its size where appropriate.
The Corporate Governance and Nominating Committee is responsible, among other things, for periodically assessing the size and composition of the Board and its committees and making recommendations to the Board. The Board considers that its present size is appropriate given the diversity of its operations.
- 8.
- The Board should review the adequacy and form of director compensation to reflect the risk and responsibilities of its directors.
The Corporate Governance and Nominating Committee is responsible for reviewing and recommending director compensation to the Board.
- 9.
- Board committees should generally be composed of non-management directors, a majority of whom are unrelated.
All committees of the Board are composed solely of non-management directors. The Independent Directors' Committee is comprised of five members, all of whom are unrelated to management and the Corporation's controlling shareholder. The Audit Committee is comprised of a majority of unrelated directors. The Corporate Governance and Nominating Committee, the Environment, Safety and Health Committee and the Pension Investment Committee are 50% comprised of unrelated directors. The Human Resources and Compensation Committee has five members, two of whom are unrelated directors. The Board considers this to be an appropriate mix, within the TSX Guidelines, taking into account Noranda's ownership interests.
- 10.
- The Board or one of its committees should expressly assume responsibility for developing the Corporation's approach to governance issues, including its response to the TSX Guidelines.
While the Board retains overall responsibility for corporate governance matters, its committees each have specific responsibilities for certain aspects of corporate governance. The Corporate Governance and Nominating Committee is responsible for reviewing the Corporation's statement of corporate governance practices, including its response to the TSX Guidelines and makes recommendations to ensure that best practices are followed.
- 11.
- The Board, together with the CEO, should define management's role and responsibilities, including the CEO's corporate objectives.
The Human Resources and Compensation Committee is responsible, among other things, for reviewing and reporting to the Board on management resource planning, including succession planning, proposed senior management appointments, and the job descriptions and annual objectives of the CEO.
21
The Board believes in the importance of developing business plans to ensure the compatibility of shareholder, Board and management views on the Corporation's strategic direction and performance targets, and the effective utilization of shareholder capital. The Board's approval of the annual business plan provides a mandate for senior management to conduct the affairs of the Corporation within the terms of the plan, knowing it has the necessary Board support. Material deviations from the plan are reported to and considered by the Board.
- 12.
- The Board should have in place appropriate structures to ensure that it can function independent of management.
At its meetings, the Board regularly engages in a private session with the Corporation's most senior officers without other members of senior management present. The Board also meets independently of all senior management on a regular basis. In addition the Independent Directors' Committee meets regularly and at all such meetings engages in a private session without members of management present.
- 13.
- The Audit Committee of the Board should be comprised only of non-management members, should have a specific mandate, and have direct access to the Corporation's internal and external auditors and oversight over these functions.
The Audit Committee of the Board is composed solely of non-management directors. The mandate of the Audit Committee is set out in a charter which is reviewed by that Committee and approved by the Board. Among other things, the Audit Committee is responsible for monitoring the Corporation's systems and procedures for internal controls and monitoring the performance of the Corporation's external auditors. The Audit Committee also meets periodically in private with the Corporation's auditors to discuss and review specific issues as appropriate.
- 14.
- Individual directors should be able to engage outside advisers under appropriate conditions.
Individual directors of the Board are free to consult with members of senior management, whenever they so require, and to engage outside advisors with Board authorization.
22
![]()
FALCONBRIDGE LIMITED
BCE Place
181 Bay Street, Suite 200
Toronto, Ontario M5J 2T3
t. 416.982.7115 f. 416.982.7423
www.falconbridge.com
corpcom@falconbridge.com
FALCONBRIDGE LIMITED
Annual Meeting of Shareholders • April 17, 2003 • Form of Proxy
This proxy is being solicited by the management of Falconbridge Limited (the "Corporation") in connection with the annual meeting of shareholders of the Corporation (the "Meeting") to be held at the Design Exchange, Trading Floor, 234 Bay Street, Toronto, Ontario on Thursday, Apri1 17, 2003 commencing at 11:00 a.m. (Toronto time) and any adjournment or adjournments thereof. A shareholder has the right to appoint a person other than the nominees designated below (which person need not be a shareholder of the Corporation) to represent the shareholder at the Meeting, or any adjournment or adjournments thereof, and may exercise such right by inserting the name of the person in the blank space provided below for that purpose and striking out the other names or by completing another proper form of proxy.
The undersigned shareholder of the Corporation hereby appointsAlex G. BALOGH, Chairman of the Board of Directors of the Corporation, or, failing him,Aaron W. REGENT, President and Chief Executive Officer of the Corporation, or, failing him,Julia K. SIEVWRIGHT, Secretary and Assistant General Counsel of the Corporation, or instead of any one of them, , as nominee of the undersigned to attend and act for and on behalf of the undersigned at the Meeting, and any adjournment or adjournments thereof, to the same extent and with the same power as if the undersigned were personally present at the Meeting and any adjournment or adjournments thereof and, without limiting the generality of the foregoing, the proxyholder is specifically directed to vote or withhold voting the common shares of the Corporation registered in the name of the undersigned as follows:
- 1.
- ELECTION OF DIRECTORS
o VOTE FORoro WITHHOLD VOTE FOR the election as directors of management's nominees in accordance with the management information circular of the Corporation dated February 28, 2003.
- 2.
- APPOINTMENT AND REMUNERATION OF AUDITOR
o VOTE FORoro WITHHOLD VOTE FOR the appointment of Deloitte & Touche LLP, Chartered Accountants, as auditor of the Corporation and the authorization of the directors to fix the auditor's remuneration.
The common shares represented by this proxy will be voted in accordance with the foregoing instructions with respect to the matters specified. If no instructions are given with respect to either matter, however, the common shares represented by this proxy will be voted for such matter.
If any amendments or variations to the matters identified in the notice of Meeting are proposed at the Meeting, or any adjournment or adjournments thereof, or if any other matters which are not now known to management should properly come before the Meeting, or any adjournment or adjournments thereof, this proxy confers discretionary authority on the proxyholder to vote on such amendments or variations or such other matters in accordance with his or her best judgement.
The undersigned agrees to ratify and confirm all acts that the proxyholder may do by virtue of this proxy and revokes any proxy previously given.
| | | |
|---|---|---|
| DATED this day of , 2003. | ||
Signature of Shareholder | ||
Name of Shareholder — Please print |
Notes:
- (1)
- This proxy must be signed by the shareholder or his or her attorney authorized in writing or, if the shareholder is a corporation, by an officer or attorney thereof duly authorized.
- (2)
- To be effective, this proxy or another proper form of proxy must be completed and delivered to the Corporation at least 48 hours prior to the Meeting.
- (3)
- Please fill in the date on this proxy. If the date is not filled in, this proxy will be deemed to be dated on the date it was mailed to you by management of the Corporation.
SIGNATURES
KIDD CREEK OPERATIONS
LIQUIDITY AND CAPITAL RESOURCES
SUSTAINABLE DEVELOPMENT
EXPLORATION AND BUSINESS DEVELOPMENT
ADVANCED PROJECTS — Mineral Resources1
KEY ASSUMPTIONS FOR MINERAL RESOURCE AND RESERVE ESTIMATION
MARKETS
RISK FACTORS
SENSITIVITIES
ACCOUNTING CHANGES
OUTLOOK
ACCOUNTING RESPONSIBILITIES, PROCEDURES AND POLICIES
AUDITORS' REPORT
CONSOLIDATED STATEMENTS OF EARNINGS
CONSOLIDATED STATEMENTS OF FINANCIAL POSITION
CONSOLIDATED STATEMENTS OF SHAREHOLDERS' EQUITY
CONSOLIDATED STATEMENTS OF CASH FLOWS
NOTES TO CONSOLIDATED FINANCIAL STATEMENTS (Tabular figures in thousands of Canadian dollars, except where otherwise noted)
CORPORATE GOVERNANCE PRACTICES
OFFICERS OF THE CORPORATION
BOARD OF DIRECTORS
CORPORATE DIRECTORY
SHAREHOLDER INFORMATION
Management Information Circular
Election of Directors
Executive Compensation
Pension Plans
Interests of Insiders and Others in Material Transactions
Statement of Corporate Governance Practices
Auditor Independence
Appointment of Auditor
General
Management Information Circular
Schedule A — Corporate Governance Guidelines