Exhibit 99.1
Falconbridge Limited

2004 ANNUAL REPORT
2004 Financial Highlights
(US$ MILLIONS, EXCEPT PER SHARE DATA) |
| 2004 |
| 2003 |
| ||
|
|
|
|
|
| ||
Operating Highlights |
|
|
|
|
| ||
|
|
|
|
|
| ||
Revenues |
| $ | 3,070 |
| $ | 2,083 |
|
Operating income |
| 969 |
| 301 |
| ||
Earnings |
| 672 |
| 191 |
| ||
Cash provided by operating activities before changes |
|
|
|
|
| ||
in working capital |
| 1,067 |
| 445 |
| ||
Capital expenditures and deferred project costs |
| 573 |
| 370 |
| ||
|
|
|
|
|
| ||
Financial Position |
|
|
|
|
| ||
|
|
|
|
|
| ||
Cash and cash equivalents |
| 645 |
| 298 |
| ||
Working capital |
| 933 |
| 649 |
| ||
Total assets |
| 5,118 |
| 4,172 |
| ||
Long-term debt |
| 1,437 |
| 1,427 |
| ||
Shareholders’ equity |
| 2,563 |
| 1,938 |
| ||
Return on common shareholders’ equity (ROE) |
| 31 | % | 11 | % | ||
Return on net assets |
| 31 | % | 13 | % | ||
Ratio of net debt to net debt plus equity |
| 24 | % | 37 | % | ||
|
|
|
|
|
| ||
Per Common Share (US$) |
|
|
|
|
| ||
|
|
|
|
|
| ||
Earnings (Basic) |
| $ | 3.71 |
| $ | 1.03 |
|
Earnings (Diluted) |
| 3.69 |
| 1.02 |
| ||
Cash provided by operating activities |
| 5.38 |
| 2.48 |
| ||
Book value |
| 14.25 |
| 10.84 |
| ||
|
|
|
|
|
| ||
Shares outstanding (millions of shares) |
| 179.8 |
| 178.8 |
| ||
Front cover, from left to right:
1) Nickel Rim South, Sudbury, Ontario, vent shaft galloway assembly of two sections
2) Nickel end product
3) Lomas Bayas, Chile
4) Nikkelverk, Norway, refinery
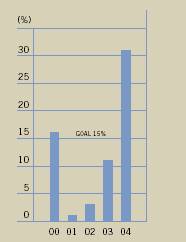
RETURN ON EQUITY
Falconbridge achieved a 31% return on equity in 2004 exceeding its 15% ROE objective.
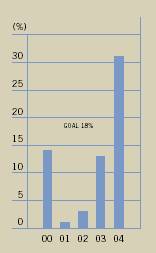
RETURN ON NET ASSETS
Falconbridge increased its RONA to 31% in 2004, surpassing its 18% target.
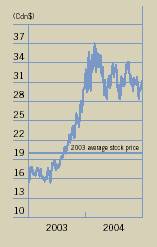
SHARE PRICE
During 2004, Falconbridge maintained an average stock price of Cdn$31.88, 60% higher than its 2003 average of Cdn$19.95.
Investment Grade Credit Ratings: Moody’s: Baa3 Standard & Poor’s: BBB– Dominion Bond Rating Service: BBB High
Right metals – nickel and copper
Solid production base – upside potential
Growth opportunities – within our control
Growing value of scarce resources
Financial strength to fund operations and growth projects
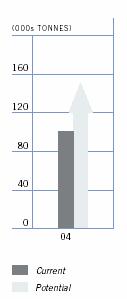
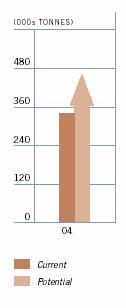
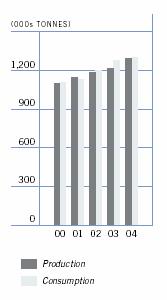
NICKEL PRODUCTION
Falconbridge achieved refined nickel production of 100,900* tonnes in 2004.

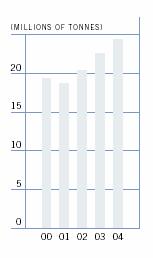
COPPER PRODUCTION
Falconbridge achieved record copper mine production of 340,900 tonnes in 2004.
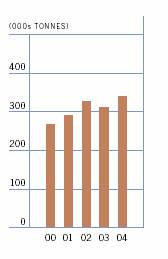
* Production was impacted by a three-week strike at Sudbury operations.
TABLE OF CONTENTS
|
|
|
|
|
|
|
|
|
|
|
|
|
|
|
|
1
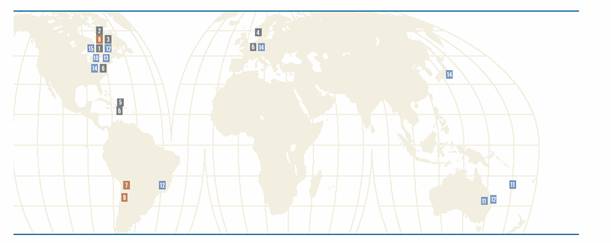
1 Sudbury
(Sudbury, Ontario)
Mines and mills nickel-copper ores; smelts nickel-copper concentrate from mines in Sudbury, Raglan and Montcalm, and processes custom feed materials.
2 Raglan
(Nunavik, Quebec)
Mines and mills nickel-copper ores from open pits and underground mines.
3 Montcalm
(Timmins, Ontario)
Mines nickel-copper ores from an underground mine.
4 Nikkelverk A/S
(Kristiansand, Norway)
Refines nickel, copper, cobalt, precious and platinum group metals from Sudbury, Raglan and from custom feeds.
5 Falconbridge Dominicana,
C. por A. (85.26%)
(Bonao, Dominican Republic)
Mines, mills, smelts and refines nickel laterite ores.
6 Custom Feed
(Brussels, Belgium; Pittsburgh, Pennsylvania; Christ Church, Barbados)
7 Compañía Minera Doña Inés de Collahuasi S.C.M. (44%)
(Northern Chile)
Mines and mills copper sulphide ores into concentrate; mines and leaches copper oxide ores to produce cathodes.
8 Kidd Division
(Timmins, Ontario)
Mines copper-zinc ores from Kidd Mine. Mills, smelts and refines copper-zinc ores from Kidd Mine and processes Sudbury copper concentrate and custom feed materials. Processes Montcalm nickel-copper ore.
9 Compañía Minera Falconbridge Lomas Bayas
(Northern Chile)
Mines copper oxide ores from an open pit; refines into copper cathode through the solvent extraction-electrowinning process
(SX-EW).
CORPORATE
10 Corporate Office
(Toronto, Ontario)
11 Project Offices
(Koné and Nouméa, New Caledonia; Brisbane, Australia)
12 Exploration Offices
(Sudbury, Timmins and Toronto, Ontario; Laval, Quebec; Belo Horizonte, Brazil; Brisbane, Australia)
13 Business Development
(Toronto, Ontario)
14 Marketing and Sales
(Brussels, Belgium; Pittsburgh, Pennsylvania; Tokyo, Japan)
15 Technology Centre
(Sudbury, Ontario)
2
Achieved record financial results with net income of $672 million ($3.71 per share) and ROE of 31% – Solid production allowed the company to take full advantage of high nickel and copper prices. With a strengthened balance sheet, a net-debt-to-total-capitalization ratio of 24% and over $1 billion in liquidity, Falconbridge has substantial financial flexibility to fund operations and growth opportunities.
Nikkelverk, Norway, refinery
Met or exceeded most production targets – Falconbridge produced 100,900 tonnes of refined nickel and a record 340,900 tonnes of mined copper in 2004.
Lomas Bayas, Chile, blast drilling

Generated $29 million in cost savings from Six Sigma projects – Momentum was maintained in 2004 with the completion of 64 projects. Over 1,000 employees have received training, including over 91 black and brown belts. Six Sigma continues to offset the cost pressures experienced at operations by improving operating efficiencies and margins.
Falcondo, Dominican Republic, surface mining
Completed growth and expansion projects in nickel and copper – Both the $77 million Montcalm nickel mine and the $584 million Collahuasi transition and concentrator expansion projects were completed under budget and ahead of schedule. Montcalm will increase refined nickel production by 9,000 tonnes annually. The expansion at Collahuasi will allow the operation to sustain mined copper production of 500,000 tonnes per year.
Collahuasi, Chile, primary crusher transfer bin
Advanced Koniambo Project – Completed a bankable feasibility study on the Koniambo nickel project, increasing the level of project definition, with engineering increasing from 10% to 25%. Completion of this study marks an important milestone in the development of the Koniambo project – one of the best laterite nickel resources in the world.
Koniambo, New Caledonia, field work
Exploration success strengthened nickel production profile – Falconbridge launched an underground definition program at Nickel Rim South, which contains 13.4 million tonnes of over 1.8% nickel, 3.3% copper and significant platinum and palladium. At Raglan, new discoveries and extensions to current ore zones added tonnes to the mineral reserves and resources equivalent to twice the amount of ore mined during the year.
Nickel Rim South, Sudbury, Ontario, aerial view of vent shaft galloway installation
3
SOLID OPERATING PERFORMANCE LED TO RECORD FINANCIAL RESULTS IN 2004: EARNINGS WERE $672 MILLION, OR $3.71 PER SHARE, COMPARED TO $191 MILLION OR $1.03 PER SHARE IN 2003, AND THE RETURN ON SHAREHOLDERS’ EQUITY WAS 31%.
We had excellent results in 2004. Our performance was the result of the commitment to executing a proven strategy. We remained focused on nickel and copper, two metals with excellent fundamentals; we strived to maximize the value of our assets through a focus on operational excellence; we expanded our pipeline of growth opportunities; and we maintained a strong financial position.
During the year we achieved many of our operating goals. Production of 100,900 tonnes of refined nickel and a record 340,900 tonnes of mined copper positioned us to take full advantage of rising nickel and copper prices. This strong operating performance was realized with safety remaining a top priority. In 2004, we improved our safety performance with a lost-time injury frequency improvement of 11% over 2003 and 20% over the last two years.
Solid operating performance led to record financial results in 2004. Earnings reached $672 million, or $3.71 of basic earnings per common share, compared to $191 million or $1.03 of basic earnings per common share in 2003 – a 252% improvement – and the return on shareholders’ equity was 31%. With improved earnings and cash flows, we also strengthened our financial position by reducing the Company’s net-debt-to-total-capitalization ratio to 24% from 37% at the end of 2003, and increasing our cash balance to $645 million from $298 million at the end of 2003.
Overall, Falconbridge is in an excellent position. We will continue to benefit from the expected continuation of high metal prices and the growth in our production of nickel and copper with a high-quality pipeline of new projects. This will enable us to continue to add significant value for our shareholders in the years ahead.
FOCUSED ON NICKEL AND COPPER
Our strategy remains focused on the production of nickel and copper and the development of nickel and copper resources. This strategy has been particularly rewarding during a year when nickel and copper prices averaged $6.28 and $1.30, respectively – the highest prices we have seen in many years.
On the nickel side, after more than a decade of industry under-investment in new nickel production, demand has outstripped supply over the past three years. In 2004, the market deficit was satisfied by nickel inventories stored in the warehouses of various metal exchanges, such as the London Metals Exchange, as well as by existing producers. With inventories declining to critical levels, the nickel price, out of necessity, rose to a level that would both curtail demand and attract new supply.
Nickel demand was strong during the year; however, some of that demand receded as stainless steel producers reduced the nickel content of their products. Furthermore, stainless steel scrap volumes increased in 2004. As a result, the nickel market reached a position of equilibrium during the year.
Entering 2005, demand for nickel continues to be strong, with high growth rates in China and a recovery in demand from the aerospace sectors. Going forward, supply will continue to be constrained due to limited sources of new production coming on stream over the next few years. Consequently, the nickel market is expected to be very finely balanced, which will lead to a
4

“POSITIVE NICKEL AND COPPER FUNDAMENTALS, COMBINED WITH A SOLID PRODUCTION BASE AND PIPELINE OF HIGH-QUALITY GROWTH OPPORTUNITIES, WILL ENABLE US TO CONTINUE TO CREATE VALUE FOR OUR SHAREHOLDERS IN THE YEARS AHEAD.” AARON REGENT, President & Chief Executive Officer
high degree of nickel price volatility as the market reacts to subtle changes in supply and demand.
In the copper market, China’s industrialization continues to be one of the main drivers affecting the market. Copper-intensive infrastructure projects, particularly in the power generation sector, along with improving living standards are creating demand for mass consumer items such as cars and air conditioners in China. As a result, Chinese copper demand increased by 15% last year, and China passed the U.S. as the world’s largest copper consumer. In addition, U.S. demand for copper has grown considerably due to the strength of the residential construction and auto sectors. This strong growth in global demand for copper, combined with the inability of current supply to meet consumption needs, drove down metal exchange copper inventories by more than 671,000 tonnes to critically low levels. Additional supply expected in 2005 will not keep pace with demand, and the current copper price of $1.40/lb. should continue to be supported.
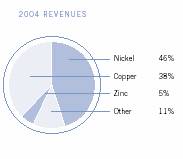
The outlook for nickel and copper prices is quite positive, and market fundamentals are solid. Both markets are forecast to remain in deficit positions as new supply is expected to be inadequate to keep up with demand. Construction of potential sources of production requires long lead times because of the size and complexity of such projects, as well as increasingly lengthy permitting processes. As a result, the pricing environment should continue to be positive for the foreseeable future. With over 80% of Falconbridge’s revenue coming from nickel and copper, we are well positioned to benefit from these positive fundamentals and to maintain our position as a key player in these metal markets.
MAXIMIZING THE VALUE OF OUR ASSETS
At our nickel operations, made up of our integrated nickel operations (INO) and Falcondo, we produced 100,900 tonnes of refined nickel in 2004. Meanwhile, we achieved record mined copper production of 340,900 tonnes. Overall in 2004, we had a year of solid operational performance.
The INO, which consists of the Sudbury mines and smelter, the Raglan mine, the Montcalm mine and the Nikkelverk refinery in Norway, produced 71,400 tonnes of refined nickel. Production was lower than originally forecast, due to a three-week strike at our Sudbury operations in January. Although we would have preferred to reach a new labour agreement in Sudbury without disruption, controlling costs and maintaining operating flexibility are important priorities in preserving the value of these assets. Fortunately the strike was relatively brief, and the subsequent ramp-up smooth.
At Falcondo, our ferronickel operation in the Dominican Republic, nickel production increased by 8% to 29,500 tonnes. Falcondo exceeded annual operating targets and realized solid margins, despite increasing cost pressures resulting from high oil prices.
FOUNDATION FOR RESPONSIBLE GROWTH
Sustainable development is a fundamental aspect of our business practice and the basis for our Company’s commitment to social responsibility, environmental management and economic strength.
As a natural resource company, we affect communities in all areas where we operate. Our Sustainable Development Policy and Code of Ethics are public commitments to apply the highest standards at our locations around the world. In 2004, we expanded the Code of Ethics to include specific commitments to stakeholders, extend Falconbridge standards to suppliers and enhance our accountability.
Falconbridge is also actively involved in local, government and industry consultative groups. We work as partners to balance community interests with responsible mining.
Each year, Falconbridge publishes a joint Sustainable Development Report with Noranda Inc. that reviews the Company’s social, environmental and economic performance. Visit www.falconbridge.com to view our
2004 report online.

Falconbridge supports the Mining Association of Canada’s “Towards Sustainable Mining” initiative.
5
2004 SENIOR
MANAGEMENT TEAM

At Collahuasi, a world-class copper mine in Chile, Falconbridge’s 44% share of copper production exceeded forecast, reaching 205,100 tonnes – a 22% increase over 2003. Collahuasi successfully completed two key initiatives in 2004: the transition of mining activities from the Ujina orebody to the Rosario orebody, and the concentrator capacity expansion. Both projects were completed ahead of schedule and under budget, contributing to Collahuasi’s impressive performance.
Lomas Bayas, also located in Chile, produced 62,000 tonnes of copper in 2004. In April, we completed a crusher expansion project, on budget and on schedule.
Kidd Creek, our copper/zinc mine and smelter in Timmins, Ontario, produced 41,000 tonnes of copper, and 87,800 tonnes of zinc, refined copper of 115,600 tonnes and refined zinc of 121,600 tonnes in 2004. This past year was a challenge as we transitioned mining activities from the upper part of the mine to the newly developed and deeper Mine D. Also, the impact of the stronger Canadian dollar adversely impacted our financial results, particularly at our metallurgical operations. However, the building blocks for improved mine production are now in place, with a changed management structure and access to new work areas in Mine D. On the smelter side, we signed a life-of-mine agreement with Agnico Eagle, which will allow us to operate the zinc refinery at full capacity and sell some of our excess zinc concentrate. We have also identified opportunities to secure higher margin copper concentrates. While the business’ position has improved during the year, many challenges remain. Our efforts continue to be focused on stabilizing this operation and maximizing the generation of free cash flow.
Cost Management
Managing costs has remained a top priority. In 2004, we saw the mining industry’s cost curves rise as a result of the rising costs of oil, energy, acid, treatment and refining of metals and shipping, as well as the impact of a weakening U.S. dollar. Although the prices of these commodities and services are beyond our control, we remain focused on managing those costs we can control by driving efficiencies at our operations using Six Sigma. At Falconbridge, we have an enormous commitment to this program – and with good reason. This disciplined and measured approach to improving margins and driving efficiencies allowed us to realize benefits of $29 million in 2004 alone. With over 1,000 employees trained in Six Sigma, Falconbridge will continue to build on this success and benefit from this program in the future.
REFINED NICKEL
PRODUCTION
MINED COPPER
PRODUCTION
SUBSTANTIAL PIPELINE OF GROWTH OPPORTUNITIES
Falconbridge is a large nickel and copper producer, however, we are always exploring profitable growth opportunities that will further strengthen our position in these metals. In 2004, we uncovered and examined a number of opportunities to increase our nickel and copper production and extract further value from our operations.
Nickel
In 2004, we successfully increased the resource base of our Integrated Nickel Operations through exploration activities in Sudbury at the Nickel Rim South and Fraser Morgan properties, and at the Raglan mining camp.
6
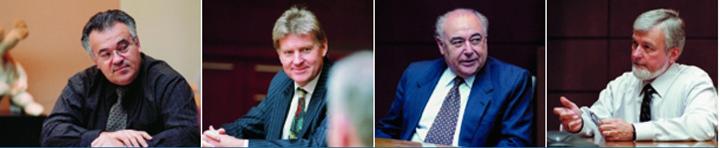
From left to right:
MICHAEL DOOLAN, Senior Vice-President & Chief Financial Officer
CLAUDE FERRON, President, Canadian Copper & Recycling
PETER KUKIELSKI, Executive Vice-President, Projects
JOSEPH LAEZZA, President, Nickel
IAN PEARCE, Senior Vice-President, Projects & Engineering
FERNANDO PORCILE, President, Copper
PAUL SEVERIN, Senior Vice-President, Exploration
Nickel Rim South is a high-grade 13.4 million tonne resource that has dramatically changed Falconbridge’s profile in Sudbury – extending the life of this resource base to at least 20 years. We began an underground definition program in 2004 and we anticipate starting ore production in 2009.
Fraser Morgan is another example of the success of our exploration efforts. Our exploration results were encouraging in 2004, resulting in new intersections with very high grades. A pre-feasibility study for the development of this site is now underway.
At Raglan, new discoveries and extensions to current ore zones added tonnes to the mineral reserves and resources equivalent to twice the amount of ore mined during the year. We are developing a two-phase expansion that would increase Raglan’s annual mine production from 900,000 tonnes to 1.2 million tonnes of ore (or a 5,000 tonne-per-year increase in refined nickel production) by 2007.
Production began in the fourth quarter of 2004 – ahead of schedule – at Montcalm, a property in the Timmins area that we acquired in 2001. Montcalm is expected to produce 750,000 tonnes of ore per year, which will increase annual nickel production by 9,000 tonnes, beginning in 2005.
To take advantage of rising nickel prices, we are also examining the potential to increase Montcalm’s production to 1.0 million tonnes of ore per year. We expect to complete the preliminary review of this acceleration project early in 2005.
Based on planned production rates at Sudbury and Raglan, the addition of Montcalm, and opportunities to increase materials from our custom feed business, we expect INO operations to run at full capacity of 85,000 tonnes of refined nickel beginning in 2005. This would be a new record for our business, and a production level we believe is sustainable for the next five years and beyond.
We are also examining expansion of our Falcondo ferronickel operation to add a further 6,000 to 7,000 tonnes of production. A scoping study is in progress for this two-phase expansion, and a decision is expected in 2005.
The Koniambo ferronickel project in New Caledonia represents a major growth initiative for Falconbridge. Koniambo is a very large nickel resource, and one of the best undeveloped nickel resources in the world. A bankable feasibility study (BFS) completed in 2004 supports annual production of 60,000 tonnes of nickel at a cash cost of $1.65/lb. At this production level, the resource base is sufficient to support 50 to 100 years of production, with future expansion possible.
During 2005, we will focus on the implementation strategy and financing structure of this $2.2 billion project, along with our 51% partner, Société Minière du Sud Pacifique (SMSP). Financially, we expect returns to exceed our cost of capital. Strategically, Koniambo represents a future anchor asset in our nickel business. As a long-life asset, Koniambo has the potential to add enormous value to Falconbridge for years to come.
Falconbridge has developed an excellent position in the nickel business. With the current expansion potential at our owned operations, as well as our partnership opportunities at new resources, Falconbridge has the potential to increase annual nickel production from its current 100,900 tonnes to more than 150,000 tonnes.
7
SIX SIGMA AND THE STAGE GATE PROCESS – LEVERAGING OUR POTENTIAL
Six Sigma has improved productivity at our operations since widespread implementation in 2002. The program provides a fact- and statistics-based approach to continuous improvement and project management. Dedicated full-time resources are applied to ensure the timely execution of projects and the maintenance of gains. A clear audit trail ensures easy validation of progress and final results.
Though sponsored by corporate management, Six Sigma is driven by local management and business unit strategies. Projects integrate individual initiatives with operational objectives and employee expertise to deliver bottom-line results.
Six Sigma improves and optimizes existing processes across all areas. Business and support unit management identify high-impact initiatives and ensure dedicated resources are applied and supported.
In addition, major capital projects under consideration at Falconbridge must pass through the stage gate approval process using Six Sigma-specific tools. At each phase of their evolution, only projects that meet defined deliverables and risk-hurdles are further developed.
Copper
We also have a number of opportunities to increase our copper production and realize further value from our copper operations.
A scoping study has been initiated at Collahuasi to assess further expansion that would increase annual copper production by 175,000 tonnes, of which Falconbridge’s share would be 77,000 tonnes. In addition, we began construction of a new molybdenum plant at Collahuasi in the first quarter of 2005, with first production expected in the first quarter of 2006. With average annual production capacity of 12,000 tonnes of molybdenum, this project is forecast to deliver high rates of returns, even at low molybdenum prices.
At Lomas Bayas, we have an option to purchase an adjacent resource, Fortuna de Cobre, which would allow us to increase copper production at Lomas Bayas by 50%, to 90,000 tonnes per year. If completed, Fortuna de Cobre could be in production by mid-2007 and would extend the life of the mine past 2020.
Expansion potential could increase Falconbridge’s annual copper production from the current 340,900 tonnes to more than 470,000 tonnes over the next five to seven years.
STRONG FINANCIAL POSITION
A key part of our strategy is to maintain a strong financial position and significant liquidity to enable us to fund our operations and projects at all points of the metals cycle. We target investment grade credit ratings for our debt securities and manage our credit ratios to meet investment grade criteria.
Over 2004, we strengthened our balance sheet by reducing our net-debtto-total-capitalization ratio to 24%, down from 37% at the end of 2003. With the high earnings level achieved in 2004, we were able to more than fund our operations and capital expenditures from operating cash flows.
We further increased our financial flexibility during the year, with more than $1 billion in cash and undrawn credit facilities available to fund our operations in 2005 and beyond.
LOOKING FORWARD WITH CONFIDENCE
Over the last few years, Falconbridge has grown into a key player in the world’s base metals industry. We have built momentum that is sustainable for the foreseeable future.
We enter 2005 with confidence in Falconbridge’s future. Positive nickel and copper fundamentals, combined with our solid production base and pipeline of high-quality growth opportunities, will continue to create value for our shareholders and allow Falconbridge to remain a leader in the industry.
I would like to thank our customers for their valued business, our shareholders for their continuing support, our Board of Directors for its guidance and our employees for another year of excellent work. It is because of you, our stakeholders, that Falconbridge is positioned to deliver another year of successful results in 2005.
/s/ Aaron Regent |
|
AARON REGENT | |
President & Chief Executive Officer | |
February 24, 2005 | |
8
Measuring Our Progress in 2004
OBJECTIVE |
|
|
| PERFORMANCE |
|
|
|
|
|
Achieve production and cost objectives |
| • |
| Met or exceeded production targets at most operations; lower-than-planned production at Sudbury due to three-week labour disruption. Controllable cost targets were largely met; results were impacted by exchange rate movements and higher energy prices. |
|
|
|
|
|
Complete Collahuasi, Kidd Mine D and Montcalm projects on budget and on schedule |
| • |
| Both Collahuasi and Montcalm were completed ahead of schedule and under budget; the Kidd Mine D project continues to progress. |
|
|
|
|
|
Complete Koniambo bankable feasibility study (BFS); finalize financing structure |
| • |
| The BFS was completed in the fourth quarter of 2004; development of financing structure and implementation approach continues in consultation with our 51% partner SMSP and the French Government. |
|
|
|
|
|
Complete scoping studies on expansions at Raglan, Falcondo, Collahuasi and Lomas Bayas |
| • |
| Scoping studies have been completed; development concepts being evaluated and pre-feasibility studies to be initiated in 2005. |
|
|
|
|
|
Add nickel and copper production through technology, exploration, acquisitions and partnerships |
| • |
| Strong exploration program added 4.3 million tonnes of discovered nickel resources; eight joint ventures were established in 2004; new targets were also identified. |
|
|
|
|
|
Maintain good access to capital and substantial liquidity |
| • |
| Current liquidity is over $1 billion; balance sheet ratios improved with a reduction in a net-debt-to-total-capitalization ratio to 24% from 37% in 2003. |
2005 Objectives
• Achieve production and cost objectives
• Advance growth initiatives in nickel and copper businesses
• Ensure projects remain on schedule and within budget
• Advance the Koniambo project
• Realize cost savings of $30 million through Six Sigma
• Maintain strong balance sheet and substantial liquidity
9
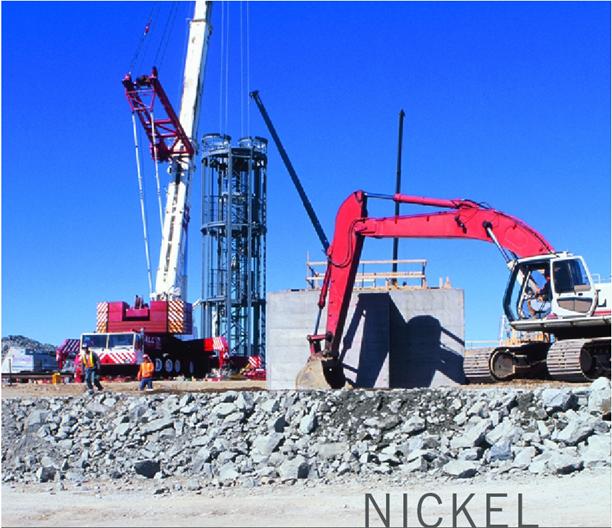
AS A LARGE PLAYER IN THE NICKEL MARKET, FALCONBRIDGE BENEFITED FROM STRONG PRICES IN 2004, WITH PRODUCTION OF REFINED NICKEL EXCEEDING 100,000 TONNES.
Above: Nickel Rim South, Sudbury, Ontario, galloway vent shaft
10
Nickel Market Review
IN 2004, NICKEL CONTINUED TO BENEFIT FROM STRONG DEMAND AND CONSTRAINED SUPPLY.
Strong Demand
Nickel consumption, mainly driven by stainless steel production, has grown at an average rate of 4% per year since 1993. Average stainless steel growth has been around 6% for the last decade, and the non-stainless steel sector has doubled its growth rate during the same period.
Since 1990, nickel demand from China has grown at more than twice the rate in the Western World. Despite these increases, China remains in the early stages of intense metal usage, and per capita metal consumption is only now reaching levels that have historically triggered significant growth in metal demand in other newly industrialized Asian countries.
Constrained Supply
Low nickel prices during the nineties led to both under-investment in the nickel industry and a short-term nickel shortage. The recovery to higher prices over the past few years has made a number of potential new projects more attractive. However, the significant time lag between mineral deposit discovery and metal delivery means that any new supply from these sources will require a number of years.
Low Inventories
London Metals Exchange (LME) inventories currently stand at critically low levels. In 2004, market pressure was alleviated to some degree by greater scrap availability, as well as some substitution into ferritic production and 200-series stainless steel.
With existing producers operating at full capacity and limited LME stocks, there is no extra supply elasticity in the system. Under these conditions, nickel prices are expected to be volatile.
Favourable Outlook
The fundamentally sound market conditions for nickel remain intact. The nickel market is expected to continue to benefit from strong ongoing demand over the long term, against a backdrop of limited supply.
FIRST USES OF NICKEL
NICKEL PRICES AND INVENTORIES

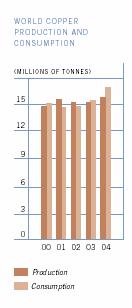
WORLD NICKEL PRODUCTION AND CONSUMPTION
WORLD STAINLESS STEEL PRODUCTION
11
Nickel – Operations and Growth Opportunities
FALCONBRIDGE’S STRATEGY TO SECURE NEW RESOURCES HAS BEEN FOCUSED ON A COMBINATION OF EXPLORATION, ACQUISITIONS AND THE CREATION OF JOINT VENTURES.
As a large player in the nickel market, with production of refined nickel exceeding 100,000 tonnes, Falconbridge benefited from strong prices in 2004. To maintain a strong position in nickel, the challenge faced by all mining companies is the requirement to replace reserves, to sustain production levels and to pursue growth opportunities. To meet this challenge, Falconbridge’s strategy to secure new resources has been focused on a combination of exploration, acquisitions and the creation of joint ventures.
Falconbridge’s substantial progress in these areas has positioned the Company to produce a record 113,000 tonnes of nickel in 2005, with anticipated further growth to over 150,000 tonnes in the future. Falconbridge has also improved the quality of its resources, with discoveries such as Nickel Rim South, which has much higher grades than current operations. Falconbridge’s recognized status as an industry leader has led to the creation of a number of joint ventures. In particular, Falconbridge was selected as the joint-venture partner to help develop the world-class Koniambo resource. Falconbridge works with partners all over the world, and is optimistic that its list of growth opportunities will continue to expand.
EXPLORATION SUCCESS, EXPANSION POTENTIAL
Nickel Rim South
In 2001, Falconbridge discovered Nickel Rim South – a high-grade 13.4 million tonne resource with over 1.8% nickel, 3.3% copper and significant platinum and palladium. A five-year, underground definition program began in the first quarter of 2004. After taking into account pre-production revenues, the net capital investment will be $412 million. Because of its high grades, Nickel Rim South will be one of the lowest-cost mines in the history of Falconbridge at Sudbury, with unit cash costs estimated at negative $0.65/lb. after by-product credits.
This project has progressed on schedule and within budget, and site work is in preparation for shaft sinkage, expected in early 2005. With full production anticipated in late 2009, Nickel Rim South will extend Falconbridge’s presence in the Sudbury basin for at least another 20 years.
Fraser Morgan
There has been continued exploration success at Fraser Morgan, which contains 7.0 million tonnes of measured, indicated, and inferred resources with high grades. Drilling in 2004 uncovered intersections of over 36 metres of 2.3% nickel. This resource has the potential for continued growth and a pre-feasibility development study is underway. With its location near existing infrastructure, capital development costs will be significantly lower than for a greenfield site.
Onaping Depth
Onaping Depth, in Sudbury, contains 15.8 million tonnes of high-grade indicated and inferred resources. This orebody, located below the Craig Mine, is accessible using Craig Mine infrastructure by deepening the existing shaft. In 2004, Falconbridge continued research on enabling technologies to mine safely at greater depths, and continues to make substantial progress.
Below, from left to right:
1) Sudbury, Ontario, underground mining 2) Montcalm, Ontario, aerial overview of holding ponds and site 3) Nikkelverk, Norway, quality control 4) Falcondo, Dominican Republic, conveyor
Opposite page, from left to right:
1) Nikkelverk, Norway, control room 2) Nickel Rim South, Sudbury, Ontario, vent shaft galloway assembly of two sections 3) Raglan, Quebec, employee 4) Nickel crowns
12
Raglan
Raglan, in northern Quebec, is an attractive deposit with 24.6 million tonnes of reserves and resources with close to 3% nickel and considerable potential for further discoveries. Exploration success has maintained total reserves and resources at approximately the same level since mine start-up in 1998. Continued growth in Raglan’s resource base supports future production rate increases. In 2004, the first phase of a two-phase optimization plan was initiated. The first phase will convert the mill from autogenous to semi-autogenous grinding, to increase its ability to process harder ore and ensure the maintenance of production levels at 1.0 million tonnes per year. The second phase would involve changes to the grinding circuits in the back half of the plant to increase the mining rate to 1.2 million tonnes per year. The optimization program would increase Raglan’s nickel production by 20%, or 5,000 tonnes beginning in 2007.
CAPACITY UTILIZATION, EXPANSION POTENTIAL
Montcalm
Acquired in 2001, Montcalm has 5.6 million tonnes of reserves and resources and is located near Timmins, Ontario. Construction of the $77 million mine, which is expected to produce 750,000 tonnes of ore annually, was completed in the fourth quarter of 2004. The ore will be processed at the Kidd mill and sent to Sudbury and Nikkelverk for smelting and refining, adding 9,000 tonnes to annual nickel production. Falconbridge is reviewing a project that would accelerate Montcalm’s annual mining rate to 1.0 million tonnes and maximize production during a period of expected high nickel prices.
Falcondo
At Falcondo, an expansion, which would take advantage of the existing plant infrastructure to increase production by 6,000 to 7,000 tonnes per year, is being evaluated. This expansion would involve two phases, with Phase I consisting of modifications to the power plant and Phase II consisting of the re-commissioning of the #2 furnace and de-bottlenecking various unit operations. This expansion would add additional nickel production at a relatively low capital cost.
SIX SIGMA CASE STUDY – NICKEL SALES (BRUSSELS)
OPPORTUNITY:
Reduce working capital associated with finished nickel inventory by 10%. Finished nickel historically ran at 50 days of sales, with inventory of 11,000 tonnes. With inventory financing costs already covered in the sales premium, it was important to achieve the reduction without loss of profitability or operating efficiency.
SOLUTION:
Through a focused Six Sigma approach, key inventory drivers were identified, processes mapped, and project-based initiatives launched at sales offices and the Nikkelverk refinery. Strong co-operation between sales and refinery personnel resulted in the development of new processes to manage the way nickel is sold and how it is delivered to customers.
IMPACT:
Working inventory of nickel improved from 50 to 38 days of sales, with inventory averaging 7,500 tonnes in 2004 and a reduction in working capital of more than $23 million. Results exceeded the original objective, and efforts are underway to continue reducing working capital associated with nickel inventory.
13
KONIAMBO IS A WORLD-CLASS RESOURCE THAT HAS THE POTENTIAL TO CONTRIBUTE TO FALCONBRIDGE’S FUTURE WHAT SUDBURY HAS CONTRIBUTED TO ITS PAST.
POSITIONED FOR GROWTH:
KONIAMBO – A WORLD-CLASS RESOURCE
Falconbridge is a 49% joint-venture partner in the development of the massive Koniambo orebody in New Caledonia. SMSP, the development arm of the North Province of New Caledonia, is the 51% partner.
Replenishing Resources
Koniambo is a world-class resource. Nickel is contained in both saprolite and limonite with grades that compare favourably with other laterite deposits in the world. The saprolite ore-body contains 142.1 million tonnes of measured and indicated resources at 2.13% nickel and 156.0 million tonnes of inferred resources at 2.2% nickel. Nickel would be extracted using a smelting process to produce ferronickel, similar to the process used at Falconbridge’s Falcondo operations. Nickel would be extracted from the limonite orebody, a resource of 100 million tonnes of over 1.6% nickel, using a hydrometallurgical process.
Project Advancing
During 2004, Falconbridge completed a bankable feasibility study (BFS) on the development and processing of the laterite resource. The BFS has increased the level of project definition with the level of engineering now at approximately 25%. Annual production would be 60,000 tonnes of nickel in ferro-nickel, at an estimated cash cost of $1.65/lb., positioning this operation as one of the largest nickel producers in the world. The costs of inputs have increased as a result of changes in foreign currency exchange rates as well as increased service and raw materials costs. The cost of Koniambo is now estimated at $2.2 billion, which includes the construction of a 390 MW power facility, a metallurgical plant, mine development and other infrastructure such as the port and road facilities, and excludes $500 million of other costs (see page 38).
Development of the limonite resource would be deferred for future years but is also sufficient to support a 60,000 tonne-per-year operation, providing a future opportunity to further increase the nickel production base.
With the completion of the BFS, the Company is focused on finalizing the financing structure and continues to hold discussions with its partner and the French government to determine their level of financial support.
With the Company’s successful development track record, Falconbridge is confident in Koniambo’s project management team and its ability to execute this project. The implementation approach continues to be assessed, with earliest possible start-up in 2009.
Koniambo’s scope and significance to Falconbridge’s future can be illustrated by comparing it to the Sudbury basin – one of the world’s most prolific sources of nickel. For over 75 years, Falconbridge has mined over 140 million tonnes of ore at an average grade of 1.5% nickel in Sudbury. Consequently, based on its even larger reserves and resources at over 2% nickel, Koniambo has the potential to contribute to Falconbridge’s future what Sudbury has contributed to its past, and will add significant value to shareholders for decades to come.
Below, from left to right:
Koniambo, New Caledonia 1) development work 2) field work 3) aerial overview 4) aerial overview

14

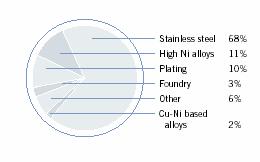
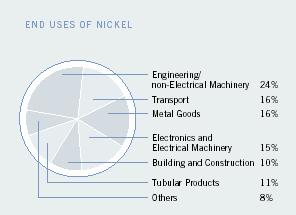
Nickel End Uses
NICKEL PLAYS AN IMPORTANT ROLE IN MODERN SUSTAINABLE SOCIETY, SPECIFICALLY BECAUSE ITS PROPERTIES ARE CRITICAL TO THE PERFORMANCE OF STAINLESS STEEL.
STAINLESS STEEL
The main force driving growing nickel demand over the past 20 years has been the stainless steel sector. Stainless steel benefits from nickel’s ductility – its ability to deform without losing toughness – and its corrosion resistance. Stainless steel is often the material of choice for its long life, anti-corrosion properties, strength-to-weight ratio, aesthetic appeal, weldability and its compatibility with food processing and storage.
Food Processing
Stainless steels are well established in the food-processing industry and are among the easiest steels to clean. The smooth pore-free surface not only prevents tainting and discolouration of utensils, but inhibits bacteria growth. With its bright and modern appearance, it is found in a broad range of kitchen applications from pots and pans, cutlery and sinks, to cladding of large appliances.
Architecture
There are diverse architectural applications for stainless steel, including railings, garbage bins, signs, escalators, elevators, ramps, outdoor furniture, doors, windows and cladding for the external facades of buildings, to name a few. Aesthetic appeal, a variety of finishes and corrosion resistance make stainless steel the material of choice for outdoor uses.
However, it is in large-scale construction projects, such as bridges, arenas and buildings, that stainless steel really stands out. Compared to less durable materials, such as carbon steel, concrete and plastics, stainless steel provides most applications with long-term performance and minimum down-time, making it ideal for long-life building structures. Moreover, due to its formability, versatility and visual appeal, the use of stainless steel has expanded beyond reinforcement to become the main design feature in visually spectacular structures.
NICKEL ALLOYS
Nickel alloys – metallic materials in which nickel is combined with other metals – are used in countless applications. In the innovative electronics and telecommunications sectors, nickel alloys are used in a wide variety of products such as semiconductors, cathode ray tubes for personal computers, optical and laser equipment, radio devices and various telecommunications equipment
components.
With their heat resisting properties, nickel-based high-performance alloys are used in jet engine turbine blades and vanes, which reach exceptionally high temperatures, and in combustion cans, which are the hottest part of jet engines. Liquid rocket engines use these alloys to provide high strength under extreme conditions. High performance nickel-based alloys are also an important constituent of industrial gas turbines for power generation, a market that is growing world wide.
15
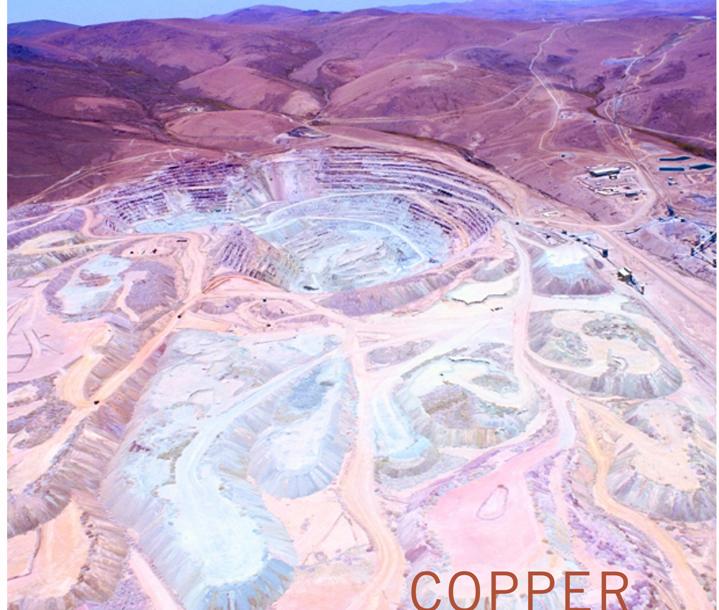
FALCONBRIDGE HAS A STRONG COPPER PLATFORM WITH THREE LARGE OPERATIONS: COLLAHUASI AND LOMAS BAYAS IN CHILE AND KIDD CREEK IN CANADA. THESE OPERATIONS PROVIDE A NUMBER OF OPPORTUNITIES TO CONTINUE TO EXPAND COPPER PRODUCTION.
Above: Collahuasi, Chile, Ujina pit
16
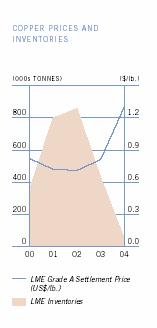
Copper Market Review
STRONG FUNDAMENTALS IN THE COPPER MARKET UNDERPINNED A 61% INCREASE IN COPPER PRICES IN 2004.
Copper prices benefited from strong demand combined with the limited supply that resulted from supply cutbacks and producer discipline in 2002 and 2003.
Strong Demand
In 2004, the strength of copper demand took the industry by surprise, growing by almost 9%. In the U.S., higher production in the auto sector and a booming construction sector have been the cornerstones of strong copper demand. The main driving force behind the resurgence of global copper demand, however, is China. With ongoing investment in basic infrastructure and growing domestic demand for electronic products and motor vehicles, this trend is expected to continue into the foreseeable future.
Producer Discipline and Low Inventory Levels
Copper inventories have declined dramatically since the beginning of 2003, as a result of producer shutdowns. These have had the intended effect of reducing large stock overhang. Exchange inventory levels have reached critical levels as a result of exceptionally strong demand and a number of production-related setbacks.
Outlook
Higher metal prices are leading to the restart of de-activated production, and to the emergence of new projects in the form of brownfield expansions and greenfield construction. Despite the rebound in refined production in 2004, and even greater expansion potential for 2005, demand is expected to continue to exceed supply, leaving the copper market in deficit for another year. Consequently, the copper price outlook moving into 2005 remains favourable.
17
Copper – Operations and Growth Opportunities
FALCONBRIDGE WAS A MAJOR BENEFICIARY OF THE HIGH COPPER PRICES REALIZED IN 2004, WITH MINED COPPER PRODUCTION REACHING A RECORD 340,900 TONNES.
As a large copper producer, Falconbridge was a major beneficiary of the high copper prices realized in 2004, with mined copper production reaching a record 340,900 tonnes. The Company has a strong platform in copper with three large operations: Collahuasi and Lomas Bayas in Chile, and Kidd Creek in Canada. The South American operations, in particular, present a number of exciting opportunities for expanding copper production by further developing resources.
Collahuasi
Collahuasi is a world-class resource in Chile in which Falconbridge holds a 44% interest, and its partners, Anglo American and a Japanese consortium, hold interests of 44% and 12%, respectively. Collahuasi is the world’s fourth largest copper producer and has extensive reserves and resources of over 4.0 billion tonnes of copper ore. Since start-up in 1999, Collahuasi has been a successful operation and maintained its position as a low-cost producer.
In 2004, construction of a new grinding circuit at the Ujina concentrator was completed, with successful transition to the Rosario pit. The project, which was completed ahead of schedule and under budget, increased the concentrator’s capacity from 70,000 to 110,000 tonnes per day, compensating for an anticipated decline in ore grade. As a result, Falconbridge’s share of 2004 production increased to 205,100 tonnes, from 168,600 tonnes in 2003.
In the first quarter of 2005, construction of a new molybdenum flotation plant began at Collahuasi. Mining operations have now shifted to the Rosario orebody, which contains economic molybdenum grades at the top of the mine, with increasing molybdenum grades as the orebody deepens. The new molybdenum plant will enable Collahuasi to capture the value of the molybdenum in the ore, particularly with current prices of over $30/lb. The plant’s average capacity will be 12,000 tonnes of molybdenum concentrate annually. First production is anticipated in the first quarter of next year with 2006 production expected to be approximately 4,000 tonnes. This production will increase over time as a result of the increase in molybdenum grades at depth. The capital cost of the plant will be $42 million, with Falconbridge’s share approximating $18 million.
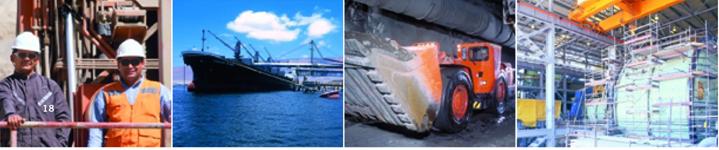
Below, from left to right:
1) Lomas Bayas, Chile, employees
2) Collahuasi, Chile, loading dock
3) Kidd Creek, Ontario, underground mining
4) Collahuasi, Chile, crusher
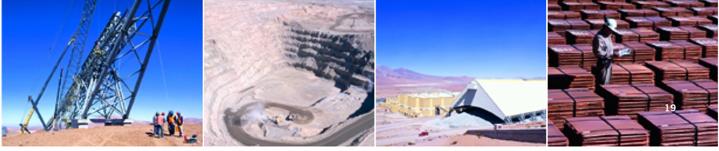
Opposite page, from left to right:
1) Collahuasi, ore-handling equipment
2) Lomas Bayas, Chile, open pit mine
3) Collahuasi, Chile, sulphide mineral stockpile
4) Lomas Bayas, Chile, copper cathode
18
With the large resource base at Collahuasi, a scoping study has been initiated to assess further expansion. This could increase production by a further 175,000 tonnes, with Falconbridge’s share at 77,000 tonnes. Mining rates would be increased and additional grinding and flotation capacity would be added. Modifications to the current infrastructure would also be required. The scoping study and preliminary engineering work will be completed in 2005, with first production possible in late 2007. This project would increase Collahuasi’s total copper production to approximately 675,000 tonnes per year, of which Falconbridge’s share would be 297,000 tonnes.
Lomas Bayas
Lomas Bayas is an open pit copper mine and a solvent extraction and electrowinning (SX-EW) plant in northern Chile. Since being acquired in 2001, Lomas Bayas has exceeded both production and earnings expectations, in addition to making a solid contribution to Falconbridge’s performance.
In 2004, a crusher expansion project was successfully completed at Lomas Bayas, on schedule and on budget. The plant achieved design capacity of 36,000 tonnes per day in the first week of June.
At Lomas Bayas there is an opportunity to further expand production. A scoping study has been initiated on a nearby deposit called Fortuna de Cobre, which could expand production by 50%, to 90,000 tonnes per year, and extend the mine life at Lomas Bayas by five years, to 2020. Fortuna de Cobre is an attractive growth opportunity because of its low stripping ratio and very favourable mineralogy and leaching kinetics. Falconbridge has the option to purchase Fortuna de Cobre by mid-2006.
SIX SIGMA CASE STUDY – COLLAHUASI
OPPORTUNITY:
Reduce monthly unplanned shutdown time and prevent production loss on both semi-autogenous (SAG) mill lines at Collahuasi’s concentrator.
SOLUTION:
Six Sigma tools identified the potential to decrease shutdowns due to electrical failures by 50%. Root causes of failures were identified and control measures were implemented in 2004, including:
• Training for all operators on new standard operating procedures;
• Predictive maintenance of key electrical systems and programmable logic controllers (PLCs); and
• Parallel backups for certain high-failure components.
IMPACT:
Monthly SAG mill shutdown time decreased on both lines, from an average of 10.12 hours to 2.77 hours. Bottom-line savings were $850,000 in 2004 and will increase going forward.
19
WITH STRONG OPERATIONS AND A NUMBER OF GROWTH OPPORTUNITIES, FALCONBRIDGE HAS THE POTENTIAL TO GROW ITS COPPER OUTPUT BY 35% OVER THE NEXT FIVE TO SEVEN YEARS.
Kidd Creek
Kidd Creek is located in Timmins, Ontario. Mining operations are now transitioning to the newly developed Mine D, which will improve operational stability and predictability, and should lead to improved financial performance. Commissioning of the block 1 ore handling system at Mine D was completed in 2004, with first ore hoisted up the shaft in July, ahead of the feasibility schedule. Mining rates are also planned to increase from a 2004 level of 2.1 million tonnes of ore annually to 2.4 million tonnes once in full production. With increased throughput, unit costs are expected to decline.
Progress was also made at Kidd’s metallurgical operations. Falconbridge reached an agreement with Agnico Eagle for a life-of-mine contract to process the majority of its annual production of zinc concentrate. This will ultimately provide the zinc operations at Kidd Creek with an annual supply of more than 100,000 tonnes of precious metal-bearing zinc concentrate, and will enable it to run with improved margins at full capacity.
At the end of 2004, ore from the Montcalm nickel deposit, near Timmins, Ontario, began to be treated at the Kidd concentrator. Montcalm will be in full production in 2005 and the Kidd concentrator will continue to process its nickel-bearing ores.
Kidd Creek has the potential to generate substantial free cash flow. The strategy with Kidd Creek is to maximize efficiencies at this operation and generate a significant level of cash flow, which can be redeployed into strategic, profitable growth opportunities.
Falconbridge is a large producer of copper with strong operations and a number of growth opportunities. Over the next five to seven years, Falconbridge has the potential to grow its copper output by 35%.
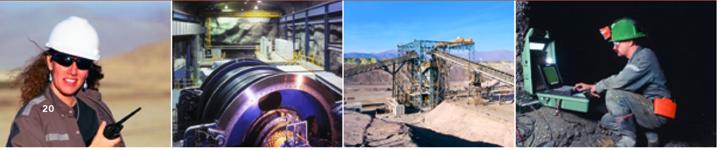
Below, from left to right:
1) Lomas Bayas, Chile, employee
2) Kidd Creek, Ontario, hoist room
3) Lomas Bayas, Chile, conveyer
4) Kidd Creek, Ontario, employee
20

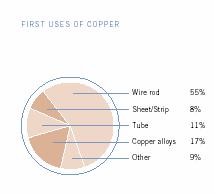
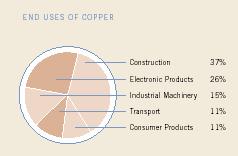
Copper End Uses
COPPER IS USED IN A WIDE SPECTRUM OF INDUSTRIES AND IS VALUED PREDOMINANTLY FOR ITS HIGH ELECTRICAL CONDUCTIVITY. COPPER COMBINES WITH OTHER METALS TO FORM AN EXTENSIVE RANGE OF COPPER-BASED ALLOYS POSSESSING MANY USEFUL PROPERTIES.
Copper Wire and Cable
Copper wire and cable, the most common copper products, are used in building and construction, automotive, electronics, industrial machinery and consumer products. These applications account for nearly 50% of copper consumption. Building wire is the largest end-use product. The use of copper wire in both residential and commercial buildings has increased considerably with the greater number of appliances and electronics now found in homes and businesses. The wire and cable application is anticipated to continue to grow in both mature and developing economies, as the number of electrical devices used at home and in the workplace continues to rise.
Electrical End Uses
The second largest end-use sector, accounting for 26% of Western World copper demand, is electrical and electronic products. These applications include telecommunication cable, power cable, transformer windings, semiconductors and motors for heavy appliances.
The volume of copper consumed by business electronics has grown rapidly, mainly driven by the widespread use of personal computers and, correspondingly, electronic connectors. The semiconductors currently found in computers no longer provide the speed and integration required by users, but copper provides a solution. With its lower resistance properties, it can improve speed and integration in semiconductors.
Telecommunications
The growth in the popularity of the Internet and email, delivered to users through digital subscriber lines (DSLs), has enhanced the role of copper in telecommunications. Residential markets are expected to follow recent growth patterns in the commercial and industrial sectors of the telecommunications segment. Similarly, developing countries are expected to undergo growth over the next few years that parallels recent gains in the industrialized world.
Automobiles
The automotive sector has significant potential. The use of copper in cars has doubled over the past 25 years and a typical car now contains more than 50 pounds of copper, mostly in electrical components and also in radiators. The increasing use of wiring and electronics in cars is a result of copper properties that enable smart sensors, smart airbags, electronic throttle control and improved exhaust sensors. The introduction of electric power steering, electric braking, and hybrid vehicles with battery-generated power, will provide additional opportunities to add several kilos of copper per vehicle.
21
Summary of Mineral Reserves and Mineral Resources(1)
|
| Percentage |
|
|
| Thousand |
| % |
| % |
| % |
| g/t |
|
Operation |
| Ownership |
| Category |
| Tonnes |
| Nickel |
| Copper |
| Zinc |
| Silver |
|
MINERAL RESERVES |
|
|
|
|
|
|
|
|
|
|
|
|
| ||
NickelDeposits |
|
|
|
|
|
|
|
|
|
|
|
|
|
|
|
|
|
|
|
|
|
|
|
|
|
|
|
|
|
|
|
Sudbury |
| 100 | % | Proven |
| 4,554 |
| 1.32 |
| 1.59 |
| — |
| — |
|
|
|
|
| Probable |
| 7,310 |
| 1.12 |
| 1.17 |
| — |
| — |
|
|
|
|
| Total |
| 11,864 |
| 1.20 |
| 1.33 |
| — |
| — |
|
Raglan |
| 100 | % | Proven |
| 6,270 |
| 2.63 |
| 0.74 |
| — |
| — |
|
|
|
|
| Probable |
| 9,382 |
| 2.95 |
| 0.81 |
| — |
| — |
|
|
|
|
| Total |
| 15,652 |
| 2.82 |
| 0.78 |
| — |
| — |
|
Montcalm |
| 100 | % | Proven |
| 3,162 |
| 1.56 |
| 0.75 |
| — |
| — |
|
|
|
|
| Probable |
| 1,724 |
| 1.44 |
| 0.70 |
| — |
| — |
|
|
|
|
| Total |
| 4,886 |
| 1.51 |
| 0.73 |
| — |
| — |
|
Falcondo(2) |
| 85.26 | % | Proven |
| 47,846 |
| 1.21 |
| — |
| — |
| — |
|
|
|
|
| Probable |
| 9,557 |
| 1.20 |
| — |
| — |
| — |
|
|
|
|
| Total |
| 57,403 |
| 1.21 |
| — |
| — |
| — |
|
|
|
|
|
|
|
|
|
|
|
|
|
|
|
|
|
Copper Deposits |
|
|
|
|
|
|
|
|
|
|
|
|
|
|
|
|
|
|
|
|
|
|
|
|
|
|
|
|
|
|
|
Kidd Creek |
| 100 | % | Proven |
| 14,286 |
| — |
| 1.91 |
| 5.64 |
| 62 |
|
|
|
|
| Probable |
| 3,780 |
| — |
| 1.35 |
| 7.52 |
| 47 |
|
|
|
|
| Total |
| 18,066 |
| — |
| 1.80 |
| 6.03 |
| 58 |
|
Lomas Bayas |
| 100 | % | Proven |
| 41,180 |
| — |
| 0.40 |
| — |
| — |
|
|
|
|
| Probable |
| 301,521 |
| — |
| 0.33 |
| — |
| — |
|
|
|
|
| Total |
| 342,701 |
| — |
| 0.34 |
| — |
| — |
|
Collahuasi(2) |
| 44 | % | Proven |
| 310,503 |
| — |
| 1.09 |
| — |
| — |
|
|
|
|
| Probable |
| 1,539,102 |
| — |
| 0.87 |
| — |
| — |
|
|
|
|
| Total |
| 1,849,605 |
| — |
| 0.90 |
| — |
| — |
|
|
|
|
|
|
|
|
|
|
|
|
|
|
|
|
|
MINERAL RESOURCES (IN ADDITION TO MINERAL RESERVES) |
|
|
|
|
|
|
|
| |||||||
Nickel Deposits |
|
|
|
|
|
|
|
|
|
|
|
|
|
|
|
|
|
|
|
|
|
|
|
|
|
|
|
|
|
|
|
Sudbury |
| 100 | % | Measured |
| 4,000 |
| 1.77 |
| 0.63 |
| — |
| — |
|
|
|
|
| Indicated |
| 17,770 |
| 2.36 |
| 1.04 |
| — |
| — |
|
|
|
|
| Total |
| 21,770 |
| 2.25 |
| 0.97 |
| — |
| — |
|
|
|
|
| Inferred |
| 29,700 |
| 1.8 |
| 2.6 |
| — |
| — |
|
Raglan |
| 100 | % | Measured |
| 55 |
| 3.93 |
| 1.11 |
| — |
| — |
|
|
|
|
| Indicated |
| 3,710 |
| 2.19 |
| 0.73 |
| — |
| — |
|
|
|
|
| Total |
| 3,765 |
| 2.22 |
| 0.74 |
| — |
| — |
|
|
|
|
| Inferred |
| 5,200 |
| 2.9 |
| 0.8 |
| — |
| — |
|
Montcalm |
| 100 | % | Measured |
| — |
| — |
| — |
| — |
| — |
|
|
|
|
| Indicated |
| — |
| — |
| — |
| — |
| — |
|
|
|
|
| Total |
| — |
| — |
| — |
| — |
| — |
|
|
|
|
| Inferred |
| 700 |
| 1.7 |
| 0.7 |
| — |
| — |
|
Falcondo(2) |
| 85.26 | % | Measured |
| — |
| — |
| — |
| — |
| — |
|
|
|
|
| Indicated |
| 13,840 |
| 1.53 |
| — |
| — |
| — |
|
|
|
|
| Total |
| 13,840 |
| 1.53 |
| — |
| — |
| — |
|
|
|
|
| Inferred |
| 6,400 |
| 1.4 |
| — |
| — |
| — |
|
|
|
|
|
|
|
|
|
|
|
|
|
|
|
|
|
Copper Deposits |
|
|
|
|
|
|
|
|
|
|
|
|
|
|
|
|
|
|
|
|
|
|
|
|
|
|
|
|
|
|
|
Kidd Creek |
| 100 | % | Measured |
| 310 |
| — |
| 1.32 |
| 6.08 |
| 43 |
|
|
|
|
| Indicated |
| 78 |
| — |
| 2.82 |
| 8.54 |
| 52 |
|
|
|
|
| Total |
| 388 |
| — |
| 1.62 |
| 6.57 |
| 45 |
|
|
|
|
| Inferred |
| 15,300 |
| — |
| 3.0 |
| 4.6 |
| 82 |
|
Lomas Bayas |
| 100 | % | Measured |
| 5,253 |
| — |
| 0.28 |
| — |
| — |
|
|
|
|
| Indicated |
| 239,736 |
| — |
| 0.27 |
| — |
| — |
|
|
|
|
| Total |
| 244,989 |
| — |
| 0.27 |
| — |
| — |
|
|
|
|
| Inferred |
| 42,000 |
| — |
| 0.3 |
| — |
| — |
|
Collahuasi(2) |
| 44 | % | Measured |
| 50,795 |
| — |
| 0.55 |
| — |
| — |
|
|
|
|
| Indicated |
| 430,031 |
| — |
| 0.65 |
| — |
| — |
|
|
|
|
| Total |
| 480,826 |
| — |
| 0.64 |
| — |
| — |
|
|
|
|
| Inferred |
| 1,820,000 |
| — |
| 0.8 |
| — |
| — |
|
1. The mineral reserve and resource estimates are prepared in accordance with the “CIM Definition Standards On Minera Resources and Mineral Reserves, adopted by CIM Council on November 14, 2004, and the CIM Estimation of Mineral Resources and Mineral Reserves Best Practice Guidelines”, adopted by CIM Council on November 23, 2003, using geostatistical and/or classical methods, plus economic and mining parameters appropriate to each project.
2. The mineral reserves and resources at Collahuasi and Falcondo are shown on a 100% basis.
There are no known environmental, permitting, legal, taxation, political or other relevant issues that would materially affect the estimates of the mineral reserves.
The mineral resources have reasonable prospects for economic extraction but have not yet had complete formal evaluation, or do not have demonstrated economic viability under current conditions.
The mineral reserve and mineral resource estimates are compiled and verified by Chester Moore, Director, Mineral Reserve Estimation and Reporting, a member of the Professional Geoscientists of Ontario with over 30 years experience as a geologist.
The mineral reserves and resources at Collahuasi are estimated and provided by the operator of the joint venture based on a copper price of US$0.95/lb. The mineral reserves and resources are estimated and classified to industry standards following the Australasian Institute of Mining and Metallurgy’s Joint Ore Reserve Committee code. These estimates have been restated to conform to CIM mineral reserve and resource definitions. The estimates are inspected annually by Chester Moore.
22
Financial Section
IN 2004, FALCONBRIDGE BENEFITED FROM IMPROVING FUNDAMENTALS FOR NICKEL, COPPER AND COBALT. IN 2005 AND BEYOND, THE COMPANY WILL CONTINUE ITS DRIVE TO MAXIMIZE PRODUCTION AT EXISTING OPERATIONS, GROW PROFITABLY WITH TIMELY AND JUDICIOUS INVESTMENTS, AND MAINTAIN A STRONG FINANCIAL POSITION.
TABLE OF CONTENTS
|
| |
|
|
|
|
| |
|
|
|
|
| |
|
|
|
|
| |
|
|
|
|
| |
|
|
|
|
| |
|
|
|
|
| |
|
|
|
|
| |
|
|
|
|
| |
|
|
|
|
| |
|
|
|
|
| |
|
|
|
|
| |
|
|
|
|
| |
|
|
|
|
| |
|
|
|
|
| |
|
|
|
|
| |
|
|
|
|
| |
|
|
|
|
| |
|
|
|
|
| |
|
|
|
|
| |
|
|
|
|
| |
|
|
|
|
| |
|
|
|
|
| |
|
|
|
|
| |
|
|
|
|
| |
|
|
|
|
| |
|
|
|
|
| |
|
|
|
|
| |
|
|
|
|
| |
|
|
|
|
| |
|
|
|
|
| |
|
|
|
|
| |
|
|
|
|
| CONSOLIDATED RESULTS – 2004 AND 2003 BY QUARTERS (UNAUDITED) |
Forward-looking Statements
This discussion contains forward-looking statements that involve risks, uncertainties and assumptions. Falconbridge’s actual financial condition and results of operations could differ materially from those that may be contemplated by these forward-looking statements as a result of those risks, uncertainties and assumptions. These risks include, but are not limited to, fluctuations in the prices for copper, nickel or other metals produced by Falconbridge; mining and processing risks; domestic and foreign laws, particularly environmental legislation; labour relations; geological and metallurgical assumptions and estimates; fluctuations in currency exchange rates, principally the Canadian/U.S. dollar exchange rate; interest rate and counter-party risks; energy supply and prices; foreign operations; market access; production and processing technology; legal proceedings; raw material procurement; and other risks and hazards associated with mining operations. For additional information regarding these factors, please see“Trends, Risks and Uncertainties” on page 54.
Falconbridge’s consolidated financial statements are prepared in accordance with Canadian generally accepted accounting principles (“GAAP”). The Company’s audited Consolidated Financial Statements for the year ended December 31, 2003 have been restated to reflect the adoption of the new Canadian Institute of Chartered Accountants (CICA) standard to account for Asset Retirement Obligations (ARO). Comparative numbers in the Management’s Discussion and Analysis have also been restated to reflect this change in accounting. Effective July 1, 2003, Falconbridge’s functional and reporting currency was converted to U.S. dollars. Unless otherwise noted, all amounts in this report are expressed in U.S. dollars.
In the following discussion and analysis, Falconbridge uses “net debt”, “net debt plus equity” and “operating cash costs” which are non-GAAP financial measures. The most directly comparable GAAP financial measures are “total debt”, “total debt plus equity” and “operating costs”, respectively. Reconciliations of these non-GAAP measures to the most directly comparable financial measures presented in accordance with GAAP may be found on pages 50 to 52.
Information contained in this discussion is given as of January 31, 2005, unless otherwise indicated.
23
Management’s Discussion and Analysis
FALCONBRIDGE HAD A RECORD YEAR IN 2004, CAPITALIZING ON A BUOYANT METALS MARKET AND ACHIEVING OR EXCEEDING MOST PRODUCTION TARGETS. EARNINGS FOR 2004 WERE $672 MILLION, AN INCREASE OF 252% FROM $191 MILLION IN 2003. CASH GENERATED FROM OPERATING ACTIVITIES BEFORE WORKING CAPITAL CHANGES TOTALED $1,067 MILLION IN 2004, COMPARED TO $445 MILLION FOR 2003.
Falconbridge is an international mining company engaged in the exploration, development, mining, processing and marketing of metals and minerals, with primary focus on nickel and copper. Falconbridge is also engaged in the custom feed business through the acquisition, processing and recycling of third-party materials. Falconbridge believes that it is the third-largest producer of refined nickel and the twelfth-largest copper producer in the world.
Products and Marketing
Falconbridge’s principal products are nickel, ferronickel, copper, zinc and cobalt. Other products include silver, gold, platinum group metals, cadmium, indium and sulphuric acid. Falconbridge markets and sells nickel and cobalt and certain other of its products internationally through marketing and sales offices in the United States, Belgium and Japan. Noranda Inc. acts as sales agent for all products from the Kidd Creek operations. Falconbridge markets copper concentrate and cathode from the Chilean operations through a marketing group in Santiago, Chile to customers around the world.
Mining and Processing Operations
Falconbridge has mining and mineral processing facilities in Canada (Sudbury, Raglan, Montcalm and Kidd Creek operations), Norway (Nikkelverk), the Dominican Republic (Falconbridge Dominicana, C. por A. (Falcondo)) and Chile (Compañía Minera Doña Inés de Collahuasi S.C.M. (Collahuasi) and Compañía Minera Falconbridge Lomas Bayas (Lomas Bayas)).
These activities are conducted through six segments – the Integrated Nickel Operations (INO), Falcondo, Kidd Creek, Collahuasi, Lomas Bayas and Corporate.
• The INO encompasses all operations engaged in the integrated operations of mining, milling, smelting, refining and marketing of metals mainly derived from Sudbury, Raglan and Montcalm nickel-copper ores and its custom feed business.
• Falcondo mines, mills, smelts and refines its own nickel laterite ores.
• Kidd Creek mines, mills, smelts and refines its own copper-zinc ores from Kidd Mine and processes Sudbury copper concentrate and custom feed materials. Beginning in the fourth quarter of 2004, Kidd Creek began milling Montcalm nickel-copper ore.
• Collahuasi mines and mills its sulphide ores into concentrate and mines and leaches copper oxide ores to produce copper cathode. Falconbridge owns 44% of Collahuasi.
• Lomas Bayas mines and refines its own copper ores.
• The Corporate segment accounts for the following expenditures: general and administrative, exploration, research and process development, foreign exchange gains and losses, and other expenses/(income) items.
Exploration Activities
The Falconbridge exploration team conducts worldwide exploration focused primarily on nickel and platinum group metals. Its mandate is to discover and delineate mineral resources that ultimately merit the Board of Directors’ approval to proceed to development and production. The team targets mineral resources of strategic size, in locations with acceptable country risk, with after-tax rates of return on investment of at least 15% and operating costs below the industry mid-point. Its goal is to conduct safe and environmentally responsible exploration utilizing the latest technological advances in exploration methodology to improve efficiency and the likelihood of success.
24
Joint-venture arrangements are pursued with both junior and senior mining companies to increase the level of focused activity and to share cost and risk.
Business Development
The business development function plays a critical role in several aspects of the Company’s management. First, it works in tandem with the various business units, exploration group and project development teams to plan, coordinate and implement long-term strategies to replace the reserves that are depleted in the normal course of mining operations and to grow the business throughout the cycle. Business development regularly evaluates opportunities for growth. These objectives are achieved by, amongst other things, evaluating potential acquisitions of mining properties or assets, investing in junior mining companies, partnering with other companies to develop growth opportunities, developing long-term strategic, commercial relationships or examining potential brownfield expansions within the Company’s existing asset base. Furthermore, the Company focuses on the development of long-term relationships, which increases the potential for identifying growth opportunities. The Company also focuses on growth opportunities that create additional synergies with its existing asset base.
Safety and Health
Providing a safe and healthy workplace is a priority at Falconbridge. Operations continue to implement effective safety training programs and management systems. Safety performance is strongly supported by senior management and the Board of Directors. Safety and health policies are in place at all Falconbridge operations and safety responsibilities are part of all job descriptions, job procedures and performance reviews.
Sustainable Development
Falconbridge is a strong proponent of sustainable development where economic prosperity, environmental quality and social equity drive business activities. This commitment is reflected in the Company’s Sustainable Development Policy. See further discussion on page 40.
Focus, Objectives and Business Strategy
Falconbridge is focused on the production of nickel and copper, two metals that continue to have positive long-term fundamentals and near-term outlooks. Both of these metals have competitive attributes which have led to diversified usage in the world’s economy and have had an average annual long-term consumption growth rate of over 4% for nickel and 3% for copper. Falconbridge has a unique position in these markets as one of the world’s largest producers of both metals, as well as substantial operational, technical, exploration and development experience. In addition, the Company has the potential to increase its production as a result of the development of a number of new projects.
Falconbridge’s objective is to increase returns to shareholders as measured by returns on net assets and on shareholders’ equity. To achieve this goal, Falconbridge’s business strategy is to continuously improve operating efficiencies to reduce costs, obtain maximum returns on existing assets and acquire, develop and mine high quality ore reserves. The Company believes that a conservative financial structure and financial flexibility are important in order to accommodate the capital intensive and cyclical nature of the business.
Nature of Business and Markets
Falconbridge’s business is international and, in essence, is the production and marketing of a commodity and the treatment of custom feed material. As a result, profitability and cash flows from operations are determined primarily by the price of the metals sold and the Company’s ability to produce at a low cost.
Price and Markets
Historically, the Company has experienced and expects to continue to be subject to volatile prices, which are influenced primarily by the world supply-demand balance for products and services, and related factors such as speculative activities, production activities by competitors, political and economic conditions, as well as production costs in major producing regions. Since the Company’s
25
products are marketed in all major geographical markets, the realized price for metals is also influenced by regional supply-demand factors, the availability and price of secondary or metal containing scrap material, and other substitute commodity products. Falconbridge generally accepts market prices and does not hedge the price it realizes on the sale of its own production.
A detailed analysis of relevant metal markets is discussed on page 52 – Markets.
Production Costs
The other primary determinant of profitability and cash flow from operations is the Company’s ability to produce at a low cost. Production costs are largely influenced by ore grades, mine planning, processes technology and the by-product credit revenues.
Business Risks
The primary risks facing Falconbridge are:
• Changes in metal prices
• Reliance on third-party feed
• Mining and processing risks
• Environmental risks
• Labour relations
• Uncertainty of reserve and production estimates
• Exchange rate fluctuations
• Interest rate and counter-party risks
• Energy supply and prices
• Foreign operations
• Treatment and refining charges
• Legal proceedings
The nature, implications and tools used to manage these risks are discussed fully starting on page 54 – Trends, Risks and Uncertainties.
Capital
Falconbridge’s business is capital intensive with significant costs involved in exploration activities, and the development of mining and metallurgical facilities. As such, securing low-cost capital is instrumental in profitability.
Historically, Falconbridge has sourced capital from common and preferred equity markets, public debt markets and bank debt.
Earnings, Cash Flows and Financial Condition
Falconbridge had a record year in 2004, capitalizing on a buoyant metals commodity market and achieving or exceeding most production targets. Earnings for 2004 were $672 million or $3.71 of basic earnings per common share ($3.69 per share on a diluted basis), an increase of 252% from $191 million or $1.03 of basic earnings per common share reported at the end of 2003. Operating income in 2004 was $969 million, compared to $301 million for 2003. Cash generated from operating activities before working capital changes totaled $1,067 million, compared to $445 million for 2003. All of these increases reflect higher average realized nickel, copper and zinc prices, which increased 45%, 61% and 24%, respectively, over the same period in 2003, and higher copper sales volumes, offset in part by lower nickel sales volumes and the impact of the stronger Canadian dollar, which when compared to the U.S. dollar was up 8% compared to the 2003 average.
There are many factors that influence the price received for commodities (see Markets discussion on page 52). Growing worldwide industrial production and continued strong growth from China has increased demand for metals. Falling inventories, combined with little new additional supply have been the catalyst for the rising metal prices.
The Company’s balance sheet improved in 2004, as the ratio of net debt to net debt plus equity improved to 24% from 27% at September 30, 2004 and from 37% at December 31, 2003. Cash and cash equivalents were $645 million at December 31, 2004. Falconbridge believes that although metal prices will be volatile, they remain fundamentally strong; therefore its balance sheet should continue to improve and that cash flows will be sufficient to cover all of its obligations for 2005.
26
Consolidated Statement of Earnings
(AUDITED – $ MILLIONS, EXCEPT PER SHARE DATA)
Years ended December 31 |
| 2004 |
| 2003 |
| ||
|
|
|
| Restated |
| ||
|
|
|
|
|
| ||
Revenues |
| $ | 3,070 |
| $ | 2,083 |
|
Operating expenses |
|
|
|
|
| ||
Costs of sales |
|
|
|
|
| ||
Costs of metal and other product sales |
| 1,682 |
| 1,413 |
| ||
Depreciation and amortization of property, plant and equipment |
| 274 |
| 249 |
| ||
|
| 1,956 |
| 1,662 |
| ||
Selling, general and administrative |
| 108 |
| 86 |
| ||
Exploration |
| 20 |
| 23 |
| ||
Research and process development |
| 12 |
| 13 |
| ||
Other expenses/(income) |
| 5 |
| (2 | ) | ||
|
| 2,101 |
| 1,782 |
| ||
Operating income |
| 969 |
| 301 |
| ||
Interest |
| 37 |
| 43 |
| ||
Earnings before taxes and non-controlling interest |
| 932 |
| 258 |
| ||
Income and mining taxes |
| 248 |
| 63 |
| ||
Non-controlling interest in earnings of subsidiary |
| 12 |
| 4 |
| ||
Earnings for the year |
| $ | 672 |
| $ | 191 |
|
Dividends on preferred shares |
| 7 |
| 9 |
| ||
Earnings attributable to common shares |
| $ | 665 |
| $ | 182 |
|
Basic earnings per common share |
| $ | 3.71 |
| $ | 1.03 |
|
Diluted earnings per common share |
| $ | 3.69 |
| $ | 1.02 |
|
The significant increase in operating income and earnings is attributable to the following factors:
• Consolidated revenues of $3,070 million increased from $2,083 million in 2003. The increase reflects higher average realized prices of nickel, copper, zinc and silver, higher precious metal revenues from the Integrated Nickel Operations and higher volumes of copper and zinc sales. This was partially offset by lower sales volumes of nickel and silver.
• Costs of metal and other product sales of $1,682 million increased by $269 million over 2003. The increase reflects higher mining costs, higher acquisition costs for custom feed, the impact of a stronger Canadian dollar and Chilean peso relative to the U.S. dollar, and higher copper and zinc sales volumes. This was partially offset by lower sales volumes of nickel and silver.
• Depreciation and amortization of property, plant and equipment of $274 million increased from $249 million in 2003. The increase of $25 million is attributable to higher units of production and larger asset bases at Canadian and Chilean operations.
• Selling, general and administrative costs increased to $108 million from $86 million in 2003, primarily as a result of the impact of the stronger Canadian dollar in 2004 versus 2003, and higher freight costs. Direct selling expenses were higher at Chile and Kidd in 2004, over 2003.
• Exploration expenditures of $20 million decreased from $23 million in 2003. This decrease is attributable to the increased sharing of exploration costs with joint-venture partners, offset in part by the impact of a weaker U.S. dollar.
• Research and process development expenditures of $12 million decreased marginally by $1 million over the corresponding period of 2003.
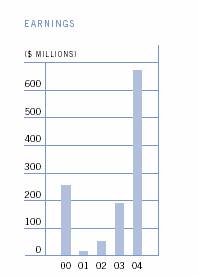
27
• Other expenses of $5 million in 2004 compared with other income of $2 million in 2003. The $7 million change is primarily attributable to the following: metals trading generated $2 million of losses in 2004 compared to gains of $11 million in 2003. This was offset in part by the recognition of $5 million of net interest income on interest rate swaps not eligible for hedge accounting and $2 million in gains on energy positions not eligible for hedge accounting.
Income and expenses were provided from the following non-operating sources:
• Net interest expense was $37 million in 2004, compared to $43 million in 2003. This decrease is attributable to higher capitalized interest related to projects and increased interest income due to higher cash balances.
• Income and mining tax expense of $248 million in 2004 compared to an expense of $63 million in 2003. This $185 million increase resulted primarily from higher levels of earnings in 2004.
• Non-controlling interest in earnings of subsidiary increased by $8 million, reflecting higher earnings at Falcondo.
Earnings by Segment
The following table summarizes audited segmented results of operations:
(AUDITED - - $ MILLIONS)
Years ended December 31 |
| 2004 |
| 2003 |
| ||
|
|
|
| Restated |
| ||
Principal operations – |
|
|
|
|
| ||
Integrated Nickel Operations (INO) |
| $ | 442 |
| $ | 224 |
|
Falconbridge Dominicana, C. por A. |
| 181 |
| 59 |
| ||
Nickel Operations |
| 623 |
| 283 |
| ||
Kidd Creek Operations |
| (45 | ) | (68 | ) | ||
Collahuasi |
| 361 |
| 115 |
| ||
Lomas Bayas |
| 95 |
| 32 |
| ||
Copper Operations |
| 411 |
| 79 |
| ||
Corporate costs |
| 65 |
| 61 |
| ||
Operating income |
| 969 |
| 301 |
| ||
Interest |
| 37 |
| 43 |
| ||
Income and mining taxes |
| 248 |
| 63 |
| ||
Non-controlling interest in earnings of subsidiary |
| 12 |
| 4 |
| ||
Earnings for the year |
| $ | 672 |
| $ | 191 |
|
Dividends on preferred shares |
| 7 |
| 9 |
| ||
Earnings attributable to common shares |
| $ | 665 |
| $ | 182 |
|
Falconbridge is the third-largest producer of refined nickel in the world, accounting for roughly 8% of world supply in 2004.
For 2004, operating income for the nickel business was $623 million, compared to $283 million for the same period in 2003. Refined nickel production was 100,887 tonnes in 2004, compared to 104,410 tonnes in the same period in 2003. The operating cash cost per pound of mined nickel for all of Falconbridge was $2.93 in 2004, compared with $2.78 in 2003.
Falconbridge has two nickel divisions. The INO produces London Metals Exchange (LME)-registered nickel and Falcondo produces ferronickel.
Integrated Nickel Operations (INO)
The INO includes mines and plants at Sudbury, Raglan and Montcalm in Canada, a smelter in Sudbury, a refinery at Kristiansand in Norway and a significant custom feed business.
The following table sets forth certain unaudited financial data with respect to Falconbridge’s Integrated Nickel Operations for the years indicated.
28
Years ended December 31 |
| 2004 |
| 2003 |
| 2002 |
|
Sales (tonnes) |
|
|
|
|
|
|
|
Nickel |
| 71,374 |
| 78,978 |
| 71,153 |
|
Copper |
| 51,057 |
| 59,208 |
| 54,495 |
|
Cobalt |
| 3,648 |
| 3,401 |
| 2,932 |
|
Revenues ($ millions) |
| 1,429 |
| 1,046 |
| 692 |
|
Realized price ($/lb. of nickel) |
| 6.40 |
| 4.40 |
| 3.14 |
|
Operating cash cost ($/lb. of nickel) |
| 2.57 |
| 2.64 |
| 1.96 |
|
Operating income ($ millions) |
| 442 |
| 224 |
| 86 |
|
Revenues: In 2004, sales volumes of nickel and copper decreased by 10% and 14%, respectively, as a result of lower metal deliveries resulting from the strike at Sudbury operations and reductions from custom shippers. Cobalt sales increased 7% from 2003 levels due to increases in production related to custom feeds. Realized nickel, copper and cobalt prices increased by 45%, 59% and 139%, respectively, in 2004. Precious metals revenues increased by $12 million to $99 million. In 2004, consolidated revenues for the INO increased 37%, to $1,429 million from $1,046 million in 2003.
Costs: In 2004, the operating cash cost of producing a pound of nickel from INO mines was $2.57. The $0.07, or 3%, decrease from 2003 costs was the result of increased mine production and higher by-product credits due to the increase in metal prices, which offset lower ore grades and increased costs to access the ore at Canadian operations due in part to the stronger Canadian dollar.
Operating Income: For 2004, the INO’s operating income was $442 million compared with $224 million for 2003. The $218 million increase was mainly due to higher metal prices, lower unit costs, and lower depreciation and amortization charges, which were partially offset by lower sales volumes for nickel and copper and increased administrative charges, again caused in part by the strengthening of the Canadian dollar.
Production: During 2004, Sudbury mines nickel production was 22,602 tonnes, compared with 24,143 tonnes in 2003. The shortfall in nickel production was attributable to the three-week labour strike in the first quarter of 2004, which reduced the annual production by 3,500 tonnes. For 2005, nickel in concentrate production at Sudbury is forecast at 22,500 tonnes.
For 2004, Raglan’s nickel in concentrate production was a record 26,552 tonnes and copper production was 6,867 tonnes, compared with 25,110 tonnes of nickel and 6,628 tonnes of copper in 2003 as increased ore tonnages offset the impact of lower ore grades. For 2005, nickel in concentrate production at Raglan is forecast to decline to 20,700 tonnes due to anticipated lower nickel grades and lower mill throughput resulting from a two-week shutdown for the conversion from an autogenous grinding mill to a semi-autogenous grinding mill.
Sudbury smelter production of nickel in matte was 52,595 tonnes in 2004, compared with 59,831 tonnes in 2003, largely as a result of the strike at Sudbury and lower concentrate grades.
At Nikkelverk, 2004 nickel production of 71,410 tonnes was lower than the 77,183 tonnes produced in 2003 due to lower shipments of material from Sudbury during the labour disruption. During the year, Nikkelverk achieved record cobalt production of 4,670 tonnes. For 2005, refined nickel and copper production forecasts at Nikkelverk are 85,000 tonnes and 37,000 tonnes, respectively. This nickel production forecast reflects expected higher volumes of available feed primarily as a result of the newly-constructed Montcalm mine.
INO Production and Sales
The following table sets forth certain segmented sales and production data with respect to Falconbridge’s Integrated Nickel Operations for the periods indicated.
29
Integrated Nickel Operations
|
| 2004 |
| 2003 |
| ||||||||
|
| Ore tonnes |
| Ni |
| Cu |
| Ore tonnes |
| Ni |
| Cu |
|
Production |
|
|
|
|
|
|
|
|
|
|
|
|
|
Sudbury – Mine |
|
|
|
|
|
|
|
|
|
|
|
|
|
Craig |
| 807 |
| 1.53 |
| 0.45 |
| 889 |
| 1.54 |
| 0.46 |
|
Fraser |
| 693 |
| 1.00 |
| 2.39 |
| 686 |
| 1.05 |
| 2.99 |
|
Lindsley |
| 462 |
| 1.14 |
| 1.24 |
| 429 |
| 1.16 |
| 1.36 |
|
Lockerby |
| 187 |
| 1.91 |
| 0.91 |
| 225 |
| 1.88 |
| 1.15 |
|
Total mined |
| 2,149 |
|
|
|
|
| 2,229 |
|
|
|
|
|
Total – ore processed |
| 2,259 |
| 1.31 |
| 1.28 |
| 2,261 |
| 1.35 |
| 1.48 |
|
Raglan mine |
| 935 |
| 3.31 |
| 0.94 |
| 834 |
| 3.47 |
| 0.99 |
|
Montcalm mine |
| 220 |
| 1.32 |
| 0.68 |
| — |
| — |
| — |
|
|
| Ni |
| Cu |
| Co |
| Ni |
| Cu |
| Co |
|
Metal in concentrate (tonnes) |
|
|
|
|
|
|
|
|
|
|
|
|
|
Sudbury mine output |
| 22,602 |
| 24,694 |
| 565 |
| 24,143 |
| 29,161 |
| 611 |
|
Raglan mine output |
| 26,552 |
| 6,867 |
| 404 |
| 25,110 |
| 6,628 |
| 381 |
|
Montcalm mine output* |
| 2,152 |
| 1,188 |
| 66 |
| — |
| — |
| — |
|
Metal in copper concentrate |
| 75 |
| 17,598 |
| — |
| 110 |
| 21,874 |
| — |
|
Smelter, refinery |
|
|
|
|
|
|
|
|
|
|
|
|
|
Smelter (tonnes) |
|
|
|
|
|
|
|
|
|
|
|
|
|
Mines – Sudbury |
| 18,653 |
| 5,806 |
| 427 |
| 24,687 |
| 8,139 |
| 658 |
|
– Raglan |
| 23,849 |
| 6,331 |
| 313 |
| 28,708 |
| 7,678 |
| 463 |
|
– Montcalm* |
| 1,828 |
| 403 |
| 50 |
| — |
| — |
| — |
|
Custom |
| 8,265 |
| 5,861 |
| 1,048 |
| 6,436 |
| 4,962 |
| 1,075 |
|
Total |
| 52,595 |
| 18,401 |
| 1,838 |
| 59,831 |
| 20,779 |
| 2,196 |
|
Refinery (tonnes) |
|
|
|
|
|
|
|
|
|
|
|
|
|
Mines – Sudbury |
| 19,849 |
| 6,751 |
| 421 |
| 25,351 |
| 8,862 |
| 688 |
|
– Raglan |
| 26,248 |
| 7,523 |
| 330 |
| 27,020 |
| 6,895 |
| 437 |
|
– Montcalm* |
| 1,131 |
| 179 |
| 30 |
| — |
| — |
| — |
|
Custom |
| 24,182 |
| 21,190 |
| 3,889 |
| 24,812 |
| 20,095 |
| 3,431 |
|
Total |
| 71,410 |
| 35,643 |
| 4,670 |
| 77,183 |
| 35,852 |
| 4,556 |
|
|
| Ni |
| Cu |
| Co |
| Ni |
| Cu |
| Co |
|
Sales (tonnes) |
|
|
|
|
|
|
|
|
|
|
|
|
|
Mines – Sudbury |
| 19,780 |
| 21,790 |
| 440 |
| 26,278 |
| 32,767 |
| 667 |
|
– Raglan |
| 26,815 |
| 7,521 |
| 338 |
| 26,627 |
| 6,820 |
| 412 |
|
– Montcalm* |
| 774 |
| 461 |
| 12 |
| — |
| — |
| — |
|
Custom |
| 23,801 |
| 21,285 |
| 2,858 |
| 25,775 |
| 19,621 |
| 2,322 |
|
Purchased product |
| 204 |
| — |
| — |
| 298 |
| — |
| — |
|
Total |
| 71,374 |
| 51,057 |
| 3,648 |
| 78,978 |
| 59,208 |
| 3,401 |
|
*Includes pre-production material
Other Developments
In the fourth quarter of 2004, the Board of Directors approved Phase I of the Raglan Optimization program – an expansion that will increase annual production by approximately 5,000 tonnes of nickel per year. The capital cost for Phase I is estimated at $28 million and involves the conversion from autogenous to semi-autogenous grinding, which will increase the level of annual throughput to approximately 1.0 million tonnes and increase the mill’s ability to process harder ore. Engineering work on Phase II is underway, with changes to the grinding circuit and other concentrator equipment to further increase annual production rates being assessed.
The development of the Montcalm nickel mine in Timmins, Ontario was completed in December 2004, under budget and two months ahead of schedule. In 2004, Montcalm produced
30
2,152 tonnes of nickel and reached full production by the end of the year. Beginning in 2005, production at Montcalm is expected to be 9,000 tonnes per year.
Reserves & Exploration: At planned operating rates, the proven and probable mineral reserves at Sudbury are equal to approximately six years of production. Production is expected to be extended as it is anticipated that a significant portion of the mineral resources will be converted to mineral reserves and will lengthen the life of the operation.
In 2004, the Sudbury division’s proven and probable mineral reserves decreased by an additional 200,000 tonnes after production of 2.0 million tonnes. The loss of reserves mainly resulted from re-estimation of stopes in Zones 6 and 7 at Fraser mine. This loss was mostly offset by gains in reserves at the Thayer Lindsley mine due to a lowering of the cut-off grade. At December 31, 2004, total proven and probable reserves were 11.9 million tonnes.
Total mineral resources increased again in 2004, from 49.4 million to 51.5 million tonnes with additions at Nickel Rim South and Fraser Morgan. A small overall loss occurred in the mines. Approximately 1.7 million tonnes were added at Nickel Rim South in 2004. The Nickel Rim South deposit is now estimated to contain 13.4 million tonnes of 1.8% nickel, 3.3% copper,1.8 grams/tonne platinum, 2.0 grams/tonne palladium and 0.8 grams/tonne gold. Fraser Morgan Zones 8, 9, 10 and 11 increased by 700,000 tonnes to measured and indicated resources of 4.9 million tonnes and inferred resources of 2.1 million tonnes.
At Raglan, the mineral reserves are equal to approximately 17 years of production at current operating rates. Mineral reserves decreased by 2.0 million tonnes as a result of annual production, write-downs and reclassification to resources. At December 31, 2004, total proven and probable reserves at Raglan were 15.7 million tonnes. Mineral resources were increased by 1.8 million tonnes, primarily a result of discoveries and additions at Zone 3, Zones 5-8, West Boundary and Donaldson through exploration.
At planned operating rates, the mineral reserves at Montcalm are equal to approximately seven years of production. Mineral reserves decreased from 5.1 million tonnes to 4.9 million tonnes due to the start of production in 2004. Inferred resources totaling 0.7 million tonnes remain as before.
Falcondo
Located in the Dominican Republic, Falcondo mines, mills, smelts and refines its own nickel laterite ores. Falconbridge owns 85.26% of Falcondo.
The following table sets forth certain unaudited financial data with respect to Falcondo for the periods indicated.
Years ended December 31 |
| 2004 |
| 2003 |
| 2002 |
|
Sales of ferronickel (tonnes) |
| 28,936 |
| 27,133 |
| 21,446 |
|
Production (tonnes) |
| 29,477 |
| 27,227 |
| 23,303 |
|
Revenues ($ millions) |
| 406 |
| 252 |
| 149 |
|
Realized price ($/lb. of ferronickel) |
| 6.37 |
| 4.20 |
| 3.16 |
|
Operating cash cost ($/lb. of ferronickel) |
| 3.50 |
| 3.04 |
| 2.76 |
|
Operating income/(loss) ($ millions) |
| 181 |
| 59 |
| (1 | ) |
Revenues: In 2004, revenues of $406 million at Falcondo were 61% higher compared to $252 million in 2003. Revenues were positively impacted by the 7% increase in sales volumes to 28,936 tonnes, from 27,133 tonnes in 2003 and a 52% increase in the realized ferronickel price in 2004, compared to 2003.
Costs: In 2004, Falcondo’s operating cash cost per pound of ferronickel was $3.50, compared with $3.04 in 2003. The increase in costs was largely due to the increase in the oil price and costs for extra power generation during periods of power plant maintenance. Falcondo’s delivered oil costs rose from $29.42 per barrel in 2003 to $36.63 in 2004, which represents a discount to West Texas Intermediate (WTI) of $1.68 and $5.15 per barrel, respectively, due to procurement strategies and partial use of low-cost heavy oil.
Operating Income: Falcondo’s 2004 operating income was $181 million, compared with $59 million in 2003. The $122 million higher contribution reflects a higher ferronickel selling price and increased sales volumes reduced by the impact of higher oil costs.
31
Production: For 2004, Falcondo increased production by 8% to 29,477 tonnes of nickel in ferronickel compared to 27,227 tonnes in 2003. For 2005, production at Falcondo is forecast at 28,000 tonnes.
Reserves & Exploration: At planned operating rates, the proven and probable mineral reserves are equal to approximately 16 years of production. The proven and probable mineral reserves at Falcondo showed a total decrease of 3.5 million tonnes after production of 3.7 million tonnes in 2004. After production, most adjustments in the proven and probable reserve categories were due to a drilling campaign on the Barmac Reject Stockpile. At December 31, 2004, total proven and probable reserves were 57.4 million tonnes.
Falconbridge is also an important copper producer, ranking twelfth in the world in mined production during 2004. The Company’s copper operations include Kidd Creek in Canada and Collahuasi and Lomas Bayas in Chile.
Operating income of the copper business totaled $411 million in 2004, compared with $79 million in 2003. Copper production from Kidd Creek and South American operations was 308,186 tonnes in 2004, compared with 275,414 tonnes in 2003. The operating cash cost per pound of copper was $0.58 in 2004, compared with $0.53 in 2003.
Collahuasi
Compañía Minera Doña Inés de Collahuasi S.C.M., in which Falconbridge holds a 44% interest, operates the Collahuasi mine in northern Chile. Collahuasi mines and mills copper sulphide ores into concentrate and mines and leaches copper oxide ores to produce cathodes.
The following table sets forth certain unaudited financial data with respect to Collahuasi for the periods indicated.
Falconbridge’s 44% share
Years ended December 31 |
| 2004 |
| 2003 |
| 2002 |
|
Sales of copper (tonnes) |
| 204,636 |
| 168,147 |
| 187,524 |
|
Production (tonnes) |
| 205,116 |
| 168,578 |
| 185,014 |
|
Revenues ($ millions) |
| 566 |
| 275 |
| 246 |
|
Realized price ($/lb. of copper) |
| 1.30 |
| 0.80 |
| 0.71 |
|
Operating cash cost ($/lb. of copper) |
| 0.45 |
| 0.38 |
| 0.39 |
|
Operating income ($ millions) |
| 361 |
| 115 |
| 83 |
|
Revenues: In 2004, Falconbridge’s share of Collahuasi revenues was $566 million, compared to $275 million in 2003. This $291 million increase in revenue is attributable to both higher copper prices and higher sales volumes, compared with 2003.
Costs: In 2004, the operating cash cost was $0.45/lb. of copper compared to $0.38/lb. in 2003. This increase resulted from higher realization costs, including treatment and refining charges and freight, and the strengthening of the Chilean peso against the U.S. dollar.
Operating Income: In 2004, Falconbridge’s share of operating income was $361 million compared with $115 million in 2003. The positive variance is mostly attributable to higher copper prices and sales volumes, partially offset by higher production costs.
Production: In 2004, Falconbridge’s share of copper production totaled 205,116 tonnes, 22% higher than the production of 168,578 tonnes in 2003. The increase was driven by the added production that resulted from the Ujina-Rosario transition and the concentrator expansion, completed during the year. Copper production in 2005 is forecast at 220,000 tonnes.
Other Developments
In 2004, the construction of a new grinding circuit at the Ujina concentrator and the shifting of mining operations from the Ujina to the Rosario orebody were completed ahead of schedule and under budget. This project increased Collahuasi’s concentrator design capacity to 110,000 tonnes per day from 70,000 tonnes per day, compensating for an expected decline in ore grade and thereby enabling Collahuasi to maintain copper production at current levels. The total capital cost
32
of the transition and concentrator expansion project was $584 million, with Falconbridge’s 44% share of this cost totaling $257 million.
Conceptual study of the second expansion of the copper concentrator is on track. This project would involve adding a grinding line similar to the last expansion and accelerating the production rate at the Rosario pit, where grades are higher than at Ujina. This expansion would potentially increase total Collahuasi copper production by 175,000 tonnes, of which Falconbridge’s share would be 77,000 tonnes. First production could be expected in 2007 at the earliest.
In the first quarter of 2005, construction of a new molybdenum flotation plant will begin at Collahuasi. Mining operations have now shifted to the Rosario orebody, which contains economic molybdenum grades at the top of the mine, with increasing molybdenum grades as the orebody deepens. The new molybdenum plant will enable Collahuasi to capture the value of the molybdenum in the ore, and take advantage of high molybdenum prices, which are currently over $30/lb. The plant’s average capacity will be 12,000 tonnes of molybdenum concentrate annually. Operations will begin in late 2005, with 2006 production of molybdenum in concentrate expected to be approximately 4,000 tonnes. This production will increase over time, as a result of the increase in molybdenum grades at depth. The capital cost of the plant is forecast at $42 million, with Falconbridge’s share approximating $18 million.
Reserves & Exploration: The December 31, 2004 total proven and probable mineral reserves of 1,849.6 million tonnes at Collahuasi were increased by 41.4 million tonnes after production of 41.5 million tonnes. The overall increase of 82.9 million tonnes is due to revision of the resource models (76.5 million tonnes) based on new drill information and the addition of new exotic copper orebodies (6.4 million tonnes). At planned operating rates, the proven and probable mineralreserves are equal to over 40 years of production.
In 2006, Collahuasi plans to produce a molybdenum concentrate from material mined at the Rosario deposit. At that time, the molybdenum grade of the Rosario reserves is estimated to be 0.03% molybdenum.
Lomas Bayas
Compañía Minera Falconbridge Lomas Bayas mines and leaches copper oxide ores to produce cathodes.
The following table sets forth certain unaudited financial data with respect to Lomas Bayas for the periods indicated.
Years ended December 31 |
| 2004 |
| 2003 |
| 2002 |
|
Sales of copper (tonnes) |
| 60,190 |
| 61,289 |
| 60,265 |
|
Production (tonnes) |
| 62,041 |
| 60,427 |
| 59,304 |
|
Revenues ($ millions) |
| 183 |
| 114 |
| 97 |
|
Realized price ($/lb. of copper) |
| 1.38 |
| 0.84 |
| 0.73 |
|
Operating cash cost ($/lb. of copper) |
| 0.52 |
| 0.47 |
| 0.45 |
|
Operating income ($ millions) |
| 95 |
| 32 |
| 18 |
|
Revenues: In 2004, revenues were $183 million, compared to $114 million in 2003. The $69 million increase was attributable to higher copper prices.
Costs: In 2004, the operating cash cost was $0.52/lb. of copper, up from $0.47/lb. in the same period of 2003. The increase was driven by higher contractor costs (mainly maintenance and freight), higher fuel and acid costs, and the strengthening of the Chilean peso against the U.S. dollar.
Operating Income: In 2004, operating income was $95 million, up from $32 million in 2003. Higher sales prices more than offset the impact of higher production costs.
Production: In 2004, cathode production was 62,041 tonnes, compared to 60,427 tonnes in 2003. Copper production in 2005 is forecast at 62,000 tonnes.
Reserves & Exploration: At planned operating rates, the proven and probable mineral reserves are equal to approximately 10 years of production. The mineral reserves decreased by 21.2 million tonnes due to mine production of 29.6 million tonnes and positive reserve adjustments of 8.4 million tonnes due to a revised reserve estimation model and additional diamond drill information. The December 31, 2004 mineral reserves total was 342.7 million tonnes of 0.34% copper.
33
An option to purchase is held on the Fortuna de Cobre deposit which is located near Lomas Bayas and contains measured plus indicated mineral resources totaling 470.3 million tonnes of 0.29% copper. It is thought that low acid consumption and rapid leach times will compensate for the low copper grades and allow economic extraction. An evaluation of the project is underway to determine the future course of action on the property.
Consolidated Kidd Creek Operations
Kidd Creek is an integrated processing facility engaged in the mining, milling, smelting and refining of its own copper and zinc ores and in the processing of custom feed.
The following table sets forth certain unaudited financial data with respect to Falconbridge’s Kidd Creek operations for the periods indicated.
Years ended December 31 |
| 2004 |
| 2003 |
| 2002 |
|
Sales (tonnes) |
|
|
|
|
|
|
|
Copper (in metal and concentrate) |
| 90,286 |
| 105,162 |
| 110,575 |
|
Zinc (in metal and concentrate) |
| 135,259 |
| 110,592 |
| 148,418 |
|
Revenues ($ millions) |
| 486 |
| 396 |
| 340 |
|
Realized copper price ($/lb. of copper) |
| 1.32 |
| 0.83 |
| 0.74 |
|
Realized zinc price ($/lb. of zinc) |
| 0.51 |
| 0.41 |
| 0.39 |
|
Operating cash cost ($/lb. of copper) |
| 0.93 |
| 0.83 |
| 0.68 |
|
Operating loss ($ millions) |
| (45 | ) | (68 | ) | (46 | ) |
Revenues: In 2004, revenues totaled $486 million, up 23% from revenues of $396 million for the same period of 2003. Higher metal prices, by-product revenues and zinc sales volumes largely accounted for this variance.
Costs: In 2004, operating cash costs at the Kidd Mine were $0.93/lb. of copper compared to $0.83/lb. in 2003. The majority of this increase relates to reduced tonnes milled/hoisted, combined with increased spending for contracted services and mine supplies, and the impact of the stronger Canadian dollar.
Operating Income: Kidd Creek reported an operating loss of $45 million for 2004, compared to an operating loss of $68 million in the same periods for 2003.
Production: In 2004, copper and zinc in concentrate production at Kidd Mine totaled 41,029 tonnes and 87,847 tonnes, respectively, compared to 46,409 tonnes and 75,528 tonnes, respectively, during 2003. Lower copper volumes were the result of lower tonnage and lower ore grades; meanwhile, higher zinc volumes benefited from higher ore grades, partially offset by lower tonnage.
At the Kidd Mining division, ore mined and milled in 2004 was 2,094 thousand tonnes and 2,063 thousand tonnes, respectively, slightly below 2003 levels. In 2004, concentrator throughput was 3% below that of 2003, due mainly to ore availability in the first half of the year and an ore car derailment in the third quarter that damaged and closed the main haulage line for one week. Tie-ins for the Montcalm circuit also adversely impacted production. In 2004, copper and zinc head grades were 2.1% and 5.0%, respectively, compared to 2.3% and 4.3% last year. The copper and zinc mine production forecast for 2005 has been estimated at 46,000 tonnes and 100,000 tonnes, respectively.
In 2004, copper cathode and refined zinc production totaled 115,578 tonnes and 121,557 tonnes, respectively, compared to 132,364 tonnes and 94,719 tonnes, respectively, in 2003. The copper plant variance was due mainly to an extended shutdown resulting from the premature failure of the C furnace in May and restricted volumes resulting from acid plant operational issues related to the interpass tower. The zinc plant’s favourable output was a function of higher throughput volumes and the reduction of the annual shutdown to seven weeks in 2004,versus 13 weeks in 2003. For 2005, refined copper production is expected to be approximately 130,000 tonnes, and zinc production approximately 135,000 tonnes.
Other Developments
In the fourth quarter of 2004, commissioning of the Montcalm nickel circuit began in the Kidd Creek concentrator. The first ore was processed on October 17 and achieved commercial operating rates several months ahead of schedule.
34
In April 2004, Falconbridge reached an agreement with Agnico Eagle for a life-of-mine contract to process the majority of its annual production of zinc concentrate from its LaRonde mine. This will ultimately provide the zinc operations at Kidd Creek with an annual supply of over 100,000 tonnes of precious metal-bearing zinc concentrate, and will enable it to run with improved margins at full capacity.
In the fourth quarter of 2004, the zinc plant successfully commissioned the precious metal recovery circuit on time and on budget. Tie-ins and equipment commissioning began in the second week of October with the first tonnes of LaRonde zinc concentrate processed before the end of October and first shipments of precious metals residue sent to Noranda’s Brunswick smelter the following week.
Kidd continues to develop Mine D, the depth extension of Kidd mine orebody. At Mine D, commissioning of the ore handling system was completed in 2004, with first ore hoisted up the shaft in July, ahead of the feasibility schedule. The shaft is now below the 8800 level. The Operations group has assumed control of the Block 1 Ore Handling System.
In 2004, $127 million, including capitalized interest, was spent on Mine D development (2003 – $85 million), with a total of $404 million spent to date. Mine D will allow the mine to produce 2.4 million tonnes of ore annually once in full production. The cost of Mine D Stage I has been estimated at $500 million, excluding capitalized interest.
The following table sets forth certain segmented sales and production data with respect to Falconbridge’s Kidd Creek operations for the periods indicated.
Kidd Creek Operations
|
| 2004 |
| 2003 |
| ||||||||||||
|
| Ore tonnes |
|
|
|
|
|
|
| Ore tonnes |
|
|
|
|
|
|
|
|
| (x 1,000) |
| Cu % |
| Zn % |
| Au g/t |
| (x 1,000) |
| Cu % |
| Zn % |
| Au g/t |
|
Production |
|
|
|
|
|
|
|
|
|
|
|
|
|
|
|
|
|
Kidd Mining Division |
|
|
|
|
|
|
|
|
|
|
|
|
|
|
|
|
|
No. 1 and 2 Mines |
| 674 |
| 2.27 |
| 6.63 |
| 156 |
| 737 |
| 2.36 |
| 6.12 |
| 87 |
|
No. 3 Mine |
| 1,210 |
| 2.16 |
| 4.32 |
| 60 |
| 1,371 |
| 2.25 |
| 3.20 |
| 41 |
|
D Mine |
| 210 |
| 1.04 |
| 4.69 |
| 26 |
| — |
| — |
| — |
| — |
|
Total mined |
| 2,094 |
|
|
|
|
|
|
| 2,108 |
|
|
|
|
|
|
|
Total ore milled |
| 2,063 |
|
|
|
|
|
|
| 2,125 |
|
|
|
|
|
|
|
(tonnes except |
|
|
| Cu |
| Cu |
|
|
|
|
|
|
| Cu |
| Cu |
|
|
|
|
|
000 troy ounces for Ag) |
| Cu |
| Cathode |
| Blister |
| Zn |
| Ag |
| Cu |
| Cathode |
| Blister |
| Zn |
| Ag |
|
Kidd Mining Division |
|
|
|
|
|
|
|
|
|
|
|
|
|
|
|
|
|
|
|
|
|
Metal in concentrate |
| 41,029 |
| — |
| — |
| 87,847 |
| 3,849 |
| 46,409 |
| — |
| — |
| 75,528 |
| 2,676 |
|
|
|
|
|
|
|
|
|
|
|
|
|
|
|
|
|
|
|
|
|
|
|
Kidd Metallurgical Division |
|
|
|
|
|
|
|
|
|
|
|
|
|
|
|
|
|
|
|
|
|
Mines |
|
|
| 41,331 |
| 42,283 |
| 79,863 |
| 2,442 |
|
|
| 51,477 |
| 51,104 |
| 62,126 |
| 2,557 |
|
Custom – Sudbury |
|
|
| 18,169 |
| 18,587 |
| — |
| 465 |
|
|
| 26,048 |
| 25,860 |
| — |
| 380 |
|
Custom – other |
|
|
| 56,078 |
| 57,370 |
| 41,694 |
| 969 |
|
|
| 54,839 |
| 54,441 |
| 32,593 |
| 2,520 |
|
Total |
|
|
| 115,578 |
| 118,240 |
| 121,557 |
| 3,876 |
|
|
| 132,364 |
| 131,405 |
| 94,719 |
| 5,457 |
|
(tonnes except |
|
|
| Cu in |
|
|
| Zn in |
|
|
|
|
| Cu in |
|
|
| Zn in |
|
|
|
000 troy ounces for Ag) |
| Cu |
| conc. |
| Zn |
| conc. |
| Ag |
| Cu |
| conc. |
| Zn |
| conc. |
| Ag |
|
Sales |
|
|
|
|
|
|
|
|
|
|
|
|
|
|
|
|
|
|
|
|
|
Mines |
| 38,990 |
| — |
| 71,072 |
| 15,724 |
| 2,849 |
| 47,184 |
| — |
| 63,963 |
| 11,964 |
| 4,130 |
|
Custom – other |
| 51,296 |
| — |
| 48,463 |
| — |
| 1,027 |
| 57,978 |
| — |
| 34,665 |
| — |
| 1,193 |
|
Purchased metal |
| — |
| — |
| — |
| — |
| — |
| — |
| — |
| — |
| — |
| — |
|
Total |
| 90,286 |
| — |
| 119,535 |
| 15,724 |
| 3,876 |
| 105,162 |
| — |
| 98,628 |
| 11,964 |
| 5,323 |
|
35
Reserves: At December 31, 2004, reserves totaled 18.1 million tonnes of 1.80% copper and 6.03% zinc. Mineral reserves decreased by 2.8 million tonnes resulting from production of 2.1 million tonnes and downward revisions of 678,000 tonnes, mainly the result of stope designrevisions and the temporary re-categorization of 370,000 tonnes of copper stringer ore to inferred resources until diamond drilling is completed in the lower part of the mine. At planned operating rates, the mineral reserves at Kidd Mining division are equal to approximately seven years of production (averaging 2.4 million tonnes per year), not including the inferred resources which, if converted to reserves, could provide up to an additional six years of operations.
During the year ended December 31, 2004, corporate costs were $65 million, compared to $61 million for 2003. The increase in costs is primarily attributable to losses of $2 million on metals trading in 2004, compared to gains of $11 million in 2003, and $3 million in higher corporate general and administrative expenses, partly as a result of the stronger Canadian dollar.
These costs were offset by $3 million in lower spending on exploration due to the increased sharing of exploration costs with joint-venture partners, offset in part by the impact of the stronger Canadian dollar. In addition, $5 million of net interest income on interest rate swaps not eligible for hedge accounting and $2 million in gains on energy positions not eligible for hedge accounting were recognized in 2004.
Advanced Projects – Mineral Resources(1)
The table below sets forth mineral resource estimates and certain other data with respect to Falconbridge’s advanced development
projects:
December 31, 2004
|
| Resource |
| Percentage |
|
|
| Million |
|
|
|
|
|
|
|
|
|
Project |
| location |
| ownership |
| Category |
| tonnes |
| % Nickel |
| % Copper |
| % Cobalt |
| % Zinc |
|
Nickel deposits |
|
|
|
|
|
|
|
|
|
|
|
|
|
|
|
|
|
Nickel Rim South(2) |
| Sudbury |
| 100 | % | Inferred |
| 13.4 |
| 1.8 |
| 3.3 |
| 0.04 |
| — |
|
Fraser Morgan(2) |
| Sudbury |
| 100 | % | Measured |
| 3.3 |
| 1.85 |
| 0.61 |
| 0.06 |
| — |
|
|
|
|
|
|
| Indicated |
| 1.6 |
| 1.69 |
| 0.46 |
| 0.06 |
| — |
|
|
|
|
|
|
| Total |
| 4.9 |
| 1.80 |
| 0.56 |
| 0.06 |
| — |
|
|
|
|
|
|
| Inferred |
| 2.1 |
| 1.8 |
| 0.5 |
| 0.1 |
| — |
|
Onaping Depth(2) |
| Sudbury |
| 100 | % | Indicated |
| 14.6 |
| 2.52 |
| 1.15 |
| 0.06 |
| — |
|
|
|
|
|
|
| Inferred |
| 1.2 |
| 3.6 |
| 1.2 |
| 0.07 |
| — |
|
Koniambo(3) |
| New Caledonia |
| 49 | % | Measured |
| 32.4 |
| 2.21 |
| — |
| — |
| — |
|
|
|
|
|
|
| Indicated |
| 109.7 |
| 2.10 |
| — |
| — |
| — |
|
|
|
|
|
|
| Total |
| 142.1 |
| 2.13 |
| — |
| — |
| — |
|
|
|
|
|
|
| Inferred |
| 156.0 |
| 2.2 |
| — |
| — |
| — |
|
Copper deposits |
|
|
|
|
|
|
|
|
|
|
|
|
|
|
|
|
|
Mine D(4) |
| Timmins |
| 100 | % | Inferred |
| 15.3 |
| — |
| 3.0 |
| — |
| 4.6 |
|
Fortuna de Cobre(5) |
| Chile |
| 100 | % | Measured |
| 125.2 |
| — |
| 0.31 |
| — |
| — |
|
|
|
|
|
|
| Indicated |
| 345.1 |
| — |
| 0.28 |
| — |
| — |
|
|
|
|
|
|
| Total |
| 470.3 |
| — |
| 0.29 |
| — |
| — |
|
|
|
|
|
|
| Inferred |
| 150.0 |
| — |
| 0.2 |
| — |
| — |
|
Notes:
1. The mineral resource estimates were prepared in accordance with the CIM Definition Standards on Mineral Resources and Mineral Reserves, adopted by CIM Council on November 14, 2004, and the CIM Estimation of Mineral Resources and Mineral Reserves Best Practice Guidelines, adopted by CIM Council on November 23, 2003, using geostatistical and/or classical methods, plus economic and mining parameters appropriate to each project.
The mineral resources have been compiled under the supervision of Chester Moore, Director, Mineral Reserve Estimation and Reporting, a member of the Professional Geoscientists of Ontario with over 30 years experience as a geologist.
The mineral resources have reasonable prospects for economic extraction but have not yet had complete format evaluation, or do not have demonstrated economic viability under current conditions.
2. Also included as part of the Sudbury mineral resources on the Mineral Reserves and Mineral Resources table.
3. Option to earn. At a 2.0% nickel cut-off grade, the deposit contains Measured plus Indicated mineral resources of 75.6 million tonnes grading 2.47% nickel.
4. Also included as part of the Kidd Creek mineral resources on the Mineral Reserves and Mineral Resources table.
5. Option to purchase.
36
Growth Opportunities
Over the last decade, Falconbridge has assembled a significant portfolio of growth projects. Some are closer to its operations and easier to execute (e.g. brownfield projects); others are new projects unrelated to existing operations (e.g. greenfield projects).
Projects in Development
Kidd Mine D, Timmins, Canada – (See page 35).
Collahuasi Molybdenum Plant, Chile – (See page 33).
Brownfield projects
NICKEL
Nickel Rim South, Sudbury, Canada – This is a high-grade deposit, which was discovered in 2001, and is located close to existing operations. The updated inferred mineral resource estimate as of December 31, 2004, is 13.4 million tonnes of 1.8% nickel, 3.3% copper and significant palladium and platinum.
In the first quarter of 2004, a five-year, $368 million underground definition program was approved, and site work is now in progress in preparation for shaft sinking, which began in the first quarter of 2005. This project has progressed on schedule and within budget. Once completed, a further $185 million will be required to bring the mine into production. After taking into account pre-production revenues of $141 million, the overall net capital cost is estimated at $412 million. Full production at Nickel Rim South is expected in late 2009 or early 2010.
Fraser Morgan, Sudbury, Canada – This deposit was discovered in 2001 and is accessible from existing Fraser Mine infrastructure. Exploration results were encouraging in 2004, with diamond drilling at the Fraser Mine resulting in measured resources of 3.3 million tonnes of 1.85% nickel and 0.61% copper, indicated mineral resources of 1.6 million tonnes of 1.69% nickel and 0.46% copper and inferred mineral resources of 2.1 million tonnes of 1.8% nickel and 0.5% copper. Diamond drilling continues in 2005.
Onaping Depth, Sudbury, Canada – Onaping Depth is a high-grade resource in Sudbury with 14.6 million tonnes of indicated high-grade resources at 2.52% nickel and 1.15% copper and inferred resources of 1.2 million tonnes at 3.6% nickel and 1.2% copper. This orebody, located below the Craig Mine, is accessible using Craig Mine infrastructure by deepening the existing shaft. In 2004, Falconbridge continued research on enabling technologies to mine safely at greater depths, and continues to make substantial progress.
Raglan, Nunavik, Quebec – The Company is evaluating the possibility of increasing annual production by 20% to 1.2 million tonnes of ore per year. A scoping study for this project is in progress. A focused exploration program continues on the Company’s large property holdings in the area of the Raglan mine.
COPPER
Collahuasi, Chile – Currently the fourth-largest copper mine in the world, Collahuasi has sufficient reserves and resources for further expansion. A Phase II expansion was completed in 2004, and a Phase III expansion would increase copper production by approximately 175,000 tonnes, of which Falconbridge’s share would be 77,000 tonnes. This expansion would involve adding another grinding line and accelerating the production rate at the Rosario pit. A scoping study has been initiated to assess this growth opportunity, with start-up expected in 2007 at the earliest.
Lomas Bayas, Chile – The acquisition of an adjacent deposit, called Fortuna de Cobre, is being considered. If developed, total annual production would increase by 50% to 90,000 tonnes and extend mine life by five years. A decision on the option to buy the deposit must be made by mid-2006.
Greenfield projects
Kabanga, Tanzania – In early February 2004, Falconbridge and Barrick Gold Company reached a preliminary agreement under which Barrick would grant Falconbridge an option to acquire 50% of its interest in the Kabanga and Kagera nickel properties in Tanzania. Discussions on finalized terms are ongoing. Kabanga, located in western Tanzania about 1,500 kilometres from Dar Es Salaam,
37
has a high-grade mineral resource of more than 26 million tonnes at 2.6% nickel. Depending on the additional resources found during the exploration program, a mine could produce between 30,000 and 35,000 tonnes of nickel in concentrate annually.
Koniambo, New Caledonia – Work continued throughout the year on the Koniambo ferronickel project in the Northern Province of New Caledonia, near the provincial capital of Koné. At a 1.5% nickel cut-off grade, the deposit contains measured plus indicated resources totaling 142.1 million tonnes at 2.13% nickel. Together with additional inferred resources of 156.0 million tonnes at 2.2% nickel, Koniambo is one of the world’s largest and highest grade nickel laterite deposits. At a 2.0% nickel cut-off grade, the deposit contains measured plus indicated resources of 75.6 million tonnes at 2.47% nickel. In addition, the project has an inferred limonite resource estimated at 100 million tonnes at 1.6% nickel and 0.2% cobalt that could be developed at a later date.
In 1998, Falconbridge entered into a joint-venture agreement with Société Minière du Sud Pacifique S.A. (SMSP) and its controlling shareholder, Société de Financement et d’Investissement de la Province Nord, for the evaluation and development of the 60,000 tonne-per-year nickel in ferronickel mining and smelting complex. By signing its joint-venture agreement with SMSP, Falconbridge became SMSP’s approved industrial partner under the Bercy Accord, with titles to the Koniambo orebody held in escrow until the conditions of the Bercy Accord are met. Upon satisfaction of the conditions in the Bercy Accord, SMSP and Falconbridge are to receive a 51% and 49% interest, respectively, in the project. The two conditions precedent are: 1) the completion of a positive technical study, and 2) firm orders of $100 million related to the project. These conditions must be met before the expiry of the Bercy Accord on January 1, 2006.
The Bankable Feasibility Study (BFS) on the Koniambo ferronickel project in New Caledonia has now been completed.
The BFS has increased the level of project definition, with engineering increasing from approximately 10% to 25%. Substantial analysis has been completed on many aspects of the project and included extensive third-party reviews. The project scope has remained essentially unchanged, with the work performed in the pre-feasibility study validated through the completion of the BFS. The costs of the inputs have increased as a result of changes in foreign currency exchange rates, and increased service and raw materials costs. As a result, the estimated capital cost of the project has increased to $2.2 billion. Working capital, cost escalation from 2004 to start-up, financing and arrangement fees and interest costs, for a total of approximately $500 million of other costs, are not included in the $2.2 billion. This cost estimate compares with a pre-feasibility estimate of $1.6 billion (in 2002 dollars). Estimated operating costs have increased to $1.65/lb., from $1.27/lb.
KEY ASSUMPTIONS FOR MINERAL RESOURCE AND RESERVE ESTIMATION
Refer to Summary of Mineral Reserves and Mineral Resources on page 22 and Advanced Projects on page 36.
Bulk density: The factor used to convert volume into tonnage. This factor is a function of the mineralogy and physical characteristics of a deposit. Formulae are developed using regression analyses on a suitably large number of individual determinations.
Cut-off grade: The grade that ensures the revenue from the metal content of the lowest grade parcel included in a deposit will be at least equal to the anticipated prime operating costs of producing this revenue. These costs include mining, milling, smelting, refining, selling and all transportation and administration costs. The cut-off grade will vary greatly from property to property due to a range of factors, including deposit size and shape, metal content and prime cost structure.
Exchange rate (US$ to Cdn$): 1.50
Long-term metal prices (US$ per pound): Nickel $3.25, Copper $0.90, Zinc $0.50
Minimum mining width: The smallest horizontal thickness used in an estimation based on the selected mining method and the minimum opening size required by mining equipment used. The grade across this minimum width must equal or exceed the cut-off grade.
Mining dilution*: All external material with grades lower than the cut-off grade that must be removed with the ore. The amount of this diluting material can vary considerably and depends upon mining method and the location, attitude, size, shape and wall rocks of the ore zone.
Mining recovery*: The proportion of the ore that is extracted after accounting for mining losses. The mining recovery can vary widely both within a single mine and from property to property, due to a range of factors, including deposit geometry and mining method.
*Used for mineral reserve estimation only.
38
The capital cost of $2.2 billion includes the construction of a $600 million power station with an installed generating capacity of 390 MW. The remaining $1.6 billion relates to the metallurgical plant, mine development, and other infrastructure such as the port and road facilities.
With the bankable feasibility study completed, the Company, with its partner SMSP and the French government, is focused on finalizing the financing structure for this project. The implementation approach to this project continues to be assessed, with earliest possible start-up in 2009.
If developed, Koniambo would be one of the largest nickel producers in the world with initial production of 60,000 tonnes per year. In addition, future expansion could take advantage of the large resource base, which has an estimated life in excess of 50 years.
The objectives of the exploration team are aligned with those of the nickel and copper business units and are consistent with the corporate strategy of focusing primarily on copper and nickel growth opportunities worldwide. The philosophy adopted of consistently being a fair and honest partner by exhibiting strong technical skills and a solid track record with a “win-win” philosophy is consistent with the aim of being the most valued and sought-after partner in the mining and metals business. Joint-venture arrangements are pursued with both junior and senior mining companies to increase the level of focused exploration activity, thereby sharing cost and risk and improving the likelihood of success. The exploration team has the backing of an experienced mergers and acquisitions team and a capable project engineering team with a track record of building mines around the world.
As a Founding Patron of the Association of Professional Geoscientists of Ontario and a Founding Partner of the Prospector and Developers Association’s Environmental Excellence in Exploration initiative, the team of geoscientists is committed to being fully compliant with National Instrument 43-101 requirements and in consistently conducting safe and environmentally responsible exploration worldwide.
The forecast exploration expenditure for 2005 is $26 million including capitalized expenditures, compared to $25 million invested in 2004. Exploration activity is primarily focused on Canada, Brazil, Norway, Australia, and Africa.
At Sudbury, the Nickel Rim South discovery has an estimated inferred mineral resource of 13.4 million tonnes of 1.8% nickel, 3.3% copper, 0.04% cobalt, 1.8 grams/tonne platinum, 2.0 grams/tonne palladium and 0.8 grams/tonne gold. Drilling on the Fraser Morgan zones in an area east of Fraser Mine has increased the mineral resources to 4.9 million tonnes of indicated resources at 1.80% nickel, 0.56% copper and 0.06% cobalt, plus inferred resources totaling 2.1 million tonnes of 1.8% nickel, 0.5% copper and 0.1% cobalt. This increased total includes 1.1 million tonnes of inferred resources at 2.1% nickel and 0.7% copper in the new Zone 11 discovery located 600 metres to the east of Zone 9.
At Raglan, 1.9 million tonnes of mineral resources have been discovered as a result of the 2004 exploration program. This gain was offset by 2004 mine production and a mineral reserve write-down associated with the re-estimation of historical polygonal mineral reserves at Donaldson and East Lake.
In the Espedalen area, 180 kilometres north-northwest of Oslo, Norway, diamond drilling has resulted in the greenfields discovery of significant new nickel sulphide mineralization referred to as the Stormyra discovery. Diamond drill hole ES2004-08 intersected 2.7 metres of 2.07% nickel and 1.20% copper at a depth of 56 metres. It is located approximately 200 metres along strike from drill hole ES2004-09 which intersected 14.6 metres of 1.73% nickel and 0.77% copper at a depth of 93 metres. Diamond drilling will resume during the first quarter of 2005. This is a jointventure with Blackstone Ventures Inc.
At Collahuasi in Chile, diamond drilling of geophysical anomalies in the La Grande area, immediately southwest and south of the Rosario pit, has been encouraging. The immediate objectives of the ongoing exploration program are to better define La Grande mineralization to determine the economic potential of the zone and modifications, if any, to the mine plan. Assays have been received from two holes:
39
Hole |
| From |
| To |
| Metres |
| % Cu |
|
GC221 and including GC226 |
| 130 |
| 180 |
| 50 |
| 0.98 |
|
|
| 234 |
| 631 |
| 397 |
| 0.85 |
|
|
| 282 |
| 458 |
| 175 |
| 1.15 |
|
|
| 405 |
| 487 |
| 82 |
| 1.43 |
|
In 2004, energy costs represented approximately 28% of the cash cost breakdown for all of Falconbridge’s operations. Significant quantities of electricity, natural gas, and petroleum products are procured from commodities markets and regulated energy providers in the U.S., Canada, Norway, the Gulf of Mexico and Chile.
The Company’s profitability is sensitive to energy prices. A corporate risk management committee stewards the procurement of energy from commodities markets in order to minimize price volatility and supply risk. Of particular concern in the mid term, are the sustained increases of average world oil prices, North American and European electricity prices, and North American natural gas prices.
A formal strategy focused on building the capacity to manage energy use throughout Falconbridge’s operations is being implemented on a site-by-site basis. Within the implementation phase, employees are engaged at all levels through involvement in awareness workshops, and energy indicators are being developed to support the ability of operations to control energy consumption.
In addition to the company-wide energy intensity improvement target of 1% per year, each facility establishes an annual energy cost reduction target. Six Sigma methodology and energy efficiency engineering practices are used to take actions to more effectively use energy and reduce energy costs. Examples of success include the improved efficiency of the power plant at operations in the Dominican Republic, the sale of recovered waste heat to the local community from the Norwegian refinery, and the reduction of energy used for ventilation at Sudbury mines.
Falconbridge is a strong proponent of sustainable development where economic prosperity, environmental quality and social equity drive business activities. This commitment is reflected in the Company’s Sustainable Development Policy.
Providing a safe and healthy workplace is a priority at Falconbridge. Operations continue to implement effective safety training programs and management systems. Safety performance is strongly supported by senior management and the Board of Directors. Under the 2004 Safety, Health and Leadership program, four Falconbridge operations were visited by senior management to assess, promote and reinforce the importance of a safe workplace. These initiatives, among others, have resulted in enhanced safety performance in 2004 as the lost-time injury frequency (a measure of the number of compensable injuries per 200,000 hours worked) declined to 1.12 versus 1.26 in 2003.
For more details on our progress towards sustainable development, please refer to the 2004 Noranda Inc./Falconbridge Limited Sustainable Development Report, which is available on the Company’s website.
($ MILLIONS, EXCEPT PER SHARE DATA)
Years ended December 31 |
| 2004 |
| 2003 |
| 2002 |
|
Total revenues |
| 3,070 |
| 2,083 |
| 1,525 |
|
Income |
| 672 |
| 191 |
| 52 |
|
Basic net income per share (US$) |
| 3.71 |
| 1.03 |
| 0.25 |
|
Diluted net income per share (US$) |
| 3.69 |
| 1.02 |
| 0.24 |
|
Total assets |
| 5,118 |
| 4,172 |
| 3,453 |
|
Long-term debt |
| 1,437 |
| 1,427 |
| 1,280 |
|
Cash dividends declared – Common Shares (Cdn$) |
| 0.40 |
| 0.40 |
| 0.40 |
|
– Common Shares (US$ equivalent) |
| 0.31 |
| 0.29 |
| 0.25 |
|
– Preferred Share Series 1 (Cdn$) |
| 0.08 |
| 0.08 |
| 0.08 |
|
– Preferred Share Series 2 (Cdn$) |
| 0.7397 |
| 1.4688 |
| 1.4688 |
|
– Preferred Share Series 3 (Cdn$) |
| 0.8589 |
| — |
| — |
|
40
Earnings were $672 million for the year ended December 31, 2004 compared to earnings of $191 million for 2003. The increase of $481 million is attributable to the following:
• Higher realized prices for nickel, copper, zinc, cobalt, platinum, silver and sulphuric acid.
• Higher sales volumes for copper, cobalt, precious metals and zinc, offset by lower sales volumes for nickel and silver.
• Lower interest expense resulting from increased interest income due to higher cash balances and higher capitalized interest related to projects.
The above favourable items were offset by the following:
• Higher mining costs and higher acquisition costs for custom feed.
• The impact of a stronger Canadian dollar, relative to the U.S. dollar, on Canadian mining and administrative costs.
• Higher income and mining taxes attributable to higher income in 2004 relative to 2003.
|
| December 31, |
| September 30, |
| June 30, |
| March 31, |
| ||||||||
(UNAUDITED – $ MILLIONS, EXCEPT PER SHARE DATA) |
| 2004 |
| 2003 |
| 2004 |
| 2003 |
| 2004 |
| 2003 |
| 2004 |
| 2003 |
|
Total revenues |
| 876 |
| 636 |
| 756 |
| 485 |
| 704 |
| 490 |
| 734 |
| 472 |
|
Earnings |
| 194 |
| 95 |
| 155 |
| 19 |
| 139 |
| 39 |
| 184 |
| 38 |
|
Basic net income per share (US$) |
| 1.07 |
| 0.52 |
| 0.85 |
| 0.10 |
| 0.77 |
| 0.21 |
| 1.02 |
| 0.20 |
|
Diluted net income per share (US$) |
| 1.07 |
| 0.51 |
| 0.85 |
| 0.10 |
| 0.76 |
| 0.21 |
| 1.01 |
| 0.20 |
|
The financial results for the last eight quarters reflect rising realized prices for nickel, copper, zinc, cobalt, platinum, silver and acid, higher sales volumes for copper, cobalt, zinc, precious metals and acid, offset by lower sales volumes for nickel and silver and rising cash costs. These trends are discussed elsewhere in this report.
LIQUIDITY AND CAPITAL RESOURCES
The Company’s cash position and changes in cash for the year ended December 31, 2004 compared to the year ended December 31, 2003 are summarized below:
($ MILLIONS) |
|
|
|
|
| ||
Years ended December 31 |
| 2004 |
| 2003 |
| ||
Cash provided by operating activities |
| $ | 968 |
| $ | 444 |
|
Cash used in investing activities |
| (573 | ) | (388 | ) | ||
Cash (used in) provided by financing activities |
| (48 | ) | 77 |
| ||
Cash provided during the year |
| 347 |
| 133 |
| ||
Cash and cash equivalents, beginning of the year |
| 298 |
| 165 |
| ||
Cash and cash equivalents, end of the year |
| $ | 645 |
| $ | 298 |
|
Liquidity and Cash Flow
Consolidated cash and cash equivalents increased by $347 million to $645 million at December 31, 2004. These items were invested primarily in high-quality short-term money market instruments and liquidity funds.
During 2004, the Company’s balance sheet improved as the ratio of net debt to net debt plus equity improved to 24% from 37% at the end of 2003.
Falconbridge has significant liquidity and financial flexibility, including unused bank lines of credit totaling $457 million. As a result, the Company has unused credit and cash available in excess of $1 billion. The Company has a $200 million debenture maturing on September 1, 2005.
Working capital increased to $933 million at the end of December 2004 from $649 million at the end of December 2003.
Cash generated from operations before working capital changes totaled $1,067 million at December 31, 2004, compared with $445 million at year-end 2003.
The ratio of current assets to current liabilities was 2.5:1 at December 31, 2004.
Based on planned production levels, estimated LME prices and forecasted Canadian/U.S. dollar exchange rates, it is anticipated that funds provided from operations, available cash, and proceeds from existing lines of credit will be sufficient to finance committed obligations, planned capital expenditures in 2005 and the dividends declared to date.
41
SIGNIFICANT FUTURE OBLIGATIONS
The following table sets out Falconbridge’s significant contractual obligations, as of December 31, 2004, for the period indicated:
($ MILLIONS) |
| Significant future obligations by year |
| ||||||||||||
Nature of obligation |
| 2005 |
| 2006 |
| 2007 |
| 2008 |
| 2009 |
| Thereafter |
| Total |
|
Long-term debt |
| 248 |
| 305 |
| 55 |
| 208 |
| 40 |
| 581 |
| 1,437 |
|
Asset retirement obligation |
| 11 |
| 6 |
| 5 |
| 7 |
| 7 |
| 434 |
| 470 |
|
Operating leases |
| 2 |
| 2 |
| 2 |
| 2 |
| 2 |
| 16 |
| 26 |
|
Total contractual obligations |
| 261 |
| 313 |
| 62 |
| 217 |
| 49 |
| 1,031 |
| 1,933 |
|
Outstanding Indebtedness
Total debt at December 31, 2004 was $1,437 million, compared to $1,427 million at the end of 2003. The $10 million increase was the result of a foreign exchange loss on Canadian dollar denominated debt, due to the strengthening of the Canadian currency. The current portion of long-term debt is $248 million.
The ratio of net debt (debt minus cash and temporary investments) to net debt plus equity improved to 24% at the end of 2004 from 37% at the end of 2003.
Capital Resources and Financial Flexibility
The Company believes that both a conservative financial structure and financial flexibility are important in order to accommodate the capital intensive and cyclical nature of the business.
The Company has three-year committed revolving Credit Facilities with various banks totaling $475 million at December 31, 2004. Borrowings may be in many forms including Letters of Credit, which offset amounts available under certain Credit Facilities. As at December 31, 2004 the Company had no borrowings and had drawn Letters of Credit totaling $18 million. The Company also has additional Letters of Credit outstanding of $17 million.
The Company has a Commercial Paper Program. Unused lines of credit and cash on hand are used to support the Commercial Paper Program. As at December 31, 2004 the Company had no Commercial Paper outstanding.
Capital Expenditures and Deferred Project Costs
Expenditures in 2004 were directed towards development of Mine D at the Kidd Mining division, the Montcalm and Nickel Rim South projects at the INO division, evaluation work at Koniambo and to maintain and improve productive capacity at all locations.
Expenditures for 2005 will primarily be used for the continued development of Mine D at Kidd, the development of the Nickel Rim South and Fraser Morgan projects, the Raglan Optimization project, continued evaluation work at Koniambo and to maintain and improve production capacity at all locations. Expenditures will be financed from internal sources and existing lines of credit. Expenditures for Canadian projects have been adversely impacted by the strengthening Canadian dollar.
The following table summarizes the expenditures incurred or planned for the periods indicated:
($ MILLIONS) |
| 2005F |
| 2004 |
| 2003 |
|
Investment projects |
|
|
|
|
|
|
|
Nickel |
|
|
|
|
|
|
|
Montcalm |
| 3 |
| 59 |
| 5 |
|
Koniambo |
| 100 |
| 57 |
| 34 |
|
Nickel Rim South |
| 61 |
| 96 |
| 5 |
|
Fraser Morgan |
| 30 |
| — |
| — |
|
Raglan |
| 21 |
| — |
| — |
|
|
|
|
|
|
|
|
|
Copper |
|
|
|
|
|
|
|
Kidd |
| 86 |
| 127 |
| 85 |
|
Collahuasi |
| 18 |
| 65 |
| 151 |
|
|
|
|
|
|
|
|
|
Maintenance and other |
| 181 |
| 169 |
| 90 |
|
|
| 500 |
| 573 |
| 370 |
|
42
OFF-BALANCE SHEET ARRANGEMENTS
The Company does not have any unconsolidated affiliates. There are no off-balance sheet arrangements with special purpose entities in the normal course of business. The only significant off-balance sheet arrangements consist of Canadian dollar expenditure hedges discussed under the heading Financial Instruments and Other Instruments (page 48).
TRANSACTIONS WITH RELATED PARTIES
At December 31, 2004 Noranda Inc. (Noranda) owned, directly and indirectly, approximately 58.8% of Falconbridge’s common shares. During 2002, a process was initiated to integrate certain operations of Noranda and Falconbridge with the objective of reducing costs and further extracting value from the respective assets. The initiatives undertaken have included the combination of various corporate support services and greater coordination between operations. Arrangements between Falconbridge and the Noranda Group of Companies are negotiated in the best interest of both parties, on an arm’s length basis at market terms.
Falconbridge has entered into an agreement with a subsidiary of Noranda, whereby it acts as a sales agent for all products, other than sulphuric acid and indium, produced at Falconbridge’s Kidd Creek operations. Falconbridge has entered into a supply agreement with another subsidiary of Noranda, which will purchase and resell Falconbridge’s output of sulphuric acid. Accounts and metals settlements receivable, in the Consolidated Statements of Financial Position, include $43 million (2003 – $30 million) in receivables from Noranda relating to amounts being collected under the sales agreements and $nil (2003 – $13 million) from net purchases of material by Noranda.
Falconbridge has agreements with various Noranda Group of Companies for the purchase of custom feeds; the toll treatment of copper concentrates, blister copper and refinery slimes; and the sale of metals. The following table details related party production and marketing transactions with Noranda Group of Companies:
($ MILLIONS) |
|
|
|
|
|
Years ended December 31 |
| 2004 |
| 2003 |
|
Sale of materials and technology to Noranda(a) |
| 121 |
| 98 |
|
Purchase of materials from and smelting and refining fees paid to Noranda(b) |
| 140 |
| 159 |
|
Commissions and agency fees paid to Noranda(c) |
| 1 |
| 1 |
|
Net fees received relating to sulphuric acid from Noranda(a) |
| 7 |
| 2 |
|
Included in Falconbridge’s Consolidated Statements of Earnings in (a) Revenues; (b) Cost of metal and other product sales; (c) Selling, general and administrative.
During the third quarter of 2004, Noranda, 58.8% owner of Falconbridge, announced that it had entered into exclusive negotiations with China Minmetals Corporation concerning a proposal from Minmetals to acquire 100% of the outstanding common shares of Noranda. Falconbridge understands that Noranda’s exclusive negotiations with China Minmetals ended in December 2004 and continue on a non-exclusive basis.
There are no other significant proposed transactions that have not been discussed elsewhere in this document.
FOURTH QUARTER RESULTS OVERVIEW
Earnings of $194 million ($1.07 per common share on a basic and diluted basis) were reported for the fourth quarter of 2004, compared to $95 million ($0.52 and $0.51 on a basic and diluted basis, respectively) for the fourth quarter of 2003. Increased copper sales volumes of 21% over the fourth quarter of 2003 combined with the continued strong pricing environment led to this significant year-over-year increase.
Fourth quarter operating income totaled $277 million, compared with operating income of $157 million for the same period of 2003. Consolidated revenues of $876 million increased from $636 million in the fourth quarter of 2003. Both increases reflect higher average realized nickel, copper and zinc prices, which were up 16%, 50% and 13%, respectively, assisted by higher copper sales volumes, offset by the impact of a higher U.S./Canadian exchange rate on Canadian operating
43
costs. Corporate costs of $11 million compared to $14 million in the same period last year. During the quarter, cash flow from operations before working capital improved to $308 million, compared to $164 million for the corresponding period of 2003.
Metal prices were volatile in the fourth quarter and the Company believes that the volatility will continue throughout 2005; however, market fundamentals remain strong. Many of the same economic factors that are contributing to the current metal price environment are also contributing to increased input costs for Falconbridge’s operations and projects. Increases for energy and contractor labour, combined with the negative impact of foreign exchange on those costs, detract from the pricing gains.
Management is required to make estimates in preparing its financial statements in conformity with Canadian GAAP. These estimates affect the reported amounts of assets and liabilities and the disclosure of contingent assets and liabilities at the date of the financial statements and the reported amounts of revenues and expenses during the reporting period. Changes to these estimates would result in material changes to these line items. The critical accounting estimates made by Falconbridge relate to its accounting for the following items:
• Property, plant and equipment
– The determination of mineral reserves
– Impairment assessments of long-lived assets
– Depreciation and amortization of property, plant and equipment
• Employee future benefits
• Asset retirement obligations
• Income and mining taxes
Property, Plant and Equipment
As of December 31, 2004, property, plant and equipment, with a carrying value of $3 billion, represented 62% of Falconbridge’s asset base. As such, the estimates used in accounting for property, plant and equipment and the related depreciation and amortization charges are critical and have a material impact on its financial condition and earnings. Property, plant and equipment and related capitalized interest and development and pre-production expenditures are recorded at cost and in addition, include the fair value amount related to asset retirement obligations. Property, plant and equipment are subject to impairment testing as discussed below.
Determination of Mineral Reserves
One of the most significant estimates which impacts the accounting for property, plant and equipment and the related depreciation and amortization, is the estimate of proven and probable ore reserves. The process of estimating reserves is complex; requiring significant assumptions, estimates and decisions regarding economic (i.e. metal prices, production costs, and exchange rates), engineering, geophysical and geological data. A material revision to existing reserve estimates could occur because of changes to any of these inputs. Changes in reserves could result in impairment of the carrying amount of property, plant and equipment (see below) and a change in amortization expense (see below).
Impairment Assessments of Long-lived Assets
A review and evaluation of long-lived assets for impairment is undertaken when events or changes in circumstances indicate that the carrying amount may not be recoverable. There were no impairment losses on long-lived assets incurred in 2003 and 2004. Asset impairment is considered to exist if the total estimated future cash flows on an undiscounted basis are less than the carrying amount of the asset. An impairment loss is measured and recorded based on recoverable minerals, expected commodity prices (considering current and historical prices, price trends and related factors), production levels, availability of custom feed, capital and reclamation costs, all based on detailed life-of-mine plans. The term “recoverable minerals” refers to the estimated amount of metal that will be obtained from proven and probable ore/mineral reserves, as well as value attributed to measured and indicated mineral resources, after taking into account losses during ore processing and treatment. Significant management judgment is involved in estimating these factors, which include inherent risks and uncertainties. The assumptions used are consistent with internal planning. Management periodically evaluates and updates the estimates
44
based on the conditions that influence these factors. The variability of these factors depends on a number of conditions, including uncertainty about future events, and thus accounting estimates may change from period to period. If other assumptions and estimates had been used in the current period, the asset balances could have been materially impacted. If management uses different assumptions or if different conditions occur in future periods, future operating results could be materially impacted.
In estimating future cash flows, assets are grouped at the lowest levels for which there are identifiable cash flows that are largely independent of future cash flows from other asset groups, taking into consideration movements of intermediate products to ensure the utilization of available capacity across operations. All assets at a particular operation are considered together for purposes of estimating future cash flows.
Depreciation and Amortization of Property, Plant and Equipment
The Company generally depreciates plant and equipment on a straight-line basis over the lesser of their useful service lives or the lives of the producing mines to which they relate. At the Kidd Creek operations, mine facilities are amortized over the estimated lives of the mines based on the unit of production basis. Amortization of resource properties is provided over the estimated lives of the resources recoverable from the properties on the unit of production basis. Development and pre-production expenditures, together with certain subsequent capitalized development expenditures, are amortized over periods not exceeding the lives of the producing mines and properties.
The most critical estimate which impacts the above accounting policy is the estimated quantity of proven and probable mineral reserves, which is the underlying basis for the calculation of the amortization of resource properties using the unit of production method. Changes in the quantity of reserves would result in changes in amortization expense in the periods subsequent to the revision.
Employee Future Benefits
Pension fund assets are valued at fair market value. The expected return on plan assets, currently 7%, is based on current bond yields and expected long-term rate of return on equities. The long-term rate of return on assets assumption is reviewed on an annual basis.
Plan obligations are determined as a present value of future anticipated cash flows using a discount rate that reflects the market yields, as of the measurement date, on high quality debt instruments with cash flows that match expected benefit payments. Differences between the estimated future results and actual future results are amortized (to the extent that the cumulative experience gain or loss is in excess of the permitted 10% corridor under Canadian GAAP) over the expected average remaining service life (EARSL) of the active members. This 10% corridor represents 10% of the greater of the post-retirement benefit obligations and the fair value of plan assets. The discount rate, salary and inflation assumptions used to value the plan obligations are reviewed annually and are determined based on a consistent framework from year to year. The most significant risk is that the assumption will prove to be either too high or too low in the long term. It is reasonable to assume that there will be a significant variation between the assumptions (which are set within the framework of a long-term commitment) and actual experience in any one year, but are expected to produce an appropriate reflection of costs over the long term.
For post-employment benefits other than pensions, the discount rate is the same as for pensions. The inflation rate assumed for medical costs is based on the Company’s history of health care spending. The assumption for the ultimate health care trend rates relates to the overall economic trends.
Falconbridge currently estimates that a 0.5% increase or decrease in the return on assets assumption would result in a corresponding $4 million decrease or increase in annual pension expense. Changes to the return on asset assumption would have no significant effect on funding requirements, as contributions are primarily determined based on the applicable Canadian regulatory solvency funding requirements. Under this valuation methodology, liabilities for solvency valuation are based on market bond yields and the excess of liabilities over assets must be amortized over a five-year period. Falconbridge estimates that a 0.5% increase or decrease in the discount rate assumption would result in a corresponding $3 million decrease or increase in the pension expense.
45
Asset Retirement Obligations (ARO)
As a result of mining activities, Falconbridge incurs legal obligations associated with the retirement of tangible long-lived assets, from the acquisition, construction, development or normal operations of those assets, which an entity is required to settle as a result of an existing or enacted law or contract. CICA 3110 ARO, which was adopted January 1, 2004, requires that, when a legal obligation is incurred, Falconbridge records as a liability the fair value of its estimated asset retirement obligations and a corresponding increase to the carrying amount of the related asset. The liability is accreted to full value over time through a charge to earnings. The asset is depreciated over the useful life of the associated asset. The fair value of the obligation as of December 31, 2004 was $149 million. Period-to-period adjustments due to circumstances or changes in estimates are recorded as determined.
The fair value of these obligations is determined by discounting the projected cash flows required to settle the legal obligations at a credit adjusted risk free interest rate over the time periods over which the obligations were incurred. The future cash flows required to settle the obligations were determined by detailed engineering and environmental reviews assuming the most probable outcome based on present facts, circumstances and legislation.
Critical estimates and judgments were made by management in the determination of the fair value of the obligation. Cash outflows to settle these obligations will be incurred during periods ranging from 1 to 62 years. Due to the combined effect of the uncertainty associated with such extended time periods, the estimated discount and inflation factors, and potential changes to applicable legislation, the fair value of the asset retirement obligations could materially change from period to period impacting the amount charged to operations. Under the accounting standard, a provision for asset retirement is not required to be recorded for assets with indeterminate lives until such time as sufficient information exists to estimate a range of settlement dates. As such, although the Company will be subject to asset retirement obligations for its refinery in Norway, its power plant at Falcondo, as well as for the metallurgical facilities at Sudbury and Kidd Creek, these assets are not included in the provision for asset retirement as sufficient information is not available at this time to estimate the timing of the settlement.
Income and Mining Taxes
The provision or relief for income taxes is calculated based on the expected tax treatment of transactions recorded in the Company’s Consolidated Financial Statements. The objectives of accounting for income and mining taxes are to recognize the amount of taxes payable or refundable for the current year and deferred tax liabilities and assets for the future tax consequences of events that have been recognized in Falconbridge’s Consolidated Financial Statements or tax returns. In determining both the current and future components of income and mining taxes, the Company interprets tax legislation in a variety of jurisdictions, as well as makes assumptions about the expected timing of the reversal of future tax assets and liabilities. The Company also makes assumptions about the repatriation of its earnings or their redeployment offshore and the related withholding taxes thereon. If the interpretations or assumptions differ from those of tax authorities or if the timing of reversals is not anticipated, the provision or relief for income and mining taxes could increase or decrease in future periods. In estimating deferred income and mining tax assets, a valuation allowance is determined to reduce the future income tax assets to the amount that is more likely than not to be realized.
CHANGES IN ACCOUNTING POLICIES INCLUDING INITIAL ADOPTION
Effective January 1, 2004, the Company adopted four new accounting standards and guidelines issued by the Canadian Institute of Chartered Accountants: Asset Retirement Obligations (CICA 3110), Hedging Relationships (AcG 13), Impairment of Long-lived Assets (CICA 3063) and Generally Accepted Accounting Principles (CICA 1100).
Asset Retirement Obligations
Under the previous policy, costs related to ongoing site restoration programs were expensed when incurred, while a provision for mine closure and site closure costs was charged to earnings over the life of the operations. Under the new standard, a long-term obligation, and corresponding increase
46
to the carrying amount of the related asset, equal to the fair value of the legal obligation for asset retirement, determined at the date of adoption, was recorded. The key assumptions on which the fair value of the asset retirement obligations is based include the estimated future cash flows, the timing of those cash flows, and the credit-adjusted risk-free rate or rates at which the estimated cash flows have been discounted. The Company uses discount rates ranging from 5.0% to 6.5%. Under the accounting standard, a provision for asset retirement is not required to be recorded for assets with indeterminate lives until such time as sufficient information exists to estimate a range of settlement dates. As such, although the Company will be subject to asset retirement obligations for its refinery in Norway, its power plant at Falcondo, as well as for the metallurgical facilities at Sudbury and Kidd Creek, these assets are not included in the provision for asset retirement, as sufficient information is not available at this time to estimate the timing of settlement. As of December 31, 2004, with respect to the Company’s other asset retirement obligations, undiscounted cash outflows approximating $470 million are expected to occur over a period ranging from 1 to 62 years. The asset is being depreciated and charged to depreciation expense over the life of the associated asset. Interest on the obligation is being accreted with a corresponding charge to operating income. This standard has been applied retroactively with restatement of prior years.
As of January 1, 2003, the cumulative impact of the adoption of the standard was to increase retained earnings by $14 million, increase property, plant and equipment by $69 million, increase accumulated depreciation by $13 million, increase the provision for asset retirement by $37 million, and increase future income taxes by $5 million. The adoption of this standard resulted in a decrease of $3 million to previously reported earnings for the year ended December 31, 2003. Consequently, the effect of this restatement on previously reported basic earnings per common share is a decrease of $0.02.
Hedging Relationships
As of January 1, 2004, the Company adopted CICA guideline AcG 13 which establishes new standards for when hedge accounting may be applied. This standard is applied prospectively without restatement of prior period results. Under the provisions of the guideline, the Company’s interest rate swaps were deemed to be in a hedging relationship, as a fair value hedge of a portion of the Company’s debt, prior to, but not as at, the date of the guideline’s implementation. As such, on January 1, 2004, the Company recorded a deferred mark-to-market gain of $27 million on its interest rate hedges, while recording a long-term receivable and a long-term payable of $67 million and $40 million, for those contracts in a gain and loss position, respectively. Under the provision of the standard, the mark-to-market gain is amortized into income, as a reduction of interest expense, over the life of the underlying hedged debt. For the year ended December 31, 2004, $7 million of this deferred gain was amortized into income as an adjustment of interest expense.
Subsequent to the implementation of the guideline, the Company has to prove hedge effectiveness in order to qualify for hedge accounting. The Company’s interest rate swaps did not qualify for hedge accounting until April 22, 2004. Upon qualification for hedge accounting, the long-term receivable and long-term payable, representing the fair value of the qualified hedges on April 22, 2004, are amortized into interest expense. For the year ended December 31, 2004, the Company recorded a mark-to-market loss of $1 million for those contracts that were not eligible for hedge accounting. For contracts that qualify for hedge accounting, the net interest received/paid on those positions is shown as a reduction from/addition to interest on the statement of earnings. For contracts that do not qualify for hedge accounting or for those which the Company does not seek hedge accounting, the net interest received/paid on those positions is not shown as a reduction from/addition to interest, on the statement of earnings, but as a component of other expenses/(income), together with the change in fair value of those contracts during the period.
For energy price hedge contracts that were not eligible for hedge accounting, Falconbridge recorded at January 1, 2004, a deferred mark-to-market gain of $3 million. $2 million of this deferred gain was amortized into income during the year ended December 31, 2004. In addition, Falconbridge recorded a $1 million mark-to-market gain on those contracts during the year ended December 31, 2004.
47
Under the provisions of the new guideline, the Company continues to be eligible for hedge accounting for forward contracts and option contracts used as a currency hedge of Canadian dollar operating costs. Falconbridge did not seek hedge accounting for forward contracts and option contracts used as an economic currency hedge of Canadian dollar denominated monetary assets and liabilities. These contracts continue to be marked to market.
Impairment Of Long-Lived Assets
CICA section 3063 establishes standards for the recognition, measurement and disclosure of the impairment of long-lived assets. This standard is effective for fiscal years commencing on or after April 1, 2003, and as such was implemented by Falconbridge effective January 1, 2004. Under the provision of the standard, a two-step process determines impairment of long-lived assets held for use. The first step determines whether impairment exists, and if so, the second step measures the amount of the impairment. Impairment exists if the carrying amount of a long-lived asset exceeds the sum of the undiscounted cash flows expected to result from its use and eventual disposition. The amount of the impairment loss is determined as the amount by which the longlived asset’s carrying value exceeds its fair value. Falconbridge has not incurred an impairment loss on any of its long-lived assets as a result of the implementation of this standard.
Generally Accepted Accounting Principles
Effective January 1, 2004, Falconbridge adopted CICA 1100 which establishes standards for financial reporting in accordance with generally accepted accounting principles. This section describes what constitutes Canadian generally accepted accounting principles and its sources. The standard provides guidance on sources to consult when selecting accounting principles and determining appropriate disclosure when a matter is not dealt with explicitly in the primary sources of generally accepted accounting principles. The effect of any change in accounting policy made on adopting this section is applied to events and transactions occurring after the date of the change and to any outstanding related balances existing at the date of the change. No cumulative catch-up adjustment is made to such balances. Implementation of this standard has had no significant impact on the Company.
FINANCIAL INSTRUMENTS AND OTHER INSTRUMENTS
Falconbridge uses financial and other instruments in the following instances.
Foreign Currency Exposure
Falconbridge uses forward foreign exchange and option contracts to hedge the effect of exchange rate changes on identifiable foreign currency exposures. Falconbridge hedges up to 50% of its one-year operating costs and up to 25% of its subsequent year’s operating costs, each on a rolling 12-month basis. Falconbridge may enter into futures and forward contracts for the purchase or sale of currencies not designated as hedges. These contracts are carried at estimated fair values and gains or losses arising from the changes in the market values of these contracts are recognized in the earnings of the period in which the changes occur. Fair value of forward contracts is calculated by comparing the contract rate to the market forward rate obtained from electronic market data sources. The fair value of options is provided by the Company’s counter-parties. A summary of these positions is tabled on page 49.
48
As at December 31 |
| 2004 |
| 2003 |
|
Expenditure hedges |
|
|
|
|
|
Forward exchange contracts |
|
|
|
|
|
Canadian dollar expenditures |
|
|
|
|
|
US$ forward contracts (millions) |
| 198 |
| 426 |
|
Average price (US$) |
| 1.3835 |
| 1.4941 |
|
Contract amount (in Cdn$ millions) |
| 274 |
| 636 |
|
Fair value (in US$ millions) |
| 30 |
| 62 |
|
With maturity dates up to: |
| December 2005 |
|
|
|
|
|
|
|
|
|
Chilean peso expenditures |
|
|
|
|
|
US$ forward contracts (millions) |
| 9 |
| 47 |
|
Average price (US$) |
| 708 |
| 726 |
|
Contract amount (in CHP millions) |
| 6,538 |
| 34,238 |
|
Fair value (in US$ millions) |
| 3 |
| 10 |
|
With maturity dates up to: |
| September 2005 |
|
|
|
|
|
|
|
|
|
Norwegian kroner expenditures |
|
|
|
|
|
US$ forward contracts (millions) |
| — |
| 33 |
|
Average price (US$) |
| — |
| 7.9841 |
|
Contract amount (in NOK millions) |
| — |
| 267 |
|
Fair value (in US$ millions) |
| — |
| 6 |
|
|
|
|
|
|
|
Option contracts |
|
|
|
|
|
Canadian dollar expenditures |
|
|
|
|
|
Option amount (in Cdn$ millions) |
| 50 |
| 30 |
|
Fair value (in US$ millions) |
| 1 |
| 1 |
|
With maturity dates up to: |
| December 2005 |
|
|
|
|
|
|
|
|
|
Norwegian kroner expenditures |
|
|
|
|
|
Option amount (in NOK millions) |
| 135 |
| 210 |
|
Fair value (in US$ millions) |
| 1 |
| 1 |
|
With maturity dates up to: |
| September 2005 |
|
|
|
Falconbridge has foreign currency denominated monetary assets and liabilities denominated in currencies other than the U.S. dollar. The Company uses foreign currency forward contracts to offset the exposure from fluctuations in foreign exchange rates. The following is a summary of foreign currency forward contracts.
As at December 31 |
| 2004 |
| 2003 |
|
Balance sheet economic hedges |
|
|
|
|
|
Canadian dollar net liability exposure |
|
|
|
|
|
US$ forward contracts (millions) |
| 429 |
| 385 |
|
Average price (US$) |
| 1.2120 |
| 1.3236 |
|
Contract amount (in Cdn$ millions) |
| 520 |
| 510 |
|
Fair value (in US$ millions) |
| 3 |
| 9 |
|
With maturity dates up to: |
| March 2005 |
|
|
|
Commodity Price Exposure
Generally, Falconbridge does not hedge the price it realizes on the sale of its own production and accepts realizations based on market prices prevailing around the time of delivery of metals to customers. Under certain circumstances, Falconbridge enters into futures and option contracts to hedge the effect of price changes on a portion of the commodities it sells. Gains and losses on these contracts are reported as a component of the related transactions. Falconbridge may enter into futures and forward contracts for the purchase or sale of commodities not designated as hedges for accounting purposes. These contracts are carried at estimated fair values and gains or losses arising from the changes in the market values of these contracts are recognized in the earnings of the period in which the changes occur.
49
Interest Rate Management
Falconbridge also enters into interest rate swap contracts, including foreign exchange cross currency swaps, to modify the interest characteristics of its outstanding debt. The differential to be paid or received, for interest rate swaps for which hedge accounting is applied, is accrued and recognized as an adjustment to interest expense related to the debt. The net interest on other swaps is reflected in the financial statements as other expenses/(income). The fair value of interest rate swaps is provided by the Company’s counter-parties. A summary of these positions is tabled below:
Interest rate swap contracts at December 31, 2004 |
| Total(1) |
|
Maturity (2005) |
| 400 |
|
Maturity (2006) |
| 325 |
|
Maturity (2008)(2) |
| 136 |
|
Maturity (2012) |
| 350 |
|
Maturity (2015) |
| 150 |
|
Fair value(3) |
| 66 |
|
1. Notional principal amount of maturities and fair value are in millions of U.S. dollars.
2. Includes cross currency interest rate swaps (with a notional amount of $111 million) designated as a hedge of our Canadian dollar debenture. The total fair value of these instruments at December 31, 2004 was $46 million of which $34 million related to the currency component of the swap and $12 million related to the interest component.
3. Includes the total fair value of $34 million related to the cross currency interest rate swap discussed above.
Energy Price Management
Falconbridge hedges a portion of the cost of electricity of its operations in Canada and Norway. The following tables summarize outstanding contracts as of December 31, 2004:
Canadian electricity contracts |
|
|
|
|
|
|
| 2005 |
| 2006 |
| 2007 |
|
Rate Cdn$/MWh |
|
|
|
|
|
|
| 50.82 |
| 52.78 |
| 52.65 |
|
Amount (MW) |
|
|
|
|
|
|
| 125 |
| 92 |
| 21 |
|
Fair value (in Cdn$millions) |
|
|
|
|
|
|
| 5 |
| 3 |
| 1 |
|
|
|
|
|
|
|
|
|
|
|
|
|
|
|
Norwegian electricity |
|
|
|
|
|
|
|
|
|
|
|
|
|
contracts |
| 2005 |
| 2006 |
| 2007 |
| 2008 |
| 2009 |
| Thereafter |
|
Rate NOK/MWh |
| 183.5 |
| 191.4 |
| 198.5 |
| 205.8 |
| 211.1 |
| 215.1 |
|
Amount (MW) |
| 55.9 |
| 55.9 |
| 50.9 |
| 45.9 |
| 45.9 |
| 20.2 |
|
Fair value (in NOK millions) |
| 8 |
| 15 |
| 11 |
| 8 |
| 9 |
| 38 |
|
RECONCILIATION OF FINANCIAL MEASURES
Reconciliation of Cost of Metal and Other Product Sales to Operating Cash Cost Per Pound
The Company has included operating cash cost per pound of nickel and copper data in Management’s Discussion and Analysis because certain investors use this information to assess the Company’s performance and cash-generating capabilities. In addition, management uses this information to monitor cost performance relative to budget and prior periods. Operating cash cost per pound is a non-GAAP measure. These measurements are intended to provide additional information and should not be considered in isolation or as a substitute for measures of performance prepared in accordance with GAAP. The measures are not necessarily indicative of operating profit or cash flow from operations as determined under GAAP.
Operating cash cost includes all cash production and selling costs, net of by-product credits, but excludes interest, corporate, exploration costs and custom feed profits. Costs incurred during shutdowns or strikes are excluded.
The following table sets forth a reconciliation of operating cash cost per pound of nickel and copper to GAAP cost of sales for the periods indicated:
50
(UNAUDITED – $ MILLIONS, EXCEPT PER LB. DATA)
Years ended December 31 |
| 2004 |
| 2003 |
|
Operating Costs |
|
|
|
|
|
INO |
| 831 |
| 669 |
|
Falcondo |
| 210 |
| 177 |
|
Kidd Creek |
| 447 |
| 405 |
|
Collahuasi |
| 126 |
| 99 |
|
Lomas Bayas |
| 68 |
| 63 |
|
Costs of metal and other product sales, as reported |
| 1,682 |
| 1,413 |
|
Integrated Nickel Operations |
| 831 |
| 669 |
|
By-product credits |
| (206 | ) | (144 | ) |
Delivery expense |
| 5 |
| 5 |
|
Purchased feed costs |
| (420 | ) | (271 | ) |
Strike costs |
| (14 | ) | — |
|
Canadian dollar cost hedges |
| 35 |
| 16 |
|
Other operating costs |
| 55 |
| 8 |
|
Cash costs |
| 286 |
| 283 |
|
Production – Nickel recoverable (000s lbs.) |
| 111,045 |
| 108,584 |
|
Cash cost per lb. nickel (US$) |
| 2.57 |
| 2.64 |
|
Falcondo |
| 210 |
| 177 |
|
Delivery expense |
| 5 |
| 5 |
|
Other operating costs |
| 12 |
| — |
|
Cash costs |
| 227 |
| 182 |
|
Production – Nickel recoverable (000s lbs.) |
| 64,985 |
| 60,025 |
|
Cash cost per lb. nickel (US$) |
| 3.50 |
| 3.04 |
|
Kidd Creek |
| 447 |
| 405 |
|
By-product credits |
| (113 | ) | (65 | ) |
Delivery expense |
| 2 |
| — |
|
Feed acquisition costs |
| (269 | ) | (255 | ) |
Canadian dollar cost hedges |
| 15 |
| — |
|
Other operating costs |
| (2 | ) | (1 | ) |
Cash costs |
| 80 |
| 84 |
|
Production – Copper recoverable (000s lbs.) |
| 87,133 |
| 99,636 |
|
Cash cost per lb. copper (US$) |
| 0.93 |
| 0.83 |
|
Collahuasi |
| 126 |
| 99 |
|
Delivery expense |
| 27 |
| 13 |
|
Realization costs |
| 57 |
| 39 |
|
Other operating costs |
| (8 | ) | (4 | ) |
Cash costs |
| 202 |
| 147 |
|
Production – Copper recoverable (000s lbs.) |
| 453,234 |
| 383,275 |
|
Cash cost per lb. copper (US$) |
| 0.45 |
| 0.38 |
|
Lomas Bayas |
| 68 |
| 63 |
|
Other operating costs |
| 4 |
| (3 | ) |
Cash costs |
| 72 |
| 60 |
|
Production – Copper recoverable (000s lbs.) |
| 136,777 |
| 128,133 |
|
Cash cost per lb. copper (US$) |
| 0.52 |
| 0.47 |
|
Net Debt to Net Debt Plus Equity
Net debt to net debt plus equity is not a standardized measure recognized under Canadian GAAP. Non-GAAP financial measures do not have standard definitions and therefore, may not be comparable to similar measures presented by other issuers. The Company believes the presentation of this measure is relevant and useful for investors when assessing the Company’s liquidity. In addition, the Company uses this measure to better assess its ability for growth and investment. The data is intended to provide additional information and is not intended to be a substitute for measures of performance in accordance with Canadian GAAP. This measure is not necessarily indicative of the Company’s liquidity as determined by Canadian GAAP.
51
A reconciliation of debt to debt plus equity, the most directly comparable Canadian GAAP measure, is provided below:
($ MILLIONS)
December 31 |
| 2004 |
| 2003 |
|
Long-term debt (including current portion) (a) |
| 1,437 |
| 1,427 |
|
Cash and cash equivalents |
| (645 | ) | (298 | ) |
Net debt (b) |
| 792 |
| 1,129 |
|
Shareholders’ equity (c) |
| 2,563 |
| 1,938 |
|
Net debt plus equity (d) = (b + c) |
| 3,355 |
| 3,067 |
|
Net debt to net debt plus equity (b/d) |
| 24 | % | 37 | % |
Total debt to total debt plus equity (a/(a + c)) |
| 36 | % | 42 | % |
December 31 |
| 2004 |
| 2003 |
|
Common shares |
| 179,770,190 |
| 178,792,492 |
|
Preferred Share Series 1 |
| 89,835 |
| 89,835 |
|
Preferred Share Series 2 |
| 4,787,283 |
| 7,910,165 |
|
Preferred Share Series 3 |
| 3,122,882 |
| — |
|
The number of common shares outstanding as of January 31, 2005 was 179, 780, 890.
Nickel
After moving above the $4.00/lb. level in the second half of 2003, the nickel price continued to rise and peaked at $8.06/lb. in early January of 2004. For the balance of the year, nickel prices remained volatile, oscillating within a range of $4.78/lb. to $7.53/lb., breaking the trend of the previous decade when the nickel price managed to stay above the $4.00/lb. level only briefly. The average LME cash-settlement price for 2004 was $6.28/lb., 44% above the average price of $4.37/lb. for 2003.
The increase in nickel prices was driven by constrained supply of both primary nickel and stainless steel scrap and strong demand from the stainless-steel sector, particularly in China. Stainless steel production grew an estimated 8% in 2004. Strong market fundamentals were further supported by investment-fund interest and activity. A continued strengthening of the global economy bolstered other nickel end-use sectors as well, including the high-performance nickel alloys used in jet-engine turbines.
By the start of summer, already low LME nickel inventories fell to critical levels just below 8,000 tonnes. High prices and tight availability caused Chinese traders and consumers to begin de-stocking and also resulted in increased quantities of stainless-steel scrap appearing on the market. Some stainless steel producers, particularly in Asia, shifted their production focus onto ferritic grades of stainless steel and/or grades with lower nickel content. This action alleviated the pressure on a tight primary nickel supply, and caused the forecast deficit for 2004 to be reduced to 5,000 tonnes from an initial forecast of 25,000 tonnes. LME inventories began to reflect this increased availability, as a steady trickle of small warehouse deposits brought the exchange stocks back up to 20,898 tonnes by the end of the year. At December 31, 2004, LME nickel inventories had declined by 3,180 tonnes from the beginning of the year.
(AVERAGE PRICES — IN US$)
|
|
|
| Realized by Falconbridge |
| London Metal Exchange |
| ||||||||
|
| Pricing unit |
| 2004 |
| 2003 |
| 2004 |
| 2003 |
| ||||
Nickel |
| pound |
| $ | 6.40 |
| $ | 4.40 |
| $ | 6.28 |
| $ | 4.37 |
|
Ferronickel |
| pound |
| 6.37 |
| 4.20 |
| — |
| — |
| ||||
Copper |
| pound |
| 1.32 |
| 0.82 |
| 1.30 |
| 0.81 |
| ||||
Zinc |
| pound |
| 0.51 |
| 0.41 |
| 0.48 |
| 0.38 |
| ||||
Cobalt |
| pound |
| 22.48 |
| 9.42 |
| 22.36 | * | 8.94 | * | ||||
*As per Metal Bulletin 99.3%
52
Copper
After breaking through the $1.00/lb. level at the end of 2003, the copper price continued to rise steadily, reaching a high of $1.41/lb. in early April. Copper prices then retracted to the $1.20 – $1.30/lb. range until late September, after which they regained momentum, rising to a high of $1.49/lb. at year end. The average LME cash-settlement price for 2004 was $1.30/lb., 60% above the average price of $0.81/lb. in 2003.
In 2004, the copper market was characterized by extraordinarily strong global consumption growth that, despite supply growth, caused the supply/demand deficit to exceed one million tonnes. Global copper consumption is forecast to have grown a hefty 8.7%, as Western consumption staged a recovery. Chinese consumption growth, having receded in the previous year, still grew at a very robust 18% year over year.
During the first few years of the decade, when prices were significantly lower, copper producers exhibited discipline and curtailed copper mine and refinery output. However, the rapid rise in copper prices, which began in late 2003, has led to the restart of de-activated production as well as the emergence of new brownfield and greenfield projects. Copper mine production rose sharply in 2004, spurred by the combination of mine restarts and expansion projects. An estimated 865,000 tonnes of additional mined production entered the market in 2004, mostly from brownfield expansions. Despite the increased mine production, refinery utilization rates still were constrained at around 85%, as a significant portion of the additional mined production was absorbed into concentrate pipelines and smelter stock replenishments.
Despite the increases on the supply side, the strong demand for copper metal outpaced the additional supply, forcing consumers and merchants to draw down physical stocks and exchange stocks in order to fulfill their needs. By year end, LME stocks decreased 384,000 tonnes to 49,000 tonnes. Total LME, Comex and Shanghai exchange stocks decreased by 672,000 tonnes over the course of the year.
Cobalt
The start of 2004 saw a further strong recovery in the cobalt price, as the late 2003 surge carried over, with prices for high-grade material at or above $25.00/lb. for the first half of the year. Prices were supported by strong demand from the battery sector, with growth primarily powered by cobalt-containing lithium ion batteries. Higher cobalt prices eventually led to some price-sensitive substitution in this sector. The second half of 2004 saw a steady decline in prices to $18.00/lb. as the seasonal summer slowdown persisted. This softening of prices was attributed primarily to a build-up of inventories at battery manufacturers in Japan. Japanese consumers over-estimated cobalt demand growth for 2004 and, in anticipation of tight supplies, committed to high levels of contracted off-take for the year. Continued growth in Chinese cobalt supply arising from imports of low-grade intermediate feeds from the Democratic Republic of Congo accentuated the impact of declining Chinese consumption in the second half of 2004. The result was a small supply surplus of approximately 430 tonnes at the end of 2004.
Nickel
Current nickel-market fundamentals project a tight market again in 2005, with an expected deficit of 10,000 tonnes. Nickel production is set to increase. However, with no major new projects expected to come on-stream until 2006, supply will remain constrained. On the demand side, stainless steel production growth is forecast at 6%, while the high-nickel-alloy market is also expected to grow at an accelerated rate. As stainless-steel scrap volumes have been drawn down, the availability of scrap is not anticipated to keep pace with new production. In China, rising nickel imports point to consumer restocking and improved demand. Given the continued outlook for strong nickel demand versus a backdrop of supply-side constraints and low inventories, the nickel price likely will remain volatile within a historically high range. Nickel prices should remain well supported, as the market remains vulnerable to supply-side disruptions.
53
Copper
As a result of the higher prices, global copper mine production is forecast to increase by a further 1.6 million tonnes in 2005, with the continued ramp-up of brownfield expansions and the commissioning of a number of greenfield projects. With supply pipelines replenished and improved concentrate availability, global refined metal production is also forecast to increase by 1.6 million tonnes. As global economic growth is projected to ease slightly in 2005, the growth in copper consumption is forecast to slow to 4%, reflecting moderating demand in China and the United States. The projected market deficit is currently 170,000 tonnes for the year, significantly less than in 2004. But copper prices can be expected to remain at historically high levels while the supply/demand deficit is projected to persist in 2005.
Cobalt
The supply/demand prospects for cobalt for 2005 are anticipating a balanced market. Global demand is forecast to grow 6%, reflecting a strong recovery in super-alloy demand for turbine engine manufacture for aviation and power generation, and a resumption of demand growth in China. New production from the Coral Bay project in the Philippines, and moderate supply growth from low-grade intermediate feeds processed in China, will help supply keep pace with demand. Downward price movement is expected to extend into first quarter 2005, and until such time as inventories at battery manufacturers in Japan fall to normal levels.
TRENDS, RISKS AND UNCERTAINTIES
Sensitivities
Falconbridge’s earnings are primarily sensitive to changes in metal prices, exchange rates and energy prices. The following tables illustrate the impact of a change in these variables on operating income, earnings and cash flow. The impact of a change in either variable assumes the other variables remain constant.
|
|
|
| Impact on |
| ||||||
|
| Change in Realized |
| Operating |
|
|
|
|
| ||
($ MILLIONS) |
| Price (US$) |
| Income |
| Earnings(a) |
| Cash Flow |
| ||
Nickel |
| $ | 0.50 per pound |
| 70 |
| 50 |
| 65 |
| |
Ferronickel |
| 0.50 per pound |
| 30 |
| 15 |
| 15 |
| ||
Copper |
| 0.10 per pound |
| 83 |
| 58 |
| 78 |
| ||
Zinc |
| 0.05 per pound |
| 13 |
| 9 |
| 12 |
| ||
Cobalt |
| 1.00 per pound |
| 4 |
| 3 |
| 4 |
| ||
Platinum and Palladium |
| 100.00 per ounce |
| 14 |
| 10 |
| 13 |
| ||
Silver |
| 1.00 per ounce |
| 8 |
| 5 |
| 7 |
| ||
Oil |
| 1.00 per bbl |
| 4 |
| 2 |
| 2 |
| ||
|
|
|
|
|
|
|
|
|
| ||
Exchange rate (US$ vs. Cdn$) |
| Cdn$ | 0.01 |
| 4 |
| 3 |
| 4 |
| |
(a) Difference between earnings and cash flow relates to deferred tax amount
Falconbridge periodically uses foreign exchange and options contracts to hedge the effect of exchange rate changes on identifiable foreign currency exposures. The sensitivity table above reflects the impact of such currency hedges. In addition, Falconbridge may use futures and option contracts to hedge the effect of price changes on a portion of the metals it sells. The above sensitivities could accordingly be affected if such hedging programs were to be put in place.
Fluctuating Metal Prices
As substantially all of Falconbridge’s revenues are derived from the sale of nickel, copper, cobalt and zinc, its earnings are directly related to fluctuations in the prices of these metals. The prices of these metals are subject to volatile price movements over short periods of time. Falconbridge generally does not hedge prices of the metals it produces. Market prices can be affected by numerous factors beyond Falconbridge’s control, including expectations for inflation, speculative activities, relative exchange rates to the U.S. dollar, production activities of Falconbridge’s competitors, global and regional demand and supply, political and economic conditions and production costs in major producing regions. The prices for nickel, copper or other metals
54
produced by Falconbridge may decline significantly from current levels. A reduction in the prices of one or more of these metals could materially adversely affect the value and amount of Falconbridge’s reserves, business, financial condition, liquidity and operating results.
Mining and Processing Risks
The business of mining and processing of metals is generally subject to a number of risks and hazards, including unusual or unexpected geological conditions, ground conditions, phenomena such as inclement weather conditions, floods and earthquakes and the handling of hazardous substances and emissions of contaminants. Such occurrences could result in personal injury or death, damage to, or destruction of, mineral properties, processing or production facilities or the environment, monetary losses and possible legal liability. Falconbridge’s business, financial condition, liquidity and operating results could be materially adversely affected if any of these developments were to occur.
Although Falconbridge maintains insurance to cover some of these risks and hazards to the extent available that Falconbridge believes is consistent with the industry practice, no assurance can be given that such insurance will continue to be available, or that it will be available at economically feasible premiums. Falconbridge’s property, business interruption and liability insurance may not provide sufficient coverage for losses related to these or other risks or hazards. In such event, Falconbridge’s business, financial condition, liquidity and results of operations could be materially adversely affected.
Environmental Risks
Environmental legislation affects nearly all aspects of Falconbridge’s operations worldwide. This type of legislation requires Falconbridge to obtain operating licences and imposes standards and controls on activities relating to mining, exploration, development, production, closure and the refining, distribution and marketing of nickel and other metals products. Environmental assessments are required before initiating most new products or undertaking significant changes to existing operations. Compliance with environmental legislation can require significant expenditures, including expenditures for clean-up costs and damages arising out of contaminated properties. In addition to current requirements, Falconbridge expects that additional environmental regulations will likely be implemented to protect the environment and quality of life, given issues of sustainable development and other similar requirements which governmental and supra-governmental organizations and other bodies have been pursuing. Some of the issues currently under review by environmental regulatory agencies include reducing or stabilizing various emissions, including sulphur dioxide and greenhouse gas emissions, mine reclamation and restoration, and water, air and soil quality and absolute liability for spills and exceedances.
Canada ratified the Kyoto Protocol to the United Nations Framework Convention on Climate Change in late 2002. The protocol will enter into force in February of 2005. Various levels of governments in Canada are developing a number of policy measures in order to meet Canada’s emission reduction obligations under the protocol. While the impact of the protocol and measures cannot be quantified at this time, the likely effect will be to increase costs for fossil fuels, electricity and transportation, restrict industrial emission levels, impose added costs for emissions in excess of permitted levels and increase costs for monitoring, reporting and financial accounting. Compliance with these initiatives could have a material adverse effect on Falconbridge’s business, financial condition, liquidity and operating results.
Further changes in environmental laws, new information on existing environmental conditions or other events, including legal proceedings based upon such conditions or an inability to obtain necessary permits, could have a material adverse effect on product demand, product quality and methods of production and distribution, or could require increased financial reserves or compliance expenditures or otherwise have a material adverse effect on Falconbridge’s business, financial condition, liquidity and operating results.
Failure to comply with environmental legislation may result in the imposition of fines and penalties, liability for clean-up costs, damages and the loss of important permits. There can be no assurance that Falconbridge will at all times be in compliance with all environmental regulations or the steps to bring Falconbridge into compliance would not materially adversely affect Falconbridge’s business, financial condition, liquidity or operating results.
55
In view of the uncertainties concerning future removal and site restoration costs on Falconbridge’s properties, the ultimate costs for future removal and site restoration to Falconbridge could differ from the amounts estimated by Falconbridge. The estimate for this future liability is subject to change based on amendments to applicable laws and legislation, the nature of ongoing operations and technological innovations. Future changes, if any, due to their nature and unpredictability, could have a significant impact and would be reflected prospectively as a change in an accounting estimate.
In addition, regulatory authorities in various jurisdictions around the world may require Falconbridge to post financial security to secure in whole or in part future reclamation and restoration obligations in such jurisdictions. In some instances, Falconbridge has already provided this security. In other instances, such security may be required to be posted upon the occurrence of certain events including if Falconbridge ceases to maintain a minimum investment grade credit rating, if the regulatory authority ceases to accept alternative forms of comfort to secure the obligation or as a property nears the end of its operation. Although the posting of this security does not increase the future reclamation and restoration costs (other than costs associated with posting such security), a portion of Falconbridge’s credit may be required to back up these commitments, which could affect Falconbridge’s liquidity.
Labour Relations
Collective agreements covering Falconbridge’s hourly rated employees at Falconbridge’s Sudbury operations, Nikkelverk operations, Collahuasi operations, Kidd metallurgical division, Raglan mine, Falcondo operations and Lomas Bayas operations are currently in place.
Two collective agreements will expire in 2005. The contract covering the production and maintenance employees at the Kidd Metallurgical site will expire on September 30, 2005. The contract covering the production and maintenance employees at Falcondo will expire on November 30, 2005.
Collective agreements covering Falconbridge’s unionized workers at Raglan, Lomas Bayas, Sudbury division, Nikkelverk and Collahuasi will expire between 2006 and 2007. Falconbridge cannot predict at this time whether it will be able to reach new agreements with these employees upon expiry of their current agreements without a work stoppage. Any lengthy work interruptions could materially adversely affect Falconbridge’s business, financial condition, liquidity and results of operations.
Uncertainty of Reserve Estimates and Production Estimates
Falconbridge’s reported mineral reserves as of year-end 2004 are estimated quantities of proven and probable ore that under present and anticipated conditions can be legally and economically mined and processed by the extraction of their mineral content. Falconbridge determines the amount of its mineral reserves in accordance with the requirements of the applicable Canadian securities regulatory authorities and established mining standards. Falconbridge does not use outside sources to verify its reserves. The volume and grade of reserves actually recovered and rates of production from Falconbridge’s present mineral reserves may be less than geological measurements of the reserves. Market price fluctuations in nickel, copper, other metals and exchange rates, and changes in operating and capital costs may in the future render certain mineral reserves uneconomic to mine. In addition, short-term operating factors relating to the mineral reserves, such as the need for orderly development of orebodies or the processing of new or different ore grades, may cause mineral reserves to be modified or Falconbridge’s operations to be unprofitable in any particular fiscal period.
No assurance can be given that the indicated amount of ore will be recovered or that it will be recovered at the prices assumed by Falconbridge in determining mineral reserves. Mineral reserve estimates are based on limited sampling and, consequently, are uncertain because the samples may not be representative of the entire orebody. As more knowledge and understanding of the orebody is obtained, the reserve estimates may change significantly, either positively or negatively.
Falconbridge prepares estimates of future production for particular operations. These production estimates are based on, among other things, reserve estimates; assumptions regarding ground conditions and physical characteristics of ores, such as hardness and presence or absence of particular metallurgical characteristics; and estimated rates and costs of mining and processing. Falconbridge’s actual production may vary from estimates for a variety of reasons, including actual
56
ore mined varying from estimates of grade, tonnage, dilution and metallurgical and other characteristics; short-term operating factors relating to the mineral reserves, such as the need for sequential development of orebodies and the processing of new or different ore grades; risks and hazards associated with mining, natural phenomena, such as inclement weather conditions, floods, and earthquakes; and unexpected labour shortages or strikes. No assurance can be given that production estimates will be achieved. Failure to achieve production estimates could have a material adverse impact on Falconbridge’s future cash flows, earnings, results of operations and financial condition.
Exchange Rate Fluctuations
Fluctuations in currency exchange rates, principally the Canadian/U.S. dollar exchange rate and, to a lesser extent, Norwegian kroner, Chilean peso, Euro, Japanese yen and other exchange rates, can significantly impact Falconbridge’s earnings and cash flows. These exchange rates have varied substantially over time, including over the last five years. Most of Falconbridge’s revenues and debt are denominated in U.S. dollars, whereas most of the operating costs at its Canadian sites are incurred in Canadian dollars. The costs at Falcondo, Lomas Bayas, and Collahuasi are incurred principally in U.S. dollars, although there are costs denominated in the domestic currency, while Nikkelverk’s costs are incurred in Norwegian kroner. Falconbridge’s Consolidated Financial Statements are expressed in U.S. dollars. Fluctuations in exchange rates between the U.S. dollar and the Canadian dollar and other currencies may give rise to foreign currency exposure, either favourable or unfavourable, which has materially impacted and may in the future materially impact Falconbridge’s financial results. Falconbridge from time to time hedges a portion of its Canadian dollar and other currency requirements to limit any adverse effect of exchange rate fluctuations with respect to Falconbridge’s Canadian dollar and other costs, but such hedges have not eliminated the potential material adverse effect of such fluctuations.
Interest Rate and Counter-Party Risk
Falconbridge’s exposure to changes in interest rates results from investing and borrowing activities undertaken to manage its liquidity and capital requirements. Falconbridge has entered into interest rate swap agreements to manage the interest rate risk associated with a portion of its fixed-rate debt. The interest rate swap changes Falconbridge’s exposure to interest risk by effectively converting a portion of Falconbridge’s fixed-rate debt to a floating rate. At December 31, 2004, approximately $828 million, or 58% of Falconbridge’s total debt of $1,437 million, was subject to variable interest rates. Falconbridge may elect in the future to enter into interest rate swaps to effectively convert floating-rate debt to fixed-rate debt and enter into additional fixed-rate to floating-rate swaps. There can be no assurance that Falconbridge will not be materially adversely affected by interest rate changes in the future, notwithstanding its use of interest rate swaps. To the extent that interest rate hedges are not eligible for hedge accounting, mark-to-market changes will impact reported results of operations.
In addition, Falconbridge’s interest rate swaps, metals hedging and foreign currency and energy risk management activities expose Falconbridge to the risk of default by the counter-parties to such arrangements. Any such default could have a material adverse effect on Falconbridge’s business, financial condition and results of operation.
Foreign currency and interest rate swap contracts are maintained with counter-parties with at least an “A” rating or better by a recognized national rating agency. As a result, Falconbridge does not anticipate that any counter-parties will fail to meet their obligation. If any outstanding foreign exchange or interest rate swap is terminated prior to maturity, then the contract would be settled at the fair value at the time.
Energy Supply and Prices
Falconbridge’s operations and facilities are intensive users of natural gas, electricity and oil. Procurement of these types of energy sources can be affected by numerous factors beyond Falconbridge’s control, including global and regional supply and demand, political and economic conditions and problems related to local production and delivery conditions. Falconbridge’s supply contracts typically provide that suppliers may be released from their delivery obligations to Falconbridge if certain “force majeure” events occur. Falconbridge’s business operations could be
57
adversely affected, including loss of production and damage to Falconbridge’s plants and equipment, if, even temporarily, the supply of energy to one or more of its facilities was interrupted.
A prolonged shortage of supply of energy used in Falconbridge’s operations could materially adversely affect its business, financial condition, liquidity and results of operations. As a significant portion of Falconbridge’s costs relate to energy consumption, its earnings are directly related to fluctuations in the cost of natural gas, electricity and oil. Energy prices can be affected by numerous factors beyond Falconbridge’s control, including global and regional demand and supply, and applicable regulatory regimes. The prices for various sources of energy Falconbridge uses may increase significantly from current levels. An increase in energy prices could materially adversely affect Falconbridge’s business, financial condition, liquidity and operating results.
Foreign Operations
A large portion of Falconbridge’s activities and related assets are located in countries outside North America, some of which may be considered to be, or may become, politically or economically unstable. Exploration or development activities in such countries may require protracted negotiations with host governments, international organizations and other third parties, including non-governmental organizations, and are frequently subject to economic and political considerations, such as taxation, nationalization, inflation, currency fluctuations and governmental regulation and approval requirements, which could adversely affect the economics of projects. These projects and investments could be adversely affected by war, civil disturbances and activities of foreign governments which limit or disrupt markets, restrict the movement of funds or supplies or result in the restriction of contractual rights or the taking of property, without fair compensation.
Falconbridge performs a thorough risk assessment on a country-by-country basis when considering foreign activities, and attempts to conduct its business and financial affairs so as to protect against political, legal, regulatory and economic risks applicable to operations in the various countries where it operates, but there can be no assurance that Falconbridge will be successful in so protecting itself. These projects and investments could also be adversely affected by changes in Canadian laws and regulations relating to foreign trade, investment and taxation.
Treatment and Refining Charges
Falconbridge receives fees (treatment and refining charges) calculated in U.S. dollars for processing concentrate into refined metal. Fluctuations in these treatment and refining charges result primarily from changes in the supply of, and demand for, concentrate, finished metal and by-products, all of which are beyond Falconbridge’s control. A shortage in the supply of concentrate will generally have a negative impact on the treatment and refining charges Falconbridge realizes.
Legal Proceedings
The nature of Falconbridge’s business subjects it to numerous regulatory investigations, claims, lawsuits and other proceedings in the ordinary course of Falconbridge’s business. The results of these legal proceedings cannot be predicted with certainty. There can be no assurance that these matters will not have a material adverse effect on Falconbridge’s results of operations in any future period, and a substantial judgment could have a material adverse impact on Falconbridge’s business, financial condition, liquidity and results of operations.
ADDITIONAL INFORMATION
Additional information relating to Falconbridge, including Falconbridge’s annual information form, is on the System for Electronic Document Analysis and Retrieval (SEDAR) at www.sedar.com.
58
Accounting Responsibilities, Procedures and Policies
The Board of Directors which, among other things, is responsible for Falconbridge’s Consolidated Financial Statements, delegates to management the responsibility for the preparation of the statements. Responsibility for their review is that of the Audit Committee. Each year the shareholders appoint independent auditors to audit and report directly to them on the financial statements.
In preparing the Consolidated Financial Statements, great care is taken to use the appropriate generally accepted accounting principles and estimates considered necessary by management to present fairly and consistently the consolidated financial position and the results of operations. The principal accounting policies followed by Falconbridge are summarized on pages 65 to 68.
The accounting systems employed by Falconbridge include appropriate controls, checks and balances to provide reasonable assurance that Falconbridge’s assets are safeguarded from loss or unauthorized use as well as facilitating the preparation of comprehensive, timely and accurate financial information. There are limits inherent in all systems based on the recognition that the cost of such systems should not exceed the benefits to be derived. Falconbridge believes its systems provide the appropriate balance in this respect.
The Audit Committee is appointed by the Board of Directors annually and is currently comprised of four non-management, independent directors. The Committee meets with management and with the independent auditors (who have free access to the Audit Committee) to satisfy itself that each group is properly discharging its responsibilities and to review the financial statements and the independent auditors’ report. The Audit Committee reports its findings to the Board of Directors for consideration in approving the financial statements for issuance to the shareholders.
/s/ Neville Kirchmann |
| /s/ Aaron Regent |
| /s/ Michael Doolan |
|
Neville Kirchmann |
| Aaron Regent |
| Michael Doolan |
|
Chairman of the Audit Committee |
| President & Chief Executive Officer |
| Senior Vice-President & Chief Financial Officer |
|
59
To the Shareholders of Falconbridge Limited:
We have audited the Consolidated Statements of Financial Position of Falconbridge Limited (“Falconbridge”) as at December 31, 2004 and 2003, and the Consolidated Statements of Earnings, Shareholders’ Equity and Cash Flows for the years then ended. These financial statements are the responsibility of Falconbridge’s management. Our responsibility is to express an opinion on these financial statements based on our audits.
We conducted our audits in accordance with Canadian generally accepted auditing standards. Those standards require that we plan and perform an audit to obtain reasonable assurance whether the financial statements are free of material misstatement. An audit includes examining, on a test basis, evidence supporting the amounts and disclosures in the financial statements. An audit also includes assessing the accounting principles used and significant estimates made by management, as well as evaluating the overall financial statement presentation.
In our opinion, these Consolidated Financial Statements present fairly, in all material respects, the financial position of Falconbridge as at December 31, 2004 and 2003, and the results of its operations and its cash flows for the years then ended in accordance with Canadian generally accepted accounting principles.
/s/ Deloitte and Touche LLP |
|
Deloitte and Touche LLP | |
Chartered Accountants | |
| |
Toronto, Ontario | |
January 31, 2005 | |
60
Consolidated Statements of Earnings
(IN MILLIONS OF US$) |
|
|
|
|
| ||
Years ended December 31 |
| 2004 |
| 2003 |
| ||
|
|
|
| Restated – Note 2 |
| ||
|
|
|
|
|
| ||
Revenues |
| $ | 3,070 |
| $ | 2,083 |
|
Operating expenses |
|
|
|
|
| ||
Costs of sales |
|
|
|
|
| ||
Costs of metal and other product sales |
| 1,682 |
| 1,413 |
| ||
Depreciation of plant and equipment |
| 192 |
| 179 |
| ||
Amortization of development and preproduction expenditures |
| 82 |
| 70 |
| ||
|
| 1,956 |
| 1,662 |
| ||
Selling, general and administrative |
| 108 |
| 86 |
| ||
Exploration |
| 20 |
| 23 |
| ||
Research and process development |
| 12 |
| 13 |
| ||
Other expenses/(income) (Note 16) |
| 5 |
| (2 | ) | ||
|
| 2,101 |
| 1,782 |
| ||
Operating income |
| 969 |
| 301 |
| ||
Interest (Note 11) |
| 37 |
| 43 |
| ||
Earnings before taxes and non-controlling interest |
| 932 |
| 258 |
| ||
Income and mining taxes (Note 7) |
| 248 |
| 63 |
| ||
Non-controlling interest in earnings of subsidiary |
| 12 |
| 4 |
| ||
Earnings for the year |
| $ | 672 |
| $ | 191 |
|
Dividends on preferred shares |
| 7 |
| 9 |
| ||
Earnings attributable to common shares |
| $ | 665 |
| $ | 182 |
|
Basic earnings per common share (Note 10(c)) |
| $ | 3.71 |
| $ | 1.03 |
|
Diluted earnings per common share (Note 10(c)) |
| $ | 3.69 |
| $ | 1.02 |
|
(See accompanying Notes to Consolidated Financial Statements)
61
Consolidated Statements of Financial Position
(IN MILLIONS OF US$) |
|
|
|
|
| ||
As at December 31 |
| 2004 |
| 2003 |
| ||
|
|
|
| Restated – Note 2 |
| ||
ASSETS |
|
|
|
|
| ||
Current |
|
|
|
|
| ||
Cash and cash equivalents (Note 12) |
| $ | 645 |
| $ | 298 |
|
Accounts and metals settlements receivable (Note 15) |
| 332 |
| 258 |
| ||
Inventories (Note 3) |
| 573 |
| 442 |
| ||
Total current assets |
| 1,550 |
| 998 |
| ||
Property, plant and equipment (Note 4) |
| 3,195 |
| 2,970 |
| ||
Deferred expenses and other assets (Note 5) |
| 373 |
| 204 |
| ||
Total assets |
| $ | 5,118 |
| $ | 4,172 |
|
|
|
|
|
|
| ||
LIABILITIES AND SHAREHOLDERS’ EQUITY |
|
|
|
|
| ||
Current |
|
|
|
|
| ||
Accounts payable and accrued charges (Note 15) |
| $ | 335 |
| $ | 255 |
|
Income and other taxes payable |
| 34 |
| 23 |
| ||
Long-term debt due within one year (Note 6) |
| 248 |
| 71 |
| ||
Total current liabilities |
| 617 |
| 349 |
| ||
Long-term debt (Note 6) |
| 1,189 |
| 1,356 |
| ||
Future income and mining taxes (Note 7) |
| 355 |
| 205 |
| ||
Employee future benefits (Note 8) |
| 112 |
| 150 |
| ||
Other long-term liabilities (Note 9) |
| 247 |
| 147 |
| ||
Non-controlling interest |
| 35 |
| 27 |
| ||
Total liabilities |
| $ | 2,555 |
| $ | 2,234 |
|
Commitments and contingencies (Notes 6, 9, 14, 17) |
|
|
|
|
| ||
Shareholders’ equity |
| 2,563 |
| 1,938 |
| ||
Total liabilities and shareholders’ equity |
| $ | 5,118 |
| $ | 4,172 |
|
(See accompanying Notes to Consolidated Financial Statements)
On behalf of the Board: |
| ||
|
| ||
|
| ||
/s/ David Kerr |
| /s/ Aaron Regent |
|
David Kerr, | Aaron Regent, | ||
Director | Director | ||
62
Consolidated Statements of Shareholders’ Equity
(IN MILLIONS OF US$) |
|
|
| 2004 |
|
|
| 2003 |
| ||
Years ended December 31 |
| Number |
| Amount |
| Number |
| Amount |
| ||
|
|
|
|
|
|
|
| Restated – Note 2 |
| ||
Share capital |
|
|
|
|
|
|
|
|
| ||
Authorized |
|
|
|
|
|
|
|
|
| ||
Unlimited preferred shares |
|
|
|
|
|
|
|
|
| ||
Unlimited common shares |
|
|
|
|
|
|
|
|
| ||
|
|
|
|
|
|
|
|
|
| ||
Issued |
|
|
|
|
|
|
|
|
| ||
Common shares |
|
|
|
|
|
|
|
|
| ||
Balance, beginning of year |
| 178,792,492 |
| $ | 1,450 |
| 177,603,432 |
| $ | 1,430 |
|
Repurchased and cancelled (Note 10(d)) |
| — |
| — |
| (600,000 | ) | (5 | ) | ||
Issued pursuant to employee stock option plan (Note 10(a)) |
| 977,698 |
| 16 |
| 1,789,060 |
| 25 |
| ||
Balance, end of year |
| 179,770,190 |
| 1,466 |
| 178,792,492 |
| 1,450 |
| ||
Preferred shares Series 1 (Note 10(b)) |
|
|
|
|
|
|
|
|
| ||
Balance, beginning and end of year |
| 89,835 |
| 1 |
| 89,835 |
| 1 |
| ||
Preferred shares Series 2 (Note 10(b)) |
|
|
|
|
|
|
|
|
| ||
Balance, beginning of year |
| 7,910,165 |
| 129 |
| 7,910,165 |
| 129 |
| ||
Conversion of units |
| (3,122,882 | ) | (51 | ) | — |
| — |
| ||
Balance, end of year |
| 4,787,283 |
| 78 |
| 7,910,165 |
| 129 |
| ||
Preferred shares Series 3 (Note 10(b)) |
|
|
|
|
|
|
|
|
| ||
Balance, beginning of year |
| — |
| — |
| — |
| — |
| ||
Conversion of units |
| 3,122,882 |
| 51 |
| — |
| — |
| ||
Balance, end of year |
| 3,122,882 |
| 51 |
| — |
| — |
| ||
|
|
|
|
|
|
|
|
|
| ||
Contributed surplus |
|
|
|
|
|
|
|
|
| ||
Balance, beginning of year |
|
|
| 2 |
|
|
| 2 |
| ||
Amortization of fair value of stock options |
|
|
| 1 |
|
|
| — |
| ||
Balance, end of year |
|
|
| 3 |
|
|
| 2 |
| ||
|
|
|
|
|
|
|
|
|
| ||
Surplus (Deficit) |
|
|
|
|
|
|
|
|
| ||
Balance, beginning of year |
|
|
| 139 |
|
|
| (6 | ) | ||
Adjustment for change in accounting standard Asset retirement obligations (Note 2) |
|
|
| — |
|
|
| 14 |
| ||
Earnings for the year |
|
|
| 672 |
|
|
| 191 |
| ||
Dividends – Common shares |
|
|
| (55 | ) |
|
| (50 | ) | ||
– Preferred shares |
|
|
| (7 | ) |
|
| (9 | ) | ||
Loss on repurchase of common shares (Note 10(d)) |
|
|
| — |
|
|
| (1 | ) | ||
Balance, end of year |
|
|
| 749 |
|
|
| 139 |
| ||
Cumulative translation adjustment |
|
|
| 215 |
|
|
| 217 |
| ||
Total shareholders’ equity |
|
|
| $ | 2,563 |
|
|
| $ | 1,938 |
|
(See accompanying Notes to Consolidated Financial Statements)
63
Consolidated Statements of Cash Flows
(IN MILLIONS OF US$) |
|
|
|
|
| ||
Years ended December 31 |
| 2004 |
| 2003 |
| ||
|
|
|
| Restated – Note 2 |
| ||
Operating activities |
|
|
|
|
| ||
Earnings for the year |
| $ | 672 |
| $ | 191 |
|
Add (deduct) items not affecting cash |
|
|
|
|
| ||
Depreciation of plant and equipment |
| 192 |
| 179 |
| ||
Amortization of development and preproduction expenditures |
| 82 |
| 70 |
| ||
Future income and mining taxes (Note 7) |
| 152 |
| 25 |
| ||
Non-controlling interest in earnings of subsidiary |
| 12 |
| 4 |
| ||
Other |
| (5 | ) | 6 |
| ||
Contributions to pension fund in excess of amounts expensed |
| (38 | ) | (30 | ) | ||
Cash provided by operating activities before working capital changes |
| 1,067 |
| 445 |
| ||
Net change in receivables, inventories and payables |
| (99 | ) | (1 | ) | ||
Cash provided by operating activities |
| 968 |
| 444 |
| ||
Investing activities |
|
|
|
|
| ||
Capital investments and deferred project costs |
| (573 | ) | (370 | ) | ||
Proceeds on disposal of assets |
| 1 |
| — |
| ||
Other |
| (1 | ) | (18 | ) | ||
Cash used in investing activities |
| (573 | ) | (388 | ) | ||
Financing activities |
|
|
|
|
| ||
Long-term debt, including current portion (Note 6): |
|
|
|
|
| ||
Issued |
| 60 |
| 246 |
| ||
Repaid |
| (60 | ) | (130 | ) | ||
Dividends paid – Common shares |
| (55 | ) | (50 | ) | ||
– Preferred shares |
| (6 | ) | (8 | ) | ||
– Minority shareholders of Falcondo |
| (3 | ) | — |
| ||
Repurchase of common shares |
| — |
| (6 | ) | ||
Issue of common shares (Note 10(a)) |
| 16 |
| 25 |
| ||
Cash (used in) provided by financing activities |
| (48 | ) | 77 |
| ||
Cash provided during the year |
| 347 |
| 133 |
| ||
Cash and cash equivalents, beginning of year |
| 298 |
| 165 |
| ||
Cash and cash equivalents, end of year |
| $ | 645 |
| $ | 298 |
|
Supplementary information: |
|
|
|
|
| ||
Cash paid for interest |
| $ | 63 |
| $ | 59 |
|
Cash paid for income and mining taxes |
| $ | 89 |
| $ | 17 |
|
(See accompanying Notes to Consolidated Financial Statements)
64
Notes to Consolidated Financial Statements
(TABULAR FIGURES IN MILLIONS OF US$, EXCEPT WHERE OTHERWISE NOTED)
1. SUMMARY OF SIGNIFICANT ACCOUNTING POLICIES
The Consolidated Financial Statements of Falconbridge Limited have been prepared in accordance with Canadian generally accepted accounting principles (GAAP), consistently applied (Note 2). In these Consolidated Financial Statements, references to the Corporation mean only Falconbridge Limited, the parent company, and references to Falconbridge include the Corporation and its consolidated subsidiaries. The principal accounting policies followed by Falconbridge are summarized hereunder.
Basis of Consolidation
Falconbridge consolidates the financial statements of subsidiary companies and proportionately consolidates the financial statements of joint ventures.
Translation of Foreign Currencies
Effective July 1, 2003, the functional currency of Falconbridge was changed from the Canadian to U.S. dollar. Concurrent with this change in functional currency, Falconbridge adopted the U.S. dollar as its reporting currency.
Prior to the change, foreign currency balances and the financial statements of integrated foreign operations were translated into Canadian dollars using the temporal method. Under this method, monetary items are translated at the rate of exchange in effect at year-end. Non-monetary items are translated at historical exchange rates. Revenue and expense items are translated at the average exchange rates prevailing during the year, except for depreciation and amortization, which are translated at the same exchange rates as the assets to which they relate. Exchange gains and losses are included in income in the current year, except when hedged. Certain monetary items were hedged by foreign currency forward and option contracts. Financial statements of self-sustaining foreign operations were translated into Canadian dollars using the current rate method. Under this method, assets and liabilities are translated at the rate of exchange in effect at year-end while revenue and expense items (including depreciation and amortization) are translated at the average exchange rates prevailing during the year. Exchange gains and losses from the translation of such financial statements are deferred and disclosed as a separate component of shareholders’ equity. The Corporation used a combination of its U.S. dollar long-term debt and forward exchange contracts and options for the sale of U.S. dollars to fully hedge its net investments in self-sustaining foreign operations. Gains or losses on these hedge instruments are reported in the same manner as exchange gains and losses from the translation of the financial statements of its self-sustaining foreign operations.
Subsequent to the change, the Corporation does not have any self-sustaining subsidiaries whose functional currency is not the U.S. dollar. Balances denominated in currencies other than the U.S. dollar, and the financial statements of integrated foreign operations, are translated into U.S. dollars using the temporal method described above. The economic exposure of certain foreign currency monetary items are managed through the use of foreign currency forward and option contracts.
Revenue Recognition
Revenues are generated from the sale of refined metals, concentrates and ferronickel, and are recorded in the accounts when the ownership and control of goods passes to the buyer, which generally occurs upon shipment. Prices used for provisionally-priced sales are based on market prices prevailing at the time of shipment and are adjusted upon final settlement with customers pursuant to the terms of sales contracts.
Cash and Cash Equivalents
Cash and cash equivalents include cash on account, demand deposits and short-term investments with original maturities of three months or less and are stated at cost, which approximates market value.
65
Valuation of Inventories
Metals inventories are valued at the lower of cost, determined on a “first-in, first-out” basis, and net realizable value. Supplies inventories are valued at the lower of average cost of acquisition, less appropriate allowances for obsolescence, and replacement cost. Effective January 1, 2003, Falconbridge retroactively changed its accounting policy for inventory costing. Under the previous policy, depreciation and amortization of property, plant and equipment was treated as a period cost. Under the new policy depreciation and amortization is treated as a product cost and expensed when the inventory is sold.
Financial Instruments
Falconbridge periodically uses forward foreign exchange and option contracts to hedge the effect of exchange rate changes on identifiable foreign currency exposures. Generally, Falconbridge does not hedge the price it realizes on the sale of its own production and accepts realizations based on market prices prevailing around the time of delivery of metals to customers. Under certain circumstances, Falconbridge enters into futures and option contracts to hedge the effect of price changes on a portion of the commodities it sells. Falconbridge also enters into interest-rate swap agreements, including foreign exchange cross currency swaps, to modify the interest characteristics of its outstanding debt.
Falconbridge may enter into futures and forward contracts for the purchase or sale of commodities and currencies not designated as hedges. These contracts are carried at estimated fair values and gains or losses arising from the changes in the market values of these contracts are recognized in the earnings of the period in which the changes occur.
Financial instruments designated as hedges are tested for effectiveness on a quarterly basis. Gains and losses on those contracts that are proven to be effective are reported as a component of the related transactions.
The net interest received/paid on interest rate swap agreements that qualify for hedge accounting is reflected as a reduction from/addition to interest on the statement of earnings. For contracts that do not qualify for hedge accounting, or for those which Falconbridge does not seek hedge accounting, the net interest received/paid on those positions is not shown as a reduction from/addition to interest, on the statement of earnings, but is shown as a component of other expenses/(income) together with the change in fair value of those contracts during the period (see Note 2 – Accounting changes; Note 16 – Other expenses/(income); and Note 11 – Interest).
Interest
Falconbridge capitalizes a portion of its interest costs incurred on corporate debt to all major projects prior to commencement of commercial production. Interest costs incurred after the commencement of commercial production are expensed.
Property, Plant and Equipment
Property, plant and equipment and related capitalized interest and development and preproduction expenditures are recorded at cost. Repairs and maintenance expenditures are charged to operations; major betterments and replacements are capitalized. Under the provisions of the new standard for asset retirement obligations, an increase to the carrying amount of the related asset equal to the fair value of the legal obligation for asset retirement is recorded as incurred (see Note 2 – Accounting changes).
Falconbridge generally depreciates plant and equipment on a straight-line basis over the lesser of their useful service lives or the lives of the producing mines to which they relate. At the Kidd Creek operations, mine facilities are depreciated over the estimated lives of the mines based on the unit of production basis. Reduction and refining facilities are depreciated on the straight-line basis over the life of the related asset. Generally, Falconbridge calculates depreciation on a straight-line basis at rates varying from 5% to 25%. Assets are depreciated and charged to depreciation expense on the straight-line basis over the life of the associated asset.
Amortization of resource properties is provided over the estimated lives of the reserves recoverable from the properties on the unit of production basis.
Development and preproduction expenditures are capitalized until the commencement of commercial production. These, together with certain subsequent development expenditures, which are also capitalized, are amortized over periods not exceeding the lives of the producing mines and properties.
66
Annually, or as required, Falconbridge assesses its long-lived assets for impairment. The first step in this assessment determines whether impairment exists, and, if so, the second step measures the amount of the impairment. Impairment exists if the carrying amount of a long-lived asset exceeds the sum of the undiscounted cash flows expected to result from its use and eventual disposition. The amount of any impairment loss, determined as the amount by which the long-lived asset’s carrying value exceeds its fair value, is charged to earnings with a corresponding reduction in the book value of the related asset (see Note 2 – Accounting changes).
Exploration
Exploration costs incurred to the date of establishing that a property has reserves, which have the potential of being economically recoverable, are expensed. Costs incurred subsequent to the determination of economically recoverable reserves, including allocated interest costs, are deferred. Upon reaching commercial production, such deferred costs are amortized as appropriate under the policy for property, plant and equipment as described above.
Employee Future Benefits
The costs of retirement benefits and other benefit obligations are recognized over the period in which employees render services in return for the benefits.
Pension expense recorded for Falconbridge’s defined benefit plans is the net of management’s best estimate of the cost of benefits provided, the interest cost of projected benefits, return on pension plan assets and amortization of experience gains or losses and other pension plan surpluses or deficits. Plan obligations are discounted using rates that reflect the market yields, as of the measurement date, on high-quality debt instruments with cash flows that match expected benefit payments. The return on plan assets assumption and the discount rate, salary and inflation assumptions used to value the plan obligations are reviewed annually. The assumption is based on expected returns for the various asset classes.
Pension fund assets are presented at fair market value. Pension plan surpluses or deficits, experience gains or losses and the cost of pension plan improvements are amortized, on a straight-line basis, over the expected average remaining service life (EARSL) of the employee group or the term of the employment contract to which the items relate, depending on the nature of the item. Funding is subject to applicable government regulations.
Under its defined contribution retirement savings program, Falconbridge makes payments based on employee earnings and partially matches employee contributions, to a defined maximum. Employees may receive profit sharing credits based on earnings.
Falconbridge also provides certain health care and life insurance benefits for retired employees and their dependents. The cost of these benefits is expensed over the period in which the employees render services in return for the benefits.
Income and Mining Taxes
Current income taxes are recognized for the estimated income and mining taxes payable for the current year. Future income tax assets and liabilities are recognized for temporary differences between the tax and accounting bases of assets and liabilities as well as for the benefit of losses, available to be carried forward to future years for tax purposes, that are likely to be realized. Where appropriate, income and withholding taxes are provided on the portion of any interest in consolidated foreign subsidiaries’ undistributed net income, which it is reasonable to assume, will be transferred in a taxable distribution.
Asset Retirement Obligations
Falconbridge records a liability for its long-term asset retirement obligations, equal to the fair value of the legal obligation for asset retirement, and records a corresponding increase to the carrying amount of the related asset. The asset is depreciated and charged to depreciation expense over the life of the associated asset. Interest on the obligation is accreted over the period of expected cash flows with a corresponding charge to operating income. The fair value of the legal obligation for asset retirement is assessed annually.
67
A provision for asset retirement is not recorded for assets with indeterminate lives until sufficient information exists to estimate the timing of settlement. As such, although Falconbridge will be subject to asset retirement obligations for its refinery in Norway, its power plant at Falcondo, as well as for the metallurgical facilities at Sudbury and Kidd Creek, these assets are not included in the provision for asset retirement as sufficient information is not available at this time to estimate the timing of settlement (see Note 2 – Accounting changes).
Stock Option Plan
Falconbridge accounts for stock options using the fair value method. Compensation expense for stock options is measured at the fair value at the grant date using the Black-Scholes valuation model and is recognized over the vesting period of the options granted.
Use of Estimates
The preparation of financial statements in conformity with generally accepted accounting principles requires management to make estimates and assumptions. These estimates affect the reported amounts of assets and liabilities and the disclosure of contingent assets and liabilities at the date of the financial statements and the reported amounts of revenues and expenses during the reporting period. Falconbridge primarily uses estimates in the determination of asset lives to compute depreciation, asset impairment, the cost of employee future benefits, asset retirement obligations, mineral reserves, taxes, derivatives and allowances for unrecoverable receivables. Actual results could differ from those estimates.
2. ACCOUNTING CHANGES
Adoption of New Accounting Standards
Effective January 1, 2004, Falconbridge adopted four new accounting standards and guidelines issued by the Canadian Institute of Chartered Accountants (CICA); Asset Retirement Obligations (CICA 3110), Hedging Relationships (AcG 13), Impairment of Long-lived Assets (CICA 3063), and Generally Accepted Accounting Principles (CICA 1100).
Asset Retirement Obligations
Under the previous policy, costs related to ongoing site restoration programs were expensed when incurred, while a provision for mine closure and site closure costs was charged to earnings over the life of the operations. Under the new standard, a long-term obligation, equal to the fair value of the legal obligation for asset retirement and a corresponding increase to the carrying amount of the related asset, determined at the date of adoption, is recorded. The key assumptions on which the fair value of the asset retirement obligations is based, include the estimated future cash flows, the timing of those cash flows, and the credit-adjusted risk-free rate or rates at which the estimated cash flows have been discounted. Falconbridge uses discount rates ranging from 5.0% to 6.5%. Under the accounting standard, a provision for asset retirement is not required to be recorded for assets with indeterminate lives until such time as sufficient information exists to estimate a range of settlement dates. As such, although Falconbridge will be subject to asset retirement obligations for its refinery in Norway, its power plant at Falcondo, as well as for the metallurgical facilities at Sudbury and Kidd Creek, these assets are not included in the provision for asset retirement as sufficient information is not available at this time to estimate the timing of settlement. As of December 31, 2004, with respect to Falconbridge’s other asset retirement obligations, undiscounted cash outflows approximating $470 million are expected to occur over a period ranging from 1 to 62 years. The asset is being depreciated and charged to depreciation expense over the life of the associated asset. Interest on the obligation is being accreted with a corresponding charge to operating income. This standard has been applied retroactively with restatement of prior years.
As of January 1, 2003, the cumulative impact of the adoption of the standard was to increase retained earnings by $14 million, increase property, plant and equipment by $69 million, increase accumulated depreciation by $13 million, increase the provision for asset retirement by $37 million, and increase future income taxes by $5 million. The adoption of this standard resulted in a decrease of $3 million to previously reported earnings for the year ended December 31, 2003. Consequently, the effect of this restatement on previously reported basic earnings per common
68
share is a decrease of $0.02. Further disclosure regarding asset retirement obligations is presented in Note 9 – Other long-term liabilities.
Hedging Relationships
As of January 1, 2004, Falconbridge adopted CICA guideline AcG 13 which establishes new standards for when hedge accounting may be applied. This standard is applied prospectively without restatement of prior period results. Under the provisions of the guideline, Falconbridge’s interest rate swaps were deemed to be in a hedging relationship, as a fair value hedge of a portion of the Corporation’s debt, prior to, but not as at, the date of the guideline’s implementation. As such, on January 1, 2004, Falconbridge recorded a deferred mark-to-market gain of $27 million on its interest rate hedges, while recording a long-term receivable and a long-term payable of $67 million and $40 million, for those contracts in a gain and loss position, respectively. Under the provision of the standard the mark-to-market gain is amortized into income, as a reduction of interest expense, over the life of the underlying hedged debt (see Note 11 – Interest). For the year ended December 31, 2004, $7 million of this deferred gain was amortized into income as part of interest expense.
Subsequent to the implementation of the guideline, Falconbridge has to prove hedge effectiveness in order to qualify for hedge accounting. Falconbridge’s interest rate swaps did not qualify for hedge accounting until April 22, 2004. Upon qualification for hedge accounting, the long-term receivable and long-term payable, representing the fair value of the hedges which qualified on April 22, 2004, are amortized into interest expense (see Note 11 – Interest). For the year ended December 31, 2004, a mark-to-market loss of $1 million was recorded for those contracts that were not eligible for hedge accounting. For contracts that qualify for hedge accounting, the net interest received/paid on those positions is shown as a reduction from/addition to interest on the statement of earnings. For contracts that do not qualify for hedge accounting or for those which Falconbridge does not seek hedge accounting, the net interest received/paid on those positions is not shown as a reduction from/addition to interest, on the statement of earnings, but is shown as a component of other expenses/(income) together with the change in fair value of those contracts during the period (see Note 16 – Other expenses/(income) and Note 11 – Interest).
For energy price hedge contracts not eligible for hedge accounting, Falconbridge recorded at January 1, 2004, a deferred mark-to-market gain of $3 million. $2 million of this deferred gain was amortized into income during the year ended December 31, 2004. In addition, Falconbridge recorded a $1 million mark-to-market gain on those contracts during the year ended December 31, 2004.
Under the provisions of the new guideline, Falconbridge continues to be eligible for hedge accounting for forward contracts and option contracts used as a currency hedge of Canadian dollar operating costs. Falconbridge did not seek hedge accounting for forward contracts and option contracts used as an economic currency hedge of Canadian dollar denominated monetary assets and liabilities. These contracts continue to be marked to market (see Note 14 – Financial instruments).
Impairment of Long-lived Assets
CICA section 3063 establishes standards for the recognition, measurement and disclosure of the impairment of long-lived assets. This standard is effective for fiscal years commencing on or after April 1, 2003, and as such was implemented by Falconbridge effective January 1, 2004. Under the provision of the standard, a two-step process determines impairment of long-lived assets held for use. The first step determines whether impairment exists, and if so, the second step measures the amount of the impairment. Impairment exists if the carrying amount of a long-lived asset exceeds the sum of the undiscounted cash flows expected to result from its use and eventual disposition. The amount of the impairment loss is determined as the amount by which the long-lived asset’s carrying value exceeds its fair value. Falconbridge has not incurred an impairment loss on any of its long-lived assets as a result of the implementation of this standard.
Generally Accepted Accounting Principles
Effective January 1, 2004, Falconbridge adopted CICA 1100, which establishes standards for financial reporting in accordance with generally accepted accounting principles. CICA 1100 describes what constitutes Canadian generally accepted accounting principles and its sources. The standard provides guidance on sources to consult when selecting accounting principles and determining appropriate disclosure when a matter is not dealt with explicitly in the primary sources of generally accepted accounting principles. The effect of any change in accounting policy made on adopting this section is applied to events and transactions occurring after the date of the
69
change and to any outstanding related balances existing at the date of the change. No cumulative catch-up adjustment is made to such balances. Implementation of this standard has had no significant impact on Falconbridge.
Change in Functional and Reporting Currency
Effective July 1, 2003, the functional currency of Falconbridge was changed from the Canadian to the U.S. dollar. In general, this change resulted from a gradual increase in the overall proportion of business activities conducted in U.S. dollars. Concurrent with this change in functional currency, Falconbridge adopted the U.S. dollar as its reporting currency. In accordance with Canadian GAAP, the change was effected by translating assets and liabilities, at the end of prior reporting periods, at the existing U.S./Canadian dollar foreign exchange spot rate, while earnings for those periods were translated at the average rate for each period. Equity transactions have been translated at historic rates, with opening equity on January 1, 1999, restated at the rate of exchange on that date. The resulting net translation adjustment has been credited to the cumulative translation adjustment account.
3. INVENTORIES
Inventories consist of the following:
As at December 31 |
| 2004 |
| 2003 |
| ||
Metals in process |
| $ | 294 |
| $ | 218 |
|
Finished metals |
| 157 |
| 123 |
| ||
Supplies |
| 115 |
| 85 |
| ||
Raw materials |
| 7 |
| 16 |
| ||
|
| $ | 573 |
| $ | 442 |
|
4. PROPERTY, PLANT AND EQUIPMENT
Property, plant and equipment consist of the following:
As at December 31 |
| 2004 |
| 2003 |
| ||||||||||||||
| Cost |
| Accumulated |
| Net |
| Cost |
| Accumulated |
| Net |
| |||||||
Plant and equipment: |
|
|
|
|
|
|
|
|
|
|
|
|
|
|
|
|
|
|
|
Mines, mining plants and ancillary mining assets |
| $ | 2,986 |
| $ | 1,413 |
| $ | 1,573 |
| $ | 2,771 |
| $ | 1,277 |
| $ | 1,494 |
|
Smelters |
| 548 |
| 348 |
| 200 |
| 535 |
| 328 |
| 207 |
| ||||||
Refineries |
| 692 |
| 432 |
| 260 |
| 673 |
| 405 |
| 268 |
| ||||||
Other |
| 186 |
| 125 |
| 61 |
| 165 |
| 118 |
| 47 |
| ||||||
|
| 4,412 |
| 2,318 |
| 2,094 |
| 4,144 |
| 2,128 |
| 2,016 |
| ||||||
Land and properties |
| 297 |
| 171 |
| 126 |
| 292 |
| 159 |
| 133 |
| ||||||
|
| $ | 4,709 |
| $ | 2,489 |
| $ | 2,220 |
| $ | 4,436 |
| $ | 2,287 |
| $ | 2,149 |
|
Development and preproduction expenditures, net |
|
|
|
|
| 975 |
|
|
|
|
| 821 |
| ||||||
|
|
|
|
|
| $ | 3,195 |
|
|
|
|
| $ | 2,970 |
| ||||
70
5. DEFERRED EXPENSES AND OTHER ASSETS
Deferred expenses and other assets consist of the following:
As at December 31 |
| 2004 |
| 2003 |
| ||
Deferred pre-development costs |
| $ | 186 |
| $ | 130 |
|
Unrealized gain on interest rate swap contracts |
| 89 |
| — |
| ||
Unrealized gain on Canadian debt hedge contract |
| 31 |
| 24 |
| ||
Inventories and supplies |
| 23 |
| 14 |
| ||
Debt discount and issue expenses, net |
| 8 |
| 10 |
| ||
Water rights |
| 7 |
| 7 |
| ||
Employee housing advances |
| 3 |
| 4 |
| ||
Other |
| 26 |
| 15 |
| ||
|
| $ | 373 |
| $ | 204 |
|
6. LONG-TERM DEBT
Long-term debt consists of the following:
As at December 31 |
| 2004 |
| 2003 |
| ||
Falconbridge Limited: |
|
|
|
|
| ||
7.35% Debentures, due November 1, 2006 (a) |
| $ | 250 |
| $ | 250 |
|
7.35% Debentures, due June 5, 2012 (a) |
| 250 |
| 250 |
| ||
5.375% Debentures, due June 1, 2015 (a) |
| 250 |
| 250 |
| ||
7.375% Debentures, due September 1, 2005 (a) |
| 200 |
| 200 |
| ||
8.50% Debentures, due December 8, 2008 (Cdn$175.0 million) (b) |
| 145 |
| 135 |
| ||
Compañía Minera Doña Inés de Collahuasi S.C.M.: Senior Debt (c) |
| 282 |
| 282 |
| ||
Compañía Minera Lomas Bayas: Term Loan (d) |
| 60 |
| 60 |
| ||
Total |
| 1,437 |
| 1,427 |
| ||
Less: long-term debt due within one year |
| 248 |
| 71 |
| ||
|
| $ | 1,189 |
| $ | 1,356 |
|
(a) The Corporation has entered into a number of interest rate swap and option transactions with terms up to 11 years. As a result of these transactions, at December 31, 2004, interest costs on $550 million (2003 – $550 million) of the debentures were swapped to an average fixed interest rate of 6.01% (2003 – 6.01%) and interest costs on $400 million (2003 – $400 million) were swapped to a floating rate basis at an average interest rate of 4.45% (2003 – 3.28%). The weighted average interest rate on these debentures at December 31, 2004, was 5.35% (2003 – 4.86%). If these positions had been settled at December 31, 2004, the Corporation would have received $21 million (2003 – received $24 million).
(b) The Corporation has entered into several cross currency interest rate swap transactions with terms of four years. As a result of these transactions, at December 31, 2004, interest costs on $86 million (2003 – $86 million) of the debentures were swapped to an average floating interest rate of 6.74% (2003 – 5.32%) and interest costs on $25 million (2003 – $25 million) were swapped to a fixed interest rate of 5.00% (2003 – 5.00%). If these positions had been settled at December 31, 2004, the Corporation would have received $45 million (2003 – received $31 million).
(c) In December 2004, Collahuasi renegotiated the terms of their outstanding senior debt. The term has been extended to December 15, 2011. The principal is repayable in equal semi-annual installments. The weighted average interest rate on the senior debt outstanding at December 31, 2004, was 2.88% (2003 – 2.52%).
(d) In December 2004, Lomas Bayas repaid their existing loan and entered into a new Term Loan in the amount of $60 million. The loan is due January 2, 2008 and has semi-annual principal repayments of $7.5 million, commencing July 2, 2005. The interest rate on the loan at December 31, 2004 was 3.62% (December 31, 2003 – 3.66%).
71
Available Financing Facilities
The Corporation has unsecured committed Credit Facilities with various banks outstanding at December 31, 2004 (individually a “Credit Facility” and collectively the “Credit Facilities”). These three-year revolving Credit Facilities mature on December 13, 2007. The aggregate principal amount of the Credit Facilities is $475 million (2003 – $405 million). The revolving period of the Credit Facilities may be renewed and extended annually to maintain the three-year term of the revolver. Borrowings may be made under the Credit Facilities in Canadian dollars in the form of prime rate loans or bankers’ acceptances or in U.S. dollars in the form of U.S. base rate loans or LIBOR loans. In some cases, borrowings may be in the form of letters of credit, which offset amounts available under the Credit Facility. As at December 31, 2004, the Corporation had no borrowings (2003 – nil) and had drawn letters of credit totaling $18 million (2003 – $17 million) under a Credit Facility, leaving an unused balance of $457 million.
The Corporation also has an uncommitted letter of credit facility of $21 million. At December 31, 2004, $17 million (2003 – $15 million) of letters of credit had been issued under this facility.
The Corporation has also established a Commercial Paper Program. Unused lines of credit and cash on hand are used to support the Commercial Paper Program. As at December 31, 2004, the Corporation had no Commercial Paper outstanding (2003 – nil).
Long-term debt will mature as follows:
Years ending December 31, 2005 |
| $ | 248 |
| |
| 2006 |
| 305 |
| |
| 2007 |
| 55 |
| |
| 2008 |
| 208 |
| |
| 2009 |
| 40 |
| |
| thereafter |
| 581 |
| |
|
| $ | 1,437 |
| |
The weighted average interest rate on the long-term debt portfolio, including the effect of interest rate swap agreements, at December 31, 2004, was 4.87% (2003 – 4.37%).
At December 31, 2004, the fair market value of Falconbridge’s total debt, excluding the effect of interest rate swap agreements, was $1,507 million (2003 – $1,521 million).
On January 6, 2004, the Corporation filed a short form base shelf prospectus that provided for the issuance, during a twenty-five month period ending February 2006, of debt securities of up to $600 million. To date no amounts have been drawn under this arrangement.
7. INCOME AND MINING TAXES
(a) Consolidated income and mining taxes consist of the following:
Years ended December 31 |
| 2004 |
| 2003 |
| ||
Current |
|
|
|
|
| ||
Federal and provincial income taxes |
| $ | 5 |
| $ | 4 |
|
Foreign taxes |
| 91 |
| 34 |
| ||
|
| 96 |
| 38 |
| ||
Future |
|
|
|
|
| ||
Federal and provincial income taxes |
| 38 |
| (6 | ) | ||
Provincial mining taxes |
| 16 |
| 4 |
| ||
Foreign taxes |
| 98 |
| 27 |
| ||
|
| 152 |
| 25 |
| ||
|
| $ | 248 |
| $ | 63 |
|
(b) The difference between the amount of the reported consolidated income and mining taxes and the amount computed by multiplying the earnings before taxes by the Corporation’s applicable tax rates is reconciled as follows:
72
Years ended December 31 |
| 2004 |
| 2003 |
| ||
Taxes computed using the Corporation’s tax rates* |
| $ | 358 |
| $ | 101 |
|
Adjust for – |
|
|
|
|
| ||
Foreign tax rates, net (i) |
| (83 | ) | (41 | ) | ||
Currency translation adjustments |
| 13 |
| 12 |
| ||
Resource and depletion allowances |
| (22 | ) | (11 | ) | ||
Mining taxes |
| 16 |
| 6 |
| ||
Non-claimable expenses |
| 12 |
| 8 |
| ||
Non-taxable income |
| (4 | ) | (3 | ) | ||
Canadian income tax rate changes |
| — |
| (9 | ) | ||
Establishment of a previously unrecognized tax asset – Lomas Bayas |
| (14 | ) | — |
| ||
Other |
| (28 | ) | — |
| ||
Income and mining taxes |
| $ | 248 |
| $ | 63 |
|
*Federal and provincial income tax rates |
| 38.44 | % | 39.12 | % |
(i) The Corporation has foreign subsidiaries that have undistributed earnings on which no taxes have been provided. These earnings, which amount to approximately $541 million (2003 – $411 million), have been permanently reinvested outside Canada and are used to finance non-Canadian investments, and exploration and development projects.
(c) The components of the future income tax liability are as follows:
As at December 31 |
| 2004 |
| 2003 |
| ||
Future income and mining tax liabilities |
|
|
|
|
| ||
Development and preproduction |
| $ | 210 |
| $ | 175 |
|
Property, plant and equipment |
| 205 |
| 219 |
| ||
Foreign exchange |
| 33 |
| 9 |
| ||
Accrued witholding taxes |
| 67 |
| 32 |
| ||
Pensions |
| 23 |
| 5 |
| ||
Exploration |
| — |
| 2 |
| ||
Other |
| 22 |
| 5 |
| ||
|
| 560 |
| 447 |
| ||
Future income and mining tax assets |
|
|
|
|
| ||
Non-capital losses |
| 32 |
| 129 |
| ||
Post-retirement benefits |
| 66 |
| 58 |
| ||
Reclamation provisions |
| 45 |
| 19 |
| ||
Exploration |
| 15 |
| — |
| ||
Research and development |
| 21 |
| 16 |
| ||
Inventory obsolescence |
| 10 |
| 9 |
| ||
Other |
| 16 |
| 11 |
| ||
|
| 205 |
| 242 |
| ||
Net future income and mining tax liability |
| $ | 355 |
| $ | 205 |
|
8. EMPLOYEE FUTURE BENEFITS
Falconbridge has a number of defined benefit plans providing pension, health, dental and life insurance benefits for certain salaried and hourly-rated employees. Pension benefits are calculated based upon length of service and either final average pensionable earnings or a specified amount per year of service. Funding and pension plan assets (which consist principally of cash, equity securities and fixed income securities) for the defined benefit plans are primarily governed by the Ontario
Pension Benefits Act.
Falconbridge also has a number of capital accumulation plans. The Kidd Creek operations and Société Minière Raglan du Québec Ltée make monthly contributions on behalf of employees under a deferred profit sharing plan and a group RRSP respectively. In 2003, Falconbridge offered certain groups of office employees at the corporate office and Sudbury divisions the opportunity to switch from the current defined benefit plan to a defined contribution plan. Approximately 30% of eligible employees chose to make the switch with $7 million in assets to be allocated to the
73
defined contribution plan. Effective January 1, 2003, all new office employees are only eligible to join the defined contribution plan. Under the terms of this plan, Falconbridge contributes 5% of the employee’s pensionable earnings and matches 50% of employee’s contributions, up to 2% of the employee’s pensionable earnings.
The funded status of Falconbridge’s defined benefit pension plans and post-employment benefit plans other than pensions, are as follows:
Defined Benefit Pension Plans
As at December 31 |
| 2004 |
| 2003 |
| ||||||||||||||
| Plans where |
| Plans where |
| Net |
| Plans where assets exceed benefits |
| Plans where benefits exceed assets |
| Net |
| |||||||
Plan assets at fair value |
| $ | 25 |
| $ | 763 |
| $ | 788 |
| $ | 65 |
| $ | 587 |
| $ | 652 |
|
Projected benefit obligations |
| 12 |
| 957 |
| 969 |
| 51 |
| 787 |
| 838 |
| ||||||
Plan assets in excess of (less than) projected benefit obligations |
| $ | 13 |
| $ | (194 | ) | $ | (181 | ) | $ | 14 |
| $ | (200 | ) | $ | (186 | ) |
Other Benefit Plans
As at December 31 |
| 2004 |
| 2003 |
| ||||||||||||||
| Plans where |
| Plans where |
| Net |
| Plans where |
| Plans where |
| Net |
| |||||||
Plan assets at fair value |
| $ | 22 |
| $ | — |
| $ | 22 |
| $ | 18 |
| $ | — |
| $ | 18 |
|
Projected benefit obligations |
| 17 |
| 269 |
| 286 |
| 16 |
| 229 |
| 245 |
| ||||||
Plan assets in excess of (less than) projected benefit obligations |
| $ | 5 |
| $ | (269 | ) | $ | (264 | ) | $ | 2 |
| $ | (229 | ) | $ | (227 | ) |
The accrued asset, net of valuation allowance (liability) for employee future benefits on the Consolidated Statements of Financial Position, are as follows:
As at December 31 |
| 2004 |
| 2003 |
| ||
Defined pension plans |
| $ | 80 |
| $ | 21 |
|
Other benefit plans |
| (192 | ) | (171 | ) | ||
Employee future benefits |
| $ | (112 | ) | $ | (150 | ) |
Falconbridge’s post-retirement benefit expense included the following components:
Years ended December 31 |
| 2004 |
| 2003 |
| ||||||||
| Pension |
| Other |
| Pension |
| Other |
| |||||
Current service cost |
| $ | 10 |
| $ | 5 |
| $ | 11 |
| $ | 3 |
|
Interest cost |
| 52 |
| 15 |
| 52 |
| 13 |
| ||||
Expected return on plan assets |
| (46 | ) | (1 | ) | (40 | ) | (1 | ) | ||||
Amortization of: |
|
|
|
|
|
|
|
|
| ||||
Past service costs |
| 2 |
| — |
| 3 |
| — |
| ||||
Net actuarial losses |
| 13 |
| 3 |
| 14 |
| 2 |
| ||||
Valuation allowance provided against plan asset |
| (5 | ) | — |
| (3 | ) | — |
| ||||
Settlement losses |
| — |
| — |
| 2 |
| — |
| ||||
Defined benefit plan expense |
| 26 |
| 22 |
| 39 |
| 17 |
| ||||
Defined contribution plan expense |
| 8 |
| — |
| 8 |
| — |
| ||||
Post-employment benefit expense |
| $ | 34 |
| $ | 22 |
| $ | 47 |
| $ | 17 |
|
74
Reconciliation of Defined Benefit Expense recognized with
Defined Benefit Expense Incurred
In accordance with Section 3461 of the CICA Handbook, the expense recognized in the financial statements includes the amortization of gains and losses as well as past service costs arising in the current and prior periods. The table below reconciles the expense recognized with the expense incurred in each period. The expense incurred reflects the full amount of gains and losses and past service costs arising in the current period, and does not include the amortization of amounts realized in previous periods.
Years ended December 31 |
| 2004 |
| 2003 |
| ||||||||
| Pension |
| Other |
| Pension |
| Other |
| |||||
Defined benefit expense recognized |
| $ | 26 |
| $ | 22 |
| $ | 39 |
| $ | 17 |
|
Difference between: |
|
|
|
|
|
|
|
|
| ||||
Expected and actual return on plan assets |
| (18 | ) | — |
| (32 | ) | — |
| ||||
Actuarial losses (gains) amortized and actuarial losses (gains) arising |
| 44 |
| 12 |
| 38 |
| 41 |
| ||||
Past service costs amortized and past service costs arising |
| 4 |
| — |
| (3 | ) | 1 |
| ||||
Change in valuation allowance |
| 5 |
| — |
| 2 |
| — |
| ||||
Post-employment benefit expense “incurred” |
| $ | 61 |
| $ | 34 |
| $ | 44 |
| $ | 59 |
|
The change in the funded status of Falconbridge’s post-retirement benefit plans was as follows:
As at December 31 |
| 2004 |
| 2003 |
| ||||||||
| Pension |
| Other |
| Pension |
| Other |
| |||||
Projected benefit obligations |
|
|
|
|
|
|
|
|
| ||||
Balance at beginning of year |
| $ | 838 |
| $ | 246 |
| $ | 657 |
| $ | 165 |
|
Current service cost |
| 10 |
| 5 |
| 11 |
| 3 |
| ||||
Benefits paid |
| (61 | ) | (14 | ) | (58 | ) | (13 | ) | ||||
Interest cost |
| 52 |
| 15 |
| 52 |
| 13 |
| ||||
Actuarial losses |
| 56 |
| 14 |
| 52 |
| 43 |
| ||||
Settlements |
| — |
| — |
| (8 | ) | — |
| ||||
Amendments |
| 6 |
| — |
| — |
| — |
| ||||
Curtailments |
| 1 |
| — |
| — |
| — |
| ||||
Net transfers in |
| — |
| — |
| 1 |
| — |
| ||||
Effect of exchange rate changes |
| 67 |
| 20 |
| 131 |
| 34 |
| ||||
Projected benefit obligations at end of year |
| $ | 969 |
| $ | 286 |
| $ | 838 |
| $ | 245 |
|
Plan assets |
|
|
|
|
|
|
|
|
| ||||
Balance at beginning of year |
| $ | 652 |
| $ | 18 |
| $ | 481 |
| $ | 10 |
|
Actual return on plan assets |
| 63 |
| 1 |
| 72 |
| 1 |
| ||||
Employer contributions |
| 79 |
| 15 |
| 65 |
| 18 |
| ||||
Benefits paid |
| (61 | ) | (14 | ) | (55 | ) | (13 | ) | ||||
Settlements |
| — |
| — |
| (6 | ) | — |
| ||||
Net transfers in |
| — |
| — |
| 1 |
| — |
| ||||
Effect of exchange rate changes |
| 55 |
| 2 |
| 94 |
| 2 |
| ||||
Fair value of plan assets at end of year |
| $ | 788 |
| $ | 22 |
| $ | 652 |
| $ | 18 |
|
Plan deficit |
| $ | 181 |
| $ | 264 |
| $ | 186 |
| $ | 227 |
|
75
The total cash payments for the year made by Falconbridge to the benefit plans were as follows:
As at December 31 |
| 2004 |
| 2003 |
| ||||||||
| Pension |
| Other |
| Pension |
| Other |
| |||||
Defined benefit |
| $ | 79 |
| $ | 15 |
| $ | 65 |
| $ | 18 |
|
Defined contribution |
| 8 |
| — |
| 8 |
| — |
| ||||
Total |
| $ | 87 |
| $ | 15 |
| $ | 73 |
| $ | 18 |
|
A breakdown of the plan assets by major asset category was as follows:
As at December 31 |
| 2004 |
| 2003 |
| ||||
| Pension |
| Other |
| Pension |
| Other |
| |
Equity securities |
| 50 | % | — |
| 55 | % | — |
|
Debt securities |
| 50 | % | 100 | % | 45 | % | 100 | % |
Total |
| 100 | % | 100 | % | 100 | % | 100 | % |
The measurement date used for financial reporting purposes of the plan assets and benefit obligations is December 31. With respect to the significant Canadian pension plans, the most recent actuarial valuations required for funding purposes were prepared as of January 1, 2004 and the effective date of the next required funding actuarial valuations is January 1, 2005.
As at December 31 |
| 2004 |
| 2003 |
| ||||||||
| Pension |
| Other |
| Pension |
| Other |
| |||||
Reconciliation of projected benefit obligation to deficit |
|
|
|
|
|
|
|
|
| ||||
Accrued benefit (asset)/liability |
| $ | (80 | ) | $ | 192 |
| $ | (21 | ) | $ | 171 |
|
Unamortized past service costs |
| 5 |
| (1 | ) | 1 |
| 1 |
| ||||
Unamortized net actuarial losses |
| 256 |
| 73 |
| 212 |
| 55 |
| ||||
Accrued benefit liability |
| 181 |
| 264 |
| 192 |
| 227 |
| ||||
Valuation allowance |
| — |
| — |
| (6 | ) | — |
| ||||
Plan deficit |
| $ | 181 |
| $ | 264 |
| $ | 186 |
| $ | 227 |
|
The significant actuarial assumptions used in measuring Falconbridge’s pension and other benefit obligations and expense were as follows:
As at December 31 |
| 2004 |
| 2003 |
| 2004 |
| 2003 |
| ||
| Pension |
| Pension |
| Other |
| Other |
| |||
Weighted average assumptions used to calculate benefit expense |
|
|
|
|
|
|
|
|
| ||
Discount rate |
| 6.25 | % | 6.75 | % | 6.25 | % | 6.75 | % | ||
Expected long-term rate of return on plan assets |
| 7.00 | % | 7.00 | % |
|
|
|
| ||
Rate of compensation increase |
| 3.50 | % | 3.50 | % |
|
|
|
| ||
Weighted average assumptions used to calculate benefit obligation at end of year |
|
|
|
|
|
|
|
|
| ||
Discount rate |
| 5.75 | % | 6.25 | % | 5.75 | % | 6.25 | % | ||
Rate of compensation increase |
| 3.50 | % | 3.50 | % |
|
|
|
| ||
Effect of 1% increase in assumed health care cost trend rates |
|
|
|
|
|
|
|
|
| ||
Total of service and interest cost components |
|
|
|
|
| $ | 3 |
| $ | 2 |
|
Post-employment benefit obligation |
|
|
|
|
| 37 |
| 31 |
| ||
Effect of 1% decrease in assumed health care cost trend rates |
|
|
|
|
|
|
|
|
| ||
Total of service and interest cost components |
|
|
|
|
| $ | (2 | ) | $ | (2 | ) |
Post-employment benefit obligation |
|
|
|
|
| (30 | ) | (26 | ) | ||
The health care cost trend rate is assumed to start at 8.5% for 2004 (2003 – 9.0%), decreasing to an ultimate medical trend rate of 4.5% (2003 – 4.5%).
76
9. OTHER LONG-TERM LIABILITIES
Other long-term liabilities consist of the following:
As at December 31 |
| 2004 |
| 2003 |
| ||
Asset retirement obligations (a) |
| $ | 149 |
| $ | 132 |
|
Unrealized loss on interest rate swap contracts |
| 67 |
| — |
| ||
Unamortized deferred fair value loss on interest rate swaps |
| 20 |
| — |
| ||
Other |
| 11 |
| 15 |
| ||
|
| $ | 247 |
| $ | 147 |
|
(a) The business conducted by Falconbridge has been, and may in the future be, affected by changes in environmental legislation and other requirements including those related to asset retirement obligations and progressive site restoration costs. As Falconbridge operates in many countries, both the likelihood of changes in legislation and its impact upon Falconbridge are not predictable. Falconbridge’s policy is to meet and, if possible, surpass standards set by relevant legislation, through the application of innovative and technically proven economical measures in advance of prescribed deadlines. Falconbridge incurs substantial removal and site restoration costs on an ongoing basis, which, it believes, will mitigate future removal and site restoration costs. A long-term obligation, equal to the fair value of the legal obligation for asset retirement is recorded based on an annual assessment of projected asset retirement and progressive reclamation costs. The key assumptions on which the fair value of the asset retirement obligations is based include the estimated future cash flows, the timing of those cash flows, and the credit-adjusted risk-free rate or rates at which the estimated cash flows have been discounted. Falconbridge uses discount rates ranging from 5.0% to 6.5%. As of December 31, 2004, undiscounted cash outflows approximating $470 million are expected to occur over a period ranging from 1 to 62 years. Falconbridge will be subject to asset retirement obligations for its refinery in Norway, its power plant at Falcondo, as well as for the metallurgical facilities at Sudbury and Kidd Creek. However, these assets are not included in the provision for asset retirement as sufficient information is not available at this time to estimate the timing of settlement.
In view of the uncertainties concerning future asset retirement and progressive reclamation costs, the ultimate costs to Falconbridge could differ materially from the amounts estimated. The estimate for the future liability is subject to change based on amendments to applicable laws and legislation, the nature of ongoing operations and technological innovations. Future changes, if any, due to their nature and unpredictability, could have a significant impact and would be reflected prospectively, as a change in an accounting estimate.
The following table explains the change in the asset retirement obligations:
As at December 31 |
| 2004 |
| 2003 |
| ||
Asset retirement obligations, beginning of year |
| $ | 132 |
| $ | 98 |
|
Liabilities incurred |
| 5 |
| 18 |
| ||
Liabilities settled |
| (5 | ) | (9 | ) | ||
Gain on settlement of liabilities |
| (5 | ) | — |
| ||
Accretion expense |
| 8 |
| 7 |
| ||
Revisions in estimated cash flows |
| 7 |
| — |
| ||
Foreign exchange |
| 7 |
| 18 |
| ||
Asset retirement obligations, end of year |
| $ | 149 |
| $ | 132 |
|
77
10. SHARE CAPITAL
(a) Employee Stock Option Plan
The Corporation has a stock option plan, through which options may be granted to officers and employees for the purchase of common shares. Options are granted at prices equal to the closing market value on the last trading day or period prior to the grant. Stock options granted from 1997 through December 31, 1999 have a 10-year term and contain vesting provisions of 20% on the first anniversary date following the date of the grant, and a further 20% on each of the four subsequent anniversary dates. Stock options granted since January 1, 2000, have a 10-year term with the same vesting provisions; however, they also contain an accelerated vesting feature specifying that on the first day that the market price of the common shares is 20% greater than the exercise price of the option, the final tranche of unvested options outstanding on that date will immediately vest and be exercisable. In 2002, the Corporation amended the terms of its outstanding stock options to eliminate the cash settlement feature. Selling, general and administrative expenses for 2004 include compensation costs of $2 million (2003 – $2 million) relating to outstanding options granted since January 1, 2002.
During 2004, two stock option series were granted totaling 385,500 options having a weighted-average fair value of Cdn$11.19 per share. The compensation expense associated with these stock options series was calculated using the Black-Scholes valuation model assuming the following weighted-average parameters; 10-year term, 27% volatility, expected dividend of 1.65% annually and an interest rate of 4.52%. The stock option value is charged against earnings over its vesting period.
A summary of the status of the stock option plan and changes during the years is presented below:
As at December 31 |
| 2004 |
| 2003 |
| ||||||
| Options |
| Weighted-average |
| Options |
| Weighted-average |
| |||
|
| (000s) |
| (Cdn$) |
| (000s) |
| (Cdn$) |
| ||
Outstanding, beginning of year |
| 3,332 |
| $ | 18.21 |
| 4,413 |
| $ | 18.24 |
|
Granted |
| 386 |
| 30.62 |
| 760 |
| 16.73 |
| ||
Exercised |
| (978 | ) | 19.37 |
| (1,789 | ) | 17.64 |
| ||
Cancelled |
| (241 | ) | 19.07 |
| (52 | ) | 18.50 |
| ||
Outstanding, end of year |
| 2,499 |
| $ | 19.59 |
| 3,332 |
| $ | 18.21 |
|
The following table summarizes information about the stock options outstanding at December 31, 2004:
|
| Options outstanding |
| Options exercisable |
| ||||||||
Range of exercise prices (Cdn$) |
| Number (000s) |
| Weighted-average |
| Weighted-average |
| Number (000s) |
| Weighted-average |
| ||
|
|
|
|
|
| (Cdn$) |
|
|
| (Cdn$) |
| ||
$ 15.67 to $20.14 |
| 1,983 |
| 6.6 |
| $ | 16.85 |
| 750 |
| $ | 17.31 |
|
$ 26.25 to $32.00 |
| 516 |
| 7.5 |
| 30.10 |
| 206 |
| 29.30 |
| ||
$ 15.67 to $32.00 |
| 2,499 |
| 7.0 |
| $ | 19.59 |
| 956 |
| $ | 19.90 |
|
(b) Preferred Shares
On March 7, 1997, the Corporation issued 8,000,000 Units, at a price of Cdn$10.00 per Unit, with each unit consisting of one Cumulative Preferred Share Series 1 (the “Preferred Share Series 1”) and one Cumulative Preferred Share Series 2 Purchase Warrant (the “Warrant”). Since September 1, 1998, the quarterly cash dividend on Preferred Share Series 1 has been Cdn$0.02 per share. The holders of the Units had the right to acquire on certain dates, for each Unit held, one Cumulative Preferred Share Series 2 (the “Preferred Share Series 2”) of the Corporation by the combined effect of tendering for conversion one Preferred Share Series 1 and the exercise of one Warrant together with the cash payment of Cdn$15.00 per Warrant. A total of 7,910,165 warrants have been converted into Preferred Share Series 2. The remaining unexercised warrants cannot be exercised.
Until March 1, 2004, holders of the Preferred Share Series 2 were entitled to fixed cumulative preferential cash dividends, as and when declared by the Board of Directors, which accrued from the date of issue and were payable quarterly in the amount of Cdn$0.3672 per share or Cdn$1.4688 per share per annum. From March 1, 2004, the Preferred Share Series 2 are entitled to floating adjustable cumulative preferential cash dividends as and when declared by the Board of Directors.
78
Holders of Preferred Share Series 2 had the right to convert their shares into Cumulative Preferred Share Series 3 (the “Preferred Share Series 3”) of the Corporation, subject to certain conditions, on March 1, 2004, and will continue to have the right every five years thereafter. On March 1, 2004, the Corporation had the right to redeem for cash the Preferred Share Series 2, in whole but not in part, at the Corporation’s option, at Cdn$25.00 per share plus accrued and unpaid dividends. Subsequent to March 1, 2004, the Corporation has the right to redeem at any time for cash the Preferred Share Series 2, in whole but not in part, at the Corporation’s option, at Cdn$25.50 per share plus accrued and unpaid dividends. Effective March 1, 2004, the Preferred Share Series 2 shares pay a monthly adjustable floating dividend based on a percentage of the Canadian prime rate. A total of 3,122,882 units have been converted into Preferred Share Series 3.
Holders of Preferred Share Series 3 are entitled to fixed cumulative preferential cash dividends, as and when declared by the Board of Directors, which accrue from March 1, 2004. The dividends are payable quarterly on the first day of March, June, September, and December in the amount of Cdn$0.2863 per share or Cdn$1.1452 per share per annum until March 1, 2009. The Preferred Share Series 3 are not redeemable prior to March 1, 2009. The Preferred Share Series 3 will be redeemable on March 1, 2009 and on March 1 every fifth year thereafter, in whole but not in part, at the Corporation’s option, at Cdn$25.00 per share, together with accrued and unpaid dividends up to but excluding the date of redemption. Holders of Preferred Share Series 3, upon giving notice, will have the right to convert on March 1, 2009, and on March 1 in every fifth year thereafter, their shares into an equal number of Preferred Share Series 2, subject to the automatic conversion provisions.
(c) Earnings Per Common Share
Basic earnings per common share have been calculated after deducting preferred share dividends of $7 million (2003 – $9 million) and have been based on the weighted average number of common shares outstanding during the year of 179,550,277 shares (2003 – 177,674,710 shares). Diluted earnings per share, calculated using the treasury stock method, have been based on the weighted average number of common shares outstanding during the year of 180,512,236 shares (2003 –178,096,477 shares) after giving effect to the exercise of options.
(d) Repurchase of Common Shares
During 2003, the Corporation redeemed and cancelled a total of 600,000 common shares, having a book value of $5 million, realizing a loss of $1 million on the repurchase. There were no common shares redeemed in 2004.
(e) Deferred Share Unit Plan for Non-employee Directors
During 2002, the Corporation approved a deferred share unit plan for non-employee directors (DSUPD). Under the DSUPD, each eligible director may elect to be paid annual retainer fees and/or meeting attendance fees in deferred share units (DSU) rather than in cash. A DSU is a notional unit, equivalent to a common share. DSUs are credited with dividend equivalents when dividends are paid on the Corporation’s common shares. Payment of DSUs is made in cash or common shares after the director leaves the Board. As of December 31, 2004, a total of 17,806 DSUs (2003 – 10,264 DSUs) were held by participating directors.
11. INTEREST
Interest includes the following:
Years ended December 31 |
| 2004 |
| 2003 |
| ||
Interest on long-term debt |
| $ | 84 |
| $ | 81 |
|
Interest capitalized |
| (26 | ) | (16 | ) | ||
Net interest income on interest rate swap contracts |
| (14 | ) | (21 | ) | ||
Amortization of deferred gain on interest rate swap contracts |
| (7 | ) | — |
| ||
Other |
| 11 |
| 5 |
| ||
Interest expensed on long-term debt |
| 48 |
| 49 |
| ||
Interest income |
| (11 | ) | (6 | ) | ||
Interest |
| $ | 37 |
| $ | 43 |
|
79
12. COLLAHUASI JOINT VENTURE
Compañía Minera Doña Inés de Collahuasi S.C.M. (Collahuasi) is the corporation which owns the mining and water rights and other assets relating to the Collahuasi project, secures financing, conducts the operations, and markets the products of the property.
The Consolidated Financial Statements of Falconbridge include the Corporation’s 44% share of the financial position, operating results and cash flow of Collahuasi as follows:
As at December 31 |
| 2004 |
| 2003 |
| ||
Financial Position |
|
|
|
|
| ||
ASSETS |
|
|
|
|
| ||
Current assets |
| $ | 383 |
| $ | 143 |
|
Property, plant and equipment |
| 925 |
| 905 |
| ||
Other |
| 30 |
| 18 |
| ||
Total assets |
| $ | 1,338 |
| $ | 1,066 |
|
LIABILITIES AND SHAREHOLDERS’ EQUITY |
|
|
|
|
| ||
Current liabilities |
| $ | 179 |
| $ | 87 |
|
Long-term debt |
|
|
|
|
| ||
Senior debt |
| 242 |
| 226 |
| ||
Intercompany debt |
| 184 |
| 266 |
| ||
Other long-term liabilities |
| 200 |
| 106 |
| ||
Shareholders’ equity |
| 533 |
| 381 |
| ||
Total liabilities and shareholders’ equity |
| $ | 1,338 |
| $ | 1,066 |
|
Years ended December 31 |
| 2004 |
| 2003 |
| ||
Earnings |
|
|
|
|
| ||
Revenues |
| $ | 566 |
| $ | 275 |
|
Earnings for the year |
| 249 |
| 70 |
| ||
Cash Flow |
|
|
|
|
| ||
Cash Flow provided by (used in): |
|
|
|
|
| ||
Operating activities |
| $ | 272 |
| $ | 95 |
|
Investing activities |
| (20 | ) | (114 | ) | ||
Financing activities |
| (66 | ) | 9 |
| ||
Increase (decrease) in cash and cash equivalents |
| $ | 186 |
| $ | (10 | ) |
Current assets include cash of $264 million (2003 – $78 million) which is only available for use within the project.
During 2002, the Board of Directors of Compañía Minera Doña Inés de Collahuasi approved the construction of a new grinding circuit at the Ujina concentrator. This was part of the Ujina to Rosario transition project, which also involved transferring mine production from the Ujina to the Rosario orebody in the second quarter of 2004. The project increased Collahuasi’s concentrator design capacity to 110,000 tonnes per day. The total capital cost of the transition and concentrator expansion project was at $584 million, with Falconbridge’s 44% share of this cost totaling $257 million.
80
13. SEGMENTED DATA
Falconbridge operates in one industry – mining, processing and marketing of mineral products. These activities are conducted through six segments – the Integrated Nickel Operations (INO), Kidd Creek, Falcondo, Collahuasi, Lomas Bayas and Corporate. The INO includes the accounts of the Corporation and all of its wholly-owned subsidiaries engaged in the integrated operations of mining, milling, smelting, refining and marketing of metals mainly derived from Sudbury and Raglan nickel-copper ores and its custom feed business. Kidd Creek includes the mining, milling, smelting and refining of its own copper-zinc ores and its custom feed business. Falcondo mines, mills, smelts and refines its own nickel laterite ores. Collahuasi is a copper mine, in which Falconbridge owns 44%. Lomas Bayas mines and refines its own copper ores. Corporate includes general and administrative expenditures, exploration, research and development expenditures, foreign exchange gains and losses, and other income and expenses.
The accounting policies used by these segments are the same as those described in the Summary of Significant Accounting Policies in Note 1. Any sales and transfers between the segments are accounted for as if the sales or transfers were to third parties, that is, at current market prices. During the preparation of the financial statements the transfers between segments are eliminated.
As the products and services in each of the reportable segments, except for Corporate, are essentially the same, the reportable segments have been selected at the level where decisions are made on the provision of resources, capital and where performance is measured. For operations forming part of a reportable segment, performance is measured based on production targets, operating costs incurred and unit operating costs.
(a) Segmented information:
|
| Nickel |
| Copper |
|
|
|
|
| |||||||||||||
|
|
|
|
|
|
|
|
|
| Lomas |
| Corporate |
|
|
| |||||||
|
| INO |
| Falcondo |
| Kidd Creek |
| Collahuasi |
| Bayas |
| and other |
| Total |
| |||||||
Year ended December 31, 2004 |
|
|
|
|
|
|
|
|
|
|
|
|
|
|
| |||||||
Ownership |
| (100 | )% | (85.26 | )% | (100 | )% | (44 | )% | (100 | )% | (100 | )% |
|
| |||||||
Revenues(a) |
| $ | 1,429 |
| $ | 406 |
| $ | 486 |
| $ | 566 |
| $ | 183 |
| $ | — |
| $ | 3,070 |
|
Operating income (loss) |
| 442 |
| 181 |
| (45 | ) | 361 |
| 95 |
| (65 | ) | 969 |
| |||||||
Working capital |
| 415 |
| 56 |
| 29 |
| 386 |
| 84 |
| (37 | ) | 933 |
| |||||||
Depreciation and amortization |
| 120 |
| 10 |
| 68 |
| 58 |
| 16 |
| 2 |
| 274 |
| |||||||
Property, plant & equipment |
| 1,071 |
| 114 |
| 834 |
| 1,031 |
| 137 |
| 8 |
| 3,195 |
| |||||||
Capital expenditures & deferred project costs |
| 297 |
| 19 |
| 160 |
| 81 |
| 16 |
| — |
| 573 |
| |||||||
Year ended December 31, 2003 |
|
|
|
|
|
|
|
|
|
|
|
|
|
|
| |||||||
Ownership |
| (100 | )% | (85.26 | )% | (100 | )% | (44 | )% | (100 | )% | (100 | )% |
|
| |||||||
Revenues(a) |
| $ | 1,046 |
| $ | 252 |
| $ | 396 |
| $ | 275 |
| $ | 114 |
| $ | — |
| $ | 2,083 |
|
Operating income (loss) |
| 224 |
| 59 |
| (68 | ) | 115 |
| 32 |
| (61 | ) | 301 |
| |||||||
Working capital |
| 348 |
| 25 |
| 28 |
| 80 |
| 30 |
| 138 |
| 649 |
| |||||||
Depreciation and amortization |
| 124 |
| 10 |
| 48 |
| 50 |
| 15 |
| 2 |
| 249 |
| |||||||
Property, plant & equipment |
| 958 |
| 104 |
| 743 |
| 1,018 |
| 134 |
| 13 |
| 2,970 |
| |||||||
Capital expenditures & deferred project costs |
| 97 |
| 13 |
| 97 |
| 151 |
| 12 |
| — |
| 370 |
| |||||||
|
|
|
| Dominican |
|
|
|
|
|
|
|
|
|
|
| |||||||
Principal base of operations |
| Canada |
| Republic |
| Canada |
| Chile |
| Chile |
| Canada |
|
|
| |||||||
(a)Inter-segment sales are eliminated during the preparation of the Consolidated Financial Statements.
81
(b) Identifiable assets by geographic location are as follows:
|
| Total |
| Total |
| Property, plant |
| Property, plant |
| ||||
|
| assets |
| assets |
| and equipment |
| and equipment |
| ||||
As at December 31 |
| 2004 |
| 2003 |
| 2004 |
| 2003 |
| ||||
Canada |
| $ | 2,418 |
| $ | 2,061 |
| $ | 1,778 |
| $ | 1,576 |
|
Chile |
| 1,741 |
| 1,379 |
| 1,146 |
| 1,132 |
| ||||
Barbados |
| 203 |
| 124 |
| 2 |
| 2 |
| ||||
Norway |
| 158 |
| 159 |
| 145 |
| 148 |
| ||||
Dominican Republic |
| 301 |
| 216 |
| 114 |
| 104 |
| ||||
Other |
| 297 |
| 233 |
| 10 |
| 8 |
| ||||
|
| $ | 5,118 |
| $ | 4,172 |
| $ | 3,195 |
| $ | 2,970 |
|
(c) Consolidated sales revenues:
(i) By geographic location of customers:
Years ended December 31 |
| 2004 |
| 2003 |
| ||||||
|
| Amount |
| % |
| Amount |
| % |
| ||
Europe |
| $ | 1,189 |
| 39 |
| $ | 891 |
| 43 |
|
U.S. |
| 838 |
| 27 |
| 554 |
| 27 |
| ||
Other |
| 786 |
| 26 |
| 465 |
| 22 |
| ||
Total foreign* |
| 2,813 |
| 92 |
| 1,910 |
| 92 |
| ||
Canada |
| 257 |
| 8 |
| 173 |
| 8 |
| ||
|
| $ | 3,070 |
| 100 |
| $ | 2,083 |
| 100 |
|
*Includes sales by Canadian |
|
|
|
|
|
|
|
|
| ||
operations to foreign customers |
| $ | 1,246 |
|
|
| $ | 957 |
|
|
|
(ii) By product category:
Years ended December 31 |
|
|
| 2004 |
|
|
| 2003 |
| ||
|
| Amount |
| % |
| Amount |
| % |
| ||
Nickel |
| $ | 1,000 |
| 33 |
| $ | 768 |
| 37 |
|
Ferronickel |
| 406 |
| 13 |
| 252 |
| 12 |
| ||
Copper |
| 1,166 |
| 38 |
| 691 |
| 33 |
| ||
Zinc |
| 144 |
| 5 |
| 100 |
| 5 |
| ||
Cobalt |
| 180 |
| 6 |
| 71 |
| 3 |
| ||
Palladium |
| 31 |
| 1 |
| 35 |
| 2 |
| ||
Other |
| 143 |
| 4 |
| 166 |
| 8 |
| ||
|
| $ | 3,070 |
| 100 |
| $ | 2,083 |
| 100 |
|
14. FINANCIAL INSTRUMENTS
Falconbridge has an approved financial risk management policy addressing the philosophy, implementation and control of financial risk management and investment activities. Falconbridge manages its exposures by entering into contractual arrangements (derivatives) which reduce (hedge) the exposures by creating an offsetting position. The following is a summary of these hedge positions.
Balance Sheet Economic Hedges
Falconbridge has monetary assets and liabilities denominated in currencies other than the U.S. dollar. The Corporation uses foreign currency forward contracts to offset the exposure from fluctuations in foreign exchange rates. The following is a summary of foreign currency forward contracts:
82
As at December 31 |
| 2004 |
| 2003 |
|
Canadian dollar net liability exposure |
|
|
|
|
|
US$ forward contracts (millions) |
| 429 |
| 385 |
|
Average price (US$) |
| 1.2120 |
| 1.3236 |
|
Contract amount (in Cdn$ millions) |
| 520 |
| 510 |
|
Fair value (in US$ millions) |
| 3 |
| 9 |
|
With maturity dates up to: |
| March 2005 |
|
|
|
Expenditure Hedges
Falconbridge incurs expenses, denominated in foreign currencies, which expose it to increased volatility in earnings due to fluctuations in foreign exchange rates. Falconbridge uses foreign currency forward exchange contracts and options to reduce these exposures by creating an offsetting position. Following is a summary of these hedge positions:
As at December 31 |
| 2004 |
| 2003 |
|
Forward exchange contracts |
|
|
|
|
|
Canadian dollar expenditures |
|
|
|
|
|
US$ forward contracts (millions) |
| 198 |
| 426 |
|
Average price (US$) |
| 1.3835 |
| 1.4941 |
|
Contract amount (in Cdn$ millions) |
| 274 |
| 636 |
|
Fair value (in US$ millions) |
| 30 |
| 62 |
|
With maturity dates up to: |
| December 2005 |
|
|
|
|
|
|
|
|
|
Chilean peso expenditures |
|
|
|
|
|
US$ forward contracts (millions) |
| 9 |
| 47 |
|
Average price (US$) |
| 708 |
| 726 |
|
Contract amount (in CHP millions) |
| 6,538 |
| 34,238 |
|
Fair value (in US$ millions) |
| 3 |
| 10 |
|
With maturity dates up to: |
| September 2005 |
|
|
|
|
|
|
|
|
|
Norwegian kroner expenditures |
|
|
|
|
|
US$ forward contracts (millions) |
| — |
| 33 |
|
Average price (US$) |
| — |
| 7.9841 |
|
Contract amount (in NOK millions) |
| — |
| 267 |
|
Fair value (in US$ millions) |
| — |
| 6 |
|
|
|
|
|
|
|
Option contracts |
|
|
|
|
|
Canadian dollar expenditures |
|
|
|
|
|
Option amount (in Cdn$ millions) |
| 50 |
| 30 |
|
Fair value (in US$ millions) |
| 1 |
| 1 |
|
With maturity dates up to: |
| December 2005 |
|
|
|
|
|
|
|
|
|
Norwegian kroner expenditures |
|
|
|
|
|
Option amount (in NOK millions) |
| 135 |
| 210 |
|
Fair value (in US$ millions) |
| 1 |
| 1 |
|
With maturity dates up to: |
| September 2005 |
|
|
|
83
Interest Rate Risk Management
Falconbridge is exposed to interest rate risk as a result of its issuance of debt. Falconbridge reduces its borrowing costs and hedges its exposure to interest rate risk through the use of interest rate swaps and interest rate swap options. The differential to be paid or received, on interest rate swaps, for which Falconbridge received hedge accounting, is accrued and recognized as an adjustment to interest expense related to the debt. The net interest on other swaps is reflected in the financial statements as other expenses/(income). Following is a summary of the hedge positions:
Interest rate swap contracts at December 31, 2004 |
| Total(1) |
|
Maturity (2005) |
| 400 |
|
Maturity (2006) |
| 325 |
|
Maturity (2008)(2) |
| 136 |
|
Maturity (2012) |
| 350 |
|
Maturity (2015) |
| 150 |
|
Fair value (3) |
| 66 |
|
1. Notional principal amount of maturities and fair value are in millions of U.S. dollars.
2. Includes cross currency interest rate swaps (with a notional amount of $111 million) designated as a hedge of the Canadian dollar debenture. The total fair value of these instruments at December 31, 2004 was $46 million, of which $34 million related to the currency component of the swap and $12 million related to the interest component.
3. Includes the total fair value of $34 million related to the cross currency interest rate swap discussed before.
Energy Price Management
Falconbridge hedges a portion of the cost of electricity of its operations in Canada and Norway. The following tables summarize outstanding contracts for the year:
Canadian electricity contracts |
| 2005 |
| 2006 |
| 2007 |
|
Rate Cdn$/MWh |
| 50.82 |
| 52.78 |
| 52.65 |
|
Amount (MW) |
| 125 |
| 92 |
| 21 |
|
Fair value (in Cdn$ millions) |
| 5 |
| 3 |
| 1 |
|
Norwegian electricity |
|
|
|
|
|
|
|
|
|
|
|
|
|
contracts |
| 2005 |
| 2006 |
| 2007 |
| 2008 |
| 2009 |
| Thereafter |
|
Rate NOK/MWh |
| 183.5 |
| 191.4 |
| 198.5 |
| 205.8 |
| 211.1 |
| 215.1 |
|
Amount (MW) |
| 55.9 |
| 55.9 |
| 50.9 |
| 45.9 |
| 45.9 |
| 20.2 |
|
Fair value (in NOK millions) |
| 8 |
| 15 |
| 11 |
| 8 |
| 9 |
| 38 |
|
Discretionary Trading
Falconbridge’s risk management policy provides for the limited use of financial instruments for discretionary trading purposes. In the normal course of business, Falconbridge has traditionally maintained a limited amount of financial instruments for discretionary trading purposes. Falconbridge had no outstanding contracts used for discretionary trading at December 31, 2004 and December 31, 2003.
Fair Value of Primary Financial Instruments
The fair value of Falconbridge’s primary financial instruments, including cash and cash equivalents, accounts and metals settlements receivable, and accounts payable and accrued charges approximates their carrying value due to the short-term nature of these instruments. The fair value of the long-term debt is disclosed in Note 6.
Credit Risk
Falconbridge does not consider the credit risk associated with its financial instruments to be significant. Foreign currency and interest rate swap contracts are maintained with high quality counter-parties and Falconbridge does not anticipate that any counter-parties will fail to meet their obligation. Falconbridge does not have significant exposure to any individual customer and these risks are further managed through a highly effective credit management program. Falconbridge’s risk management policy only allows short-term investments in high-quality debt obligations.
84
15. RELATED-PARTY TRANSACTIONS
At December 31, 2004, Noranda Inc. (Noranda) owned, directly and indirectly, approximately 58.8% of the common shares of the Corporation. Falconbridge has entered into an agreement with a subsidiary of Noranda, whereby it acts as a sales agent for all products, other than sulphuric acid and indium, produced at Kidd Creek operations. Falconbridge has entered into a supply agreement with another subsidiary of Noranda, which will purchase and resell the output of sulphuric acid. Accounts and metals settlements receivable, in the Consolidated Statements of Financial Position, includes $43 million (2003 – $30 million) in receivables from Noranda relating to amounts being collected under the sales agreements and $nil (2003 – $13 million) from net purchases of material by Noranda. Accounts payable and accrued charges, in the Consolidated Statements of Financial Position, include $28 million (2003 – $35 million) for the purchase of materials from Noranda.
Falconbridge has agreements with various Noranda Group of Companies for the purchase of custom feeds; the toll treatment of copper concentrates, blister copper and refinery slimes; and the sale of metals. The following table details related-party production and marketing transactions with Noranda Group of Companies:
Years ended December 31 |
| 2004 |
| 2003 |
| ||
Sale of materials and technology to Noranda(a) |
| $ | 121 |
| $ | 98 |
|
Purchase of materials from and smelting and refining fees paid to Noranda(b) |
| 140 |
| 159 |
| ||
Commissions and agency fees paid to Noranda(c) |
| 1 |
| 1 |
| ||
Net fees received relating to sulphuric acid from Noranda(a) |
| 7 |
| 2 |
| ||
Included in Falconbridge’s Consolidated Statements of Earnings in (a) Revenues; (b) Costs of metal and other product sales; (c) Selling, general and administrative.
In an effort to maximize synergies, certain operations of Noranda and Falconbridge are integrated including the combination of various corporate support services and merged management teams. Arrangements between Falconbridge and the Noranda Group of Companies are negotiated in the best interest of both parties, on an arms length basis at market terms.
16. OTHER EXPENSES/(INCOME)
Other expenses/(income) include the following:
Years ended December 31 |
| 2004 |
| 2003 |
| ||
Foreign exchange loss |
| $ | 16 |
| $ | 17 |
|
Metals trading loss (gain) |
| 2 |
| (11 | ) | ||
Net interest income on interest rate swaps not designated as hedges |
| (6 | ) | — |
| ||
Other income |
| (7 | ) | (8 | ) | ||
Other expenses/(income) |
| $ | 5 |
| $ | (2 | ) |
17. COMMITMENTS AND CONTINGENCIES
(a) The Corporation has received an exemption granted by the Ontario government, until December 31, 2009, from a requirement to refine in Canada ores mined from certain properties of the Corporation in Ontario. This exemption is limited to the quantity of nickel-copper matte capable of yielding not more than 100 million pounds of refined nickel per year.
(b) Effective January 1, 2003, Falconbridge adopted AcG 14, “Disclosure of Guarantees”, issued by the Canadian Institute of Chartered Accountants, which expands previously issued accounting guidance and requires additional disclosure by the guarantor in its interim and annual financial statements. In the normal course of business, Falconbridge enters into numerous agreements that
85
contain indemnification commitments and may contain other features that meet the expanded definition of guarantees. The terms of these indemnification agreements will vary based on the contract and typically do not provide for any limit on the maximum potential liability. Historically, Falconbridge has not made any significant payments under such indemnifications and no amounts have been accrued in the financial statements with respect to these indemnification commitments.
(c) In the normal course of business, Falconbridge may enter into contractual agreements with suppliers for project-related equipment where there may be a long lead delivery schedule.
(d) From time to time, Falconbridge is involved in litigation, investigations or proceedings relating to claims arising out of its operations in the ordinary course of business. In the opinion of management, the aggregate amount of any potential liability is not expected to have a material adverse effect on Falconbridge’s financial position or results.
18. COMPARATIVE AMOUNTS
Certain of the comparative figures have been restated to conform to the current year’s presentation, including the restatement outlined in Note 2.
86
(UNAUDITED – IN MILLIONS OF US$, EXCEPT PER SHARE DATA) |
| 2004 |
| 2003 |
| 2002 |
| 2001 |
| 2000 |
| |||
Operating results |
|
|
|
|
|
|
|
|
|
|
| |||
Revenues |
| 3,070 |
| 2,083 |
| 1,525 |
| 1,385 |
| 1,766 |
| |||
EBITDA(1) |
| 1,243 |
| 550 |
| 313 |
| 231 |
| 561 |
| |||
Depreciation and amortization |
| 274 |
| 249 |
| 234 |
| 210 |
| 194 |
| |||
Earnings for the year |
| 672 |
| 191 |
| 52 |
| 16 |
| 254 |
| |||
Operating cash flow |
| 968 |
| 444 |
| 233 |
| 231 |
| 446 |
| |||
Capital expenditures and deferred project costs |
| 573 |
| 370 |
| 234 |
| 225 |
| 168 |
| |||
Per common share data |
|
|
|
|
|
|
|
|
|
|
| |||
Net income (US$) |
| 3.71 |
| 1.03 |
| 0.25 |
| 0.05 |
| 1.39 |
| |||
Cash dividends (Cdn$) |
| 0.40 |
| 0.40 |
| 0.40 |
| 0.40 |
| 0.40 |
| |||
Operating cash flow (US$) |
| 5.38 |
| 2.48 |
| 1.32 |
| 1.31 |
| 2.52 |
| |||
Number of common shares issued at end of year (000s) |
| 179,770 |
| 178,792 |
| 177,603 |
| 176,977 |
| 176,977 |
| |||
Financial position |
|
|
|
|
|
|
|
|
|
|
| |||
Cash and equivalents |
| 645 |
| 298 |
| 165 |
| 125 |
| 167 |
| |||
Total assets |
| 5,118 |
| 4,172 |
| 3,453 |
| 3,342 |
| 3,349 |
| |||
Working capital |
| 933 |
| 649 |
| 443 |
| 356 |
| 470 |
| |||
Property, plant and equipment, net |
| 3,195 |
| 2,970 |
| 2,616 |
| 2,610 |
| 2,542 |
| |||
Long-term debt |
| 1,437 |
| 1,427 |
| 1,280 |
| 1,172 |
| 990 |
| |||
Shareholders’ equity |
| 2,563 |
| 1,938 |
| 1,530 |
| 1,511 |
| 1,639 |
| |||
Total liabilities |
| 2,555 |
| 2,234 |
| 1,923 |
| 1,831 |
| 1,710 |
| |||
|
|
|
|
|
|
|
|
|
|
|
| |||
Net debt/net debt plus equity |
| 24 | % | 37 | % | 42 | % | 41 | % | 33 | % | |||
Return on common shareholders’ equity |
| 31 | % | 11 | % | 3 | % | 1 | % | 16 | % | |||
Return on net assets employed |
| 31 | % | 13 | % | 3 | % | 1 | % | 14 | % | |||
Production statistics (tonnes) |
|
|
|
|
|
|
|
|
|
|
| |||
Mine Nickel | – Sudbury |
| 22,602 |
| 24,143 |
| 27,833 |
| 25,226 |
| 23,234 |
| ||
| – Raglan |
| 26,552 |
| 25,110 |
| 24,636 |
| 24,570 |
| 23,089 |
| ||
| – Montcalm |
| 2,152 |
| — |
| — |
| — |
| — |
| ||
| – Falcondo |
| 29,477 |
| 27,227 |
| 23,303 |
| 21,662 |
| 27,830 |
| ||
|
| 80,783 |
| 76,480 |
| 75,772 |
| 71,458 |
| 74,153 |
| |||
Refined Nickel | – Nikkelverk |
| 71,410 |
| 77,183 |
| 68,530 |
| 68,221 |
| 58,679 |
| ||
| – Falcondo |
| 29,477 |
| 27,227 |
| 23,303 |
| 21,662 |
| 27,830 |
| ||
|
| 100,887 |
| 104,410 |
| 91,833 |
| 89,883 |
| 86,509 |
| |||
Mine Copper | – Sudbury |
| 24,694 |
| 29,161 |
| 31,050 |
| 22,858 |
| 20,990 |
| ||
| – Raglan |
| 6,867 |
| 6,628 |
| 6,500 |
| 6,915 |
| 6,308 |
| ||
| – Kidd Creek |
| 41,029 |
| 46,409 |
| 45,434 |
| 42,340 |
| 54,926 |
| ||
| – Collahuasi |
| 205,116 |
| 168,578 |
| 185,014 |
| 193,135 |
| 186,073 |
| ||
| – Lomas Bayas |
| 62,041 |
| 60,427 |
| 59,304 |
| 24,702 |
| — |
| ||
| – Montcalm |
| 1,188 |
| — |
| — |
| — |
| — |
| ||
|
| 340,935 |
| 311,203 |
| 327,302 |
| 289,950 |
| 268,297 |
| |||
Refined Copper | – Nikkelverk |
| 35,643 |
| 35,852 |
| 30,632 |
| 26,722 |
| 25,307 |
| ||
| – Kidd Creek |
| 115,578 |
| 132,364 |
| 146,526 |
| 127,824 |
| 122,987 |
| ||
| – Collahuasi |
| 25,610 |
| 27,895 |
| 26,678 |
| 26,180 |
| 25,579 |
| ||
| – Lomas Bayas |
| 62,041 |
| 60,427 |
| 59,304 |
| 24,702 |
| — |
| ||
|
| 238,872 |
| 256,538 |
| 263,140 |
| 205,428 |
| 173,873 |
| |||
(1) EBITDA – represents earnings before interest, income and mining taxes, depreciation and amortization, and non-controlling interest.
87
Consolidated Results – 2004 and 2003 by Quarters
|
| 2004 |
| ||||||||
(UNAUDITED – IN MILLIONS OF US$, EXCEPT PER SHARE DATA) |
| 1st Qtr. |
| 2nd Qtr. |
| 3rd Qtr. |
| ||||
OPERATIONS |
|
|
|
|
|
|
| ||||
Revenues |
| $ | 734 |
| $ | 704 |
| $ | 756 |
| |
Operating expenses |
|
|
|
|
|
|
| ||||
Costs of sales |
|
|
|
|
|
|
| ||||
Costs of metal and other product sales |
| 404 |
| 407 |
| 400 |
| ||||
Depreciation of plant and equipment |
| 41 |
| 46 |
| 35 |
| ||||
Amortization of development and preproduction expenditures |
| 16 |
| 21 |
| 24 |
| ||||
|
| 461 |
| 474 |
| 459 |
| ||||
Selling, general and administrative |
| 24 |
| 30 |
| 28 |
| ||||
Exploration |
| 3 |
| 5 |
| 8 |
| ||||
Research and process development |
| 2 |
| 3 |
| 3 |
| ||||
Other (income)/expenses |
| (23 | ) | 3 |
| 22 |
| ||||
|
| 467 |
| 515 |
| 520 |
| ||||
Operating income |
| 267 |
| 189 |
| 236 |
| ||||
Interest |
| 10 |
| 6 |
| 11 |
| ||||
Earnings before taxes and non-controlling interest |
| 257 |
| 183 |
| 225 |
| ||||
Income and mining taxes |
| 69 |
| 41 |
| 67 |
| ||||
Non-controlling interest in earnings of subsidiary |
| 4 |
| 3 |
| 3 |
| ||||
Earnings for the period |
| 184 |
| 139 |
| 155 |
| ||||
Dividends on preferred shares |
| 2 |
| 1 |
| 2 |
| ||||
Earnings attributable to common shares |
| $ | 182 |
| $ | 138 |
| $ | 153 |
| |
Basic earnings per common share (Note 1) |
| $ | 1.02 |
| $ | 0.77 |
| $ | 0.85 |
| |
Diluted earnings per common share (Note 1) |
| $ | 1.01 |
| $ | 0.76 |
| $ | 0.85 |
| |
Basic weighted average number of shares outstanding (thousands) |
| 179,177 |
| 179,567 |
| 179,696 |
| ||||
Diluted weighted average number of shares outstanding (thousands) |
| 180,450 |
| 180,584 |
| 180,661 |
| ||||
EARNINGS (LOSS) CONTRIBUTIONS |
|
|
|
|
|
|
| ||||
Principal operations – |
|
|
|
|
|
|
| ||||
Integrated Nickel Operations (INO) |
| $ | 131 |
| $ | 90 |
| $ | 106 |
| |
Falconbridge Dominicana, C. por A. |
| 55 |
| 44 |
| 40 |
| ||||
Nickel Operations |
| 186 |
| 134 |
| 146 |
| ||||
Kidd Creek Operations |
| 3 |
| (19 | ) | (15 | ) | ||||
Collahuasi |
| 45 |
| 73 |
| 124 |
| ||||
Lomas Bayas |
| 24 |
| 22 |
| 23 |
| ||||
Copper Operations |
| 72 |
| 76 |
| 132 |
| ||||
Corporate and other (Note 2) |
| 9 |
| (21 | ) | (42 | ) | ||||
Operating income |
| 267 |
| 189 |
| 236 |
| ||||
Interest |
| 10 |
| 6 |
| 11 |
| ||||
Income and mining taxes |
| 69 |
| 41 |
| 67 |
| ||||
Non-controlling interest in earnings of subsidiary |
| 4 |
| 3 |
| 3 |
| ||||
Earnings for the period |
| 184 |
| 139 |
| 155 |
| ||||
Dividends on preferred shares |
| 2 |
| 1 |
| 2 |
| ||||
Earnings attributable to common shares |
| $ | 182 |
| $ | 138 |
| $ | 153 |
| |
Basic earnings per common share (Note 1) |
| $ | 1.02 |
| $ | 0.77 |
| $ | 0.85 |
| |
Diluted earnings per common share (Note 1) |
| $ | 1.01 |
| $ | 0.76 |
| $ | 0.85 |
| |
METAL SALES (tonnes, except precious metal revenues and silver) |
|
|
|
|
|
|
| ||||
INO | – Nickel |
| 18,118 |
| 18,025 |
| 15,432 |
| |||
| – Copper |
| 13,197 |
| 11,464 |
| 13,875 |
| |||
| – Precious metal revenues (thousands) |
| $ | 21,727 |
| $ | 26,718 |
| $ | 24,436 |
|
Kidd Creek | – Zinc (including metal in concentrate) |
| 26,525 |
| 33,670 |
| 34,501 |
| |||
| – Copper (including metal in concentrate) |
| 28,969 |
| 15,834 |
| 23,040 |
| |||
| – Silver (thousands of troy ounces) |
| 1,004 |
| 1,143 |
| 949 |
| |||
Nickel in ferronickel |
| 6,777 |
| 7,808 |
| 6,247 |
| ||||
Collahuasi | – Copper (including metal in concentrate) |
| 28,879 |
| 47,077 |
| 62,013 |
| |||
Lomas Bayas | – Copper |
| 15,036 |
| 13,645 |
| 16,271 |
| |||
AVERAGE PRICES REALIZED (US$/lb., except silver) |
|
|
|
|
|
|
| ||||
Nickel |
| $ | 6.88 |
| $ | 5.76 |
| $ | 6.54 |
| |
Ferronickel |
| 6.80 |
| 5.85 |
| 6.49 |
| ||||
Copper |
| 1.21 |
| 1.21 |
| 1.29 |
| ||||
Zinc |
| 0.52 |
| 0.51 |
| 0.48 |
| ||||
Silver (US$/oz.) |
| 6.42 |
| 6.22 |
| 6.06 |
| ||||
Note: 1. See Note 10(c) to the Consolidated Financial Statements.
2. Corporate and other costs include general and administrative and exploration expenditures, foreign exchange gains or losses on U.S. dollar debt and other expenses/(income).
88
|
| 2004 |
| 2003 |
| ||||||||||||||||||
|
| 4th Qtr. |
| Year |
| 1st Qtr. |
| 2nd Qtr. |
| 3rd Qtr. |
| 4th Qtr. |
| Year |
| ||||||||
OPERATIONS |
|
|
|
|
|
|
|
|
|
|
|
|
|
|
| ||||||||
Revenues |
| $ | 876 |
| $ | 3,070 |
| $ | 472 |
| $ | 490 |
| $ | 485 |
| $ | 636 |
| $ | 2,083 |
| |
Operating expenses |
|
|
|
|
|
|
|
|
|
|
|
|
|
|
| ||||||||
Costs of sales |
|
|
|
|
|
|
|
|
|
|
|
|
|
|
| ||||||||
Costs of metal and other product sales |
| 471 |
| 1,682 |
| 332 |
| 340 |
| 352 |
| 389 |
| 1,413 |
| ||||||||
Depreciation of plant and equipment |
| 70 |
| 192 |
| 41 |
| 51 |
| 43 |
| 44 |
| 179 |
| ||||||||
Amortization of development and preproduction expenditures |
| 21 |
| 82 |
| 16 |
| 17 |
| 18 |
| 19 |
| 70 |
| ||||||||
|
| 562 |
| 1,956 |
| 389 |
| 408 |
| 413 |
| 452 |
| 1,662 |
| ||||||||
Selling, general and administrative |
| 26 |
| 108 |
| 21 |
| 23 |
| 19 |
| 23 |
| 86 |
| ||||||||
Exploration |
| 4 |
| 20 |
| 2 |
| 8 |
| 8 |
| 5 |
| 23 |
| ||||||||
Research and process development |
| 4 |
| 12 |
| 2 |
| 2 |
| 3 |
| 6 |
| 13 |
| ||||||||
Other (income)/expenses |
| 3 |
| 5 |
| (3 | ) | (1 | ) | 9 |
| (7 | ) | (2 | ) | ||||||||
|
| 599 |
| 2,101 |
| 411 |
| 440 |
| 452 |
| 479 |
| 1,782 |
| ||||||||
Operating income |
| 277 |
| 969 |
| 61 |
| 50 |
| 33 |
| 157 |
| 301 |
| ||||||||
Interest |
| 10 |
| 37 |
| 12 |
| 13 |
| 12 |
| 6 |
| 43 |
| ||||||||
Earnings before taxes and non-controlling interest |
| 267 |
| 932 |
| 49 |
| 37 |
| 21 |
| 151 |
| 258 |
| ||||||||
Income and mining taxes |
| 71 |
| 248 |
| 11 |
| (3 | ) | 1 |
| 54 |
| 63 |
| ||||||||
Non-controlling interest in earnings of subsidiary |
| 2 |
| 12 |
| — |
| 1 |
| 1 |
| 2 |
| 4 |
| ||||||||
Earnings for the period |
| 194 |
| 672 |
| 38 |
| 39 |
| 19 |
| 95 |
| 191 |
| ||||||||
Dividends on preferred shares |
| 2 |
| 7 |
| 2 |
| 2 |
| 2 |
| 3 |
| 9 |
| ||||||||
Earnings attributable to common shares |
| $ | 192 |
| $ | 665 |
| $ | 36 |
| $ | 37 |
| $ | 17 |
| $ | 92 |
| $ | 182 |
| |
Basic earnings per common share (Note 1) |
| $ | 1.07 |
| $ | 3.71 |
| $ | 0.20 |
| $ | 0.21 |
| $ | 0.10 |
| $ | 0.52 |
| $ | 1.03 |
| |
Diluted earnings per common share (Note 1) |
| $ | 1.07 |
| $ | 3.69 |
| $ | 0.20 |
| $ | 0.21 |
| $ | 0.10 |
| $ | 0.51 |
| $ | 1.02 |
| |
Basic weighted average number of shares outstanding (thousands) |
| 179,758 |
| 179,550 |
| 177,607 |
| 177,165 |
| 177,506 |
| 178,153 |
| 177,675 |
| ||||||||
Diluted weighted average number of shares outstanding (thousands) |
| 180,676 |
| 180,512 |
| 177,640 |
| 177,303 |
| 178,030 |
| 179,156 |
| 178,096 |
| ||||||||
EARNINGS (LOSS) CONTRIBUTIONS |
|
|
|
|
|
|
|
|
|
|
|
|
|
|
| ||||||||
Principal operations – |
|
|
|
|
|
|
|
|
|
|
|
|
|
|
| ||||||||
Integrated Nickel Operations (INO) |
| $ | 115 |
| $ | 442 |
| $ | 44 |
| $ | 46 |
| $ | 31 |
| $ | 103 |
| $ | 224 |
| |
Falconbridge Dominicana, C. por A. |
| 42 |
| 181 |
| 4 |
| 7 |
| 17 |
| 31 |
| 59 |
| ||||||||
Nickel Operations |
| 157 |
| 623 |
| 48 |
| 53 |
| 48 |
| 134 |
| 283 |
| ||||||||
Kidd Creek Operations |
| (14) |
| (45 | ) | (14 | ) | (16 | ) | (23 | ) | (15 | ) | (68 | ) | ||||||||
Collahuasi |
| 119 |
| 361 |
| 28 |
| 25 |
| 23 |
| 39 |
| 115 |
| ||||||||
Lomas Bayas |
| 26 |
| 95 |
| 6 |
| 5 |
| 8 |
| 13 |
| 32 |
| ||||||||
Copper Operations |
| 131 |
| 411 |
| 20 |
| 14 |
| 8 |
| 37 |
| 79 |
| ||||||||
Corporate and other (Note 2) |
| (11) |
| (65 | ) | (7 | ) | (17 | ) | (23 | ) | (14 | ) | (61 | ) | ||||||||
Operating income |
| 277 |
| 969 |
| 61 |
| 50 |
| 33 |
| 157 |
| 301 |
| ||||||||
Interest |
| 10 |
| 37 |
| 12 |
| 13 |
| 12 |
| 6 |
| 43 |
| ||||||||
Income and mining taxes |
| 71 |
| 248 |
| 11 |
| (3 | ) | 1 |
| 54 |
| 63 |
| ||||||||
Non-controlling interest in earnings of subsidiary |
| 2 |
| 12 |
| — |
| 1 |
| 1 |
| 2 |
| 4 |
| ||||||||
Earnings for the period |
| 194 |
| 672 |
| 38 |
| 39 |
| 19 |
| 95 |
| 191 |
| ||||||||
Dividends on preferred shares |
| 2 |
| 7 |
| 2 |
| 2 |
| 2 |
| 3 |
| 9 |
| ||||||||
Earnings attributable to common shares |
| $ | 192 |
| $ | 665 |
| $ | 36 |
| $ | 37 |
| $ | 17 |
| $ | 92 |
| $ | 182 |
| |
Basic earnings per common share (Note 1) |
| $ | 1.07 |
| $ | 3.71 |
| $ | 0.20 |
| $ | 0.21 |
| $ | 0.10 |
| $ | 0.52 |
| $ | 1.03 |
| |
Diluted earnings per common share (Note 1) |
| $ | 1.07 |
| $ | 3.69 |
| $ | 0.20 |
| $ | 0.21 |
| $ | 0.10 |
| $ | 0.51 |
| $ | 1.02 |
| |
METAL SALES (tonnes, except precious metal revenues and silver) |
|
|
|
|
|
|
|
|
|
|
|
|
|
|
| ||||||||
INO | – Nickel |
| 19,799 |
| 71,374 |
| 20,325 |
| 20,627 |
| 17,558 |
| 20,468 |
| 78,978 |
| |||||||
| – Copper |
| 12,521 |
| 51,057 |
| 14,470 |
| 16,139 |
| 12,093 |
| 16,506 |
| 59,208 |
| |||||||
| – Precious metal revenues (thousands) |
| $ | 26,165 |
| $ | 99,046 |
| $ | 19,963 |
| $ | 24,751 |
| $ | 22,686 |
| $ | 19,380 |
| $ | 86,780 |
|
Kidd Creek | – Zinc (including metal in concentrate) |
| 40,563 |
| 135,259 |
| 35,517 |
| 28,361 |
| 25,407 |
| 21,307 |
| 110,592 |
| |||||||
| – Copper (including metal in concentrate) |
| 22,443 |
| 90,286 |
| 28,773 |
| 26,375 |
| 26,098 |
| 23,916 |
| 105,162 |
| |||||||
| – Silver (thousands of troy ounces) |
| 780 |
| 3,876 |
| 1,204 |
| 1,553 |
| 1,550 |
| 1,016 |
| 5,323 |
| |||||||
Nickel in ferronickel |
| 8,104 |
| 28,936 |
| 6,536 |
| 6,455 |
| 7,361 |
| 6,781 |
| 27,133 |
| ||||||||
Collahuasi | – Copper (including metal in concentrate) |
| 66,667 |
| 204,636 |
| 44,429 |
| 46,798 |
| 37,281 |
| 39,639 |
| 168,147 |
| |||||||
Lomas Bayas | – Copper |
| 15,238 |
| 60,190 |
| 14,578 |
| 14,817 |
| 15,601 |
| 16,293 |
| 61,289 |
| |||||||
AVERAGE PRICES REALIZED (US$/lb., except silver) |
|
|
|
|
|
|
|
|
|
|
|
|
|
|
| ||||||||
Nickel |
| $ | 6.45 |
| $ | 6.40 |
| $ | 3.83 |
| $ | 3.87 |
| $ | 4.33 |
| $ | 5.57 |
| $ | 4.40 |
| |
Ferronickel |
| 6.42 |
| 6.37 |
| 3.65 |
| 3.78 |
| 4.15 |
| 5.21 |
| 4.20 |
| ||||||||
Copper |
| 1.42 |
| 1.32 |
| 0.78 |
| 0.76 |
| 0.81 |
| 0.96 |
| 0.82 |
| ||||||||
Zinc |
| 0.52 |
| 0.51 |
| 0.39 |
| 0.39 |
| 0.41 |
| 0.46 |
| 0.41 |
| ||||||||
Silver (US$/oz.) |
| 7.04 |
| 6.51 |
| 4.69 |
| 4.62 |
| 4.83 |
| 5.19 |
| 4.80 |
| ||||||||
89
DAVID W. KERR, C.A.
Toronto, Ontario
Chairman, Falconbridge Limited
Appointed in April 1989
Chairman of Noranda Inc. and previously President and CEO of Noranda Inc. Past Chairman of the International Council on Mining and Metals. Directorships include: Brascan Corporation, Shell Canada Limited, Sun Life Financial Inc. and Sustainable Development Technology Canada. Mr. Kerr is also Chairman of the Toronto Rehabilitation Hospital Foundation.
ALEX G. BALOGH

Oakville, Ontario
Corporate Director
Appointed in September 1989 (2,3)
Formerly Deputy Chairman of Noranda Inc. (1994-2003) and Chairman of Falconbridge Limited (1994-2003). Directorships include: Noranda Inc., Strongco Inc., Brascan Power Inc. and Cambior Inc. Mr. Balogh also serves on the Advisory Council of Sentient Global Resources Fund. He is Chairman of the National Advisory Board, Minerals and Metals Science and Technology, and is past Chairman of the International Council of Metals and the Environment. In addition, Mr Balogh is a metallurgical engineer.
JACK L. COCKWELL
Toronto, Ontario
Group Chairman,
Brascan Corporation
Appointed in December 1995 (4)
Formerly Brascan’s President and Chief Executive Officer for 12 years. Directorships include: Brascan Corporation, Brookfield Properties Limited, Brascan Power Inc., Astral Media Inc., Noranda Inc., Norbord Inc., Fraser Papers Inc. and the C.D. Howe Institute. Mr. Cockwell is also Chairman of the Board of Trustees of the Royal Ontario Museum.
ROBERT HARDING, F.C.A.
Toronto, Ontario
Chairman, Brascan Corporation
Appointed in July 2000 (2,4,6)

Directorships include: Brascan Corporation (Chairman) and the following Brascan group companies: BPO Properties Corporation (Chair- man), Noranda Inc., Norbord Inc. and Fraser Papers Inc. Mr. Harding is also a Director of Burlington Resources Inc. and is Chairman of the Board of Governors of the University of Waterloo, Chair of Campaign Waterloo and Trustee and Vice-Chair of the United Way of Greater Toronto.
COMMITTEES |
| 1 |
| Audit Committee |
|
|
|
|
|
|
| 2 |
| Corporate Governance Committee |
|
|
|
|
|
|
| 3 |
| Environment, Health and Safety Committee |
|
|
|
|
|
|
| 4 |
| Human Resources and Compensation Committee |
|
|
|
|
|
|
| 5 |
| Independent Directors’ Committee |
|
|
|
|
|
|
| 6 |
| Pension Investment Committee |
|
|
|
|
|
|
|
|
| The Chair of the committee is in bold |
90
G. EDMUND KING
Toronto, Ontario
Partner, DeCew Capital Corporation
Appointed in June 1994 (2,4,5,6)
Formerly Chairman and Chief Executive Officer of CIBC Wood Gundy Corporation and formerly Chairman of WIC Western Inter- national Communications Inc. Directorships include: Rockwater Capital Corporation, Caldwell Partners Ltd., the Canadian Cardiology Society and the Centre of Addiction and Mental Health Foundation.

NEVILLE W. KIRCHMANN, C.A. (S.A.)
Toronto, Ontario
President, Kirchmann Holdings Ltd.
Appointed in December 1997 (1,4,5)
Previously President and CEO of Coca-Cola Canada and Southern Africa. Formerly President and CEO of The Princess Margaret Hospital Founda-tion. Directorships include: Clearly Canadian Beverage Corporation, Fibre Connections Inc. and Interlink Community Cancer Nurses (Chairman). Mr. Kirchmann is also Chair of the Development Committee and a Board Member of The Princess Margaret Hospital Foundation.
MARY MOGFORD, ICD. D.
Newcastle, Ontario
Corporate Director
Appointed in December 1995 (1,2,3,5)
Former Deputy Minister of Finance and Deputy Minister of Natural Resources for the Province of Ontario. Directorships include: MDS Inc., Potash Corporation of Saskatchewan Inc., Sears Canada, Sears Canada Bank and the Altamira Advisory Council. Ms. Mogford is also a Director of The Hospital for Sick Children and a Trustee of The Toronto Symphony Foundation.

DEREK PANNELL, ing, BSc, ARSM
Toronto, Ontario
President and Chief Executive Officer,
Noranda Inc.
Appointed in April 2001 (3,4)
Appointed President and CEO of Noranda Inc. in June 2002. Previously President and COO of Noranda and CEO of Falconbridge Limited, Vice-President of Compañía Minera Antamina in Peru and President of Brunswick Mining and Smelting. Directorships include: Noranda Inc. and the Mining Association of Canada. Mr. Pannell is also an Honorary Professor of the Universidad Nacional de Ingenéria, Lima, Peru.

DAVID H. RACE
Toronto, Ontario
Corporate Director
Appointed in April 1994 (1,3,5)
Chairman Emeritus of CAE Inc. and previously President and CEO of CAE Inc. (1985-1993). Mr. Race is also an Honorary Director of the Bank of Nova Scotia and Laureate of the Canadian Business Hall of Fame.
AARON W. REGENT, C.A.
Toronto, Ontario
President and Chief Executive
Officer, Falconbridge Limited
Appointed in February 2002
Previously Executive Vice-President and CFO of Noranda Inc., President and CEO of Trilon Securities Corporation and Senior Vice- President and CFO of Brascan Corporation. Directorships include: Compañía Minera Doña Inés de Collahuasi S.C.M., The Nickel Development Institute (Chairman), the C.D. Howe Institute, The National Ballet of Canada and The Hospital for Sick Children Foundation.

JAMES D. WALLACE, F.C.A.
Sudbury, Ontario
President, Pioneer Construction, Inc.
Appointed in January 2001 (1,4,5,6)
Director of the following public companies: Osprey Media Group Inc. and Northstar Aerospace Inc. Mr. Wallace is also a Director of Northern Ski Company Limited, Krisjefdon Limited, Ethier Sand & Gravel Limited and Alexander Centre Industries Limited. Other directorships: Councillors of Ontario’s Promise: The Partnership for Children and Youth, Northeastern Smart Growth Panel and Cancer Care, Ontario. Mr. Wallace is also past Chair of Laurentian University.
91
Ongoing Corporate Governance Initiatives
THE BOARD OF DIRECTORS AND COMPANY MANAGEMENT STRIVE TO ANTICIPATE AND IMPLEMENT ANY GOVERNANCE INITIATIVES THAT THE CORPORATE GOVERNANCE COMMITTEE BELIEVES ARE APPROPRIATE IN THE CONTEXT OF THE EXTENSIVE INTERNATIONAL BUSINESS ACTIVITIES AND THE GENERAL GLOBAL BUSINESS ENVIRONMENT. OVER THE PAST TWO YEARS IN PARTICULAR, THE BOARD HAS TAKEN STEPS TO ALIGN ITSELF WITH DEVELOPING GOVERNANCE STANDARDS. CERTAIN KEY COMPONENTS OF THE COMPANY’S GOVERNANCE SYSTEMS AND PROCEDURES ARE OUTLINED BELOW.
Disclosure Committee
DENIS COUTURE
Vice-President,
Investor Relations,
Communications & Public Affairs
KATHERINE RETHY
Senior Vice-President,
Information Systems,
Procurement, Logistics, Enterprise
Risk Management & Facilities
JEFFERY SNOW
Senior Vice-President
& General Counsel
STEPHEN YOUNG
Corporate Secretary
Corporate Governance Guidelines
The Corporate Governance Guidelines serve as the formal mandate of the Board of Directors with a view to providing a framework for strengthening governance, expanding insider accountability and enhancing the quality of Board oversight. These Guidelines, reviewed by the Board for effectiveness on an annual basis, state the primary responsibilities of the Board as well as the general criteria for Board membership and level of commitment expected of each director.
Director Independence
In certain of the fundamental governance areas requiring Board oversight, a strong element of independent director stewardship continues to be maintained and developed by the Board. The Independent Directors’ Committee meets frequently during the course of the year to consider related party matters and other transactions which may impact on the interests of the minority shareholders as a group. The Audit Committee is comprised solely of independent directors and there is a majority of independent directors, including the Chair, on the Corporate Governance Committee.
Code of Ethics
The Company’s written Code of Ethics sets a high standard of ethical behaviour throughout the Company and its global operations. The code applies to all directors, officers and employees of the Company and also provides a confidential procedure under which employees can report issues to designated individuals or through the Company’s Ethics Hotline.
Disclosure Policy
The Corporate Disclosure Policy summarizes the Company’s policies and practices regarding disclosure of information to investors, analysts, the media and the public generally. The Company’s Disclosure Committee oversees and monitors compliance with this policy and advises senior management and the Board on public disclosure matters.
Recent Developments
The Board has recently revised its Corporate Governance Guidelines and the terms of reference for the Board committees to expand their stated mandates and respective responsibilities, high-lighting the Company’s ongoing compliance with new regulatory governance guidelines. Audit Committee oversight was also enhanced over the past year by regular quarterly reports under the Company’s Enterprise Risk Management Process, which extends risk analysis processes globally to all business and functional units, and by the filling of the new post of Director, Corporate Audit Services who reports directly to the Audit Committee.
(see Management Information Circular for more information)
92
DAVID KERR
Chairman of the Board
AARON REGENT
President & Chief Executive Officer
CLAUDE FERRON
President, Canadian Copper & Recycling
JOSEPH LAEZZA
President, Nickel
FERNANDO PORCILE
President, Copper
PETER KUKIELSKI
Executive Vice-President, Projects
MICHAEL DOOLAN
Senior Vice-President & Chief
Financial Officer
MICHAEL AGNEW
Vice-President, Technology
RICK BURDETT
Vice-President,
Information Systems & Chief Information Officer
ROBERT BURROW
Vice-President,
Finance – Nickel Operations
DEAN CHAMBERS
Treasurer
SERGIO CHAVEZ
President & General Manager, Ferronickel Operations
DENIS COUTURE
Vice-President,
Investor Relations,
Communications & Public Affairs
JOHN DOYLE
Vice-President, Taxation
PETER EICHINGER
Vice-President,
Global Procurement
ALLEN HAYWARD
Vice-President,
Nickel Mining
DAVID HOLOWACK
Vice-President,
Strategy & Administration
OLLE JOHANSSON
Vice-President,
Trading
ANDRÉ JORON
Vice-President,
Human Resources
TED LAKS
Vice-President,
Performance/Six Sigma
IAN PEARCE
Senior Vice-President,
Projects & Engineering
DAVID RAE
Vice-President, Commercial & Strategy, Nickel
KATHERINE RETHY
Senior Vice-President,
Information Systems,
Procurement, Logistics, Enterprise Risk Management & Facilities
MARTIN SCHADY
Senior Vice-President,
Business Development
PAUL SEVERIN
Senior Vice-President,
Exploration
JEFFERY SNOW
Senior Vice-President & General Counsel
ROBERT TELEWIAK
Vice-President,
Environment, Health & Safety
STEPHEN YOUNG
Corporate Secretary
LYNDA BEESLEY
Assistant Corporate Secretary
CRAIG DUFF
Assistant Treasurer
93
HEAD OFFICE
Falconbridge Limited
BCE Place
181 Bay Street
Suite 200
Toronto, Ontario
M5J 2T3
Telephone: (416) 982-7111
Fax: (416) 982-7423
NICKEL
Sudbury Mines/Mill
Onaping, Ontario
P0M 2R0
Telephone: (705) 966-3411
Fax: (705) 699-3100
Michael Dufresne
General Manager
Sudbury Smelter
Falconbridge, Ontario
P0M 1S0
Telephone: (705) 693-2761
Fax: (705) 699-3932
Mark Trevisiol
General Manager
Raglan Mine
120, avenue de l’Aéroport
Rouyn-Noranda, Québec
J9X 5B7
Telephone: (819) 762-7800
Fax: (819) 762-9266
Denis Lachance
General Manager, Raglan
Operations
Falconbridge Nikkelverk A/S
P.O. Box 457
4601 Kristiansand South, Norway
Telephone: 47-38-10-10-10
Fax: 47-38-10-10-11
Edward Henriksen
Managing Director
Falconbridge Dominicana,
C. por A.
Bonao, Dominican Republic
Telephone: (809) 682-6041
Fax: (809) 221-8423
Sergio Chavez
President & General Manager
CUSTOM FEED
Falconbridge International Limited
Suite 201, Stevmar House
Rockley, Christ Church, Barbados
Telephone: (246) 435-9969
Fax: (246) 435-9978
Ric Lorrimer
President
Falconbridge International S.A.
Avenue Lloyd George 7, Box 2
B – 1000 Brussels, Belgium
Telephone: (32-2) 401-8330
Fax: (32-2) 401-8331
Michael McSorley
Chairman
COPPER
Compañía Minera Doña Inés de
Collahuasi S.C.M.
Av. Andrés Bello 2687, Piso 11
Las Condes
Santiago, Chile
Telephone: (56-2) 362-6500
Fax: (56-2) 362-6562
Thomas Keller
Chief Executive Officer
Kidd Mining Division
Postal Bag 2002
Timmins, Ontario P4N 7K1
Telephone: (705) 264-5200
Fax: (705) 267-8709
Michel Boucher
General Manager
Kidd Metallurgical Division
Postal Bag 2002
Timmins, Ontario P4N 7K1
Telephone: (705) 235-8121
Fax: (705) 235-7318
Daniel Picard
General Manager
Compañía Minera Falconbridge
Lomas Bayas
Galleguillos Lorca 1610
Antofagasta, Chile
Telephone: (56) 55 200-600
Fax: (56) 55 200-664
Gordon Stodhart
General Manager
CORPORATE
Marketing and Sales Subsidiaries and Offices
Falconbridge Europe S. A.
Avenue Lloyd George 7, Box 2
B – 1000 Brussels, Belgium
Telephone: (32-2) 401-8300
Fax: (32-2) 401-8301
John Smillie
President
Falconbridge (Japan) Ltd.
Nihonbashi First Building 8F
2-19, Nihonbashi 1-Chome
Chuo-ku, Tokyo 103, Japan
Telephone: (81-3) 3272-0900
Fax: (81-3) 3272-0901
Toshiaki Oiwa
President
94
Falconbridge U.S. Inc.
Twin Towers – Suite 245
4955 Steubenville Pike
Pittsburgh, Pennsylvania
U.S.A. 15205-9604
Telephone: (412) 787-0220
Fax: (412) 787-0287
James Moore
President
Exploration Offices
Queen’s Quay Terminal
207 Queen’s Quay West
Suite 800
Toronto, Ontario
M5J 1A7
Telephone: (416) 982-7111
Fax: (416) 982-7420
Mike Donnelly
General Manager,
Copper Exploration Latin America
David Gower
General Manager,
Nickel Exploration
Tony Green
General Manager,
Copper Exploration
Technology Centre
P.O. Box 40
Falconbridge, Ontario P0M 1S0
Telephone: (705) 693-2761
Fax: (705) 699-3600
Gary Potts
Manager of Geology,
Sudbury Region
P.O. Bag 2002
Timmins, Ontario P4N 7K1
Telephone: (705) 264-5200
Fax: (705) 267-8709
Damien Duff
Manager of Geology,
Timmins Region
3296, avenue Francis-Hugues
Laval, Quebec
H7L 5A7
Telephone: (450) 668-2112
Fax: (450) 668-2929
James Robertson
Director of Exploration,
North America
Falconbridge (Australia) Pty. Ltd.
Exploration Division
Suite 701, Level 7
Toowong Tower – 9 Sherwood Road
Toowong, Queensland, 4066
Australia
Telephone: (61-7) 3721-4222
Fax: (61-7) 3871-1379
Scott Bruce
Director of Exploration, Australasia
Falconbridge Brasil Ltda.
Avenida Afonso Pena 2770
2nd Andar
Bairro Funcionarios
Belo Horizonte – MG 30130-007
Brazil
Telephone: (55-31) 3280-4400
Fax: (55-31) 3280-4411
Helio Diniz
Exploration Manager, Brazil
Subsidiaries, Project Offices and
Associated Companies
Noranda Chile Limitada –
Falconbridge Chile S.A.
Avenida Andres Bello 2777
Piso 8
Las Condes
Santiago, Chile
Telephone: (56-2) 337-0600
Fax: (56-2) 337-7220
Fernando Porcile
President, Copper
Falconbridge Nouvelle-
Calédonie SAS
9 rue Austerlitz, 6e étage
BP MGA 08
Nouméa Cedex 98802
Nouvelle-Calédonie
Telephone: (687) 246-040
Fax: (687) 246-049
Brian Kenny
President, Koniambo
Falconbridge (Australia) Pty Ltd.
Suite 701, Level 7
Toowong Tower – 9 Sherwood Road
Toowong, Queensland, 4066
Australia
Telephone: (61-7) 3721-4222
Fax: (61-7) 3871-1379
Brian Hill
Managing Director
Falconbridge France SAS
17 Square Edouard VII
75009 Paris
France
Telephone: 33 (01) 53-43-51-60
Fax: 33 (01) 53-43-51-62
Derek Job
Finance Director
95
Shareholder and Corporate Information
STOCK EXCHANGE LISTING
Toronto, Trade Symbol:
FL (Common Shares)
FL. PR. A (Preferred Share Series 2)
FL. PR. B (Preferred Share Series 3)
INDEX LISTINGS
S&P/TSX Composite
S&P/TSX Capped Composite
S&P/TSX Capped Diversified Metals & Mining
S&P/TSX Capped Materials
S&P/TSX MidCap
OUTSTANDING SHARES
December 31, 2004 |
|
|
Common Shares |
| 179,770,190 |
Preferred Share Series 1 |
| 89,835 |
Preferred Share Series 2 |
| 4,787,283 |
Preferred Share Series 3 |
| 3,122,882 |
ANNUAL DIVIDEND PER SHARE
Common Shares |
| Cdn$0.40 |
Preferred Share Series 1 |
| Cdn$0.08 |
Preferred Share Series 2 |
| Cdn$0.74 |
Preferred Share Series 3 |
| Cdn$0.86 |
FALCONBRIDGE DIVIDEND POLICY
Falconbridge views common share dividends as an important part of a shareholder’s return on investment. As a result, it aims to pay a common share dividend at all points of the economic cycle, as long as the payment does not impair the Company’s financial position. It is expected that the common share dividend will increase or decrease to reflect the Company’s operating results and financial position.
The preferred shares of each series issued by Falconbridge rank in priority to the common shares with respect to the payment of dividends.
AUDITORS
Deloitte & Touche LLP
Toronto, Ontario
ANNUAL MEETING
The annual meeting of shareholders will be held on April 21, 2005 at the Design Exchange, Trading Floor, 234 Bay Street, Toronto at 2:00 p.m.
TRANSFER AGENT & REGISTRAR
For information regarding dividend cheques, share certificates, stock transfers, etc., please contact: Computershare Trust Company of Canada
Telephone: |
| 1-800-564-6253 or |
|
| (514) 982-7555 |
Fax: |
| 1-866-249-7775 or |
|
| (416) 263-9524 |
service@computershare.com | ||
INQUIRIES
Denis Couture
Vice-President, Investor Relations,
Communications & Public Affairs
Telephone: (416) 982-7020
Tracey Wise
Manager, Investor Relations
Telephone: (416) 982-7178
VISIT OUR WEBSITE
Browse www.falconbridge.com to learn more about Falconbridge and the mining industry.
VERSION FRANÇAISE
La version française du rapport annuel sera fournie sur demande.
SHARE TRADING INFORMATION
|
| Share Price |
| Share Price |
| Common Share |
| ||
Quarter |
| Low |
| High |
| Volume (MILLIONS) |
| ||
2004 |
|
|
|
|
|
|
| ||
First |
| $ | 29.21 |
| $ | 37.45 |
| 45 |
|
Second |
| 28.05 |
| 35.53 |
| 33 |
| ||
Third |
| 28.00 |
| 34.68 |
| 22 |
| ||
Fourth |
| 28.14 |
| 34.35 |
| 23 |
| ||
2003 |
|
|
|
|
|
|
| ||
First |
| $ | 15.37 |
| $ | 18.13 |
| 26 |
|
Second |
| 15.25 |
| 18.95 |
| 18 |
| ||
Third |
| 17.35 |
| 23.18 |
| 24 |
| ||
Fourth |
| 21.81 |
| 31.78 |
| 29 |
| ||
96
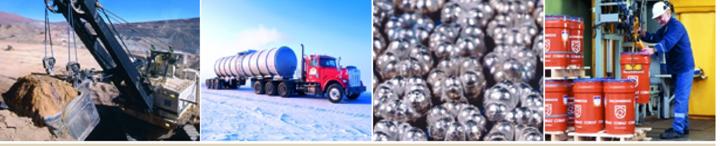
Above, from left to right:
1) Collahuasi, Chile, shovel
2) Raglan, Quebec, logistics
3) Nickel crowns 4) Nikkelverk, Norway, cobalt packaging
Back cover, from left to right:
1) Collahuasi Chile, ball mill
2) Copper 3) Collahuasi, Chile, Rosario mine 4) Lomas Bayas, Chile, employee
Falconbridge is a leading producer of nickel, copper, cobalt and platinum group metals. The Company is also a major recycler and processor of metal-bearing materials.
Falconbridge is committed to improving shareholder returns through the responsible and profitable growth of its core nickel and copper businesses. This will be accomplished by focusing on high-quality and long-life orebodies, by optimizing returns from current assets, and by selective acquisitions and development opportunities.
The company targets a 15% after-tax return on equity through a metals cycle, while maintaining investment grade credit ratings. Falconbridge entered the mining business in 1928 and today employs 5,800 people in 12 countries. The Company’s common shares are listed on the Toronto Stock Exchange under the symbol FL. As of December 31, 2004, Falconbridge was owned by Noranda Inc. of Toronto (58.8%) and by other investors (41.2%).
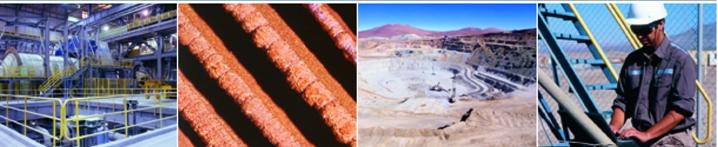

FALCONBRIDGE LIMITED
BCE PLACE, 181 BAY STREET, SUITE 200, TORONTO, ONTARIO, CANADA M5J 2T3
TELEPHONE: 416.982.7111 FACSIMILE: 416.982.7423 EMAIL: INVESTOR@FALCONBRIDGE.COM
www.falconbridge.com