Exhibit 99.1
Investor Presentation
Second Quarter Update - 2011
2
Forward-Looking Statements
Certain statements made by Meadowbrook Insurance Group, Inc. in this
presentation may constitute forward-looking statements including, but not limited
to, those statements that include the words "believes," "expects," "anticipates,"
"estimates," or similar expressions. Please refer to the Company's most recent
10-K, 10-Q, and other Securities and Exchange Commission filings for more
information on risk factors. Actual results could differ materially. These forward-
looking statements involve risks and uncertainties including, but not limited to the
following: the frequency and severity of claims; uncertainties inherent in reserve
estimates; catastrophic events; a change in the demand for, pricing of,
availability or collectability of reinsurance; increased rate pressure on premiums;
obtainment of certain rate increases in current market conditions; investment
rate of return; changes in and adherence to insurance regulation; actions taken
by regulators, rating agencies or lenders; obtainment of certain processing
efficiencies; changing rates of inflation; and general economic conditions.
Meadowbrook is not under any obligation to (and expressly disclaims any such
obligation to) update or alter its forward-looking statements whether as a result
of new information, future events or otherwise.
3
The Meadowbrook Approach - Predictability
We strive to deliver consistent results with a balanced business model
We are a specialty niche focused commercial insurance underwriter and
insurance administration services company
Our objective is to generate predictable results across the market cycle,
with a target return on average equity of 10% - 17%
To achieve these results we seek to leverage the unique characteristics of
our balanced business model to generate:
– Consistent, profitable underwriting results
– Predictable investment income in a low-risk, high-quality, fixed income portfolio
– Profitable growth both organically and through acquisitions
– Strong cash flow from our insurance company subsidiaries and non-regulated fee-based
services to leverage invested assets to equity and manage debt service
– Steady fee and commission income
4
Meadowbrook Vitals
Current market cap (at 8/4/11): $482.7 million
Outstanding shares (at 6/30/11): 52.9 million
Weighted average shares (at 6/30/11): 53.3 million
Book value (at 6/30/2011): $573.0 million
Book value per share: $10.84
– Excluding unrealized gain / loss, net of deferred taxes: $9.99
– Tangible book value per share (excluding goodwill and intangibles): $7.94
Debt to equity: 19.6%; 5.5% excluding debentures
Debt to total capital: 16.37%; 4.6% excluding debentures
Current price / book: .84 (at $9.06 share market price - as of 8/4/11)
Dividend yield (at 8/4/11): 1.77%
Statutory premium leverage (TTM 6/30/11) Actual Targeted Maximum
– GWP to Statutory surplus 2.3 to 1 2.75 to 1
– NWP to Statutory surplus 2.0 to 1 2.25 to 1
Insider ownership (at 6/30/11): 6.9%
5
Diverse Revenue
Sources
Sources
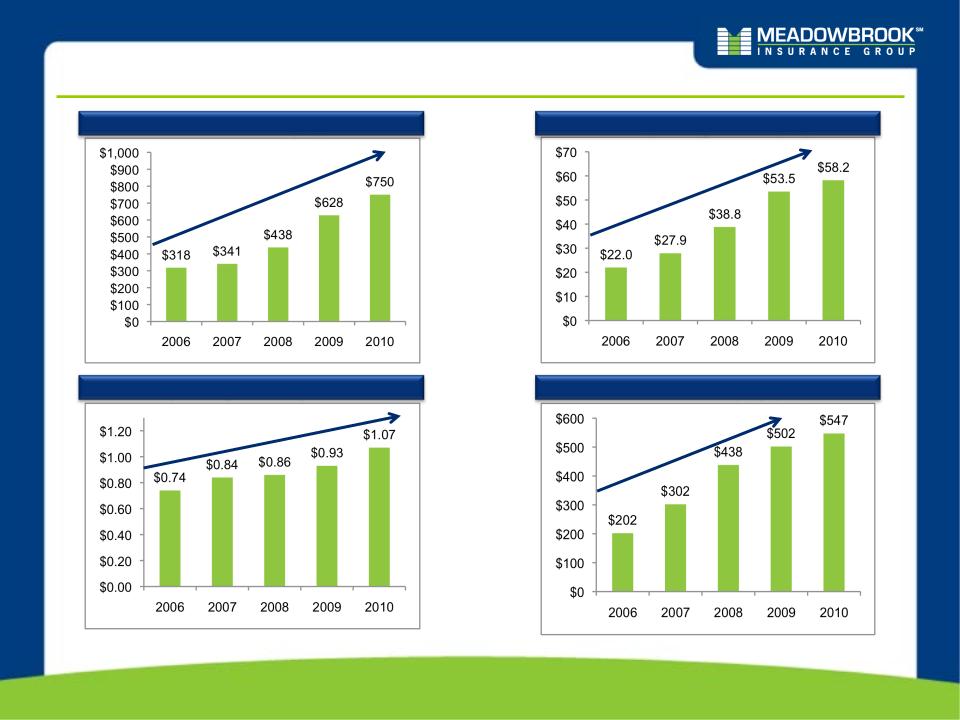
Earned premium from insurance operations
Fee revenue from risk management services
Flexibility to utilize multiple distribution channels
Positioned to Manage
Insurance Cycles
Insurance Cycles
Conservative
Investment
Philosophy
Investment
Philosophy
Ability to Attract and
Retain Talented
Professionals
Retain Talented
Professionals
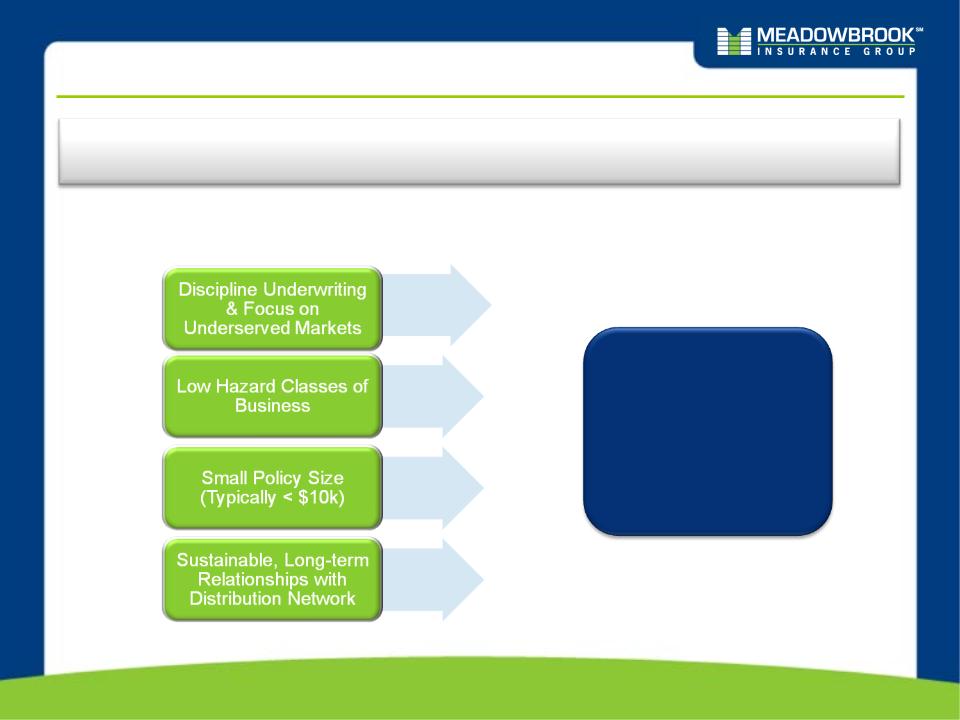
Our model allows us to deliver more predictable results
Product, program and geographic diversification
Admitted market capabilities contribute to stability and higher renewal retention
Non-admitted capabilities enable opportunistic response in volatile pricing environment
High-quality fixed income approach to our $1.3 billion portfolio
Investment approach reinforces our focus on underwriting profitability
Insurance subsidiaries rated A- (Excellent) by A.M. Best
Insurance subsidiary surplus levels can support meaningful premium growth
Insurance subsidiaries have additional borrowing capacity through FHLB membership
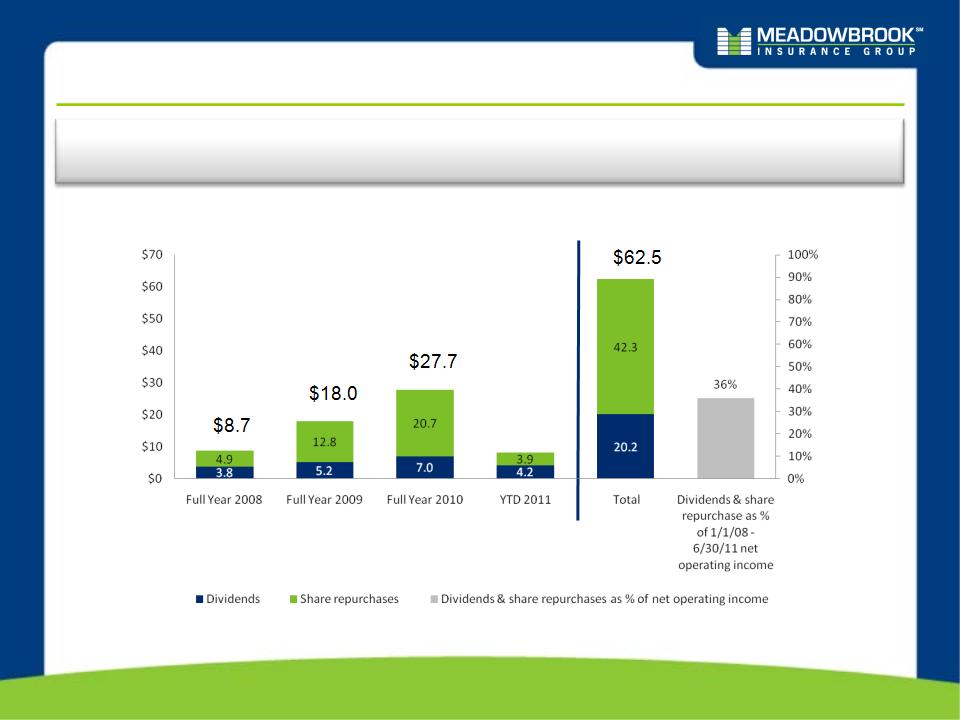
Generate cash flows from both regulated and non-regulated sources, which provides
flexibility
flexibility
Manageable debt levels, with access to $35 million line of credit
(no outstanding balance)
Strong Capital and
Liquidity Position
Liquidity Position
Team of talented insurance professionals with a wide range of expertise across all
functions and lines of business
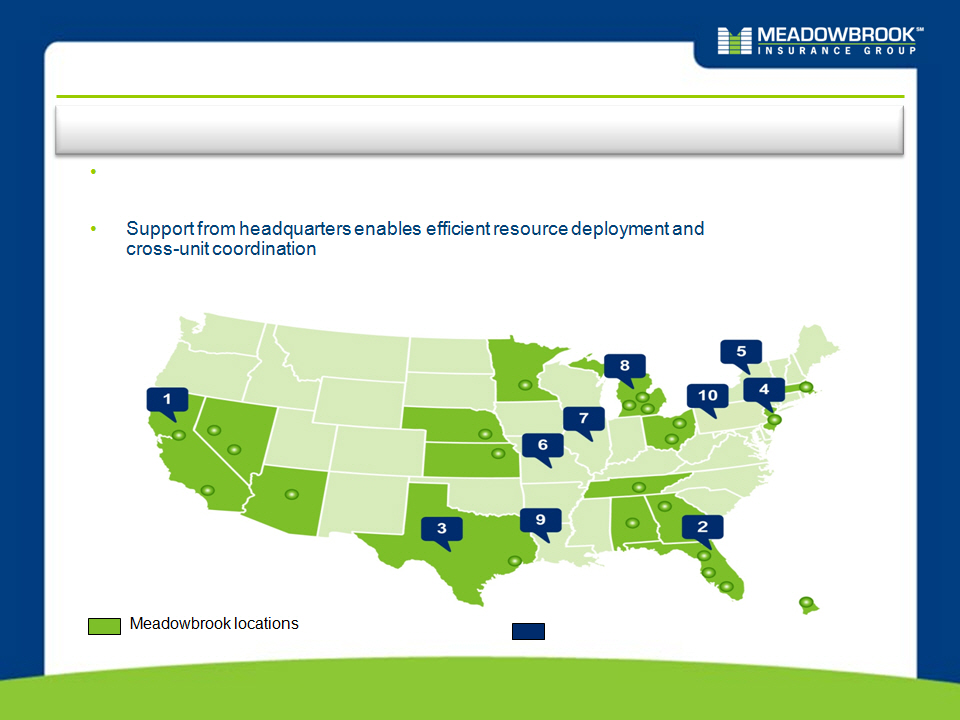
Regional structure enables associates to deliver strong and responsive local service
to clients
to clients
What Makes Us Different:
We are Flexible and are Able to Adapt to Changing Market Conditions
6
Our Approach Has Delivered Results Over Time
Total Revenue ($M)
Net Operating Income ($M)
Shareholders’ Equity ($M)
Net Operating Income per Share
CAGR (2006 to 2010) = 24%
CAGR (2006 to 2010) = 28%
CAGR (2006 to 2010) = 10%
7
Capability Building Through Successful Acquisitions
Retail Agency Only
1955: Founded as a retail insurance agency
Core Capability Build Out
1985: Star Insurance Company
1990: Savers Property & Casualty Insurance Company
1994: American Indemnity Insurance Company
1996: Association Self Insurance Services
1997: Williamsburg National Insurance Company
Crest Financial Services
1998: Ameritrust Insurance Corporation
Florida Preferred Administrators, Inc.
1999: TPA Insurance Agency
Continued Synergistic Expansion
2007: USSU
2008: Procentury
Continued Synergistic Expansion
Strategic Staging of Acquisitions
Meadowbrook actively reviews acquisition
prospects on a strategic basis and enters into
transactions that will increase long-term
shareholder value
prospects on a strategic basis and enters into
transactions that will increase long-term
shareholder value
We consider a range of strategic factors when
looking at acquisitions including:
– Opportunity to leverage our diverse
revenue platform, by expanding current
distribution, servicing capabilities, and
complementary product lines and
classes
revenue platform, by expanding current
distribution, servicing capabilities, and
complementary product lines and
classes
– Ability to attract talented insurance
professionals that are a good fit with
Meadowbrook culture
professionals that are a good fit with
Meadowbrook culture
– Opportunity to create “win-win” situation
by mitigation our downside risk and
providing seller with opportunity to obtain
fair value through deal structure
by mitigation our downside risk and
providing seller with opportunity to obtain
fair value through deal structure
Diverse Revenue Sources
Insurance Operations
Commission & Fee Revenue
Our most prominent source of revenue and income comes from our insurance operation;
commission revenue and fee-for-service revenue generate unregulated free cash flow
Admitted and non-admitted products and
programs
programs
Risk sharing vehicles
Relatively small but provides a valuable
source of unregulated cash flow
Agency commission from non-affiliated
carriers
carriers
Managed program revenue
Municipality and association clients
2010 Net Earned Premium: $659.8 M
2010 Pre-Tax Net Earned Premium Profit : $33.2M
2010 Net Investment Income: $54.2M
2010 Net Commission & Fee Revenue: $34.2 M
2010 Pre-Tax Commission & Fee Income: $11.7M
9
Insurance Operations
Diversified Commercial Positions Built to Manage Across Cycles
Main Street Excess
and Surplus Lines
and Surplus Lines
Admitted Programs
Non-Admitted
Programs
Programs
Specialty Markets
Homogeneous specialized programs
Heterogeneous geographic centers
Product focused
Promotes specialty agents
Broad classes of “Main Street”
commercial risks
commercial risks
Promotes General Agent
distribution
distribution
Specialized programs ignored or
underserved by the standard market
Promotes wholesalers with specialty
underwriting authority
Solutions designed for very specific
products and market segments
2010 GWP: $532 M
2010 GWP: $147 M
2010 GWP: $47 M
2010 GWP: $76 M
Food service industry
Educators
Auto re-possessors
Health and fitness centers
Description
Examples
Garage dealers
Apartments, hotels and motels
Contractors liability
Restaurants, bars and taverns
Oil and gas contractors
Forced placed property
Small business
Pet-sitters
Irrigation
Excess workers’ comp
Environmental
Marine
10
National Scope with Regional Perspective
Balance of effective local touch, with efficient national coordination
Top 10 production states (TTM 6/30/2011)
Talented associates are located throughout the country to serve the needs of
regional clients
regional clients
Bermuda
11
Diverse Mix of Business
TTM June 30, 2011 Gross Written Premium Business Mix
We have built our business to
create product diversification as
indicated by the mix of business
create product diversification as
indicated by the mix of business
This platform enables us to
grow our business
opportunistically with a focus on
underwriting discipline and
pricing adequacy
grow our business
opportunistically with a focus on
underwriting discipline and
pricing adequacy
Our wide range of product
expertise positions us well to
support future growth
expertise positions us well to
support future growth
Our new business is primarily
rollover books of business with
a proven track record of
profitability
rollover books of business with
a proven track record of
profitability
12
Meadowbrook Workers’ Compensation Profile
We have strategically grown our workers’ compensation business. Overall, we believe
we have achieved controlled profitable growth.
Workers’ Compensation Profile
History of Proven
Profitable
Performance
Profitable
Performance
Expense Ratio Analysis
14
YTD June 30, 2010 and 2011 GAAP Expense Ratio Comparison
Net earned premium $314.2M $352.1M
Policy acquisition $109.2M $119.9M
and other u/w expenses
Expense ratio 34.8% 34.0%
15
Focus on Generating Consistent
Investment Income
Investment Income
Robust top line growth has led to a larger investment base and a meaningful increase in NII
Pre-tax book yield was
4.2% at 6/30/2011 vs.
4.5% at 12/31/2007
4.2% at 6/30/2011 vs.
4.5% at 12/31/2007
The duration of our
portfolio increased to 5.0
years at 6/30/2011 from
4.4 years at 12/31/2007
portfolio increased to 5.0
years at 6/30/2011 from
4.4 years at 12/31/2007
The duration of our $1.3
billion portfolio is 5 years
The duration on net
reserves of $829 million is
approximately 3.5 years
reserves of $829 million is
approximately 3.5 years
Net investment income
YTD 6/30/11 increased by
3.2% compared to YTD
6/30/10
YTD 6/30/11 increased by
3.2% compared to YTD
6/30/10
Pre-tax Net Investment Income ($ in M) and Average
Investment Yield
Investment Yield
*4.4
*4.8
*5.1
*5.0
*5.0
*Effective Duration
16
We Maintain a High Quality, Low Risk Investment Portfolio
We maintain a conservative investment portfolio
Portfolio Allocation and Quality
Low equity risk exposure
– 98% fixed income and
cash
cash
– 2% equity
High credit quality
– 99% of bonds are
investment grade
investment grade
– Average S&P rating of
AA / Moody’s of Aa3
AA / Moody’s of Aa3
Interest Rate Risk Protection
– Hold to Maturity
– High Credit Quality =
Low Historical
Impairments
Low Historical
Impairments
– Access to additional
capital if needed
capital if needed
NOTE: Data above as of June 30, 2011
$’s in (000’s) | % Allocation 6/30/2011 | Fair Value | Gross Unrealized Gain Position | Avg. Moody's | Avg. S&P |
Fixed Income | |||||
US Government and Agencies | 2% | $ 24,696 | $ 1,373 | Aaa | AAA |
Corporate | 34% | $ 456,077 | $ 23,993 | A2 | A |
Mortgage and Asset Backed | 18% | $ 243,220 | $ 13,725 | Aaa | AAA |
Municipal | 43% | $ 571,583 | $ 29,643 | Aa2 | AA+ |
Preferred Stock Debt | 0% | $ 2,416 | $ 492 | Ba2 | BB |
Total Fixed Income | 98% | $1,297,993 | $ 69,226 | ||
Equities | |||||
Preferred Stock | 1% | $ 13,881 | $ 2,509 | ||
Mutual Funds | 1% | $ 15,783 | $ 1,020 | ||
Total Equities | 2% | $ 29,664 | $ 3,529 |
17
Capital Management
Our goal is to be efficient managers of capital; we initiated a dividend during 2008 and since this time we
have returned $62.5M to shareholders through dividends and share repurchases
$ in millions
$8.1
18
Highlights ($ in M, except per share amounts)
As compared to 2010 gross written premium is up 10.2%, our net operating income ex
unusual storm losses and development has increased meaningfully.
YTD 6/30 | Per Share | ||||
2010 | 2011 | 2010 | 2011 | ||
Gross Written Premium | $ 397.0 | $ 437.6 | |||
Reported Net Operating Income (NOI*) | $ 29.4 | $ 23.0 | $ 0.54 | $ 0.43 | |
Unusual Storm Losses (Net of Tax) | $ 1.3 | $ 3.6 | $ 0.02 | $ 0.07 | |
PY Development (Net of Tax) | $ (10.7) | $ (1.5) | $ (0.19) | $ (0.03) | |
NOI Ex Unusual Storm Losses and Development | $ 20.0 | $ 25.1 | $ 0.37 | $ 0.47 | |
Reported GAAP Combined Ratio | 94.2% | 98.4% | |||
Accident Year Combined Ratio Ex Unusual Storm Losses | 98.9% | 97.4% |
* Net operating income is a non-GAAP measure the Company defines as net income excluding
after-tax realized gains and losses.
19
Full Year 2011 Guidance and Long Term Value Creation
Looking ahead, we believe our balanced business model positions us well to continue
to deliver predictable earnings
Gross Written Premium
Range of $830M - $850M
GAAP Combined Ratio
Range of 96.0% - 97.0%
Net income from operations
$53.0M - $58.5M
Net operating income per share
$1.00 - $1.10
2011 Original Guidance
Leverage multiple revenue
sources and diverse insurance
offering to maximize
opportunities across market
cycles
sources and diverse insurance
offering to maximize
opportunities across market
cycles
Increase underwriting leverage
through selective growth
opportunities, while sustaining
appropriate diversification
through selective growth
opportunities, while sustaining
appropriate diversification
Increase investment leverage
through cash from operations
Leverage fixed costs over a
larger revenue base
larger revenue base
Increase fee-for service
income through new
opportunities and margin
expansion
income through new
opportunities and margin
expansion
Driving Long-term
Enterprise Value
Enterprise Value
2011 Original Guidance
Adjusted for Q2*
Unusual Storm Losses
Adjusted for Q2*
Unusual Storm Losses
Gross Written Premium
Range of $830M - $850M
GAAP Combined Ratio
97.0% - 98.0%
Net income from operations
$48.9M - $54.4M
Net operating income per share
$0.92 - $1.02
* The Q2 unusual storm losses were
$4.1M net of tax or $.08/diluted
share.
$4.1M net of tax or $.08/diluted
share.