EXHIBTI 99.1
Investor PresentationThird Quarter 2014 Update
2 Forward-Looking Statements & Non-GAAP Financial Measures The Company’s investor presentation may include certain statements which constitute forward-looking statements within the meaning of Section 27A of the Securities Act of 1933, as amended, and Section 21E of the Securities Exchange Act of 1934, as amended. These statements include information regarding the intent, belief, or current expectations of management, including, but not limited to, those statements that use the words “believes,” “expects,” “anticipates,” “estimates,” or similar expressions. You are cautioned that any such forward-looking statements are not guarantees of future performance and involve a number of risks and uncertainties, and results could differ materially from those indicated by such forward-looking statements. Among the important factors that could cause actual results to differ materially from those indicated by such forward-looking statements are: actual loss and loss adjustment expenses exceeding our reserve estimates; competitive pressures in our business; the failure of any of the loss limitation methods we employ; a failure of additional capital to be available or only available on unfavorable terms; our geographic concentration and the business and economic conditions, natural perils, man made perils, and regulatory conditions within our most concentrated regions; our ability to appropriately price the risks we underwrite; goodwill impairment risk employed as part of our growth strategy; efforts with regard to the review of strategic alternatives; actions taken by regulators, rating agencies or lenders, including the impact of the downgrade by A.M. Best of the Company’s insurance company subsidiaries’ financial strength rating, the lowering of the outlook of this rating from “stable” to “negative”, A.M. Best’s downgrade of our issuer credit rating and any other future action by A.M. Best with respect to such ratings; increased risks or reduction in the level of our underwriting commitments due to market conditions; a failure of our reinsurers to pay losses in a timely fashion, or at all; interest rate changes; continued difficult conditions in the global capital markets and the economy generally; market and credit risks affecting our investment portfolio; liquidity requirements forcing us to sell our investments; a failure to introduce new products or services to keep pace with advances in technology; the new federal financial regulatory reform; our holding company structure and regulatory constraints restricting dividends or other distributions by our insurance company subsidiaries; minimum capital and surplus requirements imposed on our insurance company subsidiaries; acquisitions and integration of acquired businesses resulting in operating difficulties, which may prevent us from achieving the expected benefits; our reliance upon producers, which subjects us to their credit risk; loss of one of our core producers; our dependence on the continued services and performance of our senior management and other key personnel; our reliance on our information technology and telecommunications systems; managing technology initiatives and obtaining the efficiencies anticipated with technology implementation; a failure in our internal controls; the cyclical nature of the property and casualty insurance industry; severe weather conditions and other catastrophes; the effects of litigation, including the previously disclosed arbitration and class action litigation or any similar litigation which may be filed in the future; state regulation; and assessments imposed upon our insurance company subsidiaries to provide funds for failing insurance companies. For additional information with respect to certain of these and other factors, refer to the Item 1A of Part I to our Annual Report on Form 10-K for the year ended December 31, 2013 and subsequent filings made with the United States Securities and Exchange Commission. We are not under any obligation to (and expressly disclaim any obligation to) update or alter our forward-looking statements, whether as a result of new information, future events or otherwise.Notes on Non-GAAP Financial MeasuresNet operating income is a non-GAAP measure defined as net income excluding after-tax realized gains and losses. Accident year combined ratio is a non-GAAP measure that represents the impact of any adverse or favorable development on prior year loss reserves.Statutory surplus is a non-GAAP measure with the most directly comparable financial GAAP measure being shareholders’ equity.These non-GAAP metrics are common measurements for property and casualty insurance companies. We believe this presentation enhances the understanding of our results by highlighting the underlying profitability of our insurance business. Additionally, these measures are key internal management performance standards.
Specialty niche focused commercial insurance underwriter and insurance administration services companyHeadquartered in Southfield, MI with 25 locations throughout the U.S. and ~929 employeesFounded in 1955, organized as a holding company in 1985, IPO and listed on the NYSE (MIG) in 1995 Shareholders’ equity of $448.1 million, book value of $8.94 per common share at September 30, 2014, up 7.8% from December 31, 2013Tangible book value per common share of $8.35 at September 30, 2014, up 8.7% from December 31, 2013Conservatively managed investment portfolio with invested assets of $1.6 billion at September 30, 2014Markets and underwrites specialty insurance programs and products on both an admitted and non-admitted basis YTD September 30, 2014 gross written premium of $578 million, and $764 million for the trailing 12 monthsProduct focus includes workers’ compensation, general liability, commercial multi-peril and commercial autoIndustry recognized leader supporting the program marketplaceFull range of diversified products written through six insurance carriers on both an admitted and E&S basis Meadowbrook Overview 3
Balanced business model allows the Company to adapt to changing market conditionsProduct, program and geographic diversificationAdmitted market capabilities contribute to stability and higher renewal retentionE&S platform with industry leading technology capabilities enable opportunistic response in a cyclical pricing environment Products marketed and distributed through a broad multi-channel distribution network across the U.S.Regional presence provides the infrastructure to achieve geographic diversification, while maintaining a local touch Meadowbrook’s individual product divisions and programs access approximately 800 production sources including program administrators, specialty retail agents, general agents and wholesalersThird party services and wholly-owned retail and wholesale agencies provide attractive commission and fee revenue streamNet commission and fee revenue of $44 million for the trailing 12 months – not affiliated with insurance subsidiariesGenerated $26 million of fee revenue from loss control, claims and self-insured / captive administrationGenerated $18 million of commission revenue from over $200 million of managed premium for unaffiliated carriersPre-tax margin of $12 million for the trailing 12 months (9/30/14) Meadowbrook Overview 4 A specialty, niche focused P&C carrier and insurance administration services company
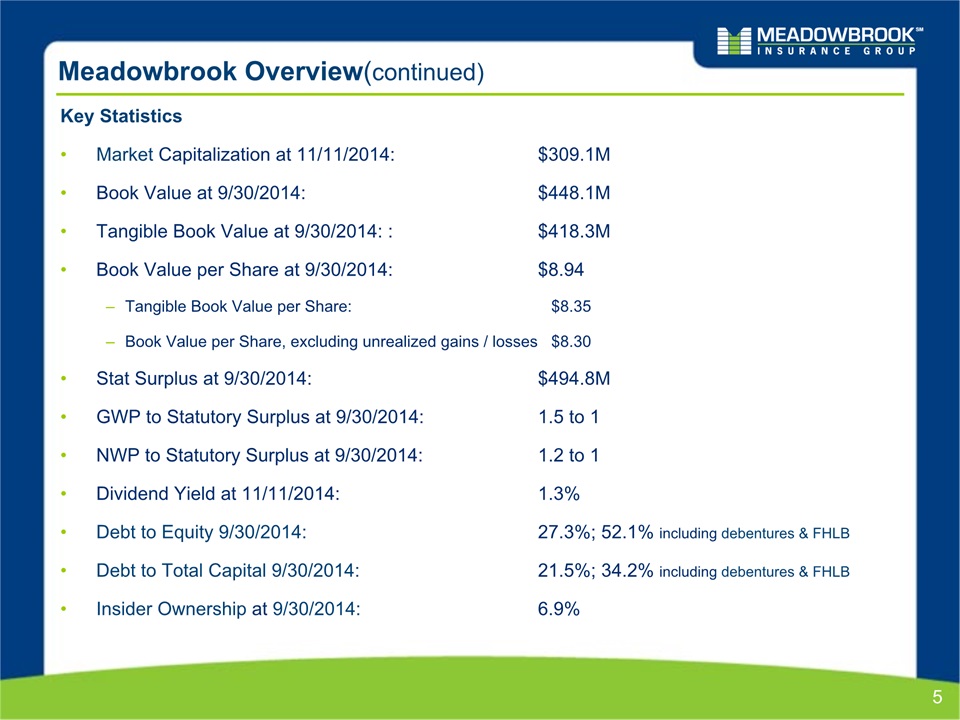
5 Meadowbrook Overview(continued) Key StatisticsMarket Capitalization at 11/11/2014: $309.1MBook Value at 9/30/2014: $448.1MTangible Book Value at 9/30/2014: : $418.3MBook Value per Share at 9/30/2014: $8.94Tangible Book Value per Share: $8.35Book Value per Share, excluding unrealized gains / losses $8.30Stat Surplus at 9/30/2014: $494.8MGWP to Statutory Surplus at 9/30/2014: 1.5 to 1NWP to Statutory Surplus at 9/30/2014: 1.2 to 1Dividend Yield at 11/11/2014: 1.3%Debt to Equity 9/30/2014: 27.3%; 52.1% including debentures & FHLBDebt to Total Capital 9/30/2014: 21.5%; 34.2% including debentures & FHLBInsider Ownership at 9/30/2014: 6.9%
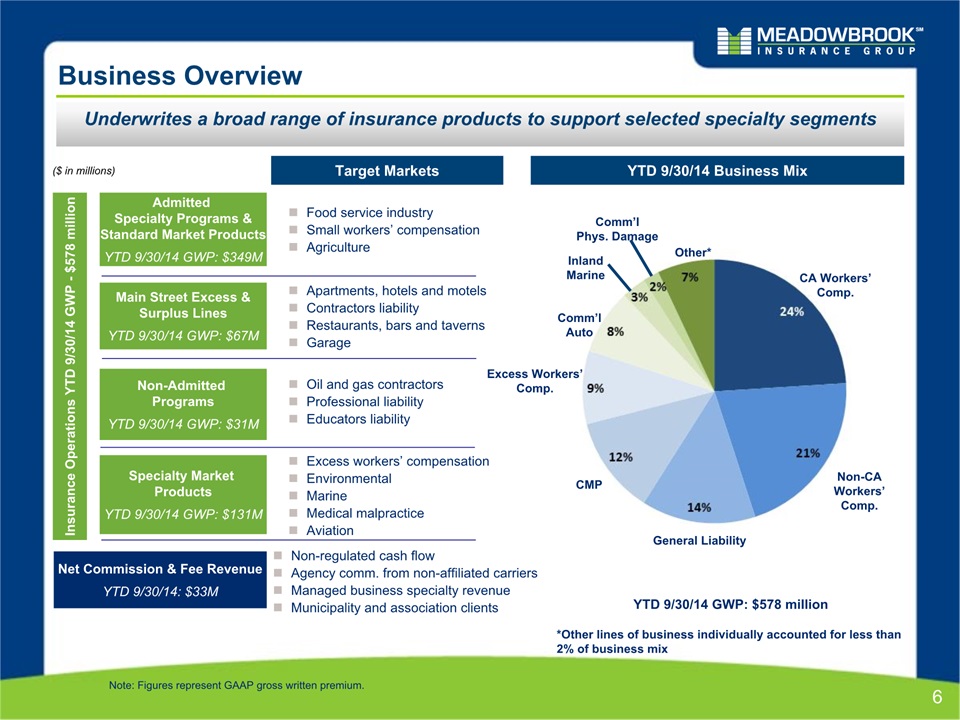
Food service industrySmall workers’ compensationAgriculture Target Markets YTD 9/30/14 Business Mix YTD 9/30/14 GWP: $578 million Excess workers’ compensationEnvironmentalMarineMedical malpracticeAviation Specialty Market ProductsYTD 9/30/14 GWP: $131M Admitted Specialty Programs &Standard Market ProductsYTD 9/30/14 GWP: $349M Oil and gas contractorsProfessional liabilityEducators liability Non-Admitted ProgramsYTD 9/30/14 GWP: $31M Apartments, hotels and motelsContractors liabilityRestaurants, bars and tavernsGarage Main Street Excess &Surplus LinesYTD 9/30/14 GWP: $67M Net Commission & Fee RevenueYTD 9/30/14: $33M Insurance Operations YTD 9/30/14 GWP - $578 million Non-regulated cash flowAgency comm. from non-affiliated carriersManaged business specialty revenueMunicipality and association clients ($ in millions) CA Workers’ Comp. General Liability CMP Comm’lAuto Excess Workers’ Comp. Comm’lPhys. Damage InlandMarine Other* Non-CA Workers’ Comp. Note: Figures represent GAAP gross written premium. 6 Business Overview Underwrites a broad range of insurance products to support selected specialty segments *Other lines of business individually accounted for less than 2% of business mix
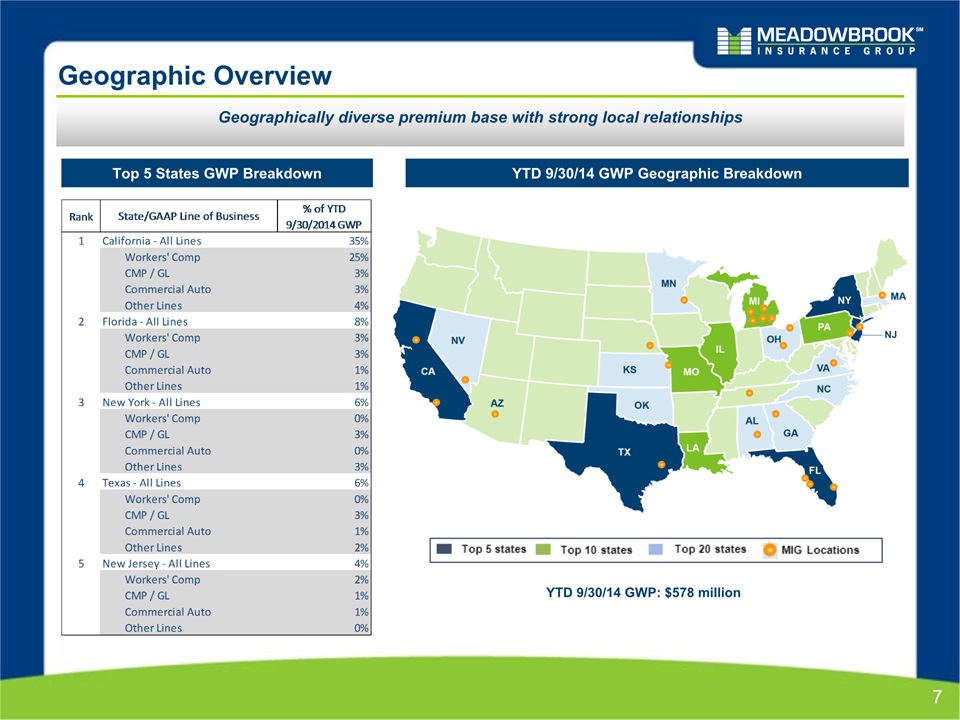
YTD 9/30/14 GWP Geographic Breakdown Top 5 States GWP Breakdown YTD 9/30/14 GWP: $578 million 7 Geographic Overview Geographically diverse premium base with strong local relationships
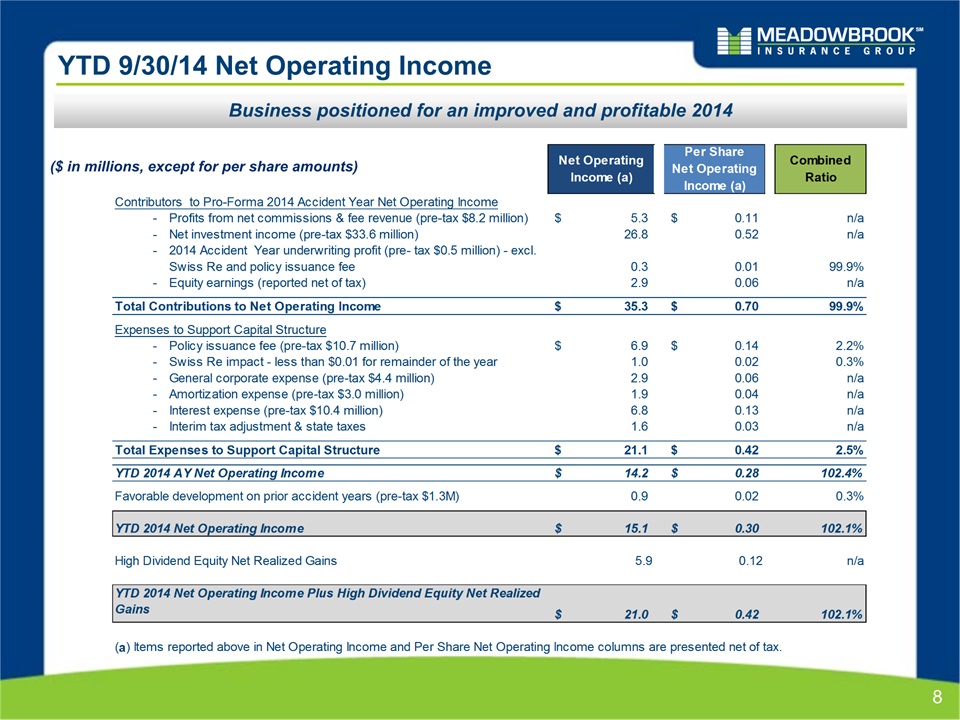
8 YTD 9/30/14 Net Operating Income Business positioned for an improved and profitable 2014 ($ in millions, except for per share amounts)
Reduced exposure to underperforming business, resulting in improved accident year resultsIncludes public entity excess, long-haul transportation, auto repossessors, workers’ compensation for isolated CA territory and other select underwriting decisions (see slides 13-16 for additional discussion)Cumulative rate increases of more than 30% in excess of cumulative loss cost trends of ~10% since 2010 (see slide 15 for additional detail)Meadowbrook achieved approximately 75% cumulative written rate increase on its CA workers’ compensation line of business since 2010Meadowbrook’s on-going business has generated attractive statutory accident year loss & ALAE ratiosAt September 30, 2014 re-estimated 2011, 2012, and 2013 accident year loss & ALAE ratios were 64.2%, 65.0%, and 58.5%, respectively*2014 accident year loss & ALAE ratio of 61.6% reflects a more conservative expected loss ratio within the standard actuarial methods and consideration of the inherent risks associated with a less mature accident year*Expense initiativesFocus on combined ratio and overall underwriting profitabilityOn-going business with our long-term client / partners have higher external commission, but a lower, more predictable loss ratio compared to some of the terminated business that had more variability in the loss ratio and a lower external commission rate.We continue to seek opportunities to optimize the level of internal cost to maintain ‘franchise’ value, yet reduce the level of fixed costs.We seek opportunities to reduce / optimize reinsurance costs and other underwriting costs. 9 Recent Activity & Management Actions Management has taken corrective actions designed to return Meadowbrook to profitability *Accident year loss & ALAE ratios above exclude the impact of the Swiss Re quota share agreement, which was terminated effective September 30, 2013.
Favorable development of $1.0 million, or 0.2 combined ratio percentage pointsGrowth in recent years from rate increases and increase in the average program maturityMore certainty in estimating loss ultimates for mature businessAs programs and books of business mature, underlying claims patterns begin to stabilize allowing more reliance on standard actuarial methods as opposed to actuarial methods modified to consider acceleration in claims handling.Run-off of premium on terminated business has been completedAt 9/30/14 essentially no unearned premium related to terminated business remainedDedicated claims handling team in charge of claims run-off processInitial impact to reserves of claims run-off has been recognizedOpen claim counts on terminated business down 52% from 4.9k at 12/31/12 to 2.4k at 9/30/14Since 12/31/10 cumulative written rate increases achieved in excess of 30% compared to cumulative loss ratio trend increases of approximately 10%Previous calendar year development on prior year reserves imbedded in the 2014 accident year loss selection resulting in a stronger reserve positionCurrent accident year loss & LAE ratio selection reflects a more conservative expected loss ratio within the standard actuarial methods and consideration of the inherent risks associated with a less mature accident year Reserves continued to stabilize with modest favorable development in first nine months of 2014 10
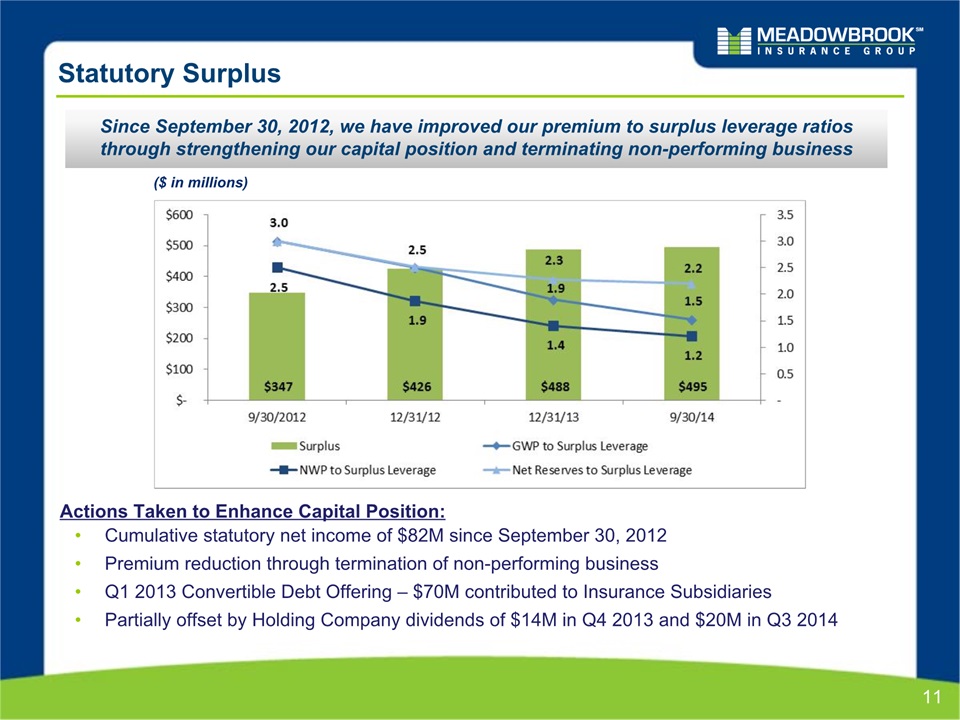
11 Statutory Surplus Since September 30, 2012, we have improved our premium to surplus leverage ratios through strengthening our capital position and terminating non-performing business Cumulative statutory net income of $82M since September 30, 2012Premium reduction through termination of non-performing businessQ1 2013 Convertible Debt Offering – $70M contributed to Insurance SubsidiariesPartially offset by Holding Company dividends of $14M in Q4 2013 and $20M in Q3 2014 Actions Taken to Enhance Capital Position: ($ in millions)
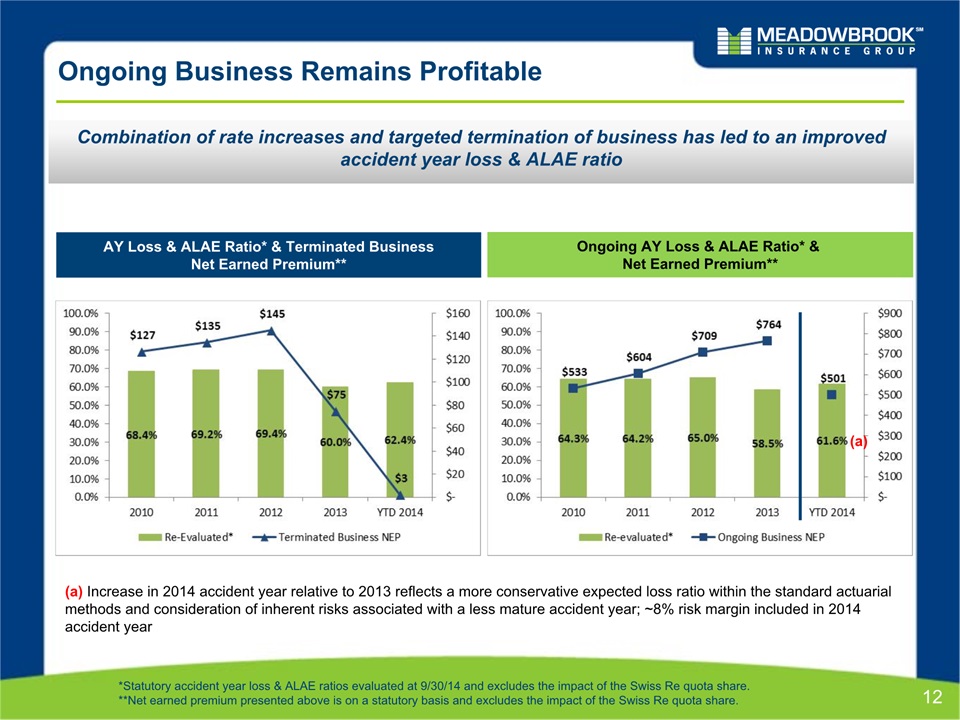
AY Loss & ALAE Ratio* & Terminated BusinessNet Earned Premium** *Statutory accident year loss & ALAE ratios evaluated at 9/30/14 and excludes the impact of the Swiss Re quota share.**Net earned premium presented above is on a statutory basis and excludes the impact of the Swiss Re quota share. 12 Ongoing Business Remains Profitable Combination of rate increases and targeted termination of business has led to an improved accident year loss & ALAE ratio Ongoing AY Loss & ALAE Ratio* & Net Earned Premium** (a) (a) Increase in 2014 accident year relative to 2013 reflects a more conservative expected loss ratio within the standard actuarial methods and consideration of inherent risks associated with a less mature accident year; ~8% risk margin included in 2014 accident year
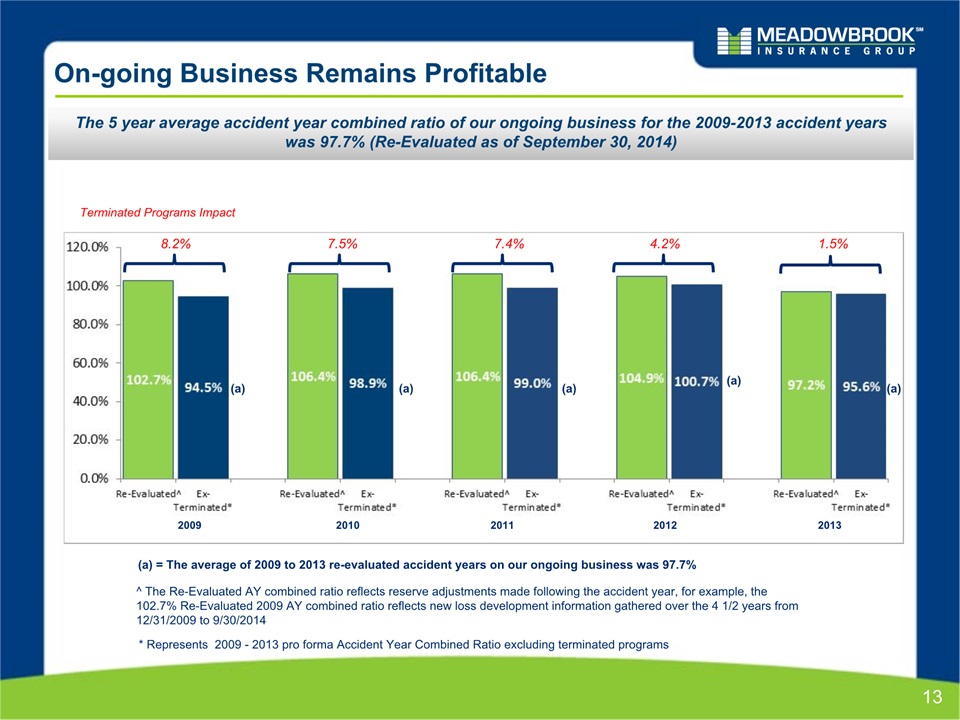
13 On-going Business Remains Profitable 2010 2011 2012 ^ The Re-Evaluated AY combined ratio reflects reserve adjustments made following the accident year, for example, the 102.7% Re-Evaluated 2009 AY combined ratio reflects new loss development information gathered over the 4 1/2 years from 12/31/2009 to 9/30/2014 2013 * Represents 2009 - 2013 pro forma Accident Year Combined Ratio excluding terminated programs 8.2% 7.5% 4.2% 1.5% Terminated Programs Impact 2009 7.4% The 5 year average accident year combined ratio of our ongoing business for the 2009-2013 accident years was 97.7% (Re-Evaluated as of September 30, 2014) (a) (a) (a) (a) (a) (a) = The average of 2009 to 2013 re-evaluated accident years on our ongoing business was 97.7%
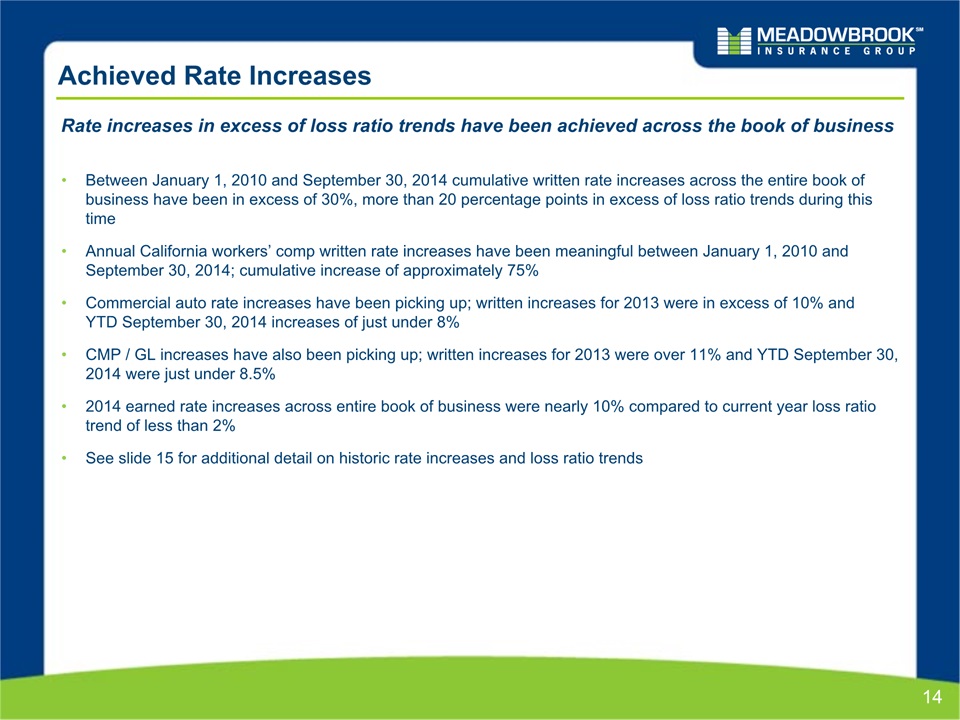
Achieved Rate Increases Rate increases in excess of loss ratio trends have been achieved across the book of business 14 Between January 1, 2010 and September 30, 2014 cumulative written rate increases across the entire book of business have been in excess of 30%, more than 20 percentage points in excess of loss ratio trends during this timeAnnual California workers’ comp written rate increases have been meaningful between January 1, 2010 and September 30, 2014; cumulative increase of approximately 75%Commercial auto rate increases have been picking up; written increases for 2013 were in excess of 10% and YTD September 30, 2014 increases of just under 8%CMP / GL increases have also been picking up; written increases for 2013 were over 11% and YTD September 30, 2014 were just under 8.5%2014 earned rate increases across entire book of business were nearly 10% compared to current year loss ratio trend of less than 2%See slide 15 for additional detail on historic rate increases and loss ratio trends
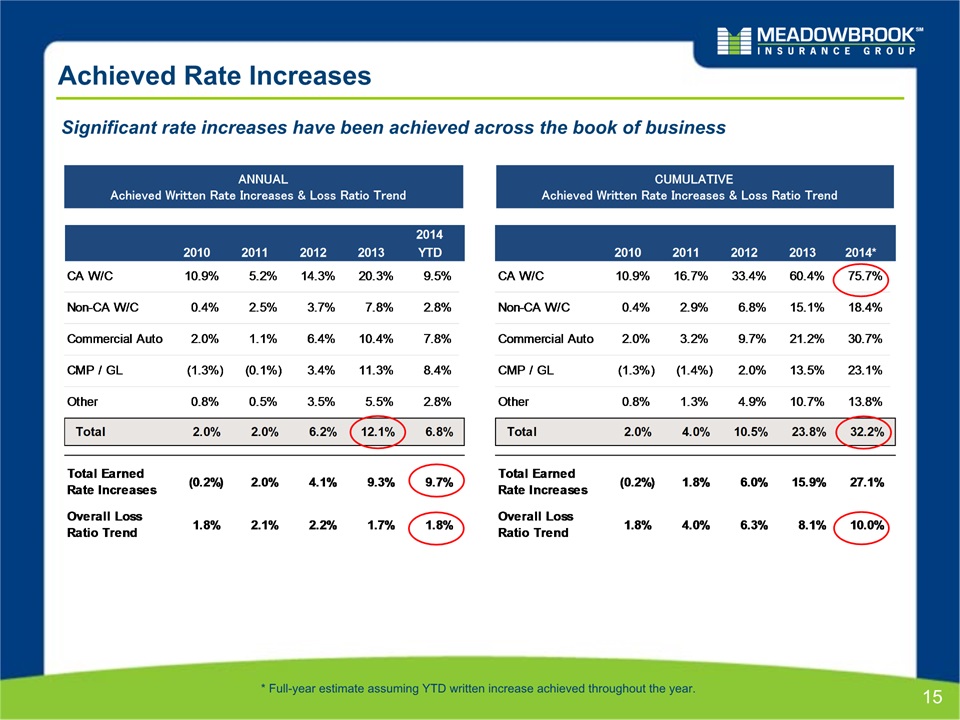
Achieved Rate Increases ANNUALAchieved Written Rate Increases & Loss Ratio Trend CUMULATIVEAchieved Written Rate Increases & Loss Ratio Trend Significant rate increases have been achieved across the book of business 15 * Full-year estimate assuming YTD written increase achieved throughout the year.
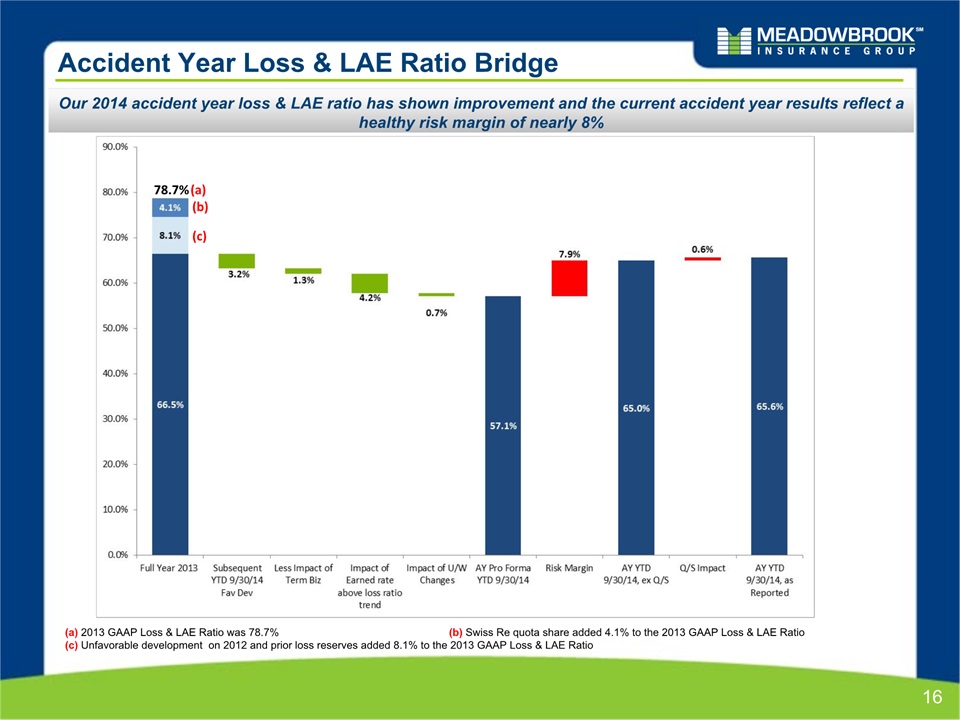
16 Accident Year Loss & LAE Ratio Bridge Our 2014 accident year loss & LAE ratio has shown improvement and the current accident year results reflect a healthy risk margin of nearly 8% (a) 2013 GAAP Loss & LAE Ratio was 78.7% (b) Swiss Re quota share added 4.1% to the 2013 GAAP Loss & LAE Ratio(c) Unfavorable development on 2012 and prior loss reserves added 8.1% to the 2013 GAAP Loss & LAE Ratio 78.7% (a) (b) (c)

Expense Ratio Analysis, excluding Swiss Re 17 ($ in millions)
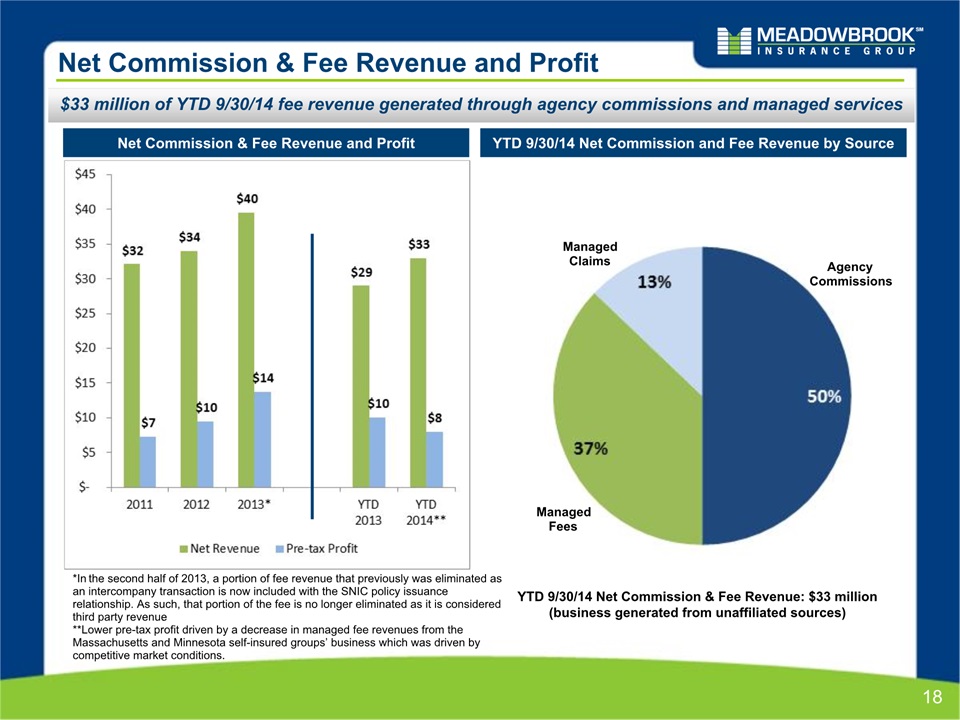
YTD 9/30/14 Net Commission and Fee Revenue by Source YTD 9/30/14 Net Commission & Fee Revenue: $33 million (business generated from unaffiliated sources) Net Commission & Fee Revenue and Profit Agency Commissions Managed Claims Managed Fees 18 Net Commission & Fee Revenue and Profit $33 million of YTD 9/30/14 fee revenue generated through agency commissions and managed services *In the second half of 2013, a portion of fee revenue that previously was eliminated as an intercompany transaction is now included with the SNIC policy issuance relationship. As such, that portion of the fee is no longer eliminated as it is considered third party revenue.**Lower pre-tax profit driven by a decrease in managed fee revenues from the Massachusetts and Minnesota self-insured groups’ business which was driven by competitive market conditions.
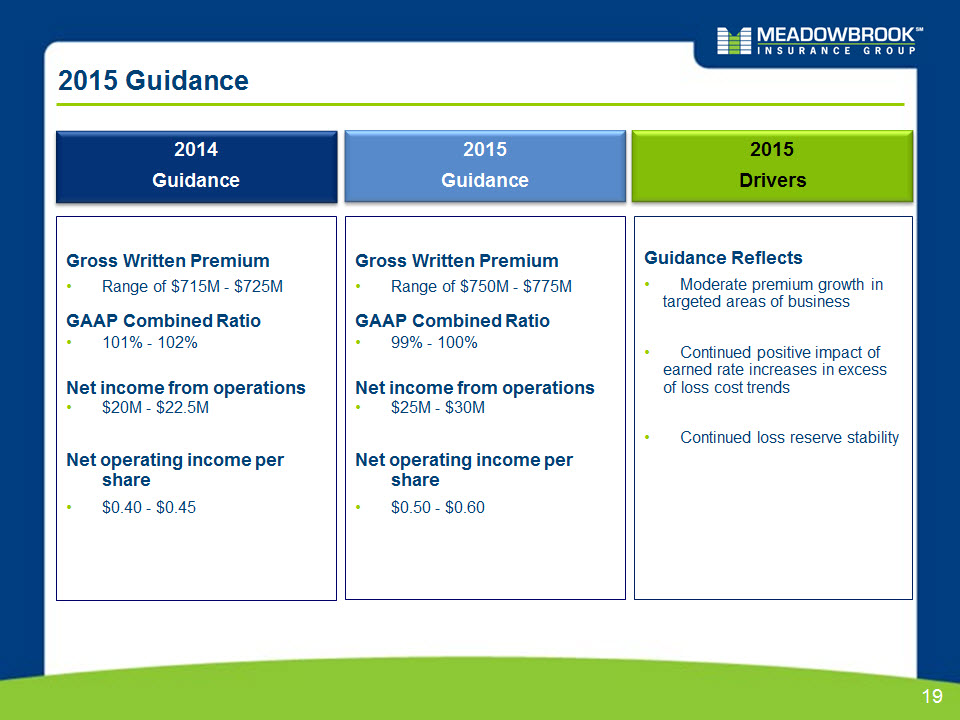
2015 Guidance Gross Written PremiumRange of $715M - $725MGAAP Combined Ratio101% - 102%Net income from operations$20M - $22.5MNet operating income per share$0.40 - $0.45 Guidance ReflectsModerate premium growth in targeted areas of businessContinued positive impact of earned rate increases in excess of loss cost trendsContinued loss reserve stability 2015Guidance Gross Written PremiumRange of $750M - $775MGAAP Combined Ratio99% - 100%Net income from operations$25M - $30MNet operating income per share$0.50 - $0.60 2015Drivers 2014Guidance 19