UNITED STATES
SECURITIES AND EXCHANGE COMMISSION
Washington, D.C. 20549
FORM 10-K
(Mark One):
| x | ANNUAL REPORT PURSUANT TO SECTION 13 OR 15(d) OF THE SECURITIES EXCHANGE ACT OF 1934 |
For the fiscal year ended January 1, 2013
OR
| ¨ | TRANSITION REPORT UNDER SECTION 13 OR 15(d) OF THE SECURITIES EXCHANGE ACT OF 1934 |
For the transition period from to
Commission File Number 001-33515
EINSTEIN NOAH RESTAURANT GROUP, INC.
(Exact Name of Registrant as Specified in its Charter)
| | |
| Delaware | | 13-3690261 |
(State or other jurisdiction of incorporation or organization) | | (I.R.S. Employer Identification No.) |
| 555 Zang Street, Suite 300, Lakewood, Colorado | | 80228 |
| (Address of principal executive offices) | | (Zip Code) |
Registrant’s telephone number, including area code: (303) 568-8000
Securities registered pursuant to Section 12(b) of the Act:
| | |
Title of each class: | | Name of each exchange on which registered: |
Common Stock, $.001 par value | | The NASDAQ Global Market |
Securities registered pursuant to Section 12(g) of the Act: | | None |
Indicate by check mark if the registrant is a well-known seasoned issuer, as defined in Rule 405 of the Securities Act. Yes ¨ No x
Indicate by check mark if the registrant is not required to file reports pursuant to Section 13 or Section 15(d) of the Act. Yes ¨ No x
Indicate by check mark whether the registrant: (1) has filed all reports required to be filed by Section 13 or 15(d) of the Securities Exchange Act of 1934 during the preceding 12 months (or for such shorter period that the registrant was required to file such reports), and (2) has been subject to such filing requirements for the past 90 days. Yes x No ¨
Indicate by check mark whether the registrant has submitted electronically and posted on its corporate Web site, if any, every Interactive Data File required to be submitted and posted pursuant to Rule 405 of Regulation S-T (§232.405 of this chapter) during the preceding 12 months (or for such shorter period that the registrant was required to submit and post such files). Yes x No ¨
Indicate by check mark if disclosure of delinquent filers pursuant to Item 405 of Regulation S-K is not contained herein, and will not be contained, to the best of the registrant’s knowledge, in definitive proxy or information statements incorporated by reference in Part III of this Form 10-K or any amendment to this Form 10-K. ¨
Indicate by check mark whether the registrant is large accelerated filer, an accelerated filer, a non-accelerated filer, or a smaller reporting company. See the definitions of “large accelerated filer,” “accelerated filer” and “smaller reporting company” in Rule 12b-2 of the Exchange Act.
| | | | | | |
| Large accelerated filer | | ¨ | | Accelerated filer | | x |
| | | |
| Non-accelerated filer | | ¨ (Do not check if a smaller reporting company) | | Smaller reporting company | | ¨ |
Indicate by check mark whether the registrant is a shell company (as defined in Rule 12b-2 of the Exchange Act). Yes ¨ No x
The aggregate market value of the voting common equity held by non-affiliates of the registrant as of the last business day of the second fiscal quarter, July 3, 2012 was $107,032,139 (computed by reference to the closing sale price as reported on the NASDAQ Global Market). As of February 21, 2013 there were 17,089,268 shares of the registrant’s Common Stock, par value of $0.001 per share outstanding.
DOCUMENTS INCORPORATED BY REFERENCE
The information required by Part III is incorporated herein by reference from the registrant’s definitive proxy statement for the 2013 annual meeting of stockholders, which will be filed with the SEC within 120 days after the close of the 2012 fiscal year.
EINSTEIN NOAH RESTAURANT GROUP, INC.
FORM 10-K
TABLE OF CONTENTS
1
Cautionary Note Regarding Forward-Looking Statements:
We wish to caution our readers that this Annual Report on Form 10-K and certain information incorporated herein by reference contain forward-looking statements within the meaning of Section 21E of the Securities Exchange Act of 1934, as amended (the “Exchange Act”) and Section 27A of the Securities Act of 1933, as amended (the “Securities Act”). Forward-looking statements involve risks and uncertainties that may cause our actual results, performance or achievements to be materially different from any future performance or achievements expressed or implied by these forward-looking statements. Factors that might cause actual events or results to differ materially from those indicated by these forward-looking statements may include matters such as future economic performance, general economic conditions, consumer preferences and spending, costs, competition, new product execution, restaurant openings or closings, operating margins, the availability of acceptable real estate locations, the sufficiency of our cash balances and cash generated from operating and financing activities for our future liquidity and capital resource needs, growth of franchise and licensing, the impact on our business as a result of Federal and/or State legislation including, but not limited to, the Dodd-Frank Wall Street Reform and Consumer Protection Act of 2010 (“Dodd-Frank Act”) and the rules promulgated thereunder, future litigation and other matters, and are generally accompanied by words such as: “believes,” “anticipates,” “plans,” “intends,” “estimates,” “predicts,” “targets,” “expects,” “contemplates” and similar expressions that convey the uncertainty of future events or outcomes. These risks and uncertainties include, but are not limited to, the risk factors discussed under Item 1A.“Risk Factors” of this Annual Report on Form 10-K. We do not undertake any obligation to update or revise any forward-looking statements to reflect events or circumstances after the date of this report or to reflect the occurrence of unanticipated events, except as may be required under applicable law.
PART I
As used in this report, the terms “Company,” “ENRGI,” “we,” “our,” or “us” refer to Einstein Noah Restaurant Group, Inc. and its consolidated subsidiaries, taken as a whole, unless the context otherwise indicates. The terms “fiscal year ended,” “fiscal year,” “year ended,” or “fiscal” refer to the entire fiscal year, unless the context otherwise indicates.
General development of our Company:
Einstein Noah Restaurant Group, Inc. is a Delaware corporation operating primarily under the Einstein Bros. Bagels (“Einstein Bros.”), Noah’s New York Bagels (“Noah’s”) and Manhattan Bagel Company (“Manhattan Bagel”) brands. We commenced operations as an operator and franchisor of coffee cafes in 1993. Substantial growth in our restaurant counts have occurred organically and through a series of acquisitions. Our largest acquisition was in 2001 when we acquired substantially all the assets of Einstein/Noah Bagel Corp. We have also grown by opening company-owned restaurants, working with franchisees on development agreements and promoting the licensing of our brand.
We operate under a 52/53-week fiscal year ending on the Tuesday closest to December 31. Fiscal years 2010 and 2012 contained 52 weeks. Fiscal year 2011 contained 53 weeks. Comparable store sales percentages for fiscal 2011 presented elsewhere in this report are calculated excluding the 53rd week.
Financial information about segments:
We operate in three key business segments, which are supported by a centralized corporate operation:
| | • | | The “company-owned restaurants” segment includes the restaurants that we own. These restaurants have similar investment criteria, economic characteristics and operating characteristics. |
2
| | • | | The “manufacturing” segment produces and distributes bagel dough and other products to our company-owned restaurants, licensees and franchisees and other third parties. In an effort to help streamline our supply chain and to reduce our cost base, we began the process of closing our food commissary facilities in September 2011 and completed the closures by March 2012. |
| | • | | The “franchise and license” segment earns royalties and other fees from the use of trademarks and operating systems developed for the Einstein Bros. and Manhattan Bagel brands. |
| | • | | The “corporate support” unit consists of overhead and other activities related to the three key business segments, as well as interest on our debt and depreciation on our assets. |
See Note 19 to the consolidated financial statements included in Item 8 of this 10-K for the financial results by segment for fiscal years 2010, 2011 and 2012.
Narrative description of business:
We are the largest owner/operator, franchisor and licensor of bagel specialty restaurants in the United States. As of January 1, 2013, we had 816 restaurants in 39 states and in the District of Columbia. In January 2013, we opened an Einstein Bros. franchise in Montana, our fortieth state. As a leading fast-casual restaurant chain, our restaurants specialize in high-quality foods for breakfast, lunch and afternoon snacks in a bakery-café atmosphere with a neighborhood emphasis. Collectively, our concepts span the nation with Einstein Bros. restaurants, Noah’s restaurants in California and Manhattan Bagel restaurants concentrated in eight states primarily in the Northeast. Currently, our Einstein Bros. and Noah’s are predominantly company-owned or licensed and our Manhattan Bagel restaurants are predominantly franchised.
Our product offerings include fresh-baked bagels and other bakery items baked on-site, made-to-order breakfast and lunch sandwiches on a variety of bagels, breads or wraps, gourmet soups and salads, assorted pastries, premium coffees and an assortment of snacks. Our manufacturing and independent distribution network delivers high-quality ingredients that are delivered fresh to our restaurants. We seek to create an inviting atmosphere which enables us to attract a diverse group of customers, approximately 60% women and 40% men, primarily in the middle to upper-middle income brackets within our breakfast traffic.
We believe that controlling the development, sourcing, manufacturing and distribution of our key products is an important element in ensuring both quality and profitability. To support this strategy, we have developed proprietary recipes, invested in processing technology and manufacturing capacity, and aligned ourselves with strategic suppliers.
We also believe that through franchising and licensing, we are able to increase our geographic footprint and brand recognition. This allows us to generate additional revenues without incurring significant additional expenses, such as those for capital commitments and rents, and avoid many of the other risks associated with opening new company-owned restaurants.
Employees:
As of January 1, 2013, the Company had 6,912 employees, of whom 208 were corporate personnel, 87 were manufacturing personnel and 6,617 were restaurant personnel. Most restaurant personnel work part-time and are paid on an hourly basis. We have never experienced a work stoppage and our employees are not represented by a labor organization.
3
Company-owned restaurants
We generated approximately 90% of our fiscal 2012 total revenue from restaurant sales at our company-owned restaurants. For the fiscal year ended January 1, 2013, approximately 66% of our company-owned restaurant revenue was generated from restaurant sales during breakfast hours.
| | • | | Principal products and services sold:Einstein Bros. offers a menu that specializes in high-quality foods for breakfast and lunch, including fresh-baked bagels and hot breakfast sandwiches, cream cheese and other spreads, premium coffees, espresso and teas, freshly prepared lunch sandwiches, soups, salads and other unique menu offerings. Our company-owned Einstein Bros. restaurants generated approximately 83% of our total company-owned restaurant sales in fiscal 2012. |
Noah’s is a neighborhood-based, New York inspired bakery/deli restaurant that serves fresh-baked bagels, hot breakfast sandwiches, cream cheese and other spreads, premium coffees, espresso and teas, made-to-order deli-style sandwiches, soups, salads and other unique menu offerings. Our company-owned Noah’s restaurants generated approximately 16% of our total company-owned restaurant sales in fiscal 2012.
Manhattan Bagel provides a traditional New York style boil and baked bagel. Manhattan Bagel also serves a variety of grilled sandwiches, freshly made deli sandwiches, freshly prepared breakfast sandwiches, soups, and a variety of other fresh-baked sweets. Similar to Einstein Bros. and Noah’s, Manhattan Bagel also features a full line of fresh brewed coffees and premium coffee/espresso beverages. Our eight company-owned Manhattan Bagel restaurants generated approximately 1% of our total company-owned restaurant sales in 2012.
| | • | | Status of products/services:We are planning to open new company-owned restaurants under the Einstein Bros. brand within existing markets. Our expansion plans are intended to increase penetration of our restaurants into the most attractive markets. In fiscal 2012, we acquired eight restaurants from existing franchisees and sold one restaurant to an existing franchisee. We opened an additional fifteen company-owned restaurants and closed one company-owned restaurant. For 2013, we plan to open fifteen to twenty restaurants. |
Our enhanced coffee program, which we launched in 2011, has proven to be successful with coffee sales now representing over 10% of our menu mix and continuing to grow.
Throughout our Einstein Bros. restaurants, we have implemented an improved kitchen display ordering system (“KDS”). The KDS is designed to:
| | • | | Reduce the time our guests wait in line before they receive their food; |
| | • | | Improve production accuracy compared to a paper ticket process; and |
We believe catering is an effective way to generate incremental sales, drive trial and expose more people to our food and our brands. We recognize that an effective catering program requires different skills for effectively selling to businesses that frequently utilize catering. The software program that we use provides on-line ordering capabilities for our customers, which in turn helps us generate, fulfill and deliver catering sales. We believe that this change has reduced the cost of our catering program while at the same time providing a more robust method of attracting new customers and increasing the order frequency of existing customers. Additionally, we believe that our catering channel will continue to benefit from an outsourced and expanded call center, digital marketing and an optimized menu. Catering accounts for approximately 8% of our comparable company-owned restaurant sales.
| | • | | Product Supply:Our purchasing programs provide our restaurants with high quality ingredients at competitive prices from reliable sources. Consistent product specifications, as well as purchasing guidelines, help to ensure freshness and quality. Our company-owned restaurants purchase their products from approved vendors and/or from our manufacturing facility (at cost). Because we utilize fresh ingredients in most of our menu offerings, our inventory is maintained at modest levels. |
4
| | • | | Trademarks and service marks:Our rights in our trademarks and service marks are a significant part of all segments of our business. We are the owners of the federal registration rights to the “Einstein Bros.,” “Noah’s New York Bagels” and “Manhattan Bagel” marks, as well as several related word marks and word and design marks related to our core brands. We license the rights to use certain trademarks we own or license to our franchisees and licensees in connection with their operations. Many of our core brand trademarks are also registered in numerous foreign countries. We are party to a co-existence agreement with the Hebrew University of Jerusalem (“HUJ”), which sets forth the terms under which we can use the name Einstein Bros. and the terms and restrictions under which HUJ could license the name and likenesses associated with the Estate of Albert Einstein to a business that competes with us. We also own numerous other trademarks and service marks related to our other brands. We are aware of a number of companies that use various combinations of words in our marks, some of which may have senior rights to ours for such use, but we do not consider any of these uses, either individually or in the aggregate, to materially impair the use of our marks. It is our policy to defend our marks and their associated goodwill against encroachment by others. |
| | • | | Government Regulation:Our restaurants are subject to licensing and regulation by a number of governmental authorities, which include health, safety, labor, sanitation, building and fire agencies in the state, county, or municipality in which the restaurant is located. A failure to comply with one or more regulations could result in the imposition of sanctions, including the closing of restaurants for an indeterminate period of time, fines or third party litigation. |
| | • | | Seasonality:Our business is subject to seasonal fluctuations. Because of the seasonality of the business and the industry, results for any quarter are not necessarily indicative of the results that may be achieved for any other quarter or the full fiscal year. |
| | • | | Competition:The restaurant industry is intensely competitive. We experience competition from numerous sources in our trade areas. Our competitors are different for each daypart, with competition based on guests’ needs for breakfast, lunch and afternoon snacks. The competitive factors include brand awareness, advertising effectiveness, location and attractiveness of facilities, hospitality, environment, quality and speed of guest service and the price/value of products offered. We compete in the fast-casual segment of the restaurant industry, but we also consider other restaurants in the fast-food, specialty food and full-service segments to be our competitors. |
Manufacturing and Commissaries:
We generated approximately 7% of our fiscal 2012 total revenue from our manufacturing operations.
| | • | | Manufacturing:We currently operate a bagel dough manufacturing facility in Whittier, California and have contracts with two suppliers to produce bagel dough and sweets to our specifications. These facilities provide frozen dough, partially-baked frozen bagels and fully baked sweets for our company-owned restaurants, franchisees and licensees. We use excess capacity to produce bagels for sale to third party resellers. |
| | • | | Commissaries:We began the process of closing all our commissaries in September 2011 and completed the closures by March 2012. We decided to close our commissaries in an effort to streamline our supply chain and to reduce our costs. We estimate savings of approximately $1.5 million occurred in 2012 as a result of these closures and anticipate that the closing of these facilities will result in continued future annual cost savings of approximately $1.5 million. We recorded restructuring charges of $0.7 million during fiscal 2011 and $0.5 million during fiscal 2012 related to these closings. The commissaries accounted for less than 1% of our fiscal 2012 total revenue. |
| | • | | Product supply: We have proprietary recipes and production processes for our bagel dough, cream cheese and coffee. We believe these recipes ensure product consistency and that our processes provide |
5
| | for the delivery of a variety of consistent, superior quality products at competitive market prices to our company-owned, franchised and licensed restaurants. |
Frozen, or partially baked and frozen, bagel dough is shipped to all of our company-owned, franchised and licensed restaurants where the dough is then baked on-site. We believe that our significant know-how and technical expertise for manufacturing and freezing mass quantities of raw dough produces a high-quality product more commonly associated with smaller bakeries.
We negotiate price agreements and contracts depending on supply and demand for our products and commodity trends. These agreements can range in duration from six months to five years. Most of our commodity based food costs decreased in fiscal 2012 as a result of our locking in prices.
Wheat represents the most significant raw ingredient we purchase. In an effort to mitigate the risk of increasing market prices, we utilize a third party advisor to manage our wheat purchases. We will continue to work with our third party advisor to strategically source our wheat purchases. As of January 1, 2013, we have secured price protection on approximately 63% of our wheat needs for fiscal 2013.
We also have developed proprietary coffee blends for sale at our company-owned, franchised and licensed restaurants. In an effort to mitigate the risk of increasing market prices, we utilize a third party advisor to manage our coffee purchases. We have secured price protection on all of our coffee needs for fiscal 2013.
Our cream cheese is manufactured to our specifications utilizing proprietary recipes. Our cream cheese and sliced cheese products are purchased from one supplier under a contract that expires in 2016. As of January 1, 2013, our supplier has secured pricing on our behalf for 71% of our butter needs and 17% of our Class III milk needs, which are the primary ingredients of our cream cheese and sliced cheese products.
We purchase other ingredients used in our restaurants, such as meat, lettuce, tomatoes and condiments, from a select group of third party suppliers. Our chicken products come from chickens that are cared for in strict accordance with established animal care guidelines and without the use of growth accelerators such as steroids or hormones. Where available, we buy high quality fresh fruits, vegetables and specialty produce from a nationally recognized group of third party suppliers and distributors.
Key products provided by single source suppliers in fiscal 2012 were as follows:
| | | | |
Supplier | | Key Product | |
Schreiber Foods, Inc. | | | Cream cheese | |
Schreiber Foods, Inc. | | | Sliced cheese | |
| | • | | Government regulation:Our manufacturing facility is licensed and subject to regulation by federal, state and local health and fire codes. Additionally, we are also subject to federal and state environmental regulations. |
| | • | | Competition: Our manufacturing operations are primarily ancillary and support our company-owned restaurant operations, as well as our franchisees and licensees. Our competition is from several large bakeries and from local bakeries in the states in which we operate. |
Franchise and Licensing
Approximately 3% of our 2012 total revenue was generated by our franchise and license operations. Revenue from our franchise and licensing segments are derived from initial up-front fees, royalties on net sales and the purchases of our proprietary products from our manufacturing plant.
| | • | | Einstein Bros. franchising:We offer Einstein Bros. franchises to qualified area developers. As of January 1, 2013, we were registered to offer Einstein Bros. franchises in 49 states and the District of Columbia. |
6
We franchise rights to develop restaurants within a defined geographic region within a specified period of time. We are targeting potential franchisees that have the existing infrastructure, operational experience and financial strength to develop several restaurants in a designated market. The franchise agreement requires an up-front fee of $35,000 per restaurant and a 5% royalty based on net sales. Our Einstein Bros. franchise restaurants that have been open for one year generally have average unit volumes of approximately $859,000.
| | • | | Manhattan Bagel franchising:We also have a franchise base in our Manhattan Bagel brand. The typical Manhattan Bagel franchise agreement requires an up-front fee of $25,000 per restaurant and a 5% royalty based on net sales. Our Manhattan Bagel franchise base provides us with the ability to grow this brand with minimal commitment of capital by us, and creates a built-in customer base for our manufacturing operations. Our Manhattan Bagel franchise restaurants that have been open for one year generally have average unit volumes of approximately $605,000. |
| | • | | Licensing:Our licensed units are located primarily in colleges and universities, hospitals, airports and military bases. Our license agreements vary by venue, but typically have a five-year term and provide that the licensee pays us an up-front license fee of $12,500 and a weighted average royalty fee of 6.6%. Our license restaurants that have been open for one year generally have average unit volumes of approximately $450,000, reflecting the predominance of college campus locations with a profitable but condensed selling season. |
| | • | | Status of development plans or expansion: We are planning to expand our presence through a significant expansion of franchise and license restaurants. We are continuously signing new franchise development agreements and there could be the potential to sell existing company-owned restaurants to prospective franchisees. This strategy allows us to generate additional revenues without incurring significant additional expense, capital commitments or many of the other risks associated with opening new company-owned restaurants. We continue to actively market the Einstein Bros. brand franchise rights in an effort to sign multi-location deals. As of February 25, 2013, we have 28 development agreements in place for 136 total restaurants, 34 of which have already opened. Based upon the development agreements, we expect the remaining 102 new restaurants will open on various dates through 2021. In fiscal 2012, we opened 13 franchised locations and 27 licensed locations. We are currently planning to open 15 to 20 franchise restaurants and 30 to 40 license restaurants in fiscal 2013. |
| | • | | Product supply:Our franchisees and licensees are required to purchase proprietary products through our designated suppliers or directly from us. |
| | • | | Seasonality:This segment is subject to the same seasonal fluctuations as our company-owned restaurant segment. Additionally, as many of our license locations are on college and university campuses, they are impacted by school schedules which typically include summer and winter breaks. Because of the seasonality of the business and the industry, results for any quarter are not necessarily indicative of the results that may be achieved for any other quarter or the full fiscal year. |
| | • | | Government regulation:Our franchise operations are subject to Federal Trade Commission (the “FTC”) regulation and various state laws which regulate the offer and sale of franchises. Several state laws also regulate substantive aspects of the franchisor/franchisee relationship. The FTC requires us to furnish to prospective franchisees a franchise disclosure document containing prescribed information. A number of states in which we might consider franchising also regulate the sale of franchises and require registration of the disclosure document with state authorities. Our ability to sell franchises in those states is dependent upon obtaining approval of our disclosure document by those authorities. |
| | • | | Competition:We compete against similar fast-casual and quick-casual restaurants that franchise and license their brands in the states where we operate. |
7
Corporate Support
| | • | | Principal products/services sold: The support center is not a profit center and is designed to manage and support all of our operations as well as provide general corporate governance. |
Financial information about geographic areas:
Our manufacturing operations sell bagels to third parties who take possession in the United States and sell outside of the United States. As the product is shipped FOB domestic dock, invoiced in U.S. dollars and paid in U.S. dollars, there are no international risks of loss or foreign exchange currency issues. Export sales are included in manufacturing and commissary revenue, and were $5.3 million, $7.1 million and $8.8 million for fiscal years 2010, 2011 and 2012, respectively. We attribute these increases in revenue to increased sales volume. All other revenues were from sales to external customers located in the United States.
Available Information:
We are subject to the informational requirements of the Exchange Act. We therefore file periodic reports, proxy statements and other information with the Securities Exchange Commission (the “SEC”). Such reports may be obtained by visiting the Public Reference Room of the SEC at 100 F Street, N.E., Washington, D.C. 20549, or by calling the SEC at 1-800-SEC-0330. In addition, the SEC maintains an internet site (www.sec.gov) that contains reports, proxy and information statements and other information regarding issuers that file electronically.
Additionally, copies of our reports on Forms 10-K, 10-Q and 8-K and any amendments to such reports are available for viewing and copying through our internet site (www.einsteinnoah.com), free of charge, as soon as reasonably practicable after filing such material with, or furnishing it to, the SEC. We typically post information about us on our website under the Financial & Media tab. We do not incorporate any information found on or accessible through our website into this Annual Report on Form 10-K.
We also make available on our website and in print to any stockholder who requests it, our Audit and Compensation Committees charters, as well as the Code of Conduct that applies to all directors, officers and associates of the company. Amendments to these documents or waivers related to the Code of Conduct will be made available on our website as soon as reasonably practicable after their execution.
Executive Officers of the Registrant:
| | | | | | |
Name | | Age | | | Position |
Jeffrey J. O’Neill | | | 56 | | | President, Chief Executive Officer and Director |
Emanuel P.N. Hilario | | | 45 | | | Chief Financial Officer |
Rhonda J. Parish | | | 56 | | | Chief Legal, People and Risk Officer, and Secretary |
Brian L. Unger | | | 56 | | | Chief Restaurant Officer |
Jeffrey J. O’Neill. Mr. O’Neill joined us in December 2008 when he was appointed President and Chief Executive Officer. Previously, Mr. O’Neill worked for Priszm Income Fund from April 2005 to November 2008. At that time, Priszm was a publicly traded Canadian restaurant income trust with a portfolio of popular brands such as Pizza Hut and Taco Bell and was one of the largest independent KFC franchisees in the world. Mr. O’Neill joined Priszm as President and Chief Operating Officer and was promoted to Chief Executive Officer in January 2008. Mr. O’Neill began his career in Brand Marketing with The Quaker Oats Company. In April 1999, he joined PepsiCo as the President of Pepsi Cola Canada. In 2002, PepsiCo acquired the Quaker Oats Company and in January 2003, Mr. O’Neill returned to Chicago to help lead the integration of the Quaker Oats/Gatorade acquisition. Mr. O’Neill has an Honors Bachelor of Business degree from the University of Ottawa.
8
Emanuel P.N. Hilario. Mr. Hilario joined us in May 2010 as Chief Financial Officer. Previously, Mr. Hilario served as the Founder and Managing Director of Koios Path, LLC, a management advisory and consulting services company from May 2009 until May 2010. Prior to that, he served as Chief Financial Officer of McCormick & Schmick’s Seafood Restaurants, Inc. from April 2004 until May 2009 and was elected to their Board of Directors in May 2007 where he served as a Director until July 2009. From April 2000 to April 2004, Mr. Hilario held various positions lastly serving as Vice President and Chief Financial Officer of Angelo and Maxie’s, Inc., which was formerly known as Chart House Enterprises, Inc. Mr. Hilario began his career at McDonald’s Corporation. Mr. Hilario holds a B.S. degree in Commerce and Accounting from Santa Clara University.
Rhonda J. Parish. Ms. Parish joined us in January 2010 as Chief Legal, People and Risk Officer. Before joining us, she took a personal sabbatical from August 2008 to December 2009. Ms. Parish worked for Denny’s Corporation from January 1995 to July 2008. She joined Denny’s Corporation as Senior Vice President and General Counsel and was promoted to Executive Vice President/Chief Legal Officer and Secretary of Denny’s Corporation in July 1998. Prior to this, Ms. Parish served as Assistant General Counsel for Wal-Mart Stores, Inc. Ms. Parish received a B.S. degree in Political Science from the University of Central Arkansas and her J.D. degree from the University of Arkansas School of Law.
Brian L. Unger. Mr. Unger joined us in March 2011 as Executive Vice President of Operations. He was appointed Chief Restaurant Officer in February 2012. Mr. Unger began his operations career with McDonald’s in Downers Grove, Illinois in 1985, and joined McDonald’s International group in 1991, working in Latin America. He moved to Puerto Rico in 1992, where he was named Director of Operations for Central America and the Caribbean. In 1997, Mr. Unger was appointed Director of Operations for Latin America, and in 2003, was named President of the Caribbean Region. He returned to the U.S. business in 2005 as Senior Vice President/General Manager McOpCo West Division in McDonald’s USA. In 2009, Mr. Unger moved to Toronto, Canada to lead Canadian corporate operations as Vice President, McDonald’s Canada. Mr. Unger holds a B.A. degree in Criminal Justice from California State University, Sacramento.
9
Ownership of our common stock involves certain risks. Holders of our common stock and prospective investors should carefully consider the following risks and other information in this document, including our historical financial statements and related notes included herein. The following risk factors could materially adversely affect our business, consolidated financial condition and results of operations. This could cause the trading price of our common stock to decline, perhaps significantly, and you may lose part or all of your investment. The risk and uncertainties below are all those that we have identified as material, but may not be the only risks and uncertainties facing us. Our business is subject to general risks and uncertainties that affect many other companies, including overall economic and industry conditions.
Risk Factors Relating to Our Business and Our Industry
General economic conditions, including continuing effects from the recent recession, have affected, and could continue to affect, discretionary consumer spending, particularly spending for meals prepared away from home.
We, together with the rest of the restaurant industry, depend upon consumer discretionary spending. The recent recession, coupled with lay-offs, high unemployment rates, foreclosures, bankruptcies, falling home prices and other economic impacts has affected consumers’ ability and willingness to spend discretionary dollars. In recent years, restaurants industry-wide have been adversely affected as a result of reduced consumer spending due to these and other factors. If the weak economy continues for a prolonged period of time or worsens, it could further reduce discretionary consumer spending, cause consumers to trade down to lower priced products within our restaurants, and/or shift to competitors with lower priced products, which in turn could reduce our guest traffic or average check. If negative economic conditions persist for a long period of time or worsen, consumers may make long-lasting changes to their discretionary purchasing behavior, including less frequent discretionary purchases on a more permanent basis. Adverse changes in consumer discretionary spending could be affected by many different factors that are out of our control, including international, national and local economic conditions, any of which could harm our business prospects, financial condition, operating results and cash flows. Our success will depend in part upon our ability to anticipate, identify and respond to changing economic and other conditions.
Failure to protect food supplies and adhere to food safety standards could result in food-borne illnesses and adversely affect our business.
We believe that food safety and reputation for quality is of significant importance to any company that, like us, operates in the restaurant industry. Food safety is a focus of increased government regulatory initiatives at the local, state and federal levels.
Failure to protect our food supply or enforce food safety policies, such as proper food temperatures and adherence to shelf life dates, could result in food-borne illnesses and/or injuries to our guests. Also, our reputation of providing high quality food is an important factor in our guests choosing our restaurants. Instances of food borne illness or other food safety issues, including food tampering and food contamination, whether or not traced to our restaurants or those of our competitors, could reduce demand for certain or all of our menu offerings. If any of our guests become ill from consuming our products, the affected restaurants may be forced to close and we may be subject to legal liability. An instance of food contamination originating from one of our restaurants, our suppliers, or our manufacturing plant could have far-reaching effects, as the contamination, or the perception of contamination could affect substantially all of our restaurants. Publicity related to either product contamination or recalls may also injure our brand and may affect the selection of our restaurants by guests, franchisees and licensees based on fear of such illnesses. In addition, the occurrence of food-borne illnesses or food safety issues could also adversely affect the price and availability of affected ingredients, which could result in disruptions in our supply chain and/or lower margins for us and our franchisees and licensees.
10
Increases in commodity prices would adversely affect our results of operations.
Global demand for commodities such as wheat, coffee and dairy products has resulted, and could in the future result, in higher prices which would increase our costs. The prices of our main ingredients are directly associated with the changing weather conditions as well as economic factors such as supply and demand of certain commodities within the United States and other countries. Our ability to forecast and manage our commodities could significantly affect our gross margins. Any increase in the prices of the ingredients most critical to our products could adversely affect our operating results.
Additionally, in the event of the destruction of products such as tomatoes, peppers or massive culling of specific animals such as chickens or turkeys to prevent the spread of disease, the supply and availability of ingredients may become limited. This could dramatically increase the price of certain menu items which could decrease sales of those items or could force us to eliminate those items from our menus entirely. All of these factors could adversely affect our business, reputation and financial results.
Any material failure, inadequacy, interruption or security failure of information technology could harm our ability to effectively operate our business.
We rely on information technology systems across our operations, including for management of supply chain, point-of-sale (“POS”) processing in our restaurants, and various other processes and transactions. Our ability to effectively manage our business and coordinate the production, distribution and sale of products depends on the reliability and capacity of these systems. Despite our implementation of security measures, all of our technology systems are vulnerable to damage, disability or failures due to physical theft, fire, power loss, telecommunications failure or other catastrophic events, as well as from internal and external security breaches, denial of service attacks, viruses, worms and other disruptive problems caused by hackers. The failure of these systems to operate effectively, problems with transitioning to upgraded or replacement systems, or a breach in security of these systems could cause delays in product sales and reduced efficiency of the Company’s operations, and significant capital investments could be required to remediate the problem.
Credit and debit card data loss, litigation and/or liability could significantly harm our reputation and adversely impact our business.
In connection with credit and debit card sales, we transmit confidential credit and debit card information securely over public networks. Third parties may have the technology or know-how to breach the security of this customer information, and our security measures may not effectively prohibit others from obtaining improper access to this information. If a person is able to circumvent our security measures, he or she could destroy or steal valuable information or disrupt our operations. Several companies in a variety of industries recently have reported security breaches during which credit/debit card or other personal identifying information has been compromised. Any security breach could expose us to risks of data loss, litigation and liability and could seriously disrupt our operations and any resulting negative publicity could significantly harm our reputation. Furthermore, as a result of legislative and regulatory rules, we may be required to notify the owners of the information of any data breaches, which could harm our reputation and financial results, as well as subject us to litigation or actions by regulatory authorities.
Unsuccessful implementation of any or all of the initiatives of our business strategy could negatively impact our operations.
Our success depends in part on our ability to understand and satisfy the needs of our guests, franchisees and licensees. Our key strategies are to:
| | • | | drive comparable store sales growth; |
| | • | | manage corporate margins; and |
| | • | | accelerate unit growth. |
11
Our ability to achieve any or all of these initiatives is uncertain. Our success in expanding sales at company-owned restaurants through various sub-initiatives is dependent in part on our ability to offer value to consumers, attract new customers, predict and satisfy consumer preferences and our consumers’ ability to respond positively in a challenging economic environment. Our sub-initiatives include: the promotion and offering of value to our customers through marketing, discounts, coupons and new menu offerings and broadening our offerings across multiple dayparts; the improvement of our ordering and production systems; the expansion of our catering program; and the upgrade of our restaurants
Our success in growing our business through opening new company-owned restaurants is dependent on a number of factors, including our ability to: find suitable locations, reach acceptable lease terms, have adequate capital, find acceptable contractors, obtain licenses and permits, manage construction and development costs, recruit and train appropriate staff and properly manage the new restaurant. Our success in opening new franchise and license restaurants is dependent upon, among other factors, our ability to: attract quality businesses with the interest and desire to invest/purchase in our core brands, maintain the effectiveness of our franchise disclosure documents in target states, offer restaurant solutions for a variety of location types and the ability of our franchisees and licensees to: find suitable locations, reach acceptable lease terms, have adequate capital, secure reasonable financing, find available contractors, obtain licenses and permits, manage construction and development costs, locate and train staff appropriately and properly manage the new restaurants. Our success in expanding our franchise business is dependent upon signing additional development agreements along with the refranchising our company-owned restaurants. If we are not successful in implementing any or all of the initiatives of our business strategy, it could have a material adverse effect on our business, results of operations, and financial condition.
Competition in the restaurant industry is intense.
Our industry is highly competitive and there are many well-established competitors, some of which have substantially greater resources than we do. While we operate in the fast-casual segment of the restaurant industry, we also consider restaurants in the fast-food and full-service segments as competitors. We believe that several of our competitors are focusing more on breakfast offerings and expanding their specialty coffee offerings. This could further increase competition in the breakfast daypart. In addition to current competitors, one or more new major competitors with substantially greater financial, marketing and operating resources could enter the market at any time and compete directly against us. Also, in virtually every major metropolitan area in which we operate or expect to enter, local or regional competitors already exist. This may make it more difficult to attract and retain guests and potential franchisees and licensees.
Our success depends in large part on our continued ability to convince customers that food made with higher-quality ingredients, including our fresh-baked bagels, premium coffee, and made-to-order breakfast and lunch sandwiches, is worth the prices at our restaurants relative to lower prices offered by some of our competitors. Numerous factors including changes in consumer tastes and preferences often affect restaurants. Shifts in consumer preferences away from our type of cuisine and/or the fast-casual style could have a material effect on our results of operations. Dietary trends, such as the consumption of food low in carbohydrate content have, in the past, and may, in the future, negatively impact our sales. Changes in our guests’ spending habits and preferences could have a material adverse effect on our sales. Our results will depend on our ability to respond to changing consumer preferences and tastes. In addition, recent local and state regulations mandating prominent disclosure of nutritional and calorie information may result in reduced demand for some of our products which could be viewed as containing too much fat or too many calories.
We occupy our company-owned restaurants under long-term non-cancelable leases, and we may be unable to renew leases at the end of their lease periods or obtain new leases on acceptable terms.
We do not own any real property, and all of our company-owned restaurants are located in leased premises. Many of our current leases are non-cancelable and typically have terms ranging from five to ten years with two three- to five-year renewal options. We believe leases that we enter into in the future likely will also be long-term
12
and non-cancelable and have similar renewal options. Most of our leases provide that the landlord may increase the rent over the term of the lease, and require us to pay our proportionate share of the cost of insurance, taxes, maintenance and utilities. If we close a restaurant, we generally remain committed to perform our obligations under the applicable lease, which would include, among other things, payment of the base rent for the balance of the lease term. In some instances, we may be unable to close an underperforming restaurant due to continuous operation clauses in our lease agreements. Our obligation to continue making rental payments in respect of leases for closed or underperforming restaurants could have an adverse effect on our business and results of operations.
If we are unable to renew our restaurant leases, we may be forced to close or relocate a restaurant, which could subject us to construction and other costs and risks, and could have a material adverse effect on our business and results of operations. For example, closing a restaurant, even during the time of relocation, will reduce the sales that the restaurant would have contributed to our revenues. Additionally, the revenue and profit, if any, generated at a relocated restaurant may not equal the revenue and profit generated at the prior location. We also face competition from both restaurants and other retailers for suitable sites for new restaurants.
Our operations may be negatively impacted by seasonality, adverse weather conditions, natural disasters or acts of terror.
Our business is subject to seasonal fluctuations, as well as adverse weather conditions and natural disasters that may at times affect regions in which our company-owned, franchised and licensed restaurants are located, regions that produce raw ingredients for our restaurants, or locations of our distribution network. As a result of the seasonality of our business and our industry, our quarterly and yearly results have varied in the past, and we believe that our quarterly operating results will vary in the future.In addition, if adverse weather conditions or natural disasters such as fires and hurricanes affect our restaurants, we could experience closures, repair and restoration costs, food spoilage, and other significant reopening costs as well as increased food costs and delayed supply shipments, any of which would adversely affect our business. We could also experience shortages or delayed shipments at our restaurants if adverse weather or natural disasters affect our distribution network, which could adversely affect our restaurants and our business as a whole. Additionally, during periods of extreme temperatures (either hot or cold) or precipitation, many individuals choose to stay indoors. This impacts transaction counts in our restaurants and could adversely affect our business and results of operations.
The effects of hurricanes, fires, snowstorms, freezes and other adverse weather conditions are likely to affect supply of and costs for raw ingredients and natural resources, near-term construction costs for our new restaurants as well as sales in our restaurants going forward. If we do not anticipate or react to changing costs of food and other raw materials by adjusting our purchasing practices or menu prices, our operating margins would likely deteriorate.
The impact on our business from terrorism (including cyber-terrorism or efforts to tamper with food supplies) could have an adverse impact on our brand and results of operations.
We have single suppliers and vendors for many of our key products and the failure of any of these suppliers or vendors to perform could harm our business.
We currently purchase our raw materials from various suppliers; and in some cases, we have selected a single supplier for a key product to take advantage of economies of scale. We have elected to purchase all of our cream cheese from a single supplier. Also, we purchase a majority of our frozen bagel dough from one supplier, who uses our proprietary processes and on whom we are dependent in the short-term. All of our remaining frozen bagel dough is produced at our dough manufacturing facility in Whittier, California or by a second supplier. Although to date we have not experienced significant difficulties with our suppliers, our choice to purchase most of our key ingredients from respective suppliers subjects us to a number of risks, including possible delays or interruption in supplies, diminished control over quality and a potential lack of adequate raw material capacity. A significant disruption in the supply or degradation in the quality of the materials provided by our suppliers could
13
have a material adverse effect on our business, operating results and financial condition until we select another supplier.
Distribution disruptions or other distribution issues could adversely affect our business and reputation.
We depend on our network of independent regional distributors to distribute frozen bagel dough and other products and materials to our company-owned, franchised and licensed restaurants. Any failure by one or more of our distributors to perform as anticipated, or any disruption in any of our distribution relationships for any reason, would subject us to a number of risks, including inadequate products delivered to our restaurants, diminished control over quality of products delivered, and increased operating costs to prevent delays in deliveries. Any of these events could harm our relationships with our franchisees or licensees, or diminish the reputation of our menu offerings or our brands in the marketplace. In addition, a negative change in the volume of products ordered from our distributors by our company-owned, franchised and licensed restaurants could increase our distribution costs. These risks could have a material adverse effect on our business, financial condition and results of operations.
Increased costs and distribution issues related to fuel and utilities could also materially impact our business and results of operations.
Increasing labor costs or labor discord could adversely affect our results of operations and cash flows.
We depend upon an available labor pool of associates, many of whom are hourly employees whose wages may be affected by increases in the federal, state or municipal “living wage” rates. Numerous increases have been made on federal, state and local levels to increase minimum wage levels. Many states have increased their minimum hourly wage rate above that of the federal rate with adjustments to many state rates effective in 2012 and 2013. Increases in the minimum wage may create pressure to increase the pay scale for our associates, which would increase our labor costs and those of our franchisees and licensees.
A shortage in the labor pool or other general inflationary pressures or changes could also increase labor costs. Changes in the labor laws, reclassifications of associates from management to hourly employees, or the potential impact of union organizing efforts could affect our labor cost. An increase in labor costs could have a material adverse effect on our income from operations and decrease our profitability and cash flows if we are unable to recover these increases by raising the prices we charge our guests.
In March 2010, comprehensive health care reform legislation was passed and signed into law. Among other things, the health care reform legislation includes guaranteed coverage requirements, eliminates pre-existing condition exclusions and annual and lifetime maximum limits, restricts the extent to which policies can be rescinded, and imposes new and significant taxes on health insurers and health care benefits. Due to the breadth and complexity of the health care reform legislation, the lack of implementing regulations and interpretive guidance, and the phased-in nature of the implementation, it is difficult to predict the overall impact of the health care reform legislation on our business over the coming years, but our results of operations, financial position and cash flows could be materially affected.
We may not be able to comply with certain debt covenants or generate sufficient cash flow to make payments on our debt or to pay dividends to our stockholders in the future.
Our current credit facility contains certain covenants, which, among others, include certain financial covenants such as limitations on capital expenditures, maintenance of the business, use of proceeds from sales of assets and consolidated leverage and fixed charge coverage ratios as defined in the agreements. We are subject to multiple economic, financial, competitive, legal and other risks that are beyond our control and could harm our future financial results. Any adverse effect on our business or financial results could affect our ability to maintain compliance with our debt covenants, and any failure by us to comply with these covenants could result in an
14
event of default. If we were to default under our covenants and such default were not cured or waived, our indebtedness could become immediately due and payable, which could render us insolvent.
We have $136.7 million in debt as of January 1, 2013. In addition, we may, subject to certain restrictions, incur substantial additional indebtedness in the future. Our debt, among other things, could:
| | • | | make it difficult for us to satisfy our obligations under our indebtedness; |
| | • | | limit our ability to obtain additional financing for working capital, capital expenditures, acquisitions and general corporate purposes; |
| | • | | increase our vulnerability to downturns in our business or the economy generally; |
| | • | | increase our vulnerability to volatility in interest rates; and |
| | • | | limit our ability to withstand competitive pressures from our less leveraged competitors. |
Economic, financial, competitive, legislative and other factors beyond our control may affect our ability to generate cash flow from operations to make payments on our indebtedness, to fund necessary working capital or to pay dividends to our stockholders in the future. A significant reduction in operating cash flow would likely increase the need for alternative sources of liquidity. If we are unable to generate sufficient cash flow to make payments on our debt, we will have to pursue one or more alternatives, such as reducing or delaying capital expenditures, refinancing our debt on terms that are not favorable to us, selling assets or issuing additional equity securities. We may not be able to accomplish any of these alternatives on satisfactory terms, if at all, and even if accomplished, they may not yield sufficient funds to service our debt.
We face the risk of adverse publicity and litigation in connection with our operations.
We are from time to time the subject of complaints or litigation from our consumers alleging illness, injury or other food quality, health or operational concerns. Adverse publicity resulting from these allegations may materially adversely affect us and our brand, regardless of whether the allegations are valid or whether we are liable. In addition, third party and employee claims against us based on, among other things, alleged discrimination, harassment or wrongful termination, or labor code violations may divert financial and management resources that would otherwise be used to benefit our future performance. There is also a risk of litigation from our franchisees and licensees. We have been subject to a variety of these and other claims from time to time and a significant increase in the number of these claims or the number that are successful could materially adversely affect our business, prospects, financial condition, operating results or cash flows.
A regional or global health pandemic could severely affect our business.
A health pandemic is a disease that spreads rapidly and widely by infection and affects many individuals in an area or population at the same time. If a regional or global health pandemic were to occur, depending upon its duration and severity, our business could be severely affected. We have positioned ourselves as a “neighborhood atmosphere” between home and work where people can gather for human connection and high quality food. Customers might avoid public gathering places in the event of a health pandemic, and local, regional or national governments might limit or ban public gatherings to halt or delay the spread of disease. A regional or global pandemic might also adversely impact our business by disrupting or delaying production and delivery of products and materials in our supply chain and causing staff shortages in our restaurants. The impact of a health pandemic might be disproportionately greater on us than on other companies that depend less on the gathering of people in a neighborhood atmosphere.
Approximately 42% of our restaurants are concentrated in five main states and, as a result, we are sensitive to economic and other trends and developments in these states.
As of January 1, 2013, 344 of our restaurants were located in five states (California, Colorado, Florida, Illinois and Texas). As a result, we are particularly susceptible to adverse trends and economic conditions in
15
these states, including their labor markets. Several of these markets have been particularly affected by the economic downturn and the timing and strength of any economic recovery is uncertain. Our geographic concentration increases vulnerability to general adverse economic and industry conditions and may have a disproportionate effect on our overall results of operations as compared to some of our competitors that may have less restaurant concentration. In addition, given our geographic concentration, negative publicity regarding any of our restaurants in these states could have a material adverse effect on our business and operations, as could other regional occurrences such as local labor strikes, energy shortages or increases in energy prices, droughts, earthquakes, fires, or other natural disasters.
Our franchisees and licensees may not help us develop our business as we expect, or could take actions that harm our business.
We rely in part on our franchisees and licensees and the manner in which they operate their restaurants to develop and promote our business. Franchisees and licensees are independent operators and are not our employees. As we offer and grant franchises for our Einstein Bros. and Manhattan Bagel brands, our reliance on our franchisees is expected to increase in proportion to growth of the franchisee base. With respect to franchising our Einstein Bros. brand, we may not be able to identify franchisees that meet our criteria, or to enter into franchise area development agreements with prospective franchisee candidates that we identify. As a result, our franchise program for the Einstein Bros. brand may not grow at the rate we currently expect, or at all.
Although we have developed criteria to evaluate and screen prospective candidates, we are limited in the amount of control we can exercise over our franchisees and licensees, and the quality of franchised and licensed restaurant operations may be diminished by any number of factors beyond our control. Franchisees and licensees may not have the business acumen or financial resources necessary to operate successful restaurants in a manner consistent with our standards and requirements and may not hire and train qualified managers and other restaurant personnel. Poor restaurant operations may affect each restaurant’s sales. Our image and reputation, and the image and reputation of other franchisees and licensees, may suffer materially and system-wide sales could significantly decline if our franchisees do not operate successfully. In addition, franchisees and licensees are subject to business risks similar to those we face such as competition; consumer acceptance; fluctuations in the cost, availability and quality of raw ingredients; increasing labor costs; and difficultly obtaining proper financing as a result of the downturn in the credit markets. The failure of franchisees and licensees to meet their development obligations or to operate successfully could have a material adverse effect on us, our reputation, our ability to collect royalties, our brands and our ability to attract prospective candidates.
Our restaurants and products are subject to numerous and changing government regulations. Failure to comply with or substantial changes in government regulations could negatively affect our sales, increase our costs or result in fines or other penalties against us.
Each of our restaurants is subject to licensing and regulation by the health, sanitation, safety, labor, building and fire agencies of the respective states, counties, cities and municipalities in which it is located. A failure to comply with one or more regulations could result in the imposition of sanctions, including the closing of facilities for an indeterminate period of time, or third party litigation, any of which could have a material adverse effect on us and our results of operations.
Recently, many government bodies have begun to legislate or regulate high-fat and high sodium foods and require disclosure of nutritional information as a way of combating concerns about obesity and health. In addition to the phase-out of artificial trans-fats, public interest groups have focused attention on the marketing of high-fat and high-sodium foods to children in a stated effort to combat childhood obesity. Some cities and states have recently adopted or are considering regulations requiring disclosure of nutritional facts, including calorie information, on menus and/or menu boards. Additional cities or states may propose or adopt similar regulations. The cost of complying with these regulations could increase our expenses and the possible negative publicity arising from such legislative initiatives could reduce our future sales.
16
Our franchising operations are subject to regulation by the Federal Trade Commission. We must also comply with state franchising laws and a wide range of other state and local rules and regulations applicable to our business. In addition, the Dodd-Frank Act and the rules promulgated thereunder may impose new business or disclosure obligations on us. The failure to comply with or substantial changes in federal, state and local rules and regulations would have an adverse effect on us.
Under various federal, state and local laws, an owner or operator of real estate may be liable for the costs of removal or remediation of certain hazardous or toxic substances on or in such property. Such liability may be imposed without regard to whether the owner or operator knew of, or was responsible for, the presence of such hazardous or toxic substances. Although we are not aware of any environmental conditions that require remediation by us under federal, state or local law at our properties, we have not conducted a comprehensive environmental review of our properties or operations. We may not have identified all of the potential environmental liabilities at our properties, and any such liabilities that are identified in the future may have a material adverse effect on our financial condition. Moreover, the adoption of new or more stringent environmental laws or regulations could result in a material liability to us and the current environmental condition of our leased properties could be harmed by third parties or by the condition of land or operations in the vicinity of our leased properties.
We may not be able to protect our brands, trademarks, service marks and other proprietary rights.
Our brands, which include our trademarks, service marks and other proprietary rights, are important to our success and our competitive position. Accordingly, we devote substantial resources to the establishment and protection of our brands. However, the actions we take may be inadequate to prevent imitation of our products and concepts by others, to prevent various challenges to our registrations or applications or denials of applications for the registration of trademarks, service marks and proprietary rights in the U.S. or other countries, or to prevent others from claiming violations of their trademarks and proprietary marks. In addition, others may assert rights in our trademarks, service marks and other proprietary rights.
The loss of key personnel or difficulties recruiting and retaining qualified personnel could adversely affect our business and financial results.
Our success depends substantially on the contributions and abilities of key executives and other employees, and on our ability to recruit and retain high quality employees to work in and manage our restaurants. We must continue to recruit, retain and motivate management and other employees sufficient to maintain our current business and support our projected growth. A loss of key employees or a significant shortage of high quality restaurant employees to maintain our current business and support our projected growth could adversely affect our business and financial results.
Our ability to use net operating loss carryforwards to offset future taxable income for U.S. federal income tax purposes would be limited if an ownership change occurs.
In general, under Section 382 of the Internal Revenue Code (“§382”), a corporation that undergoes an “ownership change” is subject to limitations on its ability to utilize its pre-change net operating loss (“NOL”) carryforwards to offset future taxable income. A corporation generally undergoes an “ownership change” when the stock ownership percentage (by value) of its “5 percent stockholders” increases by more than 50 percentage points over any three-year testing period.
Due to transactions involving the sale or other transfer of our stock from the date of our last ownership change through the date of the secondary public offering of our common stock, and changes in the value of our stock during that period, any new offerings may result in an additional ownership change for purposes of §382 or will significantly increase the likelihood that we will undergo an additional ownership change in the future (which could occur as a result of transactions involving our stock that are outside of our control). In either event,
17
the occurrence of an additional ownership change would limit our ability to utilize approximately $84.1 million of our NOL carryforwards that are not currently subject to limitation, and could further limit our ability to utilize our remaining NOL carryforwards and possibly other tax attributes. Limitations imposed on our ability to use NOL carryforwards and other tax attributes to offset future taxable income could cause us to pay U.S. federal income taxes earlier than we otherwise would if such limitations were not in effect, and could cause such NOL carryforwards and other tax attributes to expire unused, in each case reducing or eliminating the benefit of such NOL carryforwards and other tax attributes to us and adversely affecting our future cash flow. Similar rules and limitations may apply for state income tax purposes as well.
Failure of our internal controls over financial reporting could harm our business and financial results.
Our management is responsible for establishing and maintaining effective internal control over financial reporting. Internal control over financial reporting is a process to provide reasonable assurance regarding the reliability of financial reporting for external purposes in accordance with accounting principles generally accepted in the United States. Because of its inherent limitations, internal control over financial reporting is not intended to provide absolute assurance that we would prevent or detect a misstatement of our financial statements or fraud. Any failure to maintain an effective system of internal control over financial reporting could limit our ability to report our financial results accurately and timely or to detect and prevent fraud. A significant financial reporting failure or material weakness in internal control over financial reporting could cause a loss of investor confidence and decline in the market price of our stock.
Risk Factors Relating to Our Common Stock
We have a majority stockholder and are a “controlled company”.
Greenlight Capital, L.L.C. and its affiliates (“Greenlight”) beneficially own approximately 63% of our common stock as of January 1, 2013. As a result, Greenlight has sufficient voting power, without the vote of any other stockholders, to determine what matters will be submitted for approval by our stockholders to elect all of the members of our board of directors, and to determine whether a change in control of the Company occurs. Greenlight’s interests on matters submitted to stockholders may be different from those of other stockholders. Greenlight has voted its shares to elect our current board of directors, and the chairman of our board of directors was an employee of Greenlight until February 2011, when he retired from Greenlight.
We have listed our common stock on the NASDAQ Global Market. NASDAQ rules require us to have an audit committee consisting entirely of independent directors. However, under NASDAQ rules, if a single stockholder holds more than 50% of the voting power of a listed company, that company is considered a “controlled company”, and is exempt from several other corporate governance rules, including the requirement that companies have a majority of independent directors and independent director involvement in the selection of director nominees and in the determination of executive compensation. As a result, our stockholders do not have, and may never have, the protections that these rules are intended to provide. We currently have a majority of independent directors on the board of directors and an audit committee and a compensation committee that each consist entirely of independent directors. We do not have a nominating committee; however, all directors participate in the consideration of director nominees.
Future sales of shares of our common stock by our stockholders could cause our stock price to fall.
If a substantial number of shares of our common stock are sold in the public market, the market price of our common stock could fall. The perception among investors that these sales will occur could also produce this effect. Sales of our common stock by our majority stockholder, Greenlight, or a perception that Greenlight will sell their shares could cause a decrease in the market price of our common stock.
18
| ITEM 1B. | UNRESOLVED STAFF COMMENTS |
None
Our Properties
Our headquarters, manufacturing facility and all of our restaurants are located on leased premises. Lease terms are usually 5 to 10 years, with two or three 5-year renewal option periods, for total lease terms that average 10 to 20 years. The average company-owned restaurant is 1,800 to 2,500 square feet in size with 30 to 40 seats and is generally located in a neighborhood or regional shopping center. As of January 1, 2013, leases for seventeen restaurants are set to expire within the next twelve months and most of these leases contain a renewal option, usually with modified pricing terms to reflect current market rents. We expect to close six to ten company-owned restaurants over the next three years as their leases expire. In 2013, we expect seven to ten restaurant units to relocate, which will generally be within five miles or a within a six minute drive of the original location. When we intend to relocate a restaurant, we consider that restaurant to be temporarily closed for up to twelve months after it ceases operations. As of January 1, 2013, there are seven stores that we intend to relocate, and are thus considered to be temporarily closed.
Information with respect to our headquarters and manufacturing facility is presented below:
| | | | | | | | | | |
Location | | Facility | | Square
Feet | | | Lease
Expiration | |
Lakewood, Colorado | | Headquarters, Support Center, Test Kitchen | | | 44,574 | | | | 12/31/2022 | |
Whittier, California | | Manufacturing Facility | | | 54,640 | | | | 11/30/2013 | |
Our Current Restaurants
As of January 1, 2013, we owned and operated, franchised or licensed 816 restaurants. Our current base of company-owned restaurants under our core brands includes 395 Einstein Bros. restaurants, 58 Noah’s restaurants and 8 Manhattan Bagel restaurants. Also, we franchise 65 Manhattan Bagel restaurants and 32 Einstein Bros. restaurants, and license 258 Einstein Bros. restaurants. We believe that our properties are suitable, adequate, well-maintained and sufficient for our operations.
The following table details our restaurant openings and closings for fiscal 2012 for all brands:
| | | | | | | | | | | | | | | | |
| | | Company
Owned | | | Franchised | | | Licensed | | | Total | |
Total beginning balance | | | 440 | | | | 94 | | | | 239 | | | | 773 | |
Opened restaurants | | | 15 | | | | 13 | | | | 27 | | | | 55 | |
Closed restaurants | | | (1 | ) | | | (3 | ) | | | (8 | ) | | | (12 | ) |
Refranchising, net | | | 7 | | | | (7 | ) | | | — | | | | — | |
| | | | | | | | | | | | | | | | |
Total ending balance | | | 461 | | | | 97 | | | | 258 | | | | 816 | |
| | | | | | | | | | | | | | | | |
19
As of January 1, 2013, our company-owned facilities, franchisees and licensees operated in various states and in the District of Columbia as follows:
| | | | | | | | | | | | | | | | |
Location | | Company | | | Franchise | | | License | | | Total | |
Alabama | | | 0 | | | | 0 | | | | 5 | | | | 5 | |
Arizona | | | 29 | | | | 1 | | | | 5 | | | | 35 | |
Arkansas | | | 0 | | | | 2 | | | | 2 | | | | 4 | |
California | | | 80 | | | | 6 | | | | 13 | | | | 99 | |
Colorado | | | 37 | | | | 2 | | | | 7 | | | | 46 | |
Connecticut | | | 1 | | | | 0 | | | | 2 | | | | 3 | |
Delaware | | | 1 | | | | 3 | | | | 0 | | | | 4 | |
District of Columbia | | | 1 | | | | 0 | | | | 6 | | | | 7 | |
Florida | | | 51 | | | | 4 | | | | 23 | | | | 78 | |
Georgia | | | 17 | | | | 1 | | | | 15 | | | | 33 | |
Idaho | | | 0 | | | | 0 | | | | 3 | | | | 3 | |
Illinois | | | 32 | | | | 3 | | | | 10 | | | | 45 | |
Indiana | | | 11 | | | | 1 | | | | 2 | | | | 14 | |
Kansas | | | 6 | | | | 0 | | | | 2 | | | | 8 | |
Kentucky | | | 0 | | | | 0 | | | | 7 | | | | 7 | |
Louisiana | | | 0 | | | | 0 | | | | 7 | | | | 7 | |
Maryland | | | 12 | | | | 0 | | | | 5 | | | | 17 | |
Massachusetts | | | 2 | | | | 0 | | | | 4 | | | | 6 | |
Michigan | | | 15 | | | | 0 | | | | 8 | | | | 23 | |
Minnesota | | | 5 | | | | 0 | | | | 4 | | | | 9 | |
Mississippi | | | 0 | | | | 0 | | | | 3 | | | | 3 | |
Missouri | | | 12 | | | | 2 | | | | 9 | | | | 23 | |
Nevada | | | 15 | | | | 1 | | | | 5 | | | | 21 | |
New Hampshire | | | 1 | | | | 0 | | | | 0 | | | | 1 | |
New Jersey | | | 5 | | | | 28 | | | | 1 | | | | 34 | |
New Mexico | | | 5 | | | | 1 | | | | 2 | | | | 8 | |
New York | | | 7 | | | | 0 | | | | 2 | | | | 9 | |
North Carolina | | | 0 | | | | 4 | | | | 10 | | | | 14 | |
Ohio | | | 9 | | | | 0 | | | | 12 | | | | 21 | |
Oklahoma | | | 0 | | | | 1 | | | | 1 | | | | 2 | |
Oregon | | | 13 | | | | 1 | | | | 2 | | | | 16 | |
Pennsylvania | | | 9 | | | | 23 | | | | 7 | | | | 39 | |
South Carolina | | | 0 | | | | 0 | | | | 8 | | | | 8 | |
South Dakota | | | 0 | | | | 0 | | | | 3 | | | | 3 | |
Tennessee | | | 0 | | | | 3 | | | | 10 | | | | 13 | |
Texas | | | 39 | | | | 6 | | | | 31 | | | | 76 | |
Utah | | | 19 | | | | 0 | | | | 0 | | | | 19 | |
Virginia | | | 10 | | | | 4 | | | | 16 | | | | 30 | |
Washington | | | 7 | | | | 0 | | | | 3 | | | | 10 | |
Wisconsin | | | 10 | | | | 0 | | | | 3 | | | | 13 | |
| | | | | | | | | | | | | | | | |
| | | 461 | | | | 97 | | | | 258 | | | | 816 | |
| | | | | | | | | | | | | | | | |
We are subject to claims and legal actions in the ordinary course of business, including claims by or against our franchisees, licensees and employees or former employees and/or contract disputes. We do not believe any currently pending or threatened matter would have a material adverse effect on our business, results of operations or financial condition.
| ITEM 4. | MINE SAFETY DISCLOSURES |
Not applicable.
20
PART II
| ITEM 5. | MARKET FOR REGISTRANT’S COMMON EQUITY, RELATED STOCKHOLDER MATTERS AND ISSUER PURCHASES OF EQUITY SECURITIES |
Our common stock is traded on the NASDAQ Global Market under the symbol “BAGL”. The following table sets forth the high and low sale prices for our common stock for each fiscal quarter during the periods indicated.
| | | | | | | | |
| | | High | | | Low | |
Fiscal 2012: | | | | | | | | |
First Quarter | | $ | 15.44 | | | $ | 13.75 | |
Second Quarter | | $ | 17.75 | | | $ | 13.63 | |
Third Quarter | | $ | 18.58 | | | $ | 13.94 | |
Fourth Quarter | | $ | 18.58 | | | $ | 11.45 | |
| | |
| | | High | | | Low | |
Fiscal 2011: | | | | | | | | |
First Quarter | | $ | 17.04 | | | $ | 13.79 | |
Second Quarter | | $ | 16.42 | | | $ | 13.54 | |
Third Quarter | | $ | 15.99 | | | $ | 12.31 | |
Fourth Quarter | | $ | 15.94 | | | $ | 11.48 | |
As of February 26, 2013, there were approximately 257 holders of record of our common stock. This number does not include individual stockholders who own common stock registered in the name of a nominee under nominee security listings.
As permitted by our credit facility, described in further detail in Item 7, our Board of Directors (the “Board”) declared the following dividends in 2011 and 2012:
| | | | | | | | | | | | |
Date Declared | | Record Date | | Dividend
Per Share | | | Total Amount | | | Payment Date |
| | | | | | | | (in thousands) | | | |
May 3, 2011 | | June 1, 2011 | | $ | 0.125 | | | $ | 2,094 | | | July 15, 2011 |
August 3, 2011 | | September 1, 2011 | | $ | 0.125 | | | $ | 2,096 | | | October 15, 2011 |
November 2, 2011 | | December 1, 2011 | | $ | 0.125 | | | $ | 2,100 | | | January 15, 2012 |
January 18, 2012 | | March 1, 2012 | | $ | 0.125 | | | $ | 2,106 | | | April 15, 2012 |
May 1, 2012 | | June 1, 2012 | | $ | 0.125 | | | $ | 2,120 | | | July 15, 2012 |
July 30, 2012 | | September 1, 2012 | | $ | 0.125 | | | $ | 2,141 | | | October 15, 2012 |
November 1, 2012 | | December 3, 2012 | | $ | 0.125 | | | $ | 2,120 | | | January 15, 2013 |
December 6, 2012 | | December 17, 2012 | | $ | 4.000 | | | $ | 68,090 | | | December 27, 2012 |
On May 3, 2012, we announced that our Board authorized a review of strategic alternatives to the Company, including a possible business combination or sale, to maximize value for all stockholders. On December 6, 2012, we announced that our Board had completed its review and elected to recapitalize the Company by amending our existing credit facility and declaring a one-time special cash dividend of $4.00 per share payable to stockholders of record as of the close of business on December 17, 2012. The dividend was paid on December 27, 2012.
It is the current expectation of our Board that we will continue to pay a quarterly cash dividend, at the discretion of the Board, dependent on a variety of factors, including available cash and the overall financial condition of the Company. Like other companies incorporated in Delaware, we are also limited by Delaware law as to the payment of dividends. On January 30, 2013, the Board declared a cash dividend on our common stock in the amount of $0.125 per share, payable on April 15, 2013, to stockholders of record as of March 1, 2013.
21
In December 2010, our Board approved a discretionary program to repurchase up to $20.0 million of our outstanding common stock, subject to compliance with applicable laws and the terms of our credit facility. We did not purchase any shares of our common stock on the open market in fiscal 2011 or fiscal 2012. The repurchase program expired in December 2012 and was not renewed.
Performance Graph
The included performance graph covers the fiscal five-year period from January 2, 2008 through January 1, 2013. The graph compares the total return of our common stock (BAGL) to our current peer group of companies (PGI) and the NASDAQ Composite Index. We believe that the selected PGI represents our competitive peer group as the included companies are multi-concept companies with a similar organizational structure, are participants of the restaurant industry and have a sufficient period of operating history for continuous inclusion in the PGI.
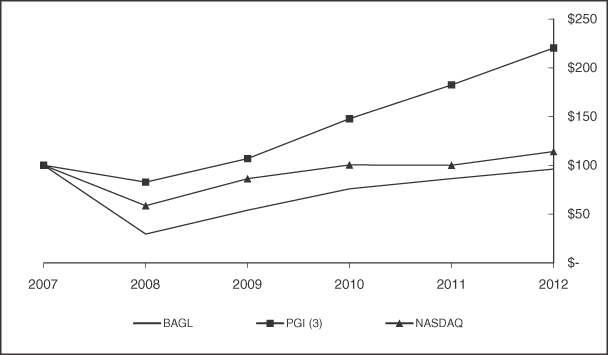
| | | | | | | | | | | | | | | | | | | | | | | | |
| | | Measurement period - five years (1) (2) | |
| | | Fiscal | | | Fiscal | | | Fiscal | | | Fiscal | | | Fiscal | | | Fiscal | |
| | | 2007 | | | 2008 | | | 2009 | | | 2010 | | | 2011 | | | 2012 | |
BAGL | | $ | 100.00 | | | $ | 29.43 | | | $ | 53.74 | | | $ | 75.77 | | | $ | 86.07 | | | $ | 96.07 | |
PGI (3) | | $ | 100.00 | | | $ | 82.49 | | | $ | 106.88 | | | $ | 147.51 | | | $ | 182.41 | | | $ | 220.09 | |
NASDAQ | | $ | 100.00 | | | $ | 58.47 | | | $ | 86.28 | | | $ | 100.40 | | | $ | 99.87 | | | $ | 113.85 | |
| (1) | Assumes all distributions to stockholders are reinvested on the payment dates. |
| (2) | Assumes $100 initial investment on December 31, 2007 in BAGL, the PGI, and the NASDAQ Composite Index. |
| (3) | The PGI is a price-weighted index. The index includes: |
| | • | | AFC Enterprises, Inc. (Popeyes Chicken and Biscuits restaurant chain) |
| | • | | The Wendy’s Company (Wendy’s restaurant chain) |
| | • | | YUM! Brands, Inc. (KFC, Pizza Hut and Taco Bell restaurant chains) |
22
| ITEM 6. | SELECTED FINANCIAL DATA |
Our selected consolidated financial data shown below should be read together with Item 7. “Management’s Discussion and Analysis of Financial Condition and Results of Operations” and our consolidated financial statements and respective notes included in Item 8. “Financial Statements and Supplementary Data”. The data shown below is not necessarily indicative of results to be expected for any future period.
| | | | | | | | | | | | | | | | | | | | |
| | | Fiscal years ended: | |
| | December 30,
2008
(52 weeks) | | | December 29,
2009
(52 weeks) | | | December 28,
2010
(52 weeks) | | | January 3,
2012
(53 weeks) | | | January 1,
2013
(52 weeks) | |
| | | (in thousands, except per share data and as otherwise indicated) | |
Selected Statements of Operations Data: | | | | | | | | | | | | | | | | | | | | |
Revenues | | $ | 413,450 | | | $ | 408,562 | | | $ | 411,711 | | | $ | 423,595 | | | $ | 427,006 | |
Cost of goods sold | | | 112,607 | | | | 108,024 | | | | 106,011 | | | | 112,002 | | | | 106,925 | |
Labor costs | | | 111,463 | | | | 113,441 | | | | 108,813 | | | | 110,467 | | | | 111,784 | |
Rent and related expenses | | | 38,356 | | | | 40,406 | | | | 39,691 | | | | 40,277 | | | | 41,993 | |
Other operating costs | | | 37,679 | | | | 37,384 | | | | 37,696 | | | | 39,092 | | | | 40,320 | |
Marketing costs | | | 2,094 | | | | 4,527 | | | | 9,794 | | | | 9,796 | | | | 11,380 | |
Manufacturing and commissary costs | | | 28,566 | | | | 26,573 | | | | 25,566 | | | | 30,441 | | | | 24,236 | |
General and administrative expenses | | | 36,305 | | | | 35,442 | | | | 38,484 | | | | 36,774 | | | | 39,569 | |
Depreciation and amortization | | | 14,100 | | | | 16,627 | | | | 17,769 | | | | 19,259 | | | | 19,707 | |
Pre-opening costs | | | 968 | | | | 496 | | | | 370 | | | | 265 | | | | 1,115 | |
Restructuring expenses | | | — | | | | — | | | | 477 | | | | 1,099 | | | | 480 | |
Strategic alternatives expenses | | | — | | | | — | | | | — | | | | — | | | | 3,677 | |
Other operating expenses (income), net (1) | | | 3,433 | | | | (93 | ) | | | (531 | ) | | | (395 | ) | | | 1,592 | |
Impairment charges and other related costs | | | 263 | | | | 818 | | | | — | | | | — | | | | — | |
| | | | | | | | | | | | | | | | | | | | |
Income from operations | | | 27,616 | | | | 24,917 | | | | 27,571 | | | | 24,518 | | | | 24,228 | |
Interest expense, net (2) | | | 5,439 | | | | 6,114 | | | | 5,135 | | | | 3,357 | | | | 3,384 | |
Write-off of debt issuance costs upon redemption of term loan | | | — | | | | — | | | | 929 | | | | — | | | | — | |
Adjustment for Series Z Modification | | | — | | | | — | | | | 966 | | | | — | | | | — | |
| | | | | | | | | | | | | | | | | | | | |
Income before income taxes | | | 22,177 | | | | 18,803 | | | | 20,541 | | | | 21,161 | | | | 20,844 | |
Provision (benefit) for income taxes | | | 2,468 | | | | (71,560 | ) | | | 9,918 | | | | 7,958 | | | | 8,103 | |
| | | | | | | | | | | | | | | | | | | | |
Net income | | $ | 19,709 | | | $ | 90,363 | | | $ | 10,623 | | | $ | 13,203 | | | $ | 12,741 | |
| | | | | | | | | | | | | | | | | | | | |
Less: Additional redemption on temporary equity | | | — | | | | — | | | | (387 | ) | | | — | | | | — | |
Add: Accretion of premium on Series Z preferred stock | | | — | | | | — | | | | 1,072 | | | | — | | | | — | |
| | | | | | | | | | | | | | | | | | | | |
Net income available to common stockholders | | $ | 19,709 | | | $ | 90,363 | | | $ | 11,308 | | | $ | 13,203 | | | $ | 12,741 | |
| | | | | | | | | | | | | | | | | | | | |
Per share data: | | | | | | | | | | | | | | | | | | | | |
Weighted average number of common shares outstanding— | | | | | | | | | | | | | | | | | | | | |
Basic | | | 15,934,796 | | | | 16,175,391 | | | | 16,532,420 | | | | 16,629,098 | | | | 16,935,018 | |
Diluted | | | 16,378,965 | | | | 16,526,869 | | | | 16,804,726 | | | | 16,880,321 | | | | 17,217,180 | |
Net income available to common stockholders per share— | | | | | | | | | | | | | | | | | | | | |
Basic | | $ | 1.24 | | | $ | 5.59 | | | $ | 0.68 | | | $ | 0.79 | | | $ | 0.75 | |
Diluted | | $ | 1.20 | | | $ | 5.47 | | | $ | 0.67 | | | $ | 0.78 | | | $ | 0.74 | |
Cash dividend declared per common share | | $ | — | | | $ | — | | | $ | 0.125 | | | $ | 0.375 | | | $ | 4.50 | |
Other Data: | | | | | | | | | | | | | | | | | | | | |
Capital expenditures | | $ | 26,690 | | | $ | 16,898 | | | $ | 16,597 | | | $ | 18,242 | | | $ | 24,046 | |
Percent change in system-wide comparable store sales (3) | | | +1.4 | % | | | -2.4 | % | | | +0.3 | % | | | +0.4 | % | | | +1.0 | % |
Percent change in company-owned restaurant comparable store sales (3) | | | -0.1 | % | | | -3.4 | % | | | -0.4 | % | | | 0.0 | % | | | +0.9 | % |
| (1) | Other operating expenses (income), net is normally comprised of acquisition costs and gains or losses on fixed asset dispositions. Other items that may be recorded in this line item include: employee wage settlements, senior management transition costs, gains on insurance proceeds received and other non-routine operating items. |
| (2) | Net interest expense can be comprised of interest paid or payable in cash, Series Z additional redemption amounts, and non-cash interest expense resulting from the amortization of debt discounts, notes paid-in-kind, debt issuance costs and the amortization of warrants issued in connection with debt financings and interest income from our money market cash accounts. |
| (3) | Comparable store sales represent sales at restaurants open for six fiscal quarters that have not been closed during the current year. System-wide comparable store sales represent all eligible stores that are company-owned, franchised or licensed. Company-owned restaurant comparable store sales only include company-owned restaurants. Comparable store sales exclude sites that are temporarily closed. |
23
| | | | | | | | | | | | | | | | | | | | |
| | | As of: | |
| | | December 30,
2008 | | | December 29,
2009 | | | December 28,
2010 | | | January 3,
2012 | | | January 1,
2013 | |
| | | | | | (in thousands, except “other data” as indicated) | | | | |
Selected Balance Sheet Data: | | | | | | | | | | | | | | | | | | | | |
Cash and cash equivalents | | $ | 24,216 | | | $ | 9,885 | | | $ | 11,768 | | | $ | 8,652 | | | $ | 17,432 | |
Property, plant and equipment, net | | | 59,747 | | | | 58,682 | | | | 56,663 | | | | 59,017 | | | | 63,013 | |
Total assets | | | 172,929 | | | | 213,258 | | | | 205,067 | | | | 204,732 | | | | 213,613 | |
Short-term debt and current portion of long-term debt | | | 8,088 | | | | 5,234 | | | | 7,500 | | | | 7,500 | | | | 5,000 | |
Mandatorily redeemable Series Z preferred stock, $.001 par value, $1,000 per share liquidation value | | | 57,000 | | | | 32,194 | | | | — | | | | — | | | | — | |
Senior notes and other long-term debt, net of discount | | | 79,787 | | | | 74,553 | | | | 80,200 | | | | 66,700 | | | | 131,700 | |
Total stockholders’ (deficit) equity | | | (29,982 | ) | | | 64,323 | | | | 77,386 | | | | 87,813 | | | | 27,507 | |
Other Data: | | | | | | | | | | | | | | | | | | | | |
Number of locations at end of period | | | 649 | | | | 683 | | | | 733 | | | | 773 | | | | 816 | |
Franchised and licensed | | | 223 | | | | 255 | | | | 302 | | | | 333 | | | | 355 | |
Company-owned and operated | | | 426 | | | | 428 | | | | 431 | | | | 440 | | | | 461 | |
24
| ITEM 7. | MANAGEMENT’S DISCUSSION AND ANALYSIS OF FINANCIAL CONDITION AND RESULTS OF OPERATIONS |
General
We have a 52/53-week fiscal year ending on the Tuesday closest to December 31. Fiscal years 2010 and 2012 ended on December 28, 2010 and January 1, 2013, respectively, and each contained 52 weeks. Fiscal year 2011 contained 53 weeks and ended on January 3, 2012. Comparable store sales percentages presented for fiscal 2011 in this Item 7 are calculated excluding the 53rd week.
Overview
We are the largest owner/operator, franchisor and licensor of bagel specialty restaurants in the United States. As a leading fast-casual restaurant chain, our restaurants specialize in high-quality foods for breakfast, lunch and afternoon snacks in a bakery-café atmosphere with a neighborhood emphasis. Our product offerings include fresh bagels and other bakery items baked on-site, made-to-order breakfast and lunch sandwiches on a variety of bagels, breads or wraps, gourmet soups and salads, assorted pastries, premium coffees and an assortment of snacks. Our manufacturing operations and network of independent distributors deliver high-quality ingredients to our restaurants.
Fiscal 2012 reflect our continued focus on execution of our key strategies and the in-depth review of strategic alternatives by our Board of Directors (the “Board”). This Overview will first review 2012 Highlights and Trends and the results of the strategic alternatives review. Lastly, we will provide a 2013 Outlook.
2012 Highlights and Trends
Our results for 2012 reflect the continued soundness of our business model, the underlying strength of our brands and the talent and dedication of our employees. We continued to focus on our key strategies which are:
| | • | | Drive comparable store sales growth; |
| | • | | Manage corporate margins; and |
| | • | | Accelerate unit growth. |
For 2012, our system-wide comparable store sales were +1.0% with seven consecutive quarters of positive system-wide comparable store sales.
| | | | | | | | | | | | | | | | | | | | |
| | | Q1 | | | Q2 | | | Q3 | | | Q4 | | | Year | |
System-wide comparable sales | | | +1.1 | % | | | +1.3 | % | | | +0.2 | % | | | +1.4 | % | | | +1.0 | % |
Company-owned comparable sales | | | +1.1 | % | | | +1.2 | % | | | +0.2 | % | | | +1.1 | % | | | +0.9 | % |
The primary reasons for this sequential improvement was strong growth in average check, a favorable menu mix shift, strength in catering sales and slightly lower customer discounts. This was partially offset by lower comparable transactions.
Our catering business, on a comparable store basis, grew by approximately 17% which we attribute to our focus on our online ordering system, online search engine and online marketing. Our catering business now makes up approximately 8% of our comparable company-owned restaurant revenues. We have also seen strong growth in our blended beverage line of business. Coffee and blended beverage sales now represent approximately 10% of our menu mix and continue to grow. We believe that our sandwich business continues to benefit from the success of our bagel thin sandwich platform, paninis and our continued focus on healthy, low calorie food options. We targeted our marketing investments at coupons, directional billboards and digital online media.
Our margin as a percentage of restaurant revenues improved in our company-owned restaurants by 1.1% primarily due to a 2.0% drop in our prime costs (combined costs of sales and total labor) as a percentage of
25
company-owned restaurant revenues. Our initiatives around food costs and labor, including waste management, made up 1.6% of this improvement in food costs. Partially offsetting the improvement in the management of our prime costs was an increase in marketing investment of 0.4% as a percentage of company-owned restaurant revenues. Our marketing investment in fiscal 2012 included product testing in certain markets, continued local store (grass roots) marketing and grand opening support.
Revenues from our manufacturing facility grew by $1.4 million, or 4.7%, to $30.5 million as a result of additional export revenues. Our commissary revenues declined by approximately $4.9 million in 2012 from 2011 as a result of the closure of our commissaries. To streamline our supply chain and to reduce our cost base, in March 2012, we completed our plan to close our five food commissary facilities. Related to this plan, we incurred approximately $0.7 and $0.5 million of restructuring expenses in 2011 and 2012, respectively, including employee termination benefits and lease termination expenses. We realized cost savings of approximately $1.5 million from the closure of these facilities. For our manufacturing and commissaries segment as a whole, revenues declined by $3.4 million, or 10.1%, while this segment’s profitability improved by $2.7 million, or 66%.
We made progress in balancing our unit portfolio toward our goal of having at least 50% of our system-wide units being franchise and license units. The proportion of units opened in our franchise and license channels was approximately 72% of total openings as we opened 40 franchise and license units in addition to 15 company-owned restaurant openings. In total, we opened 55 units. Total net units increased in fiscal 2012 to 816 from 773 at the end of fiscal 2011.
Our Recapitalization
In 2012, our Board authorized a review of strategic alternatives to maximize value for all stockholders. This review was initiated in May and culminated in December with a recapitalization of the Company, including the payment of a one-time special cash dividend of $4.00 per share of common stock on December 27, 2012.
The recapitalization included the amendment and restatement of the Company’s existing Senior Credit Facility, which consists of a Term Loan A and a Revolver with a syndicate of banks (“Facility”). The amendment and restatement of the Facility increased the Company’s Term Loan A from $75 million to $100 million, increased the Revolver availability from $50 million to $75 million, and extended the maturity date from December 20, 2015 to December 6, 2017. The increase to $175 million was used to fund the one-time special dividend of $68.1 million, as well as the ongoing quarterly dividend, working capital, capital expenditures, and other general corporate purposes. The loans under the Facility will bear interest equal to the Eurodollar Rate plus an applicable margin ranging from 2.5% to 4.0% or the Base Rate plus an applicable margin ranging from 1.5% to 3.0%.
2013 Outlook
Our execution plan to grow comparable store sales includes:
| | • | | Launching everyday value combos |
| | • | | Leveraging our strength in bagels |
| | • | | Driving frequency through increased coffee focus |
| | • | | Building awareness around lunch |
| | • | | Accelerating our in-store experience |
| | • | | Build average check through bulk bagels, catering, and new signature sandwich lines |
26
| | • | | Build brand awareness with a balanced approach of grass roots and mass marketing: |
| | • | | Digital marketing/Social Media |
We expect our catering channel will continue to benefit from our online ordering system, an outsourced and expanded call center, focus on online and digital marketing, and an optimized menu. New support for catering will include expanding our sales force, focusing our marketing search engine, managing outlier markets and penetrating the lunch daypart.
Our approach to enhancing corporate margins will extend and build on the initiatives that we have already started, namely, aggressively managing the sourcing of our commodities, utilizing new packaging to drive cost advantages, further rationalize our distribution network, and negotiate favorable contracts with our vendors.
Our emphasis on acceleration of unit growth will continue to focus on a franchise first growth model, asset light unit economics, penetration into new key channels and opportunistic refranchising and acquisition efforts. Our unit growth plan for 2013 considers our long-term annual unit growth objective of +10%, or 60 to 80 system-wide openings for 2013. This includes the openings of 15 to 20 company-owned restaurants, 15 to 20 franchised restaurants and 30 to 40 licensed restaurants. We see refranchising our units as an opportunity to attract high quality franchisees that will support our accelerated growth initiatives.
The airport channel is key for us in terms of securing success. Highlights of our airport program in 2012 and our plans for 2013 include:
| | • | | Average Unit Volume of $2.0 million in 2012. |
| | • | | +1.7% Comparable sales growth in 2012. |
| | • | | Total airport units of 11 in 2012. |
| | • | | Awarded Dallas/Fort Worth Airport (Terminal E) for potential opening in the second quarter of 2013. In February 2013, we opened a location in Terminal A. |
| | • | | Awarded two locations in San Diego Airport for potential opening in 2013. |
| | • | | Awarded Atlanta (Terminal D) for potential opening in the second quarter of 2013. |
We expect to spend between $20 million and $22 million in capital expenditures in 2013 which includes the opening of company-owned restaurants and the relocation of additional company-owned restaurants. We also intend to deploy our capital into areas such as installing drive-thru lanes and adding new exterior signage.
As we move into 2013, we continue to have a robust pipeline of existing franchise development agreements and new license locations. We will continue to host discovery days for potential franchisees as well as expand our license footprint. Thus far in fiscal 2013, we have opened three licensed units and two franchised units, including the entry into Montana, our 40th state where we have operations. As of February 25, 2013, we have 28 development agreements in place for 136 total restaurants, 34 of which have already opened. Based upon the development agreements, we expect the remaining 102 new restaurants will open on various dates through 2021. We expect to enter into 10 to 12 new agreements for a total of 60 to 70 new units, bringing our remaining total pipeline to 162 to 172 additional new units.
We expect our free cash flow will continue to be robust and we are comfortable with our financial ability to have the financial resources to execute on our 2013 plan including the servicing of our elevated level of debt.
27
Use of Non-GAAP Financial Information
In addition to the results reported in accordance with accounting principles generally accepted in the United States of America (“GAAP”) included in this filing, we have provided certain non-GAAP financial information, including non-GAAP total revenues excluding the extra week in fiscal 2011; adjusted earnings before interest, taxes, depreciation and amortization, Series Z modifications, restructuring expenses, strategic alternative expenses, write-off of debt issuance costs, and other operating expenses/income (“Adjusted EBITDA”); net income adjusted for the extra 53rd week in fiscal 2011, restructuring expenses, strategic alternatives expense, incremental interest expense on additional credit facility borrowings and other operating expenses/income (“Adjusted Net Income”); earnings per share adjusted for the extra 53rd week in fiscal 2011, restructuring expenses, strategic alternatives expense, incremental interest expense on additional credit facility borrowings and other operating expenses/income (“Adjusted Net Income Per Share”); and “Free Cash Flow”, which we define as net cash provided by operating activities less net cash used in investing activities. Management believes that the presentation of this non-GAAP financial information provides useful information to investors because this information may allow investors to better evaluate our ongoing business performance and certain components of our results. In addition, the Board uses this non-GAAP financial information to evaluate the performance of the Company and its management team. This information should be considered in addition to the results presented in accordance with GAAP, and should not be considered a substitute for the GAAP results. Not all of the aforementioned items defining Adjusted EBITDA occur in each reporting period, but have been included in our definitions of these terms based on historical activity. We have reconciled the non-GAAP financial information to the nearest GAAP measure on pages 30, 35, 36 and 43.
We include in this report information on system-wide comparable store sales percentages. In fiscal 2011, we modified the method by which we determine restaurants included in our comparable store sales percentages to include those restaurants in operation for a full six fiscal quarters. Previously, comparable store sales percentages were based on restaurants that had been in operation for thirteen months. This methodology modification did not have a material impact on previously reported amounts, and therefore previously reported amount have not been restated. System-wide comparable store sales percentages refer to changes in sales of our restaurants, whether operated by the company or by franchisees and licensees, in operation for six fiscal quarters including those restaurants temporarily closed for an immaterial amount of time. Some of the reasons restaurants may be temporarily closed include remodeling, relocations, road construction, rebuilding related to site-specific catastrophes and natural disasters. Franchise and license comparable store sales percentages are based on sales of franchised and licensed restaurants, as reported by franchisees and licensees. Management reviews the increase or decrease in comparable store sales to assess business trends. Comparable store sales exclude permanently closed locations. When we intend to relocate a restaurant, we consider that restaurant to be temporarily closed for up to twelve months after it ceases operations. If a suitable relocation site has not been identified by the end of twelve months, we consider the restaurant to be permanently closed. Until that time, we include the restaurant in our open store count, but exclude its sales from our comparable store sales. As of January 1, 2013, there are seven stores that we intend to relocate, and are thus considered to be temporarily closed.
We use company-owned store sales, franchise and license sales and the resulting system-wide sales information internally in connection with restaurant development decisions, planning, and budgeting analyses. We believe system-wide comparable store sales information is useful in assessing consumer acceptance of our brands; facilitates an understanding of our financial performance and the overall direction and trends of sales and operating income; helps us appreciate the effectiveness of our advertising and marketing initiatives; and provides information that is relevant for comparison within the industry.
Comparable store sales percentages are non-GAAP financial measures, which should not be considered in isolation or as a substitute for other measures of performance prepared in accordance with GAAP, and may not be equivalent to comparable store sales as defined or used by other companies. We do not record franchise or license restaurant sales as revenues. However, royalty revenues are calculated based on a percentage of franchise and license restaurant sales, as reported by the franchisees or licensees.
28
Results of Operations for Fiscal 2012 as compared to Fiscal 2011
Financial Highlights
| | • | | System-wide comparable store sales increased +1.0%. |
| | • | | Total revenues increased $3.4 million, or 0.8%, which was driven by an increase in company-owned restaurant revenue of $6.1 million and franchise and license related revenue of $0.9 million, partially offset by a decline in manufacturing and commissary revenue. The extra 53rd week in fiscal 2011 contributed an additional $7.3 million of revenue. Excluding the extra week in fiscal 2011, total revenues increased 2.6% in 2012, with revenue growth offset by the closure of our commissaries. |
| | • | | Manufacturing and commissary revenue decreased $3.5 million due to the closure of our commissaries and one less week in fiscal 2012. A decrease in commissary revenue of $4.9 million was partially offset by a 4.7% increase in manufacturing revenue of $1.4 million. We attribute this increase in manufacturing revenue to higher export sales. The extra 53rd week in fiscal 2011 contributed an additional $0.5 million of revenue. |
| | • | | Franchise and license related revenues grew 8.3%, or $0.9 million, and was driven by an increase in comparable store sales of +1.3% and unit growth. The extra 53rd week in fiscal 2011 contributed an additional $0.1 million of revenue. |
| | • | | Cost of goods sold decreased 180 basis points as a percentage of company-owned restaurant sales as a result of our cost savings initiatives and the leveraged impact of price increases. |
| | • | | Net income decreased 3.5% primarily due to the extra 53rd week in fiscal 2011 and the above mentioned strategic alternative review process, partially offset by our cost saving initiatives. |
| | • | | Adjusted net income increased $3.3 million, or 25.2% to $16.4 million, or $0.95 adjusted earnings per diluted share, compared to adjusted net income of $13.1 million, or $0.78 adjusted earnings per diluted share, on a comparable 52-week basis. |
| | • | | Adjusted EBITDA increased 11.7% primarily due to improved revenue and cost saving initiatives. |
| | • | | Our Board authorized a review of strategic alternatives to maximize value for all stockholders. This review was initiated in May and culminated in December with a recapitalization of the Company, including the payment of a one-time special cash dividend of $4.00 per share of common stock totaling $68.1 million on December 27, 2012. |
29
Consolidated Results – Fiscal 2012 vs Fiscal 2011
| | | | | | | | | | | | |
| | | Fiscal year ended | |
| | | (in thousands) | | | Increase/
(Decrease) | |
| | | January 3,
2012 | | | January 1,
2013 | | | 2012
vs. 2011 | |
Revenues | | $ | 423,595 | | | $ | 427,006 | | | | 0.8 | % |
Cost of sales | | | 342,075 | | | | 336,638 | | | | (1.6 | %) |
Operating expenses | | | 57,002 | | | | 66,140 | | | | 16.0 | % |
| | | | | | | | | | | | |
Income from operations | | | 24,518 | | | | 24,228 | | | | (1.2 | %) |
Interest expense, net | | | 3,357 | | | | 3,384 | | | | 0.8 | % |
Income before income taxes | | | 21,161 | | | | 20,844 | | | | (1.5 | %) |
Total provision for income taxes | | | 7,958 | | | | 8,103 | | | | 1.8 | % |
| | | | | | | | | | | | |
Net income | | $ | 13,203 | | | $ | 12,741 | | | | (3.5 | %) |
Adjustments to net income: | | | | | | | | | | | | |
Interest expense, net | | | 3,357 | | | | 3,384 | | | | 0.8 | % |
Provision for income taxes | | | 7,958 | | | | 8,103 | | | | 1.8 | % |
Depreciation and amortization | | | 19,259 | | | | 19,707 | | | | 2.3 | % |
Restructuring expenses | | | 1,099 | | | | 480 | | | | (56.3 | %) |
Strategic alternatives expenses | | | — | | | | 3,677 | | | | * | * |
Other operating expenses (income), net | | | (395 | ) | | | 1,592 | | | | * | * |
| | | | | | | | | | | | |
Adjusted EBITDA | | $ | 44,481 | | | $ | 49,684 | | | | 11.7 | % |
| | | | | | | | | | | | |
Our income from operations decreased by $0.3 million in 2012 to $24.2 million primarily as a result of the non-recurring strategic alternatives review process we undertook in 2012 and an additional $0.8 million in income from operations resulting from the 53rd week in fiscal 2011, primarily offset by improved margins in fiscal 2012.
Total revenues increased by $3.4 million to $427.0 million, primarily the result of increased revenue from our company-owned stores. The extra 53rd week in 2011 contributed an additional $7.3 million in revenue. System-wide comparable stores were +1.0% for fiscal 2012 which we attribute to strong check growth of +4.2%, reflecting price and product mix favorability. Our catering business continues to be a strong revenue generator, as evidenced by an increase in catering sales of 17.3% over fiscal 2011. To build same store sales, we focus on building traffic by leveraging our strengths, growing average check and building brand awareness through various marketing initiatives.
Net income decreased for fiscal 2012 primarily due to the extra 53rd week in 2011, which contributed net income of $0.5 million, and $3.7 million ($2.2 million, net of tax) in non-recurring strategic alternatives expenses, partially offset by improved margins.
30
Company-Owned Restaurant Operations
| | | | | | | | | | | | | | | | | | | | |
| | | Fiscal year ended | |
| | | | | | Increase/ | | | Percentage of company-owned | |
| | | (in thousands) | | | (Decrease) | | | restaurant sales | |
| | | January 3, | | | January 1, | | | 2012 | | | January 3, | | | January 1, | |
| | | 2012 | | | 2013 | | | vs. 2011 | | | 2012 | | | 2013 | |
Company-owned restaurant sales | | $ | 378,723 | | | $ | 384,783 | | | | 1.6 | % | | | | | | | | |
Percent of total revenues | | | 89.4 | % | | | 90.1 | % | | | | | | | | | | | | |
Cost of sales (exclusive of depreciation and amortization): | | | | | | | | | | | | | | | | | | | | |
Cost of goods sold | | $ | 112,002 | | | $ | 106,925 | | | | (4.5 | %) | | | 29.6 | % | | | 27.8 | % |
Labor costs | | | 110,467 | | | | 111,784 | | | | 1.2 | % | | | 29.2 | % | | | 29.0 | % |
Rent and related expenses | | | 40,277 | | | | 41,993 | | | | 4.3 | % | | | 10.6 | % | | | 10.9 | % |
Other operating costs | | | 39,092 | | | | 40,320 | | | | 3.1 | % | | | 10.3 | % | | | 10.5 | % |
Marketing costs | | | 9,796 | | | | 11,380 | | | | 16.2 | % | | | 2.6 | % | | | 3.0 | % |
| | | | | | | | | | | | | | | | | | | | |
Total company-owned restaurant costs | | $ | 311,634 | | | $ | 312,402 | | | | 0.2 | % | | | 82.3 | % | | | 81.2 | % |
| | | | | | | | | | | | | | | | | | | | |
Total company-owned restaurant gross margin | | $ | 67,089 | | | $ | 72,381 | | | | 7.9 | % | | | 17.7 | % | | | 18.8 | % |
| | | | | | | | | | | | | | | | | | | | |
Comparable store sales for our company-owned restaurants for each quarter in fiscal 2011 and 2012 were as follows:
| | | | | | | | | | | | |
| | | Fiscal 2011 | | | Fiscal 2012 | | | Change | |
First Quarter | | | -1.4 | % | | | +1.1 | % | | | +2.5 | % |
Second Quarter | | | -0.3 | % | | | +1.2 | % | | | +1.5 | % |
Third Quarter | | | +0.7 | % | | | +0.2 | % | | | -0.5 | % |
Fourth Quarter | | | +0.8 | % | | | +1.1 | % | | | +0.3 | % |
Annual | | | 0.0 | % | | | +0.9 | % | | | +0.9 | % |
Company-owned restaurant sales for fiscal 2012 increased $6.1 million, which is attributable to favorable company-owned comparable store sales, net incremental revenue of $1.7 million from new company-owned stores opened in 2012, $3.4 million from stores we acquired from franchisees and income from gift card breakage of $1.0 million. Stores that we opened in the fourth quarter 2011 further contributed incremental revenue of $5.3 million in fiscal 2012. Company-owned comparable store sales increased +0.9%, with average check increasing +4.9% partially offset by a decline in transactions. In fiscal 2012, we opened fifteen restaurants, acquired eight restaurants and closed one restaurant. Restaurant sales for 2011 benefited from $6.7 million in revenue resulting from the extra 53rd week. We took two price increases in fiscal 2012, totaling approximately 1.0%.
Catering sales, which continue to be a strong revenue driver, comprised approximately 8% of our company store sales (on a comparable basis) for fiscal 2012, an increase of 17.3% from fiscal 2011. We believe that the implementation of a new online ordering system and an outsourced/expanded call center has contributed to the growth in catering sales. Coffee sales continue to remain strong and represent approximately 10% of our comparable company-owned restaurant sales.
Total costs for company-owned restaurants, as a percentage of company-owned restaurant sales, decreased 110 basis points primarily due to sales leveraging and our cost saving initiatives, which in 2012 included a manufacturing packing efficiency review, the introduction of reusable egg boats and the closure of our commissaries.
31
Our prime costs, consisting of costs of goods sold and labor costs, decreased by 2.0% to 56.8% of company-owned restaurant revenues.
As a percentage of company-owned restaurant sales, we saw a decrease in our food costs from 29.6% for fiscal 2011 to 27.8% for fiscal 2012. This 180 basis point decrease includes savings from our initiatives (-140 basis points) and the leveraged impact of price increases (-80 basis points), partially offset by a shift in product mix (-20 basis points) and deflation in our commodity costs (-20 basis points). Most of our commodity-based food costs decreased in fiscal 2012 as we were able to lock in several of our prices. We are continuing to evaluate innovative ways to target additional savings of between $2.5 million and $5.0 million in 2013 without negatively impacting the customer experience. We anticipate overall inflation to be in the range of 2.0% to 3.0% for fiscal 2013.
As a percentage of company-owned restaurant sales, labor costs decreased by 0.2% to 29.0% in fiscal 2012. Rent and related expenses increased primarily due to unit growth, scheduled rent increases and related increases in property taxes. Other operating expenses increased primarily due to higher credit card fees resulting from the Durban Act, which began to take effect in October 2011.
We invested $1.6 million more in marketing during fiscal 2012, primarily related to product testing in certain markets, continued local store (grass roots) marketing and grand opening support.
Gross margin for our company-owned restaurant segment increased in fiscal 2012 by $5.3 million, or 7.9%, to $72.4 million. We attribute this to an increase of $6.1 million, or 1.6%, in company-owned restaurant sales while holding company-owned restaurant costs to a modest increase of $0.8 million, or 0.2%, in fiscal 2012 due to our focus on our initiatives.
Manufacturing and Commissary Operations
| | | | | | | | | | | | | | | | | | | | |
| | | Fiscal year ended | |
| | | | | | Increase/ | | | Percentage of manufacturing | |
| | | (in thousands) | | | (Decrease) | | | and commissary revenues | |
| | | January 3, | | | January 1, | | | 2012 | | | January 3, | | | January 1, | |
| | | 2012 | | | 2013 | | | vs. 2011 | | | 2012 | | | 2013 | |
Manufacturing and commissary revenues | | $ | 34,542 | | | $ | 31,037 | | | | (10.1 | %) | | | | | | | | |
Percent of total revenues | | | 8.2 | % | | | 7.3 | % | | | | | | | | | | | | |
Manufacturing and commissary costs | | $ | 30,441 | | | $ | 24,236 | | | | (20.4 | %) | | | 88.1 | % | | | 78.1 | % |
| | | | | | | | | | | | | | | | | | | | |
Total manufacturing and commissary gross margin | | $ | 4,101 | | | $ | 6,801 | | | | 65.8 | % | | | 11.9 | % | | | 21.9 | % |
| | | | | | | | | | | | | | | | | | | | |
We closed all five of our commissaries by the end of the first quarter 2012. Sales that were previously made to our franchisees and licensees by the commissaries are now being handled directly through our distributors.
Manufacturing and commissary revenue was down 10.1% when compared to fiscal 2011. A decrease in commissary revenue of $4.9 million resulting from the closure of the commissaries was partially offset by an increase in manufacturing revenue of $1.4 million. We attribute this increase in manufacturing revenue to higher export sales. Cost savings resulting from the closures of our commissaries have had a significant positive impact on our margins. We believe that the commissary closures resulted in saving of $1.5 million to the company in fiscal 2012 and will continue to result in annual cost savings of approximately $1.5 million.
32
Franchise and License Operations
| | | | | | | | | | | | |
| | | Fiscal year ended | |
| | | | | | Increase/ | |
| | | (in thousands) | | | (Decrease) | |
| | | January 3, | | | January 1, | | | 2012 | |
| | | 2012 | | | 2013 | | | vs. 2011 | |
Franchise and license related revenues | | $ | 10,330 | �� | | $ | 11,186 | | | | 8.3 | % |
Percent of total revenues | | | 2.4 | % | | | 2.6 | % | | | | |
Number of franchise and license restaurants | | | 333 | | | | 355 | | | | | |
Overall, franchise and license revenue improvement was driven by continued unit development as we opened 27 licensed locations and 13 franchised locations since January 3, 2012. Franchise and license comparable store sales were +1.3% for the fiscal year ended January 1, 2013. Franchise and license revenue improved by $0.9 million, or 8.3% from fiscal 2011, primarily the result of continued unit development and increases in comparable store sales, partially offset by a decline in initial license fee revenue recorded on unit openings. As of February 25, 2013, we have 28 development agreements in place for 136 total restaurants, 34 of which have already opened. Based upon the development agreements, we expect the remaining 102 new restaurants will open on various dates through 2021. Thus far in fiscal 2013, we have opened three licensed units and two franchised units, including the entry into Montana, our 40th state where we have operations.
Corporate Support
| | | | | | | | | | | | | | | | | | | | |
| | | Fiscal year ended | |
| | | | | | Increase/ | | | Percentage of | |
| | | (in thousands) | | | (Decrease) | | | total revenues | |
| | | January 3, | | | January 1, | | | 2012 | | | January 3, | | | January 1, | |
| | | 2012 | | | 2013 | | | vs. 2011 | | | 2012 | | | 2013 | |
General and administrative expenses | | $ | 36,774 | | | $ | 39,569 | | | | 7.6 | % | | | 8.7 | % | | | 9.3 | % |
Depreciation and amortization | | | 19,259 | | | | 19,707 | | | | 2.3 | % | | | 4.5 | % | | | 4.6 | % |
Pre-opening expenses | | | 265 | | | | 1,115 | | | | * | * | | | 0.0 | % | | | 0.3 | % |
Restructuring expenses | | | 1,099 | | | | 480 | | | | (56.3 | %) | | | 0.3 | % | | | 0.1 | % |
Strategic alternatives expense | | | — | | | | 3,677 | | | | * | * | | | 0.0 | % | | | 0.9 | % |
Other operating (income) expenses, net | | | (395 | ) | | | 1,592 | | | | * | * | | | (0.1 | %) | | | 0.4 | % |
| | | | | | | | | | | | | | | | | | | | |
Total operating expenses | | $ | 57,002 | | | $ | 66,140 | | | | 16.0 | % | | | 13.4 | % | | | 15.6 | % |
Interest expense, net | | | 3,357 | | | | 3,384 | | | | 0.8 | % | | | 0.8 | % | | | 0.8 | % |
Provision for income taxes | | | 7,958 | | | | 8,103 | | | | 1.8 | % | | | 1.9 | % | | | 1.9 | % |
Our total general and administrative expenses increased $2.8 million, or 7.6%, primarily due to an increase of $3.0 million in variable incentive compensation. Our performance incentive compensation increased from fiscal 2011 as we reached a higher bonus threshold in fiscal 2012 than we did in fiscal 2011. We expect general and administrative expenses for fiscal 2013 to be approximately $11.0 million per quarter.
Depreciation and amortization expenses increased $0.4 million, or 2.3%. The increase is due to approximately $24.0 million in capital asset expenditures since fiscal 2011. These additions included the construction and outfitting of 15 new company-owned stores, the relocation of 6 stores, the implementation of new POS systems and the replacement of older equipment. Based on our current planned purchases of capital assets, our existing base of assets and our projections for new purchases of fixed assets, we believe depreciation expense for fiscal 2013 will be in the range of $20.0 million to $22.0 million.
33
Pre-opening expenses, which include rent, wages, marketing, food and other restaurant operating costs, increased $0.9 million due to eleven more store openings in fiscal 2012. We opened fifteen company-owned stores in fiscal 2012 compared to four company-owned stores in fiscal 2011.
We incurred an additional $0.5 million of restructuring expenses in fiscal 2012 related to our plan to close our five commissaries. All of our commissaries were closed by the end of the first quarter 2012. Restructuring expenses in fiscal 2011 included charges related to the initiation of our plan to close our commissaries and the completion of our plan to restructure the organization to align with our franchise and license growth model.
On May 3, 2012, we announced that our Board authorized a review of strategic alternatives, including a possible business combination or sale of the Company, to maximize value for all stockholders. On December 6, 2012, we announced that our Board had completed its review and elected to recapitalize the Company by amending our existing credit facility and declared a one-time special cash dividend of $4.00 per share payable to holders of record of the Company’s common stock as of the close of business on December 17, 2012. The payment date of the dividend was December 27, 2012. We expensed $3.7 million towards this review.
Other operating (income) expenses, net changed by $2.0 million from income of $0.4 million in fiscal 2011 to expense of $1.6 million in fiscal 2012. In fiscal 2011, we recognized gains on the sale of three restaurants, a gain on the insurance proceeds from a restaurant fire and we incurred acquisition costs related to the purchase of nine stores. In fiscal 2012, we expensed approximately $1.2 million for an employee benefit settlement. We also incurred $0.1 million in acquisition costs in fiscal 2012 towards the purchase of seven restaurants from our franchisees.
Interest expense, net remained flat in fiscal 2012, primarily due to scheduled term loan repayments totaling $5.6 million offset by incremental interest on borrowings of $68.1 million in December 2012. As of January 1, 2013, we had an outstanding debt balance of $136.7 million. Our weighted average interest rate for fiscal 2012 was 3.4% compared to a weighted average rate of 3.1% for fiscal 2011. As of January 1, 2013, our weighted average interest rate was 4.3%. Subject to pay-downs of the revolving credit facility, we estimate interest expense to be in the range of $6.5 million to $7.0 million for fiscal 2013.
The components of our provision for income taxes were as follows:
| | | | | | | | |
| | | January 3, | | | January 1, | |
| | | 2012 | | | 2013 | |
| | | (in thousands) | |
Current | | | | | | | | |
Total current income tax provision | | $ | 1,040 | | | $ | 235 | |
Deferred | | | | | | | | |
Total deferred income tax provision | | | 6,900 | | | | 12,658 | |
Change in valuation allowance | | | 18 | | | | (4,790 | ) |
| | | | | | | | |
Total deferred income tax provision | | | 6,918 | | | | 7,868 | |
| | | | | | | | |
Total income tax provision | | $ | 7,958 | | | $ | 8,103 | |
| | | | | | | | |
Our effective tax rate increased from 37.6% for fiscal 2011 to 38.9% for fiscal 2012 because certain federal employment tax credits that were available to us in fiscal 2011 were not available to us during fiscal 2012. With the enactment of the American Taxpayer Relief Act of 2012 on January 2, 2013, these federal employment tax credits, as calculated on a retroactive basis, are expected to reduce our fiscal 2013 annual effective income tax rate.
34
EINSTEIN NOAH RESTAURANT GROUP, INC.
NON-GAAP FINANCIAL INFORMATION
| | | | | | | | |
| | | Fiscal Year Ended | |
| | | January 3, | | | January 1, | |
| | | 2012 | | | 2013 | |
| | | (in thousands, except earnings per
share and related share information) | |
Total revenues, as reported | | $ | 423,595 | | | $ | 427,006 | |
Impact of extra week in fiscal 2011 | | | (7,300 | ) | | | — | |
| | | | | | | | |
Non-GAAP total revenues | | $ | 416,295 | | | $ | 427,006 | |
| | | | | | | | |
Net income available to common stockholders | | $ | 13,203 | | | $ | 12,741 | |
Adjustments for, net of tax: | | | | | | | | |
Extra week in fiscal 2011 | | | (528 | ) | | | — | |
Restructuring expenses | | | 686 | | | | 293 | |
Strategic alternatives expense | | | — | | | | 2,247 | |
Incremental interest expense | | | — | | | | 166 | |
Other operating expenses, net | | | (246 | ) | | | 973 | |
| | | | | | | | |
Adjusted net income | | $ | 13,115 | | | $ | 16,420 | |
| | | | | | | | |
Weighted average number of common shares outstanding: | | | | | | | | |
Basic | | | 16,629,098 | | | | 16,935,018 | |
Diluted | | | 16,880,321 | | | | 17,217,180 | |
Net income per share available to common stockholders – Basic | | $ | 0.79 | | | $ | 0.75 | |
Adjustments for, net of tax: | | | | | | | | |
Extra week in fiscal 2011 | | | (0.03 | ) | | | — | |
Restructuring expenses | | | 0.04 | | | | 0.02 | |
Strategic alternatives expense | | | — | | | | 0.13 | |
Incremental interest expense | | | — | | | | 0.01 | |
Other operating expenses, net | | | (0.01 | ) | | | 0.06 | |
| | | | | | | | |
Adjusted net income per common share – Basic | | $ | 0.79 | | | $ | 0.97 | |
| | | | | | | | |
Net income per share available to common stockholders – Diluted | | $ | 0.78 | | | $ | 0.74 | |
Adjustments for: | | | | | | | | |
Extra week in fiscal 2011 | | | (0.03 | ) | | | — | |
Restructuring expenses | | | 0.04 | | | | 0.02 | |
Strategic alternatives expense | | | — | | | | 0.13 | |
Incremental interest expense | | | — | | | | 0.01 | |
Other operating expenses, net | | | (0.01 | ) | | | 0.05 | |
| | | | | | | | |
Adjusted net income per common share – Diluted | | $ | 0.78 | | | $ | 0.95 | |
| | | | | | | | |
Results of Operations for Fiscal 2011 as compared to Fiscal 2010
Financial Highlights
| | • | | Consolidated revenues increased $11.9 million, which was driven by strong increases in our franchise and license revenue, a strong increase in manufacturing revenue and $7.3 million contributed by the extra 53rd week in fiscal 2011. |
| | • | | Manufacturing and commissary revenues increased $4.1 million, which was driven by higher frozen dough sales to third party resellers and $0.5 million contributed by the extra 53rd week in fiscal 2011. |
| | • | | Franchise and license related revenues grew $1.2 million, which was driven by an increase in comparable store sales of +1.8% and $0.1 million contributed by the extra 53rd week in fiscal 2011. |
35
| | • | | Net income increased 24.3% primarily due to interest savings, a lower effective tax rate and the extra 53rd week. |
| | • | | Adjusted EBITDA decreased 1.8% primarily due to inflationary pressures in our product costs. |
| | • | | EPS increased to $0.78 per share on a dilutive basis in fiscal 2011 compared to $0.67 per share on a dilutive basis in fiscal 2010. This increase was primarily due to $0.03 in additional EPS contributed by the extra 53rd week, interest rate savings and a lower effective tax rate on our earnings. Restructuring charges incurred in fiscal 2011 reduced our EPS by approximately $0.04 per diluted share. |
Consolidated Results – Fiscal 2011 vs Fiscal 2010
| | | | | | | | | | | | |
| | | Fiscal year ended | |
| | | | | | | | | Increase/ | |
| | | (in thousands) | | | (Decrease) | |
| | | December 28, | | | January 3, | | | 2011 | |
| | | 2010 | | | 2012 | | | vs. 2010 | |
Revenues | | $ | 411,711 | | | $ | 423,595 | | | | 2.9 | % |
Cost of sales | | | 327,571 | | | | 342,075 | | | | 4.4 | % |
Operating expenses | | | 56,569 | | | | 57,002 | | | | 0.8 | % |
| | | | | | | | | | | | |
Income from operations | | | 27,571 | | | | 24,518 | | | | (11.1 | %) |
Interest expense, net | | | 5,135 | | | | 3,357 | | | | (34.6 | %) |
Adjustment for Series Z modification* | | | 929 | | | | — | | | | (100.0 | %) |
Write-off of debt issuance costs upon redemption of term loan | | | 966 | | | | — | | | | (100.0 | %) |
| | | | | | | | | | | | |
Income before income taxes | | | 20,541 | | | | 21,161 | | | | 3.0 | % |
Total provision for income taxes | | | 9,918 | | | | 7,958 | | | | (19.8 | %) |
| | | | | | | | | | | | |
Net income | | $ | 10,623 | | | $ | 13,203 | | | | 24.3 | % |
Adjustments to net income: | | | | | | | | | | | | |
Interest expense, net | | | 5,135 | | | | 3,357 | | | | (34.6 | %) |
Provision for income taxes | | | 9,918 | | | | 7,958 | | | | (19.8 | %) |
Depreciation and amortization | | | 17,769 | | | | 19,259 | | | | 8.4 | % |
Series Z modification | | | 929 | | | | — | | | | (100.0 | %) |
Write-off of debt issuance costs | | | 966 | | | | — | | | | (100.0 | %) |
Restructuring expenses | | | 477 | | | | 1,099 | | | | 130.4 | % |
Other operating income | | | (531 | ) | | | (395 | ) | | | (25.6 | %) |
| | | | | | | | | | | | |
Adjusted EBITDA | | $ | 45,286 | | | $ | 44,481 | | | | (1.8 | %) |
| | | | | | | | | | | | |
| * | As a result of the March 17, 2010 agreement modifying our Series Z, we recognized a non-cash loss of $0.9 million on the extinguishment of debt, recorded additional redemption within stockholders’ equity and recorded a discount within interest expense. |
Our income from operations declined by $3.1 million in 2011 to $24.5 million primarily as a result of inflationary pressures on our product costs, partially offset by $0.8 million in income from operations resulting from the 53rd week in fiscal 2011.
Total revenues increased by $11.9 million to $423.6 million, primarily the result of increased revenue from our manufacturing and commissary segment and $7.3 million in revenue from the extra 53rd week. System-wide comparable stores were +0.4% for fiscal 2011 due to an increase in average check of +3.7% that was partially offset by a decline in system-wide transactions of -3.3%. Our comparable transactions decreased from 2010 primarily due to the transaction impact of our 2011 promotion not generating as many transactions as our 2010 free bagel Friday promotion. Our catering sales increased by 16.3% over fiscal 2010. In addition, we maintained
36
our focus on delivering product innovation focused on health and quality, under the theme of “Club Favorites”, a new menu program we introduced in 2011.
Net income increased for fiscal 2011 due to decreases in our overall interest expense, a lower effective tax rate, partially offset by a decline in income from operations. Interest expense, net decreased by $1.8 million primarily due to realizing the impacts of decreasing our overall debt balance during the second half of 2010. The refinancing of our debt combined with the expiration of our interest rate swap, the pay down of our credit facility and the full redemption of our Series Z lowered our average debt balance from $101.6 million for fiscal 2010 to $78.9 million for fiscal 2011. These efforts also decreased our weighted average interest rates on our overall debt from 4.6% for fiscal 2010 to 3.1% for fiscal 2011. Our effective tax rate decreased from 48.3% from fiscal 2010 to 37.6% for fiscal 2011. This decrease relates to the elimination of several items that were non-deductible in 2010, including the $0.9 million adjustment on the modification of the Series Z, the additional redemption amount of the Series Z and the remaining deferred tax associated with our interest rate swap which expired in 2010. Also, the realization of higher federal employment tax credits in 2011 lowered our effective tax rate.
Company-Owned Restaurant Operations
| | | | | | | | | | | | | | | | | | | | |
| | | Fiscal year ended | |
| | | | | | Increase/ | | | Percentage of company-owned | |
| | | (in thousands) | | | (Decrease) | | | restaurant sales | |
| | | December 28, | | | January 3, | | | 2011 | | | December 28, | | | January 3, | |
| | | 2010 | | | 2012 | | | vs. 2010 | | | 2010 | | | 2012 | |
Company-owned restaurant sales | | $ | 372,191 | | | $ | 378,723 | | | | 1.8 | % | | | | | | | | |
Percent of total revenues | | | 90.4 | % | | | 89.4 | % | | | | | | | | | | | | |
Cost of sales: | | | | | | | | | | | | | | | | | | | | |
Cost of goods sold | | $ | 106,011 | | | $ | 112,002 | | | | 5.7 | % | | | 28.5 | % | | | 29.6 | % |
Labor costs | | | 108,813 | | | | 110,467 | | | | 1.5 | % | | | 29.2 | % | | | 29.2 | % |
Rent and related expenses | | | 39,691 | | | | 40,277 | | | | 1.5 | % | | | 10.7 | % | | | 10.6 | % |
Other operating costs | | | 37,696 | | | | 39,092 | | | | 3.7 | % | | | 10.1 | % | | | 10.3 | % |
Marketing costs | | | 9,794 | | | | 9,796 | | | | 0.0 | % | | | 2.6 | % | | | 2.6 | % |
| | | | | | | | | | | | | | | | | | | | |
Total company-owned restaurant costs | | $ | 302,005 | | | $ | 311,634 | | | | 3.2 | % | | | 81.1 | % | | | 82.3 | % |
| | | | | | | | | | | | | | | | | | | | |
Total company-owned restaurant gross margin | | $ | 70,186 | | | $ | 67,089 | | | | (4.4 | %) | | | 18.9 | % | | | 17.7 | % |
| | | | | | | | | | | | | | | | | | | | |
Comparable store sales for our company-owned restaurants for each quarter in 2010 and 2011 were as follows:
| | | | | | | | | | | | |
| | | Fiscal 2010 | | | Fiscal 2011 | | | Change | |
First Quarter | | | -0.2 | % | | | -1.4 | % | | | -1.2 | % |
Second Quarter | | | -2.2 | % | | | -0.3 | % | | | +1.9 | % |
Third Quarter | | | -0.2 | % | | | +0.7 | % | | | +0.9 | % |
Fourth Quarter | | | +1.0 | % | | | +0.8 | % | | | -0.2 | % |
Annual | | | -0.4 | % | | | 0.0 | % | | | +0.4 | % |
Company-owned restaurant sales for fiscal 2011 increased $6.5 million, which was primarily due to the impact of the additional 53rd week in fiscal 2011. Company-owned comparable store sales remained flat, with transactions declining by -4.0% offset by an increase in average check of +4.0%. In fiscal 2011, we acquired nine restaurants, opened an additional four restaurants and closed one restaurant. The majority of our acquisitions and openings occurred during the fourth quarter and contributed $0.9 million of incremental net sales for the year. Restaurant sales for 2010 benefited from $0.4 million in gift certificate breakage from a program that no longer exists.
37
Our bagel thin sandwich offerings, which were introduced in the second quarter of 2010, comprised 4.9% of our total mix for fiscal 2011, compared to 2.6% for fiscal 2010. Catering sales, which comprised approximately 6% of our total sales for fiscal 2011, increased 16.3% from fiscal 2010.
Total costs for company-owned restaurants increased by $9.6 million, primarily due to additional expenses of $5.1 million contributed by the extra 53rd week and inflationary pressures in our product costs. To help offset these costs, we took price increases of 4.0% during 2011 and established several initiatives to control costs.
As a percentage of company-owned restaurant sales, we saw an increase in our food costs from 28.5% for fiscal 2010 to 29.6% for fiscal 2011. This 110 basis point increase includes the impacts of inflation in our commodity costs (+120 basis points) and a product mix shift towards catering and sandwiches (+100 basis points) partially offset by price increases (-60 basis points) and savings from our initiatives (-50 basis points). We implemented a cross functional team to evaluate innovative ways to target $3.0 million in annualized incremental savings on a go-forward basis without negatively impacting the customer experience.
As a percentage of company-owned restaurant sales, labor costs, other operating costs (which include marketing costs), and rent and related costs were essentially flat to fiscal 2010. We incurred approximately $9.8 million in marketing costs for both fiscal 2010 and fiscal 2011.
Our company-owned restaurant gross margin decreased from 18.9% for fiscal 2010 to 17.7% for fiscal 2011, primarily due to inflationary pressures in our product costs.
Manufacturing and Commissary Operations
| | | | | | | | | | | | | | | | | | | | |
| | | Fiscal year ended | |
| | | | | | Increase/ | | | Percentage of manufacturing | |
| | | (in thousands) | | | (Decrease) | | | and commissary revenues | |
| | | December 28, | | | January 3, | | | 2011 | | | December 28, | | | January 3, | |
| | | 2010 | | | 2012 | | | vs. 2010 | | | 2010 | | | 2012 | |
Manufacturing and commissary revenues | | $ | 30,405 | | | $ | 34,542 | | | | 13.6 | % | | | | | | | | |
Percent of total revenues | | | 7.4 | % | | | 8.2 | % | | | | | | | | | | | | |
Manufacturing and commissary costs | | $ | 25,566 | | | $ | 30,441 | | | | 19.1 | % | | | 84.1 | % | | | 88.1 | % |
| | | | | | | | | | | | | | | | | | | | |
Total manufacturing and commissary gross margin | | $ | 4,839 | | | $ | 4,101 | | | | (15.3 | %) | | | 15.9 | % | | | 11.9 | % |
| | | | | | | | | | | | | | | | | | | | |
Manufacturing and commissary revenues for fiscal 2011 increased $4.1 million compared to fiscal 2010, driven mainly by higher frozen dough sales to third parties from our manufacturing facilities and $0.5 million contributed by the extra 53rd week in fiscal 2011. Manufacturing and commissary gross margin decreased 15.3% primarily due to higher commodity costs and a shift in sales volume to lower margin export customers. On a year to date basis, gross margin as a percentage of manufacturing and commissary revenue was 11.9%, down from 15.9% in 2010.
We closed our Ohio commissary in the fourth quarter of 2011 and closed our remaining four commissaries by the end of the first quarter 2012.
Franchise and License Operations
| | | | | | | | | | | | |
| | | Fiscal year ended | |
| | | | | | Increase/ | |
| | | (in thousands) | | | (Decrease) | |
| | | December 28, | | | January 3, | | | 2011 | |
| | | 2010 | | | 2012 | | | vs. 2010 | |
Franchise and license related revenues | | $ | 9,115 | | | $ | 10,330 | | | | 13.3 | % |
Percent of total revenues | | | 2.2 | % | | | 2.4 | % | | | | |
Number of franchise and license restaurants | | | 302 | | | | 333 | | | | | |
38
Overall, franchise and license revenue improvement was driven by continued unit development which has netted an additional 29 licensed locations and 2 franchised locations since December 28, 2010. Franchise and license comparable store sales were +1.8% for the fiscal year ended January 3, 2012. Franchise and license revenue improved by $1.2 million, or 13.3% from 2010, primarily the result of continued unit development and single-digit increases in comparable store sales.
Corporate Support
| | | | | | | | | | | | | | | | | | | | |
| | | Fiscal year ended | |
| | | | | | Increase/ | | | Percentage of | |
| | | (in thousands) | | | (Decrease) | | | total revenues | |
| | | December 28, | | | January 3, | | | 2011 | | | December 28, | | | January 3, | |
| | | 2010 | | | 2012 | | | vs. 2010 | | | 2010 | | | 2012 | |
General and administrative expenses | | $ | 38,484 | | | $ | 36,774 | | | | (4.4 | %) | | | 9.3 | % | | | 8.7 | % |
Depreciation and amortization | | | 17,769 | | | | 19,259 | | | | 8.4 | % | | | 4.3 | % | | | 4.5 | % |
Pre-opening expenses | | | 370 | | | | 265 | | | | (28.4 | %) | | | 0.1 | % | | | 0.0 | % |
Restructuring expenses | | | 477 | | | | 1,099 | | | | 130.4 | % | | | 0.1 | % | | | 0.3 | % |
Other operating income, net | | | (531 | ) | | | (395 | ) | | | (25.6 | %) | | | (0.1 | %) | | | (0.1 | %) |
| | | | | | | | | | | | | | | | | | | | |
Total operating expenses | | $ | 56,569 | | | $ | 57,002 | | | | 0.8 | % | | | 13.7 | % | | | 13.4 | % |
Interest expense, net | | | 5,135 | | | | 3,357 | | | | (34.6 | %) | | | 1.2 | % | | | 0.8 | % |
Adjustment for Series Z modification | | | 929 | | | | — | | | | (100.0 | %) | | | 0.2 | % | | | 0.0 | % |
Write-off of debt issuance costs upon redemption of term loan | | | 966 | | | | — | | | | (100.0 | %) | | | 0.2 | % | | | 0.0 | % |
Provision for income taxes | | | 9,918 | | | | 7,958 | | | | (19.8 | %) | | | 2.4 | % | | | 1.9 | % |
Our total general and administrative expenses decreased $1.7 million, or 4.4%, primarily due to declines of $1.9 million in variable incentive compensation and $0.5 million in corporate travel expenses. These decreases in general and administrative expenses were partially offset by an increase in our stock based compensation expense of $0.8 million. Our performance incentive compensation decreased from 2010 as we reached a higher bonus threshold in fiscal 2010 than we did in fiscal 2011.
Depreciation and amortization expenses increased $1.5 million, or 8.4%. The increase is due to additional investments in company-owned restaurants that were either added or upgraded throughout fiscal 2011, as well as a full year of depreciation on capital assets added in fiscal 2010.
Pre-opening expenses, which include rent, wages, food and other restaurant operating costs, declined due to two fewer store openings in fiscal 2011. We opened four company-owned stores in fiscal 2011 compared to six company-owned stores in fiscal 2010.
We also incurred $1.1 million in restructuring expenses for fiscal 2011. In 2011, we committed to a plan to close our five commissaries by the end of the first quarter 2012. As a result of this plan, we incurred $0.7 million in charges relating to severance charges, contract termination costs and other miscellaneous charges. In 2010, we approved a plan to restructure the organization to align with our franchise growth model. This reorganization included eliminating certain redundant positions and reducing headcount. We also eliminated redundant positions in the fourth quarter of 2011. As a result of these actions, we incurred an additional $0.4 million of severance charges and other miscellaneous charges during 2011.
Other operating income decreased $0.1 million from fiscal 2010 to fiscal 2011. In the third quarter of 2010, we recognized a gain on the sale of a restaurant to a franchisee. For fiscal 2011, we recognized gains on the sale of three restaurants to franchisees as well as a gain on the insurance proceeds from a restaurant fire, partially offset by $0.3 million in acquisition costs related to the purchase of nine stores in fiscal 2011.
39
Interest expense, net decreased in 2011 primarily due to the expiration of an interest rate swap agreement in August 2010 and a decrease in additional redemption amounts on previously outstanding mandatorily redeemable preferred stock. Our weighted average interest rate for fiscal 2011 was 3.1%.
The components of our provision for income taxes were as follows:
| | | | | | | | |
| | | December 28, | | | January 3, | |
| | | 2010 | | | 2012 | |
| | | (in thousands) | |
Current | | | | | | | | |
Total current income tax provision | | $ | 194 | | | $ | 1,040 | |
Deferred | | | | | | | | |
Total deferred income tax provision | | | 9,862 | | | | 6,899 | |
Change in valuation allowance | | | (138 | ) | | | 19 | |
| | | | | | | | |
Total deferred income tax provision | | | 9,724 | | | | 6,918 | |
| | | | | | | | |
Total income tax provision | | $ | 9,918 | | | $ | 7,958 | |
| | | | | | | | |
Our effective tax rate decreased from 48.3% from fiscal 2010 to 37.6% for fiscal 2011. This decrease relates to the elimination of several items that were non-deductible in 2010, including the $0.9 million adjustment on the modification of the Series Z, the additional redemption amount of the Series Z and the remaining deferred tax associated with our interest rate swap which expired in 2010. We also realized higher federal employment tax credits in fiscal 2011.
Contractual Obligations
The following table summarizes the amounts of payments due under specified contractual obligations as of January 1, 2013:
| | | | | | | | | | | | | | | | | | | | |
| | | Payments Due by Fiscal Period | |
| | | Total | | | Less than
1 year | | | 1 -3 Years | | | 3 - 5 Years | | | More than
5 years | |
| | | (in thousands) | |
Long-term debt obligations | | | 136,700 | | | | 5,000 | | | | 10,625 | | | | 121,075 | | | | — | |
Estimated interest expense on our credit facility (a) | | | 27,384 | | | | 6,244 | | | | 11,305 | | | | 9,835 | | | | — | |
Capital lease obligations | | | 64 | | | | 26 | | | | 24 | | | | 14 | | | | — | |
Operating lease obligations (b) | | | 186,552 | | | | 34,332 | | | | 63,479 | | | | 42,796 | | | | 45,945 | |
Purchase obligations (c) | | | 26,323 | | | | 26,323 | | | | — | | | | — | | | | — | |
Other long-term obligations (d) | | | 4,851 | | | | — | | | | 1,723 | | | | 1,550 | | | | 1,578 | |
Accounts payable and accrued expenses | | | 38,324 | | | | 38,324 | | | | — | | | | — | | | | — | |
| | | | | | | | | | | | | | | | | | | | |
Total | | $ | 420,198 | | | $ | 110,249 | | | $ | 87,156 | | | $ | 175,270 | | | $ | 47,523 | |
| | | | | | | | | | | | | | | | | | | | |
| (a) | Calculated as of January 1, 2013, using the variable LIBOR and U.S. Prime rates, plus the applicable margin in effect for the remainder. As the interest rates on our term loan facility and the revolving credit facility are variable, actual payments could differ materially. |
| (b) | Amounts represent cash payments and do not include potential renewal options. |
| (c) | Purchase obligations consist of non-cancelable minimum purchases of frozen dough and certain other raw ingredients that are used in our products. |
| (d) | Other long-term obligations primarily consist of the remaining liability related to minimum future purchase commitments with a supplier that advanced us $10.0 million in 1996. |
40
Financial Condition, Liquidity and Capital Resources
The restaurant industry is predominantly a cash business where cash is received at the time of the transaction. We believe that we will generate sufficient cash flow to fund operations, capital expenditures, and required debt and interest payments. Our investment in inventory is minimal because our products are perishable. Our accounts payable are on terms that we believe are consistent with those of other companies within the industry.
The primary driver of our operating cash flow is our restaurant revenue, specifically the gross margin from our company-owned restaurants. Therefore, we focus on the elements of those operations including store sales and controllable expenses to ensure a steady stream of operating profits that enable us to meet our cash obligations.
Including tenant improvement allowances that we typically receive from the landlord, the average cost of a new restaurant was approximately $474,000 in 2012. This amount can vary and is dependent on square footage, layout and location. The cost includes equipment, leasehold improvements, furniture and fixtures, and other related capital. This average cost does not include any pre-opening expenses or capitalized internal development costs. While tenant allowances reduce the cash cost of our restaurants, the amounts vary amongst restaurants as they depend on the location of the restaurant and on other terms of the lease. We are planning to deploy our capital into specific areas of the business such as adding drive-thru lanes to restaurants, adding new exterior signage, upgrades and remodels, and continuing with our KDS installations where applicable. We believe that the KDS improves speed and efficiency in delivering customer orders and helps reduce waste.
We anticipate that the majority of our capital expenditures for 2013 will be focused on the addition of fifteen to twenty new company-owned restaurants and the relocation of seven to ten company-owned restaurants. We also intend to deploy capital into areas such as remodeling, installing drive-thru lanes and adding new exterior signage.
The following is information on our restaurant economics as of January 1, 2013 and represents the average company-owned restaurant that has been open longer than one year:
| | | | |
Unit Economics | |
| | | January 1,
2013 | |
| | | (in thousands) | |
A) Last 12 months average restaurant sales | | $ | 883 | |
B) Restaurant operating profit | | $ | 174 | |
| | | | |
C)Margin (B/A) | | | 19.7 | % |
D) Cash investment cost(1) | | $ | 516 | |
| | | | |
E) Cash on cash return (B/D) | | | 34 | % |
F) Restaurant-level earnings before interest, taxes, depreciation, amortization and rent(2) | | $ | 244 | |
G) Fully capitalized investment(3) | | $ | 1,076 | |
| | | | |
H) Fully capitalized cash on cash return (F/G) | | | 23 | % |
| (1) | Amount excludes pre-opening expenses. |
| (2) | Restaurant operating profit $174,000 plus 2012 average restaurant rent expense of $70,000 per year. |
| (3) | Average rent expense capitalized at 8 times plus cash investment cost of $516,000. |
41
| | | | | | | | | | | | |
| | | Cash Flow Through On A Per Store Basis
Fiscal Year Ended
January 1, 2013 | |
| | | Company Owned | | | Licensed | | | Franchised(3) | |
| | | (in thousands) | |
Average unit volume | | $ | 883 | | | $ | 450 | | | $ | 859 | |
Contribution margin %(1)(2) | | | 19.7 | % | | | 6.6 | % | | | 5.0 | % |
Contribution margin | | $ | 174 | | | $ | 30 | | | $ | 43 | |
Cash investment | | $ | 516 | | | $ | - | | | $ | - | |
Upfront fee | | $ | - | | | $ | 12.5 | | | $ | 35 | |
| (1) | Reflects contribution margin for company-owned restaurants open for greater than one year and weighted average royalty rate of system. |
| (2) | Franchisees also contribute 4.0% of sales for marketing activities which equates to an average of $40,000 per location. |
| (3) | Only reflects Einsteins Bros. |
Senior Credit Facility
In December 2010, we entered into a senior credit facility with Bank of America and a syndicate of institutional lenders, which was amended and restated in December 2012 (the “Senior Credit Facility”).
The Senior Credit Facility consists of a:
| | • | | $75.0 million revolving credit facility maturing on December 6, 2017 (“revolver”); and |
| | • | | $100.0 million first lien term loan maturing December 6, 2017. |
We may prepay amounts outstanding under the credit facility and may terminate commitments in whole at any time without penalty or premium upon prior written notice.
In addition, the Senior Credit Facility provides for (i) an incremental term loan (the “Incremental Term Loan”) and (ii) an increase in the revolver (the “Revolving Facility Increase” and together with the Incremental Term Loan, the “Incremental Facilities”) of up to $50 million to be used by us, if needed, solely for the purpose of making acquisitions permitted under the Senior Credit Facility. If we choose to draw down the Incremental Facilities, the outstanding amount of the Incremental Facilities must be repaid in equal quarterly installments on the last day of each calendar quarter, with any remaining amounts due and payable on December 6, 2017. Availability of the Incremental Facilities is subject to customary borrowing conditions, including the absence of any default or material adverse change, and to a requirement of advanced successful syndication of the Incremental Facilities.
A portion of the revolver remains available, subject to certain conditions, to finance our ongoing working capital, capital expenditure and general corporate needs. In addition, the entire revolver is available for letters of credit, which reduce the availability on the line. As of January 1, 2013, our availability under the revolver was $31.6 million. On January 28, 2013, we paid $6.7 million towards the revolver, thereby increasing the availability under the revolver to $38.3 million.
42
Working Capital
Our working capital position increased by $5.2 million in fiscal 2012. We began fiscal 2012 with working capital of $0.2 million and ended fiscal 2012 with $5.4 million.
| | | | | | | | | | | | |
| | | January 3, | | | January 1, | | | | |
| | | 2012 | | | 2013 | | | Change | |
| | | (in thousands) | |
Current assets: | | | | |
Cash and cash equivalents | | $ | 8,652 | | | $ | 17,432 | | | $ | 8,780 | |
Restricted cash | | | 889 | | | | 998 | | | | 109 | |
Accounts receivable | | | 7,774 | | | | 9,024 | | | | 1,250 | |
Inventories | | | 5,562 | | | | 5,382 | | | | (180 | ) |
Current deferred income tax assets, net | | | 9,013 | | | | 8,190 | | | | (823 | ) |
Prepaid expenses | | | 6,483 | | | | 7,059 | | | | 576 | |
Other current assets | | | 526 | | | | 661 | | | | 135 | |
| | | | | | | | | | | | |
Total current assets | | | 38,899 | | | | 48,746 | | | | 9,847 | |
| | | | | | | | | | | | |
Current liabilities: | | | | | | | | | | | | |
Accounts payable | | $ | 6,591 | | | $ | 10,243 | | | $ | 3,652 | |
Accrued expenses and other current liabilities | | | 24,611 | | | | 28,104 | | | | 3,493 | |
Current portion of long-term debt | | | 7,500 | | | | 5,000 | | | | (2,500 | ) |
| | | | | | | | | | | | |
Total current liabilities | | | 38,702 | | | | 43,347 | | | | 4,645 | |
| | | | | | | | | | | | |
Working capital surplus | | $ | 197 | | | $ | 5,399 | | | $ | 5,202 | |
| | | | | | | | | | | | |
The increase in working capital is primarily due to the increase in our cash balance, which we attribute to strong cash flow from operations, which increased $9.4 million from fiscal 2011. As of January 1, 2013 we had unrestricted cash of $17.4 million, representing an increase in unrestricted cash of $8.8 million during fiscal 2012. In addition to changes in our unrestricted cash, other elements of working capital fluctuated in the normal course of business. On January 28, 2013, using existing cash on hand, we paid $6.7 million towards our long-term debt.
Free Cash Flow
Free Cash Flow increased by $7.2 million in fiscal 2012, primarily due to an increase of $9.4 million in net cash provided by operations while net cash used in investing activities decreased by $2.2 million.
| | | | | | | | |
| | | Fiscal year ended | |
| | | January 3, | | | January 1, | |
| | | 2012 | | | 2013 | |
| | | (in thousands) | |
Net cash provided by operating activities | | $ | 39,110 | | | $ | 48,511 | |
Net cash used in investing activities | | | (23,685 | ) | | | (25,861 | ) |
| | | | | | | | |
Free cash flow | | | 15,425 | | | | 22,650 | |
Net cash used in financing activities | | | (18,541 | ) | | | (13,870 | ) |
| | | | | | | | |
Net (decrease) increase in cash and cash equivalents | | | (3,116 | ) | | | 8,780 | |
Cash and cash equivalents, beginning of period | | | 11,768 | | | | 8,652 | |
| | | | | | | | |
Cash and cash equivalents, end of period | | $ | 8,652 | | | $ | 17,432 | |
| | | | | | | | |
Based upon our projections for 2013, we believe our various sources of capital, including availability under our existing credit facility, and cash flow provided by operating activities, are adequate to finance operations and capital expenditures as well as to satisfy the repayment of current debt obligations.
43
Net Cash Provided by Operating Activities
Net cash generated by operating activities was $48.5 million for fiscal 2012 compared to $39.1 million for fiscal 2011, a 24.0% increase. A significant portion of the increase can be attributed to increases in our year end accounts payable and accrued liability balances. Our accounts payable has increased based on timing differences in the ordinary course of business and capital expenditures. Our accrued expenses increased due to increases in our bonus accruals and incremental increases in dividends. The remaining increase can be attributed to timing differences within our working capital accounts.
Cash Used in Investing Activities
During fiscal 2012, we spent $2.2 million, net of cash acquired, on the purchase of eight restaurants. We also used approximately $24.0 million of cash to purchase additional property and equipment as follows:
| | • | | $20.2 million for new restaurants and upgrades of existing restaurants, including the installation of new equipment, exterior signs and new menu boards; |
| | • | | $3.7 million for replacement of equipment at our existing company-owned restaurants and at our manufacturing operations; and |
| | • | | $0.1 million for general corporate purposes. |
We also received $0.4 million in proceeds from the sale of one company-owned restaurant to a franchisee.
During fiscal 2011, we spent $6.8 million, net of cash acquired, on the purchase of nine restaurants, which includes $5.0 million towards the acquisition of the assets of Kettleman Bagel Company in Portland, Oregon. We also used approximately $18.2 million of cash to purchase additional property and equipment as follows:
| | • | | $10.8 million for new restaurants and upgrades of existing restaurants, including the installation of new coffee equipment, exterior signs and new menu boards; |
| | • | | $6.4 million for replacement of equipment at our existing company-owned restaurants and at our manufacturing operations; and |
| | • | | $1.0 million for general corporate purposes. |
We also received $1.4 million in proceeds from the sale of three company-owned restaurants to franchisees and insurance proceeds from a restaurant fire.
Cash Used in Financing Activities
During fiscal 2012, we amended our Senior Credit Facility to increase the availability and then borrowed an additional $38.1 million on our term loan and an additional $30.0 million on our revolving line of credit. With these proceeds, we paid a one-time special cash dividend of $4.00 per share of common stock to stockholders totaling approximately $68.1 million. We paid $1.6 million in debt issuance costs associated with this amendment. Prior to the amendment of the Senior Credit Facility, we made term loan payments totaling $5.6 million throughout the year.
In addition to the dividend payment referred to above, we also made $8.5 million in regular quarterly dividend payments in 2012. We received $1.8 million in proceeds from stock options exercised during fiscal 2012.
During fiscal 2011, we made payments on our Senior Credit Facility totaling $15.5 million, of which $7.5 million went towards the term loan in accordance with our debt repayment schedule and $8.0 million towards the revolving line of credit. Our outstanding debt balance decreased $13.5 million, based on the above repayments, partially offset by $2.0 million in borrowings on the revolving line of credit. We also paid dividends of $6.3 million during fiscal 2011. We received $1.3 million in proceeds from stock options exercised during fiscal 2011.
44
Off-Balance Sheet Arrangements
Letters of Credit
We have $6.7 million in letters of credit outstanding under our Senior Credit Facility. The letters of credit expire on various dates during 2013, are generally automatically renewable for one additional year and are payable upon demand in the event that we fail to pay the underlying obligation.
Economic Environment and Commodity Volatility
Our results depend on discretionary consumer spending, which is influenced by consumer confidence and disposable income. Declining home values and sales, the negative impact of the changes in the subprime mortgage and credit markets, high unemployment rates and lower consumer confidence as a result of the changes within the economic environment have caused the consumer to experience a real and perceived reduction in disposable income. We believe that this has negatively impacted consumer spending in most segments of the restaurant industry, including the segment in which we compete. Any material decline in the amount of discretionary spending could have a material adverse effect on our sales and income.
We believe our current strategy for dealing with inflation, which is to maintain operating margins through a combination of menu price increases, cost controls, efficient purchasing practices and careful evaluation of property and equipment needs, has been an effective tool for dealing with increased costs. However, the impact of inflation on labor and occupancy costs could, in the future, affect our operations. We pay many of our associates based on hourly rates slightly above the applicable minimum federal, state or municipal “living wage” rates. Recent changes in minimum wage laws may create pressure to increase the pay scale for our associates, which would increase our labor costs. Costs for construction, taxes, repairs, maintenance and insurance impact our occupancy costs.
Inflation on food costs also can also increase our cost of goods sold, which includes food and product costs, compensation costs and other operating costs. Wheat, coffee, butter and cheese are our primary agricultural commodities. Chicken and turkey are other major agricultural commodities which are included in our cost of goods sold. Utilizing a third party, we attempt to lock our food and product costs over an extended period of time. We believe that this strategy has been effective in dealing with increases to our food and product costs.
Recent Accounting Pronouncements
See Note 2 to our consolidated financial statements set forth in Item 8 of this Form 10-K for a detailed description of recent accounting pronouncements. We do not expect these recently issued accounting pronouncements to have a material impact on our results of operations, financial condition, or liquidity in future periods.
Critical Accounting Estimates
The discussion and analysis of our financial condition and results of operations are based upon our consolidated financial statements, which have been prepared in accordance with GAAP. The preparation of these consolidated financial statements requires us to make estimates and judgments that affect the reported amounts of assets, liabilities, revenues and expenses. On an on-going basis, we evaluate our estimates based on historical experience and on various other assumptions that are believed to be reasonable under the circumstances, the results of which form the basis for making judgments about the carrying value of assets and liabilities that are not readily apparent from other sources. Actual results may differ from these estimates under different assumptions or conditions. Additionally, any estimates for contingent liabilities that arise as result of any legal proceedings are discussed in Item 3 of this report.
Our significant accounting policies are discussed in Note 2 to our consolidated financial statements set forth in Item 8 of this Form 10-K.
45
Income Taxes
We recognize deferred tax assets and liabilities based on the differences between the financial statement carrying amounts and the respective tax bases of our assets and liabilities. Deferred tax assets and liabilities are measured using current enacted tax rates expected to apply to taxable income in the years in which we expect the temporary differences to reverse. We routinely evaluate the likelihood of realizing the benefit of our deferred tax assets and may record a valuation allowance if, based on all available evidence, we determine that some portion of the tax benefit will not be realized.
In addition, our income tax returns are periodically audited by federal and state tax authorities. These audits include questions regarding our tax filing positions, including the timing and amount of deductions taken and the allocation of income amongst various tax jurisdictions. We evaluate our exposures associated with our various tax filing positions and record a related liability. We adjust our liability for unrecognized tax benefits and income tax provision in the period in which an uncertain tax position is effectively settled, the statute of limitations expires for the relevant taxing authority to examine the tax position or when more information becomes available.
As of January 1, 2013, we have not recorded a valuation allowance on our deferred tax assets. The valuation allowance that we had recorded as of January 3, 2012 was applied against net operating losses that will expire prior to their utilization. During fiscal 2012, we eliminated these net operating losses and accordingly eliminated the related valuation allowance. We have also recorded a liability for unrecognized tax benefits of $0.7 million. The recording of these amounts requires significant management judgment regarding the interpretation of applicable statutes, the status of various income tax audits, and our particular facts and circumstances. We believe that our estimates are reasonable; however, actual results could differ from these estimates.
Impairment of Long-Lived Assets
We evaluate long-lived assets for impairment whenever events or changes in circumstances indicate that the carrying values of these assets may not be recoverable. For the purpose of reviewing restaurant assets for indicators of potential impairment, assets are grouped together at the market level. The Company manages its restaurants by market with significant common costs and promotional activities which are generally not clearly identifiable with an individual restaurant’s cash flows. We believe that historical cash flows, in addition to other relevant facts and circumstances, are the primary basis for estimating future cash flows. Relevant facts and circumstances may include, but are not limited to, local competition in the area, the ability of existing restaurant management, the necessity of tiered pricing structures and the impact that upgrading our restaurants may have on our estimates. Recoverability of restaurant assets is measured by a comparison of the carrying amount of an individual restaurant’s assets to the estimated identifiable undiscounted future cash flows expected to be generated by those restaurant assets. This process requires the use of estimates and assumptions, which are subject to a high degree of judgment. If the carrying amount of an individual restaurant’s assets exceeds its estimated, identifiable, undiscounted future cash flows, an impairment charge is recognized as the amount by which the carrying amount of the assets exceeds its fair value. Generally, a restaurant’s identifiable future cash flows are discounted to estimate its fair value. We have not recorded impairment charges for fiscal 2011 and fiscal 2012.
Impairment of Goodwill and Other Indefinite Lived Intangible Assets
At least annually, we assess the recoverability of goodwill and other intangible assets that are not subject to amortization. These impairment tests require us to estimate the fair values of our restaurant concepts by making assumptions regarding future profits and cash flows, expected growth rates, terminal values, discount rates and other factors. As of January 1, 2013, the fair value of goodwill and other intangible assets not subject to amortization sufficiently exceeded the carrying values. The assumptions used in the estimate of fair value are generally consistent with the past performance of each reporting unit and other intangible assets and are also consistent with the projections and assumptions that are used in current operating plans. These assumptions are
46
subject to change as a result of changing economic and competitive conditions. In the event that these assumptions change in the future, we may be required to record impairment charges for these assets.
Business Combinations
We account for our acquisitions using the acquisition method of accounting. This method of accounting involves the allocation of the purchase price to the estimated fair values of the assets acquired and liabilities assumed. This allocation process involves the use of estimates and assumptions to derive fair values and to complete the allocation. Acquisition accounting allows for up to one year to obtain the information necessary to finalize the fair value of all assets acquired and liabilities. As of January 1, 2013, all our recorded acquisition accounting allocations have been finalized.
Insurance Liabilities
We use a combination of insurance and self-insurance mechanisms to provide for potential liabilities on workers’ compensation, general liability and healthcare benefits. The insurance liabilities represent an estimate of the ultimate cost of claims incurred and unpaid as of the balance sheet date. The estimated liabilities are established and are not discounted, with the exception of the workers’ compensation, which is discounted at 10% based upon analysis of historical data and actuarial estimates, and they are reviewed on a quarterly basis to ensure that the liabilities are appropriate. If actual trends, including the severity or frequency of claims differ from our estimates, our financial results could be favorably or unfavorably impacted.
Stock-Based Compensation
We use the Black-Scholes model to estimate the fair value of our option awards. The Black-Scholes model requires estimates of the expected term of the option, as well as future volatility and the risk-free interest rate. Our stock options generally vest over a period of 6 months to 3 years and have contractual terms to exercise of 5 to 10 years. The expected term of options is based upon evaluations of historical and expected future exercise behavior. The risk-free interest rate is based on the U.S. Treasury rates at the date of grant with maturity dates approximately equal to the expected term at the grant date. Implied volatility is based on the mean reverting average of our stock’s historical volatility and that of an industry peer group. The use of mean reversion is supported by evidence of a correlation between stock price volatility and a company’s leverage combined with the effects mandatory principal payments will have on our capital structure, as defined under our new credit facility. Starting in 2010, we began declaring dividends and anticipate that we will continue to pay dividends in the future, at the discretion of the Board, dependent on a variety of factors, including available cash and the overall financial condition of the Company.
There is a risk that our estimates of the fair values of our share-based compensation awards on the grant dates may differ from the actual values realized upon the exercise, expiration, early termination or forfeiture of those share-based payments in the future. Certain share-based payments, such as employee stock options, may expire worthless or otherwise result in zero intrinsic value as compared to the fair values originally estimated on the grant date and reported in our financial statements. Alternatively, value may be realized from these instruments that are significantly in excess of the fair values originally estimated on the grant date and reported in our financial statements. Although the fair value of our share-based awards is determined in accordance with GAAP and the SEC’s Staff Accounting Bulletin No. 107 using an option-pricing model, the value calculated may not be indicative of the fair value observed in a willing buyer / willing seller market transaction.
47
| ITEM 7A. | QUANTITATIVE AND QUALITATIVE DISCLOSURES ABOUT MARKET RISK |
The following market risk discussion contains forward-looking statements. Actual results may differ materially from this discussion based upon general market conditions and changes in domestic and global financial markets, among other factors.
For fiscal years 2011 and 2012, our results of operations, financial position and cash flows were not materially affected by changes in the relative values of non-U.S. currencies to the U.S. dollar. We do not use derivative financial instruments to limit our foreign currency risk exposure since virtually all of our business is conducted in the United States. Our manufacturing operations sell bagels to a wholesaler and a distributor who take possession in the United States and sell outside of the United States. As the products are shipped FOB domestic dock, invoiced in U.S. dollars and paid in U.S. dollars, there are no international risks of loss or foreign exchange currency issues.
Our debt as of January 1, 2013 was composed of the Senior Credit Facility. For fixed rate debt, interest rate changes affect the fair market value of such debt but do not impact earnings or cash flows. Conversely, for variable rate debt, including borrowings under our Senior Credit Facility, interest rate changes generally do not affect the fair market value of such debt, but they do impact future earnings and cash flows, assuming other factors are held constant.
On March 3, 2011, we entered into two interest rate cap agreements, to cap our rate on $37.6 million of our debt. The effect of these interest rate caps is to cap the LIBOR portion of the interest rate on our Senior Credit Facility to 3.0%. Each agreement has a two-year term.
Assuming no change in the size or composition of debt as of January 1, 2013, and presuming that the utilization of our accumulated net operating losses would minimize the tax implications for the next several years, a 100 basis point increase in short-term effective interest rates would increase the annual interest expense on our Senior Credit Facility by approximately $1.4 million. Currently, the interest rates on our Senior Credit Facility are predominantly at LIBOR rates plus an applicable margin through short-term fixed rate financing. The estimated increase in interest expense incorporates the fixed interest financing into its assumptions.
On an annual basis, we purchase a substantial amount of agricultural products that are subject to fluctuations in price based upon market conditions. Our purchase arrangements may contain contractual features that limit the price paid by establishing certain price floors or caps. We do not use financial instruments to hedge commodity prices. We have utilized a third party advisor to manage our wheat purchases. In addition to wheat, we have established contracts and entered into commitments with our vendors for turkey, butter, cheese and coffee.
48
| ITEM 8. | FINANCIAL STATEMENTS AND SUPPLEMENTARY DATA |
49
REPORT OF INDEPENDENT REGISTERED PUBLIC ACCOUNTING FIRM
Board of Directors and Stockholders
Einstein Noah Restaurant Group, Inc.
We have audited the accompanying consolidated balance sheets of Einstein Noah Restaurant Group Inc. and subsidiaries (a Delaware corporation) (the “Company”) as of January 1, 2013 and January 3, 2012, and the related consolidated statements of income and comprehensive income, changes in stockholders’ equity, and cash flows for each of the three years in the period ended January 1, 2013. Our audits of the basic consolidated financial statements included the financial statement schedule listed in the index appearing under Item 8. These financial statements and financial statement schedule are the responsibility of the Company’s management. Our responsibility is to express an opinion on these financial statements and financial statement schedule based on our audits.
We conducted our audits in accordance with the standards of the Public Company Accounting Oversight Board (United States). Those standards require that we plan and perform the audit to obtain reasonable assurance about whether the financial statements are free of material misstatement. An audit includes examining, on a test basis, evidence supporting the amounts and disclosures in the financial statements. An audit also includes assessing the accounting principles used and significant estimates made by management, as well as evaluating the overall financial statement presentation. We believe that our audits provide a reasonable basis for our opinion.
In our opinion, the consolidated financial statements referred to above present fairly, in all material respects, the financial position of Einstein Noah Restaurant Group, Inc. and subsidiaries as of January 1, 2013 and January 3, 2012, and the results of their operations and their cash flows for each of the three years in the period ended January 1, 2013 in conformity with accounting principles generally accepted in the United States of America. Also in our opinion, the related financial statement schedule, when considered in relation to the basic consolidated financial statements taken as a whole, presents fairly, in all material respects, the information set forth therein.
We also have audited, in accordance with the standards of the Public Company Accounting Oversight Board (United States), the Company’s internal control over financial reporting as of January 1, 2013, based on criteria established inInternal Control—Integrated Framework issued by the Committee of Sponsoring Organizations of the Treadway Commission (COSO), and our report dated February 28, 2013 expressed an unqualified opinion.
/s/GRANT THORNTON LLP
Denver, Colorado
February 28, 2013
50
REPORT OF INDEPENDENT REGISTERED PUBLIC ACCOUNTING FIRM
Board of Directors and Stockholders
Einstein Noah Restaurant Group, Inc.
We have audited the internal control over financial reporting of Einstein Noah Restaurant Group, Inc. and subsidiaries, (a Delaware corporation) (the “Company”) as of January 1, 2013, based on criteria established in Internal Control—Integrated Framework issued by the Committee of Sponsoring Organizations of the Treadway Commission (COSO). The Company’s management is responsible for maintaining effective internal control over financial reporting and for its assessment of the effectiveness of internal control over financial reporting, included in the accompanyingManagement’s Annual Report on Internal Control Over Financial Reporting. Our responsibility is to express an opinion on the Company’s internal control over financial reporting based on our audit.
We conducted our audit in accordance with the standards of the Public Company Accounting Oversight Board (United States). Those standards require that we plan and perform the audit to obtain reasonable assurance about whether effective internal control over financial reporting was maintained in all material respects. Our audit included obtaining an understanding of internal control over financial reporting, assessing the risk that a material weakness exists, testing and evaluating the design and operating effectiveness of internal control based on the assessed risk, and performing such other procedures as we considered necessary in the circumstances. We believe that our audit provides a reasonable basis for our opinion.
A company’s internal control over financial reporting is a process designed to provide reasonable assurance regarding the reliability of financial reporting and the preparation of financial statements for external purposes in accordance with generally accepted accounting principles. A company’s internal control over financial reporting includes those policies and procedures that (1) pertain to the maintenance of records that, in reasonable detail, accurately and fairly reflect the transactions and dispositions of the assets of the company; (2) provide reasonable assurance that transactions are recorded as necessary to permit preparation of financial statements in accordance with generally accepted accounting principles, and that receipts and expenditures of the company are being made only in accordance with authorizations of management and directors of the company; and (3) provide reasonable assurance regarding prevention or timely detection of unauthorized acquisition, use, or disposition of the company’s assets that could have a material effect on the financial statements.
Because of its inherent limitations, internal control over financial reporting may not prevent or detect misstatements. Also, projections of any evaluation of effectiveness to future periods are subject to the risk that controls may become inadequate because of changes in conditions, or that the degree of compliance with the policies or procedures may deteriorate.
In our opinion, the Company maintained, in all material respects, effective internal control over financial reporting as of January 1, 2013, based on criteria established in Internal Control—Integrated Framework issued by COSO.
We also have audited, in accordance with the standards of the Public Company Accounting Oversight Board (United States), the consolidated financial statements of the Company as of and for the year ended January 1, 2013, and our report dated February 28, 2013 expressed an unqualified opinion on those financial statements.
/s/GRANT THORNTON LLP
Denver, Colorado
February 28, 2013
51
EINSTEIN NOAH RESTAURANT GROUP, INC.
CONSOLIDATED BALANCE SHEETS
(in thousands, except share information)
| | | | | | | | |
| | | January 3,
2012 | | | January 1,
2013 | |
ASSETS | | | | | | | | |
Current assets: | | | | | | | | |
Cash and cash equivalents | | $ | 8,652 | | | $ | 17,432 | |
Restricted cash | | | 889 | | | | 998 | |
Accounts receivable, net of $73 and $106 of allowances | | | 7,774 | | | | 9,024 | |
Inventories | | | 5,562 | | | | 5,382 | |
Current deferred income tax assets, net | | | 9,013 | | | | 8,190 | |
Prepaid expenses | | | 6,483 | | | | 7,059 | |
Other current assets | | | 526 | | | | 661 | |
| | | | | | | | |
Total current assets | | | 38,899 | | | | 48,746 | |
Property, plant and equipment, net | | | 59,017 | | | | 63,013 | |
Trademarks and other intangibles, net | | | 64,382 | | | | 64,260 | |
Goodwill | | | 9,562 | | | | 10,775 | |
Long-term deferred income tax assets, net | | | 29,803 | | | | 22,726 | |
Other assets | | | 3,069 | | | | 4,093 | |
| | | | | | | | |
Total assets | | $ | 204,732 | | | $ | 213,613 | |
| | | | | | | | |
LIABILITIES AND STOCKHOLDERS’ EQUITY | | | | | | | | |
Current liabilities: | | | | | | | | |
Accounts payable | | $ | 6,591 | | | $ | 10,243 | |
Accrued expenses and other current liabilities | | | 24,611 | | | | 28,104 | |
Current portion of long-term debt | | | 7,500 | | | | 5,000 | |
| | | | | | | | |
Total current liabilities | | | 38,702 | | | | 43,347 | |
Long-term debt | | | 66,700 | | | | 131,700 | |
Other liabilities | | | 11,517 | | | | 11,059 | |
Mandatorily redeemable, Series Z Preferred Stock, $.001 par value, $1,000 per share liquidation value; 57,000 shares authorized; 0 shares outstanding | | | — | | | | — | |
| | | | | | | | |
Total liabilities | | | 116,919 | | | | 186,106 | |
| | | | | | | | |
Commitments and contingencies (Note 17) | | | | | | | | |
Stockholders’ equity: | | | | | | | | |
Series A junior participating preferred stock, 700,000 shares authorized; no shares issued and outstanding | | | — | | | | — | |
Common stock, $.001 par value; 25,000,000 shares authorized; 16,830,831 and 17,077,472 shares issued and outstanding | | | 17 | | | | 17 | |
Additional paid-in capital | | | 273,736 | | | | 277,951 | |
Accumulated other comprehensive loss, net of income tax | | | (48 | ) | | | — | |
Accumulated deficit | | | (185,892 | ) | | | (250,461 | ) |
| | | | | | | | |
Total stockholders’ equity | | | 87,813 | | | | 27,507 | |
| | | | | | | | |
Total liabilities and stockholders’ equity | | $ | 204,732 | | | $ | 213,613 | |
| | | | | | | | |
The accompanying notes are an integral part of these consolidated financial statements.
52
EINSTEIN NOAH RESTAURANT GROUP, INC.
CONSOLIDATED STATEMENTS OF INCOME AND COMPREHENSIVE INCOME
(in thousands, except earnings per share and related share information)
| | | | | | | | | | | | |
| | | Fiscal year ended | |
| | | December 28,
2010 | | | January 3,
2012 | | | January 1,
2013 | |
Revenues: | | | | | | | | | | | | |
Company-owned restaurant sales | | $ | 372,191 | | | $ | 378,723 | | | $ | 384,783 | |
Manufacturing and commissary revenues | | | 30,405 | | | | 34,542 | | | | 31,037 | |
Franchise and license related revenues | | | 9,115 | | | | 10,330 | | | | 11,186 | |
| | | | | | | | | | | | |
Total revenues | | | 411,711 | | | | 423,595 | | | | 427,006 | |
Cost of sales (exclusive of depreciation and amortization shown separately below): | | | | | | | | | | | | |
Company-owned restaurant costs | | | | | | | | | | | | |
Cost of goods sold | | | 106,011 | | | | 112,002 | | | | 106,925 | |
Labor costs | | | 108,813 | | | | 110,467 | | | | 111,784 | |
Rent and related expenses | | | 39,691 | | | | 40,277 | | | | 41,993 | |
Other operating costs | | | 37,696 | | | | 39,092 | | | | 40,320 | |
Marketing costs | | | 9,794 | | | | 9,796 | | | | 11,380 | |
| | | | | | | | | | | | |
Total company-owned restaurant costs | | | 302,005 | | | | 311,634 | | | | 312,402 | |
Manufacturing and commissary costs | | | 25,566 | | | | 30,441 | | | | 24,236 | |
General and administrative expenses | | | 38,484 | | | | 36,774 | | | | 39,569 | |
Depreciation and amortization | | | 17,769 | | | | 19,259 | | | | 19,707 | |
Pre-opening expenses | | | 370 | | | | 265 | | | | 1,115 | |
Restructuring expenses | | | 477 | | | | 1,099 | | | | 480 | |
Strategic alternatives expense | | | — | | | | — | | | | 3,677 | |
Other operating (income) expenses, net | | | (531 | ) | | | (395 | ) | | | 1,592 | |
| | | | | | | | | | | | |
Total costs and expenses | | | 384,140 | | | | 399,077 | | | | 402,778 | |
Income from operations | | | 27,571 | | | | 24,518 | | | | 24,228 | |
Other expense: | | | | | | | | | | | | |
Interest expense, net | | | 5,135 | | | | 3,357 | | | | 3,384 | |
Adjustment for Series Z modification | | | 929 | | | | — | | | | — | |
Write-off of debt issuance costs upon redemption of term loan | | | 966 | | | | — | | | | — | |
| | | | | | | | | | | | |
Income before income taxes | | | 20,541 | | | | 21,161 | | | | 20,844 | |
Provision for income taxes | | | 9,918 | | | | 7,958 | | | | 8,103 | |
| | | | | | | | | | | | |
Net income | | $ | 10,623 | | | $ | 13,203 | | | $ | 12,741 | |
| | | | | | | | | | | | |
Unrealized gain on cash flow hedge, net of tax | | | 1,277 | | | | — | | | | — | |
Unrealized loss on interest rate caps, net of tax | | | — | | | | (48 | ) | | | (3 | ) |
Reclassification of losses included in net income, net of tax | | | — | | | | — | | | | 51 | |
| | | | | | | | | | | | |
Comprehensive income | | $ | 11,900 | | | $ | 13,155 | | | $ | 12,789 | |
| | | | | | | | | | | | |
Net income available to common stockholders per share – Basic | | $ | 0.68 | | | $ | 0.79 | | | $ | 0.75 | |
| | | | | | | | | | | | |
Net income available to common stockholders per share – Diluted | | $ | 0.67 | | | $ | 0.78 | | | $ | 0.74 | |
| | | | | | | | | | | | |
Cash dividend declared per common share | | $ | 0.125 | | | $ | 0.375 | | | $ | 4.500 | |
| | | | | | | | | | | | |
Weighted average number of common shares outstanding: | | | | | | | | | | | | |
Basic | | | 16,532,420 | | | | 16,629,098 | | | | 16,935,018 | |
| | | | | | | | | | | | |
Diluted | | | 16,804,726 | | | | 16,880,321 | | | | 17,217,180 | |
| | | | | | | | | | | | |
The accompanying notes are an integral part of these consolidated financial statements.
53
EINSTEIN NOAH RESTAURANT GROUP, INC.
CONSOLIDATED STATEMENT OF CHANGES IN STOCKHOLDERS’ EQUITY
(in thousands, except share information)
| | | | | | | | | | | | | | | | | | | | | | | | |
| | | Common Stock | | | Additional
Paid In
Capital | | | Accumulated
Other
Comprehensive
Loss | | | Accumulated
Deficit | | | Total | |
| | | Shares | | | Amount | | | | | |
Balance, December 29, 2009 | | | 16,461,123 | | | $ | 16 | | | $ | 266,928 | | | $ | (1,277 | ) | | $ | (201,344 | ) | | $ | 64,323 | |
Net income | | | — | | | | — | | | | — | | | | — | | | | 10,623 | | | | 10,623 | |
Common stock issued upon stock option exercise | | | 193,163 | | | | 1 | | | | 1,026 | | | | — | | | | — | | | | 1,027 | |
Common stock issued upon stock appreciation right exercise | | | 1,188 | | | | — | | | | — | | | | — | | | | — | | | | — | |
Stock based compensation expense | | | — | | | | — | | | | 1,532 | | | | — | | | | — | | | | 1,532 | |
Additional redemption on temporary equity | | | — | | | | — | | | | (387 | ) | | | — | | | | — | | | | (387 | ) |
Accretion of premium on Series Z Preferred Stock | | | — | | | | — | | | | 1,072 | | | | — | | | | — | | | | 1,072 | |
Dividend declared | | | — | | | | — | | | | — | | | | — | | | | (2,081 | ) | | | (2,081 | ) |
Net change in unrealized loss on derivative securities, net of income tax | | | — | | | | — | | | | — | | | | 1,277 | | | | — | | | | 1,277 | |
| | | | | | | | | | | | | | | | | | | | | | | | |
Balance, December 28, 2010 | | | 16,655,474 | | | $ | 17 | | | $ | 270,171 | | | $ | — | | | $ | (192,802 | ) | | $ | 77,386 | |
Net income | | | — | | | | — | | | | — | | | | — | | | | 13,203 | | | | 13,203 | |
Common stock issued upon stock option exercise | | | 170,503 | | | | — | | | | 1,253 | | | | — | | | | — | | | | 1,253 | |
Common stock issued upon stock appreciation right exercise | | | 4,854 | | | | — | | | | — | | | | — | | | | — | | | | — | |
Stock based compensation expense | | | — | | | | — | | | | 2,312 | | | | — | | | | — | | | | 2,312 | |
Unrealized loss on derivative securities, net of income tax | | | — | | | | — | | | | — | | | | (48 | ) | | | — | | | | (48 | ) |
Dividends declared | | | — | | | | — | | | | — | | | | — | | | | (6,293 | ) | | | (6,293 | ) |
| | | | | | | | | | | | | | | | | | | | | | | | |
Balance, January 3, 2012 | | | 16,830,831 | | | | 17 | | | | 273,736 | | | | (48 | ) | | | (185,892 | ) | | | 87,813 | |
Net income | | | — | | | | — | | | | — | | | | — | | | | 12,741 | | | | 12,741 | |
Common stock issued upon restricted stock awards | | | 31,004 | | | | — | | | | (58 | ) | | | — | | | | — | | | | (58 | ) |
Common stock issued upon stock option exercise | | | 209,083 | | | | — | | | | 1,852 | | | | — | | | | — | | | | 1,852 | |
Common stock issued upon stock appreciation right exercise | | | 6,554 | | | | — | | | | — | | | | — | | | | — | | | | — | |
Stock based compensation expense | | | — | | | | — | | | | 2,421 | | | | — | | | | — | | | | 2,421 | |
Unrealized loss on derivative securities, net of income tax | | | — | | | | — | | | | — | | | | (3 | ) | | | — | | | | (3 | ) |
Realized loss on derivative securities, net of income tax | | | — | | | | — | | | | — | | | | 51 | | | | — | | | | 51 | |
Dividends declared | | | — | | | | — | | | | — | | | | — | | | | (77,310 | ) | | | (77,310 | ) |
| | | | | | | | | | | | | | | | | | | | | | | | |
Balance, January 1, 2013 | | | 17,077,472 | | | $ | 17 | | | $ | 277,951 | | | $ | — | | | $ | (250,461 | ) | | $ | 27,507 | |
| | | | | | | | | | | | | | | | | | | | | | | | |
The accompanying notes are an integral part of these consolidated financial statements.
54
EINSTEIN NOAH RESTAURANT GROUP, INC.
CONSOLIDATED STATEMENTS OF CASH FLOWS
(in thousands)
| | | | | | | | | | | | |
| | | Fiscal year ended | |
| | | December 28,
2010 | | | January 3,
2012 | | | January 1,
2013 | |
OPERATING ACTIVITIES: | | | | | | | | | | | | |
Net income | | $ | 10,623 | | | $ | 13,203 | | | $ | 12,741 | |
Adjustments to reconcile net income to net cash provided by operating activities: | | | | | | | | | | | | |
Depreciation and amortization | | | 17,769 | | | | 19,259 | | | | 19,707 | |
Deferred income tax expense | | | 9,724 | | | | 6,918 | | | | 7,900 | |
Stock-based compensation expense | | | 1,532 | | | | 2,312 | | | | 2,421 | |
(Gain) loss on disposal of assets | | | (531 | ) | | | (820 | ) | | | 270 | |
Realized losses on interest rate caps, net of tax | | | — | | | | — | | | | 51 | |
Adjustment for Series Z modification | | | 929 | | | | — | | | | — | |
Provision for losses on accounts receivable | | | 167 | | | | 69 | | | | 78 | |
Amortization of debt issuance and debt discount costs | | | 530 | | | | 449 | | | | 459 | |
Write-off of debt issuance costs | | | 966 | | | | — | | | | — | |
Changes in operating assets and liabilities, net of acquisitions: | | | | | | | | | | | | |
Restricted cash | | | (201 | ) | | | (180 | ) | | | (109 | ) |
Accounts receivable | | | (212 | ) | | | (2,002 | ) | | | (1,328 | ) |
Accounts payable and accrued expenses | | | 3,008 | | | | 956 | | | | 7,151 | |
Other assets and liabilities | | | (535 | ) | | | (1,054 | ) | | | (830 | ) |
| | | | | | | | | | | | |
Net cash provided by operating activities | | | 43,769 | | | | 39,110 | | | | 48,511 | |
INVESTING ACTIVITIES: | | | | | | | | | | | | |
Purchase of property and equipment | | | (16,597 | ) | | | (18,242 | ) | | | (24,046 | ) |
Proceeds from the sale and disposal of property, plant and equipment | | | 860 | | | | 1,392 | | | | 359 | |
Acquisition of restaurant assets, net of cash acquired | | | — | | | | (6,835 | ) | | | (2,174 | ) |
| | | | | | | | | | | | |
Net cash used in investing activities | | | (15,737 | ) | | | (23,685 | ) | | | (25,861 | ) |
FINANCING ACTIVITIES: | | | | | | | | | | | | |
Proceeds from line of credit | | | 23,700 | | | | 2,000 | | | | 30,000 | |
Repayments on line of credit | | | (11,000 | ) | | | (8,000 | ) | | | — | |
Repayment of prior term loan | | | (79,787 | ) | | | — | | | | — | |
Term loan borrowings | | | 75,000 | | | | — | | | | 38,125 | |
Term loan repayments | | | — | | | | (7,500 | ) | | | (5,625 | ) |
Redemptions under mandatorily redeemable Series Z Preferred Stock | | | (32,194 | ) | | | — | | | | — | |
Additional redemption payments on Series Z Preferred Stock | | | (568 | ) | | | — | | | | — | |
Debt issuance costs | | | (2,315 | ) | | | — | | | | (1,562 | ) |
Dividends paid | | | — | | | | (6,273 | ) | | | (76,557 | ) |
Proceeds upon stock option exercises | | | 1,026 | | | | 1,253 | | | | 1,794 | |
Payments under capital lease obligations | | | (11 | ) | | | (21 | ) | | | (45 | ) |
| | | | | | | | | | | | |
Net cash used in financing activities | | | (26,149 | ) | | | (18,541 | ) | | | (13,870 | ) |
Net increase (decrease) in cash and cash equivalents | | | 1,883 | | | | (3,116 | ) | | | 8,780 | |
Cash and cash equivalents, beginning of period | | | 9,885 | | | | 11,768 | | | | 8,652 | |
| | | | | | | | | | | | |
Cash and cash equivalents, end of period | | $ | 11,768 | | | $ | 8,652 | | | $ | 17,432 | |
| | | | | | | | | | | | |
The accompanying notes are an integral part of these consolidated financial statements.
55
EINSTEIN NOAH RESTAURANT GROUP, INC. AND SUBSIDIARIES
Notes to Consolidated Financial Statements
| 1. | DESCRIPTION OF BUSINESS |
Einstein Noah Restaurant Group, Inc. and its wholly-owned subsidiaries (collectively, the “Company”) is the largest owner/operator, franchisor and licensor of bagel specialty restaurants in the United States. As of January 1, 2013, the Company owned, franchised or licensed various restaurant concepts under the brand names of Einstein Bros. Bagels (“Einstein Bros.”), Noah’s New York Bagels (“Noah’s”) and Manhattan Bagel Company (“Manhattan Bagel”). As of January 1, 2013, the Company had 816 restaurants in 39 states and the District of Columbia.
| 2. | SUMMARY OF SIGNIFICANT ACCOUNTING POLICIES |
Basis of Presentation and Principles of Consolidation
The consolidated financial statements of the Company have been prepared in conformity with accounting principles generally accepted in the United States of America (“GAAP”). All intercompany accounts and transactions have been eliminated in consolidation.
The Company operates three business segments: company-owned restaurant operations, manufacturing and commissary operations, and franchising and licensing operations. These reportable segments are supported by the Company’s corporate unit which facilitates all of the company-owned restaurant operations, the manufacturing facility, supports the franchisees and licensees, and handles general corporate governance. The company-owned restaurants segment includes brands that have similar investment criteria and economic and operating characteristics. The manufacturing segment produces and distributes bagel dough and other products to the restaurants, licensees, franchisees and other third parties. Intercompany sales to company-owned restaurants have been eliminated. The franchise and license segment earns royalties and other fees from the use of trademarks and operating systems developed for the Company’s brands.
Information regarding the revenues and costs of sales for each business segment has been reported in Note 19 for fiscal years 2010, 2011 and 2012.
Fiscal Year
The Company has a 52/53-week fiscal year ending on the Tuesday closest to December 31. Fiscal years 2010 and 2012 ended on December 28, 2010 and January 1, 2013, respectively, and each contained 52 weeks. Fiscal year 2011 ended on January 3, 2012 and contained 53 weeks.
Reclassifications
For fiscal 2010 and fiscal 2011, the Company reclassed company-owned restaurant pre-opening costs to a separate line item on the consolidated statements of income and comprehensive income. Consolidated and
56
EINSTEIN NOAH RESTAURANT GROUP, INC. AND SUBSIDIARIES
Notes to Consolidated Financial Statements
segment level revenues, income from operations and net income were not impacted. The following table summarizes the reclassifications that were made in each fiscal year:
| | | | | | | | | | | | |
| Fiscal 2010: | | As Previously
Reported | | | Reclassification | | | As
Adjusted | |
Cost of sales (exclusive of depreciation and amortization shown separately below): | | | | | | | | | | | | |
Company-owned restaurant costs | | | | | | | | | | | | |
Cost of goods sold | | | 106,035 | | | | (24 | ) | | | 106,011 | |
Labor costs | | | 109,005 | | | | (192 | ) | | | 108,813 | |
Rent and related expenses | | | 39,731 | | | | (40 | ) | | | 39,691 | |
Other operating costs | | | 37,732 | | | | (36 | ) | | | 37,696 | |
Marketing costs | | | 9,854 | | | | (60 | ) | | | 9,794 | |
| | | | | | | | | | | | |
Total company-owned restaurant costs | | | 302,357 | | | | (352 | ) | | | 302,005 | |
General and administrative expenses | | | 38,502 | | | | (18 | ) | | | 38,484 | |
Pre-opening expenses | | | — | | | | 370 | | | | 370 | |
| | | | | | | | | | | | |
| Fiscal 2011: | | As Previously
Reported | | | Reclassification | | | As
Adjusted | |
Cost of sales (exclusive of depreciation and amortization shown separately below): | | | | | | | | | | | | |
Company-owned restaurant costs | | | | | | | | | | | | |
Cost of goods sold | | | 112,018 | | | | (16 | ) | | | 112,002 | |
Labor costs | | | 110,595 | | | | (128 | ) | | | 110,467 | |
Rent and related expenses | | | 40,322 | | | | (45 | ) | | | 40,277 | |
Other operating costs | | | 39,116 | | | | (24 | ) | | | 39,092 | |
Marketing costs | | | 9,836 | | | | (40 | ) | | | 9,796 | |
| | | | | | | | | | | | |
Total company-owned restaurant costs | | | 311,887 | | | | (253 | ) | | | 311,634 | |
General and administrative expenses | | | 36,786 | | | | (12 | ) | | | 36,774 | |
Pre-opening expenses | | | — | | | | 265 | | | | 265 | |
Use of Estimates
The preparation of the consolidated financial statements in conformity with GAAP requires the Company to make estimates and assumptions for the reporting period and as of the reporting date. These estimates and assumptions affect the reported amounts of assets, liabilities, revenues and expenses, and the disclosure of contingencies. Actual results could differ from those estimates.
Fair Value Measurements
Fair value is defined as the price that would be received to sell an asset or paid to transfer a liability in an orderly transaction between market participants at the measurement date. GAAP requires fair value measurement to be classified and disclosed in one of the following three categories:
| | • | | Level 1: Unadjusted quoted prices in active markets that are accessible at the measurement date for identical, unrestricted assets or liabilities. |
| | • | | Level 2: Quoted prices in markets that are not active or inputs which are observable, either directly or indirectly, for substantially the full term of the asset or liability. |
| | • | | Level 3: Prices or valuation techniques that require inputs that are both significant to the fair value measurement and unobservable (i.e., supported by little or no market activity). |
57
EINSTEIN NOAH RESTAURANT GROUP, INC. AND SUBSIDIARIES
Notes to Consolidated Financial Statements
The Company’s financial instruments typically consist of cash equivalents, accounts receivable, accounts payable and debt. The fair values of accounts receivable and accounts payable approximate their carrying values, due to their short-term maturities. As of January 3, 2012 and January 1, 2013, total debt under the Company’s amended and restated credit facility was $74.2 million and $136.7 million, respectively, and had a fair value of $71.8 million and $136.7 million, respectively. The fair value of the Company’s debt was estimated based on current rates found in the market place for debt with the same remaining maturities.
Cash and Cash Equivalents
Cash and cash equivalents consist of cash on hand and highly liquid instruments with original maturities of three months or less when purchased. Amounts in-transit from credit card processors are also considered cash equivalents because they are both short-term and highly liquid in nature and are typically converted to cash within three days of the sales transaction.
Restricted Cash
The Company’s restricted cash consists of funds paid by franchisees that are earmarked as advertising fund contributions.
Accounts Receivable
The majority of the Company’s receivables are due from franchisees, licensees, distributors and trade customers. The Company determines an allowance for doubtful accounts by considering a number of factors, including the length of time trade accounts receivable are past due, previous loss and payment history, the customer’s current ability to pay its obligation to the Company and the condition of the general economy and the industry as a whole. The Company writes off accounts receivable when they become uncollectible, and payments subsequently received on such receivables are credited to the allowance for doubtful accounts.
Inventories
Inventories, which consist of food, beverage, paper supplies and bagel ingredients, are stated at the lower of cost or market. Cost is determined by the first-in, first-out method.
Property, Plant and Equipment
Property, plant and equipment and leasehold improvements are recorded at cost or, in the case of a business combination, at fair value. Depreciation is provided using the straight-line method over the estimated useful lives of the assets. Leasehold improvements are amortized using the straight-line method over the shorter of their useful lives or the non-cancelable lease term. In circumstances where failure to exercise a renewal option would result in the Company incurring an economic penalty, those option periods are included when determining the depreciation period. In either case, the Company’s policy requires consistency when calculating the depreciation period, in classifying the lease and in computing straight-line rent expense. Costs incurred to repair and maintain the Company’s facilities and equipment are expensed as incurred. The estimated useful lives used for financial statement purposes are:
| | |
Store and manufacturing equipment | | 5 years |
Furniture and fixtures | | 5 years |
Office and computer equipment | | 3 years |
Vehicles | | 5 years |
58
EINSTEIN NOAH RESTAURANT GROUP, INC. AND SUBSIDIARIES
Notes to Consolidated Financial Statements
The Company has determined that the economic useful life for leasehold improvements on new restaurants should be the shorter of 10 years or the life of the lease, which is typically 10 years. The Company also determined that the economic useful lives of our restaurant upgrades should be the shorter of 5 years or the life of the lease. However, as the Company approves restaurants to be upgraded, it simultaneously reviews the lease, and typically only upgrades those locations that have a renewal option and it is reasonably assured that the lease will be renewed.
Capitalization of Internal Development Costs
The Company capitalizes direct costs associated with the site acquisition and subsequent construction of a company-owned restaurant on that site, including direct internal payroll and payroll-related costs. The Company only capitalizes those site-specific costs incurred subsequent to the time that the site acquisition is considered probable. If the Company makes the determination that a site for which internal development costs have been capitalized will not be subsequently acquired or developed, any previously capitalized internal development costs will be written off to general and administrative expenses.
Impairment of Long-Lived Assets
Long-lived assets are reviewed for impairment whenever events or changes in circumstances indicate that the carrying value of long-lived assets may not be recoverable. For the purpose of reviewing restaurant assets for indicators of potential impairment, assets are grouped together at the market level. The Company manages its restaurants by market with significant common costs and promotional activities which are generally not clearly identifiable with an individual restaurant’s cash flows. Site specific indicators of impairment, if present, are also considered. Recoverability of restaurant assets is measured by a comparison of the carrying amount of an individual restaurant’s assets to the estimated identifiable undiscounted future cash flows expected to be generated by those restaurant assets. If the carrying amount of an individual restaurant’s assets exceeds its estimated identifiable undiscounted future cash flows, an impairment charge is recognized as the amount by which the carrying amount of the assets exceeds its fair value. Generally, a restaurant’s identifiable future cash flows are discounted to estimate its fair value.
The Company determined there were no impairments for fiscal years 2010, 2011 and 2012.
Goodwill, Trademarks and Other Intangibles
The Company’s goodwill represents the excess of the purchase price over the fair value of net identifiable assets acquired in various business combinations. The Company also has other intangibles that consist mainly of trademarks, trade secrets and patents.
The Company’s goodwill and other indefinite lived intangible assets are not subject to amortization, but are tested for impairment annually or whenever events or changes in circumstances indicate that the asset might be impaired. The Company follows a two-step approach for testing impairment, using nonrecurring Level 3 inputs. For goodwill, the fair value of each reporting unit is compared to its carrying value to determine whether an indication of impairment exists. If impairment is indicated, the fair value of the reporting unit’s goodwill is determined by allocating the unit’s fair value to its assets and liabilities (including any unrecognized intangible assets) as if the reporting unit had been acquired in a business combination. For indefinite lived intangibles, the fair value is compared to the carrying value. The amount of impairment for goodwill and other intangible assets is measured as the excess of its carrying amount over its fair value.
59
EINSTEIN NOAH RESTAURANT GROUP, INC. AND SUBSIDIARIES
Notes to Consolidated Financial Statements
As of December 28, 2010, January 3, 2012 and January 1, 2013, the Company performed impairment analyses of its goodwill and indefinite lived intangible assets. Based on the Company’s testing, there was no indication of impairment to these assets for these fiscal years.
Business Combinations
In accordance with accounting guidance for business combinations, the Company allocates the purchase price of an acquired business to its net identifiable assets and liabilities based on estimated fair values. The excess of the purchase price over the amount allocated to the assets and liabilities, if any, is recorded as goodwill. The Company uses all available information to estimate fair values including the fair value determination of identifiable intangible assets such as franchise rights, and any other significant assets or liabilities. In making these determinations, the Company may use the assistance of an independent third party valuation group.
Debt Issuance Costs
Debt issuance costs incurred in connection with the issuance of long-term debt are capitalized and amortized to interest expense based on the related debt agreement using the straight-line method, which approximates the effective interest method.
Self-Insurance Reserves
The Company uses a combination of insurance and self-insurance mechanisms to provide for the potential liabilities for workers’ compensation, general liability and healthcare benefits. The Company maintains coverage with third party insurers which limit the total exposure from medical, workers’ compensation and general liability claims. The self-insurance medical liability, insured workers’ compensation and general liability represent an estimate of the ultimate cost of claims incurred and unpaid as of the balance sheet date. The estimated liabilities are established based upon the Company’s analysis of historical data to ensure that the recorded liability is appropriate. The Company’s financial statements could be impacted if actual claims differ from these estimates. The estimated workers’ compensation liability is established based on actuarial estimates, is discounted at 10% based upon a discrete analysis of actual claims and historical data and is reviewed on a quarterly basis to ensure that the liability is appropriate. These estimated liabilities are included in accrued expenses in the accompanying consolidated balance sheets.
Income Taxes
The Company computes income taxes using the asset and liability method. Under this method, deferred income taxes are recognized for differences between the basis of assets and liabilities for financial statement and income statement purposes, using the enacted statutory rate in effect for the year these differences are expected to be taxable or refunded. Deferred income tax expenses or credits are based on the changes in the asset or liability, respectively, from period to period. A deferred tax asset or liability is recognized whenever there are future tax effects from existing temporary differences and operating loss and tax credit carry forwards. If the Company determines that a deferred tax asset could be realized in a greater or lesser amount than recorded, the asset’s recorded amount is adjusted and the income statement is either credited or charged, respectively, in the period during which the determination is made.
The Company reduces its deferred tax assets by a valuation allowance if it determines that it is more likely than not that some portion or all of these tax assets will not be realized. In making this determination, the Company considers various qualitative and quantitative factors, such as:
| | • | | the level of historical taxable income; |
60
EINSTEIN NOAH RESTAURANT GROUP, INC. AND SUBSIDIARIES
Notes to Consolidated Financial Statements
| | • | | the projection of future taxable income over periods in which the deferred tax assets would be deductible; |
| | • | | events within the restaurant industry; |
| | • | | the cyclical nature of the Company’s business; |
| | • | | the health of the economy; and |
As of January 3, 2012, the Company established a valuation allowance of approximately $4.8 million on its deferred tax assets. This valuation allowance was applied against net operating losses (“NOLs”) that will expire prior to their utilization. During fiscal 2012, the Company eliminated these NOLs and accordingly eliminated the related valuation allowance.
The Company recognizes the tax benefit from an uncertain tax position when it determines that it is more-likely-than-not that the position would be sustained upon examination by taxing authorities. The amount recognized is measured as the largest amount of benefit that has a greater than 50% likelihood of being realized upon ultimate settlement. If the Company derecognizes an uncertain tax position, the Company’s policy is to record any applicable interest and penalties within the provision for income tax.
Revenue Recognition
Company-owned restaurant sales –The Company records revenue from the sale of food, beverage and retail items as products are sold. Sales tax amounts collected from customers that are remitted to governmental authorities are excluded from net revenue.
Manufacturing and commissary revenues –Manufacturing and commissary revenues are recorded at the time of shipment to customers. The Company produces bagels for sale to third party resellers, including sales to a wholesaler and a distributor who take possession in the United States and sells outside of the United States. As the product is shipped FOB domestic dock, invoiced in U.S. dollars and paid in U.S. dollars, the Company is not exposed to international risks of loss or foreign exchange currency issues. Shipping charges billed to third parties are recognized as revenue, and the related shipping costs are included in manufacturing and commissary costs. Approximately $5.3 million, $7.1 million and $8.8 million of sales shipped internationally are included in manufacturing and commissary revenues for fiscal years 2010, 2011 and 2012, respectively.
Franchise and license related revenues –Initial fees received from a franchisee or licensee to establish a new location are recognized as income when the Company has performed its obligations required to assist the franchisee or licensee in opening a new location, which is generally at the time the franchisee or licensee commences operations. Continuing royalties are calculated as a percentage of the net sales of the Company’s franchised and licensed locations. Franchise and license related revenues for fiscal years 2010, 2011 and 2012 include the following:
| | | | | | | | | | | | |
| | | Fiscal year ended | |
| | | December 28,
2010 | | | January 3,
2012 | | | January 1,
2013 | |
| | | | | | (in thousands) | | | | |
Royalties | | $ | 8,131 | | | $ | 9,457 | | | $ | 10,453 | |
Fees | | | 984 | | | | 873 | | | | 734 | |
| | | | | | | | | | | | |
Total | | $ | 9,115 | | | $ | 10,330 | | | $ | 11,186 | |
| | | | | | | | | | | | |
61
EINSTEIN NOAH RESTAURANT GROUP, INC. AND SUBSIDIARIES
Notes to Consolidated Financial Statements
Deferred franchise and license revenue, which is included in other liabilities on the consolidated balance sheet, are summarized as follows:
| | | | | | | | |
| | | January 3,
2012 | | | January 1,
2013 | |
| | | (in thousands) | |
Deferred franchise and license revenue—current | | | 386 | | | | 495 | |
Deferred franchise and license revenue—long-term | | | 663 | | | | 563 | |
| | | | | | | | |
Deferred franchise and license revenue | | $ | 1,049 | | | $ | 1,058 | |
| | | | | | | | |
Gift Cards –Proceeds from the sale of gift cards are recorded as deferred revenue within accrued expenses, and recognized as income when redeemed by the holder. There are no expiration dates on the Company’s gift cards and the Company does not charge any service fees that would result in a decrease to a customer’s available balance.
While the Company will continue to honor all gift cards presented for payment, it may determine the likelihood of redemption to be remote for certain gift card balances due to, among other things, long periods of inactivity. In these circumstances, to the extent the Company determines there is no requirement for remitting balances to government agencies under unclaimed property laws, outstanding gift card balances may then be recognized as breakage in the consolidated statements of income and comprehensive income as a component of company-owned restaurant sales.
Income from gift card breakage was $0.2 million, $0.2 million and $0.9 million for fiscal years ended 2010, 2011 and 2012, respectively. For fiscal year 2010, the Company also recognized $0.4 million in revenue related to gift certificate breakage from a gift certificate program that no longer existed. While these gift certificates will continue to be honored, the Company has determined the likelihood to be remote for redemption of these gift certificates due to their age and the fact that the program is no longer in place.
Pre-opening Costs
Pre-opening costs, including rent, wages, food, marketing and other restaurant operating costs, are expensed as incurred prior to a restaurant opening for business.
Advertising Costs
The Company expenses advertising costs as incurred except for expenses related to the development and production of a major commercial or media campaign which are expensed during the period in which the advertisement is first presented by the media. Advertising costs were $9.9 million, $9.9 million and $11.4 million for fiscal years 2010, 2011 and 2012, respectively, and are included in company-owned restaurant costs in the consolidated statements of income and comprehensive income. The Company had $0.6 million and $0.8 million of prepaid advertising expenses as of January 3, 2012 and January 1, 2013, respectively, which are included as a component of prepaid expenses on the consolidated balance sheet.
Leases and Deferred Rent
The Company leases all of its restaurant properties under operating leases. The Company also has equipment leases that qualify as either an operating lease or capital lease.
62
EINSTEIN NOAH RESTAURANT GROUP, INC. AND SUBSIDIARIES
Notes to Consolidated Financial Statements
For a lease that contains rent escalations, the Company records the total rent payable during the lease term on a straight-line basis over the term of the lease and records the difference between rent paid and the straight-line rent expense as deferred rent payable. Incentive payments received from landlords are recorded as an increase to deferred rent payable and are amortized on a straight-line basis over the lease term as a reduction of rent. As of January 3, 2012 and January 1, 2013, the Company had $5.7 million and $6.2 million, respectively, of deferred rent payable, net of landlord incentives, recorded as a component of other liabilities on the consolidated balance sheet.
Net Income per Common Share
The Company computes basic net income per common share by dividing the net income available to common stockholders for the period by the weighted-average number of shares of common stock outstanding during the period.
Diluted net income per share is computed by dividing the net income available to common stockholders for the period by the weighted-average number of shares of common stock and potential common stock equivalents outstanding during the period using the treasury stock method. Potential common stock equivalents include incremental shares of common stock issuable upon the exercise of stock options and warrants. Potential common stock equivalents are excluded from the computation of diluted net income per share when their effect is anti-dilutive.
The following table summarizes the weighted-average number of common shares outstanding, as well as sets forth the computation of basic and diluted net income per common share for the periods:
| | | | | | | | | | | | |
| | | Fiscal year ended | |
| | | December 28, | | | January 3, | | | January 1, | |
| | | 2010 | | | 2012 | | | 2013 | |
| | | (in thousands, except earnings per share and related
share information) | |
Net income | | $ | 10,623 | | | $ | 13,203 | | | $ | 12,741 | |
Less: Additional redemption on temporary equity | | | (387 | ) | | | — | | | | — | |
Add: Accretion of premium on Series Z preferred stock | | | 1,072 | | | | — | | | | — | |
| | | | | | | | | | | | |
Net income available to common stockholders (a) | | $ | 11,308 | | | $ | 13,203 | | | $ | 12,741 | |
| | | | | | | | | | | | |
Basic weighted average shares outstanding (b) | | | 16,532,420 | | | | 16,629,098 | | | | 16,935,018 | |
Dilutive effect of stock options, SARs and RSUs | | | 272,306 | | | | 251,223 | | | | 282,162 | |
| | | | | | | | | | | | |
Diluted weighted average shares outstanding (c) | | | 16,804,726 | | | | 16,880,321 | | | | 17,217,180 | |
| | | | | | | | | | | | |
Net income available to common stockholders per share—Basic (a)/(b) | | $ | 0.68 | | | $ | 0.79 | | | $ | 0.75 | |
| | | | | | | | | | | | |
Net income available to common stockholders per share—Diluted (a)/(c) | | $ | 0.67 | | | $ | 0.78 | | | $ | 0.74 | |
| | | | | | | | | | | | |
Anti-dilutive stock options, SARs and RSUs | | | 236,275 | | | | 405,374 | | | | 622,731 | |
| | | | | | | | | | | | |
Stock-Based Compensation
The Company maintains several equity incentive plans under which it may grant non-qualified stock options, incentive stock options, stock appreciation rights (“SARs”), restricted stock units (“RSUs”) or restricted stock to employees, non-employee directors and consultants. Restricted stock and RSUs are valued using the
63
EINSTEIN NOAH RESTAURANT GROUP, INC. AND SUBSIDIARIES
Notes to Consolidated Financial Statements
closing stock price on the date of grant. The fair value of an option award or SAR is determined using the Black-Scholes option pricing model, which incorporates ranges of assumptions for inputs. The Company’s assumptions are as follows:
| | • | | Expected Term—The expected term of options is based upon evaluations of historical and expected future exercise behavior. |
| | • | | Risk Free Interest Rate—The risk-free interest rate is based on the U.S. Treasury rates at the date of grant with maturity dates approximately equal to the expected term at the grant date. |
| | • | | Implied Volatility—Implied volatility is based on the mean reverting average of the Company’s historical stock volatility and that of an industry peer group. The Company believes that the use of mean reversion is supported by evidence of a correlation between stock price volatility and a company’s leverage, combined with the effects that mandatory principal payments will have on the Company’s capital structure, as defined under its debt facility. |
| | • | | Dividend Yield—The Company declared dividends in fiscal 2010, fiscal 2011 and fiscal 2012, and anticipates that it will continue to pay dividends in the future, at the discretion of its Board of Directors (the “Board”). The payment of dividends is dependent on a variety of factors, including available cash and the overall financial condition of the Company. |
Vesting of awards can either be based on the passage of time or on the achievement of performance goals. For awards that vest on the passage of time, compensation cost is recognized using a graded vesting attribution method over the vesting period. For performance based awards, the Company will recognize compensation costs over the requisite service period when conditions for achievement become probable. The Company also estimates forfeitures at the time of grant and revises those estimates in subsequent periods if actual forfeitures differ or are expected to differ.
Concentrations of Risk
The Company maintains cash and cash equivalent balances with financial institutions that exceed federally insured limits. The Company has not experienced any losses related to these balances and management believes its credit risk to be minimal.
The Company purchases its raw materials from various suppliers; and in some cases, it has selected a single supplier for a key product to take advantage of economies of scale. The Company has elected to purchase all of its cream cheese from a single supplier. Also, the Company purchases a majority of its frozen bagel dough from one supplier, who uses the Company’s proprietary processes and on whom the Company is dependent in the short-term. All of the Company’s remaining frozen bagel dough is produced at its dough manufacturing facility in Whittier, California or by a second supplier. Although to date the Company has not experienced significant difficulties with its suppliers, its choice to purchase most of its key ingredients from respective suppliers subjects the Company to a number of risks, including possible delays or interruption in supplies, diminished control over quality and a potential lack of adequate raw material capacity. A significant disruption in the supply or degradation in the quality of the materials provided by the suppliers could have a material adverse effect on the Company’s business, operating results and financial condition until it selects another supplier.
Recent Accounting Pronouncements
In May 2011, the Financial Accounting Standards Board (“FASB”) issued guidance amending the fair value measurement and disclosure requirements. The guidance requires the disclosure of quantitative information about unobservable inputs, a description of the valuation processes used, and a qualitative discussion around the sensitivity of the measurements. The guidance became effective for the Company at the beginning of the first quarter of fiscal 2012. The adoption of this guidance did not have a material impact on the Company’s consolidated financial position, results of operations or cash flows.
64
EINSTEIN NOAH RESTAURANT GROUP, INC. AND SUBSIDIARIES
Notes to Consolidated Financial Statements
In September 2011, the FASB issued guidance that simplifies how entities test goodwill for impairment and permits an entity to first assess qualitative factors to determine whether it is more likely than not that the fair value of a reporting unit is less than its carrying amount as a basis for determining whether it is necessary to perform the two-step goodwill impairment test. The guidance became effective for the Company at the beginning of the first quarter of fiscal 2012. The adoption of this guidance did not have a material impact on the Company’s consolidated financial position, results of operations or cash flows.
In July 2012, the FASB issued guidance that simplifies how entities test indefinite-lived intangible assets and permits an entity to first assess qualitative factors to determine whether it is more likely than not that the fair value of an intangible asset is less than its carrying amount as a basis for determining whether it is necessary to perform the currently required quantitative fair value assessment. The guidance will become effective for the Company at the beginning of the first quarter of 2013, with early adoption permitted. The adoption of this guidance is not expected to have a material impact on the Company’s consolidated financial position, results of operations or cash flows.
The Company acquired nine restaurants during the fiscal year ended January 3, 2012 and eight restaurants during the fiscal year ended January 1, 2013.
The following table summarizes the estimated fair values of the Company’s acquisitions during the fiscal years ended January 3, 2012 and January 1, 2013:
| | | | | | | | |
| | | Fiscal year ended | |
| | | January 3,
2012 | | | January 1,
2013 | |
| | | (in thousands) | |
Cash and cash equivalents | | $ | 6 | | | $ | 7 | |
Inventories | | | 99 | | | | 68 | |
Other current assets | | | 22 | | | | 6 | |
Property, plant and equipment | | | 2,185 | | | | 575 | |
Trademarks and other intangibles | | | 576 | | | | — | |
Goodwill | | | 4,581 | | | | 1,096 | |
Accrued expense and other current liabilities | | | (199 | ) | | | — | |
| | | | | | | | |
Total purchase price | | $ | 7,270 | | | $ | 1,752 | |
Amounts withheld | | | (429 | ) | | | (94 | ) |
| | | | | | | | |
Net cash paid at closing | | $ | 6,841 | | | $ | 1,658 | |
Payments of amounts withheld from current and prior acquisitions | | | — | | | | 523 | |
| | | | | | | | |
Cash paid towards acquisitions | | $ | 6,841 | | | $ | 2,181 | |
| | | | | | | | |
The restaurants acquired in fiscal 2012 contributed $3.5 million in net operating revenue for the fiscal year ended January 1, 2013. Pro forma results of operations have not been presented, as the impact on the consolidated financial results would have not have been material. The goodwill of $4.6 million and $1.1 million for fiscal 2011 and fiscal 2012, respectively, arising from these acquisitions consists largely of the synergies and economies of scale expected from combining the acquired operations with the Company. All of the goodwill recognized is expected to be deductible for income tax purposes.
65
EINSTEIN NOAH RESTAURANT GROUP, INC. AND SUBSIDIARIES
Notes to Consolidated Financial Statements
The Company withholds certain amounts at the closing of each transaction for specified periods of time. The amounts withheld are applied to any invoices that relate to the seller after the closing date of the transaction. The Company will then pay the difference to the seller at an agreed upon date. As of January 3, 2012, the Company had $0.4 million recorded as a component of accrued expenses and other current liabilities on the accompanying consolidated balance sheet. There were no remaining amounts as of January 1, 2013.
The Company treats acquisition related costs as expenses in the periods in which they are incurred. The Company recorded $0.3 million and $0.1 million in acquisition costs related to acquisitions for the fiscal years ended January 3, 2012 and January 1, 2013, respectively. These amounts are included in other operating (income) expenses, net on the accompanying consolidated statement of income and comprehensive income.
During the second quarter of 2012, the Company adjusted its assignment of a prior year acquisition for changes to its original estimates of the fair value of capital assets that were acquired. These changes are the result of additional information obtained since the filing of the Company’s Form 10-K for the fiscal year ended January 3, 2012. The adjustment to property, plant and equipment of $0.1 million did not result in a material change to previously reported amounts. Goodwill increased by $0.1 million as a result of the decrease in the fair value of the property, plant and equipment.
Inventories consist of the following as of:
| | | | | | | | |
| | | January 3,
2012 | | | January 1,
2013 | |
| | | (in thousands) | |
Finished goods | | $ | 4,489 | | | $ | 4,427 | |
Raw materials | | | 1,073 | | | | 955 | |
| | | | | | | | |
Total inventories | | $ | 5,562 | | | $ | 5,382 | |
| | | | | | | | |
| 5. | PROPERTY, PLANT AND EQUIPMENT |
Property, plant and equipment consist of the following as of:
| | | | | | | | |
| | | January 3,
2012 | | | January 1,
2013 | |
| | | (in thousands) | |
Leasehold improvements | | $ | 108,833 | | | $ | 121,001 | |
Store and manufacturing equipment | | | 94,984 | | | | 94,389 | |
Furniture and fixtures | | | 1,356 | | | | 1,097 | |
Office and computer equipment | | | 24,609 | | | | 35,983 | |
Vehicles | | | 41 | | | | 4 | |
| | | | | | | | |
Property, plant and equipment | | | 229,823 | | | | 252,474 | |
Less accumulated depreciation | | | 170,806 | | | | 189,461 | |
| | | | | | | | |
Property, plant and equipment, net | | $ | 59,017 | | | $ | 63,013 | |
| | | | | | | | |
Depreciation expense was $17.8 million, $19.2 million and $19.6 million for the fiscal years ended 2010, 2011 and 2012, respectively. The Company does not allocate depreciation expense to cost of sales.
66
EINSTEIN NOAH RESTAURANT GROUP, INC. AND SUBSIDIARIES
Notes to Consolidated Financial Statements
| 6. | GOODWILL, TRADEMARKS AND OTHER INTANGIBLES |
The Company’s goodwill was $9.6 million and $10.8 million for the fiscal years ended January 3, 2012 and January 1, 2013, respectively. $6.1 million of the goodwill is attributable to the Company’s acquisitions of Manhattan Bagel restaurants in 1998 and 2012 (see Note 3) and is assigned to the Company’s Manhattan Bagel reporting unit. The remaining $4.7 million of goodwill relates to the Company’s acquisitions in fiscal 2011 (see Note 3) and is assigned to the Company’s Einstein Bros. reporting unit.
The Company’s trademarks, which are non-amortizing intangibles, were $63.8 million for both fiscal years 2011 and 2012.
The Company’s amortizing intangible assets consist of the following as of:
| | | | | | | | | | | | | | | | |
| | | January 3, 2012 | |
| | | Weighted
Average Life
Remaining (yrs) | | | Gross (1) | | | Accumulated
Amortization (1) | | | Net | |
| | | (dollars in thousands) | |
Tradename | | | 0.42 | | | $ | 38 | | | $ | (6 | ) | | $ | 32 | |
Reacquired rights | | | 7.68 | | | | 377 | | | | (17 | ) | | | 360 | |
Noncompete agreements | | | 2.92 | | | | 76 | | | | (2 | ) | | | 74 | |
Favorable leases | | | 5.18 | | | | 85 | | | | — | | | | 85 | |
| | | | | | | | | | | | | | | | |
| | | 6.24 | | | $ | 576 | | | $ | (25 | ) | | $ | 551 | |
| | | | | | | | | | | | | | | | |
| | | | | | | | | | | | | | | | |
| | | January 1, 2013 | |
| | | Weighted
Average Life
Remaining (yrs) | | | Gross (1) | | | Accumulated
Amortization (1) | | | Net | |
| | | (dollars in thousands) | |
Tradename | | | — | | | $ | 38 | | | $ | (38 | ) | | $ | — | |
Reacquired rights | | | 6.68 | | | | 377 | | | | (63 | ) | | | 314 | |
Noncompete agreements | | | 1.92 | | | | 76 | | | | (28 | ) | | | 48 | |
Favorable leases | | | 4.18 | | | | 85 | | | | (18 | ) | | | 67 | |
| | | | | | | | | | | | | | | | |
| | | 5.26 | | | $ | 576 | | | $ | (147 | ) | | $ | 429 | |
| | | | | | | | | | | | | | | | |
| (1) | Excludes the original cost and accumulated amortization of fully-amortized intangibles |
The Company estimates that the amortization of these intangibles will approximate $0.1 million per year over the next five years.
| 7. | ACCRUED EXPENSES AND OTHER CURRENT LIABILITIES |
Accrued expenses and other current liabilities consist of the following as of:
| | | | | | | | |
| | | January 3, | | | January 1, | |
| | | 2012 | | | 2013 | |
| | | (in thousands) | |
Payroll and labor related expense | | $ | 12,431 | | | $ | 15,169 | |
Sales, use and property tax expense | | | 2,877 | | | | 2,324 | |
Dividends payable | | | 2,100 | | | | 2,852 | |
Deferred gift card revenue | | | 3,165 | | | | 2,749 | |
Accrued expenses and other current liabilities | | | 4,038 | | | | 5,010 | |
| | | | | | | | |
Total accrued expenses and other current liabilities | | $ | 24,611 | | | $ | 28,104 | |
| | | | | | | | |
67
EINSTEIN NOAH RESTAURANT GROUP, INC. AND SUBSIDIARIES
Notes to Consolidated Financial Statements
On December 20, 2010, the Company entered into a senior credit facility with Bank of America and a syndicate of institutional lenders, which was amended and restated on December 6, 2012 (the “Senior Credit Facility”).
The Senior Credit Facility has a commitment of up to $175.0 million, including a term loan of up to $100.0 million (the “Term Loan”) and a revolving credit facility of up to $75.0 million (the “Revolving Facility”). Borrowings under the Senior Credit Facility bear interest at a rate equal to an applicable margin plus, at the Company’s option, either a variable base rate or a Eurodollar rate (which is calculated based off of London InterBank Offered Rates (“LIBOR”)). The applicable margin for Eurodollar rate loans ranges from 2.5% to 4.0% and for base rate loans ranges from 1.5% to 3.0%, depending on the level of the Company’s consolidated leverage ratio (as defined in the Senior Credit Facility). Upon the occurrence of a payment event of default which is continuing, all amounts due under the Senior Credit Facility will bear interest at 2.0% above the interest rate otherwise applicable.
The Senior Credit Facility matures on December 6, 2017 (the “Maturity Date”). Commencing March 31, 2013, quarterly payments on the term loan, ranging in value between $1.25 million and $2.50 million over the term of the Senior Credit Facility, are due on the last day of each calendar quarter, with any remaining amounts due and payable upon maturity. The Term Loan also requires mandatory prepayments of:
| | • | | 100% of net cash proceeds of asset sales and insurance and condemnation proceeds above a threshold and subject to the ability to reinvest under certain circumstances; and |
| | • | | 100% of net cash proceeds of any debt issued by the Company, subject to certain exceptions. |
The Senior Credit Facility contains a number of negative covenants that will limit the Company from taking certain actions. The Company is also required to maintain:
| | • | | a minimum consolidated fixed charge coverage ratio ranging from 1.30x to 1.35x; and |
| | • | | a maximum consolidated leverage ratio ranging from 2.75x to 3.50x. |
The Senior Credit Facility limits annual capital expenditures to $32.0 million, but allows, subject to certain conditions, for a percentage of any unused portion of the capital expenditure limit to be carried forward into the following year.
The Senior Credit Facility contains customary events of default. In addition, the Senior Credit Facility provides for (i) an incremental term loan (the “Incremental Term Loan”) and (ii) an increase in the Revolving Facility (the “Revolving Facility Increase” and together with the Incremental Term Loan, the “Incremental Facilities”) of up to $50 million to be used by the Company, if needed, solely for the purpose of making acquisitions permitted under the Senior Credit Facility. If the Company chooses to draw down the Incremental Facilities, the outstanding amount of the Incremental Facilities must be repaid in equal quarterly installments on the last day of each calendar quarter, with any remaining amounts due and payable on the Maturity Date. Borrowings under the Incremental Facilities, if any, will bear interest at the same rate schedule as other borrowings under the Senior Credit Facility. Availability of the Incremental Facilities is subject to customary borrowing conditions, including absence of any default or material adverse change, and to a requirement of advanced successful syndication of the Incremental Facilities.
As of January 1, 2013, the Company had $6.7 million in letters of credit outstanding on its Senior Credit Facility. The letters of credit expire on various dates during 2013, are generally automatically renewable for one additional year and are payable upon demand in the event that the Company fails to pay the underlying
68
obligation. Letters of credit reduce the Company’s availability under its Revolving Facility. The Company’s availability under its Revolving Facility was $31.6 million as of January 1, 2013.
The Company may make dividends and repurchases of its common stock using excess cash flow (as defined in the Senior Credit Facility).
The Company may prepay amounts outstanding under the Senior Credit Facility and may terminate commitments in whole at any time without penalty or premium upon prior written notice.
On December 20, 2010, as a condition to the effectiveness of the Senior Credit Facility, the Company entered into a guaranty and security agreement with Bank of America (the “Guaranty”). The Guaranty is secured by a first priority security interest in all the assets of the Company, including a pledge of 100% of the Company’s interest in all shares of capital stock (or other ownership or equity interests) of each material subsidiary.
The weighted-average interest rate under the Senior Credit Facility, excluding the amortization of debt issuance costs and other fees, was 3.1% and 3.4% for fiscal 2011 and fiscal 2012, respectively. The weighted-average interest rate under the Senior Credit Facility, excluding the amortization of debt issuance costs and other fees, was 4.3% on January 1, 2013. Excluding the amortization of debt issuance costs and other fees, the Company incurred $2.5 million and $2.5 million of interest expense in fiscal 2011 and 2012, respectively. As of January 1, 2013, the Company was in compliance with all financial and operating covenants.
The Company’s obligations on its Senior Credit Facility are as follows:
| | | | |
Fiscal year (in thousands) | | | |
2013 | | $ | 5,000 | |
2014 | | | 3,750 | |
2015 | | | 6,875 | |
2016 | | | 11,875 | |
2017 | | | 109,200 | |
| | | | |
| | $ | 136,700 | |
| | | | |
Debt Issuance Costs
Debt issuance costs, which are reported as a component of other current assets and other assets, are summarized as follows:
| | | | | | | | |
| | | January 3, | | | January 1, | |
| | | 2012 | | | 2013 | |
| | | (in thousands) | |
Debt issuance costs-current | | $ | 447 | | | $ | 570 | |
Debt issuance costs-long-term | | | 1,384 | | | | 2,370 | |
| | | | | | | | |
Total | | $ | 1,831 | | | $ | 2,940 | |
| | | | | | | | |
In connection with amending and restating the Senior Credit Facility on December 6, 2012, the Company capitalized an additional $1.6 million of debt issuance costs. Amortization expense relating to debt issuance costs was $0.5 million, $0.4 million and $0.5 million for the fiscal years 2010, 2011 and 2012, respectively, and is included in interest expense in the accompanying consolidated statements of income and comprehensive income. In fiscal 2010, the Company recorded a charge of approximately $1.0 million in unamortized debt issuance costs in connection with the termination of its prior credit facility.
69
EINSTEIN NOAH RESTAURANT GROUP, INC. AND SUBSIDIARIES
Notes to Consolidated Financial Statements
On March 3, 2011, the Company entered into two interest rate cap agreements relating to the Senior Credit Facility. Each agreement has a two year term. The Company entered into the interest rate caps for a cap rate of 3.0% calculated on an initial notional amount of $18.75 million on each cap for a total notional amount of $37.5 million based on the 3-month LIBOR. The effect of the interest rate caps is to cap the LIBOR portion of the interest rate at 3.0%. The Company has determined that these agreements qualify as cash flow hedges. For fiscal 2012, unrealized losses of approximately $51 thousand, net of taxes, were realized as interest expense on the Company’s consolidated statements of income and comprehensive income.
| 10. | MANDATORILY REDEEMABLE SERIES Z PREFERRED STOCK |
In September 2003, the Company completed an equity recapitalization with its preferred stockholders, who held a substantial portion of the Company’s common stock. Among other things, the Halpern Denny Fund III, L.P. interest in the Company’s Mandatorily Redeemable Series F Preferred Stock was converted into 57,000 shares of Series Z Mandatorily Redeemable Preferred Stock (“Series Z”).
The Series Z was recorded in the accompanying consolidated balance sheets at its full face value of $32.2 million as of December 29, 2009 which represented the total cash payable upon redemption. In a series of transactions throughout fiscal 2010, the Company redeemed $32.2 million of Series Z shares and accrued additional redemption amount of approximately $2.6 million. There were no shares of Series Z outstanding as of the end of fiscal 2010, nor have there been any other Series Z transactions since that time.
Common Stock
The Company intends to pay regular quarterly dividends at the discretion of its Board. The issuance of a dividend is dependent on a variety of factors, including, but not limited to, available cash and the overall financial condition of the Company. The issuance of a dividend is also subject to legal restrictions and the terms of the Company’s Senior Credit Facility. The Company declared the following dividends during fiscal years 2011 and 2012:
| | | | | | | | | | | | | | | | |
Date Declared | | Record Date | | | Dividend Per
Share | | | Total Amount | | | Payment Date | |
| | | | | | | | | (in thousands) | | | | |
May 3, 2011 | | | June 1, 2011 | | | $ | 0.125 | | | $ | 2,094 | | | | July 15, 2011 | |
August 3, 2011 | | | September 1, 2011 | | | $ | 0.125 | | | $ | 2,096 | | | | October 15, 2011 | |
November 2, 2011 | | | December 1, 2011 | | | $ | 0.125 | | | $ | 2,100 | | | | January 15, 2012 | |
January 18, 2012 | | | March 1, 2012 | | | $ | 0.125 | | | $ | 2,106 | | | | April 15, 2012 | |
May 1, 2012 | | | June 1, 2012 | | | $ | 0.125 | | | $ | 2,120 | | | | July 15, 2012 | |
July 30, 2012 | | | September 1, 2012 | | | $ | 0.125 | | | $ | 2,141 | | | | October 15, 2012 | |
November 1, 2012 | | | December 3, 2012 | | | $ | 0.125 | | | $ | 2,120 | | | | January 15, 2013 | |
December 6, 2012 | | | December 17, 2012 | | | $ | 4.000 | | | $ | 68,090 | | | | December 27, 2012 | |
On May 3, 2012, the Company announced that its Board authorized a review of strategic alternatives, including a possible business combination or sale of the Company, to maximize value for all stockholders. On December 6, 2012, the Company announced that its Board had completed its review and elected to recapitalize the Company by amending its existing credit facility (See Note 8) and declared a one-time cash dividend of $4.00 per share payable to holders of record of the Company’s common stock as of the close of business on December 17, 2012. The payment date of the dividend was December 27, 2012. The Company recorded expenses
70
EINSTEIN NOAH RESTAURANT GROUP, INC. AND SUBSIDIARIES
Notes to Consolidated Financial Statements
towards this review as Strategic Alternatives Expense on the consolidated statements of income and comprehensive income.
In December 2010, the Board authorized up to $20.0 million in share repurchases of the Company’s common stock, subject to compliance with applicable laws and the terms of the Company’s Senior Credit Facility. The amount and timing of the share repurchases in the open market or in privately negotiated transactions will be subject to an assessment of market conditions and other economic factors. This authorization expired in December 2012 and was not renewed. The Company did not repurchase any shares of its common stock in fiscal years 2011 or 2012.
Series A Junior Participating Preferred Stock
In June 1999, the Board authorized the issuance of 700,000 shares of Series A junior participating preferred stock. There were no shares issued or outstanding during fiscal years 2011 and 2012.
| 12. | STOCK-BASED COMPENSATION |
As of January 1, 2013, the Company had three stock-based compensation plans under which it was still issuing awards: the 2011 Omnibus Incentive Plan, the Equity Plan for Non-Employee Directors and a Stock Appreciation Rights Plan. Outstanding awards previously issued under inactive or suspended plans will continue to vest and remain exercisable in accordance with the terms of the respective plans.
2011 Omnibus Incentive Plan
On May 3, 2011, the 2011 Omnibus Incentive Plan (the “Omnibus Plan”) became effective after approval by the Board and the Company’s stockholders. The Omnibus Plan provides for the granting of incentive stock options, nonqualified stock options, SARs, restricted stock, RSUs, performance shares, performance units, cash-based awards and other stock based awards. All of the Company’s employees and third party service providers are eligible to receive awards. The Omnibus Plan will terminate automatically in May 2021, unless terminated by the Board at an earlier date. The Board has the authority to amend, modify or terminate the Omnibus Plan, subject to any required approval by the Company’s stockholders under applicable law or upon advice of counsel. No such action may affect any options previously granted under the Omnibus Plan without the consent of the holders. Options generally are granted with an exercise price equal to the fair market value on the date of grant and have a contractual life of ten years. Vesting can either be based on the passage of time or on the achievement of performance goals. The Omnibus Plan provides for the issuance of up to 1,000,000 shares of common stock to eligible individuals through the various forms of permitted awards. The maximum number of shares for which options or stock appreciation rights may be granted to any participant is 300,000 per year and the maximum number of shares that may be paid to any participant in the form of restricted stock, restricted stock units, performance shares or other stock based awards is 300,000 shares per year. The maximum aggregate amount that may be paid under an award of performance units, cash-based awards or any other award payable in cash, in each case that are performance-based compensation, is $5.0 million. As of January 1, 2013, there were 596,802 shares remaining available for issuance under the Omnibus Plan.
Equity Plan for Non-Employee Directors
On December 19, 2003, the Board adopted the Stock Option Plan for Independent Directors. On May 3, 2011, the Board and the Company’s stockholders approved the amendment and restatement of this plan. Amongst other changes, the name of the plan was changed to the Equity Plan for Non-Employee Directors (the “Equity Plan”). The Equity Plan provides for the granting of nonqualified stock options, restricted stock and
71
EINSTEIN NOAH RESTAURANT GROUP, INC. AND SUBSIDIARIES
Notes to Consolidated Financial Statements
restricted stock units to independent directors. The Board may amend, suspend, or terminate the Equity Plan at any time, provided, however, that no such action may adversely affect any outstanding option without the option holder’s consent. Options are granted with an exercise price equal to the fair market value on the date of grant, become exercisable six months after the grant date and are exercisable for five years from the date of grant unless earlier terminated. The Equity Plan provides for the issuance of up to 500,000 shares of common stock to eligible participants. As of January 1, 2013, there were 140,278 shares remaining available for issuance under the Equity Plan.
Stock Appreciation Rights Plan
On February 17, 2007, the Board adopted the Stock Appreciation Rights Plan (the “SAR Plan”). The SAR Plan provides for the granting of stock appreciation rights to employees, excluding executive officers. The SAR plan has no set expiration date. The Board has the authority to amend, modify or terminate the SAR Plan, subject to any required approval by stockholders under applicable law or upon advice of counsel, provided that, with limited exception, no modification will adversely affect outstanding rights. The value of a share from which appreciation is determined is 100% of the fair market value of a share on the date of grant and will be paid in stock when they are exercised by the employee. The rights expire upon the earlier of the termination date of the SAR Plan or termination of employment, typically vest over a two-year service period and have a contractual life of five years.
The SAR Plan provides for 150,000 shares to be issued pursuant to stock appreciation rights. As of January 1, 2013, there were 38,011 shares remaining under this authorization.
Stock Based Compensation Cost
Stock-based compensation for fiscal years 2010, 2011 and 2012 was $1.5 million, $2.3 million and $2.4 million, respectively, and is included in general and administrative expenses.
The fair value of stock options and SARs granted during fiscal years 2010, 2011 and 2012 was estimated on the date of grant using the Black-Scholes option-pricing model with the following assumptions by grant year:
| | | | | | |
| | | Fiscal Year Ended |
| | | December 28, 2010 | | January 3, 2012 | | January 1, 2013 |
Expected life | | 2.75 - 6.0 years | | 2.75 - 6.0 years | | 2.75 - 6.0 years |
Risk-free interest rate | | 0.67% - 2.74% | | 0.38% - 2.61% | | 0.35% - 1.16% |
Volatility | | 42% - 43% | | 42% - 44% | | 35% - 42% |
Assumed dividend yield | | 0% | | 3.31% | | 2.83% - 4.1% |
Stock Option and SARs Activity
The weighted-average fair value of stock options and SARs issued and the total intrinsic value of options and SARs exercised were:
| | | | | | | | | | | | |
| | | 2010 | | | 2011 | | | 2012 | |
| | | (In thousands, except share prices) | |
Weighted-average grant date fair value | | $ | 4.93 | | | $ | 4.69 | | | $ | 4.03 | |
Total intrinsic value of options exercised | | $ | 1,398 | | | $ | 1,374 | | | $ | 1,528 | |
72
EINSTEIN NOAH RESTAURANT GROUP, INC. AND SUBSIDIARIES
Notes to Consolidated Financial Statements
Changes in outstanding stock options and SARs during the fiscal years 2010, 2011 and 2012 were as follows:
| | | | | | | | | | | | | | | | | | | | | | | | |
| | | Number of Options and SARs | | | Weighted-Average Exercise Price | |
| | | 2010 | | | 2011 | | | 2012 | | | 2010 | | | 2011 | | | 2012 | |
Outstanding, beginning of year | | | 977,930 | | | | 1,069,819 | | | | 1,217,749 | | | $ | 8.80 | | | $ | 10.11 | | | $ | 12.17 | |
Granted | | | 492,250 | | | | 425,180 | | | | 322,427 | | | | 11.62 | | | | 15.61 | | | | 14.44 | |
Exercised | | | (196,863 | ) | | | (183,278 | ) | | | (231,009 | ) | | | 5.36 | | | | 7.49 | | | | 9.07 | |
Forfeited | | | (180,437 | ) | | | (93,972 | ) | | | (117,701 | ) | | | 11.27 | | | | 13.48 | | | | 13.66 | |
Cancelled | | | (23,061 | ) | | | — | | | | (56,257 | ) | | | 18.22 | | | | — | | | | 16.81 | |
| | | | | | | | | | | | | | | | | | | | | | | | |
Outstanding, end of year | | | 1,069,819 | | | | 1,217,749 | | | | 1,135,209 | | | $ | 10.11 | | | $ | 12.17 | | | $ | 13.05 | |
| | | | | | | | | | | | | | | | | | | | | | | | |
Exercisable and vested, end of year | | | 455,128 | | | | 566,665 | | | | 553,105 | | | $ | 9.98 | | | $ | 10.68 | | | $ | 11.55 | |
| | | | | | | | | | | | | | | | | | | | | | | | |
A summary of the status of the Company’s non-vested stock options and SARs as of January 1, 2013, and changes during the fiscal year then ended, is presented below:
| | | | | | | | |
| | | Number
of Options
and SARS | | | Weighted-
Average
Grant
Date Fair
Value | |
Non-vested shares, January 3, 2012 | | | 651,084 | | | $ | 4.72 | |
Granted | | | 322,427 | | | | 4.03 | |
Vested | | | (295,743 | ) | | | 4.51 | |
Forfeited | | | (95,664 | ) | | | 4.21 | |
| | | | | | | | |
Non-vested shares, January 1, 2013 | | | 582,104 | | | $ | 4.53 | |
| | | | | | | | |
As of January 1, 2013, the weighted-average remaining life of total outstanding options and SARs, and exercisable and vested options and SARs was 6.82 years and 5.47 years, respectively. As of January 1, 2013, the aggregate intrinsic value of outstanding options and SARs, and exercisable and vested options and SARs was $1.2 million and $1.1 million, respectively.
The following table summarizes information about stock options and SARs outstanding at January 1, 2013:
| | | | | | | | | | | | | | | | | | | | |
| | | Options and SARs Outstanding | | | Options and SARs Exercisable | |
Range of Exercise Prices | | Number of
Options | | | Wt.Avg.
Exercise
Price | | | Wt.Avg.
Remaining
Life (Years) | | | Number of
Options | | | Wt.Avg.
Exercise
Price | |
$0.00 - $5.00 | | | 94,475 | | | $ | 4.58 | | | | 5.99 | | | | 94,475 | | | $ | 4.58 | |
$5.01 - $10.00 | | | 76,200 | | | | 8.08 | | | | 1.56 | | | | 76,200 | | | | 8.08 | |
$10.01 - $15.00 | | | 580,796 | | | | 13.18 | | | | 7.30 | | | | 210,904 | | | | 12.19 | |
$15.01 - $25.00 | | | 383,738 | | | | 15.94 | | | | 7.34 | | | | 171,526 | | | | 16.15 | |
| | | | | | | | | | | | | | | | | | | | |
| | | 1,135,209 | | | $ | 13.05 | | | | 6.82 | | | | 553,105 | | | $ | 11.55 | |
| | | | | | | | | | | | | | | | | | | | |
As of January 1, 2013, the Company has approximately $0.8 million of total unrecognized compensation cost related to non-vested awards granted under its plans, which will be recognized over a weighted-average period of 1.27 years.
73
EINSTEIN NOAH RESTAURANT GROUP, INC. AND SUBSIDIARIES
Notes to Consolidated Financial Statements
Restricted Stock Unit Activity
With the approval of the Omnibus Plan in May 2011, the Company can now issue RSUs. The Company’s outstanding RSUs have a three year life and one-third of each grant becomes unrestricted each year on the anniversary of the grant date. Upon vesting, the RSUs are generally net share-settled to cover the required withholding tax and the remaining amount is converted into an equivalent number of shares of the Company’s common stock. The fair value of the Company’s RSUs is determined based upon the closing fair market value of the Company’s common stock on the grant date.
Transactions for fiscal 2012 were as follows:
| | | | | | | | | | | | |
| | | Number
of
Shares | | | Weighted
Average
Grant
Date Fair
Value | | | Aggregate
Intrinsic
Value | |
Non-vested rights, January 3, 2012 | | | 96,180 | | | $ | 15.55 | | | | | |
Granted | | | 103,227 | | | | 14.23 | | | | | |
Vested | | | (44,590 | ) | | | 15.58 | | | | | |
Forfeited | | | (14,032 | ) | | | 14.96 | | | | | |
| | | | | | | | | | | | |
Non-vested rights, January 1, 2013 | | | 140,785 | | | $ | 14.63 | | | $ | 1,718,985 | |
| | | | | | | | | | | | |
As of January 1, 2013, the Company had approximately $1.0 million of total unrecognized compensation cost related to RSUs, which will be recognized over a weighted average period of 1.31 years.
Restricted Stock
On January 9, 2009, the Company’s Compensation Committee granted 63,776 shares of restricted stock with a value of $375,000 in connection with Mr. O’Neill’s appointment as President and Chief Executive Officer. The Company recognized compensation cost for this award using a graded vesting attribution method over the requisite service period. Stock-based compensation expense for each of the fiscal years 2010 and 2011 includes $0.1 million related to the vesting of these shares. As of January 9, 2012, all shares were fully vested.
The Company sponsors a qualified defined contribution retirement plan (the “401(k) Plan”) covering employees, excluding officers, if they meet certain eligibility requirements. The 401(k) Plan allows participating employees to defer the receipt of a portion of their compensation, on a pretax basis, and contribute such amount to one or more investment options. Employer contributions are fully vested after three years of service. The Company did not accrue or pay a discretionary match for each of the fiscal years 2010, 2011 and 2012.
The Company established the Einstein Noah Restaurant Group, Inc. Nonqualified Deferred Compensation Plan (the “DC Plan”) in June 2007 for key employees, generally officers of the Company. The DC Plan allows an eligible employee to defer up to 80% of their base salary and bonus. In lieu of payments of the deferred amounts to the participant, the payments are to be invested with The Charles Schwab Trust Company under investment criteria directed by the participant.
74
EINSTEIN NOAH RESTAURANT GROUP, INC. AND SUBSIDIARIES
Notes to Consolidated Financial Statements
The components of the Company’s income tax provision are as follows:
| | | | | | | | | | | | |
| | | December 28,
2010 | | | January 3,
2012 | | | January 1,
2013 | |
| | | (in thousands) | |
Current | | | | | | | | | | | | |
Federal | | $ | (491 | ) | | $ | — | | | $ | — | |
State | | | 685 | | | | 1,040 | | | | 235 | |
| | | | | | | | | | | | |
Total current income tax provision | | | 194 | | | | 1,040 | | | | 235 | |
| | | | | | | | | | | | |
Deferred | | | | | | | | | | | | |
Federal | | | 8,162 | | | | 5,866 | | | | 10,938 | |
State | | | 1,700 | | | | 1,033 | | | | 1,720 | |
| | | | | | | | | | | | |
Total deferred income tax provision | | | 9,862 | | | | 6,899 | | | | 12,658 | |
Change in valuation allowance | | | (138 | ) | | | 19 | | | | (4,790 | ) |
| | | | | | | | | | | | |
Total deferred income tax provision | | | 9,724 | | | | 6,918 | | | | 7,868 | |
| | | | | | | | | | | | |
Total income tax provision | | $ | 9,918 | | | $ | 7,958 | | | $ | 8,103 | |
| | | | | | | | | | | | |
The Company’s effective tax rate differs from the statutory tax rates as follows:
| | | | | | | | | | | | |
| | | December 28,
2010 | | | January 3,
2012 | | | January 1,
2013 | |
U.S. Federal statutory rate | | | 35.0 | % | | | 35.0 | % | | | 35.0 | % |
State income tax rate, net of Federal tax benefit | | | 6.6 | % | | | 6.4 | % | | | 4.1 | % |
Federal employment tax credits | | | 0.0 | % | | | (2.2 | %) | | | (0.7 | %) |
Expiring net operating losses | | | 0.0 | % | | | 0.0 | % | | | 23.0 | % |
Effect of change in tax rate | | | 0.7 | % | | | 0.0 | % | | | 0.0 | % |
Series Z | | | 1.9 | % | | | 0.0 | % | | | 0.0 | % |
Other, net | | | 4.8 | % | | | (1.6 | %) | | | 0.5 | % |
| | | | | | | | | | | | |
| | | 49.0 | % | | | 37.6 | % | | | 61.9 | % |
Change in valuation allowance | | | (0.7 | %) | | | 0.0 | % | | | (23.0 | %) |
| | | | | | | | | | | | |
Effective income tax rate | | | 48.3 | % | | | 37.6 | % | | | 38.9 | % |
| | | | | | | | | | | | |
The Company’s total deferred tax assets and liabilities are as follows:
| | | | | | | | |
| | | January 3,
2012 | | | January 1,
2013 | |
| | | (in thousands) | |
Deferred tax assets | | $ | 60,258 | | | $ | 50,744 | |
Deferred tax liabilities | | | (16,652 | ) | | | (19,828 | ) |
| | | | | | | | |
| | | 43,606 | | | | 30,916 | |
Valuation allowance | | | (4,790 | ) | | | — | |
| | | | | | | | |
Total deferred tax assets, net | | $ | 38,816 | | | $ | 30,916 | |
| | | | | | | | |
During fiscal 2012, the Company changed its presentation of the income tax effects of approximately $12.2 million of NOL carryforwards as the gross deferred tax asset exceeded the amount permissible to be used under
75
EINSTEIN NOAH RESTAURANT GROUP, INC. AND SUBSIDIARIES
Notes to Consolidated Financial Statements
tax law. Accordingly, the Company wrote-off these NOL carryforwards and reversed the related valuation allowance of $4.8 million. There was no impact to the Company’s income tax provision or to its total deferred tax assets as a result of this adjustment.
The income tax effects of temporary differences that give rise to significant portions of deferred tax assets and liabilities are as follows:
| | | | | | | | |
| | | January 3,
2012 | | | January 1,
2013 | |
| | | (in thousands) | |
Current deferred tax assets and liabilities, net | | | | | | | | |
Operating loss carryforwards | | $ | 7,234 | | | $ | 5,537 | |
Deferred revenue | | | 164 | | | | 212 | |
Accrued expenses, net | | | 2,372 | | | | 2,536 | |
Other | | | 29 | | | | (95 | ) |
| | | | | | | | |
Total gross current deferred tax assets, net of liabilities | | | 9,799 | | | | 8,190 | |
Valuation allowance | | | (786 | ) | | | — | |
| | | | | | | | |
Total current deferred tax assets, net | | | 9,013 | | | | 8,190 | |
Long-term deferred tax assets and liabilities, net | | | | | | | | |
Operating loss carryforwards, net of unrecognized tax benefits | | | 33,165 | | | | 25,728 | |
Property, plant and equipment | | | 12,151 | | | | 10,881 | |
Intangible assets | | | (16,561 | ) | | | (19,252 | ) |
Deferred rent | | | 1,869 | | | | 2,060 | |
Stock-based compensation | | | 1,963 | | | | 2,260 | |
Federal tax credits | | | 866 | | | | 1,063 | |
Other | | | 354 | | | | (14 | ) |
| | | | | | | | |
Total gross long-term deferred tax assets, net of liabilities | | | 33,807 | | | | 22,726 | |
Valuation allowance | | | (4,004 | ) | | | — | |
| | | | | | | | |
Total long-term deferred tax assets, net | | | 29,803 | | | | 22,726 | |
| | | | | | | | |
Total deferred tax assets, net | | $ | 38,816 | | | $ | 30,916 | |
| | | | | | | | |
The Company’s continued utilization of its NOL carryforwards reduces its income tax liabilities. As of January 3, 2012 and January 1, 2013, the Company had $0.1 million and $0.4 million, respectively, of federal and state income tax overpayments recorded within prepaid expenses on the consolidated balance sheet.
As of January 1, 2013, NOL carryforwards of $93.4 million were available to be utilized against future taxable income for years through fiscal 2031, subject in part to annual limitations. As of January 1, 2013, the
76
EINSTEIN NOAH RESTAURANT GROUP, INC. AND SUBSIDIARIES
Notes to Consolidated Financial Statements
Company’s NOL carryforwards for U.S. federal income tax purposes that are expected to be utilized are subject to the following expiration schedule:
| | | | |
Net Operating Loss Carryforwards | |
Expiration Date | | Amount | |
| (in thousands) | |
December 31, 2018 | | $ | 5,470 | |
December 31, 2020 | | | 3,874 | |
December 31, 2022 | | | 12,121 | |
December 31, 2023 | | | 42,362 | |
December 31, 2024 | | | 12,003 | |
December 31, 2025 | | | 5,413 | |
December 31, 2026 | | | 4,900 | |
December 31, 2027 | | | 268 | |
December 31, 2028 | | | 47 | |
December 31, 2029 | | | 6,874 | |
December 31, 2030 | | | 62 | |
December 31, 2031 | | | 28 | |
| | | | |
| | $ | 93,422 | |
| | | | |
The Company’s ability to utilize its NOL carryforwards could be further limited if it experiences an “ownership change” as defined by IRC §382. The occurrence of this type of ownership change would limit the Company’s ability to utilize approximately $84.1 million of its NOL carryforwards that are not currently subject to limitation, and could further limit the Company’s ability to utilize its remaining NOL carryforwards and possibly other tax attributes. As of January 1, 2013, approximately $9.3 million of the Company’s NOL carryforwards are subject to limitation.
Excess tax benefits related to stock option exercises have not been recorded due to the Company’s NOL carryforward position. The following represents a reconciliation of the Company’s unrecognized excess tax benefits for the fiscal years ended January 3, 2012 and January 1, 2013:
| | | | |
| | | Unrecognized
excess tax
benefits | |
| | | (in thousands) | |
Balance—December 28, 2010 | | $ | 6,949 | |
Additions based on 2011 stock option exercises | | | 298 | |
| | | | |
Balance—January 3, 2012 | | $ | 7,247 | |
Additions based on 2012 stock option exercises | | | 658 | |
| | | | |
Balance—January 1, 2013 | | $ | 7,905 | |
| | | | |
These excess tax benefits are not included in the Company’s deferred tax assets due to limitations regarding their recognition. If these excess tax benefits are recognized in the future, the Company’s effective tax rate will not be impacted.
77
EINSTEIN NOAH RESTAURANT GROUP, INC. AND SUBSIDIARIES
Notes to Consolidated Financial Statements
Uncertain tax positions
The following table summarizes the activity related to the Company’s uncertain tax positions:
| | | | | | | | | | | | |
| | | December 28,
2010 | | | January 3,
2012 | | | January 1,
2013 | |
| | | (in thousands) | |
Balance, beginning of fiscal year | | $ | 826 | | | $ | 1,147 | | | $ | 1,006 | |
Increase related to prior period positions | | | — | | | | 516 | | | | — | |
Increase related to current year positions | | | 455 | | | | 35 | | | | — | |
Decrease related to prior period positions | | | (134 | ) | | | (692 | ) | | | (295 | ) |
| | | | | | | | | | | | |
Balance, end of fiscal year | | $ | 1,147 | | | $ | 1,006 | | | $ | 711 | |
| | | | | | | | | | | | |
The recorded amounts, if recognized, will have no impact on the effective tax rate due to the existence of NOL carryforwards.
The Company is subject to income taxes in the U.S. federal jurisdiction, and the various state and local jurisdictions in which it operates. Tax regulations within each jurisdiction are subject to the interpretation of the related tax laws and regulations and require significant judgment to apply. The Company’s federal tax filings remain subject to examination for fiscal tax years 2010 and 2011. The IRS has completed its examinations for tax years 2009 and prior. The Company’s state and local tax filings remain subject to examination for fiscal tax years 2008 through 2011. Although years prior to fiscal 2008 are no longer subject to examination, the taxing authorities reserve the right to adjust the Company’s NOL carryforwards.
| 15. | SUPPLEMENTAL CASH FLOW INFORMATION |
| | | | | | | | | | | | |
| | | Fiscal year ended | |
| | | December 28,
2010 | | | January 3,
2012 | | | January 1,
2013 | |
| | | (in thousands) | |
Cash paid during the year to date period ended: | | | | | | | | | | | | |
Interest related to: | | | | | | | | | | | | |
Term loans and revolving credit facility | | $ | 3,032 | | | $ | 2,482 | | | $ | 2,385 | |
Mandatorily redeemable preferred stock | | | 1,677 | | | | — | | | | — | |
Miscellaneous bank charges | | | 458 | | | | 402 | | | | 386 | |
Income taxes | | $ | 223 | | | $ | 733 | | | $ | 660 | |
Non-cash investing activities: | | | | | | | | | | | | |
Non-cash purchase of equipment through capital leasing | | $ | — | | | $ | 38 | | | $ | 33 | |
Change in accrued expenses for purchases of property and equipment | | $ | (351 | ) | | $ | 1,695 | | | $ | (351 | ) |
| 16. | RELATED PARTY TRANSACTIONS |
Greenlight Capital, L.L.C. (“Greenlight”) and its affiliates beneficially owned approximately 63% of the Company’s common stock as of January 1, 2013. Greenlight has sufficient voting power, without the vote of any other stockholders, to determine what matters will be submitted for approval by the Company’s stockholders, to elect all of the Board, and among other things, to determine whether a change in control of the Company occurs. The Company’s chairman, E. Nelson Heumann, was an employee of Greenlight until his retirement from Greenlight in February 2011.
78
EINSTEIN NOAH RESTAURANT GROUP, INC. AND SUBSIDIARIES
Notes to Consolidated Financial Statements
| 17. | COMMITMENTS, CONTINGENCIES AND OTHER DEVELOPMENTS |
Letters of Credit
See Note 8 for information regarding the Company’s outstanding letters of credit.
Leases
The Company leases certain equipment under capital leases. Included in property, plant and equipment are the asset values of $157,000 and $98,000 and the related accumulated amortization of $113,000 and $41,000 as of January 3, 2012 and January 1, 2013, respectively. Amortization of assets under capital leases of less than $0.1 million is included in depreciation and amortization expense for each of the fiscal years 2010, 2011 and 2012.
The Company leases office space, restaurant space and certain equipment under operating leases having terms that expire at various dates through the fiscal year ended 2024. The restaurant leases have renewal clauses of 1 to 20 years at the Company’s option and, in some cases, have provisions for contingent rent based upon a percentage of gross sales, as defined in the leases. Rent expense for fiscal years 2010, 2011 and 2012 was $31.1 million, $31.8 million and $33.3 million, respectively. Contingent rent expense for fiscal years 2010, 2011 and 2012 was $0.1 million, $0.2 million and $0.1 million, respectively
As of January 1, 2013, future minimum lease payments under capital and operating leases were as follows:
| | | | | | | | |
Fiscal year: | | Capital
Leases | | | Operating
Leases | |
| | | (in thousands) | |
2013 | | $ | 26 | | | $ | 34,332 | |
2014 | | | 16 | | | | 33,221 | |
2015 | | | 8 | | | | 30,258 | |
2016 | | | 8 | | | | 25,245 | |
2017 | | | 6 | | | | 17,551 | |
Thereafter | | | — | | | | 45,945 | |
| | | | | | | | |
Total minimum lease payments | | $ | 64 | | | $ | 186,552 | |
| | | | | | | | |
Less imputed interest (average rate of 4.75%) | | | 7 | | | | | |
| | | | | | | | |
Present value of minimum lease payments | | $ | 57 | | | | | |
Less current portion of obligations under capital leases | | | 22 | | | | | |
| | | | | | | | |
Obligations under capital leases, long-term | | $ | 35 | | | | | |
| | | | | | | | |
The short-term and long-term portions of the Company’s capital leases are recorded as a component of accrued expenses and other current liabilities and other liabilities, respectively.
The Company subleases out a portion of its restaurant space on leases where it does not need the entire space for its operations. As of January 1, 2013, minimum sublease rentals to be received in the future under non-cancelable subleases were $1.8 million. The Company’s sublease income was $0.4 million, $0.5 million and $0.5 million for fiscal years 2010, 2011 and 2012, respectively.
Purchase Commitments
The Company has obligations with certain of its major suppliers of raw materials. From time to time, the Company will commit to the purchase price of certain commodities that are related to the ingredients used for the production of its bagels, cream cheese and coffee. On a periodic basis, the Company reviews the relationship of
79
EINSTEIN NOAH RESTAURANT GROUP, INC. AND SUBSIDIARIES
Notes to Consolidated Financial Statements
these purchase commitments to its business plan, general market trends and its assumptions in its operating plans. If these commitments are deemed to be in excess of the market, the Company will expense the excess purchase commitment to cost of sales in the period in which the shortfall is determined. The total of the Company’s future purchase obligations as of January 1, 2013 was approximately $26.3 million.
San Francisco Health Care Security Ordinance
On November 29, 2012, the Company agreed to make payments in the total amount of $1.2 million relating to implementation charges for the San Francisco Health Care Security Ordinance and related legal fees. This charge is recorded as a component of other operating (income) expenses, net on the fiscal 2012 consolidated statement of income and comprehensive income.
Litigation
The Company is subject to claims and legal actions in the ordinary course of business, including claims by or against franchisees, licensees and employees or former employees and/or contract disputes. The Company does not believe any currently pending or threatened matter would have a material adverse effect on its business, results of operations or financial condition.
In fiscal 2010, the Company’s management approved a plan to restructure the organization to align with its franchise growth model. This restructuring included eliminating certain redundant positions and reducing headcount. The Company incurred $0.5 million and $0.2 million related to this restructuring for fiscal 2010 and fiscal 2011, respectively.
In fiscal 2011, the Company committed to a plan to close all five of its commissaries. The Grove City, Ohio commissary closed during the fourth quarter of 2011. The remaining four commissaries closed by the end of the first quarter of 2012. The Company recorded restructuring charges of $0.7 million during fiscal 2011 and $0.5 million during fiscal 2012 related to this restructuring.
Also in fiscal 2011, the Company eliminated other redundant positions resulting in an additional $0.2 million of restructuring charges for fiscal 2011.
All restructuring costs are included in restructuring expenses on the consolidated statements of income and comprehensive income. It is the Company’s policy to record all restructuring costs within the corporate support segment.
80
EINSTEIN NOAH RESTAURANT GROUP, INC. AND SUBSIDIARIES
Notes to Consolidated Financial Statements
The following table summarizes the Company’s restructuring activities for fiscal 2011 and fiscal 2012:
| | | | | | | | | | | | | | | | |
| | | Employee
Termination
Benefits | | | Contract
Termination
Costs | | | Other | | | Total | |
| | | | | | (in thousands) | | | | |
Balance, December 29, 2009 | | $ | — | | | $ | — | | | $ | — | | | $ | — | |
Additional expense incurred | | | 477 | | | | — | | | | — | | | | 477 | |
Amounts paid | | | (366 | ) | | | — | | | | — | | | | (366 | ) |
| | | | | | | | | | | | | | | | |
Balance, December 28, 2010 | | $ | 111 | | | $ | — | | | $ | — | | | $ | 111 | |
Additional expense incurred | | | 552 | | | | 130 | | | | 417 | | | | 1,099 | |
Amounts paid | | | (216 | ) | | | — | | | | (230 | ) | | | (446 | ) |
| | | | | | | | | | | | | | | | |
Balance, January 3, 2012 | | $ | 447 | | | $ | 130 | | | $ | 187 | | | $ | 764 | |
Additional expense incurred | | | 131 | | | | 325 | | | | 24 | | | | 480 | |
Amounts paid | | | (578 | ) | | | (430 | ) | | | (171 | ) | | | (1,179 | ) |
| | | | | | | | | | | | | | | | |
Balance, January 1, 2013 | | $ | — | | | $ | 25 | | | $ | 40 | | | $ | 65 | |
| | | | | | | | | | | | | | | | |
The Company’s senior management team manages the business and allocates resources via a combination of restaurant sales reports and gross profit information related to the Company’s three sources of revenue, which are presented in their entirety within the consolidated statements of income and comprehensive income.
Financial results by reportable segment for fiscal years 2010, 2011 and 2012 are as follows:
| | | | | | | | | | | | | | | | | | | | |
| | | Segments | | | | | | | |
| Fiscal 2010: | | Company-owned
restaurants | | | Manufacturing and
commissary | | | Franchise and
license | | | Corporate
support | | | Consolidated | |
| | | | | | (in thousands of dollars) | | | | | | | |
Revenues: | | | | | | | | | | | | | | | | | | | | |
Company-owned restaurant sales | | $ | 372,191 | | | $ | — | | | $ | — | | | $ | — | | | $ | 372,191 | |
Manufacturing and commissary revenues | | | — | | | | 30,405 | | | | — | | | | — | | | | 30,405 | |
Franchise and license related revenues | | | — | | | | — | | | | 9,115 | | | | — | | | | 9,115 | |
| | | | | | | | | | | | | | | | | | | | |
Total revenues | | | 372,191 | | | | 30,405 | | | | 9,115 | | | | — | | | | 411,711 | |
Cost of sales: | | | | | | | | | | | | | | | | | | | | |
Company-owned restaurant costs | | | 302,005 | | | | — | | | | — | | | | — | | | | 302,005 | |
Manufacturing and commissary costs | | | — | | | | 25,566 | | | | — | | | | — | | | | 25,566 | |
Franchise and license related costs | | | — | | | | — | | | | — | | | | — | | | | — | |
| | | | | | | | | | | | | | | | | | | | |
Total cost of sales | | | 302,005 | | | | 25,566 | | | | — | | | | — | | | | 327,571 | |
| | | | | | | | | | | | | | | | | | | | |
Gross profit | | | 70,186 | | | | 4,839 | | | | 9,115 | | | | | | | | 84,140 | |
Operating expenses | | | 370 | | | | — | | | | — | | | | 56,199 | | | | 56,569 | |
Other expenses | | | — | | | | — | | | | — | | | | 7,030 | | | | 7,030 | |
Provision for income taxes | | | — | | | | — | | | | — | | | | 9,918 | | | | 9,918 | |
| | | | | | | | | | | | | | | | | | | | |
Net income (loss) | | $ | 69,816 | | | $ | 4,839 | | | $ | 9,115 | | | $ | (73,147 | ) | | $ | 10,623 | |
| | | | | | | | | | | | | | | | | | | | |
Total assets | | $ | — | | | $ | — | | | $ | — | | | $ | 205,067 | | | $ | 205,067 | |
| | | | | | | | | | | | | | | | | | | | |
81
EINSTEIN NOAH RESTAURANT GROUP, INC. AND SUBSIDIARIES
Notes to Consolidated Financial Statements
| | | | | | | | | | | | | | | | | | | | |
| | | Segments | | | | | | | |
| Fiscal 2011: | | Company-owned
restaurants | | | Manufacturing and
commissary | | | Franchise and
license | | | Corporate
support | | | Consolidated | |
| | | (in thousands of dollars) | |
Revenues: | | | | | | | | | | | | | | | | | | | | |
Company-owned restaurant sales | | $ | 378,723 | | | $ | — | | | $ | — | | | $ | — | | | $ | 378,723 | |
Manufacturing and commissary revenues | | | — | | | | 34,542 | | | | — | | | | — | | | | 34,542 | |
Franchise and license related revenues | | | — | | | | — | | | | 10,330 | | | | — | | | | 10,330 | |
| | | | | | | | | | | | | | | | | | | | |
Total revenues | | | 378,723 | | | | 34,542 | | | | 10,330 | | | | — | | | | 423,595 | |
Cost of sales: | | | | | | | | | | | | | | | | | | | | |
Company-owned restaurant costs | | | 311,634 | | | | — | | | | — | | | | — | | | | 311,634 | |
Manufacturing and commissary costs | | | — | | | | 30,441 | | | | — | | | | — | | | | 30,441 | |
Franchise and license related costs | | | — | | | | — | | | | — | | | | — | | | | — | |
| | | | | | | | | | | | | | | | | | | | |
Total cost of sales | | | 311,634 | | | | 30,441 | | | | — | | | | — | | | | 342,075 | |
| | | | | | | | | | | | | | | | | | | | |
Operating expenses | | | 265 | | | | — | | | | — | | | | 56,737 | | | | 57,002 | |
Other expenses | | | — | | | | — | | | | — | | | | 3,357 | | | | 3,357 | |
Provision for income taxes | | | — | | | | — | | | | — | | | | 7,958 | | | | 7,958 | |
| | | | | | | | | | | | | | | | | | | | |
Net income (loss) | | $ | 66,824 | | | $ | 4,101 | | | $ | 10,330 | | | $ | (68,052 | ) | | $ | 13,203 | |
| | | | | | | | | | | | | | | | | | | | |
Total assets | | $ | — | | | $ | — | | | $ | — | | | $ | 204,732 | | | $ | 204,732 | |
| | | | | | | | | | | | | | | | | | | | |
| | | | | | | | | | | | | | | | | | | | |
| | | Segments | | | | | | | |
| Fiscal 2012: | | Company-owned
restaurants | | | Manufacturing and
commissary | | | Franchise and
license | | | Corporate
support | | | Consolidated | |
| | | (in thousands of dollars) | |
Revenues: | | | | | | | | | | | | | | | | | | | | |
Company-owned restaurant sales | | $ | 384,783 | | | $ | — | | | $ | — | | | $ | — | | | $ | 384,783 | |
Manufacturing and commissary revenues | | | — | | | | 31,037 | | | | — | | | | — | | | | 31,037 | |
Franchise and license related revenues | | | — | | | | — | | | | 11,186 | | | | — | | | | 11,186 | |
| | | | | | | | | | | | | | | | | | | | |
Total revenues | | | 384,783 | | | | 31,037 | | | | 11,186 | | | | — | | | | 427,006 | |
Cost of sales: | | | | | | | | | | | | | | | | | | | | |
Company-owned restaurant costs | | | 312,402 | | | | — | | | | — | | | | — | | | | 312,402 | |
Manufacturing and commissary costs | | | — | | | | 24,236 | | | | — | | | | — | | | | 24,236 | |
Franchise and license related costs | | | — | | | | — | | | | — | | | | — | | | | — | |
| | | | | | | | | | | | | | | | | | | | |
Total cost of sales | | | 312,402 | | | | 24,236 | | | | — | | | | — | | | | 336,638 | |
| | | | | | | | | | | | | | | | | | | | |
Operating expenses | | | 1,115 | | | | — | | | | — | | | | 65,025 | | | | 66,140 | |
Other expenses | | | — | | | | — | | | | — | | | | 3,384 | | | | 3,384 | |
Provision for income taxes | | | — | | | | — | | | | — | | | | 8,103 | | | | 8,103 | |
| | | | | | | | | | | | | | | | | | | | |
Net income (loss) | | $ | 71,266 | | | $ | 6,801 | | | $ | 11,186 | | | $ | (76,512 | ) | | $ | 12,741 | |
| | | | | | | | | | | | | | | | | | | | |
Total assets | | $ | — | | | $ | — | | | $ | — | | | $ | 213,613 | | | $ | 213,613 | |
| | | | | | | | | | | | | | | | | | | | |
82
EINSTEIN NOAH RESTAURANT GROUP, INC. AND SUBSIDIARIES
Notes to Consolidated Financial Statements
| 20. | QUARTERLY RESULTS OF OPERATIONS (UNAUDITED) |
The following table summarizes the unaudited consolidated quarterly results of operations for fiscal years 2011 and 2012:
| | | | | | | | | | | | | | | | |
| | | Fiscal year 2011: | |
| | | 1st Quarter | | | 2nd Quarter | | | 3rd Quarter | | | 4th Quarter | |
| | | (13 wks) | | | (13 wks) | | | (13 wks) | | | (14 wks) | |
| | | (in thousands, except earnings per share and related share
information) | |
Revenue | | $ | 101,245 | | | $ | 103,677 | | | $ | 103,532 | | | $ | 115,141 | |
Income from operations | | | 2,889 | | | | 6,033 | | | | 5,254 | | | | 10,342 | |
Net income available to common stockholders | | $ | 1,168 | | | $ | 3,080 | | | $ | 2,835 | | | $ | 6,120 | |
Net income available to common stockholders per share—Basic | | $ | 0.07 | | | $ | 0.18 | | | $ | 0.17 | | | $ | 0.36 | |
Net income available to common stockholders per share—Diluted | | $ | 0.07 | | | $ | 0.18 | | | $ | 0.17 | | | $ | 0.36 | |
Cash dividend declared | | $ | — | | | $ | 0.125 | | | $ | 0.125 | | | $ | 0.125 | |
Weighted average number of common shares outstanding: | | | | | | | | | | | | | | | | |
Basic | | | 16,678,607 | | | | 16,725,827 | | | | 16,785,934 | | | | 16,809,502 | |
| | | | | | | | | | | | | | | | |
Diluted | | | 16,981,144 | | | | 17,004,316 | | | | 17,013,086 | | | | 17,022,819 | |
| | | | | | | | | | | | | | | | |
| | | | | | | | | | | | | | | | |
| | | Fiscal year 2012: | |
| | | 1st Quarter | | | 2nd Quarter | | | 3rd Quarter | | | 4th Quarter | |
| | | (13 wks) | | | (13 wks) | | | (13 wks) | | | (13 wks) | |
| | | (in thousands, except earnings per share and related share
information) | |
Revenue | | $ | 104,873 | | | $ | 105,993 | | | $ | 105,494 | | | $ | 110,646 | |
Income from operations | | | 6,044 | | | | 5,590 | | | | 6,332 | | | | 6,262 | |
Net income available to common stockholders | | $ | 3,204 | | | $ | 2,956 | | | $ | 3,414 | | | | 3,167 | |
Net income available to common stockholders per share—Basic | | $ | 0.19 | | | $ | 0.17 | | | $ | 0.20 | | | $ | 0.19 | |
Net income available to common stockholders per share—Diluted | | $ | 0.19 | | | $ | 0.17 | | | $ | 0.20 | | | $ | 0.18 | |
Cash dividend declared | | $ | 0.125 | | | $ | 0.125 | | | $ | 0.125 | | | $ | 4.125 | |
Weighted average number of common shares outstanding: | | | | | | | | | | | | | | | | |
Basic | | | 16,850,776 | | | | 16,935,195 | | | | 16,961,298 | | | | 16,992,803 | |
| | | | | | | | | | | | | | | | |
Diluted | | | 17,125,409 | | | | 17,213,322 | | | | 17,292,305 | | | | 17,278,632 | |
| | | | | | | | | | | | | | | | |
On January 28, 2013, the Company paid $6.7 million towards its Revolving Facility.
On January 30, 2013, the Board declared a cash dividend on the Company’s common stock in the amount of $0.125 per share, payable on April 15, 2013, to shareholders of record as of March 1, 2013.
On January 31, 2013, the Company adjusted all outstanding stock options and SARs in accordance with the anti-dilution provisions of its outstanding stock-based compensation plans.
83
EINSTEIN NOAH RESTAURANT GROUP, INC. AND SUBSIDIARIES
Schedule II – Valuation and Qualifying Accounts
| | | | | | | | | | | | | | | | |
| | | Balance at
beginning
of period | | | Additions (a) | | | Deductions (b) | | | Balance at
end of
period | |
| | | (in thousands) | |
For the fiscal year ended December 28, 2010: | | | | | | | | | | | | | | | | |
Allowance for doubtful accounts | | $ | 141 | | | | 167 | | | | (259 | ) | | $ | 49 | |
Valuation allowance for deferred taxes | | $ | 4,909 | | | | — | | | | (138 | ) | | $ | 4,771 | |
For the fiscal year ended January 3, 2012: | | | | | | | | | | | | | | | | |
Allowance for doubtful accounts | | $ | 49 | | | | 69 | | | | (45 | ) | | $ | 73 | |
Valuation allowance for deferred taxes | | $ | 4,771 | | | | 19 | | | | — | | | $ | 4,790 | |
For the fiscal year ended January 1, 2013: | | | | | | | | | | | | | | | | |
Allowance for doubtful accounts | | $ | 73 | | | | 78 | | | | (45 | ) | | $ | 106 | |
Valuation allowance for deferred taxes | | $ | 4,790 | | | | — | | | | (4,790 | ) | | $ | — | |
| (a) Amounts | charged to costs and expenses. |
| (b) Bad | debt write-offs and charges to reserves. |
See accompanying report of independent registered public accounting firm
84
| ITEM 9. | CHANGES IN AND DISAGREEMENTS WITH ACCOUNTANTS ON ACCOUNTING AND FINANCIAL DISCLOSURE |
None
| ITEM 9A. CONTROLS | AND PROCEDURES |
Disclosure Controls and Procedures
Under the supervision and with the participation of our management, including our chief executive officer and our chief financial officer, we have evaluated the effectiveness of the design and operation of our disclosure controls and procedures as of January 1, 2013.
The term “disclosure controls and procedures,” as defined in Rules 13a-15(e) and 15d-15(e) under the Exchange Act, means controls and other procedures that are designed to ensure that information required to be disclosed by us in the reports that we file or submit under the Exchange Act is recorded, processed, summarized and reported within the time periods specified in SEC’s rules and forms. Disclosure controls and procedures include, without limitation, controls and procedures designed to ensure information required to be disclosed by us in the reports we file under the Exchange Act is accumulated and communicated to our management, including our chief executive officer and our chief financial officer, as appropriate to allow timely decisions regarding required disclosure.
Based on the evaluation of our disclosure controls and procedures as of January 1, 2013, our chief executive officer and our chief financial officer have concluded that, as of such date, our disclosure controls and procedures were effective.
Management’s Annual Report on Internal Control over Financial Reporting
Our management is responsible for establishing and maintaining adequate internal control over financial reporting. In accordance with Rules 13a-15(f) and 15d-15(f) under the Exchange Act, our internal control over financial reporting is a process designed under the supervision of our chief executive officer and our chief financial officer to provide reasonable assurance regarding the reliability of financial reporting and the preparation of our financial statements for external reporting purposes in accordance with accounting principles generally accepted in the United States of America.
Our internal control over financial reporting includes policies and procedures that pertain to the maintenance of records that, in reasonable detail, accurately and fairly reflect transactions and dispositions of assets; provide reasonable assurances that transactions are recorded as necessary to permit preparation of financial statements in accordance with accounting principles generally accepted in the United States of America; that receipts and expenditures are being made only in accordance with authorizations of our management and directors; and provide reasonable assurance regarding prevention or timely detection of unauthorized acquisition, use or disposition of our assets that could have a material effect on our financial statements.
As of January 1, 2013, our management conducted an assessment of the effectiveness of our internal control over financial reporting based on the framework established inInternal Control—Integrated Framework issued by the Committee of Sponsoring Organizations of the Treadway Commission (“COSO”). Based on this assessment, management has determined that our internal control over financial reporting was effective as of January 1, 2013.
The effectiveness of our internal control over financial reporting as of January 1, 2013 has been audited by Grant Thornton LLP, an independent registered public accounting firm, as stated in their report dated February 28, 2013, appearing under the heading “Report of Independent Registered Public Accounting Firm,” in Part II, Item 8 of this report.
85
Changes in Internal Control over Financial Reporting
During the fourth quarter of 2012, there were no changes to our internal control over financial reporting that have materially affected, or are reasonably likely to materially affect, our internal control over financial reporting.
| ITEM 9B. | OTHER INFORMATION |
None
86
PART III
| ITEM 10. | DIRECTORS, EXECUTIVE OFFICERS AND CORPORATE GOVERNANCE |
Information relating to directors required by Item 10 will be included in our definitive proxy statement with respect to our 2013 Annual Meeting of Stockholders (the “Proxy Statement”), which will be filed within 120 days after the close of the 2012 fiscal year, and is hereby incorporated by reference.
Information relating to compliance with Section 16(a) required by Item 10 will be included in our Proxy Statement, which will be filed within 120 days after the close of the 2012 fiscal year, and is hereby incorporated by reference.
Information regarding executive officers is included in Part I of this Form 10-K under the caption “Executive Officers of the Registrant.”
We adopted a Code of Conduct applicable to our chief executive officer, chief financial officer, chief accounting officer and other finance leaders, which is a “code of ethics” as defined by applicable rules of the SEC. This code is publicly available on the Company’s website. If we makes any amendments to this code other than technical, administrative or other non-substantive amendments, or grants any waivers, including implicit waivers, from a provision of this code to the our chief executive officer, chief financial officer or chief accounting officer, we will disclose the nature of the amendment or waiver, its effective date and to whom it applies on its website or in a report on Form 8-K filed with the SEC.
| ITEM 11. | EXECUTIVE COMPENSATION |
This information will be included in our Proxy Statement, which will be filed within 120 days after the close of the 2012 fiscal year, and is hereby incorporated by reference.
| ITEM 12. | SECURITY OWNERSHIP OF CERTAIN BENEFICIAL OWNERS AND MANAGEMENT AND RELATED STOCKHOLDER MATTERS |
This information will be included in our Proxy Statement, which will be filed within 120 days after the close of the 2012 fiscal year, and is hereby incorporated by reference.
| ITEM 13. | CERTAIN RELATIONSHIPS AND RELATED TRANSACTIONS, AND DIRECTOR INDEPENDENCE |
This information will be included in our Proxy Statement, which will be filed within 120 days after the close of the 2012 fiscal year, and is hereby incorporated by reference.
| ITEM 14. | PRINCIPAL ACCOUNTING FEES AND SERVICES |
This information will be included in our Proxy Statement, which will be filed within 120 days after the close of the 2012 fiscal year, and is hereby incorporated by reference.
87
PART IV
| ITEM 15. | EXHIBITS, FINANCIAL STATEMENT SCHEDULES |
(a) The following documents are filed as a part of this Form 10-K:
See the Index to Consolidated Financial Statements included in Part II, Item 8 for a list of the financial statements included in this Form 10-K.
| (2) | Financial Statement Schedules |
See the end of Part II, Item 8 for Schedule II—Valuation and Qualifying Accounts. All other financial statement schedules are omitted because they are not required or are not applicable.
The exhibits listed in the Exhibit Index, which appears immediately following the signature page, are incorporated herein by reference.
88
SIGNATURES
Pursuant to the requirements of Section 13 or 15(d) of the Securities Exchange Act of 1934, the registrant has duly caused this report to be signed on its behalf by the undersigned, thereunto duly authorized.
| | | | | | |
| | | | EINSTEIN NOAH RESTAURANT GROUP, INC. |
| | | |
| Date: February 28, 2013 | | | | By: | | /S/ JEFFREY J. O’NEILL |
| | | | | | Jeffrey J. O’Neill President and Chief Executive Officer |
Pursuant to the requirements of the Securities Exchange Act of 1934, this report has been signed below by the following persons on behalf of the registrant and in the capacities indicated on February 28, 2013.
| | |
Signature | | Title |
| |
/S/ JEFFREY J. O’NEILL Jeffrey J. O’Neill | | President, Chief Executive Officer and Director (Principal Executive Officer) |
| |
/S/ EMANUEL P.N. HILARIO Emanuel P.N. Hilario | | Chief Financial Officer (Principal Financial Officer) |
| |
/S/ ROBERT E. GOWDY, JR. Robert E. Gowdy, Jr. | | Controller and Chief Accounting Officer (Principal Accounting Officer) |
| |
/S/ MICHAEL W. ARTHUR Michael W. Arthur | | Director |
| |
/S/ E. NELSON HEUMANN E. Nelson Heumann | | Director |
| |
/S/ FRANK C. MEYER Frank C. Meyer | | Director |
| |
/S/ EDNA K. MORRIS Edna K. Morris | | Director |
| |
/S/ THOMAS J. MUELLER Thomas J. Mueller | | Director |
| |
/S/ S. GARRETT STONEHOUSE, JR. S. Garrett Stonehouse, Jr. | | Director |
89
EXHIBIT INDEX
| | |
Exhibit
Number | | Description |
| |
| 3.1 | | Restated Certificate of Incorporation of Einstein Noah Restaurant Group, Inc. is hereby incorporated by reference to Exhibit 3.1 to the Company’s Annual Report on Form 10-K for the fiscal year ended January 1, 2008. |
| |
| 3.2 | | Fourth Amended By-Laws of Einstein Noah Restaurant Group, Inc. is hereby incorporated by reference to Exhibit 3.2 to the Company’s Current Report on Form 8-K filed November 7, 2011. |
| |
| 4.1 | | New World Restaurant Group, Inc. Certificate of Designation, Preferences and Rights of Series Z Preferred Stock is hereby incorporated by reference to Schedule 1 to Annex B to the Company’s Proxy Statement in respect of the 2003 Annual Meeting of Stockholders. |
| |
| 10.1+ | | 1994 Stock Plan is hereby incorporated by reference to the Company’s Registration Statement on Form SB-2 (33-95764). |
| |
| 10.2+ | | Directors’ Option Plan is hereby incorporated by reference to the Company’s Registration Statement on Form SB-2 (33-95764). |
| |
| 10.3A+ | | Executive Employee Incentive Plan is hereby incorporated by reference to Annex A to the Company’s Proxy Statement in respect of the 2005 Annual Meeting of Stockholders. |
| |
| 10.3B+ | | First Amendment to Executive Employee Incentive Plan is hereby incorporated by reference to Annex B to the Company’s Proxy Statement in respect of the 2005 Annual Meeting of Stockholders. |
| |
| 10.3C+ | | Third Amendment to the Executive Employee Incentive Plan is hereby incorporated by reference to Annex D to the Company’s Proxy Statement in respect of the 2007 Annual Meeting of Stockholders. |
| |
| 10.4A+ | | Einstein Noah Restaurant Group, Inc Equity Plan for Non-Employee Directors, effective May 3, 2011, is hereby incorporated by reference to Exhibit 10.1 to the Company’s Current Report on Form 8-K filed May 5, 2011. |
| |
| 10.4B+ | | Form of Restricted Stock/Restricted Stock Unit Agreement under the Einstein Noah Restaurant Group, Inc. Equity Plan for Non-Employee Directors is hereby incorporated by reference to Exhibit 10.8 to the Company’s Current Report on Form 8-K filed May 5, 2011. |
| |
| 10.5A+ | | Einstein Noah Restaurant Group, Inc. 2011 Omnibus Incentive Plan, effective May 3, 2011, is hereby incorporated by reference to Exhibit 10.2 to the Company’s Current Report on Form 8-K filed May 5, 2011. |
| |
| 10.5B+ | | Form of Restricted Stock Unit Agreement (Section 16 Participant) under the Einstein Noah Restaurant Group, Inc. 2011 Omnibus Incentive Plan is hereby incorporated by reference to Exhibit 10.3 to the Company’s Current Report on Form 8-K filed May 5, 2011. |
| |
| 10.5C+ | | Form of Restricted Stock Unit Agreement (Non-Section 16 Participant) under the Einstein Noah Restaurant Group, Inc. 2011 Omnibus Incentive Plan is hereby incorporated by reference to Exhibit 10.4 to the Company’s Current Report on Form 8-K filed May 5, 2011. |
| |
| 10.5D+ | | Form of Stock Option Agreement under the Einstein Noah Restaurant Group, Inc. 2011 Omnibus Incentive Plan is hereby incorporated by reference to Exhibit 10.5 to the Company’s Current Report on Form 8-K filed May 5, 2011. |
| |
| 10.5E+ | | Form of Notice of Restricted Stock Unit Grant under the Einstein Noah Restaurant Group, Inc. 2011 Omnibus Incentive Plan is hereby incorporated by reference to Exhibit 10.6 to the Company’s Current Report on Form 8-K filed May 5, 2011. |
| |
| 10.5F+ | | Form of Notice of Stock Option Grant under the Einstein Noah Restaurant Group, Inc. 2011 Omnibus Incentive Plan is hereby incorporated by reference to Exhibit 10.7 to the Company’s Current Report on Form 8-K filed May 5, 2011. |
90
| | |
Exhibit
Number | | Description |
| |
| 10.6A+ | | New World Restaurant Group, Inc. Stock Appreciation Rights Plan is hereby incorporated by reference to Exhibit 4.1 to the Company’s Registration Statement on Form S-8 filed February 20, 2007. |
| |
| 10.6B+ | | Form of Stock Appreciation Rights Agreement is hereby incorporated by reference to Exhibit 4.2 to the Company’s Registration Statement on Form S-8 filed February 20, 2007. |
| |
| 10.6C+ | | Amendments to Einstein Noah Restaurant Group, Inc. Stock Appreciation Rights Plan is hereby incorporated by reference to Exhibit 10.1 to the Company’s Quarterly Report on Form 10-Q for the quarter ended July 3, 2012. |
| |
| 10.7+ | | Einstein Noah Restaurant Group, Inc. Nonqualified Deferred Compensation Plan is hereby incorporated by reference to Exhibit 10.15 to the Company’s Annual Report on Form 10-K for the fiscal year ended January 1, 2008. |
| |
| 10.8+ | | Jeffrey J. O’Neill Offer of Employment dated December 3, 2008 is hereby incorporated by reference to Exhibit 10.17 to the Company’s Annual Report on Form 10-K for the fiscal year ended December 30, 2008. |
| |
| 10.9+ | | Brian L. Unger Offer of Employment dated February 14, 2011 is hereby incorporated by reference to Exhibit 10.1 to the Company’s Current Report on Form 8-K filed ended March 5, 2012. |
| |
| 10.10+ | | Emanuel P.N. Hilario Offer of Employment dated May 5, 2010 is hereby incorporated by reference to Exhibit 10.01 to the Company’s Current Report on Form 8-K filed May 10, 2010. |
| |
| 10.11+ | | Rhonda J. Parish Offer of Employment dated January 13, 2010 is hereby incorporated by reference to Exhibit 10.24 to the Company’s Annual Report on Form 10-K for the fiscal year ended December 28, 2010. |
| |
| 10.12 | | Approved Supplier Agreement dated as of November 30, 2006, by and among New World Restaurant Group, Inc., Einstein and Noah Corp., Manhattan Bagel Company, Inc., and Harlan Bagel Supply Company, LLC, and Harlan Bakeries, Inc. (Certain information contained in this exhibit has been omitted and filed separately with the Commission pursuant to a confidential treatment request under Rule 24b-2) is hereby incorporated by reference to Exhibit 10.8 to the Company’s Annual Report on Form 10-K for the fiscal year ended January 2, 2007. |
| |
| 10.13A* | | Amended and Restated Credit Agreement dated as of December 6, 2012, by and among the Registrant, with Bank of America, N.A., as Administrative Agent, and the Lenders named therein. |
| |
| 10.13B | | Guaranty and Security Agreement, dated as of December 20, 2010, by and among the Registrant, the Guarantors named therein and Bank of America, N.A. is hereby incorporated by reference to Exhibit 10.23 to the Company’s Annual Report on Form 10-K for the fiscal year ended December 28, 2010. |
| |
| 10.14+ | | Letter Agreement for Jeffrey J. O’Neill is hereby incorporated by reference to Exhibit 10.1 to the Company’s Current Report on Form 8-K filed May 3, 2012. |
| |
| 10.15+ | | Letter Agreement for Emanuel P.N. Hilario is hereby incorporated by reference to Exhibit 10.2 to the Company’s Current Report on Form 8-K filed May 3, 2012. |
| |
| 10.16+ | | Letter Agreement for Brian L. Unger is hereby incorporated by reference to Exhibit 10.3 to the Company’s Current Report on Form 8-K filed May 3, 2012. |
| |
| 10.17+ | | Letter Agreement for Rhonda J. Parish is hereby incorporated by reference to Exhibit 10.4 to the Company’s Current Report on Form 8-K filed May 3, 2012. |
| |
| 21* | | Subsidiaries of the Registrant |
| |
| 23* | | Consent of Grant Thornton LLP |
91
| | |
Exhibit
Number | | Description |
| |
| 31.1* | | Certification of Chief Executive Officer of the Registrant pursuant to Section 302 of the Sarbanes-Oxley Act of 2002, with respect to the Registrant’s Annual Report on Form 10-K for the year ended January 1, 2013. |
| |
| 31.2* | | Certification of Chief Financial Officer of the Registrant pursuant to Section 302 of the Sarbanes-Oxley Act of 2002, with respect to the Registrant’s Annual Report on Form 10-K for the year ended January 1, 2013. |
| |
| 32.1* | | Certifications by Chief Executive Officer, Chief Financial Officer, and Chief Accounting Officer pursuant to 18 U.S.C. Section 1350, as adopted pursuant to Section 906 of the Sarbanes-Oxley Act. |
| |
| 101** | | The following materials from the Annual Report on Form 10-K of Einstein Noah Restaurant Group, Inc. for the fiscal year ended January 1, 2013, formatted in XBRL (eXtensible Business Reporting Language): (i) the Consolidated Balance Sheets, (ii) the Consolidated Statements of Income and Comprehensive Income, (iii) the Consolidated Statements of Changes in Stockholders’ Equity, (iv) the Consolidated Statements of Cash Flows and (v) the Notes to Consolidated Financial Statements. |
| ** | Pursuant to Rule 406T of Regulation S-T, the Interactive Data Files on Exhibit 101 hereto are deemed not filed or part of a registration statement or prospectus for purposes of Sections 11 or 12 of the Securities Act of 1933, as amended, are deemed not filed for purposes of Section 18 of the Securities and Exchange Act of 1934, as amended, and otherwise are not subject to liability under those sections. |
92