| UNITED STATES |
| SECURITIES AND EXCHANGE COMMISSION |
| Washington, D.C. 20549 |
| |
FORM N-CSR |
| |
CERTIFIED SHAREHOLDER REPORT OF REGISTERED |
MANAGEMENT INVESTMENT COMPANIES |
| |
| |
| |
| Investment Company Act File Number: 811-07353 |
|
| |
| T. Rowe Price Corporate Income Fund, Inc. |
|
| (Exact name of registrant as specified in charter) |
| |
| 100 East Pratt Street, Baltimore, MD 21202 |
|
| (Address of principal executive offices) |
| |
| David Oestreicher |
| 100 East Pratt Street, Baltimore, MD 21202 |
|
| (Name and address of agent for service) |
| |
| |
| Registrant’s telephone number, including area code: (410) 345-2000 |
| |
| |
| Date of fiscal year end: May 31 |
| |
| |
| Date of reporting period: November 30, 2008 |
Item 1: Report to Shareholders| Corporate Income Fund | November 30, 2008 |
The views and opinions in this report were current as of November 30, 2008. They are not guarantees of performance or investment results and should not be taken as investment advice. Investment decisions reflect a variety of factors, and the managers reserve the right to change their views about individual stocks, sectors, and the markets at any time. As a result, the views expressed should not be relied upon as a forecast of the fund’s future investment intent. The report is certified under the Sarbanes-Oxley Act, which requires mutual funds and other public companies to affirm that, to the best of their knowledge, the information in their financial reports is fairly and accurately stated in all material respects.
REPORTS ON THE WEB
Sign up for our E-mail Program, and you can begin to receive updated fund reports and prospectuses online rather than through the mail. Log in to your account at troweprice.com for more information.
Manager’s Letter
Fellow Shareholders
Investors in corporate bonds suffered significant losses over the past six months in an environment that punished most segments of the fixed-income market except for the highest-quality securities. Against the backdrop of frozen credit markets and heightened risk aversion, investors sold higher-yielding securities in favor of U.S. Treasuries during the period. We are disappointed with the fund’s performance as professional investors and as fellow shareholders.
HIGHLIGHTS
• Corporate bonds suffered significant losses during the past six months in an environment that punished most segments of the fixed-income market except for the highest-quality securities.
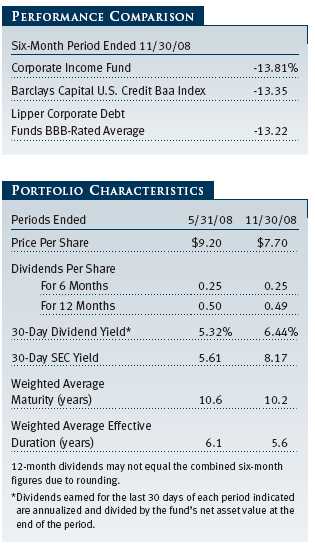
• The fund’s total return during the recent period was extremely disappointing and slightly trailed the performances of the benchmark index and the average for its Lipper peer group.
• Our higher-yielding bonds and our holdings in Lehman Brothers, which we have since eliminated from the portfolio, hampered the fund’s relative results. We have been adding to high-quality offerings with compelling yields in the new issues market.
• While it is possible that credit spreads may continue to widen in the months ahead, we anticipate that the current market dislocations will create opportunities to invest in bonds of solid companies trading below fair, fundamental value.
MARKET ENVIRONMENT
The stagnating economy has clearly deflated any lingering concerns about inflation and partially offset the negative impact of rising unemployment, slower income growth, declining asset prices, and tight credit conditions. A disinflationary trend is likely to unfold in the months ahead, and outright deflation (broad-based price declines), which we have not experienced in at least 60 years, cannot be ruled out. Against this backdrop, the Department of Labor reported that new claims for unemployment benefits soared to a 16-year high at the end of the period, reinforcing earlier signs of a rapidly weakening job market. U.S. employers cut 533,000 jobs from the nation’s payrolls in November, the largest monthly job loss in 34 years, propelling the unemployment rate from 6.5% in October to 6.7%, a 15-year high. According to the National Bureau of Economic Research, the U.S. has been in a recession since December 2007, making official what most Americans have already believed about the state of the economy.
In an attempt to boost liquidity, encourage borrowing by financial institutions, and thaw the frozen credit markets, the Federal Reserve created several unusual credit facilities and took other extraordinary actions—often in tandem with the Treasury Department, the FDIC, and the central banks of other nations. The Fed also reduced the federal funds target rate from 2.00% to 1.00% with two half-point rate cuts in October. Many central banks around the world have been reducing short-term rates as well, as the effects of the U.S. credit crunch have caused a significant global economic slowdown. (On December 16, 2008, after the end of our reporting period, the Fed dropped the federal funds rate to a range of 0% to 0.25%, the lowest rate ever.)

U.S. Treasury yields declined across all maturities, but interest rates of most other fixed-income securities increased as investors shunned assets that have some degree of credit risk. (Bond prices and interest rates move in opposite directions.) Treasuries performed best, while other securities backed by the full faith and credit of the U.S. government, such as Ginnie Mae mortgage-backed securities, produced milder gains. Asset-backed securities, which are backed by credit card, auto loan, or other debt payments, and investment-grade corporate bonds, fell sharply. High-yield bonds plunged as credit spreads widened to record levels amid fears of significant defaults, particularly from automakers.
PERFORMANCE
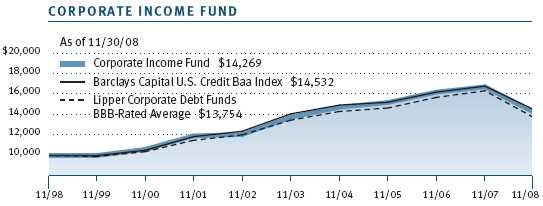
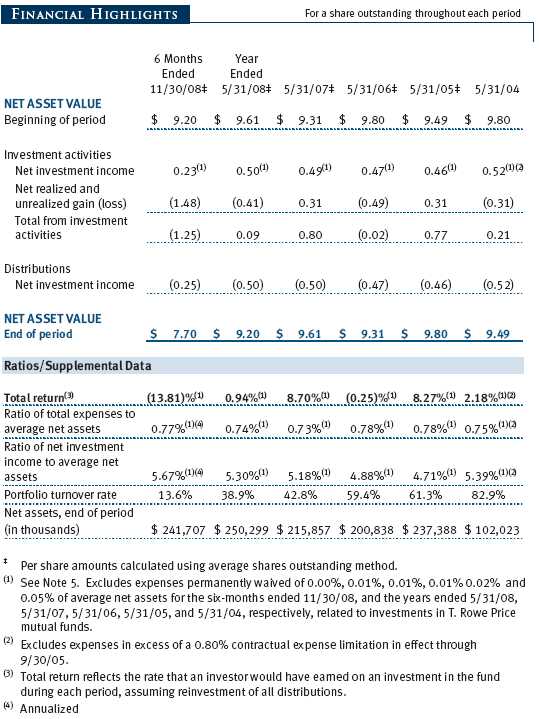
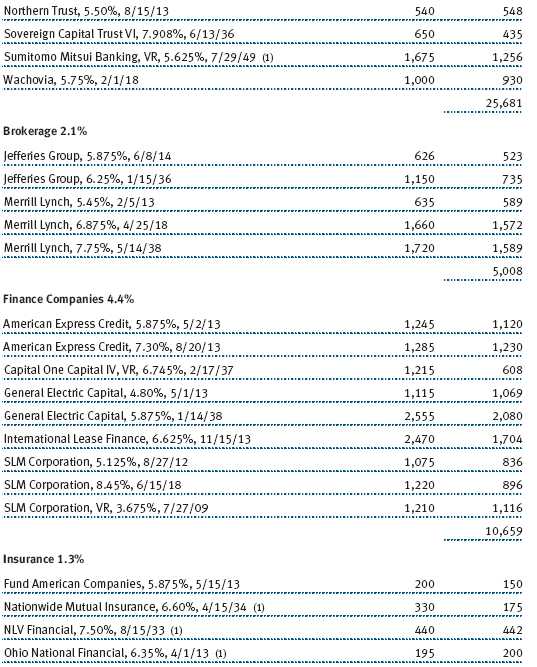
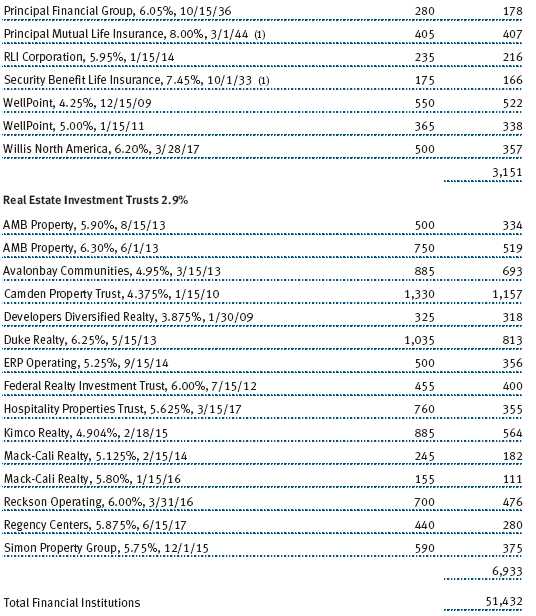
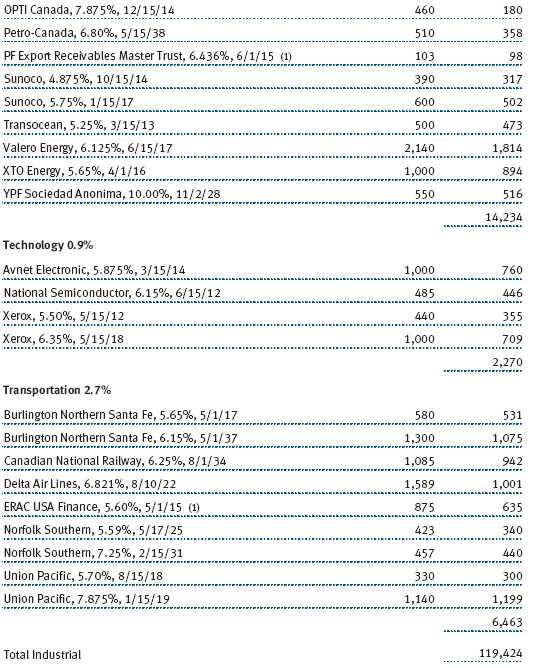
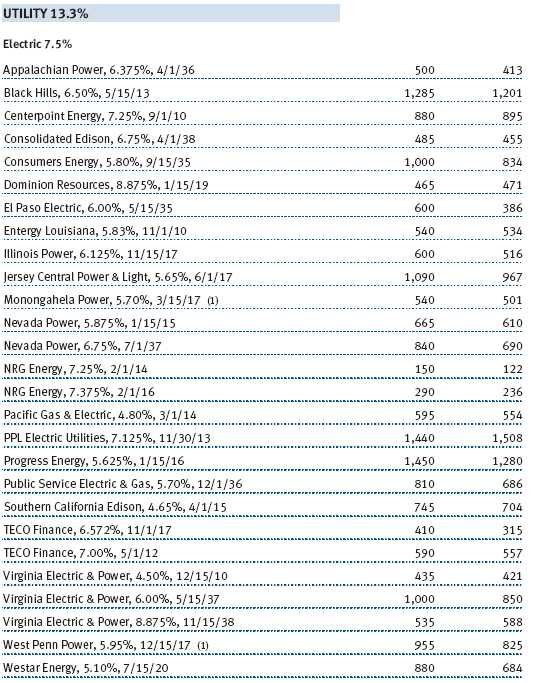
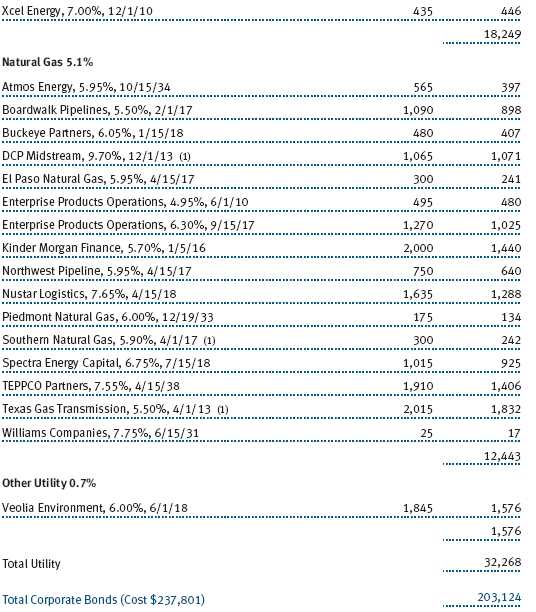
During the six-month period ended November 30, 2008, your fund generated a double-digit loss that was slightly behind the returns of both the Barclays Capital U.S. Credit Baa Index (formerly the Lehman Brothers U.S. Credit Baa Index) and the Lipper peer group average. The shortfall versus the benchmarks was primarily due to our exposure to Lehman Brothers bonds, which we have since eliminated from the portfolio, and to our allocation of higher-yielding bonds, which underperformed higher-quality segments of the market. The fund’s net asset value fell from $9.20 at the end of May to $7.70 at the end of November, while dividends contributed $0.25 per share to the total return. The 30-day SEC yield increased from 5.61% to 8.17% during the period. (Please refer to our portfolio of investments for a complete listing of fund holdings and the amount each represents in the portfolio.)
The period under review was extremely challenging for the financial markets. In the month of September alone, we witnessed dramatic changes in seven major U.S.-based financial institutions—beginning with the federal government’s takeover of Fannie Mae and Freddie Mac on Sunday, September 7, and ending with the announced sale of Wachovia Corporation on Monday, September 29. In each situation, the outcome for bondholders was difficult to anticipate. In the case of Lehman Brothers, investors were shocked that the company, which was seeking a stronger partner on a Friday, was forced to file for bankruptcy protection by early Monday morning. The speed at which events unfolded was unprecedented and framed by very different outcomes for Merrill Lynch and AIG immediately thereafter.
Aside from our Lehman Brothers holdings, our overweight allocation to banking detracted from your fund’s relative performance, as did our exposure to higher-yielding securities, which are not held in the benchmark index. The spread between the yields of lower-quality bonds and Treasury yields expanded to an all-time high during the period due to the absence of broker-dealer support, the lack of appetite for risk, and the prospects for rising defaults in 2009. The uncertainty regarding the fate of the big three U.S. auto manufacturers also weighed on this sector. During the past six months, we reduced our exposure to this segment of the market and shifted our focus to higher-rated securities.
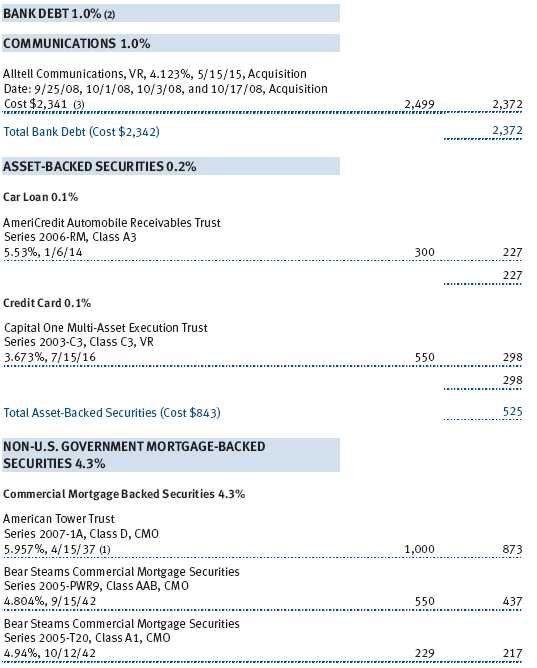
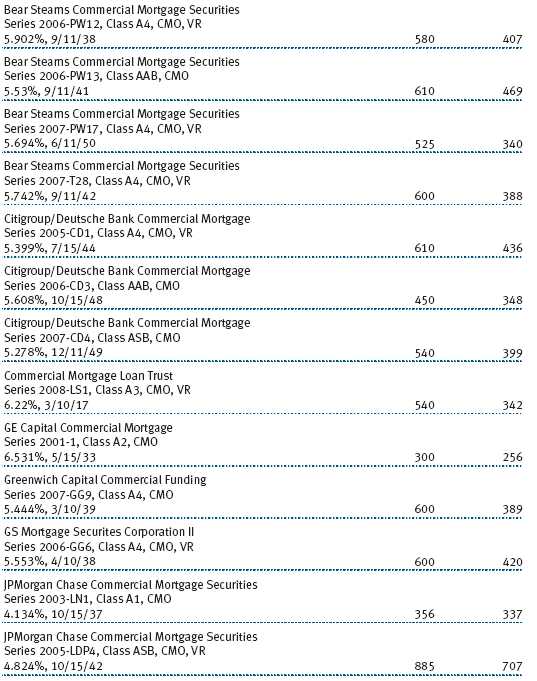
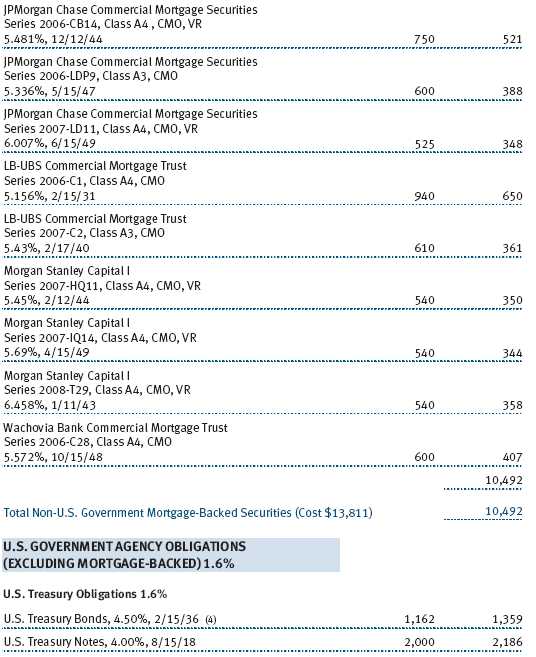
Our commercial mortgage-backed securities (CMBS) also hindered the fund’s relative performance. October and November were particularly dismal months for the CMBS sector. Their yield spreads versus Treasuries reached record levels when concerns about increasing defaults on loans secured by commercial properties began to mount. Additionally, the announcement that funds from the government’s Troubled Asset Relief Program (TARP) would not be used for the direct purchase of securities from financial institutions negatively impacted the CMBS sector. However, while our exposure to CMBS hurt overall performance, our focus on the highest-quality segment of this market did contribute positively to relative returns.
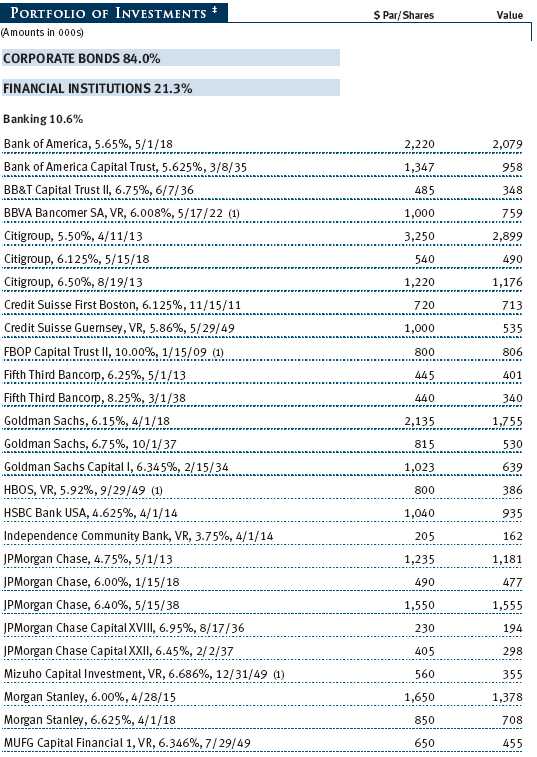
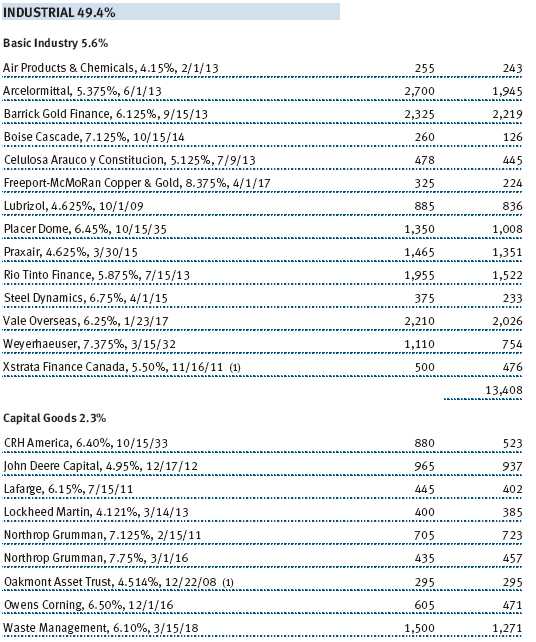
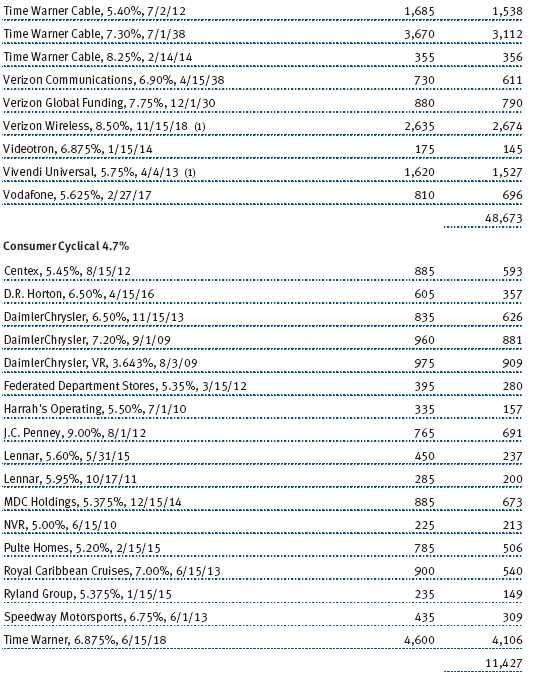
At the end of the period, we were overweight in the financials sector versus our benchmark index, with a specific focus on large, bellwether banking names, but we remain vigilant as new developments unfold. The portfolio is underweight in the industrials sector, particularly regarding consumer-related industries, and underweight in the consumer cyclical sector. Specifically, we trimmed exposure to the high-yield gaming company Harrah’s, and we eliminated exposure to Viacom in the broadcasting industry because we believe both companies will suffer from weak consumer demand. At the same time, we added to high-quality bonds in consumer noncyclicals and communications, which we expect will weather the economic downturn. In October, we bought a new A rated bond issued by IBM that came to the primary market at an attractive discount in the midst of volatile market conditions. The bond is part of our strategy of adding to high-quality securities with compelling yields in the new issues market. In November, we purchased a new bond from Verizon, an A rated wireless communications issue that was also offered at an attractive discount.
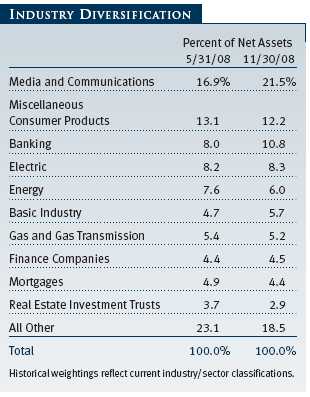
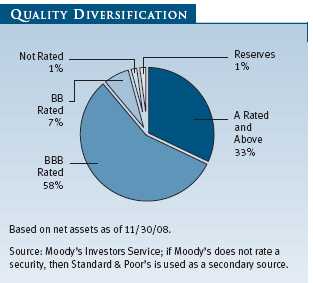
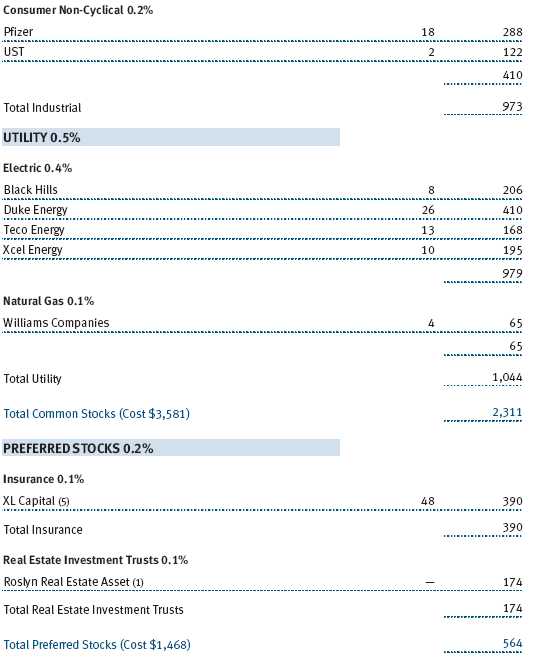
At the end of November, 58% of the portfolio was invested in bonds rated BBB, and 33% was allocated to bonds rated A and higher (a total of 91% in investment-grade credits). The balance of the portfolio was diversified among BB, B, and other securities. Media and communications composed 21.5% of the portfolio, miscellaneous consumer products 12.2%, banking 10.8%, electric utilities 8.3%, and the balance was allocated among a broad range of sectors including energy, basic industry, gas and gas transmission, finance companies, mortgages, and other groups.
OUTLOOK
Recent regulatory actions coupled with industry consolidation have quickly altered the global financial landscape. We anticipate that this trend will continue as TARP is implemented over time. While the bold actions recently taken by the Federal Reserve and U.S. Treasury are encouraging, there is still a significant risk that the current economic slowdown will further impair cyclical businesses. It is possible that credit spreads may continue to move wider as a result. However, we anticipate that the current market dislocations will create opportunities to invest in the bonds of solid companies trading below fair, fundamental value.
Our outlook for the investment-grade corporate market is cautious, and our experienced team will remain committed to the risk-conscious, fundamental investment approach and long-term perspective that have helped us weather volatile market conditions in the past.
As always, our mission remains constant as we keep a vigilant eye on the economic environment and attempt to identify appealing investment opportunities within our segment of the bond market.
Thank you for investing with T. Rowe Price.
Respectfully submitted,

David A. Tiberii
Chairman of the fund’s Investment Advisory Committee
December 16, 2008
The committee chairman has day-to-day responsibility for managing the portfolio and works with committee members in developing and executing the fund’s investment program.
RISKS OF FIXED-INCOME INVESTING
Bonds are subject to interest rate risk (the decline in bond prices that usually accompanies a rise in interest rates) and credit risk (the chance that any fund holding could have its credit rating downgraded or that a bond issuer will default by failing to make timely payments of interest or principal), potentially reducing the fund’s income level and share price. High-yield corporate bonds could have greater price declines than funds that invest primarily in high-quality bonds. Companies issuing high-yield bonds are not as strong financially as those with higher credit ratings, so the bonds are usually considered speculative investments.
GLOSSARY
30-day SEC yield: A method of calculating a fund’s yield that assumes all portfolio securities are held until maturity. The Securities and Exchange Commission (SEC) requires all bond funds to calculate this yield. Yield will vary and is not guaranteed.
Average maturity: The weighted average of the stated maturity dates of the portfolio’s securities. In general, the longer the average maturity, the greater the fund’s sensitivity to interest rate changes. A shorter average maturity usually means less interest rate sensitivity and, therefore, a less volatile portfolio.
Barclays Capital U.S. Credit Baa Index: A measure of corporate and noncorporate fixed-income securities that are rated investment grade (Baa by Moody’s Investors Service and BBB by Standard & Poor’s) and have at least 10 years to final maturity.
Duration: A measure of a bond fund’s sensitivity to changes in interest rates. For example, a fund with a duration of six years would fall about 6% in price in response to a one-percentage-point rise in interest rates, and vice versa.
Lipper averages: The averages of available mutual fund performance returns for specified time periods in defined categories as tracked by Lipper Inc.
Performance and Expenses
This chart shows the value of a hypothetical $10,000 investment in the fund over the past 10 fiscal year periods or since inception (for funds lacking 10-year records). The result is compared with benchmarks, which may include a broad-based market index and a peer group average or index. Market indexes do not include expenses, which are deducted from fund returns as well as mutual fund averages and indexes.
| AVERAGE ANNUAL COMPOUND TOTAL RETURN |
This table shows how the fund would have performed each year if its actual (or cumulative) returns for the periods shown had been earned at a constant rate.

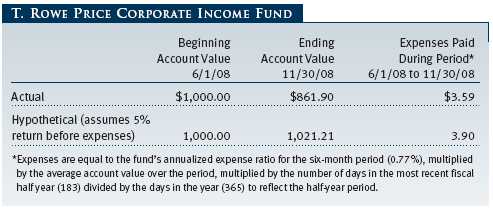
As a mutual fund shareholder, you may incur two types of costs: (1) transaction costs, such as redemption fees or sales loads, and (2) ongoing costs, including management fees, distribution and service (12b-1) fees, and other fund expenses. The following example is intended to help you understand your ongoing costs (in dollars) of investing in the fund and to compare these costs with the ongoing costs of investing in other mutual funds. The example is based on an investment of $1,000 invested at the beginning of the most recent six-month period and held for the entire period.
Actual Expenses
The first line of the following table (“Actual”) provides information about actual account values and expenses based on the fund’s actual returns. You may use the information in this line, together with your account balance, to estimate the expenses that you paid over the period. Simply divide your account value by $1,000 (for example, an $8,600 account value divided by $1,000 = 8.6), then multiply the result by the number in the first line under the heading “Expenses Paid During Period” to estimate the expenses you paid on your account during this period.
Hypothetical Example for Comparison Purposes
The information on the second line of the table (“Hypothetical”) is based on hypothetical account values and expenses derived from the fund’s actual expense ratio and an assumed 5% per year rate of return before expenses (not the fund’s actual return). You may compare the ongoing costs of investing in the fund with other funds by contrasting this 5% hypothetical example and the 5% hypothetical examples that appear in the shareholder reports of the other funds. The hypothetical account values and expenses may not be used to estimate the actual ending account balance or expenses you paid for the period.
Note: T. Rowe Price charges an annual small-account maintenance fee of $10, generally for accounts with less than $2,000 ($500 for UGMA/UTMA). The fee is waived for any investor whose T. Rowe Price mutual fund accounts total $25,000 or more, accounts employing automatic investing, and IRAs and other retirement plan accounts that utilize a prototype plan sponsored by T. Rowe Price (although a separate custodial or administrative fee may apply to such accounts). This fee is not included in the accompanying table. If you are subject to the fee, keep it in mind when you are estimating the ongoing expenses of investing in the fund and when comparing the expenses of this fund with other funds.
You should also be aware that the expenses shown in the table highlight only your ongoing costs and do not reflect any transaction costs, such as redemption fees or sales loads. Therefore, the second line of the table is useful in comparing ongoing costs only and will not help you determine the relative total costs of owning different funds. To the extent a fund charges transaction costs, however, the total cost of owning that fund is higher.

Unaudited
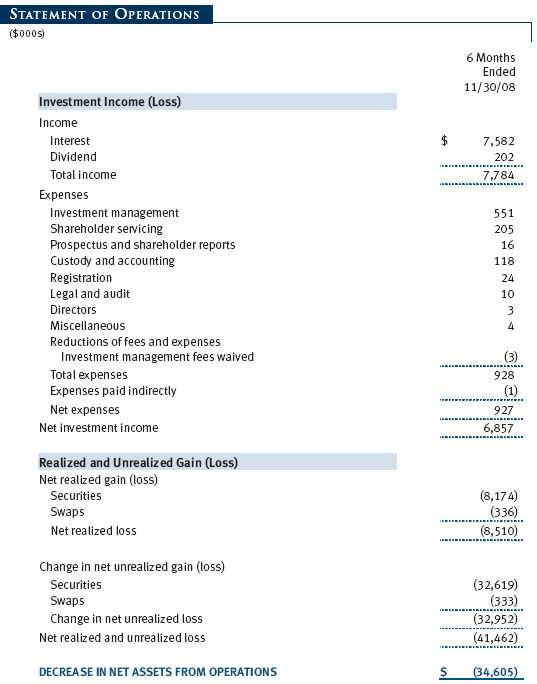
The accompanying notes are an integral part of these financial statements.
Unaudited


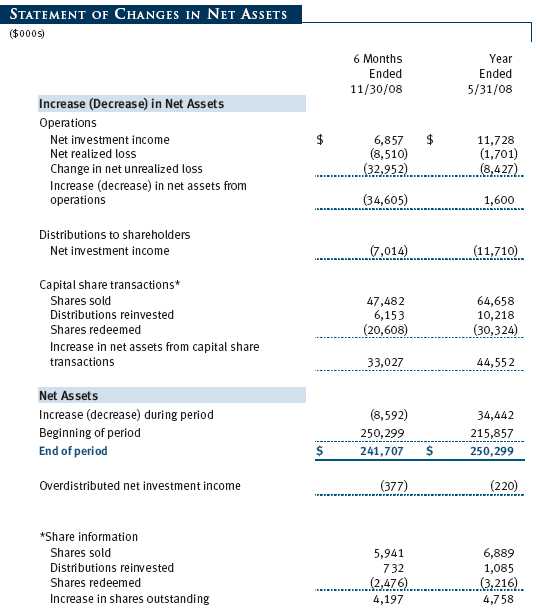
The accompanying notes are an integral part of these financial statements.
Unaudited
The accompanying notes are an integral part of these financial statements.
Unaudited
The accompanying notes are an integral part of these financial statements.
Unaudited
The accompanying notes are an integral part of these financial statements.
Unaudited
| NOTES TO FINANCIAL STATEMENTS |
T. Rowe Price Corporate Income Fund, Inc. (the fund), is registered under the Investment Company Act of 1940 (the 1940 Act) as a diversified, open-end management investment company. The fund commenced operations on October 31, 1995. The fund seeks to provide high income and some capital growth.
NOTE 1 - SIGNIFICANT ACCOUNTING POLICIES
Basis of Preparation The accompanying financial statements were prepared in accordance with accounting principles generally accepted in the United States of America, which require the use of estimates made by fund management. Fund management believes that estimates and security valuations are appropriate; however, actual results may differ from those estimates, and the security valuations reflected in the financial statements may differ from the value the fund ultimately realizes upon sale of the securities.
Investment Transactions, Investment Income, and Distributions Income and expenses are recorded on the accrual basis. Premiums and discounts on debt securities are amortized for financial reporting purposes. Dividends received from mutual fund investments are reflected as dividend income; capital gain distributions are reflected as realized gain/loss. Dividend income and capital gain distributions are recorded on the ex-dividend date. Income tax-related interest and penalties, if incurred, would be recorded as income tax expense. Investment transactions are accounted for on the trade date. Realized gains and losses are reported on the identified cost basis. Net periodic receipts or payments required by swaps are accrued daily and recorded as realized gain or loss in the accompanying financial statements. Fluctuations in the fair value of swaps are reflected in the change in net unrealized gain or loss and are reclassified to realized gain or loss upon termination prior to maturity or cash settlement. Paydown gains and losses are recorded as an adjustment to interest income. Distributions to shareholders are recorded on the ex-dividend date. Income distributions are declared on a daily basis and paid monthly. Capital gain distributions, if any, are declared and paid by the fund, typically on an annual basis.
Credits The fund earns credits on temporarily uninvested cash balances at the custodian that reduce the fund’s custody charges. Custody expense in the accompanying financial statements is presented before reduction for credits, which are reflected as expenses paid indirectly.
New Accounting Pronouncements On June 1, 2008, the fund adopted Statement of Financial Accounting Standards No. 157 (FAS 157), Fair Value Measurements. FAS 157 defines fair value, establishes the framework for measuring fair value, and expands the disclosures of fair value measurements in the financial statements. Adoption of FAS 157 did not have a material impact on the fund’s net assets or results of operations.
In March 2008, the Financial Accounting Standards Board issued Statement of Financial Accounting Standards No. 161 (FAS 161), Disclosures about Derivative Instruments and Hedging Activities, which is effective for fiscal years and interim periods beginning after November 15, 2008. FAS 161 requires enhanced disclosures about derivative and hedging activities, including how such activities are accounted for and their effect on financial position, performance and cash flows. Management is currently evaluating the impact the adoption of FAS 161 will have on the fund’s financial statements and related disclosures.
NOTE 2 - VALUATION
The fund’s investments are reported at fair value as defined under FAS 157. The fund values its investments and computes its net asset value per share at the close of the New York Stock Exchange (NYSE), normally 4 p.m. ET, each day that the NYSE is open for business.
Valuation Methods Debt securities are generally traded in the over-the-counter (OTC) market. Securities with remaining maturities of one year or more at the time of acquisition are valued at prices furnished by dealers who make markets in such securities or by an independent pricing service, which considers the yield or price of bonds of comparable quality, coupon, maturity, and type, as well as prices quoted by dealers who make markets in such securities. Securities with remaining maturities of less than one year at the time of acquisition generally use amortized cost in local currency to approximate fair value. However, if amortized cost is deemed not to reflect fair value or the fund holds a significant amount of such securities with remaining maturities of more than 60 days, the securities are valued at prices furnished by dealers who make markets in such securities or by an independent pricing service.
Equity securities listed or regularly traded on a securities exchange or in the OTC market are valued at the last quoted sale price or, for certain markets, the official closing price at the time the valuations are made, except for OTC Bulletin Board securities, which are valued at the mean of the latest bid and asked prices. A security that is listed or traded on more than one exchange is valued at the quotation on the exchange determined to be the primary market for such security. Listed securities not traded on a particular day are valued at the mean of the latest bid and asked prices for domestic securities and the last quoted sale price for international securities.
Investments in mutual funds are valued at the mutual fund’s closing net asset value per share on the day of valuation. Swaps are valued at prices furnished by independent swap dealers or by an independent pricing service.
Other investments, including restricted securities, and those for which the above valuation procedures are inappropriate or are deemed not to reflect fair value are stated at fair value as determined in good faith by the T. Rowe Price Valuation Committee, established by the fund’s Board of Directors.
Valuation Inputs Various inputs are used to determine the value of the fund’s investments. These inputs are summarized in the three broad levels listed below:
Level 1 – quoted prices in active markets for identical securities
Level 2 – observable inputs other than Level 1 quoted prices (including, but not limited to, quoted prices for similar securities, interest rates, prepayment speeds, credit risk)
Level 3 – unobservable inputs
Observable inputs are those based on market data obtained from sources independent of the fund, and unobservable inputs reflect the fund’s own assumptions based on the best information available. The input levels are not necessarily an indication of the risk or liquidity associated with investments at that level. The following table summarizes the fund’s investments, based on the inputs used to determine their values on November 30, 2008:

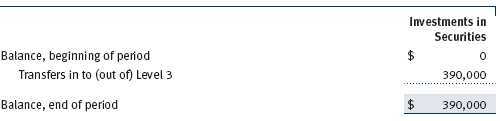
Following is a reconciliation of the fund’s Level 3 investments for the six months ended November 30, 2008:
NOTE 3 - INVESTMENT TRANSACTIONS
Consistent with its investment objective, the fund engages in the following practices to manage exposure to certain risks or to enhance performance. The investment objective, policies, program, and risk factors of the fund are described more fully in the fund’s prospectus and Statement of Additional Information.
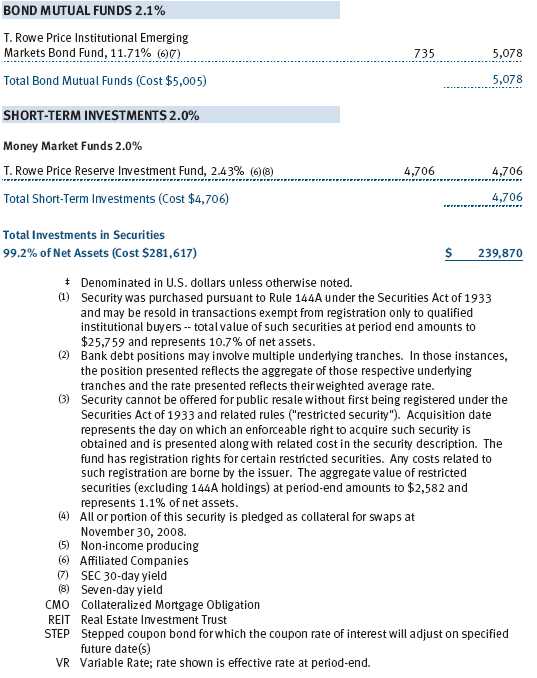
Restricted Securities The fund may invest in securities that are subject to legal or contractual restrictions on resale. Prompt sale of such securities at an acceptable price may be difficult and may involve substantial delays and additional costs.
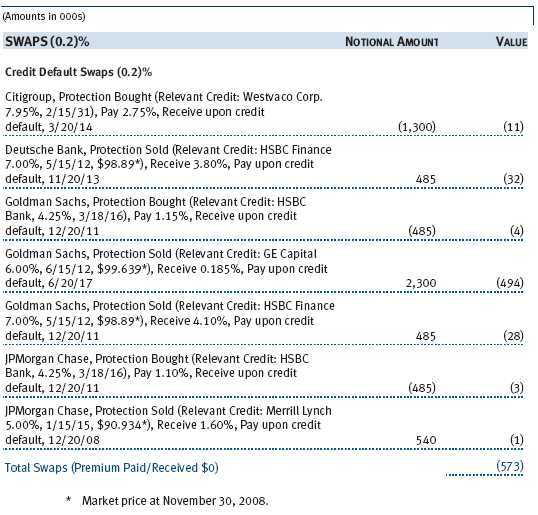
Credit Default Swaps During the six months ended November 30, 2008, the fund was a party to credit default swaps. The fund may use swaps in an effort to manage exposure to changes in credit quality, to adjust overall exposure to certain markets, to enhance total return or protect the value of portfolio securities, to serve as a cash management tool, and/or to adjust portfolio duration or credit exposure. Credit default swaps are agreements where one party (the protection buyer) will make periodic payments to another party (the protection seller) in exchange for protection against specified credit events, such as certain defaults and bankruptcies related to an underlying credit instrument or issuer thereof. Upon occurrence of a specified credit event, the protection seller is required to pay the buyer the difference between the notional amount of the swap and the value of the underlying credit, either in the form of a net cash settlement or by paying the gross notional amount and accepting delivery of the relevant underlying credit. Generally, the payment risk for the seller of protection is inversely related to the current market price of the underlying credit; t herefore, the payment risk increases as the price of the relevant underlying credit declines due to market valuations of credit quality. At November 30, 2008, the notional amount of protection sold by the fund totaled $3,810,000 (1.6% of net assets), which reflects the maximum potential amount the fund could be required to pay under such contracts. Risks related to the use of credit default swaps include the possible inability of the fund to accurately assess the current and future creditworthiness of underlying issuers and the possible failure of a counterparty to perform in accordance with the terms of the swap agreements.
Collateral Agreements The fund has entered collateral agreements with certain counterparties to mitigate counterparty risk on over-the-counter derivatives, including swaps and forward currency exchange contracts. Subject to established minimum levels, collateral is generally determined based on the net aggregate unrealized gain or loss on contracts with a particular counterparty. Collateral pledged to the fund is held in a segregated account by a third-party agent and can be in the form of cash or debt securities issued by the U.S. government or related agencies; collateral posted by the fund is noted in the accompanying Portfolio of Investments. As of November 30, 2008, no collateral was pledged by counterparties for the benefit of the fund and securities valued at $479,000 had been posted by the fund for the benefit of counterparties.
Other Purchases and sales of portfolio securities, other than short-term and U.S. government securities, aggregated $61,874,000 and $28,627,000, respectively, for the six months ended November 30, 2008. Purchases and sales of U.S. government securities aggregated $3,236,000 and $3,180,000, respectively, for the six months ended November 30, 2008.
NOTE 4 - FEDERAL INCOME TAXES
No provision for federal income taxes is required since the fund intends to continue to qualify as a regulated investment company under Subchapter M of the Internal Revenue Code and distribute to shareholders all of its taxable income and gains. Distributions are determined in accordance with Federal income tax regulations, which differ from generally accepted accounting principles, and, therefore, may differ in amount or character from net investment income and realized gains for financial reporting purposes. Financial reporting records are adjusted for permanent book/tax differences to reflect tax character but are not adjusted for temporary differences. The amount and character of tax-basis distributions and composition of net assets are finalized at fiscal year-end; accordingly, tax-basis balances have not been determined as of November 30, 2008.
In accordance with federal tax regulations, the fund deferred recognition of certain capital loss amounts previously recognized in the prior fiscal year for financial reporting purposes until the current fiscal period for tax purposes. Such deferrals amounted to $908,000 and related to net capital losses realized between November 1 and the fund’s fiscal year-end date. Further, the fund intends to retain realized gains to the extent of available capital loss carryforwards. As of May 31, 2008 the fund had $5,037,000 of unused capital loss carryforwards, of which $492,000 expire in fiscal 2009, $2,666,000 expire in fiscal 2011, $1,017,000 expire in fiscal 2015, and $862,000 expire in fiscal 2016.
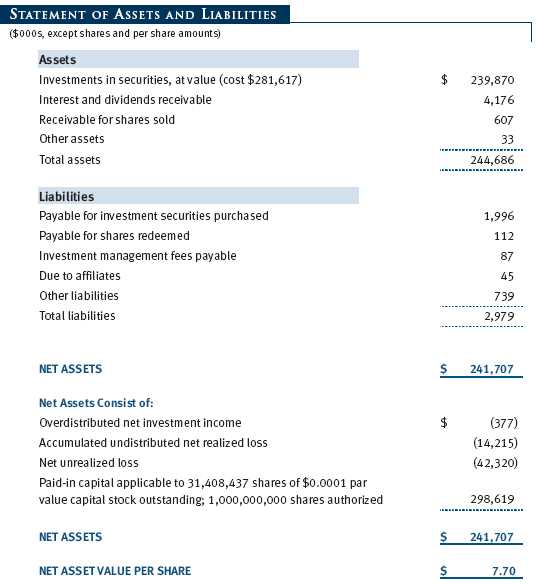
At November 30, 2008, the cost of investments for federal income tax purposes was $281,617,000. Net unrealized loss aggregated $42,320,000 at period-end, of which $1,269,000 related to appreciated investments and $43,589,000 related to depreciated investments.
NOTE 5 - RELATED PARTY TRANSACTIONS
The fund is managed by T. Rowe Price Associates, Inc. (the manager or Price Associates), a wholly owned subsidiary of T. Rowe Price Group, Inc. The investment management agreement between the fund and the manager provides for an annual investment management fee, which is computed daily and paid monthly. The fee consists of an individual fund fee, equal to 0.15% of the fund’s average daily net assets, and a group fee. The group fee rate is calculated based on the combined net assets of certain mutual funds sponsored by Price Associates (the group) applied to a graduated fee schedule, with rates ranging from 0.48% for the first $1 billion of assets to 0.285% for assets in excess of $220 billion. The fund’s group fee is determined by applying the group fee rate to the fund’s average daily net assets. At November 30, 2008, the effective annual group fee rate was 0.31%.
In addition, the fund has entered into service agreements with Price Associates and two wholly owned subsidiaries of Price Associates (collectively, Price). Price Associates computes the daily share price and provides certain other administrative services to the fund. T. Rowe Price Services, Inc., provides shareholder and administrative services in its capacity as the fund’s transfer and dividend disbursing agent. T. Rowe Price Retirement Plan Services, Inc., provides subaccounting and recordkeeping services for certain retirement accounts invested in the fund. For the six months ended November 30, 2008, expenses incurred pursuant to these service agreements were $86,000 for Price Associates, $65,000 for T. Rowe Price Services, Inc., and $2,000 for T. Rowe Price Retirement Plan Services, Inc. The total amount payable at period-end pursuant to these service agreements is reflected as Due to Affiliates in the accompanying financial statements.
The fund is also one of several mutual funds sponsored by Price Associates (underlying Price funds) in which the T. Rowe Price Spectrum Funds (Spectrum Funds) may invest. The Spectrum Funds do not invest in the underlying Price funds for the purpose of exercising management or control. Pursuant to a special servicing agreement, expenses associated with the operation of the Spectrum Funds are borne by each underlying Price fund to the extent of estimated savings to it and in proportion to the average daily value of its shares owned by the Spectrum Funds.
Expenses allocated under this agreement are reflected as shareholder servicing expense in the accompanying financial statements. For the six months ended November 30, 2008, the fund was allocated $107,000 of Spectrum Funds’ expenses, of which $81,000 related to services provided by Price. The amount payable at period-end pursuant to this agreement is reflected as Due to Affiliates in the accompanying financial statements. At November 30, 2008, approximately 53% of the outstanding shares of the fund were held by the Spectrum Funds.
The fund may invest in the T. Rowe Price Reserve Investment Fund and the T. Rowe Price Government Reserve Investment Fund (collectively, the T. Rowe Price Reserve Investment Funds), open-end management investment companies managed by Price Associates and considered affiliates of the fund. The T. Rowe Price Reserve Investment Funds are offered as cash management options to mutual funds, trusts, and other accounts managed by Price Associates and/or its affiliates and are not available for direct purchase by members of the public. The T. Rowe Price Reserve Investment Funds pay no investment management fees.
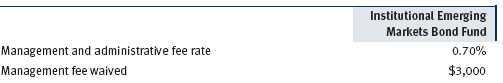
The fund may also invest in certain T. Rowe Price institutional funds (underlying institutional funds) as a means of gaining efficient and cost-effective exposure to certain markets. The underlying institutional funds are open-end management investment companies managed by Price Associates and/or T. Rowe Price International, Inc. (collectively, the Price managers) and are considered affiliates of the fund. Each underlying institutional fund pays an all-inclusive management and administrative fee to its Price manager. To ensure that the fund does not incur duplicate fees, each Price manager has agreed to permanently waive a portion of its management fee charged to the fund in an amount sufficient to fully offset the fees paid by the underlying institutional funds related to fund assets invested therein. Accordingly, the accompanying Statement of Operations includes management fees permanently waived pursuant to this agreement. Annual fee rates and amounts waived within the accompanying Statement of Operations related to shares of the underlying institutional funds for the six months ended November 30, 2008 are as follows:
| INFORMATION ON PROXY VOTING POLICIES, PROCEDURES, AND RECORDS |
A description of the policies and procedures used by T. Rowe Price funds and portfolios to determine how to vote proxies relating to portfolio securities is available in each fund’s Statement of Additional Information, which you may request by calling 1-800-225-5132 or by accessing the SEC’s Web site, www.sec.gov. The description of our proxy voting policies and procedures is also available on our Web site, www.troweprice.com. To access it, click on the words “Our Company” at the top of our corporate homepage. Then, when the next page appears, click on the words “Proxy Voting Policies” on the left side of the page.
Each fund’s most recent annual proxy voting record is available on our Web site and through the SEC’s Web site. To access it through our Web site, follow the directions above, then click on the words “Proxy Voting Records” on the right side of the Proxy Voting Policies page.
| HOW TO OBTAIN QUARTERLY PORTFOLIO HOLDINGS |
The fund files a complete schedule of portfolio holdings with the Securities and Exchange Commission for the first and third quarters of each fiscal year on Form N-Q. The fund’s Form N-Q is available electronically on the SEC’s Web site (www.sec.gov); hard copies may be reviewed and copied at the SEC’s Public Reference Room, 450 Fifth St. N.W., Washington, DC 20549. For more information on the Public Reference Room, call 1-800-SEC-0330.
Item 2. Code of Ethics.
A code of ethics, as defined in Item 2 of Form N-CSR, applicable to its principal executive officer, principal financial officer, principal accounting officer or controller, or persons performing similar functions is filed as an exhibit to the registrant’s annual Form N-CSR. No substantive amendments were approved or waivers were granted to this code of ethics during the registrant’s most recent fiscal half-year.
Item 3. Audit Committee Financial Expert.
Disclosure required in registrant’s annual Form N-CSR.
Item 4. Principal Accountant Fees and Services.
Disclosure required in registrant’s annual Form N-CSR.
Item 5. Audit Committee of Listed Registrants.
Not applicable.
Item 6. Investments.
(a) Not applicable. The complete schedule of investments is included in Item 1 of this Form N-CSR.
(b) Not applicable.
Item 7. Disclosure of Proxy Voting Policies and Procedures for Closed-End Management Investment Companies.
Not applicable.
Item 8. Portfolio Managers of Closed-End Management Investment Companies.
Not applicable.
Item 9. Purchases of Equity Securities by Closed-End Management Investment Company and Affiliated Purchasers.
Not applicable.
Item 10. Submission of Matters to a Vote of Security Holders.
Not applicable.
Item 11. Controls and Procedures.
(a) The registrant’s principal executive officer and principal financial officer have evaluated the registrant’s disclosure controls and procedures within 90 days of this filing and have concluded that the registrant’s disclosure controls and procedures were effective, as of that date, in ensuring that information required to be disclosed by the registrant in this Form N-CSR was recorded, processed, summarized, and reported timely.
(b) The registrant’s principal executive officer and principal financial officer are aware of no change in the registrant’s internal control over financial reporting that occurred during the registrant’s second fiscal quarter covered by this report that has materially affected, or is reasonably likely to materially affect, the registrant’s internal control over financial reporting.
Item 12. Exhibits.
(a)(1) The registrant’s code of ethics pursuant to Item 2 of Form N-CSR is filed with the registrant’s annual Form N-CSR.
(2) Separate certifications by the registrant's principal executive officer and principal financial officer, pursuant to Section 302 of the Sarbanes-Oxley Act of 2002 and required by Rule 30a-2(a) under the Investment Company Act of 1940, are attached.
(3) Written solicitation to repurchase securities issued by closed-end companies: not applicable.
(b) A certification by the registrant's principal executive officer and principal financial officer, pursuant to Section 906 of the Sarbanes-Oxley Act of 2002 and required by Rule 30a-2(b) under the Investment Company Act of 1940, is attached.
| | |
SIGNATURES |
| |
| | Pursuant to the requirements of the Securities Exchange Act of 1934 and the Investment |
| Company Act of 1940, the registrant has duly caused this report to be signed on its behalf by the |
| undersigned, thereunto duly authorized. |
| |
| T. Rowe Price Corporate Income Fund, Inc. |
| |
| |
| |
| By | /s/ Edward C. Bernard |
| | Edward C. Bernard |
| | Principal Executive Officer |
| |
| Date | January 15, 2009 |
| |
| |
| |
| | Pursuant to the requirements of the Securities Exchange Act of 1934 and the Investment |
| Company Act of 1940, this report has been signed below by the following persons on behalf of |
| the registrant and in the capacities and on the dates indicated. |
| |
| |
| By | /s/ Edward C. Bernard |
| | Edward C. Bernard |
| | Principal Executive Officer |
| |
| Date | January 15, 2009 |
| |
| |
| |
| By | /s/ Gregory K. Hinkle |
| | Gregory K. Hinkle |
| | Principal Financial Officer |
| |
| Date | January 15, 2009 |