UNITED STATES
SECURITIES AND EXCHANGE COMMISSION
Washington, D.C. 20549
FORM N-CSR
CERTIFIED SHAREHOLDER REPORT OF REGISTERED
MANAGEMENT INVESTMENT COMPANIES
Investment Company Act File Number: 811-07353
T. Rowe Price Corporate Income Fund, Inc.
(Exact name of registrant as specified in charter)
100 East Pratt Street, Baltimore, MD 21202
(Address of principal executive offices)
David Oestreicher
100 East Pratt Street, Baltimore, MD 21202
(Name and address of agent for service)
Registrant’s telephone number, including area code: (410) 345-2000
Date of fiscal year end: May 31
Date of reporting period: May 31, 2024
Item 1. Reports to Shareholders
(a) Report pursuant to Rule 30e-1
Annual Shareholder Report
May 31, 2024
This annual shareholder report contains important information about Corporate Income Fund (the "fund") for the period of June 1, 2023 to May 31, 2024. You can find the fund’s prospectus, financial information on Form N-CSR (which includes required tax information for dividends), holdings, proxy voting information, and other information atwww.troweprice.com/prospectus. You can also request this information without charge by contacting T. Rowe Price at 1-800-638-5660 or info@troweprice.com or contacting your intermediary.
What were the fund costs for the last year? (based on a hypothetical $10,000 investment)
| Costs of a $10,000 investment | Costs paid as a percentage of a $10,000 investment |
|---|
| Corporate Income Fund - I Class | $42 | 0.41% |
What drove fund performance during the past 12 months?
The U.S. investment-grade bond market generated positive returns over the 12-month period ended May 31, 2024, largely lifted by a rally in rates and credit spreads near the end of 2023. Corporate bonds generated positive excess returns during the rally and the broader reporting period.
Security selection within the banking sector, the consumer noncylical sector, and the communication sector boosted performance relative to its style-specific benchmark, the Bloomberg U.S. Corporate Investment Grade Bond Index. Asset allocation also contributed, with our underweight in capital goods notably outperforming verses the index.
Key rate positioning hindered performance. Overweights to the 2-year, 5-year, and 10-year key rates detracted as the yields on the respective bonds ended the period higher. Similarly, the longer-duration profile held throughout mid-2023 hindered performance as yields rose.
The Corporate Income Fund seeks to provide high income and some capital growth and primarily focuses on investment-grade, U.S. corporate bonds, with the ability to integrate nonindex sectors and securities in a measured fashion. Our allocation to U.S. corporate investment-grade bonds decreased slightly over the reporting period but continues to represent its largest absolute and relative position. We also increased our allocation to non-U.S. investment-grade bonds.
While we are primarily a cash bond manager, we occasionally use derivatives, including interest rate futures and credit default swaps, in our strategy for positioning and to hedge overall portfolio risk. Over the last 12 months, our use of derivatives—specifically, interest rate derivatives—detracted from absolute performance.
How has the fund performed?
Cumulative Returns of a Hypothetical $500,000 Investment as of May 31, 2024
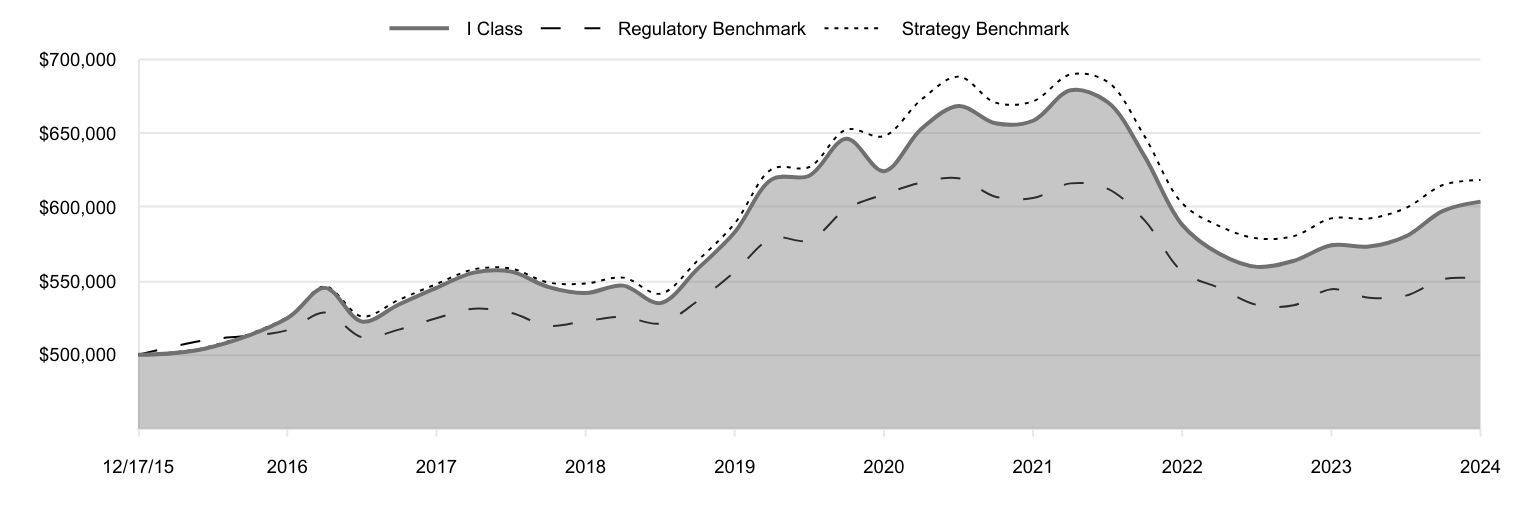
| I Class | Regulatory Benchmark | Strategy Benchmark |
|---|
| 12/17/15 | 500,000 | 500,000 | 500,000 |
| 2/29/16 | 504,161 | 509,869 | 504,823 |
| 5/31/16 | 524,741 | 516,654 | 525,523 |
| 8/31/16 | 545,349 | 528,657 | 546,272 |
| 11/30/16 | 522,487 | 511,904 | 525,986 |
| 2/28/17 | 534,097 | 517,084 | 537,230 |
| 5/31/17 | 545,399 | 524,810 | 547,936 |
| 8/31/17 | 555,704 | 531,261 | 557,929 |
| 11/30/17 | 556,385 | 528,358 | 558,395 |
| 2/28/18 | 546,000 | 519,696 | 549,042 |
| 5/31/18 | 541,852 | 522,844 | 548,247 |
| 8/31/18 | 546,861 | 525,686 | 552,308 |
| 11/30/18 | 535,033 | 521,267 | 541,399 |
| 2/28/19 | 557,892 | 536,169 | 563,501 |
| 5/31/19 | 583,019 | 556,308 | 589,074 |
| 8/31/19 | 618,996 | 579,161 | 625,942 |
| 11/30/19 | 621,349 | 577,518 | 627,220 |
| 2/29/20 | 646,393 | 598,808 | 652,597 |
| 5/31/20 | 624,384 | 608,687 | 648,133 |
| 8/31/20 | 653,093 | 616,653 | 672,913 |
| 11/30/20 | 668,581 | 619,583 | 688,440 |
| 2/28/21 | 656,821 | 607,093 | 670,806 |
| 5/31/21 | 658,549 | 606,223 | 671,720 |
| 8/31/21 | 679,196 | 616,133 | 689,929 |
| 11/30/21 | 671,073 | 612,437 | 684,781 |
| 2/28/22 | 634,448 | 591,041 | 647,975 |
| 5/31/22 | 588,048 | 556,379 | 602,672 |
| 8/31/22 | 568,306 | 545,179 | 587,027 |
| 11/30/22 | 559,593 | 533,802 | 578,927 |
| 2/28/23 | 563,688 | 533,580 | 580,412 |
| 5/31/23 | 574,187 | 544,457 | 592,434 |
| 8/31/23 | 573,318 | 538,674 | 592,286 |
| 11/30/23 | 580,283 | 540,100 | 599,497 |
| 2/29/24 | 597,502 | 551,334 | 615,038 |
| 5/31/24 | 603,752 | 551,565 | 618,508 |
202405-3565004, 202407-3567125
Average Annual Total Returns
| 1 Year | 5 Years | Since Inception 12/17/2015 |
|---|
| Corporate Income Fund (I Class) | 5.15% | 0.70% | 2.26% |
| Bloomberg U.S. Aggregate Bond Index (Regulatory Benchmark) | 1.31 | | 1.17 |
| Bloomberg U.S. Corporate Investment Grade Bond Index (Strategy Benchmark) | 4.40 | 0.98 | 2.55 |
The preceding line graph shows the value of a hypothetical $500,000 investment in the fund over the past 10 fiscal year periods or since inception (for funds lacking 10-year records). The fund’s performance information included in the line graph and table above is compared with a regulatory required index that represents an overall securities market (Regulatory Benchmark). In addition, the line graph and table may also include one or more indexes that more closely aligns to the fund's investment strategy (Strategy Benchmark(s)). Due to new SEC Rules on shareholder reporting the fund adopted a new broad-based securities market index, referred to as the Regulatory Benchmark. Market index returns do not include expenses, which are deducted from fund returns. The fund's total return figures reflect the reinvestment of dividends and capital gains, if any. Neither the fund’s returns nor the index returns reflect the deduction of taxes that a shareholder would pay on fund distributions or redemptions of fund shares. The fund’s past performance is not a good predictor of the fund’s future performance. Updated performance information can be found at www.troweprice.com.
What are some fund statistics?
| Total Net Assets (000s) | $541,725 |
| Number of Portfolio Holdings | 328 |
| Investment Advisory Fees Paid (000s) | $603 |
| Portfolio Turnover Rate | 90.7% |
What did the fund invest in?
Credit Quality Allocation* (as a % of Net Assets)
| AAA Rated | 0.9% |
| AA Rated | 4.3 |
| A Rated | 31.6 |
| BBB Rated | 54.7 |
| BB Rated and Below | 3.7 |
| Not Rated | 1.4 |
| U.S. Treasury Securities | 1.6 |
| Reserves | 1.8 |
*Credit ratings for the securities held in the Fund are provided by Moody’s, Standard & Poor’s, and Fitch and are converted to the Standard & Poor’s nomenclature. A rating of AAA represents the highest-rated securities, and a rating of D represents the lowest rated securities. If the ratings agencies differ, the highest rating is applied to the security. If a rating is not available, the security is classified as Not Rated. The rating of the underlying investment vehicle is used to determine the creditworthiness of credit default swaps and sovereign securities. The Fund is not rated by any agency.
Top Ten Holdings (as a % of Net Assets)
| Citigroup | 1.9% |
| U.S. Treasury Bonds | 1.6 |
| AbbVie | 1.4 |
| Morgan Stanley | 1.4 |
| Charter Communications Operating | 1.4 |
| Solventum | 1.4 |
| Rogers Communications | 1.3 |
| Goldman Sachs Group | 1.2 |
| CVS Health | 1.2 |
| Santander UK Group Holdings | 1.2 |
If you invest directly with T. Rowe Price, you can elect to receive future shareholder reports or other important documents through electronic delivery by enrolling at www.troweprice.com/paperless. If you invest through a financial intermediary such as an investment advisor, a bank, retirement plan sponsor or a brokerage firm, please contact that organization and ask if it can provide electronic delivery.
Bloomberg does not accept any liability for any errors or omissions in the indexes or data, and hereby expressly disclaim all warranties of originality, accuracy, completeness, timeliness, merchantability and fitness for a particular purpose. No party may rely on any indexes or data contained in this communication. Visit www.troweprice.com/en/us/market-data-disclosures for additional legal notices & disclaimers.
Corporate Income Fund
I Class (TICCX)
T. Rowe Price Investment Services, Inc.
100 East Pratt Street
Baltimore, MD 21202
Annual Shareholder Report
May 31, 2024
This annual shareholder report contains important information about Corporate Income Fund (the "fund") for the period of June 1, 2023 to May 31, 2024. You can find the fund’s prospectus, financial information on Form N-CSR (which includes required tax information for dividends), holdings, proxy voting information, and other information atwww.troweprice.com/prospectus. You can also request this information without charge by contacting T. Rowe Price at 1-800-638-5660 or info@troweprice.com or contacting your intermediary.
What were the fund costs for the last year? (based on a hypothetical $10,000 investment)
| Costs of a $10,000 investment | Costs paid as a percentage of a $10,000 investment |
|---|
| Corporate Income Fund - Investor Class | $60 | 0.59% |
What drove fund performance during the past 12 months?
The U.S. investment-grade bond market generated positive returns over the 12-month period ended May 31, 2024, largely lifted by a rally in rates and credit spreads near the end of 2023. Corporate bonds generated positive excess returns during the rally and the broader reporting period.
Security selection within the banking sector, the consumer noncylical sector, and the communication sector boosted performance relative to its style-specific benchmark, the Bloomberg U.S. Corporate Investment Grade Bond Index. Asset allocation also contributed, with our underweight in capital goods notably outperforming verses the index.
Key rate positioning hindered performance. Overweights to the 2-year, 5-year, and 10-year key rates detracted as the yields on the respective bonds ended the period higher. Similarly, the longer-duration profile held throughout mid-2023 hindered performance as yields rose.
The Corporate Income Fund seeks to provide high income and some capital growth and primarily focuses on investment-grade, U.S. corporate bonds, with the ability to integrate nonindex sectors and securities in a measured fashion. Our allocation to U.S. corporate investment-grade bonds decreased slightly over the reporting period but continues to represent its largest absolute and relative position. We also increased our allocation to non-U.S. investment-grade bonds.
While we are primarily a cash bond manager, we occasionally use derivatives, including interest rate futures and credit default swaps, in our strategy for positioning and to hedge overall portfolio risk. Over the last 12 months, our use of derivatives—specifically, interest rate derivatives—detracted from absolute performance.
How has the fund performed?
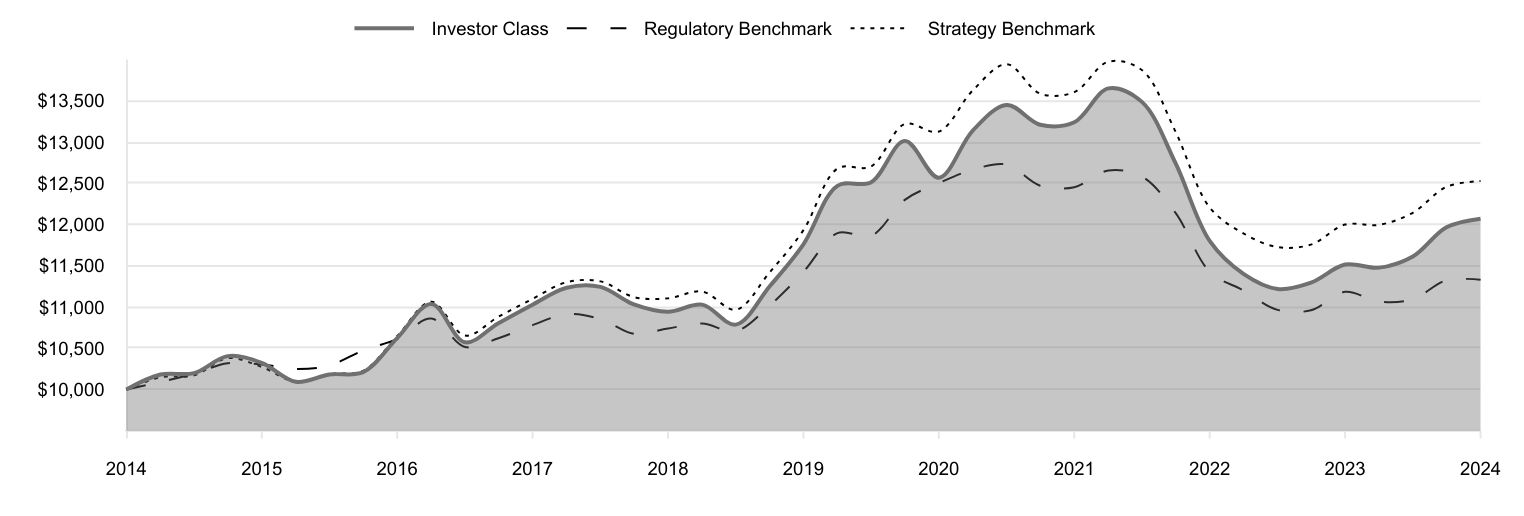
Cumulative Returns of a Hypothetical $10,000 Investment as of May 31, 2024
| Investor Class | Regulatory Benchmark | Strategy Benchmark |
|---|
| 2014 | 10,000 | 10,000 | 10,000 |
| 2014 | 10,181 | 10,090 | 10,146 |
| 2014 | 10,198 | 10,192 | 10,171 |
| 2015 | 10,404 | 10,318 | 10,379 |
| 2015 | 10,322 | 10,303 | 10,272 |
| 2015 | 10,093 | 10,247 | 10,091 |
| 2015 | 10,181 | 10,291 | 10,187 |
| 2016 | 10,209 | 10,473 | 10,225 |
| 2016 | 10,622 | 10,612 | 10,644 |
| 2016 | 11,037 | 10,859 | 11,064 |
| 2016 | 10,571 | 10,514 | 10,653 |
| 2017 | 10,803 | 10,621 | 10,881 |
| 2017 | 11,028 | 10,780 | 11,098 |
| 2017 | 11,233 | 10,912 | 11,300 |
| 2017 | 11,243 | 10,852 | 11,310 |
| 2018 | 11,030 | 10,674 | 11,120 |
| 2018 | 10,942 | 10,739 | 11,104 |
| 2018 | 11,028 | 10,798 | 11,187 |
| 2018 | 10,786 | 10,707 | 10,966 |
| 2019 | 11,244 | 11,013 | 11,413 |
| 2019 | 11,760 | 11,426 | 11,931 |
| 2019 | 12,469 | 11,896 | 12,678 |
| 2019 | 12,513 | 11,862 | 12,704 |
| 2020 | 13,014 | 12,299 | 13,218 |
| 2020 | 12,567 | 12,502 | 13,127 |
| 2020 | 13,142 | 12,666 | 13,629 |
| 2020 | 13,450 | 12,726 | 13,944 |
| 2021 | 13,210 | 12,470 | 13,587 |
| 2021 | 13,240 | 12,452 | 13,605 |
| 2021 | 13,651 | 12,655 | 13,974 |
| 2021 | 13,484 | 12,579 | 13,870 |
| 2022 | 12,743 | 12,140 | 13,124 |
| 2022 | 11,800 | 11,428 | 12,207 |
| 2022 | 11,398 | 11,198 | 11,890 |
| 2022 | 11,218 | 10,964 | 11,726 |
| 2023 | 11,295 | 10,960 | 11,756 |
| 2023 | 11,514 | 11,183 | 11,999 |
| 2023 | 11,477 | 11,064 | 11,996 |
| 2023 | 11,611 | 11,094 | 12,142 |
| 2024 | 11,966 | 11,324 | 12,457 |
| 2024 | 12,070 | 11,329 | 12,527 |
202405-3565004, 202407-3567125
Average Annual Total Returns
| 1 Year | 5 Years | 10 Years |
|---|
| Corporate Income Fund (Investor Class) | 4.82% | 0.52% | 1.90% |
| Bloomberg U.S. Aggregate Bond Index (Regulatory Benchmark) | 1.31 | | 1.26 |
| Bloomberg U.S. Corporate Investment Grade Bond Index (Strategy Benchmark) | 4.40 | 0.98 | 2.28 |
The preceding line graph shows the value of a hypothetical $10,000 investment in the fund over the past 10 fiscal year periods or since inception (for funds lacking 10-year records). The fund’s performance information included in the line graph and table above is compared with a regulatory required index that represents an overall securities market (Regulatory Benchmark). In addition, the line graph and table may also include one or more indexes that more closely aligns to the fund's investment strategy (Strategy Benchmark(s)). Due to new SEC Rules on shareholder reporting the fund adopted a new broad-based securities market index, referred to as the Regulatory Benchmark. Market index returns do not include expenses, which are deducted from fund returns. The fund's total return figures reflect the reinvestment of dividends and capital gains, if any. Neither the fund’s returns nor the index returns reflect the deduction of taxes that a shareholder would pay on fund distributions or redemptions of fund shares. The fund’s past performance is not a good predictor of the fund’s future performance. Updated performance information can be found at www.troweprice.com.
What are some fund statistics?
| Total Net Assets (000s) | $541,725 |
| Number of Portfolio Holdings | 328 |
| Investment Advisory Fees Paid (000s) | $603 |
| Portfolio Turnover Rate | 90.7% |
What did the fund invest in?
Credit Quality Allocation* (as a % of Net Assets)
| AAA Rated | 0.9% |
| AA Rated | 4.3 |
| A Rated | 31.6 |
| BBB Rated | 54.7 |
| BB Rated and Below | 3.7 |
| Not Rated | 1.4 |
| U.S. Treasury Securities | 1.6 |
| Reserves | 1.8 |
*Credit ratings for the securities held in the Fund are provided by Moody’s, Standard & Poor’s, and Fitch and are converted to the Standard & Poor’s nomenclature. A rating of AAA represents the highest-rated securities, and a rating of D represents the lowest rated securities. If the ratings agencies differ, the highest rating is applied to the security. If a rating is not available, the security is classified as Not Rated. The rating of the underlying investment vehicle is used to determine the creditworthiness of credit default swaps and sovereign securities. The Fund is not rated by any agency.
Top Ten Holdings (as a % of Net Assets)
| Citigroup | 1.9% |
| U.S. Treasury Bonds | 1.6 |
| AbbVie | 1.4 |
| Morgan Stanley | 1.4 |
| Charter Communications Operating | 1.4 |
| Solventum | 1.4 |
| Rogers Communications | 1.3 |
| Goldman Sachs Group | 1.2 |
| CVS Health | 1.2 |
| Santander UK Group Holdings | 1.2 |
If you invest directly with T. Rowe Price, you can elect to receive future shareholder reports or other important documents through electronic delivery by enrolling at www.troweprice.com/paperless. If you invest through a financial intermediary such as an investment advisor, a bank, retirement plan sponsor or a brokerage firm, please contact that organization and ask if it can provide electronic delivery.
Bloomberg does not accept any liability for any errors or omissions in the indexes or data, and hereby expressly disclaim all warranties of originality, accuracy, completeness, timeliness, merchantability and fitness for a particular purpose. No party may rely on any indexes or data contained in this communication. Visit www.troweprice.com/en/us/market-data-disclosures for additional legal notices & disclaimers.
Corporate Income Fund
Investor Class (PRPIX)
T. Rowe Price Investment Services, Inc.
100 East Pratt Street
Baltimore, MD 21202
Annual Shareholder Report
May 31, 2024
This annual shareholder report contains important information about Corporate Income Fund (the "fund") for the period of June 1, 2023 to May 31, 2024. You can find the fund’s prospectus, financial information on Form N-CSR (which includes required tax information for dividends), holdings, proxy voting information, and other information atwww.troweprice.com/prospectus. You can also request this information without charge by contacting T. Rowe Price at 1-800-638-5660 or info@troweprice.com or contacting your intermediary.
What were the fund costs for the last year? (based on a hypothetical $10,000 investment)
| Costs of a $10,000 investment | Costs paid as a percentage of a $10,000 investment |
|---|
| Corporate Income Fund - Z Class | $0 | 0.00% |
What drove fund performance during the past 12 months?
The U.S. investment-grade bond market generated positive returns over the 12-month period ended May 31, 2024, largely lifted by a rally in rates and credit spreads near the end of 2023. Corporate bonds generated positive excess returns during the rally and the broader reporting period.
Security selection within the banking sector, the consumer noncylical sector, and the communication sector boosted performance relative to its style-specific benchmark, the Bloomberg U.S. Corporate Investment Grade Bond Index. Asset allocation also contributed, with our underweight in capital goods notably outperforming verses the index.
Key rate positioning hindered performance. Overweights to the 2-year, 5-year, and 10-year key rates detracted as the yields on the respective bonds ended the period higher. Similarly, the longer-duration profile held throughout mid-2023 hindered performance as yields rose.
The Corporate Income Fund seeks to provide high income and some capital growth and primarily focuses on investment-grade, U.S. corporate bonds, with the ability to integrate nonindex sectors and securities in a measured fashion. Our allocation to U.S. corporate investment-grade bonds decreased slightly over the reporting period but continues to represent its largest absolute and relative position. We also increased our allocation to non-U.S. investment-grade bonds.
While we are primarily a cash bond manager, we occasionally use derivatives, including interest rate futures and credit default swaps, in our strategy for positioning and to hedge overall portfolio risk. Over the last 12 months, our use of derivatives—specifically, interest rate derivatives—detracted from absolute performance.
How has the fund performed?
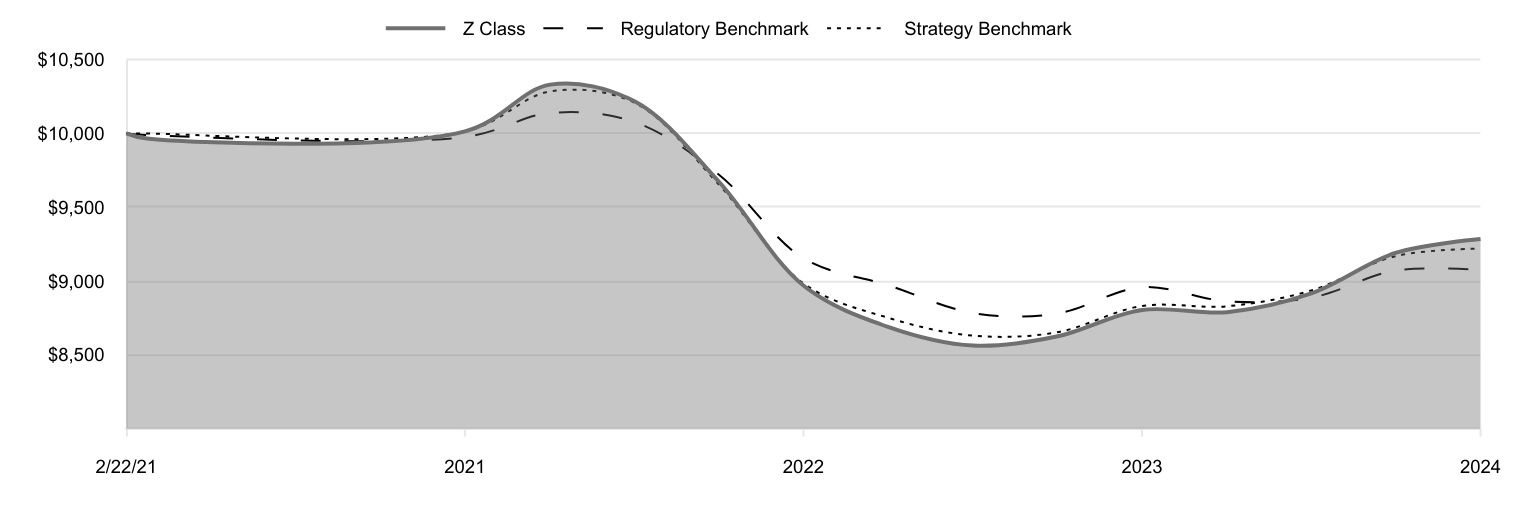
Cumulative Returns of a Hypothetical $10,000 Investment as of May 31, 2024
| Z Class | Regulatory Benchmark | Strategy Benchmark |
|---|
| 2/22/21 | 10,000 | 10,000 | 10,000 |
| 2/28/21 | 9,965 | 9,989 | 9,999 |
| 5/31/21 | 10,014 | 9,975 | 10,013 |
| 8/31/21 | 10,330 | 10,138 | 10,284 |
| 11/30/21 | 10,217 | 10,077 | 10,207 |
| 2/28/22 | 9,679 | 9,725 | 9,659 |
| 5/31/22 | 8,970 | 9,154 | 8,984 |
| 8/31/22 | 8,688 | 8,970 | 8,750 |
| 11/30/22 | 8,563 | 8,783 | 8,630 |
| 2/28/23 | 8,624 | 8,779 | 8,652 |
| 5/31/23 | 8,804 | 8,958 | 8,831 |
| 8/31/23 | 8,789 | 8,863 | 8,829 |
| 11/30/23 | 8,916 | 8,887 | 8,936 |
| 2/29/24 | 9,190 | 9,071 | 9,168 |
| 5/31/24 | 9,284 | 9,075 | 9,220 |
202405-3565004, 202407-3567125
Average Annual Total Returns
| 1 Year | Since Inception 2/22/2021 |
|---|
| Corporate Income Fund (Z Class) | 5.44% | |
| Bloomberg U.S. Aggregate Bond Index (Regulatory Benchmark) | 1.31 | |
| Bloomberg U.S. Corporate Investment Grade Bond Index (Strategy Benchmark) | 4.40 | |
The preceding line graph shows the value of a hypothetical $10,000 investment in the fund over the past 10 fiscal year periods or since inception (for funds lacking 10-year records). The fund’s performance information included in the line graph and table above is compared with a regulatory required index that represents an overall securities market (Regulatory Benchmark). In addition, the line graph and table may also include one or more indexes that more closely aligns to the fund's investment strategy (Strategy Benchmark(s)). Due to new SEC Rules on shareholder reporting the fund adopted a new broad-based securities market index, referred to as the Regulatory Benchmark. Market index returns do not include expenses, which are deducted from fund returns. The fund's total return figures reflect the reinvestment of dividends and capital gains, if any. Neither the fund’s returns nor the index returns reflect the deduction of taxes that a shareholder would pay on fund distributions or redemptions of fund shares. The fund’s past performance is not a good predictor of the fund’s future performance. Updated performance information can be found at www.troweprice.com.
What are some fund statistics?
| Total Net Assets (000s) | $541,725 |
| Number of Portfolio Holdings | 328 |
| Investment Advisory Fees Paid (000s) | $603 |
| Portfolio Turnover Rate | 90.7% |
What did the fund invest in?
Credit Quality Allocation* (as a % of Net Assets)
| AAA Rated | 0.9% |
| AA Rated | 4.3 |
| A Rated | 31.6 |
| BBB Rated | 54.7 |
| BB Rated and Below | 3.7 |
| Not Rated | 1.4 |
| U.S. Treasury Securities | 1.6 |
| Reserves | 1.8 |
*Credit ratings for the securities held in the Fund are provided by Moody’s, Standard & Poor’s, and Fitch and are converted to the Standard & Poor’s nomenclature. A rating of AAA represents the highest-rated securities, and a rating of D represents the lowest rated securities. If the ratings agencies differ, the highest rating is applied to the security. If a rating is not available, the security is classified as Not Rated. The rating of the underlying investment vehicle is used to determine the creditworthiness of credit default swaps and sovereign securities. The Fund is not rated by any agency.
Top Ten Holdings (as a % of Net Assets)
| Citigroup | 1.9% |
| U.S. Treasury Bonds | 1.6 |
| AbbVie | 1.4 |
| Morgan Stanley | 1.4 |
| Charter Communications Operating | 1.4 |
| Solventum | 1.4 |
| Rogers Communications | 1.3 |
| Goldman Sachs Group | 1.2 |
| CVS Health | 1.2 |
| Santander UK Group Holdings | 1.2 |
If you invest directly with T. Rowe Price, you can elect to receive future shareholder reports or other important documents through electronic delivery by enrolling at www.troweprice.com/paperless. If you invest through a financial intermediary such as an investment advisor, a bank, retirement plan sponsor or a brokerage firm, please contact that organization and ask if it can provide electronic delivery.
Bloomberg does not accept any liability for any errors or omissions in the indexes or data, and hereby expressly disclaim all warranties of originality, accuracy, completeness, timeliness, merchantability and fitness for a particular purpose. No party may rely on any indexes or data contained in this communication. Visit www.troweprice.com/en/us/market-data-disclosures for additional legal notices & disclaimers.
Corporate Income Fund
Z Class (TRZCX)
T. Rowe Price Investment Services, Inc.
100 East Pratt Street
Baltimore, MD 21202
Item 1. (b) Notice pursuant to Rule 30e-3.
Not applicable.
Item 2. Code of Ethics.
The registrant has adopted a code of ethics, as defined in Item 2 of Form N-CSR, applicable to its principal executive officer, principal financial officer, principal accounting officer or controller, or persons performing similar functions. A copy of this code of ethics is filed as an exhibit to this Form N-CSR. No substantive amendments were approved or waivers were granted to this code of ethics during the period covered by this report.
Item 3. Audit Committee Financial Expert.
The registrant’s Board of Directors has determined that Mr. Paul F. McBride qualifies as an audit committee financial expert, as defined in Item 3 of Form N-CSR. Mr. McBride is considered independent for purposes of Item 3 of Form N-CSR.
Item 4. Principal Accountant Fees and Services.
(a) – (d) Aggregate fees billed for the last two fiscal years for professional services rendered to, or on behalf of, the registrant by the registrant’s principal accountant were as follows:
| | | | | | | | | | |
| | | | 2024 | | | 2023 | |
| | Audit Fees | | $ | 33,841 | | | $ | 33,192 | |
| | Audit-Related Fees | | | - | | | | - | |
| | Tax Fees | | | - | | | | - | |
| | All Other Fees | | | - | | | | - | |
Audit fees include amounts related to the audit of the registrant’s annual financial statements and services normally provided by the accountant in connection with statutory and regulatory filings. Audit-related fees include amounts reasonably related to the performance of the audit of the registrant’s financial statements and specifically include the issuance of a report on internal controls and, if applicable, agreed-upon procedures related to fund acquisitions. Tax fees include amounts related to services for tax compliance, tax planning, and tax advice. The nature of these services specifically includes the review of distribution calculations and the preparation of Federal, state, and excise tax returns. All other fees include the registrant’s pro-rata share of amounts for agreed-upon procedures in conjunction with service contract approvals by the registrant’s Board of Directors/Trustees.
(e)(1) The registrant’s audit committee has adopted a policy whereby audit and non-audit services performed by the registrant’s principal accountant for the registrant, its investment adviser, and any entity controlling, controlled by, or under common control with the investment adviser that provides ongoing services to the registrant require pre-approval in advance at regularly scheduled audit committee meetings. If such a service is required between regularly scheduled audit committee meetings, pre-approval may be authorized by one audit committee member with ratification at the next scheduled audit committee meeting. Waiver of pre-approval for audit or non-audit services requiring fees of a de minimis amount is not permitted.
(2) No services included in (b) – (d) above were approved pursuant to paragraph (c)(7)(i)(C) of Rule 2-01 of Regulation S-X.
(f) Less than 50 percent of the hours expended on the principal accountant’s engagement to audit the registrant’s financial statements for the most recent fiscal year were attributed to work performed by persons other than the principal accountant’s full-time, permanent employees.
(g) The aggregate fees billed for the most recent fiscal year and the preceding fiscal year by the registrant’s principal accountant for non-audit services rendered to the registrant, its investment adviser, and any entity controlling, controlled by, or under common control with the investment adviser that provides ongoing services to the registrant were $1,230,000 and $1,521,000, respectively.
(h) All non-audit services rendered in (g) above were pre-approved by the registrant’s audit committee. Accordingly, these services were considered by the registrant’s audit committee in maintaining the principal accountant’s independence.
(i) Not applicable.
(j) Not applicable.
Item 5. Audit Committee of Listed Registrants.
Not applicable.
Item 6. Investments.
(a) Not applicable. The complete schedule of investments is included in Item 7 of this Form N-CSR.
(b) Not applicable.
Item 7. Financial Statements and Financial Highlights for Open-End Management Investment Companies.
(a – b) Report pursuant to Regulation S-X.
Financial
Highlights
Portfolio
of
Investments
Financial
Statements
and
Notes
Additional
Fund
Information
Financial
Statements
and
Other
Information
For
more
insights
from
T.
Rowe
Price
investment
professionals,
go
to
troweprice.com
.
T.
ROWE
PRICE
PRPIX
Corporate
Income
Fund
–
.
TICCX
Corporate
Income
Fund–
.
I Class
TRZCX
Corporate
Income
Fund–
.
Z Class
T.
ROWE
PRICE
Corporate
Income
Fund
Go
Paperless
Going
paperless
offers
a
host
of
benefits,
which
include:
Timely
delivery
of
important
documents
Convenient
access
to
your
documents
anytime,
anywhere
Strong
security
protocols
to
safeguard
sensitive
data
Waive
your
account
service
fee
by
going
paperless.*
To
Enroll:
˃
If
you
invest
directly
with
T.
Rowe
Price,
go
to
troweprice.com/paperless
.
If
you
invest
through
a
financial
intermediary
such
as
an
investment
advisor,
a
bank,
or
a
brokerage
firm,
please
contact
that
organization
and
ask
if
it
can
provide
electronic
documentation.
Log
in
to
your
account
at
troweprice.com
for
more
information.
*
An
account
service
fee
will
be
charged
annually
for
each
T.
Rowe
Price
mutual
fund
account
unless
you
meet
criteria
for
a
fee
waiver.
Go
to
troweprice.com/personal-investing/
help/fees-and-minimums.html
to
learn
more
about
this
account
service
fee,
including
other
ways
to
waive
it.
T.
ROWE
PRICE
Corporate
Income
Fund
For
a
share
outstanding
throughout
each
period
Investor
Class
..
Year
..
..
Ended
.
5/31/24
5/31/23
5/31/22
5/31/21
5/31/20
NET
ASSET
VALUE
Beginning
of
period
$
7
.88
$
8
.38
$
9
.93
$
9
.77
$
9
.55
Investment
activities
Net
investment
income
(1)(2)
0
.35
0
.29
0
.23
0
.26
0
.32
Net
realized
and
unrealized
gain/loss
0
.02
(
0
.50
)
(
1
.25
)
0
.26
0
.33
Total
from
investment
activities
0
.37
(
0
.21
)
(
1
.02
)
0
.52
0
.65
Distributions
Net
investment
income
(
0
.36
)
(
0
.29
)
(
0
.24
)
(
0
.26
)
(
0
.33
)
Net
realized
gain
—
—
(
0
.29
)
(
0
.10
)
(
0
.10
)
Total
distributions
(
0
.36
)
(
0
.29
)
(
0
.53
)
(
0
.36
)
(
0
.43
)
NET
ASSET
VALUE
End
of
period
$
7
.89
$
7
.88
$
8
.38
$
9
.93
$
9
.77
T.
ROWE
PRICE
Corporate
Income
Fund
For
a
share
outstanding
throughout
each
period
The
accompanying
notes
are
an
integral
part
of
these
financial
statements.
Investor
Class
..
Year
..
..
Ended
.
5/31/24
5/31/23
5/31/22
5/31/21
5/31/20
Ratios/Supplemental
Data
Total
return
(2)(3)
4
.82
%
(
2
.42
)
%
(
10
.88
)
%
5
.36
%
6
.86
%
Ratios
to
average
net
assets:
(2)
Gross
expenses
before
waivers/payments
by
Price
Associates
0
.70
%
0
.69
%
0
.59
%
0
.59
%
0
.61
%
Net
expenses
after
waivers/
payments
by
Price
Associates
0
.59
%
0
.59
%
0
.59
%
0
.59
%
0
.61
%
Net
investment
income
4
.47
%
3
.70
%
2
.37
%
2
.58
%
3
.22
%
Portfolio
turnover
rate
90
.7
%
68
.6
%
85
.5
%
107
.6
%
149
.4
%
Net
assets,
end
of
period
(in
thousands)
$126,974
$141,998
$165,944
$420,125
$717,100
0
%
0
%
0
%
0
%
0
%
(1)
Per
share
amounts
calculated
using
average
shares
outstanding
method.
(2)
Includes
the
impact
of
expense-related
arrangements
with
Price
Associates.
(3)
Total
return
reflects
the
rate
that
an
investor
would
have
earned
on
an
investment
in
the
fund
during
each
period,
assuming
reinvestment
of
all
distributions,
and
payment
of
no
redemption
or
account
fees,
if
applicable.
T.
ROWE
PRICE
Corporate
Income
Fund
For
a
share
outstanding
throughout
each
period
I
Class
..
Year
..
..
Ended
.
5/31/24
5/31/23
5/31/22
5/31/21
5/31/20
NET
ASSET
VALUE
Beginning
of
period
$
7
.88
$
8
.39
$
9
.94
$
9
.78
$
9
.55
Investment
activities
Net
investment
income
(1)(2)
0
.36
0
.31
0
.25
0
.27
0
.33
Net
realized
and
unrealized
gain/loss
0
.03
(
0
.51
)
(
1
.25
)
0
.27
0
.34
Total
from
investment
activities
0
.39
(
0
.20
)
(
1
.00
)
0
.54
0
.67
Distributions
Net
investment
income
(
0
.37
)
(
0
.31
)
(
0
.26
)
(
0
.28
)
(
0
.34
)
Net
realized
gain
—
—
(
0
.29
)
(
0
.10
)
(
0
.10
)
Total
distributions
(
0
.37
)
(
0
.31
)
(
0
.55
)
(
0
.38
)
(
0
.44
)
NET
ASSET
VALUE
End
of
period
$
7
.90
$
7
.88
$
8
.39
$
9
.94
$
9
.78
T.
ROWE
PRICE
Corporate
Income
Fund
For
a
share
outstanding
throughout
each
period
The
accompanying
notes
are
an
integral
part
of
these
financial
statements.
I
Class
..
Year
..
..
Ended
.
5/31/24
5/31/23
5/31/22
5/31/21
5/31/20
Ratios/Supplemental
Data
Total
return
(2)(3)
5
.15
%
(
2
.36
)
%
(
10
.71
)
%
5
.47
%
7
.09
%
Ratios
to
average
net
assets:
(2)
Gross
expenses
before
waivers/payments
by
Price
Associates
0
.46
%
0
.46
%
0
.44
%
0
.49
%
0
.49
%
Net
expenses
after
waivers/
payments
by
Price
Associates
0
.41
%
0
.41
%
0
.41
%
0
.48
%
0
.49
%
Net
investment
income
4
.66
%
3
.89
%
2
.78
%
2
.66
%
3
.35
%
Portfolio
turnover
rate
90
.7
%
68
.6
%
85
.5
%
107
.6
%
149
.4
%
Net
assets,
end
of
period
(in
thousands)
$149,202
$149,436
$162,609
$22,825
$17,990
0
%
0
%
0
%
0
%
0
%
(1)
Per
share
amounts
calculated
using
average
shares
outstanding
method.
(2)
Includes
the
impact
of
expense-related
arrangements
with
Price
Associates.
(3)
Total
return
reflects
the
rate
that
an
investor
would
have
earned
on
an
investment
in
the
fund
during
each
period,
assuming
reinvestment
of
all
distributions,
and
payment
of
no
redemption
or
account
fees,
if
applicable.
T.
ROWE
PRICE
Corporate
Income
Fund
For
a
share
outstanding
throughout
each
period
Z
Class
(1)
..
Year
..
..
Ended
.
2/22/21
(1)
Through
5/31/21
5/31/24
5/31/23
5/31/22
NET
ASSET
VALUE
Beginning
of
period
$
7
.88
$
8
.38
$
9
.94
$
10
.01
Investment
activities
Net
investment
income
(2)(3)
0
.40
0
.34
0
.28
0
.08
Net
realized
and
unrealized
gain/loss
0
.02
(
0
.50
)
(
1
.25
)
(
0
.07
)
(4)
Total
from
investment
activities
0
.42
(
0
.16
)
(
0
.97
)
0
.01
Distributions
Net
investment
income
(
0
.41
)
(
0
.34
)
(
0
.30
)
(
0
.08
)
Net
realized
gain
—
—
(
0
.29
)
—
Total
distributions
(
0
.41
)
(
0
.34
)
(
0
.59
)
(
0
.08
)
NET
ASSET
VALUE
End
of
period
$
7
.89
$
7
.88
$
8
.38
$
9
.94
T.
ROWE
PRICE
Corporate
Income
Fund
For
a
share
outstanding
throughout
each
period
The
accompanying
notes
are
an
integral
part
of
these
financial
statements.
Z
Class
(1)
..
Year
..
..
Ended
.
2/22/21
(1)
Through
5/31/21
5/31/24
5/31/23
5/31/22
Ratios/Supplemental
Data
Total
return
(3)(5)
5
.44
%
(
1
.84
)
%
(
10
.43
)
%
0
.14
%
Ratios
to
average
net
assets:
(3)
Gross
expenses
before
waivers/payments
by
Price
Associates
0
.42
%
0
.42
%
0
.43
%
0
.48
%
(6)
Net
expenses
after
waivers/payments
by
Price
Associates
0
.00
%
0
.00
%
0
.00
%
0
.00
%
(6)
Net
investment
income
5
.07
%
4
.30
%
2
.96
%
2
.92
%
(6)
Portfolio
turnover
rate
90
.7
%
68
.6
%
85
.5
%
107
.6
%
Net
assets,
end
of
period
(in
thousands)
$265,549
$259,273
$281,974
$339,398
0
%
0
%
0
%
0
%
(1)
Inception
date
(2)
Per
share
amounts
calculated
using
average
shares
outstanding
method.
(3)
Includes
the
impact
of
expense-related
arrangements
with
Price
Associates.
(4)
The
amount
presented
is
inconsistent
with
the
fund's
aggregate
gains
and
losses
because
of
the
timing
of
sales
and
redemptions
of
fund
shares
in
relation
to
fluctuating
market
values
for
the
investment
portfolio.
(5)
Total
return
reflects
the
rate
that
an
investor
would
have
earned
on
an
investment
in
the
fund
during
each
period,
assuming
reinvestment
of
all
distributions,
and
payment
of
no
redemption
or
account
fees,
if
applicable.
Total
return
is
not
annualized
for
periods
less
than
one
year.
(6)
Annualized
T.
ROWE
PRICE
Corporate
Income
Fund
May
31,
2024
Par/Shares
$
Value
(Amounts
in
000s)
‡
ASSET-BACKED
SECURITIES
5.3%
Car
Loan
0.8%
Americredit
Automobile
Receivables
Trust
Series
2023-1,
Class
B
5.57%,
3/20/28
895
897
Americredit
Automobile
Receivables
Trust
Series
2023-1,
Class
C
5.80%,
12/18/28
535
539
Exeter
Automobile
Receivables
Trust
Series
2023-1A,
Class
B
5.72%,
4/15/27
443
442
Ford
Credit
Auto
Lease
Trust
Series
2023-A,
Class
C
5.54%,
12/15/26
660
658
Santander
Bank
Auto
Credit-Linked
Notes
Series
2022-A,
Class
B
5.281%,
5/15/32 (1)
764
762
Santander
Drive
Auto
Receivables
Trust
Series
2024-2,
Class
C
5.84%,
6/17/30
890
895
U.S.
Bank
Series
2023-1,
Class
B
6.789%,
8/25/32 (1)
194
195
4,388
Other
Asset-Backed
Securities
4.5%
Applebee's
Funding
Series
2019-1A,
Class
A2II
4.723%,
6/5/49 (1)
455
437
CyrusOne
Data
Centers
Issuer
I
Series
2024-2A,
Class
A2
4.50%,
5/20/49 (1)
815
750
Driven
Brands
Funding
Series
2018-1A,
Class
A2
4.739%,
4/20/48 (1)
2,533
2,494
Driven
Brands
Funding
Series
2019-1A,
Class
A2
4.641%,
4/20/49 (1)
460
446
Driven
Brands
Funding
Series
2019-2A,
Class
A2
3.981%,
10/20/49 (1)
253
240
Driven
Brands
Funding
Series
2020-2A,
Class
A2
3.237%,
1/20/51 (1)
625
564
Hardee's
Funding
Series
2018-1A,
Class
A23
5.71%,
6/20/48 (1)
600
567
T.
ROWE
PRICE
Corporate
Income
Fund
Par/Shares
$
Value
(Amounts
in
000s)
Hardee's
Funding
Series
2020-1A,
Class
A2
3.981%,
12/20/50 (1)
1,514
1,358
Hardee's
Funding
Series
2021-1A,
Class
A2
2.865%,
6/20/51 (1)
793
672
Hardee's
Funding
Series
2024-1A,
Class
A2
7.253%,
3/20/54 (1)
360
359
Hotwire
Funding
Series
2021-1,
Class
A2
2.311%,
11/20/51 (1)
2,360
2,168
Madison
Park
Funding
XXXVII
Series
2019-37A,
Class
AR2,
CLO,
FRN
3M
TSFR
+
1.53%,
6.852%,
4/15/37 (1)
1,310
1,317
Magnetite
XVII
Series
2016-17A,
Class
AR2,
CLO,
FRN
3M
TSFR
+
1.50%,
6.825%,
4/20/37 (1)
1,385
1,391
MVW
Series
2021-1WA,
Class
C
1.94%,
1/22/41 (1)
63
58
MVW
Series
2023-2A,
Class
A
6.18%,
11/20/40 (1)
784
796
SEB
Funding
Series
2024-1A,
Class
A2
7.386%,
4/30/54 (1)
875
874
ServiceMaster
Funding
Series
2020-1,
Class
A2I
2.841%,
1/30/51 (1)
424
375
Sonic
Capital
Series
2020-1A,
Class
A2I
3.845%,
1/20/50 (1)
4,639
4,379
Stonepeak
Series
2021-1A,
Class
AA
2.301%,
2/28/33 (1)
1,194
1,114
Zaxby's
Funding
Series
2021-1A,
Class
A2
3.238%,
7/30/51 (1)
3,371
2,963
Zaxby's
Funding
Series
2024-1A,
Class
A2I
6.594%,
4/30/54 (1)
1,105
1,105
24,427
Total
Asset-Backed
Securities
(Cost
$29,945)
28,815
T.
ROWE
PRICE
Corporate
Income
Fund
Par/Shares
$
Value
(Amounts
in
000s)
BANK
LOANS
0.5%
(2)
UTILITY
0.5%
Electric
0.5%
NRG
Energy,
FRN
1M
TSFR
+
2.00%,
7.328%,
4/16/31
1,730
1,736
Vistra
Zero
Operating,
FRN
1M
TSFR
+
2.75%,
8.075%,
4/30/31
720
724
Total
Utility
2,460
Total
Bank
Loans
(Cost
$2,442)
2,460
CORPORATE
BONDS
87.6%
FINANCIAL
INSTITUTIONS
32.6%
Banking
19.8%
Banco
Bilbao
Vizcaya
Argentaria,
Series
9,
VR,
6.50% (3)(4)
1,200
1,191
Banco
Santander,
6.921%,
8/8/33
1,000
1,053
Banco
Santander,
VR,
5.538%,
3/14/30 (4)
2,400
2,381
Bank
of
America,
Series
TT,
VR,
6.125% (3)(4)(5)
1,580
1,570
Bank
of
New
York
Mellon,
VR,
6.474%,
10/25/34 (4)
3,945
4,243
Barclays,
VR,
2.279%,
11/24/27 (4)
675
621
Barclays,
VR,
6.692%,
9/13/34 (4)
1,710
1,810
BNP
Paribas,
VR,
5.497%,
5/20/30 (1)(4)
2,600
2,590
BNP
Paribas,
VR,
5.738%,
2/20/35 (1)(4)
935
928
CaixaBank
,
VR,
6.037%,
6/15/35 (1)(4)
1,635
1,633
CaixaBank
,
VR,
6.208%,
1/18/29 (1)(4)
2,225
2,257
Capital
One
Financial,
VR,
2.359%,
7/29/32 (4)
1,357
1,058
Capital
One
Financial,
VR,
3.273%,
3/1/30 (4)
2,354
2,110
Citigroup,
VR,
2.572%,
6/3/31 (4)
5,550
4,732
Citigroup,
VR,
3.98%,
3/20/30 (4)
6,105
5,716
Danske
Bank,
VR,
4.298%,
4/1/28 (1)(4)
4,745
4,558
Deutsche
Bank,
VR,
3.961%,
11/26/25 (4)
4,140
4,101
Fifth
Third
Bancorp,
VR,
5.631%,
1/29/32 (4)
295
292
Fifth
Third
Bancorp,
VR,
6.339%,
7/27/29 (4)
1,197
1,222
Goldman
Sachs
Group,
VR,
2.615%,
4/22/32 (4)
4,190
3,478
Goldman
Sachs
Group,
VR,
3.814%,
4/23/29 (4)
3,350
3,156
HSBC
Holdings,
VR,
2.357%,
8/18/31 (4)
3,275
2,714
HSBC
Holdings,
VR,
4.583%,
6/19/29 (4)
1,415
1,360
HSBC
Holdings,
VR,
6.161%,
3/9/29 (4)
735
750
Intesa
Sanpaolo,
6.625%,
6/20/33 (1)
1,825
1,886
JPMorgan
Chase,
VR,
2.522%,
4/22/31 (4)
145
124
JPMorgan
Chase,
VR,
2.739%,
10/15/30 (4)
3,035
2,646
T.
ROWE
PRICE
Corporate
Income
Fund
Par/Shares
$
Value
(Amounts
in
000s)
JPMorgan
Chase,
VR,
2.956%,
5/13/31 (4)
1,140
986
JPMorgan
Chase,
VR,
6.254%,
10/23/34 (4)
1,650
1,741
Morgan
Stanley,
VR,
2.699%,
1/22/31 (4)
1,460
1,264
Morgan
Stanley,
VR,
4.431%,
1/23/30 (4)
4,860
4,677
Morgan
Stanley,
VR,
6.342%,
10/18/33 (4)
1,515
1,595
Santander
Holdings
USA,
VR,
2.49%,
1/6/28 (4)
2,580
2,352
Santander
Holdings
USA,
VR,
6.174%,
1/9/30 (4)
735
737
Santander
Holdings
USA,
VR,
6.499%,
3/9/29 (4)
225
230
Santander
Holdings
USA,
VR,
6.565%,
6/12/29 (4)
345
352
Santander
UK
Group
Holdings,
VR,
1.532%,
8/21/26 (4)
6,590
6,239
Skandinaviska
Enskilda
Banken
,
5.375%,
3/5/29 (1)
3,905
3,885
Societe
Generale
,
VR,
5.519%,
1/19/28 (1)(4)
4,200
4,145
Standard
Chartered,
VR,
2.819%,
1/30/26 (1)(4)
3,111
3,048
Standard
Chartered,
VR,
7.018%,
2/8/30 (1)(4)
2,510
2,643
U.S.
Bancorp,
VR,
5.384%,
1/23/30 (4)
785
780
U.S.
Bancorp,
VR,
5.836%,
6/12/34 (4)
1,360
1,370
UBS
Group,
VR,
3.091%,
5/14/32 (1)(4)
3,515
2,998
UBS
Group,
VR,
6.246%,
9/22/29 (1)(4)
1,305
1,341
UBS
Group,
VR,
6.537%,
8/12/33 (1)(4)
1,755
1,848
Wells
Fargo,
VR,
6.303%,
10/23/29 (4)
3,460
3,567
Wells
Fargo,
Series
BB,
VR,
3.90% (3)(4)
1,465
1,379
107,357
Brokerage
Asset
Managers
Exchanges
1.9%
HAT
Holdings
I,
8.00%,
6/15/27 (1)
2,210
2,285
Intercontinental
Exchange,
2.65%,
9/15/40
3,278
2,288
Intercontinental
Exchange,
3.00%,
6/15/50
2,705
1,763
Jane
Street
Group,
7.125%,
4/30/31 (1)
2,660
2,700
Lseg
U.S.
Fin,
5.297%,
3/28/34 (1)
985
974
LSEGA
Financing,
3.20%,
4/6/41 (1)
620
460
10,470
Finance
Companies
2.1%
AerCap
Ireland
Capital,
3.30%,
1/30/32
1,650
1,407
AerCap
Ireland
Capital,
5.10%,
1/19/29
635
623
Aircastle
,
4.25%,
6/15/26
3,013
2,930
OneMain
Finance,
9.00%,
1/15/29
710
745
SMBC
Aviation
Capital
Finance,
5.30%,
4/3/29 (1)
3,145
3,104
SMBC
Aviation
Capital
Finance,
5.55%,
4/3/34 (1)
2,700
2,631
11,440
Insurance
6.4%
AIA
Group,
5.375%,
4/5/34 (1)
3,350
3,279
Arthur
J
Gallagher,
5.45%,
7/15/34
2,705
2,674
Assurant,
6.10%,
2/27/26
870
870
Centene
,
2.50%,
3/1/31
1,075
877
T.
ROWE
PRICE
Corporate
Income
Fund
Par/Shares
$
Value
(Amounts
in
000s)
Centene
,
3.00%,
10/15/30
1,015
859
Centene
,
3.375%,
2/15/30
970
854
Centene
,
4.625%,
12/15/29
1,470
1,378
CNO
Financial
Group,
5.25%,
5/30/29
627
604
Corebridge
Financial,
3.85%,
4/5/29
1,980
1,837
Corebridge
Global
Funding,
5.20%,
1/12/29 (1)
540
535
Elevance
Health,
5.125%,
2/15/53
1,450
1,333
Enstar
Group,
3.10%,
9/1/31
4,050
3,285
Equitable
Financial
Life
Global
Funding,
1.80%,
3/8/28 (1)
3,955
3,473
Health
Care
Service
A
Mutual
Legal
Reserve,
2.20%,
6/1/30 (1)
3,685
3,087
Health
Care
Service
A
Mutual
Legal
Reserve,
3.20%,
6/1/50 (1)
3,970
2,561
Humana,
2.15%,
2/3/32
1,185
939
Humana,
5.75%,
4/15/54 (5)
695
670
Humana,
5.875%,
3/1/33
2,645
2,685
Muenchener
Rueckversicherungs-Gesellschaft
in
Muenchen
,
VR,
5.875%,
5/23/42 (1)(4)
1,400
1,404
UnitedHealth
Group,
3.25%,
5/15/51
1,905
1,311
34,515
Real
Estate
Investment
Trusts
2.4%
Brixmor
Operating
Partnership,
3.90%,
3/15/27
400
382
Brixmor
Operating
Partnership,
4.05%,
7/1/30
955
877
Extra
Space
Storage,
4.00%,
6/15/29
3,000
2,808
Invitation
Homes
Operating
Partnership,
5.45%,
8/15/30
2,110
2,102
Kilroy
Realty,
2.50%,
11/15/32
260
193
Kilroy
Realty,
3.05%,
2/15/30
345
290
Kilroy
Realty,
4.25%,
8/15/29
2,980
2,687
Prologis,
5.125%,
1/15/34
3,300
3,245
Starwood
Property
Trust,
7.25%,
4/1/29 (1)
395
393
12,977
Total
Financial
Institutions
176,759
INDUSTRIAL
45.3%
Basic
Industry
1.2%
South32
Treasury,
4.35%,
4/14/32 (1)
4,115
3,709
Yara
International,
7.378%,
11/14/32 (1)
2,640
2,868
6,577
Capital
Goods
2.3%
Boeing,
3.75%,
2/1/50
578
377
Boeing,
6.298%,
5/1/29 (1)
1,510
1,519
Boeing,
6.388%,
5/1/31 (1)
1,310
1,326
Boeing,
7.008%,
5/1/64 (1)
1,775
1,788
Carrier
Global,
5.90%,
3/15/34
1,285
1,335
Ingersoll
Rand,
5.45%,
6/15/34
550
549
Ingersoll
Rand,
5.70%,
6/15/54
460
465
T.
ROWE
PRICE
Corporate
Income
Fund
Par/Shares
$
Value
(Amounts
in
000s)
L3Harris
Technologies,
5.25%,
6/1/31
1,685
1,666
Owens
Corning,
5.70%,
6/15/34
735
737
Owens
Corning,
5.95%,
6/15/54
500
502
Regal
Rexnord,
6.05%,
2/15/26
1,015
1,017
Stanley
Black
&
Decker,
2.75%,
11/15/50
1,646
938
Stanley
Black
&
Decker,
4.85%,
11/15/48
224
191
12,410
Communications
8.4%
AT&T,
3.50%,
9/15/53
3,500
2,358
Charter
Communications
Operating,
2.80%,
4/1/31
6,740
5,487
Charter
Communications
Operating,
5.25%,
4/1/53
1,800
1,419
Charter
Communications
Operating,
6.10%,
6/1/29
585
586
Comcast,
2.887%,
11/1/51
4,090
2,531
Comcast,
3.75%,
4/1/40
1,620
1,313
Crown
Castle,
2.50%,
7/15/31
1,880
1,545
Crown
Castle,
3.80%,
2/15/28
2,870
2,709
Crown
Castle
Towers,
3.663%,
5/15/25 (1)
1,785
1,746
Meta
Platforms,
4.45%,
8/15/52
5,265
4,480
Rogers
Communications,
4.35%,
5/1/49
90
71
Rogers
Communications,
4.55%,
3/15/52
3,310
2,687
Rogers
Communications,
5.00%,
2/15/29
4,125
4,050
SBA
Tower
Trust,
1.631%,
11/15/26 (1)
1,405
1,262
SBA
Tower
Trust,
2.328%,
1/15/28 (1)
820
726
SBA
Tower
Trust,
2.836%,
1/15/25 (1)
3,295
3,227
Sprint
Capital,
8.75%,
3/15/32
1,105
1,316
T-Mobile
USA,
5.75%,
1/15/54
4,850
4,826
Vmed
O2
U.K.
Financing
I,
7.75%,
4/15/32 (1)
1,345
1,311
Warnermedia
Holdings,
6.412%,
3/15/26
1,940
1,940
45,590
Consumer
Cyclical
4.3%
CBRE
Services,
5.50%,
4/1/29
550
550
Flutter
Treasury
Designated
Activity,
6.375%,
4/29/29 (1)
1,345
1,353
Ford
Motor
Credit,
5.80%,
3/5/27
1,155
1,151
Ford
Motor
Credit,
6.95%,
3/6/26
2,595
2,635
General
Motors
Financial,
5.55%,
7/15/29
1,675
1,669
GLP
Capital,
5.375%,
4/15/26
1,719
1,705
Hyundai
Capital
America,
5.35%,
3/19/29 (1)
690
685
Hyundai
Capital
America,
5.40%,
1/8/31 (1)
550
546
Hyundai
Capital
America,
6.20%,
9/21/30 (1)
1,305
1,347
Hyundai
Capital
America,
6.50%,
1/16/29 (1)
860
892
Las
Vegas
Sands,
5.90%,
6/1/27
620
621
Nissan
Motor,
4.81%,
9/17/30 (1)
3,910
3,598
Nissan
Motor
Acceptance,
1.85%,
9/16/26 (1)
1,270
1,155
T.
ROWE
PRICE
Corporate
Income
Fund
Par/Shares
$
Value
(Amounts
in
000s)
Nissan
Motor
Acceptance,
6.95%,
9/15/26 (1)(5)
150
153
Phinia
,
6.75%,
4/15/29 (1)
330
331
VF,
2.95%,
4/23/30 (5)
3,385
2,736
Volkswagen
Group
of
America
Finance,
5.60%,
3/22/34 (1)
1,215
1,203
ZF
North
America
Capital,
6.75%,
4/23/30 (1)
1,245
1,258
23,588
Consumer
Non-Cyclical
13.0%
AbbVie,
4.05%,
11/21/39
2,245
1,945
AbbVie,
4.25%,
11/21/49
665
552
AbbVie,
4.70%,
5/14/45
1,390
1,259
AbbVie,
4.875%,
11/14/48
2,085
1,918
AbbVie,
5.40%,
3/15/54
1,895
1,866
Amgen,
5.60%,
3/2/43
690
684
BAT
Capital,
5.834%,
2/20/31
2,125
2,149
BAT
Capital,
6.343%,
8/2/30
2,280
2,380
BAT
Capital,
7.081%,
8/2/53
1,305
1,405
Bayer
U.S.
Finance,
6.25%,
1/21/29 (1)
870
884
Bayer
U.S.
Finance,
6.375%,
11/21/30 (1)
1,535
1,566
Bayer
U.S.
Finance
II,
4.70%,
7/15/64 (1)
1,181
863
Becton
Dickinson
&
Company,
3.794%,
5/20/50
1,117
841
Becton
Dickinson
&
Company,
4.669%,
6/6/47
3,168
2,751
CVS
Health,
5.05%,
3/25/48
7,370
6,364
HCA,
3.625%,
3/15/32
1,570
1,372
Icon
Investments
Six,
5.849%,
5/8/29
370
373
Icon
Investments
Six,
6.00%,
5/8/34
310
315
Imperial
Brands
Finance,
6.125%,
7/27/27 (1)
3,155
3,203
IQVIA,
5.70%,
5/15/28
4,065
4,075
Kenvue
,
5.10%,
3/22/43
1,510
1,453
Mattel,
5.875%,
12/15/27 (1)
2,730
2,710
Pfizer
Investment
Enterprises,
5.30%,
5/19/53
4,040
3,866
Pfizer
Investment
Enterprises,
5.34%,
5/19/63
1,380
1,296
Philip
Morris
International,
5.125%,
2/15/30
2,760
2,739
Philip
Morris
International,
5.75%,
11/17/32
3,410
3,476
Revvity
,
1.90%,
9/15/28
5,985
5,188
Solventum
,
5.45%,
3/13/31 (1)
4,105
4,045
Solventum
,
5.60%,
3/23/34 (1)
1,960
1,926
Solventum
,
5.90%,
4/30/54 (1)
1,370
1,315
Sysco,
4.45%,
3/15/48
135
112
Teva
Pharmaceutical
Finance,
6.15%,
2/1/36
1,880
1,814
Teva
Pharmaceutical
Finance
Netherlands
III,
7.875%,
9/15/29
200
212
Utah
Acquisition
Sub,
5.25%,
6/15/46
1,440
1,180
Viatris
,
1.65%,
6/22/25
610
584
T.
ROWE
PRICE
Corporate
Income
Fund
Par/Shares
$
Value
(Amounts
in
000s)
Viterra
Finance,
4.90%,
4/21/27 (1)
1,600
1,571
70,252
Energy
10.9%
Cheniere
Energy,
5.65%,
4/15/34 (1)
1,030
1,022
Cheniere
Energy
Partners,
3.25%,
1/31/32
756
640
Cheniere
Energy
Partners,
5.95%,
6/30/33
2,262
2,276
Chesapeake
Energy,
5.875%,
2/1/29 (1)
2,720
2,669
Diamondback
Energy,
5.75%,
4/18/54
1,165
1,121
Enbridge,
5.625%,
4/5/34
885
877
Enbridge,
5.95%,
4/5/54 (5)
1,435
1,420
Enbridge,
6.20%,
11/15/30
2,505
2,613
Enbridge,
6.70%,
11/15/53
890
971
Energy
Transfer,
5.95%,
5/15/54
1,460
1,402
Energy
Transfer,
6.40%,
12/1/30
1,280
1,338
Eni,
5.50%,
5/15/34 (1)
830
825
Eni,
5.95%,
5/15/54 (1)
1,025
1,016
Hess,
5.60%,
2/15/41
1,962
1,936
Hess,
7.125%,
3/15/33
400
444
Hilcorp
Energy
I,
6.00%,
4/15/30 (1)
825
796
Hilcorp
Energy
I,
8.375%,
11/1/33 (1)
375
399
Kinetik
Holdings,
6.625%,
12/15/28 (1)
1,015
1,023
Occidental
Petroleum,
6.125%,
1/1/31
557
569
Occidental
Petroleum,
6.60%,
3/15/46
1,400
1,468
Occidental
Petroleum,
7.50%,
5/1/31
655
721
Occidental
Petroleum,
8.875%,
7/15/30
2,280
2,602
ONEOK,
5.80%,
11/1/30
2,280
2,321
Patterson-UTI
Energy,
7.15%,
10/1/33
690
726
Raizen
Fuels
Finance,
6.45%,
3/5/34 (1)
1,310
1,331
Seadrill
Finance,
8.375%,
8/1/30 (1)
1,235
1,297
Targa
Resources
Partners,
5.50%,
3/1/30
2,818
2,772
Targa
Resources
Partners,
6.875%,
1/15/29
1,766
1,812
TER
Finance
Jersey,
Series
21,
Zero
Coupon,
1/2/25 (1)(6)
1,600
1,540
TransCanada
PipeLines
,
6.203%,
3/9/26
4,050
4,029
Transcontinental
Gas
Pipe
Line,
3.95%,
5/15/50
4,000
3,052
Var
Energi
,
7.50%,
1/15/28 (1)
2,510
2,644
Var
Energi
,
8.00%,
11/15/32 (1)
2,675
2,992
Venture
Global
LNG,
9.50%,
2/1/29 (1)
2,575
2,784
Western
Midstream
Operating,
4.05%,
2/1/30
1,170
1,079
Western
Midstream
Operating,
6.35%,
1/15/29
2,595
2,674
59,201
Industrial
Other
0.4%
Booz
Allen
Hamilton,
5.95%,
8/4/33
730
750
T.
ROWE
PRICE
Corporate
Income
Fund
Par/Shares
$
Value
(Amounts
in
000s)
Jacobs
Engineering
Group,
6.35%,
8/18/28
1,225
1,254
2,004
Technology
2.8%
Atlassian
,
5.25%,
5/15/29
825
822
Broadcom,
2.45%,
2/15/31 (1)
2,430
2,027
Broadcom,
3.419%,
4/15/33 (1)
877
748
Fiserv,
5.45%,
3/15/34
3,735
3,705
Foundry
JV
Holdco,
5.90%,
1/25/30 (1)
235
238
Foundry
JV
Holdco,
6.15%,
1/25/32 (1)
1,885
1,925
Foundry
JV
Holdco,
6.40%,
1/25/38 (1)
555
568
Motorola
Solutions,
5.40%,
4/15/34
770
761
Motorola
Solutions,
5.60%,
6/1/32
1,560
1,565
Oracle,
4.90%,
2/6/33
1,385
1,336
Oracle,
6.25%,
11/9/32
1,280
1,345
15,040
Transportation
2.0%
Canadian
Pacific
Railway,
3.50%,
5/1/50
4,010
2,877
ERAC
USA
Finance,
4.90%,
5/1/33 (1)
2,470
2,387
Norfolk
Southern,
5.95%,
3/15/64
2,645
2,694
Transurban
Finance,
2.45%,
3/16/31 (1)
3,335
2,759
10,717
Total
Industrial
245,379
MISCELLANEOUS
0.5%
Miscellaneous
0.5%
Ally
Financial,
VR,
6.848%,
1/3/30 (4)
1,254
1,297
Ally
Financial,
VR,
6.992%,
6/13/29 (4)
1,275
1,313
Total
Miscellaneous
2,610
UTILITY
9.2%
Electric
8.5%
AEP
Texas,
4.70%,
5/15/32
2,825
2,651
American
Electric
Power,
5.625%,
3/1/33
1,325
1,314
American
Electric
Power,
5.95%,
11/1/32
780
797
Appalachian
Power,
5.65%,
4/1/34
1,440
1,419
DTE
Energy,
5.10%,
3/1/29
3,805
3,750
Duke
Energy,
5.00%,
8/15/52
1,533
1,336
Edison
International,
6.95%,
11/15/29
1,485
1,575
Enel
Finance
International,
5.00%,
6/15/32 (1)
3,090
2,949
Eversource
Energy,
5.85%,
4/15/31
3,145
3,172
Exelon,
3.35%,
3/15/32
1,200
1,044
Exelon,
5.60%,
3/15/53
3,400
3,277
FirstEnergy,
2.65%,
3/1/30
653
563
FirstEnergy,
Series
B,
2.25%,
9/1/30
318
263
T.
ROWE
PRICE
Corporate
Income
Fund
Par/Shares
$
Value
(Amounts
in
000s)
FirstEnergy,
Series
C,
3.40%,
3/1/50
2,143
1,414
Georgia
Power,
4.70%,
5/15/32
2,005
1,932
Georgia
Power,
4.95%,
5/17/33
2,950
2,864
New
York
State
Electric
&
Gas,
5.85%,
8/15/33 (1)
1,195
1,209
Niagara
Mohawk
Power,
5.783%,
9/16/52 (1)
2,150
2,102
OGE
Energy,
5.45%,
5/15/29
415
416
Pacific
Gas
&
Electric,
4.55%,
7/1/30
2,645
2,497
Pacific
Gas
&
Electric,
6.70%,
4/1/53
980
1,034
Pacific
Gas
&
Electric,
6.95%,
3/15/34
1,540
1,661
Southern
California
Edison,
5.45%,
6/1/31
500
502
Southern
California
Edison,
Series
20A,
2.95%,
2/1/51
3,060
1,902
Vistra
Operations,
3.70%,
1/30/27 (1)
1,900
1,798
Vistra
Operations,
6.875%,
4/15/32 (1)
2,295
2,307
45,748
Natural
Gas
0.7%
Boston
Gas,
6.119%,
7/20/53 (1)
1,005
992
Engie
,
5.625%,
4/10/34 (1)
1,285
1,287
Sempra,
3.70%,
4/1/29
1,770
1,648
3,927
Total
Utility
49,675
Total
Corporate
Bonds
(Cost
$492,803)
474,423
FOREIGN
GOVERNMENT
OBLIGATIONS
&
MUNICIPALITIES
2.9%
Owned
No
Guarantee
1.2%
NBN,
2.625%,
5/5/31 (1)
4,840
4,131
Republic
of
Chile,
3.625%,
8/1/27
2,200
2,078
6,209
Sovereign
1.7%
Kingdom
of
Saudi
Arabia,
5.75%,
1/16/54 (1)
2,030
1,966
Republic
of
Panama,
7.50%,
3/1/31
1,185
1,227
Republic
of
Panama,
7.875%,
3/1/57
1,300
1,340
Republic
of
Romania,
5.875%,
1/30/29 (1)
2,460
2,441
United
Mexican
States,
5.00%,
5/7/29
2,800
2,734
9,708
Total
Foreign
Government
Obligations
&
Municipalities
(Cost
$16,665)
15,917
T.
ROWE
PRICE
Corporate
Income
Fund
Par/Shares
$
Value
(Amounts
in
000s)
MUNICIPAL
SECURITIES
0.3%
Colorado
0.1%
Colorado
HFA,
Covenant
Living
Community,
Series B,
2.80%,
12/1/26
575
540
540
Puerto
Rico
0.2%
Puerto
Rico
Commonwealth,
GO,
VR,
11/1/43 (7)
2,017
1,250
1,250
Total
Municipal
Securities
(Cost
$1,622)
1,790
U.S.
GOVERNMENT
AGENCY
OBLIGATIONS
(EXCLUDING
MORTGAGE-BACKED)
1.6%
U.S.
Treasury
Obligations
1.6%
U.S.
Treasury
Bonds,
4.125%,
8/15/53 (8)
4,525
4,151
U.S.
Treasury
Bonds,
4.375%,
8/15/43 (8)
1,810
1,729
U.S.
Treasury
Bonds,
4.75%,
2/15/37 (8)
2,670
2,743
Total
U.S.
Government
Agency
Obligations
(Excluding
Mortgage-Backed)
(Cost
$9,048)
8,623
SHORT-TERM
INVESTMENTS
0.7%
Money
Market
Funds
0.7%
T.
Rowe
Price
Government
Reserve
Fund,
5.39% (9)(10)
3,531
3,531
Total
Short-Term
Investments
(Cost
$3,531)
3,531
SECURITIES
LENDING
COLLATERAL
1.0%
INVESTMENTS
IN
A
POOLED
ACCOUNT
THROUGH
SECURITIES
LENDING
PROGRAM
WITH
STATE
STREET
BANK
AND
TRUST
COMPANY 1.0%
Money
Market
Funds 1.0%
T.
Rowe
Price
Government
Reserve
Fund,
5.39% (9)(10)
5,263
5,263
Total
Investments
in
a
Pooled
Account
through
Securities
Lending
Program
with
State
Street
Bank
and
Trust
Company
5,263
Total
Securities
Lending
Collateral
(Cost
$5,263)
5,263
T.
ROWE
PRICE
Corporate
Income
Fund
(Amounts
in
000s,
except
for
contracts)
OPTIONS
PURCHASED 0.0%
Exchange-Traded
Options
Purchased 0.0%
Description
Contracts
Notional
Amount
$
Value
U.S.
Treasury
10-Year
Notes
Futures,
Put,
6/21/24
@
$107.75 (11)
241
26,220
57
Total
Exchange-Traded
Options
Purchased
(Cost
$117)
57
OTC
Options
Purchased 0.0%
Counterparty
Description
Contracts
Notional
Amount
$
Value
Morgan
Stanley
30
Year
Interest
Rate
Swap,
8/12/54
Pay
Fixed
3.80%
Annually,
Receive
Variable
5.34%
(SOFR)
Annually,
8/8/24
@
3.80%* (11)
1
5,480
164
Total
OTC
Options
Purchased
(Cost
$171)
164
Total
Options
Purchased
(Cost
$288)
221
Total
Investments
in
Securities
99.9%
of
Net
Assets
(Cost
$561,607)
$
541,043
‡
Par/Shares
and
Notional
Amount
are
denominated
in
U.S.
dollars
unless
otherwise
noted.
*
Exercise
Spread
(1)
Security
was
purchased
pursuant
to
Rule
144A
under
the
Securities
Act
of
1933
and
may
be
resold
in
transactions
exempt
from
registration
only
to
qualified
institutional
buyers.
Total
value
of
such
securities
at
period-end
amounts
to
$188,288
and
represents
34.8%
of
net
assets.
(2)
Bank
loan
positions
may
involve
multiple
underlying
tranches.
In
those
instances,
the
position
presented
reflects
the
aggregate
of
those
respective
underlying
tranches
and
the
rate
presented
reflects
the
weighted
average
rate
of
the
settled
positions.
(3)
Perpetual
security
with
no
stated
maturity
date.
(4)
Security
is
a
fix-to-float
security,
which
carries
a
fixed
coupon
until
a
certain
date,
upon
which
it
switches
to
a
floating
rate.
Reference
rate
and
spread
are
provided
if
the
rate
is
currently
floating.
(5)
See
Note
4
.
All
or
a
portion
of
this
security
is
on
loan
at
May
31,
2024.
(6)
See
Note
2.
Level
3
in
fair
value
hierarchy.
T.
ROWE
PRICE
Corporate
Income
Fund
.
.
.
.
.
.
.
.
.
.
(7)
Contingent
value
instrument
that
only
pays
out
if
a
portion
of
the
territory's
Sales
and
Use
Tax
outperforms
the
projections
in
the
Oversight
Board’s
Certified
Fiscal
Plan.
(8)
At
May
31,
2024,
all
or
a
portion
of
this
security
is
pledged
as
collateral
and/
or
margin
deposit
to
cover
future
funding
obligations.
(9)
Seven-day
yield
(10)
Affiliated
Companies
(11)
Non-income
producing
1M
TSFR
One
month
term
SOFR
(Secured
overnight
financing
rate)
3M
TSFR
Three
month
term
SOFR
(Secured
overnight
financing
rate)
CLO
Collateralized
Loan
Obligation
EUR
Euro
FRN
Floating
Rate
Note
GO
General
Obligation
HFA
Health
Facility
Authority
OTC
Over-the-counter
SOFR
Secured
overnight
financing
rate
VR
Variable
Rate;
rate
shown
is
effective
rate
at
period-end.
The
rates
for
certain
variable
rate
securities
are
not
based
on
a
published
reference
rate
and
spread
but
are
determined
by
the
issuer
or
agent
and
based
on
current
market
conditions.
T.
ROWE
PRICE
Corporate
Income
Fund
(Amounts
in
000s)
SWAPS
0.5%
Description
Notional
Amount
$
Value
Upfront
Payments/
$
(Receipts)
**
Unrealized
$
Gain/(Loss)
BILATERAL
SWAPS
0.0%
Credit
Default
Swaps,
Protection
Sold
0.0%
Barclays
Bank,
Protection
Sold
(Relevant
Credit:
JPMorgan
Chase,
A1*),
Receive
1.00%
Quarterly,
Pay
upon
credit
default,
12/20/24
3,975
26
3
23
BNP
Paribas,
Protection
Sold
(Relevant
Credit:
Morgan
Stanley,
A1*),
Receive
1.00%
Quarterly,
Pay
upon
credit
default,
12/20/24
3,975
26
(6)
32
Total
Bilateral
Credit
Default
Swaps,
Protection
Sold
(3)
55
Total
Return
Swaps
(0.0)%
JPMorgan
Chase,
Receive
Underlying
Reference:
iBoxx
USD
Liquid
Investment
Grade
Index
at
Maturity,
Pay
Variable
5.343%
(SOFR
+
0.00%)
at
Maturity,
6/20/24
304
(3)
(3)
—
Morgan
Stanley,
Receive
Underlying
Reference:
iBoxx
USD
Liquid
Investment
Grade
Index
at
Maturity,
Pay
Variable
5.310%
(SOFR
+
0.00%)
at
Maturity,
6/20/24
342
3
(2)
5
Morgan
Stanley,
Receive
Underlying
Reference:
iBoxx
USD
Liquid
Investment
Grade
Index
at
Maturity,
Pay
Variable
5.343%
(SOFR
+
0.00%)
at
Maturity,
6/20/24
342
(3)
(2)
(1)
Morgan
Stanley,
Receive
Underlying
Reference:
iBoxx
USD
Liquid
Investment
Grade
Index
at
Maturity,
Pay
Variable
5.343%
(SOFR
+
0.00%)
at
Maturity,
6/20/24
342
(2)
(3)
1
Total
Bilateral
Total
Return
Swaps
(10)
5
Total
Bilateral
Swaps
(13)
60
T.
ROWE
PRICE
Corporate
Income
Fund
(Amounts
in
000s)
Description
Notional
Amount
$
Value
Initial
$
Value
**
Unrealized
$
Gain/(Loss)
CENTRALLY
CLEARED
SWAPS
0.5%
Credit
Default
Swaps,
Protection
Bought
(0.0)%
Protection
Bought
(Relevant
Credit:
Tesla),
Pay
1.00%
Quarterly,
Receive
upon
credit
default,
6/20/26
1,880
(27)
73
(100)
Total
Centrally
Cleared
Credit
Default
Swaps,
Protection
Bought
(100)
Credit
Default
Swaps,
Protection
Sold
0.5%
Protection
Sold
(Relevant
Credit:
Freeport-McMoRan,
Baa2*),
Receive
1.00%
Quarterly,
Pay
upon
credit
default,
12/20/28
2,760
37
(10)
47
Protection
Sold
(Relevant
Credit:
Markit
CDX.NA.HY-S42,
5
Year
Index),
Receive
5.00%
Quarterly,
Pay
upon
credit
default,
6/20/29
14,875
1,159
1,025
134
Protection
Sold
(Relevant
Credit:
Markit
CDX.NA.IG-S42,
5
Year
Index),
Receive
1.00%
Quarterly,
Pay
upon
credit
default,
6/20/29
54,156
1,324
1,223
101
Protection
Sold
(Relevant
Credit:
Markit
iTraxx
Europe-S41,
5
Year
Index),
Receive
1.00%
Quarterly,
Pay
upon
credit
default,
6/20/29
(EUR)
9,935
259
258
1
Protection
Sold
(Relevant
Credit:
United
Mexican
States,
Baa2*),
Receive
1.00%
Quarterly,
Pay
upon
credit
default,
6/20/29
*
4,000
17
9
8
Total
Centrally
Cleared
Credit
Default
Swaps,
Protection
Sold
291
Total
Centrally
Cleared
Swaps
191
Net
payments
(receipts)
of
variation
margin
to
date
(150)
Variation
margin
receivable
(payable)
on
centrally
cleared
swaps
$
41
*
Credit
ratings
as
of
May
31,
2024.
Ratings
shown
are
from
Moody’s
Investors
Service
and
if
Moody’s
does
not
rate
a
security,
then
Standard
&
Poor’s
(S&P)
is
used.
Fitch
is
used
for
securities
that
are
not
rated
by
either
Moody’s
or
S&P.
**
Includes
interest
purchased
or
sold
but
not
yet
collected
of
$133.
T.
ROWE
PRICE
Corporate
Income
Fund
FUTURES
CONTRACTS
($000s)
Expiration
Date
Notional
Amount
Value
and
Unrealized
Gain
(Loss)
Long,
368
U.S.
Treasury
Long
Bond
contracts
9/24
42,711
$
(320)
Short,
105
U.S.
Treasury
Notes
five
year
contracts
9/24
(11,109)
4
Short,
342
U.S.
Treasury
Notes
ten
year
contracts
9/24
(37,208)
58
Long,
253
U.S.
Treasury
Notes
two
year
contracts
9/24
51,537
22
Long,
102
Ultra
U.S.
Treasury
Bonds
contracts
9/24
12,489
(143)
Short,
115
Ultra
U.S.
Treasury
Notes
ten
year
contracts
9/24
(12,884)
45
Net
payments
(receipts)
of
variation
margin
to
date
466
Variation
margin
receivable
(payable)
on
open
futures
contracts
$
132
T.
ROWE
PRICE
Corporate
Income
Fund
The
accompanying
notes
are
an
integral
part
of
these
financial
statements.
AFFILIATED
COMPANIES
($000s)
The
fund
may
invest
in
certain
securities
that
are
considered
affiliated
companies.
As
defined
by
the
1940
Act,
an
affiliated
company
is
one
in
which
the
fund
owns
5%
or
more
of
the
outstanding
voting
securities,
or
a
company
that
is
under
common
ownership
or
control.
The
following
securities
were
considered
affiliated
companies
for
all
or
some
portion
of
the
year
ended
May
31,
2024.
Net
realized
gain
(loss),
investment
income,
change
in
net
unrealized
gain/loss,
and
purchase
and
sales
cost
reflect
all
activity
for
the
period
then
ended.
Affiliate
Net
Realized
Gain
(Loss)
Change
in
Net
Unrealized
Gain/Loss
Investment
Income
T.
Rowe
Price
Government
Reserve
Fund,
5.39%
$
—
$
—
$
419++
Totals
$
—#
$
—
$
419+
Supplementary
Investment
Schedule
Affiliate
Value
05/31/23
Purchase
Cost
Sales
Cost
Value
05/31/24
T.
Rowe
Price
Government
Reserve
Fund,
5.39%
$
10,420
¤
¤
$
8,794
Total
$
8,794^
#
Capital
gain
distributions
from
underlying
Price
funds
represented
$0
of
the
net
realized
gain
(loss).
++
Excludes
earnings
on
securities
lending
collateral,
which
are
subject
to
rebates
and
fees
as
described
in
Note
4
.
+
Investment
income
comprised
$419
of
dividend
income
and
$0
of
interest
income.
¤
Purchase
and
sale
information
not
shown
for
cash
management
funds.
^
The
cost
basis
of
investments
in
affiliated
companies
was
$8,794.
T.
ROWE
PRICE
Corporate
Income
Fund
May
31,
2024
Statement
of
Assets
and
Liabilities
($000s,
except
shares
and
per
share
amounts)
Assets
Investments
in
securities,
at
value
(cost
$561,607)
$
541,043
Interest
receivable
6,120
Variation
margin
receivable
on
futures
contracts
132
Due
from
affiliates
76
Unrealized
gain
on
bilateral
swaps
61
Variation
margin
receivable
on
centrally
cleared
swaps
41
Receivable
for
shares
sold
37
Foreign
currency
(cost
$31)
31
Cash
21
Bilateral
swap
premiums
paid
3
Other
assets
35
Total
assets
547,600
Liabilities
Obligation
to
return
securities
lending
collateral
5,263
Payable
for
shares
redeemed
380
Investment
management
fees
payable
162
Bilateral
swap
premiums
received
16
Unrealized
loss
on
bilateral
swaps
1
Other
liabilities
53
Total
liabilities
5,875
Commitments
and
Contingent
Liabilities
(note
6
)
NET
ASSETS
$
541,725
T.
ROWE
PRICE
Corporate
Income
Fund
May
31,
2024
Statement
of
Assets
and
Liabilities
($000s,
except
shares
and
per
share
amounts)
The
accompanying
notes
are
an
integral
part
of
these
financial
statements.
Net
Assets
Consist
of:
Total
distributable
earnings
(loss)
$
(
134,219
)
Paid-in
capital
applicable
to
68,637,146
shares
of
$0.0001
par
value
capital
stock
outstanding;
1,000,000,000
shares
authorized
675,944
NET
ASSETS
$
541,725
NET
ASSET
VALUE
PER
SHARE
Investor
Class
(Net
assets:
$126,974;
Shares
outstanding:
16,094,609)
$
7.89
I
Class
(Net
assets:
$149,202;
Shares
outstanding:
18,894,691)
$
7.90
Z
Class
(Net
assets:
$265,549;
Shares
outstanding:
33,647,846)
$
7.89
T.
ROWE
PRICE
Corporate
Income
Fund
Year
Ended
5/31/24
Investment
Income
(Loss)
Income
Interest
$
26,786
Dividend
419
Securities
lending
16
Other
1
Total
income
27,222
Expenses
Investment
management
1,911
Shareholder
servicing
Investor
Class
$
362
I
Class
62
424
Prospectus
and
shareholder
reports
Investor
Class
16
I
Class
4
Z
Class
4
24
Custody
and
accounting
205
Registration
64
Legal
and
audit
39
Directors
2
Proxy
and
annual
meeting
1
Miscellaneous
20
Waived
/
paid
by
Price
Associates
(
1,308
)
Total
expenses
1,382
Net
investment
income
25,840
T.
ROWE
PRICE
Corporate
Income
Fund
The
accompanying
notes
are
an
integral
part
of
these
financial
statements.
Year
Ended
5/31/24
Realized
and
Unrealized
Gain
/
Loss
–
Net
realized
gain
(loss)
Securities
(
22,905
)
Futures
(
1,863
)
Swaps
1,086
Options
written
69
Foreign
currency
transactions
(
2
)
Net
realized
loss
(
23,615
)
Change
in
net
unrealized
gain
/
loss
Securities
25,140
Futures
(
351
)
Swaps
256
Change
in
net
unrealized
gain
/
loss
25,045
Net
realized
and
unrealized
gain
/
loss
1,430
INCREASE
IN
NET
ASSETS
FROM
OPERATIONS
$
27,270
T.
ROWE
PRICE
Corporate
Income
Fund
Statement
of
Changes
in
Net
Assets
Year
.
.
.
.
.
.
.
.
.
.
.
.
.
.
Ended
.
.
.
.
.
.
.
.
.
.
.
.
.
.
5/31/24
5/31/23
Increase
(Decrease)
in
Net
Assets
Operations
Net
investment
income
$
25,840
$
22,686
Net
realized
loss
(
23,615
)
(
61,612
)
Change
in
net
unrealized
gain
/
loss
25,045
24,452
Increase
(decrease)
in
net
assets
from
operations
27,270
(
14,474
)
Distributions
to
shareholders
Net
earnings
Investor
Class
(
6,042
)
(
5,452
)
I
Class
(
7,004
)
(
5,893
)
Z
Class
(
13,313
)
(
11,222
)
Decrease
in
net
assets
from
distributions
(
26,359
)
(
22,567
)
Capital
share
transactions
*
Shares
sold
Investor
Class
16,897
15,962
I
Class
21,705
19,359
Z
Class
4,069
4,672
Distributions
reinvested
Investor
Class
5,568
4,995
I
Class
6,094
5,152
Z
Class
13,394
11,222
Shares
redeemed
Investor
Class
(
37,577
)
(
34,833
)
I
Class
(
28,403
)
(
27,718
)
Z
Class
(
11,640
)
(
21,590
)
Decrease
in
net
assets
from
capital
share
transactions
(
9,893
)
(
22,779
)
T.
ROWE
PRICE
Corporate
Income
Fund
Statement
of
Changes
in
Net
Assets
The
accompanying
notes
are
an
integral
part
of
these
financial
statements.
Year
.
.
.
.
.
.
.
.
.
.
.
.
.
.
Ended
.
.
.
.
.
.
.
.
.
.
.
.
.
.
5/31/24
5/31/23
Net
Assets
Decrease
during
period
(
8,982
)
(
59,820
)
Beginning
of
period
550,707
610,527
End
of
period
$
541,725
$
550,707
*Share
information
(000s)
Shares
sold
Investor
Class
2,153
2,008
I
Class
2,786
2,438
Z
Class
519
569
Distributions
reinvested
Investor
Class
712
633
I
Class
778
652
Z
Class
1,712
1,420
Shares
redeemed
Investor
Class
(
4,800
)
(
4,409
)
I
Class
(
3,626
)
(
3,514
)
Z
Class
(
1,491
)
(
2,729
)
Decrease
in
shares
outstanding
(
1,257
)
(
2,932
)
T.
ROWE
PRICE
Corporate
Income
Fund
NOTES
TO
FINANCIAL
STATEMENTS
T.
Rowe
Price
Corporate
Income
Fund,
Inc. (the
fund) is
registered
under
the
Investment
Company
Act
of
1940
(the
1940
Act)
as a
diversified, open-end
management
investment
company.
The
fund
seeks
to
provide
high
income
and
some
capital
growth.
The
fund
has three classes
of
shares:
the
Corporate
Income
Fund
(Investor
Class),
the
Corporate
Income
Fund–I
Class
(I
Class)
and
the
Corporate
Income
Fund–Z
Class
(Z
Class).
I
Class
shares
require
a
$500,000
initial
investment
minimum,
although
the
minimum
generally
is
waived
or
reduced
for
financial
intermediaries,
eligible
retirement
plans,
and
certain
other
accounts.
The
Z
Class
is
only
available
to
funds
advised
by
T.
Rowe
Price
Associates,
Inc.
and
its
affiliates
and
other
clients
that
are
subject
to
a
contractual
fee
for
investment
management
services. Each
class
has
exclusive
voting
rights
on
matters
related
solely
to
that
class;
separate
voting
rights
on
matters
that
relate
to
all
classes;
and,
in
all
other
respects,
the
same
rights
and
obligations
as
the
other
classes.
NOTE
1
-
SIGNIFICANT
ACCOUNTING
POLICIES
Basis
of
Preparation
The fund
is
an
investment
company
and
follows
accounting
and
reporting
guidance
in
the
Financial
Accounting
Standards
Board
(FASB)
Accounting
Standards
Codification
Topic
946
(ASC
946).
The
accompanying
financial
statements
were
prepared
in
accordance
with
accounting
principles
generally
accepted
in
the
United
States
of
America
(GAAP),
including,
but
not
limited
to,
ASC
946.
GAAP
requires
the
use
of
estimates
made
by
management.
Management
believes
that
estimates
and
valuations
are
appropriate;
however,
actual
results
may
differ
from
those
estimates,
and
the
valuations
reflected
in
the
accompanying
financial
statements
may
differ
from
the
value
ultimately
realized
upon
sale
or
maturity.
Investment
Transactions,
Investment
Income,
and
Distributions
Investment
transactions
are
accounted
for
on
the
trade
date
basis.
Income
and
expenses
are
recorded
on
the
accrual
basis.
Realized
gains
and
losses
are
reported
on
the
identified
cost
basis. Premiums
and
discounts
on
debt
securities
are
amortized
for
financial
reporting
purposes. Paydown
gains
and
losses
are
recorded
as
an
adjustment
to
interest
income. Income
tax-related
interest
and
penalties,
if
incurred,
are
recorded
as
income
tax
expense. Dividends
received
from other
investment
companies are
reflected
as
dividend income;
capital
gain
distributions
are
reflected
as
realized
gain/loss. Dividend
income and
capital
gain
distributions
are
recorded
on
the
ex-dividend
date. Earnings
on
T.
ROWE
PRICE
Corporate
Income
Fund
investments
recognized
as
partnerships
for
federal
income
tax
purposes
reflect
the
tax
character
of
such
earnings. Non-cash
dividends,
if
any,
are
recorded
at
the
fair
market
value
of
the
asset
received. Proceeds
from
litigation
payments,
if
any,
are
included
in
either
net
realized
gain
(loss)
or
change
in
net
unrealized
gain/loss
from
securities. Distributions
to
shareholders
are
recorded
on
the
ex-dividend
date. Income
distributions,
if
any, are
declared
by
each
class daily
and
paid
monthly. A
capital
gain
distribution,
if
any, may
also
be
declared
and
paid
by
the
fund
annually.
Currency
Translation
Assets,
including
investments,
and
liabilities
denominated
in
foreign
currencies
are
translated
into
U.S.
dollar
values
each
day
at
the
prevailing
exchange
rate,
using
the
mean
of
the
bid
and
asked
prices
of
such
currencies
against
U.S.
dollars
as
provided
by
an
outside
pricing
service.
Purchases
and
sales
of
securities,
income,
and
expenses
are
translated
into
U.S.
dollars
at
the
prevailing
exchange
rate
on
the
respective
date
of
such
transaction.
The
effect
of
changes
in
foreign
currency
exchange
rates
on
realized
and
unrealized
security
gains
and
losses
is
not
bifurcated
from
the
portion
attributable
to
changes
in
market
prices.
Class
Accounting
Shareholder
servicing,
prospectus,
and
shareholder
report
expenses
incurred
by
each
class
are
charged
directly
to
the
class
to
which
they
relate.
Expenses
common
to
all
classes
and
investment
income
are
allocated
to
the
classes
based
upon
the
relative
daily
net
assets
of
each
class’s
settled
shares;
realized
and
unrealized
gains
and
losses
are
allocated
based
upon
the
relative
daily
net
assets
of
each
class’s
outstanding
shares.
Capital
Transactions
Each
investor’s
interest
in
the
net
assets
of the
fund
is
represented
by
fund
shares. The
fund’s
net
asset
value
(NAV)
per
share
is
computed
at
the
close
of
the
New
York
Stock
Exchange
(NYSE),
normally
4
p.m.
ET,
each
day
the
NYSE
is
open
for
business.
However,
the
NAV
per
share
may
be
calculated
at
a
time
other
than
the
normal
close
of
the
NYSE
if
trading
on
the
NYSE
is
restricted,
if
the
NYSE
closes
earlier,
or
as
may
be
permitted
by
the
SEC.
Purchases
and
redemptions
of
fund
shares
are
transacted
at
the
next-computed
NAV
per
share,
after
receipt
of
the
transaction
order
by
T.
Rowe
Price
Associates,
Inc.,
or
its
agents.
Indemnification
In
the
normal
course
of
business, the
fund
may
provide
indemnification
in
connection
with
its
officers
and
directors,
service
providers,
and/or
private
company
investments. The
fund’s
maximum
exposure
under
these
arrangements
is
unknown;
however,
the
risk
of
material
loss
is
currently
considered
to
be
remote.
T.
ROWE
PRICE
Corporate
Income
Fund
NOTE
2
-
VALUATION
Fair
Value
The
fund’s
financial
instruments
are
valued
at
the
close
of
the
NYSE
and
are
reported
at
fair
value,
which
GAAP
defines
as
the
price
that
would
be
received
to
sell
an
asset
or
paid
to
transfer
a
liability
in
an
orderly
transaction
between
market
participants
at
the
measurement
date. The fund’s
Board
of
Directors
(the
Board)
has
designated
T.
Rowe
Price
Associates,
Inc.
as
the
fund’s
valuation
designee
(Valuation
Designee).
Subject
to
oversight
by
the
Board,
the
Valuation
Designee
performs
the
following
functions
in
performing
fair
value
determinations:
assesses
and
manages
valuation
risks;
establishes
and
applies
fair
value
methodologies;
tests
fair
value
methodologies;
and
evaluates
pricing
vendors
and
pricing
agents.
The
duties
and
responsibilities
of
the
Valuation
Designee
are
performed
by
its
Valuation
Committee. The
Valuation
Designee provides
periodic
reporting
to
the
Board
on
valuation
matters.
Various
valuation
techniques
and
inputs
are
used
to
determine
the
fair
value
of
financial
instruments.
GAAP
establishes
the
following
fair
value
hierarchy
that
categorizes
the
inputs
used
to
measure
fair
value:
Level
1
–
quoted
prices
(unadjusted)
in
active
markets
for
identical
financial
instruments
that
the
fund
can
access
at
the
reporting
date
Level
2
–
inputs
other
than
Level
1
quoted
prices
that
are
observable,
either
directly
or
indirectly
(including,
but
not
limited
to,
quoted
prices
for
similar
financial
instruments
in
active
markets,
quoted
prices
for
identical
or
similar
financial
instruments
in
inactive
markets,
interest
rates
and
yield
curves,
implied
volatilities,
and
credit
spreads)
Level
3
–
unobservable
inputs
(including
the Valuation
Designee’s assumptions
in
determining
fair
value)
Observable
inputs
are
developed
using
market
data,
such
as
publicly
available
information
about
actual
events
or
transactions,
and
reflect
the
assumptions
that
market
participants
would
use
to
price
the
financial
instrument.
Unobservable
inputs
are
those
for
which
market
data
are
not
available
and
are
developed
using
the
best
information
available
about
the
assumptions
that
market
participants
would
use
to
price
the
financial
instrument.
GAAP
requires
valuation
techniques
to
maximize
the
use
of
relevant
observable
inputs
and
minimize
the
use
of
unobservable
inputs.
When
multiple
inputs
are
used
to
derive
fair
value,
the
financial
instrument
is
assigned
to
the
level
within
the
fair
value
hierarchy
based
on
the
lowest-level
input
that
is
significant
to
the
fair
value
of
the
financial
T.
ROWE
PRICE
Corporate
Income
Fund
instrument.
Input
levels
are
not
necessarily
an
indication
of
the
risk
or
liquidity
associated
with
financial
instruments
at
that
level
but
rather
the
degree
of
judgment
used
in
determining
those
values.
Valuation
Techniques
Debt
securities
generally
are
traded
in
the over-the-
counter
(OTC)
market
and
are
valued
at
prices
furnished
by
independent
pricing
services
or
by
broker
dealers
who
make
markets
in
such
securities.
When
valuing
securities,
the
independent
pricing
services
consider
factors
such
as,
but
not
limited
to,
the
yield
or
price
of
bonds
of
comparable
quality,
coupon,
maturity,
and
type,
as
well
as
prices
quoted
by
dealers
who
make
markets
in
such
securities.
Investments
in
mutual
funds
are
valued
at
the
mutual
fund’s
closing
NAV
per
share
on
the
day
of
valuation.
Listed
options,
and
OTC
options
with
a
listed
equivalent,
are
valued
at
the
mean
of
the
closing
bid
and
asked
prices
and
exchange-traded
options
on
futures
contracts
are
valued
at
closing
settlement
prices.
Futures
contracts
are
valued
at
closing
settlement
prices.
Swaps
are
valued
at
prices
furnished
by
an
independent
pricing
service
or
independent
swap
dealers.
Assets
and
liabilities
other
than
financial
instruments,
including
short-term
receivables
and
payables,
are
carried
at
cost,
or
estimated
realizable
value,
if
less,
which
approximates
fair
value.
Investments
for
which
market
quotations are
not
readily
available
or
deemed
unreliable
are
valued
at
fair
value
as
determined
in
good
faith
by
the
Valuation
Designee.
The
Valuation
Designee
has
adopted
methodologies
for
determining
the
fair
value
of
investments
for
which
market
quotations
are
not
readily
available
or
deemed
unreliable,
including
the
use
of
other
pricing
sources.
Factors
used
in
determining
fair
value
vary
by
type
of
investment
and
may
include
market
or
investment
specific
considerations.
The
Valuation
Designee typically
will
afford
greatest
weight
to
actual
prices
in
arm’s
length
transactions,
to
the
extent
they
represent
orderly
transactions
between
market
participants,
transaction
information
can
be
reliably
obtained,
and
prices
are
deemed
representative
of
fair
value.
However,
the
Valuation
Designee may
also
consider
other
valuation
methods
such
as
market-based
valuation
multiples;
a
discount
or
premium
from
market
value
of
a
similar,
freely
traded
security
of
the
same
issuer;
discounted
cash
flows;
yield
to
maturity;
or
some
combination.
Fair
value
determinations
are
reviewed
on
a
regular
basis.
Because
any
fair
value
determination
involves
a
significant
amount
of
judgment,
there
is
a
degree
of
subjectivity
inherent
in
such
pricing
decisions. Fair
value
prices
determined
T.
ROWE
PRICE
Corporate
Income
Fund
by
the
Valuation
Designee could
differ
from
those
of
other
market
participants,
and
it
is
possible
that
the
fair
value
determined
for
a
security
may
be
materially
different
from
the
value
that
could
be
realized
upon
the
sale
of
that
security.
Valuation
Inputs
The
following
table
summarizes
the
fund’s
financial
instruments,
based
on
the
inputs
used
to
determine
their
fair
values
on
May
31,
2024
(for
further
detail
by
category,
please
refer
to
the
accompanying
Portfolio
of
Investments):
($000s)
Level
1
Level
2
Level
3
Total
Value
Assets
Fixed
Income
Securities
1
$
—
$
57,605
$
—
$
57,605
Corporate
Bonds
—
472,883
1,540
474,423
Short-Term
Investments
3,531
—
—
3,531
Securities
Lending
Collateral
5,263
—
—
5,263
Options
Purchased
57
164
—
221
Total
Securities
8,851
530,652
1,540
541,043
Swaps*
—
346
—
346
Futures
Contracts*
129
—
—
129
Total
$
8,980
$
530,998
$
1,540
$
541,518
Liabilities
Swaps*
$
—
$
108
$
—
$
108
Futures
Contracts*
463
—
—
463
Total
$
463
$
108
$
—
$
571
1
Includes
Asset-Backed
Securities,
Bank
Loans,
Foreign
Government
Obligations
&
Municipalities,
Municipal
Securities
and
U.S.
Government
Agency
Obligations
(Excluding
Mortgage-Backed).
*
The
fair
value
presented
includes
cumulative
gain
(loss)
on
open
futures
contracts
and
centrally
cleared
swaps;
however,
the
net
value
reflected
on
the
accompanying
Portfolio
of
Investments
is
only
the
unsettled
variation
margin
receivable
(payable)
at
that
date.
T.
ROWE
PRICE
Corporate
Income
Fund
NOTE
3
-
DERIVATIVE
INSTRUMENTS
During
the
year ended
May
31,
2024,
the
fund
invested
in
derivative
instruments.
As
defined
by
GAAP,
a
derivative
is
a
financial
instrument
whose
value
is
derived
from
an
underlying
security
price,
foreign
exchange
rate,
interest
rate,
index
of
prices
or
rates,
or
other
variable;
it
requires
little
or
no
initial
investment
and
permits
or
requires
net
settlement.
The
fund
invests
in
derivatives
only
if
the
expected
risks
and
rewards
are
consistent
with
its
investment
objectives,
policies,
and
overall
risk
profile,
as
described
in
its
prospectus
and
Statement
of
Additional
Information.
The
fund
may
use
derivatives
for
a
variety
of
purposes
and
may
use
them
to
establish
both
long
and
short
positions
within
the
fund’s
portfolio.
Potential
uses
include
to
hedge
against
declines
in
principal
value,
increase
yield,
invest
in
an
asset
with
greater
efficiency
and
at
a
lower
cost
than
is
possible
through
direct
investment,
to
enhance
return,
or
to
adjust
portfolio
duration
and
credit
exposure.
The
risks
associated
with
the
use
of
derivatives
are
different
from,
and
potentially
much
greater
than,
the
risks
associated
with
investing
directly
in
the
instruments
on
which
the
derivatives
are
based.
The
fund
values
its
derivatives
at
fair
value
and
recognizes
changes
in
fair
value
currently
in
its
results
of
operations.
Accordingly,
the
fund
does
not
follow
hedge
accounting,
even
for
derivatives
employed
as
economic
hedges.
Generally,
the
fund
accounts
for
its
derivatives
on
a
gross
basis.
It
does
not
offset
the
fair
value
of
derivative
liabilities
against
the
fair
value
of
derivative
assets
on
its
financial
statements,
nor
does
it
offset
the
fair
value
of
derivative
instruments
against
the
right
to
reclaim
or
obligation
to
return
collateral.
The
following
table
summarizes
the
fair
value
of
the
fund’s
derivative
instruments
held
as
of
May
31,
2024,
and
the
related
location
on
the
accompanying
Statement
of
Assets
and
Liabilities,
presented
by
primary
underlying
risk
exposure:
T.
ROWE
PRICE
Corporate
Income
Fund
Additionally,
the
amount
of
gains
and
losses
on
derivative
instruments
recognized
in
fund
earnings
during
the
year ended
May
31,
2024,
and
the
related
location
on
the
accompanying
Statement
of
Operations
is
summarized
in
the
following
table
by
primary
underlying
risk
exposure:
($000s)
Location
on
Statement
of
Assets
and
Liabilities
Fair
Value*
Assets
Interest
rate
derivatives
Futures,
Securities^
$
350
Credit
derivatives
Bilateral
Swaps
and
Premiums,
Centrally
Cleared
Swaps
346
^
,*
Total
$
696
^
,*
Liabilities
Interest
rate
derivatives
Futures
$
463
Credit
derivatives
Bilateral
Swaps
and
Premiums,
Centrally
Cleared
Swaps
108
Total
$
571
*
The
fair
value
presented
includes
cumulative
gain
(loss)
on
open
futures
contracts
and
centrally
cleared
swaps;
however,
the
value
reflected
on
the
accompanying
Statement
of
Assets
and
Liabilities
is
only
the
unsettled
variation
margin
receivable
(payable)
at
that
date.
^
Options
purchased
are
reported
as
securities
and
are
reflected
in
the
accompanying
Portfolio
of
Investments.
($000s)
Location
of
Gain
(Loss)
on
Statement
of
Operations
Securities^
Options
Written
Futures
Swaps
Total
Realized
Gain
(Loss)
Interest
rate
derivatives
$
44
$
—
$
(1,863)
$
—
$
(1,819)
Credit
derivatives
(437)
69
—
1,086
718
Equity
derivatives
(289)
—
—
—
(289)
Total
$
(682)
$
69
$
(1,863)
$
1,086
$
(1,390)
T.
ROWE
PRICE
Corporate
Income
Fund
Counterparty
Risk
and
Collateral
The
fund
invests
in
derivatives
in
various
markets,
which
expose
it
to
differing
levels
of
counterparty
risk.
Counterparty
risk
on
exchange-traded
and
centrally
cleared
derivative
contracts,
such
as
futures,
exchange-traded
options,
and
centrally
cleared
swaps,
is
minimal
because
the
clearinghouse
provides
protection
against
counterparty
defaults.
For
futures
and
centrally
cleared
swaps,
the
fund
is
required
to
deposit
collateral
in
an
amount
specified
by
the
clearinghouse
and
the
clearing
firm
(margin
requirement),
and
the
margin
requirement
must
be
maintained
over
the
life
of
the
contract.
Each
clearinghouse
and
clearing
firm,
in
its
sole
discretion,
may
adjust
the
margin
requirements
applicable
to
the
fund.
Derivatives,
such
as
non-cleared bilateral
swaps,
forward
currency
exchange
contracts,
and
OTC
options,
that
are
transacted
and
settle
directly
with
a
counterparty
(bilateral
derivatives)
may
expose
the
fund
to
greater
counterparty
risk.
To
mitigate
this
risk,
the
fund
has
entered
into
master
netting
arrangements
(MNAs)
with
certain
counterparties
that
permit
net
settlement
under
specified
conditions
and,
for
certain
counterparties,
also
require
the
exchange
of
collateral
to
cover
mark-to-market
exposure.
MNAs
may
be
in
the
form
of
International
Swaps
and
Derivatives
Association
master
agreements
(ISDAs)
or
foreign
exchange
letter
agreements
(FX
letters).
MNAs
provide
the
ability
to
offset
amounts
the
fund
owes
a
counterparty
against
amounts
the
counterparty
owes
the
fund
(net
settlement).
Both
ISDAs
and
FX
letters
generally
allow
termination
of
transactions
and
net
settlement
upon
the
occurrence
of
contractually
specified
events,
such
as
failure
to
pay
or
bankruptcy.
In
addition,
ISDAs
specify
other
events,
the
occurrence
of
which
would
allow
one
of
the
parties
to
terminate.
For
example,
a
downgrade
($000s)
Location
of
Gain
(Loss)
on
Statement
of
Operations
Securities^
Options
Written
Futures
Swaps
Total
Change
in
Unrealized
Gain
(Loss)
Interest
rate
derivatives
$
(67)
$
—
$
(351)
$
—
$
(418)
Credit
derivatives
—
—
—
256
256
Equity
derivatives
76
—
—
—
76
Total
$
9
$
—
$
(351)
$
256
$
(86)
^
Options
purchased
are
reported
as
securities.
T.
ROWE
PRICE
Corporate
Income
Fund
in
credit
rating
of
a
counterparty
below
a
specified
rating
would
allow
the
fund
to
terminate,
while
a
decline
in
the
fund’s
net
assets
of
more
than
a
specified
percentage
would
allow
the
counterparty
to
terminate.
Upon
termination,
all
transactions
with
that
counterparty
would
be
liquidated
and
a
net
termination
amount
settled.
ISDAs
typically
include
collateral
agreements
whereas
FX
letters
do
not.
Collateral
requirements
are
determined
daily
based
on
the
net
aggregate
unrealized
gain
or
loss
on
all
bilateral
derivatives
with
a
counterparty,
subject
to
minimum
transfer
amounts
that
typically
range
from
$100,000
to
$250,000.
Any
additional
collateral
required
due
to
changes
in
security
values
is
typically
transferred
the
next
business
day.
Collateral
may
be
in
the
form
of
cash
or
debt
securities
issued
by
the
U.S.
government
or
related
agencies,
although
other
securities
may
be
used
depending
on
the
terms
outlined
in
the
applicable
MNA.
Cash
posted
by
the
fund
is
reflected
as
cash
deposits
in
the
accompanying
financial
statements
and
generally
is
restricted
from
withdrawal
by
the
fund;
securities
posted
by
the
fund
are
so
noted
in
the
accompanying
Portfolio
of
Investments;
both
remain
in
the
fund’s
assets.
Collateral
pledged
by
counterparties
is
not
included
in
the
fund’s
assets
because
the
fund
does
not
obtain
effective
control
over
those
assets.
For
bilateral
derivatives,
collateral
posted
or
received
by
the
fund
is
held
in
a
segregated
account
at
the
fund’s
custodian.
While
typically
not
sold
in
the
same
manner
as
equity
or
fixed
income
securities,
exchange-traded
or
centrally
cleared
derivatives
may
be
closed
out
only
on
the
exchange
or
clearinghouse
where
the
contracts
were
cleared,
and
OTC
and
bilateral
derivatives
may
be
unwound
with
counterparties
or
transactions
assigned
to
other
counterparties
to
allow
the
fund
to
exit
the
transaction.
This
ability
is
subject
to
the
liquidity
of
underlying
positions. As
of
May
31,
2024,
no
collateral had
been
pledged
or
posted
by
the
fund
to
counterparties
for
bilateral
derivatives. As
of
May
31,
2024,
collateral
pledged
by
counterparties
to
the
fund
for
bilateral
derivatives
consisted
of $279,000 cash
and
securities
valued
at
$48,000. As
of
May
31,
2024,
securities
valued
at $6,465,000
had
been
posted
by
the
fund
for
exchange-traded
and/or
centrally
cleared
derivatives.
Futures
Contracts
The
fund
is
subject
to interest
rate
risk in
the
normal
course
of
pursuing
its
investment
objectives
and
uses
futures
contracts
to
help
manage
such
risk.
The fund
may
enter
into
futures
contracts
to
manage
exposure
to
interest
rate
and
yield
curve
movements,
security
prices,
foreign
currencies,
credit
quality,
and
mortgage
prepayments;
as
an
efficient
means
of
adjusting
exposure
to
all
or
part
of
a
target
market;
to
enhance
income;
as
a
cash
management
tool;
or
to
adjust
portfolio
duration
and
credit
exposure. A
futures
contract
provides
for
the
future
sale
by
one
party
and
purchase
by
another
of
T.
ROWE
PRICE
Corporate
Income
Fund
a
specified
amount
of
a
specific
underlying
financial
instrument
at
an
agreed-
upon
price,
date,
time,
and
place.
The
fund
currently
invests
only
in
exchange-
traded
futures,
which
generally
are
standardized
as
to
maturity
date,
underlying
financial
instrument,
and
other
contract
terms.
Payments
are
made
or
received
by
the
fund
each
day
to
settle
daily
fluctuations
in
the
value
of
the
contract
(variation
margin),
which
reflect
changes
in
the
value
of
the
underlying
financial
instrument.
Variation
margin
is
recorded
as
unrealized
gain
or
loss
until
the
contract
is
closed.
The
value
of
a
futures
contract
included
in
net
assets
is
the
amount
of
unsettled
variation
margin;
net
variation
margin
receivable
is
reflected
as
an
asset
and
net
variation
margin
payable
is
reflected
as
a
liability
on
the
accompanying
Statement
of
Assets
and
Liabilities.
When
a
contract
is
closed,
a
realized
gain
or
loss
is
recorded
on
the
accompanying
Statement
of
Operations.
Risks
related
to
the
use
of
futures
contracts
include
possible
illiquidity
of
the
futures
markets,
contract
prices
that
can
be
highly
volatile
and
imperfectly
correlated
to
movements
in
hedged
security
values
and/or
interest
rates,
and
potential
losses
in
excess
of
the
fund’s
initial
investment.
During
the
year ended
May
31,
2024,
the
volume
of
the
fund’s
activity
in
futures,
based
on
underlying
notional
amounts,
was
generally
between
14%
and
36%
of
net
assets.
Options
The
fund
is
subject
to interest
rate
risk,
credit
risk
and
equity
price
risk in
the
normal
course
of
pursuing
its
investment
objectives
and
uses
options
to
help
manage
such
risks.
The
fund
may
use
options
to
manage
exposure
to
security
prices,
interest
rates,
foreign
currencies,
and
credit
quality;
as
an
efficient
means
of
adjusting
exposure
to
all
or
a
part
of
a
target
market;
to
enhance
income;
as
a
cash
management
tool;
or
to
adjust
credit
exposure.
The
fund
may
buy
or
sell
options
that
can
be
settled
either
directly
with
the
counterparty
(OTC
option)
or
through
a
central
clearinghouse
(exchange-traded
option).
Options
are
included
in
net
assets
at
fair
value,
options
purchased
are
included
in
Investments
in
Securities,
and
options
written
are
separately
reflected
as
a
liability
on
the
accompanying
Statement
of
Assets
and
Liabilities.
Premiums
on
unexercised,
expired
options
are
recorded
as
realized
gains
or
losses
on
the
accompanying
Statement
of
Operations;
premiums
on
exercised
options
are
recorded
as
an
adjustment
to
the
proceeds
from
the
sale
or
cost
of
the
purchase.
The
difference
between
the
premium
and
the
amount
received
or
paid
in
a
closing
transaction
is
also
treated
as
realized
gain
or
loss
on
the
accompanying
Statement
of
Operations.
In
return
for
a
premium
paid,
call
and
put
options
give
the
holder
the
right,
but
not
the
obligation,
to
purchase
or
sell,
respectively,
a
security
at
a
specified
exercise
price.
In
return
for
a
premium
paid,
call
and
put
options
on
futures
give
the
holder
the
right,
but
not
the
obligation,
to
purchase
or
sell,
respectively,
a
position
in
a
particular
futures
T.
ROWE
PRICE
Corporate
Income
Fund
contract
at
a
specified
exercise
price.
In
return
for
a
premium
paid,
call
and
put
index
options
give
the
holder
the
right,
but
not
the
obligation,
to
receive
cash
equal
to
the
difference
between
the
value
of
the
reference
index
on
the
exercise
date
and
the
exercise
price
of
the
option.
In
return
for
a
premium
paid,
options
on
swaps
give
the
holder
the
right,
but
not
the
obligation,
to
enter
a
specified
swap
contract
on
predefined
terms.
The
exercise
price
of
an
option
on
a
credit
default
swap
is
stated
in
terms
of
a
specified
spread
that
represents
the
cost
of
credit
protection
on
the
reference
asset,
including
both
the
upfront
premium
to
open
the
position
and
future
periodic
payments.
The
exercise
price
of
an
interest
rate
swap
is
stated
in
terms
of
a
fixed
interest
rate;
generally,
there
is
no
upfront
payment
to
open
the
position. Risks related
to
the
use
of
options
include
possible
illiquidity
of
the
options
markets;
trading
restrictions
imposed
by
an
exchange
or
counterparty;
possible
failure
of
counterparties
to
meet
the
terms
of
the
agreements;
movements
in
the
underlying
asset
values,
interest
rates
and
credit
ratings;
and,
for
options
written,
the
potential
for
losses
to
exceed
any
premium
received
by
the
fund.
During
the
year ended
May
31,
2024,
the
volume
of
the
fund’s
activity
in
options,
based
on
underlying
notional
amounts,
was
generally
between
1%
and
68%
of
net
assets.
Swaps
The
fund
is
subject
to
credit
risk in
the
normal
course
of
pursuing
its
investment
objectives
and
uses
swap
contracts
to
help
manage
such
risk.
The
fund
may
use
swaps
in
an
effort
to
manage
both
long
and
short
exposure
to
changes
in
interest
rates,
inflation
rates,
and
credit
quality;
to
adjust
overall
exposure
to
certain
markets;
to
enhance
total
return
or
protect
the
value
of
portfolio
securities;
to
serve
as
a
cash
management
tool;
or
to
adjust
portfolio
duration
and
credit
exposure.
Swap
agreements
can
be
settled
either
directly
with
the
counterparty
(bilateral
swap)
or
through
a
central
clearinghouse
(centrally
cleared
swap).
Fluctuations
in
the
fair
value
of
a
contract
are
reflected
in
unrealized
gain
or
loss
and
are
reclassified
to
realized
gain
or
loss
on
the
accompanying
Statement
of
Operations upon
contract
termination
or
cash
settlement.
Net
periodic
receipts
or
payments
required
by
a
contract
increase
or
decrease,
respectively,
the
value
of
the
contract
until
the
contractual
payment
date,
at
which
time
such
amounts
are
reclassified
from
unrealized
to
realized
gain
or
loss
on
the
accompanying
Statement
of
Operations.
For
bilateral
swaps,
cash
payments
are
made
or
received
by
the
fund
on
a
periodic
basis
in
accordance
with
contract
terms;
unrealized
gain
on
contracts
and
premiums
paid
are
reflected
as
assets
and
unrealized
loss
on
contracts
and
premiums
received
are
reflected
as
liabilities
on
the
accompanying
Statement
of
Assets
and
Liabilities.
For
bilateral
swaps,
premiums
paid
or
received
are
amortized
over
the
life
of
the
swap
and
are
recognized
as
realized
gain
or
loss
on
the
T.
ROWE
PRICE
Corporate
Income
Fund
accompanying
Statement
of
Operations.
For
centrally
cleared
swaps,
payments
are
made
or
received
by
the
fund
each
day
to
settle
the
daily
fluctuation
in
the
value
of
the
contract
(variation
margin).
Accordingly,
the
value
of
a
centrally
cleared
swap
included
in
net
assets
is
the
unsettled
variation
margin;
net
variation
margin
receivable
is
reflected
as
an
asset
and
net
variation
margin
payable
is
reflected
as
a
liability
on
the
accompanying
Statement
of
Assets
and
Liabilities.
Credit
default
swaps
are
agreements
where
one
party
(the
protection
buyer)
agrees
to
make
periodic
payments
to
another
party
(the
protection
seller)
in
exchange
for
protection
against
specified
credit
events,
such
as
certain
defaults
and
bankruptcies
related
to
an
underlying
credit
instrument,
or
issuer
or
index
of
such
instruments.
Upon
occurrence
of
a
specified
credit
event,
the
protection
seller
is
required
to
pay
the
buyer
the
difference
between
the
notional
amount
of
the
swap
and
the
value
of
the
underlying
credit,
either
in
the
form
of
a
net
cash
settlement
or
by
paying
the
gross
notional
amount
and
accepting
delivery
of
the
relevant
underlying
credit.
For
credit
default
swaps
where
the
underlying
credit
is
an
index,
a
specified
credit
event
may
affect
all
or
individual
underlying
securities
included
in
the
index
and
will
be
settled
based
upon
the
relative
weighting
of
the
affected
underlying
security(ies)
within
the
index. Generally,
the
payment
risk
for
the
seller
of
protection
is
inversely
related
to
the
current
market
price
or
credit
rating
of
the
underlying
credit
or
the
market
value
of
the
contract
relative
to
the
notional
amount,
which
are
indicators
of
the
markets’
valuation
of
credit
quality.
As
of
May
31,
2024,
the
notional
amount
of
protection
sold
by
the
fund
totaled $94,521,000
(17.4%
of
net
assets),
which
reflects
the
maximum
potential
amount
the
fund
could
be
required
to
pay
under
such
contracts.
Risks
related
to
the
use
of
credit
default
swaps
include
the
possible
inability
of
the
fund
to
accurately
assess
the
current
and
future
creditworthiness
of
underlying
issuers,
the
possible
failure
of
a
counterparty
to
perform
in
accordance
with
the
terms
of
the
swap
agreements,
potential
government
regulation
that
could
adversely
affect
the
fund’s
swap
investments,
and
potential
losses
in
excess
of
the
fund’s
initial
investment.
Total
return
swaps
are
agreements
in
which
one
party
makes
payments
based
on
a
set
rate,
either
fixed
or
variable,
while
the
other
party
makes
payments
based
on
the
return
of
an
underlying
asset
(reference
asset),
such
as
an
index,
equity
security,
fixed
income
security
or
commodity-based
exchange-
traded
fund,
which
includes
both
the
income
it
generates
and
any
change
in
its
value.
Risks
related
to
the
use
of
total
return
swaps
include
the
potential
for
unfavorable
changes
in
the
reference
asset,
the
possible
failure
of
a
T.
ROWE
PRICE
Corporate
Income
Fund
counterparty
to
perform
in
accordance
with
the
terms
of
the
swap
agreements,
potential
government
regulation
that
could
adversely
affect
the
fund’s
swap
investments,
and
potential
losses
in
excess
of
the
fund’s
initial
investment.
During
the
year ended
May
31,
2024,
the
volume
of
the
fund’s
activity
in
swaps,
based
on
underlying
notional
amounts,
was
generally
between
2%
and
19%
of
net
assets.
NOTE
4
-
OTHER
INVESTMENT
TRANSACTIONS
Consistent
with
its
investment
objective, the
fund
engages
in
the
following
practices
to
manage
exposure
to
certain
risks
and/or
to
enhance
performance.
The
investment
objective,
policies,
program,
and
risk
factors
of the
fund
are
described
more
fully
in the
fund’s prospectus
and
Statement
of
Additional
Information.
Restricted
Securities
The
fund
invests
in
securities
that
are
subject
to
legal
or
contractual
restrictions
on
resale.
Prompt
sale
of
such
securities
at
an
acceptable
price
may
be
difficult
and
may
involve
substantial
delays
and
additional
costs.
Collateralized
Loan
Obligations
The
fund
invests
in
collateralized
loan
obligations
(CLOs)
which
are
entities
backed
by
a
diversified
pool
of
syndicated
bank
loans.
The
cash
flows
of
the
CLO
can
be
split
into
multiple
segments,
called
“tranches”
or
“classes”,
which
will
vary
in
risk
profile
and
yield.
The
riskiest
segments,
which
are
the
subordinate
or
“equity”
tranches,
bear
the
greatest
risk
of
loss
from
defaults
in
the
underlying
assets
of
the
CLO
and
serve
to
protect
the
other,
more
senior,
tranches.
Senior
tranches
will
typically
have
higher
credit
ratings
and
lower
yields
than
the
securities
underlying
the
CLO.
Despite
the
protection
from
the
more
junior
tranches,
senior
tranches
can
experience
substantial
losses.
Bank
Loans
The
fund
invests
in
bank
loans,
which
represent
an
interest
in
amounts
owed
by
a
borrower
to
a
syndicate
of
lenders.
Bank
loans
are
generally
noninvestment
grade
and
often
involve
borrowers
whose
financial
condition
is
highly
leveraged.
The
fund
may
invest
in
fixed
and
floating
rate
loans,
which
may
include
senior
floating
rate
loans;
secured
and
unsecured
loans,
second
lien
or
more
junior
loans;
and
bridge
loans
or
bridge
facilities.
Certain
bank
loans
may
be
revolvers
which
are
a
form
of
senior
bank
debt,
where
the
borrower
can
draw
down
the
credit
of
the
revolver
when
it
needs
cash
and
repays
the
credit
when
the
borrower
has
excess
cash.
Certain
loans
T.
ROWE
PRICE
Corporate
Income
Fund
may
be
“covenant-lite”
loans,
which
means
the
loans
contain
fewer
maintenance
covenants
than
other
loans
(in
some
cases,
none)
and
do
not
include
terms
which
allow
the
lender
to
monitor
the
performance
of
the
borrower
and
declare
a
default
if
certain
criteria
are
breached.
As
a
result
of
these
risks,
the
fund’s
exposure
to
losses
may
be
increased.
Bank
loans
may
be
in
the
form
of
either
assignments
or
participations.
A
loan
assignment
transfers
all
legal,
beneficial,
and
economic
rights
to
the
buyer,
and
transfer
typically
requires
consent
of
both
the
borrower
and
agent.
In
contrast,
a
loan
participation
generally
entitles
the
buyer
to
receive
the
cash
flows
from
principal,
interest,
and
any
fee
payments
on
a
portion
of
a
loan;
however,
the
seller
continues
to
hold
legal
title
to
that
portion
of
the
loan.
As
a
result,
the
buyer
of
a
loan
participation
generally
has
no
direct
recourse
against
the
borrower
and
is
exposed
to
credit
risk
of
both
the
borrower
and
seller
of
the
participation.
Bank
loans
often
have
extended
settlement
periods,
generally
may
be
repaid
at
any
time
at
the
option
of
the
borrower,
and
may
require
additional
principal
to
be
funded
at
the
borrowers’
discretion
at
a
later
date
(e.g.
unfunded
commitments
and
revolving
debt
instruments).
Until
settlement,
the
fund
maintains
liquid
assets
sufficient
to
settle
its
unfunded
loan
commitments.
The
fund
reflects
both
the
funded
portion
of
a
bank
loan
as
well
as
its
unfunded
commitment
in
the
Portfolio
of
Investments.
However,
if
a
credit
agreement
provides
no
initial
funding
of
a
tranche,
and
funding
of
the
full
commitment
at
a
future
date(s)
is
at
the
borrower’s
discretion
and
considered
uncertain,
a
loan
is
reflected
in
the
Portfolio
of
Investments
only
if,
and
only
to
the
extent
that,
the
fund
has
actually
settled
a
funding
commitment.
Securities
Lending
The fund
may
lend
its
securities
to
approved
borrowers
to
earn
additional
income.
Its
securities
lending
activities
are
administered
by
a
lending
agent
in
accordance
with
a
securities
lending
agreement.
Security
loans
generally
do
not
have
stated
maturity
dates,
and
the
fund
may
recall
a
security
at
any
time.
The
fund
receives
collateral
in
the
form
of
cash
or
U.S.
government
securities.
Collateral
is
maintained
over
the
life
of
the
loan
in
an
amount
not
less
than
the
value
of
loaned
securities;
any
additional
collateral
required
due
to
changes
in
security
values
is
delivered
to
the
fund
the
next
business
day.
Cash
collateral
is
invested
in
accordance
with
investment
guidelines
approved
by
fund
management.
Additionally,
the
lending
agent
indemnifies
the
fund
against
losses
resulting
from
borrower
default.
Although
risk
is
mitigated
by
the
collateral
and
indemnification,
the
fund
could
experience
a
delay
in
recovering
its
securities
and
a
possible
loss
of
income
or
value
if
the
borrower
fails
to
return
T.
ROWE
PRICE
Corporate
Income
Fund
the
securities,
collateral
investments
decline
in
value,
and
the
lending
agent
fails
to
perform.
Securities
lending
revenue
consists
of
earnings
on
invested
collateral
and
borrowing
fees,
net
of
any
rebates
to
the
borrower,
compensation
to
the
lending
agent,
and
other
administrative
costs.
In
accordance
with
GAAP,
investments
made
with
cash
collateral
are
reflected
in
the
accompanying
financial
statements,
but
collateral
received
in
the
form
of
securities
is
not.
At
May
31,
2024,
the
value
of
loaned
securities
was
$5,167,000;
the
value
of
cash
collateral
and
related
investments
was
$5,263,000.
Other
Purchases
and
sales
of
portfolio
securities
other
than
in-kind
transactions,
if
any,
short-term and
U.S.
government
securities
aggregated $461,866,000 and
$473,526,000,
respectively,
for
the
year ended
May
31,
2024.
NOTE
5
-
FEDERAL
INCOME
TAXES
Generally,
no
provision
for
federal
income
taxes
is
required
since
the
fund
intends
to continue
to
qualify
as
a
regulated
investment
company
under
Subchapter
M
of
the
Internal
Revenue
Code
and
distribute
to
shareholders
all
of
its taxable
income
and
gains.
Distributions
determined
in
accordance
with
federal
income
tax
regulations
may
differ
in
amount
or
character
from
net
investment
income
and
realized
gains
for
financial
reporting
purposes.
The
fund
files
U.S.
federal,
state,
and
local
tax
returns
as
required.
The
fund’s
tax
returns
are
subject
to
examination
by
the
relevant
tax
authorities
until
expiration
of
the
applicable
statute
of
limitations,
which
is
generally
three
years
after
the
filing
of
the
tax
return
but
which
can
be
extended
to
six
years
in
certain
circumstances.
Tax
returns
for
open
years
have
incorporated
no
uncertain
tax
positions
that
require
a
provision
for
income
taxes.
Capital
accounts
within
the
financial
reporting
records
are
adjusted
for
permanent
book/tax
differences
to
reflect
tax
character
but
are
not
adjusted
for
temporary
differences.
The
permanent
book/tax
adjustments,
if
any,
have
no
impact
on
results
of
operations
or
net
assets.
The
tax
character
of
distributions
paid
for
the
periods
presented
was
as
follows:
T.
ROWE
PRICE
Corporate
Income
Fund
At
May
31,
2024,
the
tax-basis
cost
of
investments
(including
derivatives,
if
any)
and
gross
unrealized
appreciation
and
depreciation
were as
follows:
At
May
31,
2024,
the
tax-basis
components
of
accumulated
net
earnings
(loss)
were
as
follows:
Temporary
differences
between
book-basis
and
tax-basis
components
of
total
distributable
earnings
(loss)
arise
when
certain
items
of
income,
gain,
or
loss
are
recognized
in
different
periods
for
financial
statement
purposes
versus
for
tax
purposes;
these
differences
will
reverse
in
a
subsequent
reporting
period.
The
temporary
differences
relate
primarily
to
the
deferral
of
losses
from
wash
sales,
the
realization
of
gains/losses
on
certain
open
derivative
contracts
and
the
character
of
income
on
certain
derivatives
contracts.
The
loss
carryforwards
and
deferrals
primarily
relate
to
capital
loss
carryforwards
and
straddle
deferrals.
Capital
loss
carryforwards
are
available
indefinitely
to
offset
future
realized
capital
gains.
($000s)
May
31,
2024
May
31,
2023
Ordinary
income
(including
short-term
capital
gains,
if
any)
$
26,359
$
22,567
($000s)
Cost
of
investments
$
563,705
Unrealized
appreciation
$
5,175
Unrealized
depreciation
(25,343)
Net
unrealized
appreciation
(depreciation)
$
(20,168)
($000s)
Undistributed
ordinary
income
$
94
Net
unrealized
appreciation
(depreciation)
(20,168)
Loss
carryforwards
and
deferrals
(114,145)
Total
distributable
earnings
(loss)
$
(134,219)
T.
ROWE
PRICE
Corporate
Income
Fund
NOTE
6
-
RELATED
PARTY
TRANSACTIONS
The
fund
is
managed
by
T.
Rowe
Price
Associates,
Inc.
(Price
Associates),
a
wholly
owned
subsidiary
of
T.
Rowe
Price
Group,
Inc.
(Price
Group).
The
investment
management
agreement
between
the
fund
and
Price
Associates
provides
for
an
annual
investment
management
fee,
which
is
computed
daily
and
paid
monthly. The
fee
consists
of
an
individual
fund
fee,
equal
to
0.07%
of
the
fund’s
average
daily
net
assets,
and
a
group
fee.
The
group
fee
rate
is
calculated
based
on
the
combined
net
assets
of
certain
mutual
funds
sponsored
by
Price
Associates
(the
group)
applied
to
a
graduated
fee
schedule,
with
rates
ranging
from
0.48%
for
the
first
$1
billion
of
assets
to
0.260%
for
assets
in
excess
of
$845
billion.
The
fund’s
group
fee
is
determined
by
applying
the
group
fee
rate
to
the
fund’s
average
daily
net
assets. At
May
31,
2024,
the
effective
annual
group
fee
rate
was
0.29%.
The Investor
Class is
subject
to
a
contractual
expense
limitation
through
the
expense
limitation
date
indicated
in
the
table
below.
This
agreement
will
continue
through
the
expense
limitation
date
indicated
in
the
table
below,
and
may
be
renewed,
revised,
or
revoked
only
with
approval
of
the
fund’s
Board.
During
the
limitation
period,
Price
Associates
is required
to
waive
or
pay
any
expenses
(excluding
interest;
expenses
related
to
borrowings,
taxes,
and
brokerage;
non-recurring,
extraordinary
expenses;
and
acquired
fund
fees
and
expenses)
that
would
otherwise
cause
the
class’s
ratio
of
annualized
total
expenses
to
average
net
assets
(net
expense
ratio)
to
exceed
its
expense
limitation.
The
class
is
required
to
repay
Price
Associates
for
expenses
previously
waived/paid
to
the
extent
the
class’s
net
assets
grow
or
expenses
decline
sufficiently
to
allow
repayment
without
causing
the
class’s
net
expense
ratio
(after
the
repayment
is
taken
into
account)
to
exceed
the
lesser
of:
(1)
the
expense
limitation
in
place
at
the
time
such
amounts
were
waived;
or
(2)
the
class’s
current
expense
limitation.
However,
no
repayment
will
be
made
more
than
three
years
after
the
date
of
a
payment
or
waiver.
The
I
Class
is
also
subject
to
an
operating
expense
limitation
(I
Class
Limit)
pursuant
to
which
Price
Associates
is
contractually
required
to
pay
all
operating
expenses
of
the
I
Class,
excluding
management
fees;
interest;
expenses
related
to
borrowings,
taxes,
and
brokerage; non-recurring,
extraordinary expenses; and
acquired
fund
fees
and
expenses, to
the
extent
such
operating
expenses,
on
an
annualized
basis,
exceed
the
I
Class
Limit. This
agreement
will
continue
through
the
expense
limitation
date
indicated
in
the
table
below,
and
may
be
renewed,
revised,
or
revoked
only
with
approval
of
the
fund’s
Board.
The
I
Class
is
required
to
repay
Price
Associates
for
expenses
previously
paid
to
T.
ROWE
PRICE
Corporate
Income
Fund
the
extent
the
class’s
net
assets
grow
or
expenses
decline
sufficiently
to
allow
repayment
without
causing
the
class’s
operating
expenses
(after
the
repayment
is
taken
into
account)
to
exceed
the
lesser
of:
(1)
the
I
Class
Limit
in
place
at
the
time
such
amounts
were
paid;
or
(2)
the
current
I
Class
Limit.
However,
no
repayment
will
be
made
more
than
three
years
after
the
date
of
a
payment
or
waiver.
The
Z
Class
is
also
subject
to
a
contractual
expense
limitation
agreement
whereby
Price
Associates
has
agreed
to
waive
and/or
bear
all
of
the
Z
Class’
expenses
(excluding
interest;
expenses
related
to
borrowings,
taxes,
and
brokerage;
non-recurring,
extraordinary
expenses;
and
acquired
fund
fees
and
expenses)
in
their
entirety.
This
fee
waiver
and/or
expense
reimbursement
arrangement
is
expected
to
remain
in
place
indefinitely,
and
the
agreement
may
only
be
amended
or
terminated
with
approval
by
the
fund’s
Board.
Expenses
of
the
fund
waived/paid
by
the
manager
are
not
subject
to
later
repayment
by
the
fund.
Pursuant
to
these
agreements,
expenses
were
waived/paid
by
and/or
repaid
to
Price
Associates
during
the
year ended May
31,
2024
as
indicated
in
the
table
below.
Including these
amounts,
expenses
previously
waived/paid
by
Price
Associates
in
the
amount
of $483,000 remain
subject
to
repayment
by
the
fund
at
May
31,
2024.
Any
repayment
of
expenses
previously
waived/paid
by
Price
Associates
during
the
period
would
be
included
in
the
net
investment
income
and
expense
ratios
presented
on
the
accompanying
Financial
Highlights.
In
addition,
the
fund
has
entered
into
service
agreements
with
Price
Associates
and
two
wholly
owned
subsidiaries
of
Price
Associates,
each
an
affiliate
of
the
fund
(collectively,
Price).
Price
Associates
provides
certain
accounting
and
administrative
services
to
the
fund.
T.
Rowe
Price
Services,
Inc.
provides
shareholder
and
administrative
services
in
its
capacity
as
the
fund’s
transfer
and
dividend-disbursing
agent.
T.
Rowe
Price
Retirement
Plan
Services,
Inc.
provides
subaccounting
and
recordkeeping
services
for
certain
retirement
accounts
invested
in
the
Investor
Class.
For
the
year
ended
May
31,
2024,
Investor
Class
I
Class
Z
Class
Expense
limitation/I
Class
Limit
0.59%
0.05%
0.00%
Expense
limitation
date
09/30/25
09/30/25
N/A
(Waived)/repaid
during
the
period
($000s)
$(148)
$(82)
$(1,078)
T.
ROWE
PRICE
Corporate
Income
Fund
expenses
incurred
pursuant
to
these
service
agreements
were
$111,000
for
Price
Associates;
$323,000
for
T.
Rowe
Price
Services,
Inc.;
and
$11,000
for
T.
Rowe
Price
Retirement
Plan
Services,
Inc.
All
amounts
due
to
and
due
from
Price,
exclusive
of
investment
management
fees
payable,
are
presented
net
on
the
accompanying
Statement
of
Assets
and
Liabilities.
T.
Rowe
Price
Investment
Services,
Inc.
(Investment
Services)
serves
as
distributor
to
the
fund.
Pursuant
to
an
underwriting
agreement,
no
compensation
for
any
distribution
services
provided
is
paid
to
Investment
Services
by
the
fund
(except
for
12b-1
fees
under
a
Board-approved
Rule
12b-1
plan).
Mutual
funds,
trusts,
and
other
accounts
managed
by
Price
Associates
or
its
affiliates
(collectively,
Price
Funds
and
accounts)
may
invest
in
the
fund.
No
Price
fund
or
account
may
invest
for
the
purpose
of
exercising
management
or
control
over
the
fund.
At
May
31,
2024, 100%
of
the
Z
Class's
outstanding
shares
were
held
by
Price
Funds
and
accounts.
The fund
may
invest
its
cash
reserves
in
certain
open-end
management
investment
companies
managed
by
Price
Associates
and
considered
affiliates
of
the
fund:
the
T.
Rowe
Price
Government
Reserve
Fund
or
the
T.
Rowe
Price
Treasury
Reserve
Fund,
organized
as
money
market
funds
(together,
the
Price
Reserve
Funds).
The
Price
Reserve
Funds
are
offered
as
short-term
investment
options
to
mutual
funds,
trusts,
and
other
accounts
managed
by
Price
Associates
or
its
affiliates
and
are
not
available
for
direct
purchase
by
members
of
the
public.
Cash
collateral
from
securities
lending,
if
any,
is
invested
in
the
T.
Rowe
Price
Government
Reserve Fund. The
Price
Reserve
Funds
pay
no
investment
management
fees.
The fund may
participate
in
securities
purchase
and
sale
transactions
with
other
funds
or
accounts
advised
by
Price
Associates
(cross
trades),
in
accordance
with
procedures
adopted
by the
fund’s
Board
and
Securities
and
Exchange
Commission
rules,
which
require,
among
other
things,
that
such
purchase
and
sale
cross
trades
be
effected
at
the
independent
current
market
price
of
the
security.
During
the
year
ended
May
31,
2024,
the
fund
had
no
purchases
or
sales
cross
trades
with
other
funds
or
accounts
advised
by
Price
Associates.
T.
ROWE
PRICE
Corporate
Income
Fund
NOTE
7
-
OTHER
MATTERS
Unpredictable environmental,
political,
social
and
economic
events,
including
but
not
limited
to,
environmental
or
natural
disasters,
war
and
conflict
(including
Russia’s
military
invasion
of
Ukraine
and
the
conflict
in
Israel,
Gaza
and
surrounding
areas),
terrorism,
geopolitical
developments
(including
trading
and
tariff
arrangements,
sanctions
and
cybersecurity
attacks),
and
public
health
epidemics
(including
the
global
outbreak
of
COVID-19)
and
similar
public
health
threats,
may
significantly
affect
the
economy
and
the
markets
and
issuers
in
which
a
fund
invests.
The
extent
and
duration
of
such
events
and
resulting
market
disruptions
cannot
be
predicted.
These
and
other
similar
events
may
cause
instability
across
global
markets,
including
reduced
liquidity
and
disruptions
in
trading
markets,
while
some
events
may
affect
certain
geographic
regions,
countries,
sectors,
and
industries
more
significantly
than
others,
and
exacerbate
other
pre-existing
political,
social,
and
economic
risks.
The
fund’s
performance
could
be
negatively
impacted
if
the
value
of
a
portfolio
holding
were
harmed
by
these
or
such
events.
Management
actively
monitors
the
risks
and
financial
impacts
arising
from
such
events.
T.
ROWE
PRICE
Corporate
Income
Fund
REPORT
OF
INDEPENDENT
REGISTERED
PUBLIC
ACCOUNTING
FIRM
To
the
Board
of
Directors
and
Shareholders
of
T.
Rowe
Price
Corporate
Income
Fund,
Inc.
Opinion
on
the
Financial
Statements
We
have
audited
the
accompanying
statement
of
assets
and
liabilities,
including
the
portfolio
of
investments,
of
T.
Rowe
Price
Corporate
Income
Fund,
Inc.
(the
"Fund")
as
of
May
31,
2024,
the
related
statement
of
operations
for
the
year
ended
May
31,
2024,
the
statement
of
changes
in
net
assets
for
each
of
the
two
years
in
the
period
ended
May
31,
2024,
including
the
related
notes,
and
the
financial
highlights
for
each
of
the
periods
indicated
therein
(collectively
referred
to
as
the
“financial
statements”).
In
our
opinion,
the
financial
statements
present
fairly,
in
all
material
respects,
the
financial
position
of
the
Fund
as
of
May
31,
2024,
the
results
of
its
operations
for
the
year
then
ended,
the
changes
in
its
net
assets
for
each
of
the
two
years
in
the
period
ended
May
31,
2024
and
the
financial
highlights
for
each
of
the
periods
indicated
therein,
in
conformity
with
accounting
principles
generally
accepted
in
the
United
States
of
America.
Basis
for
Opinion
These
financial
statements
are
the
responsibility
of
the
Fund’s
management.
Our
responsibility
is
to
express
an
opinion
on
the
Fund’s
financial
statements
based
on
our
audits.
We
are
a
public
accounting
firm
registered
with
the
Public
Company
Accounting
Oversight
Board
(United
States)
(PCAOB)
and
are
required
to
be
independent
with
respect
to
the
Fund
in
accordance
with
the
U.S.
federal
securities
laws
and
the
applicable
rules
and
regulations
of
the
Securities
and
Exchange
Commission
and
the
PCAOB.
We
conducted
our
audits
of
these
financial
statements
in
accordance
with
the
standards
of
the
PCAOB.
Those
standards
require
that
we
plan
and
perform
the
audit
to
obtain
reasonable
assurance
about
whether
the
financial
statements
are
free
of
material
misstatement,
whether
due
to
error
or
fraud.
T.
ROWE
PRICE
Corporate
Income
Fund
Our
audits
included
performing
procedures
to
assess
the
risks
of
material
misstatement
of
the
financial
statements,
whether
due
to
error
or
fraud,
and
performing
procedures
that
respond
to
those
risks.
Such
procedures
included
examining,
on
a
test
basis,
evidence
regarding
the
amounts
and
disclosures
in
the
financial
statements.
Our
audits
also
included
evaluating
the
accounting
principles
used
and
significant
estimates
made
by
management,
as
well
as
evaluating
the
overall
presentation
of
the
financial
statements.
Our
procedures
included
confirmation
of
securities
owned
as
of
May
31,
2024
by
correspondence
with
the
custodians,
transfer
agent
and
brokers;
when
replies
were
not
received
from
brokers,
we
performed
other
auditing
procedures.
We
believe
that
our
audits
provide
a
reasonable
basis
for
our
opinion.
/s/
PricewaterhouseCoopers
LLP
Baltimore,
Maryland
July
18,
2024
We
have
served
as
the
auditor
of
one
or
more
investment
companies
in
the
T.
Rowe
Price
group
of
investment
companies
since
1973.
REPORT
OF
INDEPENDENT
REGISTERED
PUBLIC
ACCOUNTING
FIRM
(continued)
T.
ROWE
PRICE
Corporate
Income
Fund
TAX
INFORMATION
(UNAUDITED)
FOR
THE
TAX
YEAR
ENDED 5/31/24
We
are
providing
this
information
as
required
by
the
Internal
Revenue
Code.
The
amounts
shown
may
differ
from
those
elsewhere
in
this
report
because
of
differences
between
tax
and
financial
reporting
requirements.
For
shareholders
subject
to
interest
expense
deduction
limitation
under
Section
163(j),
$25,861,000
of
the
fund’s
income
qualifies
as
a
Section
163(j)
interest
dividend
and
can
be
treated
as
interest
income
for
purposes
of
Section
163(j),
subject
to
holding
period
requirements
and
other
limitations.
T.
ROWE
PRICE
Corporate
Income
Fund
Approval
of
Investment
Management
Agreement
Each
year,
the
fund’s
Board
of
Directors
(Board)
considers
the
continuation
of
the
investment
management
agreement
(Advisory
Contract)
between
the
fund
and
its
investment
adviser,
T.
Rowe
Price
Associates,
Inc.
(Adviser).
In
that
regard,
at
a
meeting
held
on
March
11–12,
2024
(Meeting),
the
Board,
including
all
of
the
fund’s
independent
directors
present
in
person
at
the
Meeting,
approved
the
continuation
of
the
fund’s
Advisory
Contract.
At
the
Meeting,
the
Board
considered
the
factors
and
reached
the
conclusions
described
below
relating
to
the
selection
of
the
Adviser
and
the
approval
of
the
Advisory
Contract.
The
independent
directors
were
assisted
in
their
evaluation
of
the
Advisory
Contract
by
independent
legal
counsel
from
whom
they
received
separate
legal
advice
and
with
whom
they
met
separately.
In
providing
information
to
the
Board,
the
Adviser
was
guided
by
a
detailed
set
of
requests
for
information
submitted
by
independent
legal
counsel
on
behalf
of
the
independent
directors.
In
considering
and
approving
the
continuation
of
the
Advisory
Contract,
the
Board
considered
the
information
it
believed
was
relevant,
including,
but
not
limited
to,
the
information
discussed
below.
The
Board
considered
not
only
the
specific
information
presented
in
connection
with
the
Meeting,
but
also
the
knowledge
gained
over
time
through
interaction
with
the
Adviser
about
various
topics.
The
Board
meets
regularly
and,
at
each
of
its
meetings,
covers
an
extensive
agenda
of
topics
and
materials
and
considers
factors
that
are
relevant
to
its
annual
consideration
of
the
renewal
of
the
T.
Rowe
Price
funds’
advisory
contracts,
including
performance
and
the
services
and
support
provided
to
the
funds
and
their
shareholders.
Services
Provided
by
the
Adviser
The
Board
considered
the
nature,
quality,
and
extent
of
the
services
provided
to
the
fund
by
the
Adviser.
These
services
included,
but
were
not
limited
to,
directing
the
fund’s
investments
in
accordance
with
its
investment
program
and
the
overall
management
of
the
fund’s
portfolio,
as
well
as
a
variety
of
related
activities
such
as
financial,
investment
operations,
and
administrative
services;
compliance;
maintaining
the
fund’s
records
and
registrations;
and
shareholder
communications.
The
Board
also
reviewed
the
background
and
experience
of
the
Adviser’s
senior
management
team
and
investment
personnel
involved
in
the
management
of
the
fund,
as
well
as
the
Adviser’s
compliance
record.
The
Board
concluded
that
the
information
it
considered
with
respect
to
the
nature,
quality,
and
extent
of
the
services
provided
by
the
Adviser,
as
well
as
the
other
factors
considered
at
the
Meeting,
supported
the
Board’s
approval
of
the
continuation
of
the
Advisory
Contract.
T.
ROWE
PRICE
Corporate
Income
Fund
Investment
Performance
of
the
Fund
The
Board
took
into
account
discussions
with
the
Adviser
and
detailed
reports
that
it
regularly
receives
throughout
the
year
on
relative
and
absolute
performance
for
the
T.
Rowe
Price
funds.
In
connection
with
the
Meeting,
the
Board
reviewed
information
provided
by
the
Adviser
that
compared
the
fund’s
total
returns,
as
well
as
a
wide
variety
of
other
previously
agreed-upon
performance
measures
and
market
data,
against
relevant
benchmark
indexes
and
peer
groups
of
funds
with
similar
investment
programs
for
various
periods
through
December
31,
2023.
Additionally,
the
Board
reviewed
the
fund’s
relative
performance
information
as
of
September
30,
2023,
which
ranked
the
returns
of
the
fund’s
Investor
Class
for
various
periods
against
a
universe
of
funds
with
similar
investment
programs
selected
by
Broadridge,
an
independent
provider
of
mutual
fund
data.
In
the
course
of
its
deliberations,
the
Board
considered
performance
information
provided
throughout
the
year
and
in
connection
with
the
Advisory
Contract
review
at
the
Meeting,
as
well
as
information
provided
during
investment
review
meetings
conducted
with
portfolio
managers
and
senior
investment
personnel
during
the
course
of
the
year
regarding
the
fund’s
performance.
The
Board
also
considered
relevant
factors,
such
as
overall
market
conditions
and
trends
that
could
adversely
impact
the
fund’s
performance,
the
length
of
the
fund’s
performance
track
record,
and
how
closely
the
fund’s
strategies
align
with
its
benchmarks
and
peer
groups.
The
Board
concluded
that
the
information
it
considered
with
respect
to
the
fund’s
performance,
as
well
as
the
other
factors
considered
at
the
Meeting,
supported
the
Board’s
approval
of
the
continuation
of
the
Advisory
Contract.
Costs,
Benefits,
Profits,
and
Economies
of
Scale
The
Board
reviewed
detailed
information
regarding
the
revenues
received
by
the
Adviser
under
the
Advisory
Contract
and
other
direct
and
indirect
benefits
that
the
Adviser
(and
its
affiliates)
may
have
realized
from
its
relationship
with
the
fund.
In
considering
soft-dollar
arrangements
pursuant
to
which
research
may
be
received
from
broker-dealers
that
execute
the
fund’s
portfolio
transactions,
the
Board
noted
that
during
2023
the
Adviser
paid
the
costs
of
research
services
for
all
client
accounts
that
it
advises,
including
the
T.
Rowe
Price
funds.
However,
effective
January
1,
2024,
the
Adviser
will
begin
using
brokerage
commissions
in
connection
with
certain
T.
Rowe
Price
funds’
securities
transactions
to
pay
for
research
when
permissible.
The
Board
received
information
on
the
estimated
costs
incurred
and
profits
realized
by
the
Adviser
from
managing
the
T.
Rowe
Price
funds.
While
the
Approval
of
Investment
Management
Agreement
(continued)
T.
ROWE
PRICE
Corporate
Income
Fund
Board
did
not
review
information
regarding
profits
realized
from
managing
the
fund
in
particular
because
the
fund
had
either
not
achieved
sufficient
portfolio
asset
size
or
not
recognized
sufficient
revenues
to
produce
meaningful
profit
margin
percentages,
the
Board
concluded
that
the
Adviser’s
profits
were
reasonable
in
light
of
the
services
provided
to
the
T.
Rowe
Price
funds.
The
Board
also
considered
whether
the
fund
benefits
under
the
fee
levels
set
forth
in
the
Advisory
Contract
or
otherwise
from
any
economies
of
scale
realized
by
the
Adviser.
Under
the
Advisory
Contract,
the
fund
pays
a
fee
to
the
Adviser
for
investment
management
services
composed
of
two
components—a
group
fee
rate
based
on
the
combined
average
net
assets
of
most
of
the
T.
Rowe
Price
funds
(including
the
fund)
that
declines
at
certain
asset
levels
and
an
individual
fund
fee
rate
based
on
the
fund’s
average
daily
net
assets—and
the
fund
pays
its
own
expenses
of
operations.
The
group
fee
rate
decreases
as
total
T.
Rowe
Price
fund
assets
grow,
which
reduces
the
management
fee
rate
for
any
fund
that
has
a
group
fee
component
to
its
management
fee,
and
reflects
that
certain
resources
utilized
to
operate
the
fund
are
shared
with
other
T.
Rowe
Price
funds,
thus
allowing
shareholders
of
those
funds
to
share
potential
economies
of
scale.
The
fund’s
shareholders
also
benefit
from
potential
economies
of
scale
through
a
decline
in
certain
operating
expenses
as
the
fund
grows
in
size.
However,
the
fund
is
also
subject
to
contractual
expense
limitations
that
require
the
Adviser
to
waive
its
fees
and/or
bear
any
expenses
that
would
otherwise
cause
the
expenses
of
a
share
class
of
the
fund
to
exceed
a
certain
percentage
based
on
the
class’s
net
assets.
The
expense
limitations
mitigate
the
potential
for
an
increase
in
operating
expenses
above
a
certain
level
that
could
impact
shareholders.
The
fund
also
offers
a
Z
Class,
which
serves
as
an
underlying
investment
within
certain
T.
Rowe
Price
fund
of
funds
arrangements.
The
Adviser
waives
its
advisory
fee
on
the
Z
Class
and
waives
or
bears
the
Z
Class’s
other
operating
expenses,
with
certain
exceptions.
The
Board
considered
whether
the
advisory
fee
and
operating
expense
waivers
on
the
Z
Class
may
present
a
means
for
cross-
subsidization
of
the
Z
Class
by
other
share
classes
of
the
fund.
In
that
regard,
the
Board
noted
that
the
Z
Class
operating
expenses
are
largely
covered
by
the
all-inclusive
fees
charged
by
the
investing
T.
Rowe
Price
fund
of
funds
and
that
any
Z
Class
operating
expenses
not
covered
by
the
investing
T.
Rowe
Price
fund
of
funds’
fees
are
paid
by
the
Adviser
and
not
by
shareholders
of
any
other
share
class
of
the
fund.
Approval
of
Investment
Management
Agreement
(continued)
T.
ROWE
PRICE
Corporate
Income
Fund
In
addition,
the
Board
noted
that
the
fund
potentially
shares
in
indirect
economies
of
scale
through
the
Adviser’s
ongoing
investments
in
its
business
in
support
of
the
T.
Rowe
Price
funds,
including
investments
in
trading
systems,
technology,
and
regulatory
support
enhancements,
and
the
ability
to
possibly
negotiate
lower
fee
arrangements
with
third-party
service
providers.
The
Board
concluded
that
the
advisory
fee
structure
for
the
fund
provides
for
a
reasonable
sharing
of
benefits
from
any
economies
of
scale
with
the
fund’s
investors.
Fees
and
Expenses
The
Board
was
provided
with
information
regarding
industry
trends
in
management
fees
and
expenses.
Among
other
things,
the
Board
reviewed
data
for
peer
groups
that
were
compiled
by
Broadridge,
which
compared:
(i)
contractual
management
fees,
actual
management
fees,
nonmanagement
expenses,
and
total
expenses
of
the
Investor
Class
of
the
fund
with
a
group
of
competitor
funds
selected
by
Broadridge
(Expense
Group)
and
(ii)
actual
management
fees,
nonmanagement
expenses,
and
total
expenses
of
the
Investor
Class
of
the
fund
with
a
broader
set
of
funds
within
the
Lipper
investment
classification
(Expense
Universe).
The
Board
considered
the
fund’s
contractual
management
fee
rate,
actual
management
fee
rate
(which
reflects
the
management
fees
actually
received
from
the
fund
by
the
Adviser
after
any
applicable
waivers,
reductions,
or
reimbursements),
operating
expenses,
and
total
expenses
(which
reflect
the
net
total
expense
ratio
of
the
fund
after
any
waivers,
reductions,
or
reimbursements)
in
comparison
with
the
information
for
the
Broadridge
peer
groups.
Broadridge
generally
constructed
the
peer
groups
by
seeking
the
most
comparable
funds
based
on
similar
investment
classifications
and
objectives,
expense
structure,
asset
size,
and
operating
components
and
attributes
and
ranked
funds
into
quintiles,
with
the
first
quintile
representing
the
funds
with
the
lowest
relative
expenses
and
the
fifth
quintile
representing
the
funds
with
the
highest
relative
expenses.
The
information
provided
to
the
Board
indicated
that
the
fund’s
contractual
management
fee
ranked
in
the
first
quintile
(Expense
Group),
the
fund’s
actual
management
fee
rate
ranked
in
the
first
quintile
(Expense
Group
and
Expense
Universe),
and
the
fund’s
total
expenses
ranked
in
the
fourth
quintile
(Expense
Group
and
Expense
Universe).
The
Board
also
reviewed
the
fee
schedules
for
other
investment
portfolios
with
similar
mandates
that
are
advised
or
subadvised
by
the
Adviser
and
its
affiliates,
including
separately
managed
accounts
for
institutional
and
individual
investors;
subadvised
funds;
and
other
sponsored
investment
portfolios,
including
collective
investment
trusts
and
pooled
vehicles
organized
and
offered
to
investors
outside
the
United
States.
Management
provided
the
Board
with
information
about
the
Adviser’s
responsibilities
and
services
provided
to
subadvisory
and
other
institutional
account
clients,
including
information
about
how
the
requirements
and
Approval
of
Investment
Management
Agreement
(continued)
T.
ROWE
PRICE
Corporate
Income
Fund
economics
of
the
institutional
business
are
fundamentally
different
from
those
of
the
proprietary
mutual
fund
business.
The
Board
considered
information
showing
that
the
Adviser’s
mutual
fund
business
is
generally
more
complex
from
a
business
and
compliance
perspective
than
its
institutional
account
business
and
considered
various
relevant
factors,
such
as
the
broader
scope
of
operations
and
oversight,
more
extensive
shareholder
communication
infrastructure,
greater
asset
flows,
heightened
business
risks,
and
differences
in
applicable
laws
and
regulations
associated
with
the
Adviser’s
proprietary
mutual
fund
business.
In
assessing
the
reasonableness
of
the
fund’s
management
fee
rate,
the
Board
considered
the
differences
in
the
nature
of
the
services
required
for
the
Adviser
to
manage
its
mutual
fund
business
versus
managing
a
discrete
pool
of
assets
as
a
subadviser
to
another
institution’s
mutual
fund
or
for
an
institutional
account
and
that
the
Adviser
generally
performs
significant
additional
services
and
assumes
greater
risk
in
managing
the
fund
and
other
T.
Rowe
Price
funds
than
it
does
for
institutional
account
clients,
including
subadvised
funds.
On
the
basis
of
the
information
provided
and
the
factors
considered,
the
Board
concluded
that
the
fees
paid
by
the
fund
under
the
Advisory
Contract
are
reasonable.
Approval
of
the
Advisory
Contract
As
noted,
the
Board
approved
the
continuation
of
the
Advisory
Contract.
No
single
factor
was
considered
in
isolation
or
to
be
determinative
to
the
decision.
Rather,
the
Board
concluded,
in
light
of
a
weighting
and
balancing
of
all
factors
considered,
that
it
was
in
the
best
interests
of
the
fund
and
its
shareholders
for
the
Board
to
approve
the
continuation
of
the
Advisory
Contract
(including
the
fees
to
be
charged
for
services
thereunder).
Approval
of
Investment
Management
Agreement
(continued)
100
East
Pratt
Street
Baltimore,
MD
21202
T.
Rowe
Price
Investment
Services,
Inc.
Call
1-800-225-5132
to
request
a
prospectus
or
summary
prospectus;
each
includes
investment
objectives,
risks,
fees,
expenses,
and
other
information
that
you
should
read
and
consider
carefully
before
investing.
F112-050
7/24
Item 8. Changes in and Disagreements with Accountants for Open-End Management Investment Companies.
Not applicable.
Item 9. Proxy Disclosures for Open-End Management Investment Companies.
Not applicable.
Item 10. Remuneration Paid to Directors, Officers, and Others of Open-End Management Investment Companies.
Remuneration paid to Directors is included in Item 7 of this Form N-CSR.
Item 11. Statement Regarding Basis for Approval of Investment Advisory Contract.
If applicable, see Item 7.
Item 12. Disclosure of Proxy Voting Policies and Procedures for Closed-End Management Investment Companies.
Not applicable.
Item 13. Portfolio Managers of Closed-End Management Investment Companies.
Not applicable.
Item 14. Purchases of Equity Securities by Closed-End Management Investment Company and Affiliated Purchasers.
Not applicable.
Item 15. Submission of Matters to a Vote of Security Holders.
There has been no change to the procedures by which shareholders may recommend nominees to the registrant’s board of directors.
Item 16. Controls and Procedures.
(a) The registrant’s principal executive officer and principal financial officer have evaluated the registrant’s disclosure controls and procedures within 90 days of this filing and have concluded that the registrant’s disclosure controls and procedures were effective, as of that date, in ensuring that information required to be disclosed by the registrant in this Form N-CSR was recorded, processed, summarized, and reported timely.
(b) The registrant’s principal executive officer and principal financial officer are aware of no change in the registrant’s internal control over financial reporting that occurred during the period covered by this report that has materially affected, or is reasonably likely to materially affect, the registrant’s internal control over financial reporting.
Item 17. Disclosure of Securities Lending Activities for Closed-End Management Investment Companies.
Not applicable.
Item 18. Recovery of Erroneously Awarded Compensation.
Not applicable.
Item 19. Exhibits.
SIGNATURES
Pursuant to the requirements of the Securities Exchange Act of 1934 and the Investment Company Act of 1940, the registrant has duly caused this report to be signed on its behalf by the undersigned, thereunto duly authorized.
T. Rowe Price Corporate Income Fund
| | | | |
| | |
| By | | /s/ David Oestreicher | | |
| | David Oestreicher | | |
| | Principal Executive Officer | | |
| | |
| Date | | July 18, 2024 | | |
Pursuant to the requirements of the Securities Exchange Act of 1934 and the Investment Company Act of 1940, this report has been signed below by the following persons on behalf of the registrant and in the capacities and on the dates indicated.
| | | | |
| By | | /s/ David Oestreicher | | |
| | David Oestreicher | | |
| | Principal Executive Officer | | |
| | |
| Date | | July 18, 2024 | | |
| | |
| By | | /s/ Alan S. Dupski | | |
| | Alan S. Dupski | | |
| | Principal Financial Officer | | |
| | |
| Date | | July 18, 2024 | | |