Table of Contents
SCHEDULE 14A INFORMATION
Proxy Statement Pursuant to Section 14(a) of the Securities
| Filed by the Registrant x | Filed by a Party other than the Registrant o |
Check the appropriate box:
| o | Preliminary Proxy Statement |
| x | Definitive Proxy Statement |
| o | Soliciting Material Pursuant to §240.14a-11(c) or §240.14a-12 |
| o | Confidential, for Use of the Commission Only (as permitted by Rule 14a-6(e)(2)) |
The Boston Beer Company, Inc.
The Boston Beer Company, Inc.
Payment of Filing Fee (Check the appropriate box):
| x | No fee required. |
| o | Fee computed on table below per Exchange Act Rules 14a-6(i)(1) and 0-11. |
1) Title of each class of securities to which transaction applies:
2) Aggregate number of securities to which transaction applies:
3) Per unit price or other underlying value of transaction computed pursuant to Exchange Act Rule 0-11 (Set forth the amount on
which the filing fee is calculated and state how it was determined):
4) Proposed maximum aggregate value of transaction:
5) Total fee paid:
| o | Fee paid previously with preliminary materials. |
| o | Check box if any part of the fee is offset as provided by Exchange Act Rule 0-11(a)(2) and identify the filing for which the offsetting fee was paid previously. Identify the previous filing by registration statement number, or the Form or Schedule and the date of its filing. |
1) Amount Previously Paid:
2) Form, Schedule or Registration Statement No.:
3) Filing Party:
4) Date Filed:
Table of Contents
 |  | |
| C. James Koch | Kathleen H. Wade | |
Chairman of the Board of Directors | Corporate Secretary |
Annual Meeting of Stockholders to be Held on May 25, 2011
Table of Contents
Table of Contents
| • | each person (or group of affiliated persons) known by the Company to be the beneficial owner(s) of more than 5% of the outstanding Class A Common Stock; | |
| • | the current directors of the Company, all of whom are nominees for reelection as directors, and the executive officers of the Company named in the Summary Compensation Table on page 25 (“named executive officers”); and | |
| • | all current directors and executive officers of the Company as a group. |
2
Table of Contents
| Shares Beneficially Owned | ||||||||
Name of Beneficial Owner | Number | Percent | ||||||
Directors and Executive Officers: | ||||||||
C. James Koch(1) | 4,492,174 | 33.4 | % | |||||
Martin F. Roper(2) | 194,030 | * | ||||||
David A. Burwick(3) | 36,200 | * | ||||||
Pearson C. Cummin, III(4) | 53,923 | * | ||||||
Charles J. Koch(5) | 71,800 | * | ||||||
Jay Margolis(6) | 26,000 | * | ||||||
Gregg A. Tanner(7) | 23,000 | * | ||||||
Jean-Michel Valette(8) | 56,500 | * | ||||||
William F. Urich(9) | 164,225 | * | ||||||
Thomas W. Lance(10) | 60,731 | * | ||||||
John C. Geist(11) | 1,894 | * | ||||||
All Directors, Nominees for Director and Executive Officers as a group (13 people) | 5,195,278 | 38.7 | % | |||||
Owners of 5% or More of Our Outstanding Shares: | ||||||||
Black Rock, Inc.(12) | 678,921 | 7.3 | % | |||||
| 40 E. 52nd Street New York, NY 10022 | ||||||||
Neuberger Berman Group LLC(13) | 1,284,400 | 13.8 | % | |||||
| Neuberger Berman LLC | ||||||||
| Neuberger Berman Management LLC | ||||||||
| Neuberger Berman Equity Funds | ||||||||
| 605 Third Avenue, New York, NY 10158 | ||||||||
The Vanguard Group, Inc.(14) | 593,552 | 6.4 | % | |||||
| 100 Vanguard Blvd., Malvern, PA 19355 | ||||||||
| * | Represents holdings of less than one percent (1%). | |
| (1) | Includes 4,107,355 shares of Class B Common Stock, constituting all of the outstanding shares of Class B Common Stock, options to acquire 26,500 shares of Class A Common Stock exercisable currently or within sixty (60) days, 23,486 shares of Class A Common Stock held by Mr. Koch for the benefit of his minor children and 5,266 shares of Class A Common Stock held by Mr. Koch’s spouse as custodian for the benefit of his children for which she has sole voting and investment power. | |
| (2) | Includes options to acquire 193,000 shares of Class A Common Stock exercisable currently or probable to become exercisable within sixty (60) days. | |
| (3) | Includes options to acquire 36,000 shares of Class A Common Stock exercisable currently or within sixty (60) days. | |
| (4) | Includes options to acquire 30,000 shares of Class A Common Stock exercisable currently or within sixty (60) days. |
3
Table of Contents
| (5) | Includes options to acquire 50,000 shares of Class A Common Stock exercisable currently or within sixty (60) days and 1,000 shares held in trust in which Mr. Koch has a beneficial interest. | |
| (6) | Consists of options to acquire 26,000 shares of Class A Common Stock exercisable currently or within sixty (60) days. | |
| (7) | Consists of options to acquire 23,000 shares of Class A Common Stock exercisable currently or within sixty (60) days. | |
| (8) | Includes options to acquire 40,000 shares of Class A Common Stock exercisable currently or within sixty (60) days. | |
| (9) | Includes options to acquire 160,800 shares of Class A Common Stock exercisable currently or within sixty (60) days and 1,871 shares of Class A Common Stock purchased under the Company’s Investment Share program which are not yet vested. | |
| (10) | Includes options to acquire 50,000 shares of Class A Common Stock exercisable currently or within sixty (60) days, 2,000 shares of Class A Common Stock issued pursuant to a restricted stock award which are not yet vested and 638 shares of Class A Common Stock purchased under the Company’s Investment Share program which are not yet vested. | |
| (11) | Consists of 1,894 shares of Class A Commons Stock purchased under the Company’s Investment Share program which are not yet vested. | |
| (12) | Information is based on a Schedule 13G filed with the SEC on February 3, 2011 by BlackRock, Inc., which reported sole voting power and sole dispositive power as follows: sole voting power — 678,921 shares and sole dispositive power — 678,921 shares. | |
| (13) | Information is based on a Schedule 13G filed with the SEC on February 14, 2011 by Neuberger Berman Group LLC, Neuberger Berman LLC, Neuberger Berman Management LLC and Neuberger Berman Equity Funds, which reported that these entities may be deemed to beneficially own all of the shares reported in the table. Neuberger Berman Group LLC and Neuberger Berman LLC each reported shared voting power with respect to 1,115,191 shares and shared dispositive power with respect to 1,284,400 shares. Neuberger Berman Management LLC reported shared voting power and shared dispositive power with respect to 1,024,419 shares. Neuberger Berman Equity Funds reported shared voting power and shared dispositive power with respect to 1,018,419 shares. These entities also reported that the holdings of Neuberger Berman Trust Co N.A., Neuberger Berman Trust Co of Delaware N.A., NB Alternative Fund Management LLC, NB Alternatives Advisers LLC and Neuberger Berman Fixed Income LLC, affiliates of Neuberger Berman LLC, are also aggregated to comprise the shares reported. | |
| (14) | Information is based on a Schedule 13G filed with the SEC on February 11, 2011 by The Vanguard Group, Inc., which reported sole voting power and sole and shared dispositive power as follows: sole voting power — 14,017 shares, shared dispositive power — 14,017 shares, and sole dispositive power — 579,535 shares. |
| Items 1 and 2. | ELECTION OF CLASS A AND CLASS B DIRECTORS |
4
Table of Contents
| Year First | Position With the Company | |||||||||
| Elected | or Principal Occupation | |||||||||
Name of Nominee | Age | a Director | During the Past Five Years | |||||||
| David A. Burwick | 49 | 2005 | In April, 2010, Mr. Burwick became President, North America, of Weight Watchers International, Inc., a publicly-held company based in New York City and a leading provider of weight management services. Mr. Burwick had been Senior Vice President and Chief Marketing Officer of PepsiCo — North American Beverages, headquartered in Purchase, New York until September 2009. Before assuming that position in April 2008, he had been Executive Vice President, Commercial, of PepsiCo International and President of Pepsi-QTG Canada, headquartered in Toronto, a position he held from November 2005 to March 2008. Mr. Burwick held several positions with Pepsi-Cola North America, including serving as Senior Vice President and Chief Marketing Officer from June 2002 until immediately prior to his move to Pepsi-QTG Canada. Mr. Burwick has extensive experience in marketing consumer product goods and brand development. | |||||||
5
Table of Contents
| Year First | Position With the Company | |||||||||
| Elected | or Principal Occupation | |||||||||
Name of Nominee | Age | a Director | During the Past Five Years | |||||||
| Pearson C. Cummin, III | 68 | 1995 | Mr. Cummin has been active as a private investor for over five years and is currently the Managing Member of Grey Fox Associates I, LLC, a private investment company headquartered in Greenwich, Connecticut. He served as a Director of Pacific Sunwear of California, Inc., a California-based specialty apparel retailer, from 1988 through March 2010, where he also had served as chair of its compensation committee and a member of its audit and nominating/governance committees. Mr. Cummin currently serves as the Secretary/Treasurer elect of the American Diabetes Association. From 1986 through 2002, Mr. Cummin served as a general partner of Consumer Venture Partners, a Greenwich, Connecticut-based venture capital firm. He is an experienced investor and a venture capitalist, with extensive experience in finance, public company corporate governance and executive compensation matters. | |||||||
| Jean-Michel Valette | 50 | 2003 | Mr. Valette currently serves as an independent advisor to select branded consumer companies. He is Chairman of the Board and a member of the audit and nominating/governance committees of Peet’s Coffee and Tea Inc., a California-based specialty coffee company. He is also Chairman of the Board and a member of the audit committee of Select Comfort Corporation, a Minneapolis-based bedding company. Until October 2006, he was also Chairman of Robert Mondavi Winery, a California wine company. Prior to assuming that position, he had served as President and Managing Director of Robert Mondavi Winery from October 2004 to January 2005. From May 2003 through May 2006, Mr. Valette served as a Class B Director of the Company. Mr. Valette has extensive experience in management, public company corporate governance, strategic planning and finance, as well as in the alcohol beverage industry. | |||||||
6
Table of Contents
| Year First | Position With the Company | |||||||||
| Elected | or Principal Occupation | |||||||||
Name of Nominee | Age | a Director | During the Past Five Years | |||||||
| C. James Koch | 61 | 1995 | Mr. Koch founded the Company in 1984 and currently serves as its Chairman. Until January 2001, Mr. Koch also served as the Company’s Chief Executive Officer and he served as the Company’s Secretary/Clerk until May 2010. He is a member of the Board of Directors of the Brewers Association, which represents craft brewers in the U.S. Prior to starting the Company, he had worked as a consultant for an international consulting firm, with a focus on manufacturing. His 25 years at the helm of the Company, during which it grew from a small start-up company to its current position, is a testament to his skill in brewing, strategy, brand development and industry leadership. | |||||||
| Charles J. Koch | 88 | 1995 | Mr. Koch is the father of founder C. James Koch. In 1989, Mr. Koch retired as founder and co-owner of Chemicals, Inc., a distributor of brewing and industrial chemicals in southwestern Ohio, a business that he had established and managed for over 30 years. Prior to that, Mr. Koch had been a brewmaster for several years. He also holds a degree in brewing from the Siebel Institute of Technology. | |||||||
| Jay Margolis | 62 | 2006 | Mr. Margolis is currently an independent investor. He serves as a Director of Burlington Coat Factory Warehouse Corporation, a privately held company headquartered in Burlington, New Jersey, Godiva Chocolatier Inc., a privately held, high-end specialty chocolate manufacturer and retailer, with its North American headquarters located in New York, New York, and Built NY, Inc., a privately held designer and manufacturer of fashionable and functional totes, bags, cases and similar consumer products, also headquartered in New York, New York. From October 2005 through July 2007, Mr. Margolis served as the President and CEO of the Apparel Group of Limited Brands located in Ohio. Before assuming that position, he had been President and Chief Operating Officer of Massachusetts-based Reebok, Inc. since 2001, where he also served as a Director. Prior to that he served on the boards and as an executive officer of other well-known clothing brands. Mr. Margolis has significant knowledge of retailing of consumer product goods, merchandising, consumer insights, strategic planning and public company corporate governance. | |||||||
7
Table of Contents
| Year First | Position With the Company | |||||||||
| Elected | or Principal Occupation | |||||||||
Name of Nominee | Age | a Director | During the Past Five Years | |||||||
| Martin F. Roper | 48 | 1999 | Mr. Roper is the President and Chief Executive Officer of the Company, a position he had held since January 2001. Mr. Roper joined the Company as Vice President of Manufacturing and Business Development in September 1994, became the Chief Operating Officer in April 1997 and became President and Chief Operating Officer in December 1999. In November 2007, Mr. Roper joined the board of directors of Lumber Liquidators, Inc., a Virginia-based hardwood flooring retailer and is chair of its compensation committee and a member of its audit committee. Mr. Roper holds a masters degree in manufacturing, as well as an advanced degree in business management. Prior to joining the Company, he worked as a strategy consultant and led small manufacturing companies in turn-around situations. His experience, both prior to and since joining the Company, provides strength in operations, strategy, finance, public company corporate governance and general management. | |||||||
| Gregg A. Tanner | 54 | 2007 | Mr. Tanner is currently Executive Vice President and Chief Supply Chain Officer of Dean Foods Company of Dallas, Texas, a position he has held since November 2007. From July 2006 through October 2007, Mr. Tanner was Senior Vice President of Global Operations for The Hershey Company of Hershey, Pennsylvania. He was with ConAgra Foods of Omaha, NE from September 2001 through July 2005, holding the position of Senior Vice President, Retail Supply Chain from June 2002 through July 2005. Prior to that, Mr. Tanner held positions of increasing responsibility at the Quaker Oats Company and Ralston Purina Company. Mr. Tanner has over 30 years of operations and supply chain management experience in the food and beverage industry, with significant experience in risk management. | |||||||
8
Table of Contents
9
Table of Contents
10
Table of Contents
11
Table of Contents
| In effect | ||||||||
Applies to | Payment For | Prior to 6/1/2010 | 6/1/2010 | Payable(1) | ||||
| All Non-Management | One-time Award | Option for 5,000 | No change | Upon first-time election | ||||
| Directors | shares of Class A | to the Board | ||||||
| Common Stock(2) | ||||||||
| All Non-Management | Annual Award | Option for 5,000 | No change | Upon each subsequent | ||||
| Directors | shares of Class A | election to the Board | ||||||
| Common Stock(2) | ||||||||
| All Non-Management | Annual Retainer | $7,500 | $12,500 | Upon election to the | ||||
| Directors | Board | |||||||
| Chair, Audit | Annual Retainer | $11,000 | $13,000 | Upon appointment | ||||
| Committee | ||||||||
| Chair, Compensation | Annual Retainer | $2,500 | $6,000 | Upon appointment | ||||
| Committee | ||||||||
| Chair, Nominating/ | Annual Retainer | $2,500 | $4,500 | Upon appointment | ||||
| Governance Committee | ||||||||
| Members of Audit | Annual Retainer | $9,000 | $10,000 | Upon appointment to the | ||||
| Committee (other than | Audit Committee | |||||||
| Chair) | ||||||||
| Members of Other | Annual Retainer | $500 | $2,000 | Upon appointment to a | ||||
| Standing Committees | standing committee other | |||||||
| (other than Chair) | than the Audit Committee | |||||||
| All Non-Management | Attendance at | $3,000 | $4,000 | After attendance at the | ||||
| Directors | Regular Board | meeting | ||||||
| Meeting in person | ||||||||
| All Non-Management | Attendance at | $1,000 | $2,000 | After attendance at the | ||||
| Directors | Regular Board | meeting | ||||||
| Meeting by | ||||||||
| telephone | ||||||||
| All Non-Employee | Attendance at | — | $1,000 | After attendance at the | ||||
| Directors | Special Board | meeting | ||||||
| Meetings by | ||||||||
| telephone | ||||||||
| All Committee | Attendance at | $750 | $1,000 | After attendance at the | ||||
| Members | Committee Meeting | meeting | ||||||
| in person | ||||||||
| All Committee | Attendance at | $200 | $750 | After attendance at the | ||||
| Members | Committee Meeting | meeting | ||||||
| by telephone |
12
Table of Contents
| (1) | All retainers and the annual option grant are pro-rated if the non-management Director is appointed after the annual meeting of stockholders. | |
| (2) | All options to non-management directors are granted under the Company’s Non-Employee Director Stock Option Plan, as amended and restated (the “Director Option Plan”). As provided in the Director Option Plan, options carry an exercise price equal to the fair market value of the underlying shares on the date of grant, are immediately fully vested and expire ten (10) years after the date of grant or three (3) years after the grantee ceases to be a director of the Company, whichever occurs sooner. The number of shares of Class A Common Stock registered under the Plan is 550,000 shares, with 172,500 remaining shares available for issuance. |
| Fees Earned or | Option | All Other | ||||||||||||||
Name | Paid in Cash($) | Awards($)(1)(2) | Compensation($) | Total($) | ||||||||||||
| David A. Burwick | $ | 30,750 | $ | 130,855 | $ | 0 | $ | 161,605 | ||||||||
| Pearson C. Cummin, III | $ | 40,200 | $ | 130,855 | $ | 0 | $ | 171,055 | ||||||||
| Charles J. Koch | $ | 14,500 | $ | 130,855 | $ | 4,030 | (3) | $ | 149,385 | |||||||
| Jay Margolis | $ | 23,750 | $ | 130,855 | $ | 0 | $ | 154,605 | ||||||||
| Gregg A. Tanner | $ | 34,200 | $ | 130,855 | $ | 0 | $ | 165,055 | ||||||||
| Jean-Michel Valette | $ | 38,450 | $ | 130,855 | $ | 0 | $ | 169,305 | ||||||||
| (1) | Reflects the dollar amount of the aggregate grant date fair value of awards granted during the fiscal year ended December 25, 2010 as computed in accordance with Accounting Standards Codification 718,Compensation-Stock Compensation(“ASC 718”). The methods and assumptions used in valuing the stock option awards in accordance with ASC 718 are described in Notes B and M to the Company’s audited financial statements for the fiscal year ended December 25, 2010 included in the Company’s Annual Report onForm 10-K filed with the SEC on March 8, 2011. | |
| (2) | On May 26, 2010, each Director was granted an option under the Director Option Plan to purchase 5,000 shares of the Company’s Class A Common Stock at an exercise price of $61.855, the average of the high and low price of such stock on the date of grant. All options are fully vested as of the date of grant. As of December 25, 2010, the aggregate number of stock options held by directors who are not named executive officers is shown below: |
Name | Number of Options | |||
| David A. Burwick | 36,000 | |||
| Pearson C. Cummin, III | 30,000 | |||
| Charles J. Koch | 50,000 | |||
| Jay Margolis | 26,000 | |||
| Gregg A. Tanner | 23,000 | |||
| Jean-Michel Valette | 45,000 | |||
| (3) | Represents reimbursement of certain administrative fees incurred as a result of a tax-related reporting error by the Company. |
13
Table of Contents
| • | provide executives with competitive cash and stock compensation with a significant portion of total compensation contingent on individual and Company performance, as well as the creation of stockholder value; | |
| • | provide higher compensation to high-value contributors and high performers in the most critical areas of the Company’s business; and |
14
Table of Contents
| • | encourage executives to act as owners with an equity stake in the Company, while reducing risk from its compensation practices that would be reasonably likely to have a material adverse effect on the Company by basing variable compensation on a range of performance criteria that have a mix of short-term and long-term implications. |
15
Table of Contents
16
Table of Contents
17
Table of Contents
18
Table of Contents
| % of Base | ||||||||||
| Bonus | ||||||||||
| 2010 Base Bonus Goals for CEO: | Opportunity | |||||||||
Fiscal 2010 Base Bonus Performance Goal | Weighting | 2010 Performance | Awarded | |||||||
| • Weighted combined depletions and pricing growth of at least 7% with a minimum 2010 EPS greater than $2.48 | 10 | % | Achieved weighted combined depletions and pricing growth of 11.5% and EPS of $3.52 | 10.0 | % | |||||
| • Weighted combined depletions and pricing growth of at least 4% better than craft volume growth with a 2010 EPS greater than $2.48 | 20 | % | * | * | ||||||
| • Delivered gross profit of at least $206 million and gross profit margin of at least 48% | 10 | % | Achieved delivered gross profit of $232.3 million and gross profit margin of 50.1% | 10.0 | % | |||||
| • Implementation of resource efficiency programs to improve gross profit margin realization in 2010 and beyond | 10 | % | Implemented resource efficiency programs to improve gross profit margin realization | 10.0 | % | |||||
| • Systematic improvement in internal processes, procedures and capabilities | 5 | % | Achieved expectations for systematic improvements in internal processes, procedures and capabilities | 5.0 | % | |||||
| • Reductions in the cost of goods and freight of at least $10 million by the Brewing and Operations departments and by other departments by at least $4 million | 30 | % | Achieved cost reductions in excess of specified target amounts | 30.0 | % | |||||
| • Improve brand management capabilities, including significant improvements of advertising campaigns and new metrics to measure effectiveness of the campaigns | 15 | % | Partially achieved expectations for improvements in brand management capabilities | 7.5 | % | |||||
Total | 100 | % | 72.5 | %** | ||||||
| * | The Compensation Committee was not able to determine whether this goal had been attained due to insufficient information. When the information needed to measure performance with respect to this goal becomes available for the Committee’s review, the bonus award may be increased by the Committee. | |
| ** | Without taking into consideration the possible achievement of the goal for which determination has not yet been possible. |
19
Table of Contents
| % of Stretch Bonus | ||||||||||
Fiscal 2010 Stretch Bonus Performance Goal | Weighting | 2010 Performance | Awarded | |||||||
| • Weighted combined depletions and pricing growth of at least 6% better than the craft category | 25.0 | % | Target not achieved | 0 | % | |||||
| • Weighted combined depletions and pricing growth of at least 9% better than the craft category | 37.5 | % | Target not achieved | 0 | % | |||||
| • Processing costs of under $2.00 per case equivalent for owned breweries, holding energy costs at planned levels | 37.5 | % | Target not achieved | 0 | % | |||||
Total | 100 | % | 0 | % | ||||||
20
Table of Contents
Fiscal 2010 Bonus Performance Goal | Weighting | 2010 Performance | % of Bonus Awarded | |||||||
| • Weighted combined depletions and pricing growth of at least 7% with a minimum 2010 EPS greater than $2.48 | 10 | % | Achieved weighted combined depletions and pricing growth of 11.5% and EPS of $3.52 | 10.0 | % | |||||
| • Weighted combined depletions and pricing growth of at least 4% better than craft volume growth with a 2010 EPS greater than $2.48 | 30 | % | * | * | ||||||
| • Delivered gross profit of at least $206 million and gross profit margin of at least 48% | 20 | % | Achieved delivered gross profit of $232.3 million and gross profit margin of 50.1% | 20.0 | % | |||||
| • Implementation of resource efficiency programs to improve gross profit margin realization in 2010 and beyond | 20 | % | Met expectations for implementing resource efficiency programs | 20.0 | % | |||||
| • Improve time and resources in support of craft beer industry initiatives | 20 | % | Achieved expectations for improvements in support of industry initiatives | 20.0 | % | |||||
Total | 100 | % | 70 | %** | ||||||
| * | The Compensation Committee was not able to determine whether this goal had been attained due to insufficient information. When the information needed to measure performance with respect to this goal becomes available for the Committee’s review, the bonus award may be increased by the Committee. | |
| ** | Without taking into consideration the possible achievement of the goal for which determination has not yet been possible. |
21
Table of Contents
| • | William F. Urich, Treasurer & Chief Financial Officer | |
| • | Thomas W. Lance, Vice President of Operations | |
| • | John C. Geist, Vice President of Sales |
| % Increase to | ||||||||
| Fiscal 2010 | Fiscal 2009 | |||||||
Named Executive Officer | Base Salary | Base Salary | ||||||
| William F. Urich | $ | 372,000 | 2.8 | % | ||||
| Thomas W. Lance | $ | 329,000 | 2.8 | % | ||||
| John C. Geist | $ | 315,000 | 5.0 | % | ||||
22
Table of Contents
| % of Bonus | ||||||||||
Fiscal 2010 Bonus Performance Goal | Weighting | 2010 Performance | Awarded | |||||||
| • Shared Company-Wide Goals | 30 | % | All goals achieved | 30 | % | |||||
Individual Goals: | ||||||||||
| • Deliver at least $4 million in resource efficiencies outside of delivered gross margin; support efforts to achieve delivered gross margin goal of $10 million in savings; develop performance improvement measurements, KPI’s and financial reporting | 35 | % | Expectations achieved | 35 | % | |||||
| • Through effective use of procurement department, deliver at least $1.5 million in reduced costs outside of delivered gross margin and identify at least $3.25 million in delivered gross margin savings | 15 | % | Achieved $2.4 million of cost savings and identified over $4.0 million in delivered gross margin savings | 15 | % | |||||
| • Support sales force through identifying unplanned pricing opportunities, develop program to track wholesaler and retailer margins; implement process to evaluate wholesaler incentives and management of local marketing resources | 10 | % | Achieved expectations for pricing opportunities and margin tracking; Tracking wholesaler incentives not achieved | 5 | % | |||||
| • Improve IT operational efficiency | 10 | % | Achieved expectations | 10 | % | |||||
Total | 100 | % | 95 | % | ||||||
| % of Bonus | ||||||||||
Fiscal 2010 Bonus Performance Goal | Weighting | 2010 Performance | Awarded | |||||||
| • Shared Company-Wide Goals | 20 | % | All goals achieved | 20 | % | |||||
Individual Goals: | ||||||||||
| • Reduce total incident rate by 5% | 10 | % | Expectations not achieved | 0 | % | |||||
| • Improve total quality aggregate score by 5% | 10 | % | Target not fully achieved | 9 | % | |||||
| • Develop and implement inventory improvements | 10 | % | Target achieved | 10 | % | |||||
| • Deliver at least $10 million in delivered gross margin savings | 20 | % | Delivered $10.5 million in delivered gross margin savings | 20 | % | |||||
| • Develop leadership and implement performance improvements in the breweries | 15 | % | Target achieved | 15 | % | |||||
| • Restructure Cincinnati Brewery to improvement alignment of volume needs with cost structure | 5 | % | Expectations partially achieved | 4 | % | |||||
| • Develop and implement employee relations strategy at the Pennsylvania Brewery | 10 | % | Significant progress, but goal was not fully achieved | 8 | % | |||||
Total | 100 | % | 86 | % | ||||||
23
Table of Contents
| % of Bonus | ||||||||||
Fiscal 2010 Bonus Performance Goal | Weighting | 2010 Performance | Awarded | |||||||
| • Shared Company-Wide Goals | 30 | % | All goals achieved | 30 | % | |||||
Individual Goals: | ||||||||||
| • Achieve specific depletions targets for all Samuel Adams beers, Samuel Adams Boston Lager and Twisted Tea | 20 | % | Performance exceeded all targets | 20 | % | |||||
| • Grow Samuel Adams share of craft category measured by IRI data | 5 | % | Expectations not achieved | 0 | % | |||||
| • Achieve specific growth targets for convenience stores and on-premise national accounts | 10 | % | Performance exceeded both targets | 10 | % | |||||
| • Develop leadership in the off-premise craft category with execution in at least 10 chain stores | 5 | % | Expectations not fully achieved | 2 | % | |||||
| • Implement “Sam to Standard” program with all core wholesalers, tracking market improvements | 4 | % | Target achieved | 4 | % | |||||
| • Implement display tracking for key holidays with all core wholesalers, tracking market improvements | 4 | % | Target achieved | 4 | % | |||||
| • Improve conversion rate for seasonal beers on draft | 4 | % | Target achieved | 4 | % | |||||
| • Collect draft surveys in 90% of core wholesalers with a list of targeted accounts. | 4 | % | Expectations partially achieved | 2 | % | |||||
| • Achieve net mixed price increases by 1.5%, with an additional $500,000 in unplanned pricing increases | 7 | % | Expectations partially achieved | 5 | % | |||||
| • Stay within local marketing and expense budgets allocated to sales | 7 | % | Expectations not achieved | 0 | % | |||||
Total | 100 | % | 81 | % | ||||||
24
Table of Contents
| (1) | The material in this report is not “soliciting material,” is not deemed filed with the SEC and is not to be incorporated by reference in any filing of the Company under the Securities Act of 1933, as amended, or the Securities Exchange Act of 1934, as amended, whether made before or after the date hereof and irrespective of any general incorporation language in any such filing. |
| Non-Equity | ||||||||||||||||||||||||
| Incentive Plan | ||||||||||||||||||||||||
| Name and | Salary | Option | Compensation | All Other | ||||||||||||||||||||
Principal Position | Year | ($)(1) | Awards ($)(2) | ($)(1) | Compensation ($)(3) | Total ($) | ||||||||||||||||||
Martin F. Roper | 2010 | $ | 686,750 | — | $ | 398,315 | (4) | $ | 9,173 | $ | 1,094,238 | (4) | ||||||||||||
| President & Chief | 2009 | $ | 666,750 | — | $ | 373,380 | $ | 9,173 | $ | 1,049,303 | ||||||||||||||
| Executive Officer | 2008 | $ | 666,750 | $ | 6,341,503 | $ | 399,977 | $ | 7,688 | $ | 7,415,918 | |||||||||||||
William F. Urich | 2010 | $ | 372,000 | $ | 380,445 | (5) | $ | 176,700 | $ | 9,173 | $ | 938,318 | ||||||||||||
| Treasurer & Chief | 2009 | $ | 362,000 | $ | 265,275 | (6) | $ | 130,320 | $ | 9,173 | $ | 766,768 | ||||||||||||
| Financial Officer | 2008 | $ | 352,000 | $ | 330,305 | (6) | $ | 144,320 | $ | 7,688 | $ | 834,313 | ||||||||||||
C. James Koch | 2010 | $ | 375,000 | $ | 190,222 | (5) | $ | 262,500 | (4) | $ | 9,173 | $ | 836,895 | (4) | ||||||||||
| Chairman | 2009 | $ | 273,000 | $ | 127,332 | (6) | $ | 136,500 | $ | 9,173 | $ | 546,005 | ||||||||||||
| 2008 | $ | 273,000 | $ | 172,333 | (6) | $ | 136,475 | $ | 7,688 | $ | 589,496 | |||||||||||||
Thomas W. Lance | 2010 | $ | 329,000 | — | $ | 141,684 | $ | 9,173 | $ | 479,857 | ||||||||||||||
| Vice President of | 2009 | $ | 320,000 | $ | 425,790 | (5) | $ | 103,680 | $ | 9,173 | $ | 858,643 | ||||||||||||
| Operations | 2008 | $ | 312,000 | — | $ | 129,948 | $ | 7,688 | $ | 449,636 | ||||||||||||||
John C. Geist | 2010 | $ | 315,000 | $ | 380,445 | (5) | $ | 127,575 | $ | 9,173 | $ | 832,193 | ||||||||||||
| Vice President of | 2009 | $ | 300,000 | $ | 265,275 | (6) | $ | 73,500 | $ | 9,173 | $ | 647,948 | ||||||||||||
| Sales | 2008 | $ | 290,000 | $ | 330,305 | (6) | $ | 120,350 | $ | 7,688 | $ | 748,343 | ||||||||||||
25
Table of Contents
| (1) | Included in this column are amounts earned, though not necessarily received, during the corresponding fiscal year. | |
| (2) | Reflects the dollar amount of the aggregate grant date fair value of awards granted during each fiscal year as computed in accordance with Accounting Standards Codification 718,Compensation-Stock Compensation(“ASC 718”). The methods and assumptions used in valuing the stock option awards in accordance with ASC 718 are described in Notes B and M to the Company’s audited financial statements for the fiscal year ended December 25, 2010 included in the Company’s Annual Report onForm 10-K filed with the Securities and Exchange Commission on March 8, 2011. | |
| (3) | Includes annual group life insurance premium and Company matching contributions under the Company’s 401(k) plan paid in the respective year. | |
| (4) | At its February 2011 meeting, the Compensation Committee was not able to determine whether one goal had been attained due to insufficient information. When the information needed to measure performance with respect to that goal becomes available for the Committee’s review, the bonus award may be increased by the Committee. The information shown above reflects the non-equity incentive payment for 2010 as of the date of this Proxy Statement. | |
| (5) | Grant contains performance-based vesting conditions; as such, the value reported above reflects the value of the award at the grant date and is consistent with the estimate of aggregate compensation cost to be recognized over the service period determined as of the grant date under ASC 718, excluding the effect of estimated forfeitures. In 2010, the Company concluded that it was probable that the performance criteria would be met and recorded the related compensation expense. In February 2011, the Compensation Committee determined that the maximum performance criteria had been achieved and the shares eligible to vest under the options would vest commencing in March 2011 as to 100% of the shares. | |
| (6) | Grant contains performance-based vesting conditions; as such, the value reported above reflects the value of the award at the grant date and is consistent with the estimate of aggregate compensation cost to be recognized over the service period determined as of the grant date under ASC 718, excluding the effect of estimated forfeitures. Such value has not been recognized for financial statement purposes, as the performance conditions were not met. |
26
Table of Contents
| Estimated | ||||||||||||||||||||||||||||||||||||
| Possible | ||||||||||||||||||||||||||||||||||||
| Payouts | ||||||||||||||||||||||||||||||||||||
| Under | ||||||||||||||||||||||||||||||||||||
| Non-Equity | Grant | |||||||||||||||||||||||||||||||||||
| Incentive | Exercise or | Closing | Date Fair | |||||||||||||||||||||||||||||||||
| Plan | Estimated Future Payouts Under | Base Price | Price on | Value of | ||||||||||||||||||||||||||||||||
| Awards(3) | Equity Incentive Plan Awards(1) | of Option | Date of | Option | ||||||||||||||||||||||||||||||||
| Grant | Approval | Maximum | Threshold | Target | Maximum | Awards | Grant | Awards | ||||||||||||||||||||||||||||
Name | Date(1) | Date(2) | ($) | (#) | (#) | (#) | ($/sh) | ($/sh) | ($)(4) | |||||||||||||||||||||||||||
Martin F. Roper | — | — | $ | 988,902 | — | — | — | — | — | — | ||||||||||||||||||||||||||
William F. Urich | 1/1/10 | 12/15/09 | $ | 186,000 | 9,500 | 14,250 | 19,000 | $ | 46.60 | (3) | $ | 46.60 | $ | 380,445 | ||||||||||||||||||||||
C. James Koch | 1/1/10 | 12/15/09 | $ | 375,000 | 4,750 | 7,125 | 9,500 | $ | 46.60 | (3) | $ | 46.60 | $ | 190,222 | ||||||||||||||||||||||
Thomas W. Lance | — | — | $ | 164,500 | — | — | — | — | — | — | ||||||||||||||||||||||||||
John C. Geist | 1/1/10 | 12/15/09 | $ | 157,500 | 9,500 | 14,250 | 19,000 | $ | 46.60 | (3) | $ | 46.60 | $ | 380,445 | ||||||||||||||||||||||
| (1) | Each option vests at 20% per year provided certain criteria are met. The vesting of each option is contingent on the Company achieving certain performance criteria. If the Company’s depletions increased by at least 2%, but less than 3%, over 2009 depletions, 50% of the number of shares would be eligible to vest in accordance with the vesting schedule (“Threshold”). If the Company’s depletions increased by at least 3%, but less than 4%, over 2009 depletions, 75% of the number of shares would be eligible to vest in accordance with the vesting schedule (“Target”). If the Company’s depletions increased by 4% or more over 2009 depletions, 100% of the number of shares shall be eligible to vest in accordance with the vesting schedule (“Maximum”). In February 2011, the Compensation Committee determined that the Maximum had been achieved. As a result, 20% of the Shares vested on March 1, 2011 and, so long as the Optionee continues to be employed by the Company or an affiliate of the Company as of each indicated date, the Option shall become incrementally exercisable as to 20% of Shares on January 1 in each of the years 2012, 2013, 2014 and 2015. | |
| (2) | At the December 15, 2009 meeting of the Board of Directors, upon the recommendation of the Compensation Committee, the Board of Directors granted the options effective as of January 1, 2010, with an exercise price equal to the closing price of the Company’s stock on the New York Stock Exchange on the last trading day immediately prior to the effective date of the option grant. | |
| (3) | There are no threshold levels for these awards. The amount reflects the maximum payout for full achievement of the performance goals. Nevertheless, the Compensation Committee has the discretion to adjust the actual payout upon evaluation of overall achievement. | |
| (4) | Reflects the dollar amount of the aggregate grant date fair value of awards granted during each fiscal year as computed in accordance with ASC 718. The methods and assumptions used in valuing the stock option awards in accordance with ASC 718 are described in Notes B and M to the Company’s audited financial statements for the fiscal year ended December 25, 2010 included in the Company’s Annual Report onForm 10-K filed with the Securities and Exchange Commission on March 8, 2011. |
27
Table of Contents
| Option Awards | Stock Awards | |||||||||||||||||||||||||||
| No. of | No. of | No. of | Market | |||||||||||||||||||||||||
| Securities | Securities | Securities | No. of | Value of | ||||||||||||||||||||||||
| Underlying | Underlying | Underlying | Shares of | Shares | ||||||||||||||||||||||||
| Unexercised | Unexercised | Unexercised | Option | Option | Stock That | that Have | ||||||||||||||||||||||
| Options | Options | Options | Exercise | Expiration | Have Not | Not | ||||||||||||||||||||||
Name | Exercisable | Unexercisable | Unearned | Price ($) | Date | Vested | Vested ($) | |||||||||||||||||||||
Martin F. Roper | 4,000 | (1) | — | — | $ | 18.465 | 1/1/2014 | — | — | |||||||||||||||||||
| 9,000 | (2) | — | — | $ | 21.140 | 1/1/2015 | ||||||||||||||||||||||
| 180,000 | (3) | — | — | $ | 22.425 | 6/28/2015 | ||||||||||||||||||||||
| — | 180,000 | (4) | — | $ | 43.550 | 8/11/2017 | ||||||||||||||||||||||
| — | 753,864 | (5) | — | $ | 37.650 | (5) | 12/31/2018 | |||||||||||||||||||||
William F. Urich | 83,800 | (6) | — | — | $ | 15.835 | 9/8/2013 | — | — | |||||||||||||||||||
| 50,000 | (6) | — | — | $ | 18.000 | 9/8/2013 | ||||||||||||||||||||||
| 6,000 | (7) | — | — | $ | 21.140 | 1/1/2015 | ||||||||||||||||||||||
| 8,000 | (8) | 2,000 | (8) | — | $ | 24.950 | 1/1/2016 | |||||||||||||||||||||
| 5,400 | (9) | 3,600 | (9) | — | $ | 35.980 | 1/1/2017 | |||||||||||||||||||||
| — | — | 19,000 | (10) | $ | 46.600 | 12/31/2019 | ||||||||||||||||||||||
C. James Koch | 12,000 | (11) | 3,000 | (11) | — | $ | 26.070 | 1/1/2016 | — | — | ||||||||||||||||||
| 7,200 | (9) | 4,800 | (9) | — | $ | 35.980 | 1/1/2017 | |||||||||||||||||||||
| — | — | 9,500 | (10) | $ | 46.600 | 12/31/2019 | ||||||||||||||||||||||
Thomas W. Lance | 20,000 | (12) | 20,000 | (12) | — | $ | 34.700 | 1/22/2017 | 4,000 | (13) | $ | 150,600 | ||||||||||||||||
| — | — | 60,000 | (14) | $ | 18.510 | 3/12/2019 | ||||||||||||||||||||||
John C. Geist | — | 4,000 | (8) | — | $ | 24.950 | 1/1/2016 | — | — | |||||||||||||||||||
| — | 8,000 | (9) | — | $ | 35.980 | 1/1/2017 | ||||||||||||||||||||||
| — | — | 19,000 | (10) | $ | 46.600 | 12/31/2019 | ||||||||||||||||||||||
| (1) | Option granted 1/1/04 and shares vested at the rate of 20% per year commencing one year after date of grant. | |
| (2) | Option granted 1/1/05 and provides that 3,000 shares vested on 5/31/07, 5/31/08 and 5/31/09 due to certain performance criteria being met. Does not include 3,000 shares which lapsed as of 3/1/06 and 3/1/10 as a result of performance criteria not having been met. | |
| (3) | Option granted 6/28/05 and 180,000 shares vested on 5/1/08 due to certain performance criteria being met. Does not include 120,000 shares which lapsed as of 5/1/10 as a result of certain performance criteria not having been met. | |
| (4) | Option granted 8/13/07 and provides that 180,000 shares will vest on 8/13/2013 contingent on Mr. Roper’s continued employment with the Company. | |
| (5) | Option granted 1/1/08 and provides that shares vest at the rate of 20% on January 1 in each of the years 2014 through 2018, contingent on Mr. Roper’s continued employment with the Company. The exercise price is determined by multiplying $42.00 by the aggregate change in the DJ Wilshire 5000 Index from and after January 1, 2008 through the close of business on the trading date next preceding each date on which the option is exercised. The exercise price will not be less than $37.65 per share and the excess of the fair value of the Company’s Class A Common Stock cannot exceed $70 per share over the exercise price. | |
| (6) | Options granted 9/8/03 and shares vested at the rate of 20% per year commencing one year after date of grant. | |
| (7) | Option granted on 1/1/05 and 2,000 shares vested on 5/31/07, 5/31/08 and 5/31/09 due to certain performance criteria being met. Does not include 2,000 shares which lapsed as of 3/1/06 and 3/1/10 as a result of performance criteria not having been met. | |
| (8) | Option granted 1/1/06 and shares will vest at the rate of 20% per year due to certain performance criteria being met as of 3/1/07. |
28
Table of Contents
| (9) | Option granted 1/1/07 and shares will vest at the rate of 20% per year due to certain performance criteria being met as of 3/1/08. | |
| (10) | Option granted 1/1/2010 and the shares will vest at the rate of 20% per year if certain performance criteria are met as of 3/1/11. On 3/1/11 it was determined the option will vest due to performance criteria being met. | |
| (11) | Option granted 2/16/06 and shares will vest at the rate of 20% per year due to certain performance criteria being met as of 3/1/07. | |
| (12) | Option granted 1/29/07 and provides that shares will vest at the rate of 25% per year if certain performance criteria were met as of 1/22/09, with the first vesting date being 3/1/09. Does not include 40,000 shares which lapsed as of 3/1/09 due to certain performance criteria not having been met. | |
| (13) | Restricted stock awarded 1/29/07 and shares vest at a rate of 20% per year commencing 1/22/08. | |
| (14) | Option granted 3/13/09 and provides that shares vest at the rate of 331/3% on March 1 in each of the years 2011, 2012 and 2013, contingent on certain performance criteria being met. In February 2011, it was determined the option will vest due to performance criteria being met. |
| Option Awards | Stock Awards | |||||||||||||||
| No. of Shares | No. of Shares | |||||||||||||||
| Acquired on | Value Realized on | Acquired on | Value Realized on | |||||||||||||
Name | Exercise (#) | Exercise ($) | Vesting (#) | Vesting(1) ($) | ||||||||||||
| Martin F. Roper | — | — | — | — | ||||||||||||
| William F. Urich | 25,500 | $ | 1,412,341 | — | — | |||||||||||
| C. James Koch | — | — | — | — | ||||||||||||
| Thomas W. Lance | — | — | 2,000 | $ | 93,020 | |||||||||||
| John C. Geist | 21,000 | $ | 520,274 | — | — | |||||||||||
| (1) | The aggregate dollar amount realized upon vesting equals the number of shares vested multiplied by the market value of the underlying shares on the vesting date. |
29
Table of Contents
30
Table of Contents
31
Table of Contents
| • | Audit Fees. The Company paid audit fees to Ernst & Young in the amount of $383,000 for its audit of the Company’s 2010 annual financial statements and for quarterly reviews during the fiscal year ended December 25, 2010. Fees for the audit of the Company’s 2009 annual financial statements and quarterly reviews during the fiscal year ended December 26, 2009 totaled $450,600. These amounts include fees for the review and certification of the Company’s compliance with the provisions of Section 404 of the Sarbanes-Oxley Act of 2002. |
| • | Audit-Related Fees. The Company paid Ernst & Young $26,000 for audit fees relating to the Company’s 401(k) plans in 2010 and $14,000 for audit fees relating to the Company’s 401(k) plans in 2009. The increase is due to the inclusion of the 401(k) plan of a subsidiary in the 2010 audit. | |
| • | Tax Fees. The Company paid Ernst & Young an aggregate of $153,580 for tax-related services in 2010, which consisted of $57,500 in federal and state tax return compliance assistance, $87,055 for federal and state examination review assistance and $9,025 for other tax advisory services. The Company paid Ernst & Young an aggregate of $540,505 for tax-related services in 2009, which consisted of $136,600 for federal and state tax return compliance assistance, $67,765 for federal and state examination review assistance and $336,140 in tax-related advisory services in connection with an internal organizational restructuring that was effected as of the beginning of the 2010 fiscal year. | |
| • | Other Fees. The Company paid no other fees to Ernst & Young during the 2010 and 2009 fiscal years. |
32
Table of Contents
33
Table of Contents
34
Table of Contents
Both are available 24 hours a day, 7 days a week.
http://www.proxyvoting.com/sam
1-866-540-5760
97221 97222
THIS PROXY WILL BE VOTED AS DIRECTED, OR IF NO DIRECTION IS INDICATED, WILL BE VOTED “FOR” THE ELECTION OF DIRECTORS, “FOR” ITEM 3 AND FOR “EVERY 1 YEAR” ON ITEM 4. | Please mark your votes as indicated in this example | x |
| FOR | WITHHOLD | *EXCEPTIONS | ||||
| ALL | FOR ALL | |||||
1. ELECTION OF DIRECTORS Nominees: | o | o | o |
02 Pearson C. Cummin, III
03 Jean-Michel Valette
Management recommends a vote FOR the following proposal:
| FOR | AGAINST | ABSTAIN | ||||||||
| 3. | To approve the non-binding advisory resolution relating to executive compensation. | o | o | o | ||||||
| Management recommends a vote for EVERY 1 YEAR on the following proposal: | ||||||||||
| 1 year | 2 years | 3 years | Abstain | |||||||
| 4. | Non-binding advisory vote on frequency of executive compensation vote | o | o | o | o | |||||
| Such other matters as may properly come before the meeting or at any adjournment there of. | ||||||||
| Mark Here for Address Change or Comments SEE REVERSE | o | |||||||
Signature | Signature | Date |
Table of Contents
9:00 A.M.
The Brewery
30 Germania Street
Boston, MA 02130
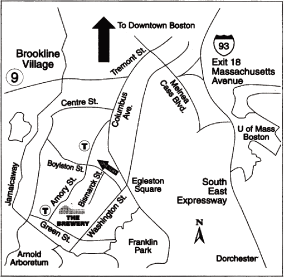
Follow Tremont St through seven lights. Take a right on Amory St(Landmark: look for a big, powder blue Muffler Mart shop on the right-directly after Centre Street).Follow Amory St through 2 lights. After the 2nd light take a left on Porter St(Landmark: Directly after Boyiston St). Go to the end of Porter St and the Brewery is on the right.
The Proxy Statement and the 2010 Annual Report to Stockholders are available at:
http://www.proxyvoting.com/sam
(Mark the corresponding box on the reverse side)
P.O. BOX 3550
SOUTH HACKENSACK, NJ 07606-9250
| WO# | Fulfillment# | |||||
| 97221 | 97222 |