INCOME OPPORTUNITY REALTY INVESTORS, INC.
CONSOLIDATED STATEMENTS OF OPERATIONS
(Unaudited)
| | | For the Years Ended March 31, | |
| | | 2018 | | | 2017 | |
| | | (dollars in thousands, except per share amounts) | |
| Revenues: | | | | | | |
| Rental and other property revenues | | $ | — | | | $ | — | |
| | | | | | | | | |
| Expenses: | | | | | | | | |
| Property operating expenses (including $0 and $0 for the three months ended 2018 and 2017, respectively, from related parties) | | | — | | | | — | |
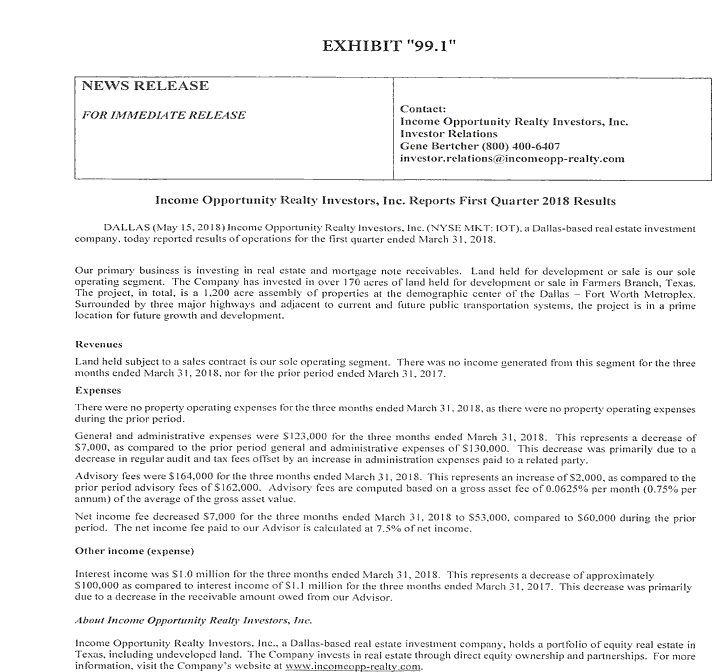
| General and administrative (including $42 and $54 for the three months ended 2018 and 2017, respectively, from related parties) | | | 123 | | | | 130 | |
| Net income fee to related party | | | 53 | | | | 60 | |
| Advisory fee to related party | | | 164 | | | | 162 | |
| Total operating expenses | | | 340 | | | | 352 | |
| Net operating loss | | | (340 | ) | | | (352 | ) |
| | | | | | | | | |
| Other income (expenses): | | | | | | | | |
| Interest income from related parties | | | 1,042 | | | | 1,089 | |
| Total other income | | | 1,042 | | | | 1,089 | |
| | | | | | | | | |
| Income before taxes | | | 702 | | | | 737 | |
| Net income | | $ | 702 | | | $ | 737 | |
| | | | | | | | | |
| Earnings per share - basic and diluted | | | | | | | | |
| Net income | | $ | 0.17 | | | $ | 0.18 | |
| | | | | | | | | |
| Weighted average common shares used in computing earnings per share | | | 4,168,214 | | | | 4,168,214 | |
INCOME OPPORTUNITY REALTY INVESTORS, INC.
CONSOLIDATED BALANCE SHEETS
| | | March 31, | | | December 31, | |
| | | 2018 | | | 2017 | |
| | | (Unaudited) (dollars in thousands, except par value amount) | |
| Assets | | | | | | | | |
| Real estate land holdings subject to sales contract, at cost | | $ | 22,717 | | | $ | 22,717 | |
| Total real estate | | | 22,717 | | | | 22,717 | |
| | | | | | | | | |
| Notes and interest receivable from related parties | | | 13,568 | | | | 14,030 | |
| Total notes and interest receivable | | | 13,568 | | | | 14,030 | |
| Cash and cash equivalents | | | 2 | | | | 2 | |
| Receivable and accrued interest from related parties | | | 50,790 | | | | 49,631 | |
| Other assets | | | 1,517 | | | | 1,517 | |
| Total assets | | $ | 88,594 | | | $ | 87,897 | |
| | | | | | | | | |
| Liabilities and Shareholders’ Equity | | | | | | | | |
| Liabilities: | | | | | | | | |
| Accounts payable and other liabilities | | $ | 5 | | | $ | 10 | |
| Total liabilities | | | 5 | | | | 10 | |
| Shareholders’ equity: | | | | | | | | |
| Common stock, $0.01 par value, authorized 10,000,000 shares; issued 4,173,675 and outstanding 4,168,214 shares in 2018 and 2017 | | | 42 | | | | 42 | |
| Treasury stock at cost, 5,461 shares in 2018 and 2017 | | | (39 | ) | | | (39 | ) |
| Paid-in capital | | | 61,955 | | | | 61,955 | |
| Retained earnings | | | 26,631 | | | | 25,929 | |
| Total shareholders’ equity | | | 88,589 | | | | 87,887 | |
| Total liabilities and shareholders’ equity | | $ | 88,594 | | | $ | 87,897 | |
