
Refining . . . Plus Much More
September 21, 2004

Safe Harbor Statement
Those statements made by representatives of Sunoco during the course of this presentation that are not historical facts are forward-looking statements intended to be covered by the safe harbor provisions of Section 27A of the Securities Act of 1933 and Section 21E of the Securities Exchange Act of 1934. These forward-looking statements are based upon a number of assumptions by Sunoco concerning future conditions, any or all of which may ultimately prove to be inaccurate. Forward-looking statements are inherently uncertain and necessarily involve risks that may affect Sunoco’s business prospects and performance, causing actual results to differ materially from those discussed during this presentation. Such risks and uncertainties include, by way of example and not of limitation: general business and economic conditions; competitive products and pricing; changes in refining, chemical and other product margins; variation in petroleum-based commodity prices and availability of crude oil supply or transportation; fluctuations in supply of feedstocks and demand for products manufactured; changes in operating conditions and costs; changes in the expected level of environmental capital, operating or remediation spending; potential equipment malfunction; potential labor relations problems; the legislative or regulatory environment; ability to identify acquisition candidates, enter into agreement of terms favorable to us and integrate them into our existing businesses, ability to enter into joint ventures and other collaborations with favorable terms, plant construction/repair delays, non-performance by major customers, suppliers or other business partners; and political and economic conditions including the impact of potential terrorist acts and international hostilities. These and other applicable risks and uncertainties have been described more fully in Sunoco’s Second Quarter 2004 Form 10-Q, filed with the Securities and Exchange Commission on August 5, 2004. Unpredictable or unknown factors not discussed herein could also have material adverse effects on forward-looking statements. All forward-looking statements included in this presentation are expressly qualified in their entirety by the foregoing cautionary statements.
Sunoco undertakes no obligation to update any forward-looking statements whether as a result of new information or future events.
2

Sunoco Representatives
Jack Drosdick Chairman and CEO
Joel Maness Senior V. P. Refining & Supply
Bob Owens Senior V. P. Retail Marketing
Bruce Fischer Senior V. P. Chemicals
Mike Dingus Senior V.P. Sun Coke
Tom Hofmann Senior V. P. Finance and CFO
3

Agenda
What we have done
What we have recently added to the businesses
What more we can do with existing assets
What we expect in the future
4

Refining & Supply
Joel Maness

Refining
Refining Capacity (MB/D)
Phila / Marcus Hook 505
Eagle Point 150
NERC 655
Toledo 150
Tulsa 85
MCRC 235
Total 890
Annual Production of 335 MMB
Each $1.00/B in refining margins » $2.70 /share
Tulsa
Toledo
Philadelphia
Eagle Point
Marcus Hook
6

Refining & Supply
Excluding Eagle Point: Average earnings of $209 MM and ROCE of 19% for 2000—03 . . . $252 MM net income in 1H04
with Eagle Point: $317 MM earnings in 1H04 . . . on average Capital Employed of approximately $900 MM
Implemented “Five Fingers” culture . . . Safe, Environmentally Sound, Reliable, Solomon Pacesetter, Optimization . . . throughout the organization
Have achieved substantial operating gains throughout the system
safety and environment performance improvements have led the way
have improved UEDC and EII to 1st / 2nd quartile levels
annual production increased 15 MMB since 2000 . . . equivalent to a 40,000 BPD refinery
7

Refining & Supply—Employee Recordable Rate
Recordable injuries / illnesses per 200,000 hours worked
0.0
0.2
0.4
0.6
0.8
1.0
1.2
1.4
1.6
2000
2001
2002
2003
08-30-2004
8
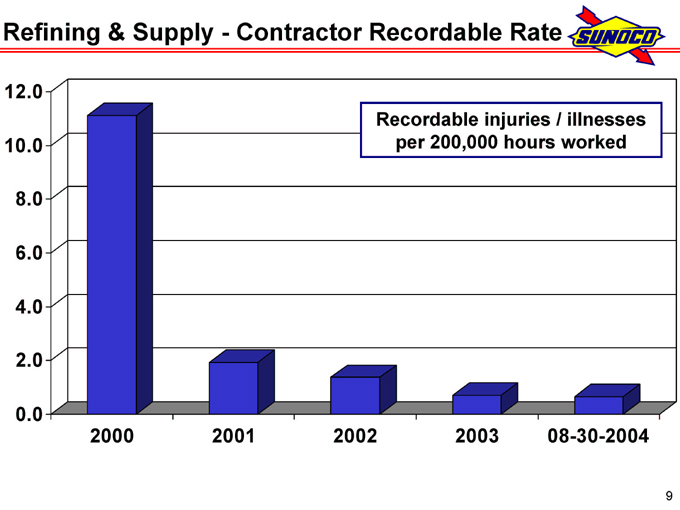
Refining & Supply—Contractor Recordable Rate
Recordable injuries / illnesses per 200,000 hours worked
0.0
2.0
4.0
6.0
8.0
10.0
12.0
2000
2001
2002
2003
08-30-2004
9
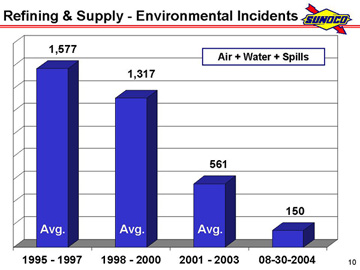
Refining & Supply—Environmental Incidents
Air + Water + Spills
1,577
1,317
561
150
1995—1997
1998—2000
2001—2003
08-30-2004
10

U.S. Refinery Utilization, (UEDC)
Percent
95
90
85
80
75
70
73 94.1 91.5 92.0 89.7 85.3
1996 1998 2000 2002 1H04
NERC *
88.8
Better
1st Quartile 2nd Quartile 3rd Quartile 4th Quartile
1% UEDC improvement = $6—7 MM/yr in increased production for Refining & Supply
* NERC excludes Eagle Point (acquired 1/2004)
11
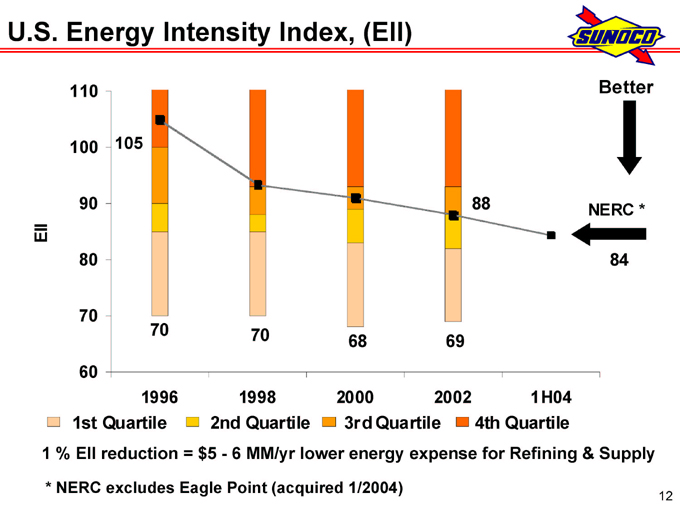
U.S. Energy Intensity Index, (EII)
EII
110 100 90 80 70 60
105
88
70 70
68 69
1996 1998 2000 2002 1H04
Better
NERC *
84
1st Quartile 2nd Quartile 3rd Quartile 4th Quartile
1% EII reduction = $5—6 MM/yr lower energy expense for Refining & Supply
* NERC excludes Eagle Point (acquired 1/2004)
12

Eagle Point
Acquired in January 2004 for $235 MM (including inventory)
150,000 BPD refinery . . . expanded Sunoco capacity by 20%
also included a 4,500 BPD cumene unit ($40 MM), logistics assets sold to Sunoco Logistics Partners ($20 MM)
immediate integration into Sunoco system and real synergy capture
$65 MM income contribution in 1H04
further improvement opportunities and action plans developed
13

Income Improvement Initiatives
Eagle Point
improve Energy Intensity Index (EII) to levels comparable with rest of Northeast system (119 vs. 84)
Expand crude oil supply alternatives
higher sulfur, higher acid sweet crudes for Northeast system
increased Canadian supply for Mid-Continent system
Organic income improvement investments
Continued progress on “Five Fingers”
14

Expectations
Margins continue to be volatile and cyclical . . . but also continue to be above historical mid-cycle over the next several years
Continue to “get more” from the existing system . . . aided by capital where appropriate
Continue to be opportunistic and disciplined in acquisition efforts
Continue to provide a strong base of earnings and cash flow for the Company
15

Retail Marketing
Bob Owens

Net Income and ROCE
Average $73 MM income / 14% ROCE (1997—2003)
MM$ 100
80 60 40 20 0
% 20
16 12 8 4 0
1997 1998 1999 2000 2001 2002 2003 1H04
Net Income
ROCE(%)
17

Sunoco Marketing Area: 1997
3,600 Sites
3.4 B Gallons
$540 MM Cap Employed
18

Sunoco Marketing Area: 2004
4,800 Sites
5.2 B Gallons
$600 MM Cap Employed *
* Projected average
19

Coastal Acquisitions: 2001 & 2002
$62 MM
Tested Sunoco brand acceptance in Southeast with modest investment
Coastal brand used as secondary offering
20

Recent Acquisitions
$343 MM
Speedway: high-quality, Co-op sites in Southeast
Expect to recover $30 MM through real estate divestments
COP: high volume, good real estate, contiguous to primary Sunoco market
Expected to contribute $30 MM per year in earnings
Speedway: 2003
ConocoPhillips: 2004
21

MCJ1
Retail Portfolio Management (RPM)
Optimize invested capital
Expect $200 MM real estate proceeds in 2003-05
$100 MM realized, balance over next 18 months
370 of 1,600 Company-owned / leased sites
Retain volume with dealers / distributors
$100 MM from credit card outsourcing (2Q04)
Expect modest earnings accretion
Expect net gain on divestments
Improves ROCE
75 in 2003 Spring
22

More From Existing Assets
Brand position
Retail buying experience
NASCAR
Capital investments
Stores / stations
Technology
Process improvement
Same-store sales growth
Fuel and merchandise
Expense control
23

Expectations
Competitive pressures to continue but average margins comparable to 2000-03 period
Business to reflect improved earnings power and ROCE as a result of recent acquisitions, RPM and improvement initiatives
Continue to be opportunistic in considering acquisitions and further growth of our Brand
24

Chemicals
Bruce Fischer

Chemicals Capital Employed, MM$
Phenol $450
Polypropylene $600
Other—$15
Total: $1.065 B at 6/30/04
26

Chemicals
Steady financial improvement ($0.07 EPS in 2001, $0.68 EPS in 2003) but ROCE has been unacceptable—- economics have favored feedstock providers
Focus on cash generation to Sunoco and optimizing operations
$323 MM net cash generation (ex-acquisitions) from 1/1/01 to 6/30/04, including plasticizers divestment
shut down approximately 10 % of phenol and polypropylene capacity
improved employee productivity by 30 %
optimized logistics and raw material procurement
27
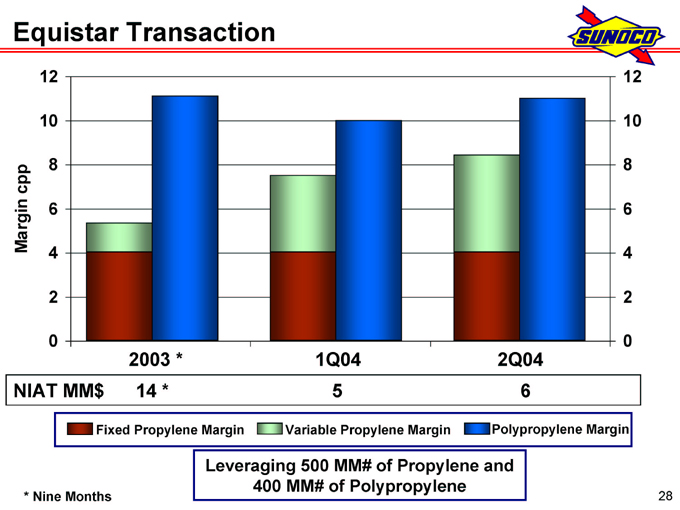
Equistar Transaction
Margin cpp
12 10 8 6 4 2 0
12 10 8 6 4 2 0
2003 * 1Q04 2Q04 NIAT MM$ 14 * 5 6
Fixed Propylene Margin Variable Propylene Margin Polypropylene Margin
Leveraging 500 MM# of Propylene and 400 MM# of Polypropylene
Nine Months
28

Operating Rates
North American
Polypropylene & Phenol Operating Rates
Industry Utilization, (%)
100 95 90 85 80 75 70
2000 2001 2002 2003 2004 Est.
Polypropylene
Phenol
Source: Industry Statistics
29

Current Sunoco Status
Productivity initiatives implemented
Operating rates 90 % +
Spot market pricing moving up (Asia export)
Gaining pricing power
Income in a $45 /BBL crude environment
No significant industry capacity additions announced
Believe Cyclical Recovery is Underway
30

Sun Coke
Mike Dingus

Sun Coke Advantage
32

Sun Coke Advantage
33

Sun Coke Advantage
34

Sun Coke Advantage
35

Sun Coke Advantage
Superior Technology . . . heat recovery vs. traditional chemical by-product plants
lower capital and operating costs
higher quality coke . . . improved blast furnace efficiency
greater coal blend flexibility
environmentally superior . . . negative pressure . . . convert waste heat into steam or electric power
Unique Joint Venture development model
36
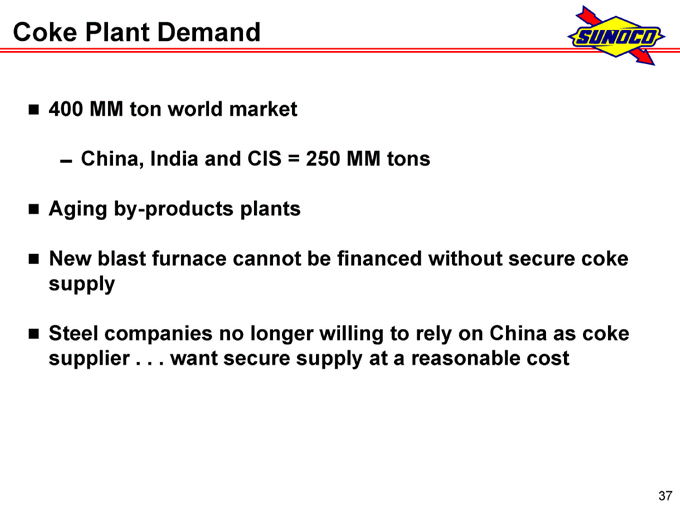
Coke Plant Demand
400 MM ton world market
China, India and CIS = 250 MM tons
Aging by-products plants
New blast furnace cannot be financed without secure coke supply
Steel companies no longer willing to rely on China as coke supplier . . . want secure supply at a reasonable cost
37

Sun Coke Strategy
Demonstrate technology and develop growth plan, based on:
good customers, assets and credit
good logistics
stable energy markets with spot, medium and long-term contracts
long-term take-or-pay contacts . . . coal price pass through . . . targeted steady return on equity investment
seeks customers as partners
38

Sun Coke Today
Jewell (Virginia)
Completed in the 1960’s . . . 700,000 ton
$309 MM proceeds from sale of partnership interests (in 1995/00)
ISG—offtaker
Indiana Harbor (Indiana) . . . 1,300,000 ton
Completed in 1998 for $195 MM
$415 MM proceeds from sale of partnership interests (in 1998/02)
Ispat Inland – offtaker
39

Sun Coke Today
Haverhill I (Ohio)
550,000 ton, $140MM
Under construction, expected completion 1Q 2005
ISG—offtaker
Steam supply to Sunoco Chemicals Haverhill phenol plant
Vitoria, Brazil—1% ownership, currently
1,600,000 ton, $380 MM
Under construction, expected completion 3Q 2006
Option to increase ownership to 20%
CST, Belgo Mineria, Acesita, CVRD—offtakers
SCC earns technology and operating fees
40

Sun Coke Business Plan for the Future
Multiple minority interest projects
Sun Coke equity ownership < 40% . . . generally $15 MM to $35 MM invested per project
non-recourse project financing
expect equity to earn attractive return . . . other equity owners to include steel company customers . . . parallel interests and goals
Sun Coke also receives technology and operating fees
responsible for construction engineering and ongoing operations
41

Prototype Coke Plant
240 ovens, 1.2 MM tons
100 MW electricity
$365 MM capital cost
$255 MM project financing, $77 MM partners equity, $33 MM Sun Coke equity
Partners typically steel company customer, power operator / marketer or coal provider
After-tax income of $15—20 MM / year to Sun Coke
42

Active Development Projects
3 projects in permitting phase . . . representing approximately 2.7 MM tons and $850 MM total construction cost
Subject to finalization of contracts and other contingencies and approvals
At 30% equity interest in each project . . . Sun Coke total investment would be approximately $75 MM
With fees, total income potential of approximately $30 MM / year
Option to increase Brazil ownership to 20% . . . approximately $5 MM incremental income per year
In various stages of discussion on several other projects
43

Financial Review
Tom Hofmann

Strategy Has Been Consistent
(1) Get more from existing assets
Higher refinery production (15 MMB since 2000)
Improved refinery efficiency (EII / UEDC)
Higher retail throughputs (up 15% since 2000)
Rationalized chemical production lines / costs
Asset rationalization
$100 MM retail portfolio management program
$90 MM sale of plasticizers business
$100 MM sale of Proprietary Credit Card
$129 MM SXL secondary offering
45

Strategy Has Been Consistent
(2) Opportunistically upgrade the asset base
Purchase Price (MM$) 1H04 Income (MM$)
Refining & Supply—Eagle Point (1/04) 235 65
Retail Marketing—Speedway (6/03) 162 4
Retail Marketing—ConocoPhillips (4/04) 181 5
Chemicals—Equistar (4/03) 198 11
776 85
46

Strategy Has Been Consistent
(2) Opportunistically upgrade the asset base
Purchase Price (MM$) 1H04 Income (MM$)
Refining & Supply—Eagle Point (1/04) 235 65
Retail Marketing—Speedway (6/03) 162 4
Retail Marketing—ConocoPhillips (4/04) 181 5
Chemicals—Equistar (4/03) 198 11
776 85
Haverhill Ohio Coke Plant (1Q05) 140 15*
* Expected annualized Sunoco earnings
47

Strategy Has Been Consistent
(3) Return cash to shareholder
Increased dividend in 2003 and 2004
Dividend is $1.20 / share, highest yield among refining peers
Reduced shares outstanding 17% (net of option exercises) since 1/1/00
New $500 MM authorization
48

Strategy Has Been Consistent
(4) Maintained financial strength
Strong balance sheet
Balanced approach of funding asset growth, dividend and share repurchase
Strong operating cash flow
Generated $1.2 B from asset sales / other sources
Increased total assets from $5.5 B at 12/31/00 to $8.0 B at 6/30/04
Debt restructuring underway
Maintained investment grade rating
49
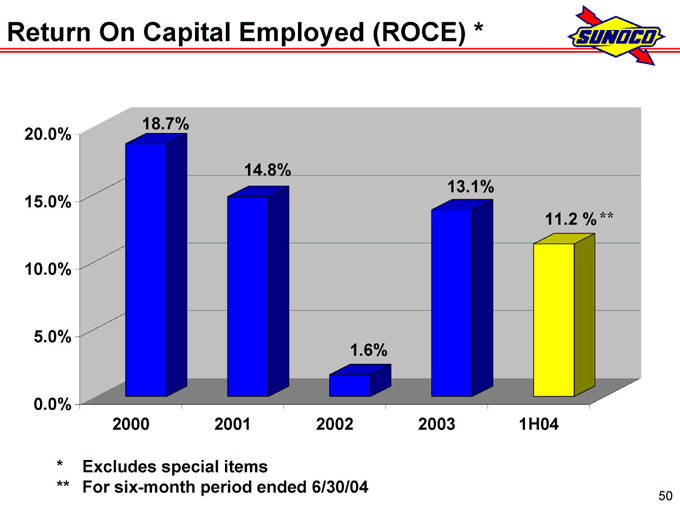
Return On Capital Employed (ROCE) *
20.0% 15.0% 10.0% 5.0% 0.0%
18.7%
14.8%
13.1%
11.2 %**
1.6%
2000 2001 2002 2003 1H04
* Excludes special items
** For six-month period ended 6/30/04
50

Strategy remains unchanged
Positive market fundamentals
Substantial organic growth and improvement potential from existing asset base
Financial capacity to do more
Prudent growth in all businesses
Return cash to shareholders
Summary
Continue to build a bigger, more diversified company with greater earnings power and less shares outstanding.
51

Appendix

Summary of Results
2000
2001
2002
2003
1H04
Income (Loss) before Special Items, MM$
438
380
(25)
335
327
Income (Loss) before Special Items EPS, $/share
5.01
4.63
(0.33)
4.32
4.29
ROCE, % *
18.7
14.8
1.6
13.1
11.2
Debt / Capital, % (net of cash) **
47***
49
45
42
34
Share Repurchase, MM$
144
393
—
136
65
Shares O/S @ Period-end, MM
84.8
75.5
76.4
75.4
75.3
Share Price @ Period-end, $/share
33.69
37.34
33.18
51.15
63.62
* Calculated using Income before Special Items. 1H ratio not annualized.
** Per Revolver Covenant
*** Pro-forma to reflect Aristech acquisition completed 1/1/01.
A1

Earnings Profile, MM$
2000
2001
2002
2003
1H04
Refining & Supply
317
290
(31)
261
317
Retail Marketing
77
87
20
91
20
Chemicals
16
6
28
53
24
Logistics
46
42
33
26
17
Coke
61
61
42
43
18
Corporate / Net Financing
(79)
(106)
(117)
(139)
(69)
438
380
(25)
335
327
Special Items
(16)
18
(22)
(23)
(4)
Consolidated Net Income (Loss)
422
398
(47)
312
323
EPS (diluted):
Income (Loss) before Special Items
5.01
4.63
(0.33)
4.32
4.29
Special Items
(0.19)
0.22
(0.29)
(0.29)
(0.06)
Net Income (Loss)
4.82
4.85
(0.62)
4.03
4.23
A2

Total Shareholder Return (4+ Years)
Dollars
Peer Group Ashland Lyondell Marathon Premcor Tesoro Valero
Major Oil Cos. Amerada Hess BP
ChevronTexaco Exxon Mobil ConocoPhillips
350 300 250 200 150 100 50 0
Sunoco, Inc.
Peer Major Group Oil Cos.
S&P 500 Stock Index
1999 2000 2001 2002 2003
* Estimated total return (including reinvested dividends) 1/1/00—9/17/04. Peer Group and Major Oil returns weighted by market capitalization (proxy methodology).
A3

Sunoco Shares Outstanding, MM
Have repurchased 21 MM shares ($810 MM) over this period
90 85 80 75 70 65
89.9 84.8 75.5 76.4 75.4 74.6
12-31-99 12-31-00 12-31-01 12-31-02 12-31-03 09-01-04
A4