Exhibit 99.2
3Q04 Earnings Conference Call
October 21, 2004
1
Safe Harbor Statement
This slide presentation should be reviewed in conjunction with Sunoco’s Third Quarter 2004 earnings conference call, held on October 21, 2004 at 3:00 p.m. ET. You may listen to the audio portion of the conference call on this website or an audio recording will be available after the call’s completion by calling 1-800-642-1687 and entering conference ID # 1232297.
Those statements made by representatives of Sunoco during the course of this conference call that are not historical facts are forward-looking statements intended to be covered by the safe harbor provisions of Section 27A of the Securities Act of 1933 and Section 21E of the Securities Exchange Act of 1934. These forward-looking statements are based upon a number of assumptions by Sunoco concerning future conditions, any or all of which may ultimately prove to be inaccurate. Forward-looking statements are inherently uncertain and necessarily involve risks that may affect Sunoco’s business prospects and performance, causing actual results to differ materially from those discussed during this conference call. Such risks and uncertainties include, by way of example and not of limitation: general business and economic conditions; competitive products and pricing; changes in refining, chemical and other product margins; variation in petroleum-based commodity prices and availability of crude oil supply or transportation; fluctuations in supply of feedstocks and demand for products manufactured; changes in product specifications; availability and pricing of oxygenates; phase-outs or restrictions on the use of MTBE; changes in operating conditions and costs; changes in the expected level of environmental capital, operating or remediation expenditures; age of, and changes in, the reliability and efficiency of the Company’s or a third party’s operating facilities; potential equipment malfunction; potential labor relations problems; the legislative and regulatory environment; ability to identify acquisitions under favorable terms and integrate them into the Company’s existing businesses; ability to enter into joint ventures and other arrangements with favorable terms; plant construction/repair delays; non-performance by major customers, suppliers or other business partners; changes in financial markets impacting pension expense and funding requirements; political and economic conditions, including the impact of potential terrorist acts and international hostilities; and changes in the status of, or initiation of new, litigation. These and other applicable risks and uncertainties have been described more fully in Sunoco’s Second Quarter 2004 Form 10-Q filed with the Securities and Exchange Commission on August 5, 2004. Unpredictable or unknown factors not discussed herein could also have material adverse effects on forward-looking statements. All forward-looking statements included in this conference call are expressly qualified in their entirety by the foregoing cautionary statements.
Sunoco undertakes no obligation to update any forward-looking statements whether as a result of new information or future events.
2
3Q04 Earnings Highlights
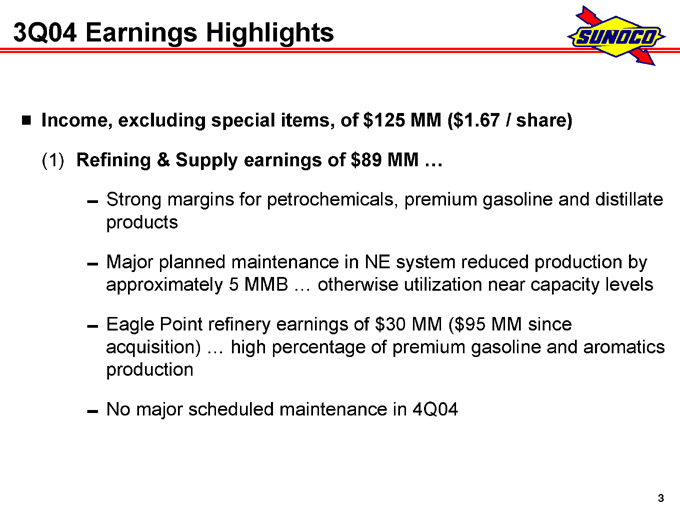
Income, excluding special items, of $125 MM ($1.67 / share)
(1) Refining & Supply earnings of $89 MM …
Strong margins for petrochemicals, premium gasoline and distillate products
Major planned maintenance in NE system reduced production by approximately 5 MMB … otherwise utilization near capacity levels
Eagle Point refinery earnings of $30 MM ($95 MM since acquisition) … high percentage of premium gasoline and aromatics production
No major scheduled maintenance in 4Q04
3
3Q04 Earnings Highlights
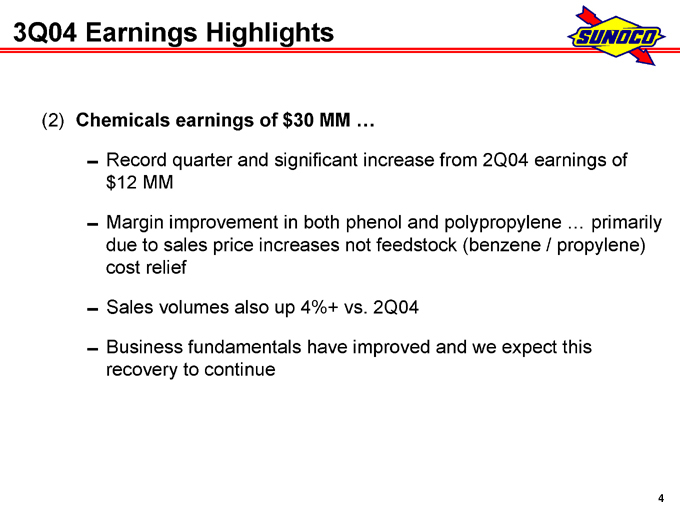
(2) Chemicals earnings of $30 MM …
Record quarter and significant increase from 2Q04 earnings of $12 MM
Margin improvement in both phenol and polypropylene … primarily due to sales price increases not feedstock (benzene / propylene) cost relief
Sales volumes also up 4%+ vs. 2Q04
Business fundamentals have improved and we expect this recovery to continue
4
3Q04 Earnings Highlights
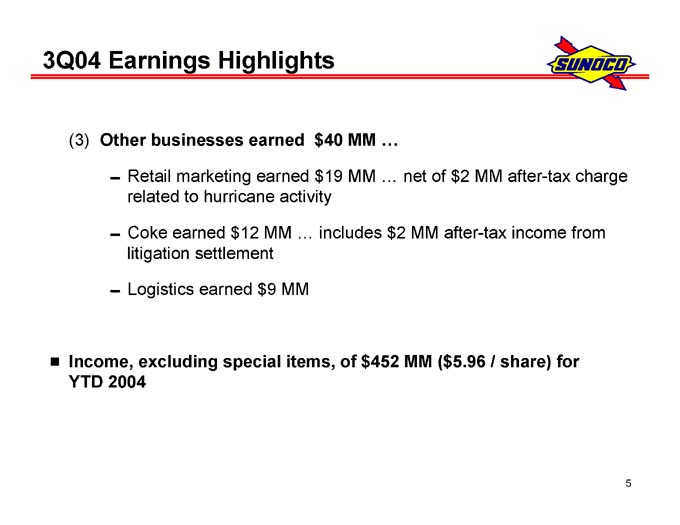
(3) Other businesses earned $40 MM …
Retail marketing earned $19 MM … net of $2 MM after-tax charge related to hurricane activity
Coke earned $12 MM … includes $2 MM after-tax income from litigation settlement
Logistics earned $9 MM
Income, excluding special items, of $452 MM ($5.96 / share) for YTD 20045
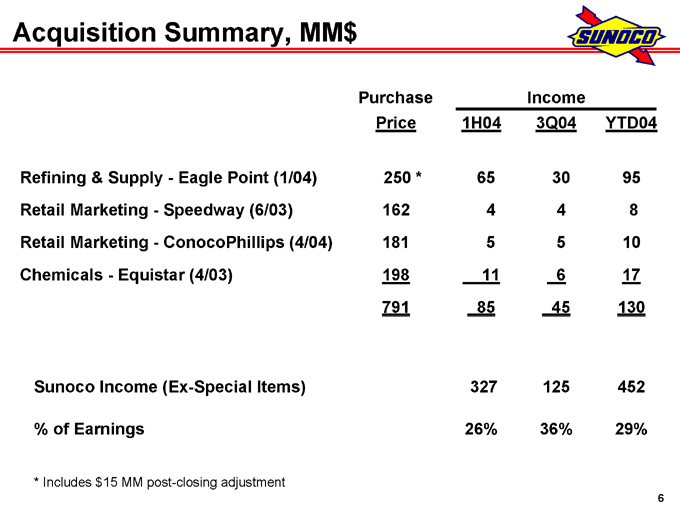
Acquisition Summary, MM$
Purchase Price Income
1H04 3Q04 YTD04
Refining & Supply—Eagle Point (1/04) 250 * 65 30 95
Retail Marketing—Speedway (6/03) 162 4 4 8
Retail Marketing—ConocoPhillips (4/04) 181 5 5 10
Chemicals—Equistar (4/03) 198 11 6 17
791 85 45 130
Sunoco Income (Ex-Special Items) 327 125 452
% of Earnings 26% 36% 29%
* Includes $15 MM post-closing adjustment
6
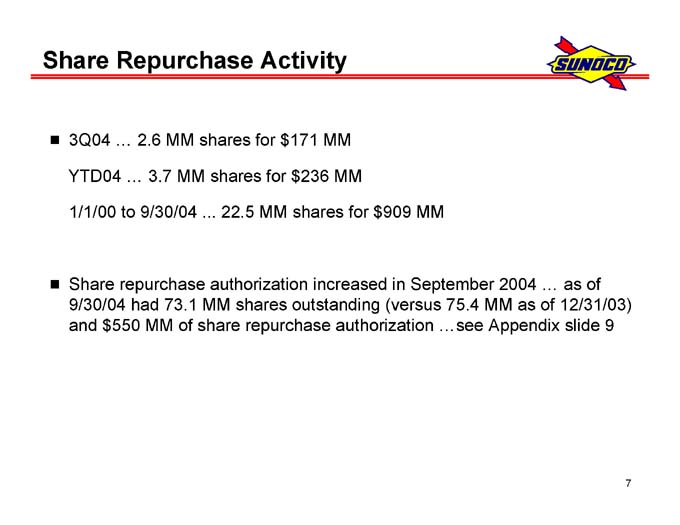
Share Repurchase Activity
3Q04 … 2.6 MM shares for $171 MM
YTD04 … 3.7 MM shares for $236 MM
1/1/00 to 9/30/04 ... 22.5 MM shares for $909 MM
Share repurchase authorization increased in September 2004 … as of 9/30/04 had 73.1 MM shares outstanding (versus 75.4 MM as of 12/31/03) and $550 MM of share repurchase authorization …see Appendix slide 97
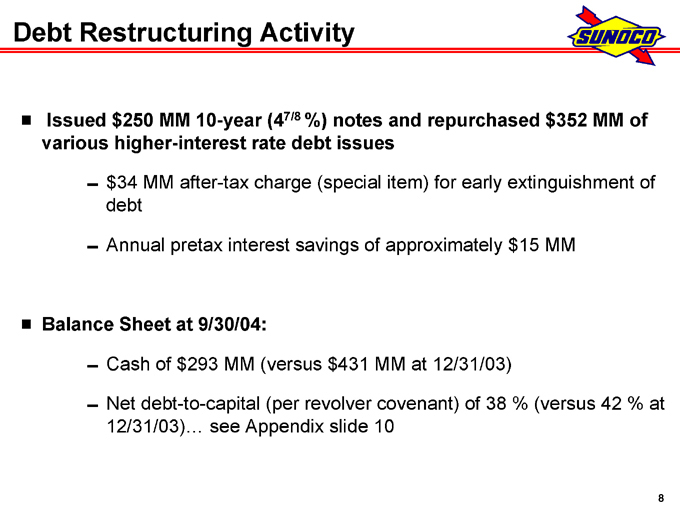
Debt Restructuring Activity
Issued $250 MM 10-year (47/8 %) notes and repurchased $352 MM of various higher-interest rate debt issues
$34 MM after-tax charge (special item) for early extinguishment of debt
Annual pretax interest savings of approximately $15 MM
Balance Sheet at 9/30/04:
Cash of $293 MM (versus $431 MM at 12/31/03)
Net debt-to-capital (per revolver covenant) of 38 % (versus 42 % at 12/31/03)… see Appendix slide 10
8
Appendix
3Q04 Earnings Conference Call October 21, 2004
A1
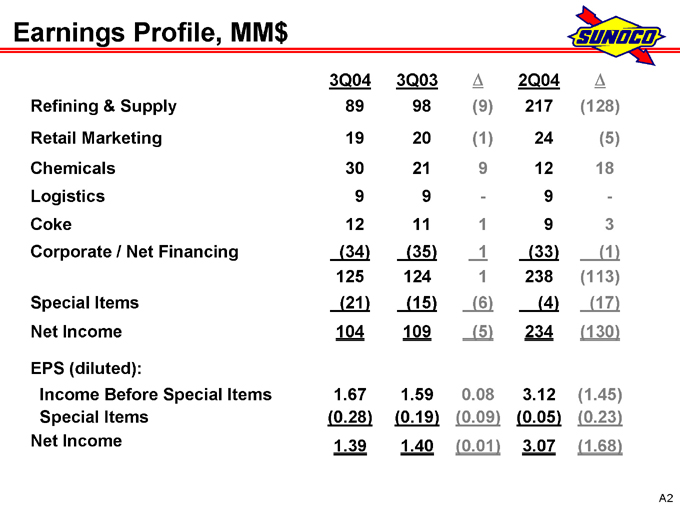
Earnings Profile, MM$
3Q04 3Q03 2Q04
Refining & Supply 89 98 (9) 217 (128)
Retail Marketing 19 20 (1) 24 (5)
Chemicals 30 21 9 12 18
Logistics 9 9 - 9 -
Coke 12 11 1 9 3
Corporate / Net Financing (34) (35) 1 (33) (1)
125 124 1 238 (113)
Special Items (21) (15) (6) (4) (17)
Net Income 104 109 (5) 234 (130)
EPS (diluted):
Income Before Special Items 1.67 1.59 0.08 3.12 (1.45)
Special Items (0.28) (0.19) (0.09) (0.05) (0.23)
Net Income 1.39 1.40 (0.01) 3.07 (1.68)
A2
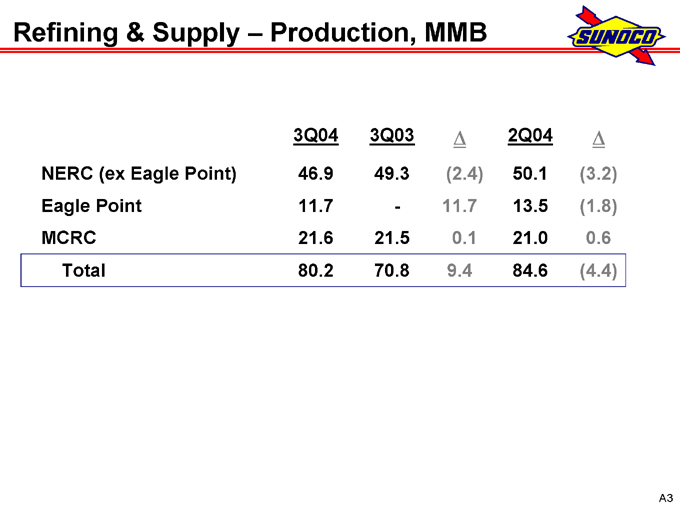
Refining & Supply – Production, MMB
3Q04 3Q03 2Q04
NERC (ex Eagle Point) 46.9 49.3 (2.4) 50.1 (3.2)
Eagle Point 11.7 - 11.7 13.5 (1.8)
MCRC 21.6 21.5 0.1 21.0 0.6
Total 80.2 70.8 9.4 84.6 (4.4)
A3
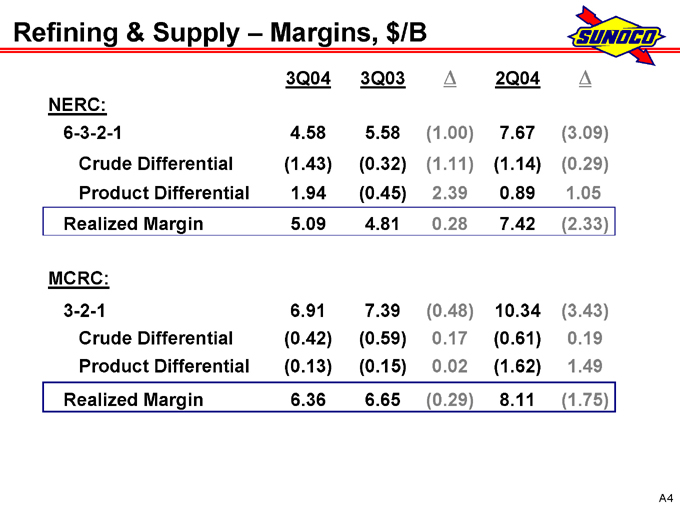
Refining & Supply – Margins, $/B
3Q04 3Q03 2Q04
NERC:
6-3-2-1 4.58 5.58 (1.00) 7.67 (3.09)
Crude Differential (1.43) (0.32) (1.11) (1.14) (0.29)
Product Differential 1.94 (0.45) 2.39 0.89 1.05
Realized Margin 5.09 4.81 0.28 7.42 (2.33)
MCRC:
3-2-1 6.91 7.39 (0.48) 10.34 (3.43)
Crude Differential (0.42) (0.59) 0.17 (0.61) 0.19
Product Differential (0.13) (0.15) 0.02 (1.62) 1.49
Realized Margin 6.36 6.65 (0.29) 8.11 (1.75)
A4
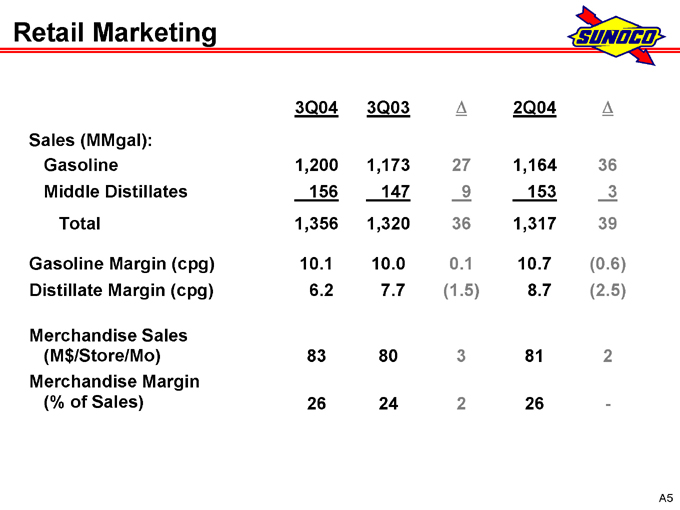
Retail Marketing
3Q04 3Q03 2Q04
Sales (MMgal):
Gasoline 1,200 1,173 27 1,164 36
Middle Distillates 156 147 9 153 3
Total 1,356 1,320 36 1,317 39
Gasoline Margin (cpg) 10.1 10.0 0.1 10.7 (0.6)
Distillate Margin (cpg) 6.2 7.7 (1.5) 8.7 (2.5)
Merchandise Sales
(M$/Store/Mo) 83 80 3 81 2
Merchandise Margin
(% of Sales) 26 24 2 26 -
A5
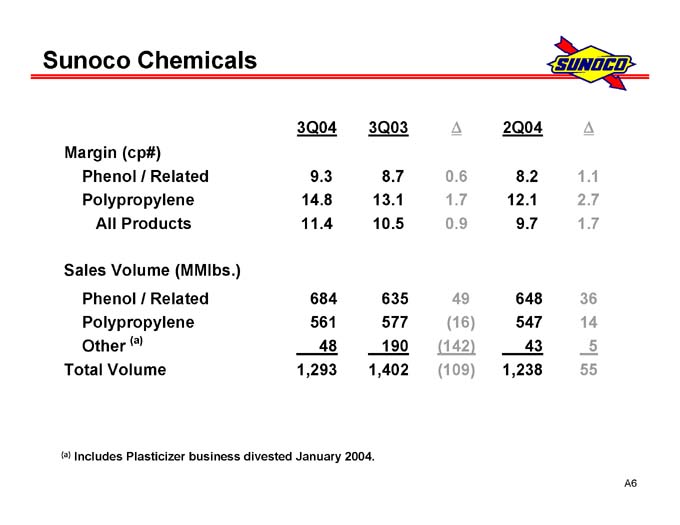
Sunoco Chemicals
3Q04 3Q03 D 2Q04 D Margin (cp#)Phenol / Related 9.3 8.7 0.6 8.2 1.1 Polypropylene14.8 13.1 1.7 12.1 2.7 All Products 11.4 10.50.9 9.7 1.7 Sales Volume (MMlbs.) Phenol / Related 684635 49 648 36 Polypropylene 561 577 (16) 54714 Other (a) 48 190 (142) 43 5 Total Volume 1,2931,402 (109) 1,238 55A6
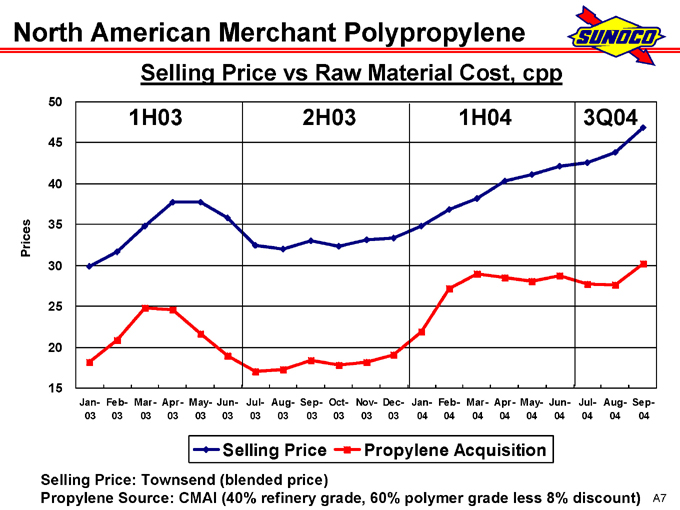
North American Merchant Polypropylene
Selling Price vs Raw Material Cost, cpp
Prices
50 45 40 35 30 25 20 15
1H03
2H03
1H04
3Q04
Jan-03
Feb-03
Mar-03
Apr 03
May-03
Jun-03
Jul-03
Aug-03
Sep-03
Oct-03
Nov-03
Dec-03
Jan-04
Feb-04
Mar-04
Apr-04
May-04
Jun-04
Jul-04
Aug-04
Sep-04
Selling Price
Propylene Acquisition
Selling Price: Townsend (blended price)
Propylene Source: CMAI (40% refinery grade, 60% polymer grade less 8% discount)
A7
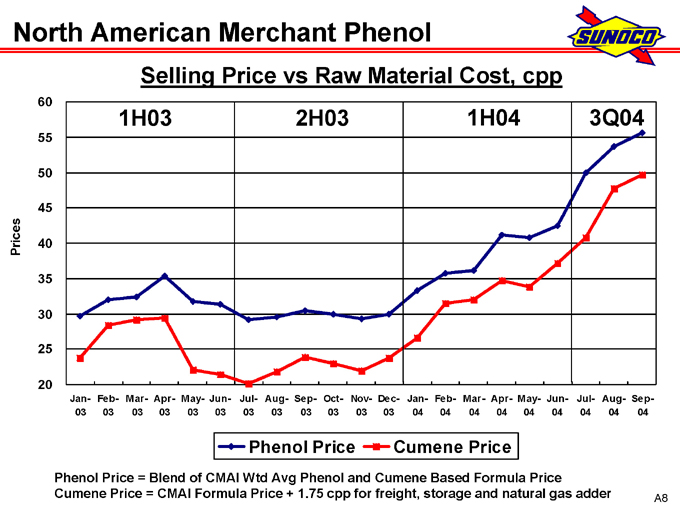
North American Merchant Phenol
Selling Price vs Raw Material Cost, cpp
Prices
60 55 50 45 40 35 30 25 20
1H03 2H03 1H04 3Q04
Jan-03 Feb-03 Mar-03 Apr-03 May-03 Jun-03 Jul-03 Aug-03 Sep-03 Oct-03 Nov-03 Dec-03
Jan-04 Feb-04 Mar-04 Apr-04 May-04 Jun-04 Jul-04 Aug-04 Sep-04
Phenol Price
Cumene Price
Phenol Price = Blend of CMAI Wtd Avg Phenol and Cumene Based Formula Price
Cumene Price = CMAI Formula Price + 1.75 cpp for freight, storage and natural gas adder A8
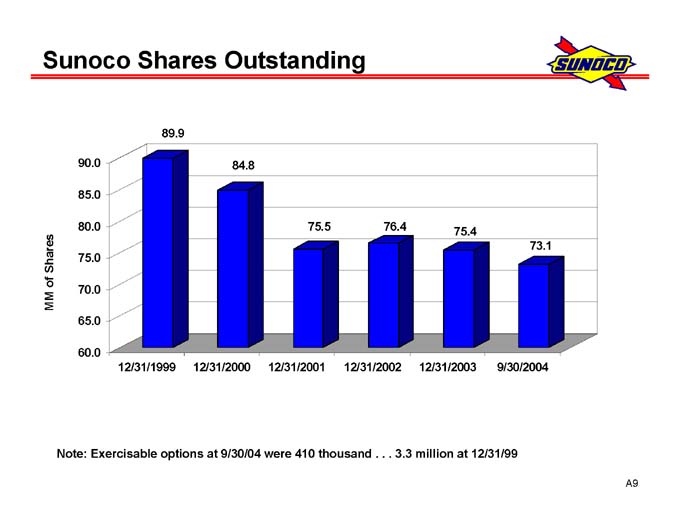
Sunoco Shares Outstanding89.990.0 84.885.080.0 75.5 76.4 75.4Shares 73.1 75.0 MM of 70.0 65.060.012/31/1999 12/31/2000 12/31/2001 12/31/2002 12/31/20039/30/2004Note: Exercisable options at 9/30/04 were 410 thousand . . . 3.3 million at12/31/99A9
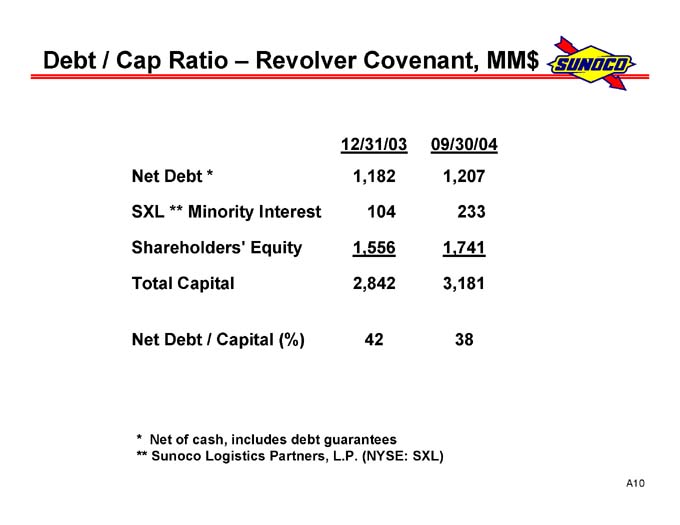
Debt / Cap Ratio – Revolver Covenant, MM$12/31/03 09/30/04 Net Debt * 1,182 1,207 SXL ** Minority Interest 104 233 Shareholders’ Equity 1,5561,741 Total Capital 2,842 3,181 Net Debt / Capital (%) 42 38 * Net of cash, includes debt guarantees ** Sunoco Logistics Partners, L.P.(NYSE: SXL)A10
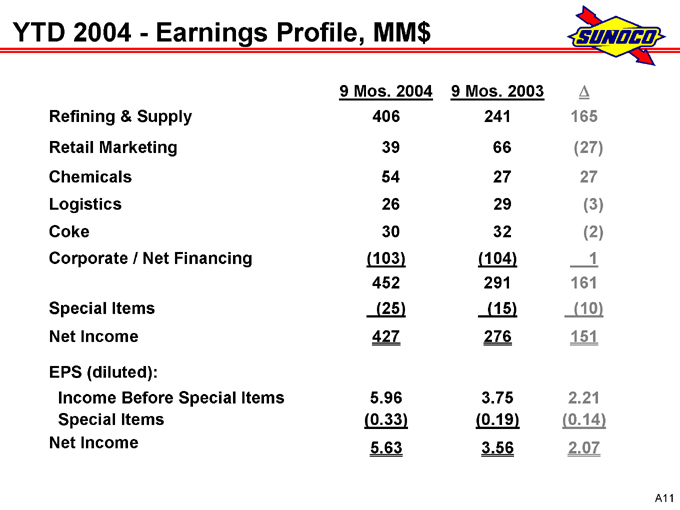
YTD 2004—Earnings Profile, MM$
9 Mos. 2004 9 Mos. 2003
Refining & Supply 406 241 165
Retail Marketing 39 66 (27)
Chemicals 54 27 27
Logistics 26 29 (3)
Coke 30 32 (2)
Corporate / Net Financing (103) (104) 1
452 291 161
Special Items (25) (15) (10)
Net Income 427 276 151
EPS (diluted):
Income Before Special Items 5.96 3.75 2.21
Special Items (0.33) (0.19) (0.14)
Net Income 5.63 3.56 2.07
A11
For More Information
Press releases and SEC filings are available on our website at www.SunocoInc.com
Contact for more information:
Terry Delaney (215) 977-6106 John Sadlowski (215) 977-6764
A12