Exhibit 99.2
4Q04 Earnings Conference Call January 20, 2005
1
Safe Harbor Statement
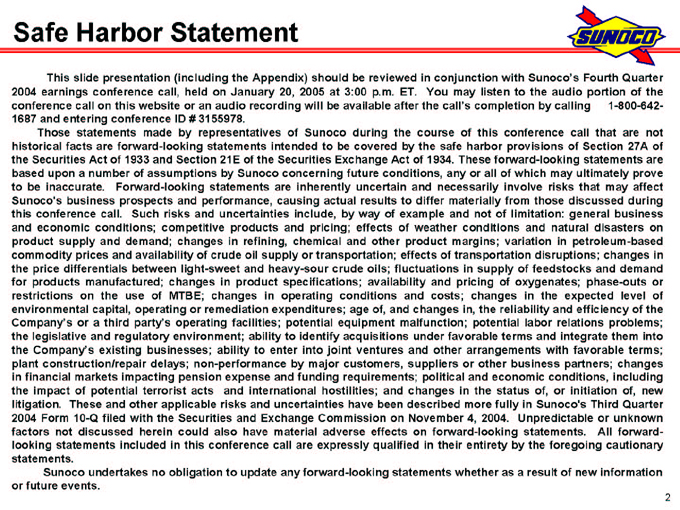
This slide presentation (including the Appendix) should be reviewed in conjunction with Sunoco’s Fourth Quarter 2004 earnings conference call, held on January 20, 2005 at 3:00 p.m. ET. You may listen to the audio portion of the conference call on this website or an audio recording will be available after the call’s completion by calling 1-800-642-1687 and entering conference ID # 3155978.
Those statements made by representatives of Sunoco during the course of this conference call that are not historical facts are forward-looking statements intended to be covered by the safe harbor provisions of Section 27A of the Securities Act of 1933 and Section 21E of the Securities Exchange Act of 1934. These forward-looking statements are based upon a number of assumptions by Sunoco concerning future conditions, any or all of which may ultimately prove to be inaccurate. Forward-looking statements are inherently uncertain and necessarily involve risks that may affect Sunoco’s business prospects and performance, causing actual results to differ materially from those discussed during this conference call. Such risks and uncertainties include, by way of example and not of limitation: general business and economic conditions; competitive products and pricing; effects of weather conditions and natural disasters on product supply and demand; changes in refining, chemical and other product margins; variation in petroleum-based commodity prices and availability of crude oil supply or transportation; effects of transportation disruptions; changes in the price differentials between light-sweet and heavy-sour crude oils; fluctuations in supply of feedstocks and demand for products manufactured; changes in product specifications; availability and pricing of oxygenates; phase-outs or restrictions on the use of MTBE; changes in operating conditions and costs; changes in the expected level of environmental capital, operating or remediation expenditures; age of, and changes in, the reliability and efficiency of the Company’s or a third party’s operating facilities; potential equipment malfunction; potential labor relations problems; the legislative and regulatory environment; ability to identify acquisitions under favorable terms and integrate them into the Company’s existing businesses; ability to enter into joint ventures and other arrangements with favorable terms; plant construction/repair delays; non-performance by major customers, suppliers or other business partners; changes in financial markets impacting pension expense and funding requirements; political and economic conditions, including the impact of potential terrorist acts and international hostilities; and changes in the status of, or initiation of, new litigation. These and other applicable risks and uncertainties have been described more fully in Sunoco’s Third Quarter 2004 Form 10-Q filed with the Securities and Exchange Commission on November 4, 2004. Unpredictable or unknown factors not discussed herein could also have material adverse effects on forward-looking statements. All forward-looking statements included in this conference call are expressly qualified in their entirety by the foregoing cautionary statements.
Sunoco undertakes no obligation to update any forward-looking statements whether as a result of new information or future events.
2
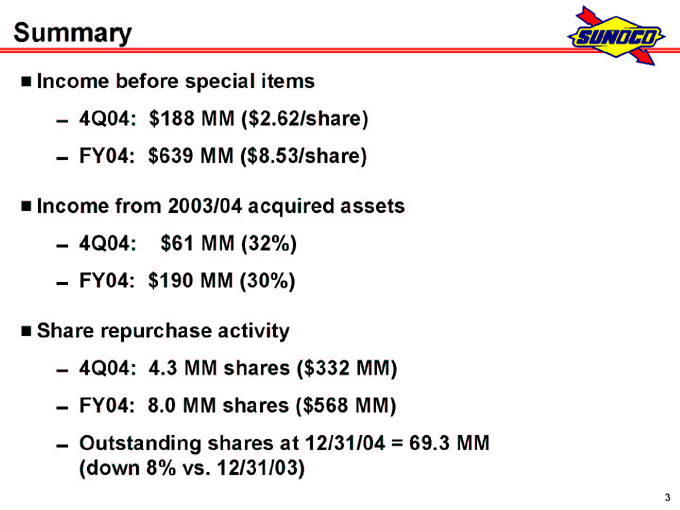
Summary
Income before special items
4Q04: $188 MM ($2.62/share)
FY04: $639 MM ($8.53/share)
Income from 2003/04 acquired assets
4Q04: $61 MM (32%)
FY04: $190 MM (30%)
Share repurchase activity
4Q04: 4.3 MM shares ($332 MM)
FY04: 8.0 MM shares ($568 MM)
Outstanding shares at 12/31/04 = 69.3 MM (down 8% vs. 12/31/03)
3
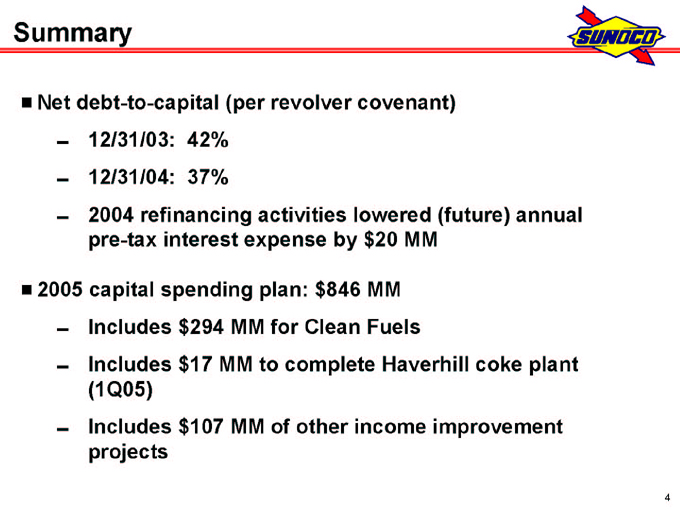
Summary
Net debt-to-capital (per revolver covenant)
12/31/03: 42%
12/31/04: 37%
2004 refinancing activities lowered (future) annual pre-tax interest expense by $20 MM
2005 capital spending plan: $846 MM
Includes $294 MM for Clean Fuels
Includes $17 MM to complete Haverhill coke plant (1Q05)
Includes $107 MM of other income improvement projects
4
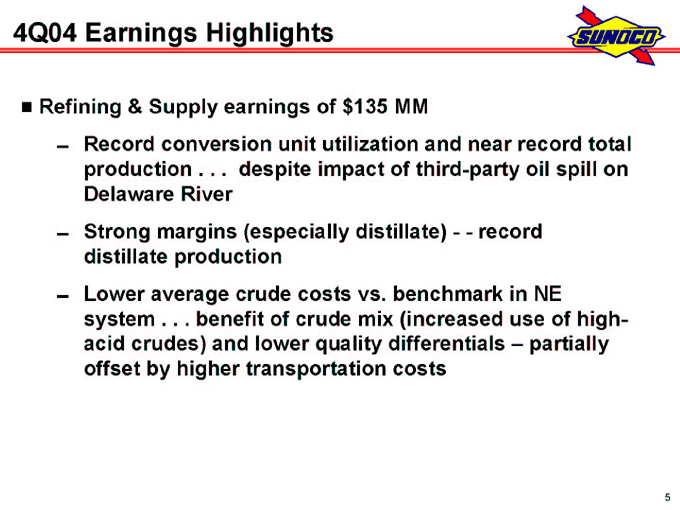
4Q04 Earnings Highlights
Refining & Supply earnings of $135 MM
Record conversion unit utilization and near record total production . . . despite impact of third-party oil spill on Delaware River
Strong margins (especially distillate)—- record distillate production
Lower average crude costs vs. benchmark in NE system . . . benefit of crude mix (increased use of high-acid crudes) and lower quality differentials – partially offset by higher transportation costs
5
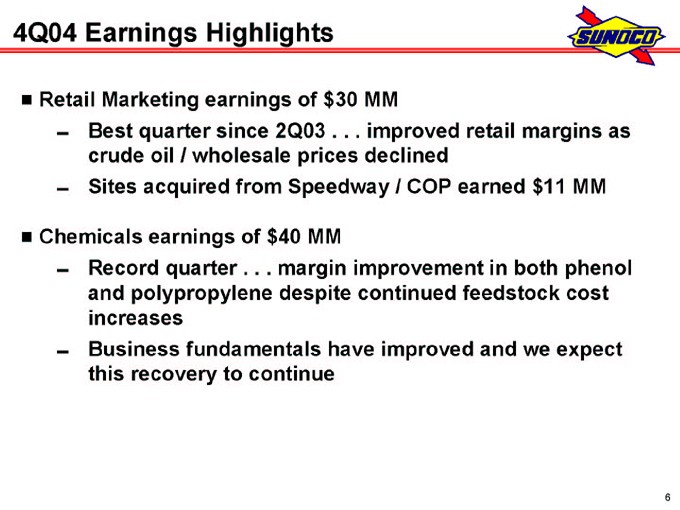
4Q04 Earnings Highlights
Retail Marketing earnings of $30 MM
Best quarter since 2Q03 . . . improved retail margins as crude oil / wholesale prices declined
Sites acquired from Speedway / COP earned $11 MM
Chemicals earnings of $40 MM
Record quarter . . . margin improvement in both phenol and polypropylene despite continued feedstock cost increases
Business fundamentals have improved and we expect this recovery to continue
6
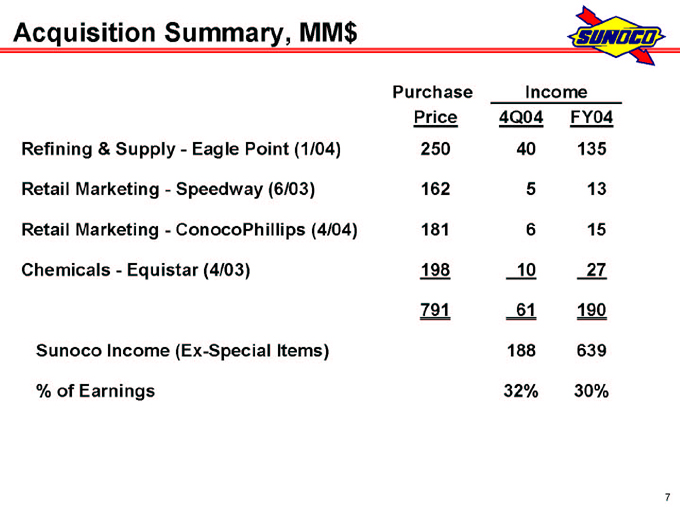
Acquisition Summary, MM$
Purchase Income
Price 4Q04 FY04
Refining & Supply—Eagle Point (1/04) 250 40 135
Retail Marketing—Speedway (6/03) 162 5 13
Retail Marketing—ConocoPhillips (4/04) 181 6 15
Chemicals—Equistar (4/03) 198 10 27
791 61 190
Sunoco Income (Ex-Special Items) 188 639
% of Earnings 32% 30%
7
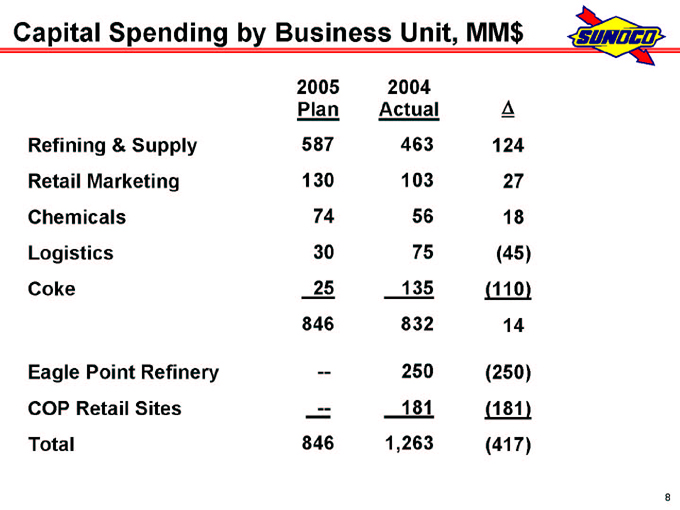
Capital Spending by Business Unit, MM$
2005 2004
Plan Actual D
Refining & Supply 587 463 124
Retail Marketing 130 103 27
Chemicals 74 56 18
Logistics 30 75 (45)
Coke 25 135 (110)
846 832 14
Eagle Point Refinery — 250 (250)
COP Retail Sites — 181 (181)
Total 846 1,263 (417)
8
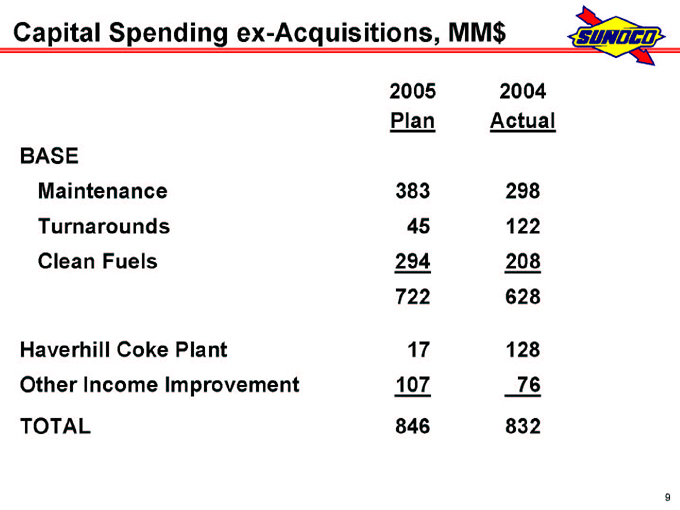
Capital Spending ex-Acquisitions, MM$
2005 2004
Plan Actual
BASE
Maintenance 383 298
Turnarounds 45 122
Clean Fuels 294 208
722 628
Haverhill Coke Plant 17 128
Other Income Improvement 107 76
TOTAL 846 832
9
Appendix
4Q04 Earnings Conference Call January 20, 2005
A1
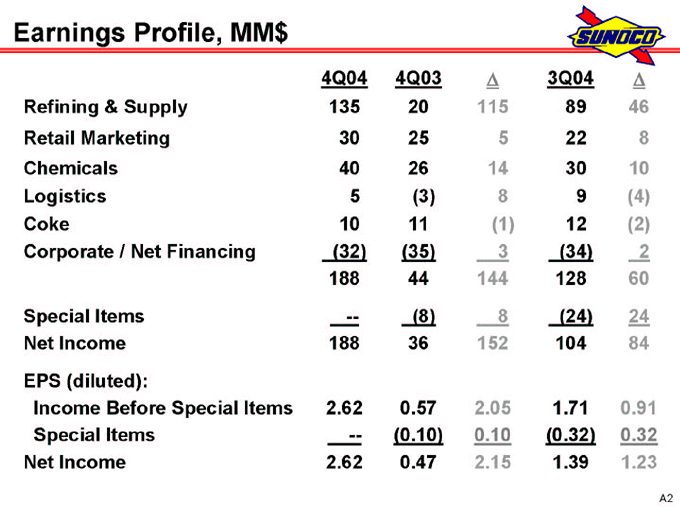
Earnings Profile, MM$
4Q04 4Q03 D 3Q04 D
Refining & Supply 135 20 115 89 46
Retail Marketing 30 25 5 22 8
Chemicals 40 26 14 30 10
Logistics 5 (3) 8 9 (4)
Coke 10 11 (1) 12 (2)
Corporate / Net Financing (32) (35) 3 (34) 2
188 44 144 128 60
Special Items — (8) 8 (24) 24
Net Income 188 36 152 104 84
EPS (diluted):
Income Before Special Items 2.62 0.57 2.05 1.71 0.91
Special Items — (0.10) 0.10 (0.32) 0.32
Net Income 2.62 0.47 2.15 1.39 1.23
A2
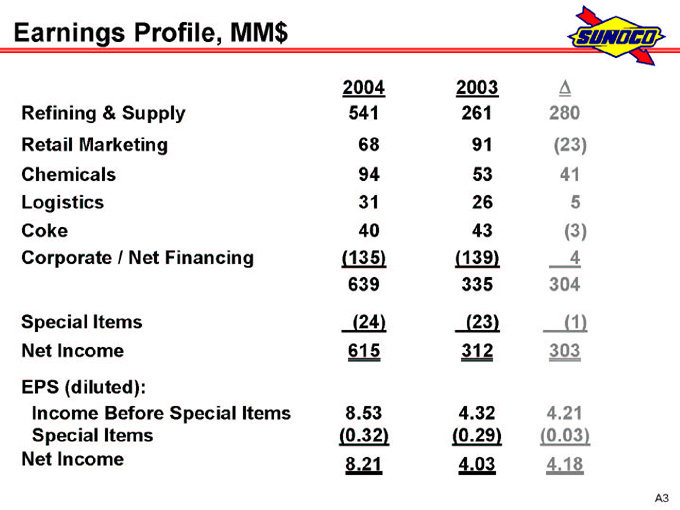
Earnings Profile, MM$
2004 2003 D
Refining & Supply 541 261 280
Retail Marketing 68 91 (23)
Chemicals 94 53 41
Logistics 31 26 5
Coke 40 43 (3)
Corporate / Net Financing (135) (139) 4
639 335 304
Special Items (24) (23) (1)
Net Income 615 312 303
EPS (diluted):
Income Before Special Items 8.53 4.32 4.21
Special Items (0.32) (0.29) (0.03)
Net Income 8.21 4.03 4.18
A3
FY04 Highlights
Refining & Supply’s earnings of $541 MM
Strong margins throughout the year . . . gasoline, distillate and petrochemicals
Eagle Point contribution of $135 MM
Excluding Eagle Point, increased production by 4 MM bbls. over 2003
Significant marine transportation savings vs. spot market (40% time charter coverage)
A4
FY04 Highlights
Retail Marketing earnings of $68 MM
$52 MM in 2H04 when crude oil / wholesale gasoline prices moderated
COP sites acquired late April 2004 earned $15 MM
Proceeds of $100 MM from sale of credit card business and $92 MM from Retail Portfolio Management (RPM) site divestments
Chemicals earnings of $94 MM
Business conditions have been steadily improving . . . seven consecutive year-on-year quarterly increases
2H04 earnings of $70 MM
Strong 2004 demand growth for polypropylene and phenol . . . industry utilization rates at 95 %+ for both products
A5
FY04 Highlights
Logistics earnings of $31 MM (vs. $26 MM in FY03)
Lower environmental/insurance charges partially offset by reduced ownership interest (75.2 % to 62.6 % in April 2004)
$65 MM of acquisitions/growth capital in 2004
SXL unit value increased 17 % in 2004 . . . Sunoco owns 15.3 MM units and is the General Partner
Coke earnings of $40 MM (vs. $43 MM in FY03)
Lower tax benefits from cokemaking operations
New 550,000 ton plant in Haverhill, Ohio expected to start production by end of 1Q05 . . . steam to Sunoco Chemicals Haverhill phenol plant
Total expected annual income to Coke / Chemicals of approximately $15 MM after-tax
A6
FY04 Highlights
Corporate expenses (after-tax) of $57 MM in 2004 (vs. $40 MM in FY03)
Higher incentive and stock compensation expense and cost of Sarbanes-Oxley compliance
Net financing expenses (after-tax) of $78 MM in 2004 (vs. $99 MM in FY03)
Lower average borrowings and rate, reduced preferential return expenses related to Sun Coke partnerships and higher capitalized interest
Refinanced over $500 MM of debt in 2004 with annual interest savings for 2005 of approximately $20 MM pre-tax
A7
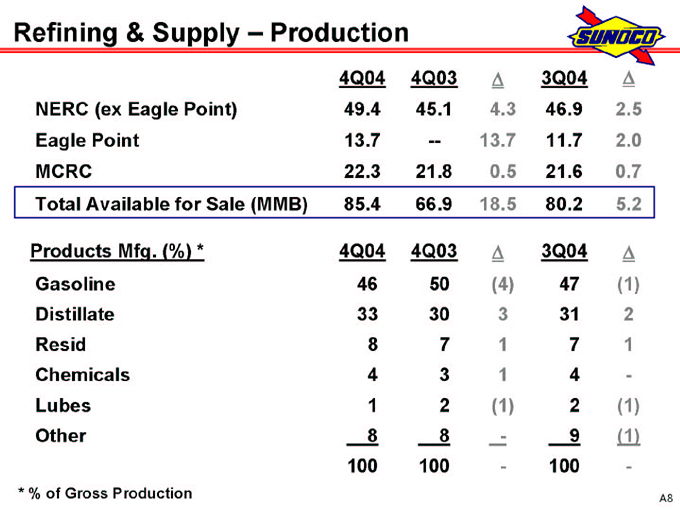
Refining & Supply – Production
4Q04 4Q03 D 3Q04 D
NERC (ex Eagle Point) 49.4 45.1 4.3 46.9 2.5
Eagle Point 13.7 — 13.7 11.7 2.0
MCRC 22.3 21.8 0.5 21.6 0.7
Total Available for Sale (MMB) 85.4 66.9 18.5 80.2 5.2
Products Mfg. (%) * 4Q04 4Q03 D 3Q04 D
Gasoline 46 50 (4) 47 (1)
Distillate 33 30 3 31 2
Resid 8 7 1 7 1
Chemicals 4 3 1 4 -
Lubes 1 2 (1) 2 (1)
Other 8 8 - 9 (1)
100 100 - 100 -
* % of Gross Production
A8
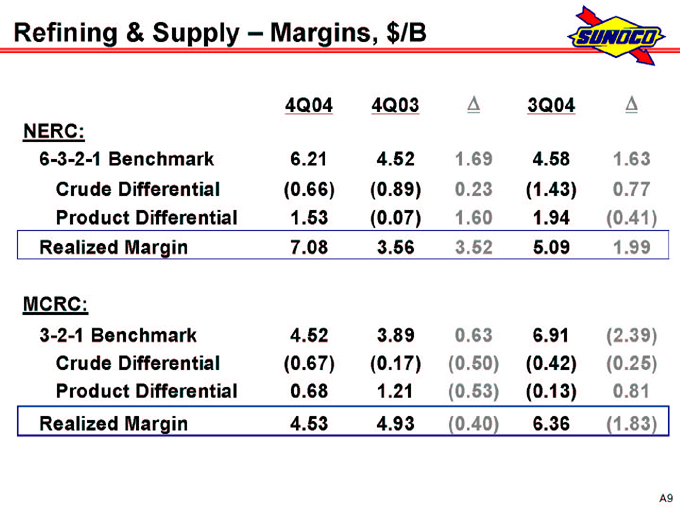
Refining & Supply – Margins, $/B
4Q04 4Q03 D 3Q04 D
NERC:
6-3-2-1 Benchmark 6.21 4.52 1.69 4.58 1.63
Crude Differential (0.66) (0.89) 0.23 (1.43) 0.77
Product Differential 1.53 (0.07) 1.60 1.94 (0.41)
Realized Margin 7.08 3.56 3.52 5.09 1.99
MCRC:
3-2-1 Benchmark 4.52 3.89 0.63 6.91 (2.39)
Crude Differential (0.67) (0.17) (0.50) (0.42) (0.25)
Product Differential 0.68 1.21 (0.53) (0.13) 0.81
Realized Margin 4.53 4.93 (0.40) 6.36 (1.83)
A9
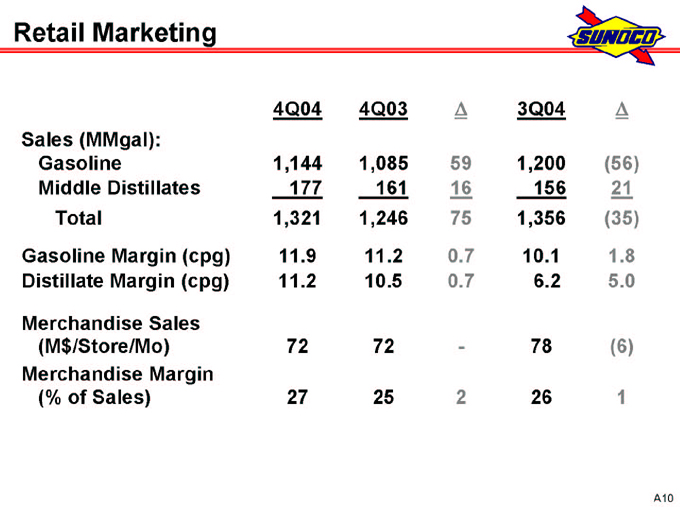
Retail Marketing
4Q04 4Q03 D 3Q04 D
Sales (MMgal):
Gasoline 1,144 1,085 59 1,200 (56)
Middle Distillates 177 161 16 156 21
Total 1,321 1,246 75 1,356 (35)
Gasoline Margin (cpg) 11.9 11.2 0.7 10.1 1.8
Distillate Margin (cpg) 11.2 10.5 0.7 6.2 5.0
Merchandise Sales
(M$/Store/Mo) 72 72 - 78 (6)
Merchandise Margin
(% of Sales) 27 25 2 26 1
A10
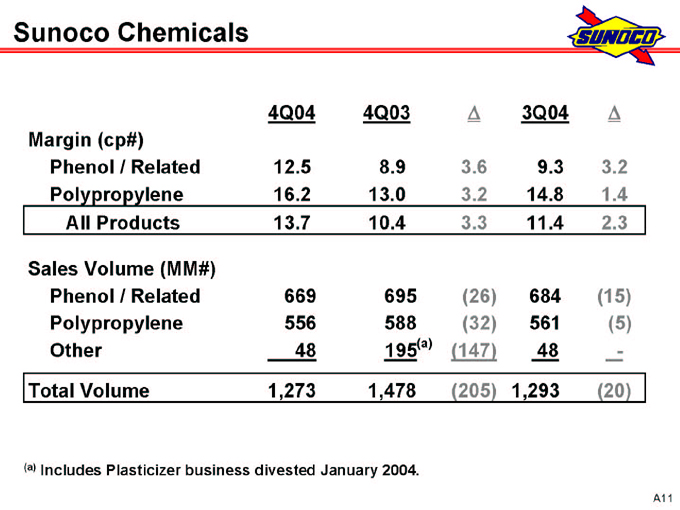
Sunoco Chemicals
4Q04 4Q03 D 3Q04 D
Margin (cp#)
Phenol / Related 12.5 8.9 3.6 9.3 3.2
Polypropylene 16.2 13.0 3.2 14.8 1.4
All Products 13.7 10.4 3.3 11.4 2.3
Sales Volume (MM#)
Phenol / Related 669 695 (26) 684 (15)
Polypropylene 556 588 (32) 561 (5)
Other 48 195(a) (147) 48 -
Total Volume 1,273 1,478 (205) 1,293 (20)
(a) Includes Plasticizer business divested January 2004.
A11
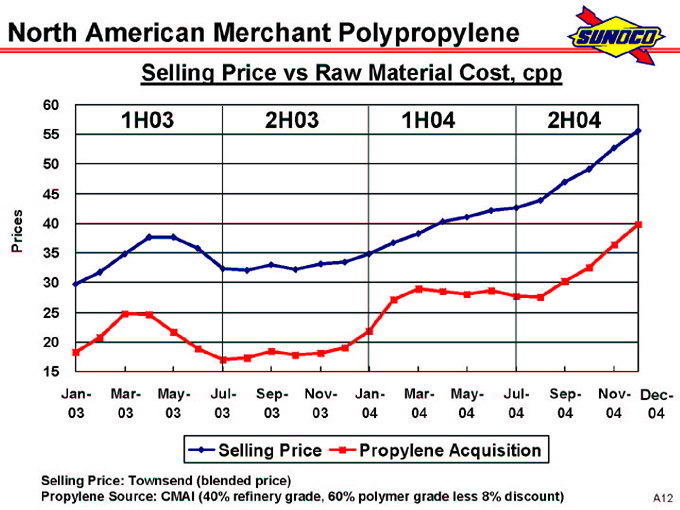
North American Merchant Polypropylene
Selling Price vs Raw Material Cost, cpp
60 55 50
45 Prices 40 35 30
25 20 15
1H03
2H03
1H04
2H04
Jan- Mar- May- Jul- Sep- Nov- Jan- Mar- May- Jul- Sep- Nov- Dec-
03 03 03 03 03 03 04 04 04 04 04 04 04
Selling Price
Propylene Acquisition
Selling Price: Townsend (blended price)
Propylene Source: CMAI (40% refinery grade, 60% polymer grade less 8% discount)
A12
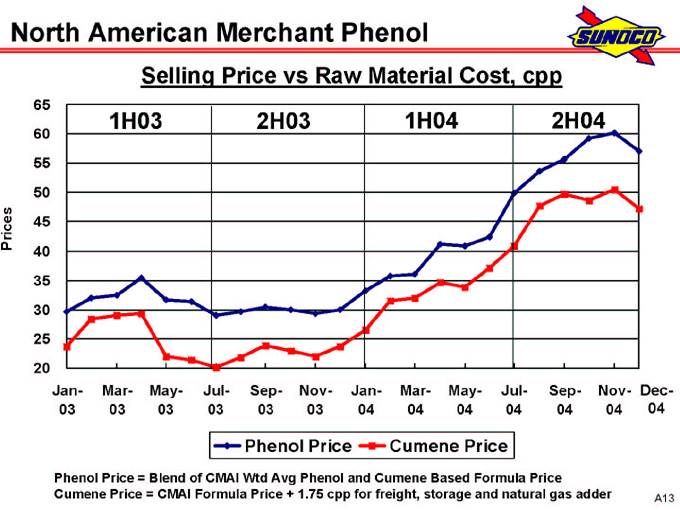
North American Merchant Phenol
Selling Price vs Raw Material Cost, cpp
65 60 55 50 Prices 45 40 35 30 25 20
1H03
2H03
1H04
2H04
Jan- Mar- May- Jul- Sep- Nov- Jan- Mar- May- Jul- Sep- Nov- Dec-
03 03 03 03 03 03 04 04 04 04 04 04 04
Phenol Price
Cumene Price
Phenol Price = Blend of CMAI Wtd Avg Phenol and Cumene Based Formula Price
Cumene Price = CMAI Formula Price + 1.75 cpp for freight, storage and natural gas adder
A13
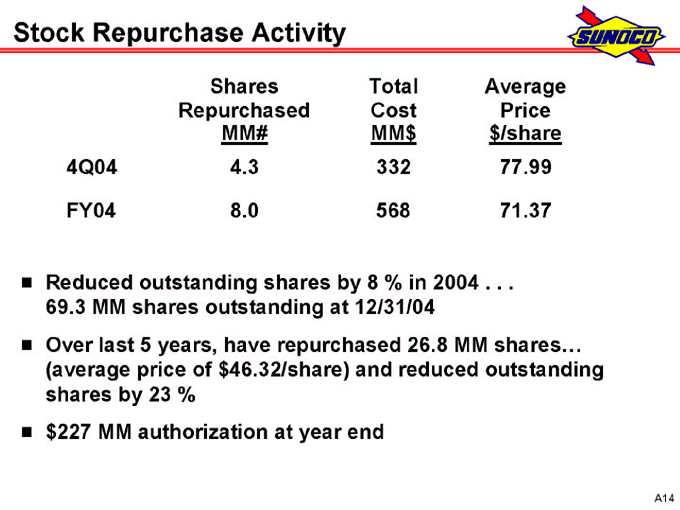
Stock Repurchase Activity
Shares Total Average
Repurchased Cost Price
MM# MM$ $/share
4Q04 4.3 332 77.99
FY04 8.0 568 71.37
Reduced outstanding shares by 8 % in 2004 . . . 69.3 MM shares outstanding at 12/31/04 Over last 5 years, have repurchased 26.8 MM shares… (average price of $46.32/share) and reduced outstanding shares by 23 % $227 MM authorization at year end
A14
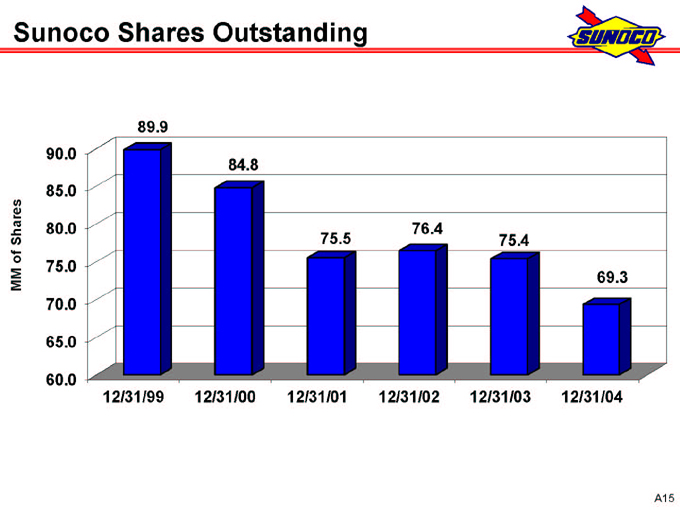
Sunoco Shares Outstanding
90.0
85.0
80.0
MM of Shares 75.0
70.0 65.0 60.0
89.9
84.8
75.5
76.4
75.4
69.3
12/31/99 12/31/00 12/31/01 12/31/02 12/31/03 12/31/04
A15
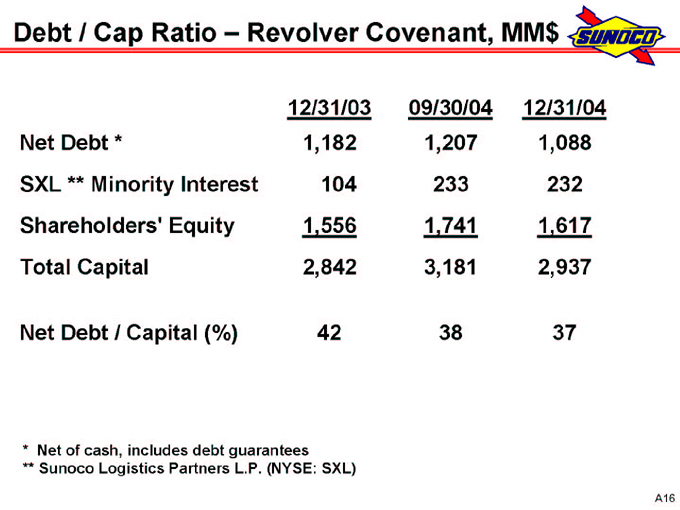
Debt / Cap Ratio – Revolver Covenant, MM$
12/31/03 09/30/04 12/31/04
Net Debt * 1,182 1,207 1,088
SXL ** Minority Interest 104 233 232
Shareholders’ Equity 1,556 1,741 1,617
Total Capital 2,842 3,181 2,937
Net Debt / Capital (%) 42 38 37
* Net of cash, includes debt guarantees ** Sunoco Logistics Partners L.P. (NYSE: SXL)
A16
For More Information
Press releases and SEC filings are available on our website at www.SunocoInc.com
Contact for more information:
Terry Delaney (215) 977-6106 John Sadlowski (215) 977-6764
A17