Exhibit 99.1
Credit Suisse First Boston Energy Summit
TW Hofmann, SVP - CFO
February 4, 2005
Safe Harbor Statement
Those statements made by representatives of Sunoco during the course of this presentation that are not historical facts are forward-looking statements intended to be covered by the safe harbor provisions of Section 27A of the Securities Act of 1933 and Section 21E of the Securities Exchange Act of 1934. These forward-looking statements are based upon a number of assumptions by Sunoco concerning future conditions, any or all of which may ultimately prove to be inaccurate. Forward-looking statements are inherently uncertain and necessarily involve risks that may affect Sunoco’s business prospects and performance, causing actual results to differ materially from those discussed during this presentation. Such risks and uncertainties include, by way of example and not of limitation: failure to achieve the results contemplated by 2005 cash flow model contained in this presentation; general business and economic conditions; competitive products and pricing; effects of weather conditions and natural disasters on product supply and demand; changes in refining, chemical and other product margins; variation in petroleum-based commodity prices and availability of crude oil supply or transportation; effects of transportation disruptions; changes in the price differentials between light-sweet and heavy-sour crude oils; fluctuations in supply of feedstocks and demand for products manufactured; changes in product specifications; availability and pricing of oxygenates; phase-outs or restrictions on the use of MTBE; changes in operating conditions and costs; changes in the expected level of environmental capital, operating or remediation expenditures; age of, and changes in, the reliability and efficiency of the Company’s or a third party’s operating facilities; potential equipment malfunction; potential labor relations problems; the legislative and regulatory environment; ability to identify acquisitions under favorable terms and integrate them into the Company’s existing businesses; ability to enter into joint ventures and other arrangements with favorable terms; plant construction/repair delays; non-performance by major customers, suppliers or other business partners; changes in financial markets impacting pension expense and funding requirements; political and economic conditions, including the impact of potential terrorist acts and international hostilities; and changes in the status of, or initiation of new, litigation. These and other applicable risks and uncertainties have been described more fully in Sunoco’s Third Quarter 2004 Form 10-Q filed with the Securities and Exchange Commission on November 4, 2004. Unpredictable or unknown factors not discussed herein could also have material adverse effects on forward-looking statements. All forward-looking statements included in this presentation are expressly qualified in their entirety by the foregoing cautionary statements.
Sunoco undertakes no obligation to update any forward-looking statements whether as a result of new information or future events.
2
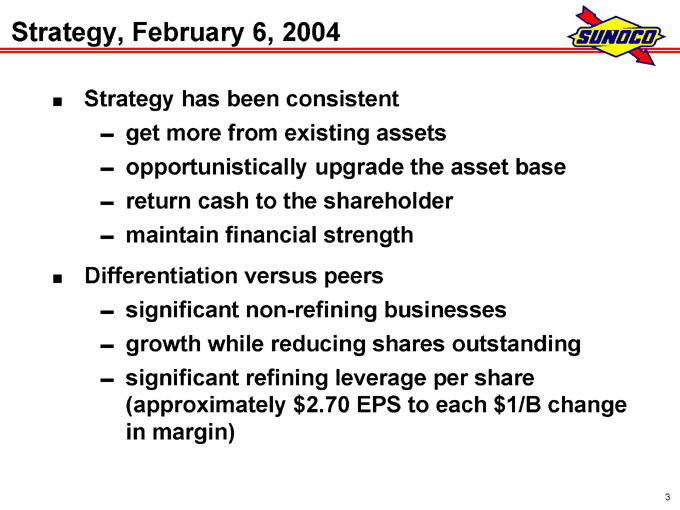
Strategy, February 6, 2004
Strategy has been consistent get more from existing assets opportunistically upgrade the asset base return cash to the shareholder maintain financial strength
Differentiation versus peers significant non-refining businesses growth while reducing shares outstanding significant refining leverage per share (approximately $2.70 EPS to each $1/B change in margin)
3
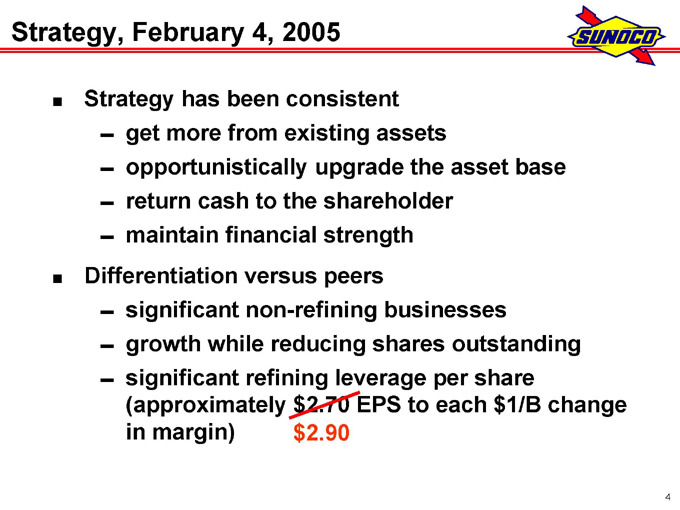
Strategy, February 4, 2005
Strategy has been consistent get more from existing assets opportunistically upgrade the asset base return cash to the shareholder maintain financial strength
Differentiation versus peers significant non-refining businesses growth while reducing shares outstanding significant refining leverage per share (approximately $2.90 EPS to each $1/B change in margin) $2.70
4
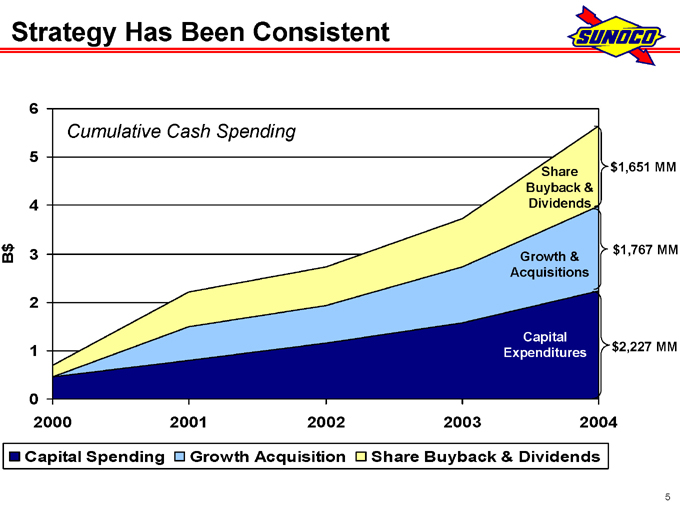
Strategy Has Been Consistent
B$
6 5 4 3 2 1 0
2000 2001 2002 2003 2004
Cumulative Cash Spending
Share Buyback & Dividends
Growth & Acquisitions
Capital Expenditures $1,651 MM $1,767 MM $2,227 MM
Capital Spending
Growth Acquisition
Share Buyback & Dividends
5
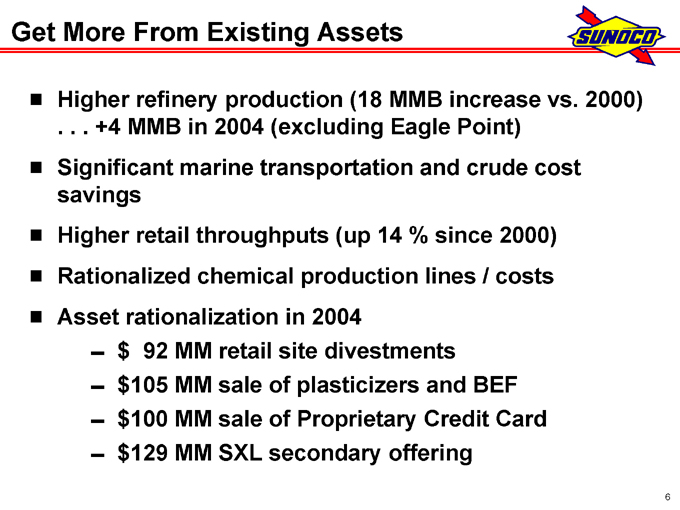
Get More From Existing Assets
Higher refinery production (18 MMB increase vs. 2000) . . . +4 MMB in 2004 (excluding Eagle Point) Significant marine transportation and crude cost savings Higher retail throughputs (up 14 % since 2000) Rationalized chemical production lines / costs Asset rationalization in 2004 $92 MM retail site divestments $105 MM sale of plasticizers and BEF $100 MM sale of Proprietary Credit Card $129 MM SXL secondary offering
6
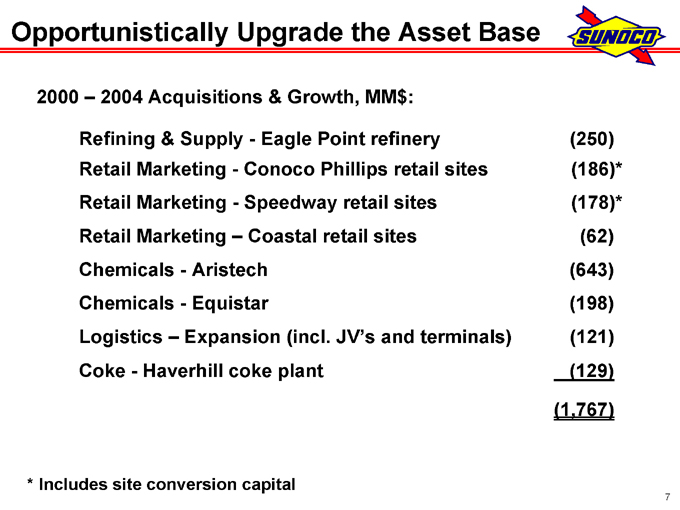
Opportunistically Upgrade the Asset Base
2000 – 2004 Acquisitions & Growth, MM$:
Refining & Supply - Eagle Point refinery (250)
Retail Marketing - Conoco Phillips retail sites (186)*
Retail Marketing - Speedway retail sites (178)*
Retail Marketing – Coastal retail sites (62)
Chemicals - Aristech (643)
Chemicals - Equistar (198)
Logistics – Expansion (incl. JV’s and terminals) (121)
Coke - Haverhill coke plant (129)
(1,767)
* Includes site conversion capital
7
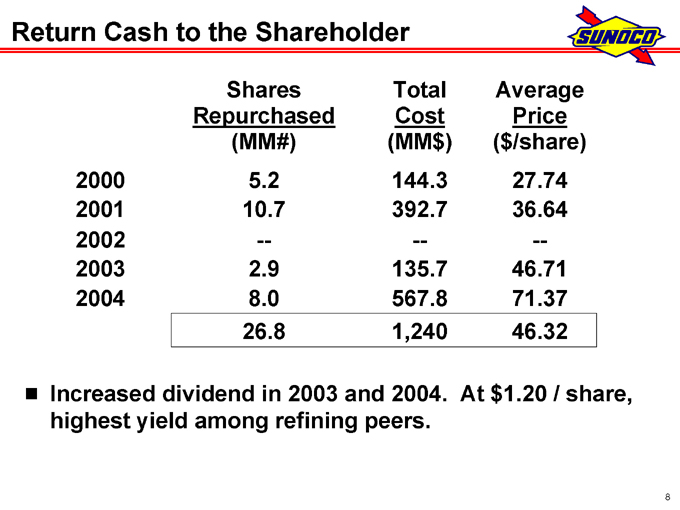
Return Cash to the Shareholder
Shares Total Average
Repurchased Cost Price
(MM#) (MM$) ($/share)
2000 5.2 144.3 27.74
2001 10.7 392.7 36.64
2002 — — —
2003 2.9 135.7 46.71
2004 8.0 567.8 71.37
26.8 1,240 46.32
Increased dividend in 2003 and 2004. At $1.20 / share, highest yield among refining peers.
8
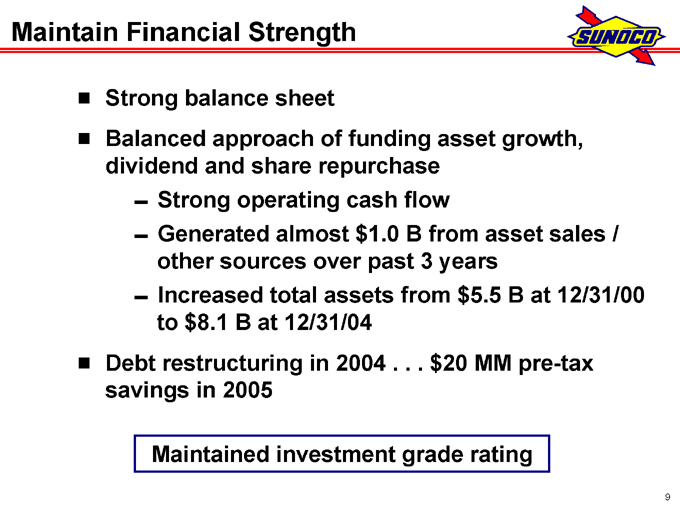
Maintain Financial Strength
Strong balance sheet
Balanced approach of funding asset growth, dividend and share repurchase
Strong operating cash flow
Generated almost $1.0 B from asset sales / other sources over past 3 years Increased total assets from $5.5 B at 12/31/00 to $8.1 B at 12/31/04
Debt restructuring in 2004 . . . $20 MM pre-tax savings in 2005
Maintained investment grade rating
9
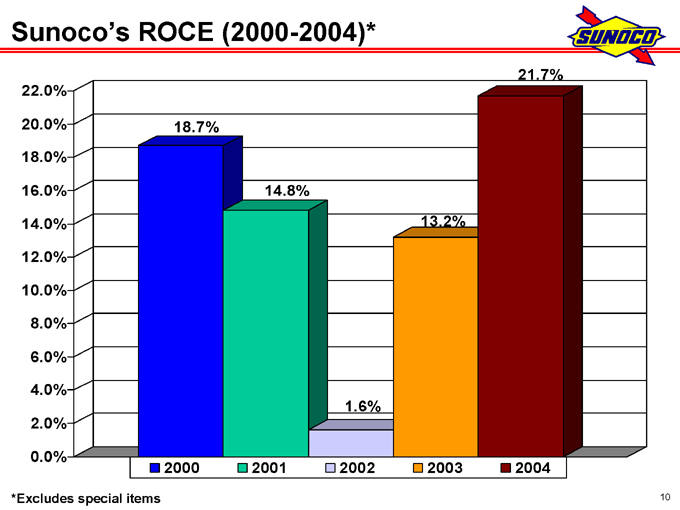
Sunoco’s ROCE (2000-2004)*
22.0% 20.0% 18.0% 16.0% 14.0% 12.0% 10.0% 8.0% 6.0% 4.0% 2.0% 0.0%
18.7%
14.8%
1.6%
13.2%
21.7%
2000
2001
2002
2003
2004
*Excludes special items
10
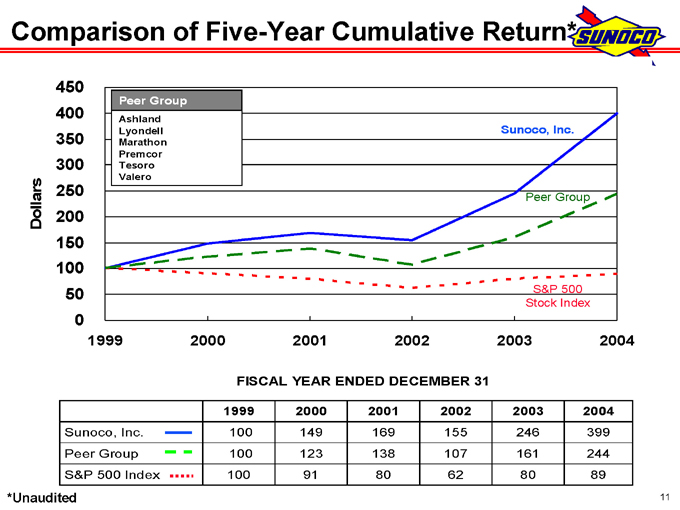
Comparison of Five-Year Cumulative Return*
450 400 350 300 250
Dollars 200
150 100 50 0
1999 2000 2001 2002 2003 2004
Peer Group
Ashland Lyondell Marathon Premcor Tesoro Valero
Sunoco, Inc.
Peer Group
S&P 500 Stock Index
FISCAL YEAR ENDED DECEMBER 31
1999 2000 2001 2002 2003 2004
Sunoco, Inc. 100 149 169 155 246 399
Peer Group 100 123 138 107 161 244
S&P 500 Index 100 91 80 62 80 89
*Unaudited
11
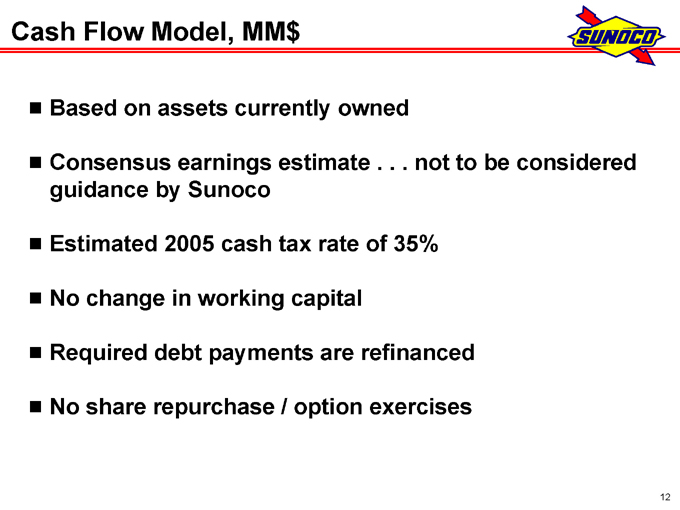
Cash Flow Model, MM$
Based on assets currently owned
Consensus earnings estimate . . . not to be considered guidance by Sunoco
Estimated 2005 cash tax rate of 35% No change in working capital Required debt payments are refinanced No share repurchase / option exercises
12
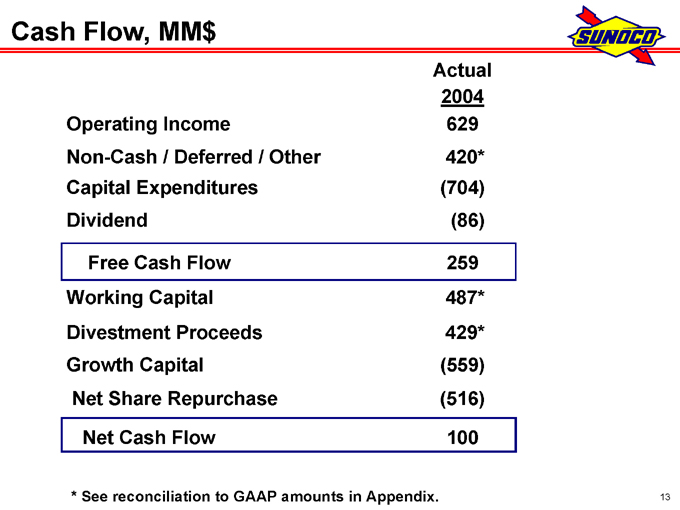
Cash Flow, MM$
Actual
2004
Operating Income 629
Non-Cash / Deferred / Other 420*
Capital Expenditures (704)
Dividend (86)
Free Cash Flow 259
Working Capital 487*
Divestment Proceeds 429*
Growth Capital (559)
Net Share Repurchase (516)
Net Cash Flow 100
* See reconciliation to GAAP amounts in Appendix.
13
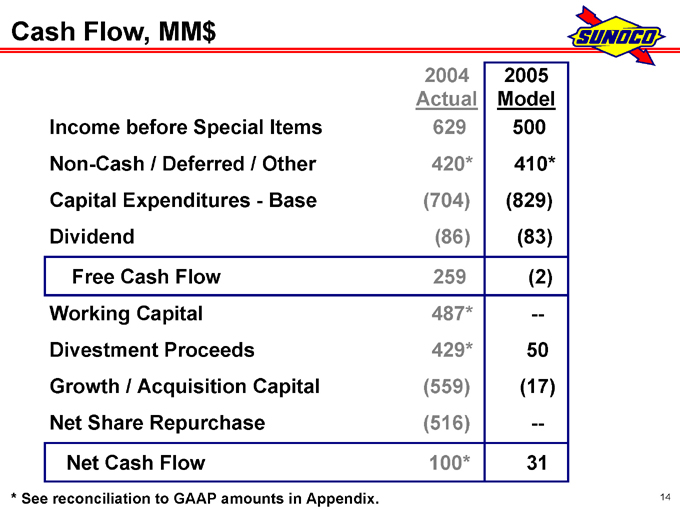
Cash Flow, MM$
2004 2005
Actual Model
Income before Special Items 629 500
Non-Cash / Deferred / Other 420* 410*
Capital Expenditures—Base (704) (829)
Dividend (86) (83)
Free Cash Flow 259 (2)
Working Capital 487* —
Divestment Proceeds 429* 50
Growth / Acquisition Capital (559) (17)
Net Share Repurchase (516) —
Net Cash Flow 100* 31
* See reconciliation to GAAP amounts in Appendix.
14
Outlook
Refining supply / demand tightening and increasing complexity to manufacture and distribute
Chemicals fundamentals improved… industry utilization rates, prices, and margins have increased
2003 / 04 transactions significantly increase earnings power
2005 improvements: Haverhill coke plant (1Q05), full-year Conoco Phillips retail, lower net financing expenses and 8% fewer shares
15
Outlook
Refining supply / demand tightening and increasing complexity to manufacture and distribute
Chemicals fundamentals improved… industry utilization rates, prices, and margins have increased
2003 / 04 transactions significantly increase earnings power
2005 improvements: Haverhill coke plant (1Q05), full-year Conoco Phillips retail, lower net financing expenses and 8% fewer shares
Strategy will remain consistent
16
For More Information
Press releases and SEC filings are available on our website at www.SunocoInc.com
Contact for more information:
Terry Delaney (215) 977-6106 John Sadlowski (215) 977-6764
17
Appendix
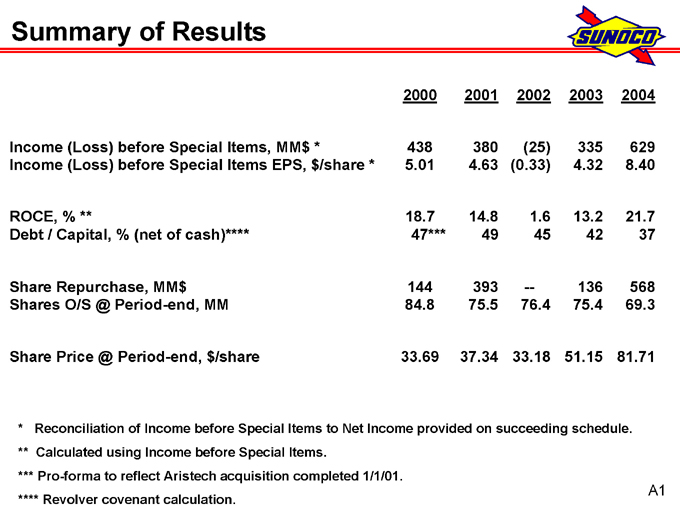
Summary of Results
2000 2001 2002 2003 2004
Income (Loss) before Special Items, MM$* 438 380 (25) 335 629
Income (Loss) before Special Items EPS, $/share * 5.01 4.63 (0.33) 4.32 8.40
ROCE, % ** 18.7 14.8 1.6 13.2 21.7
Debt / Capital, % (net of cash)**** 47*** 49 45 42 37
Share Repurchase, MM$ 144 393 — 136 568
Shares O/S @ Period-end, MM 84.8 75.5 76.4 75.4 69.3
Share Price @ Period-end, $/share 33.69 37.34 33.18 51.15 81.71
* Reconciliation of Income before Special Items to Net Income provided on succeeding schedule.
** Calculated using Income before Special Items.
*** Pro-forma to reflect Aristech acquisition completed 1/1/01. **** Revolver covenant calculation.
A1
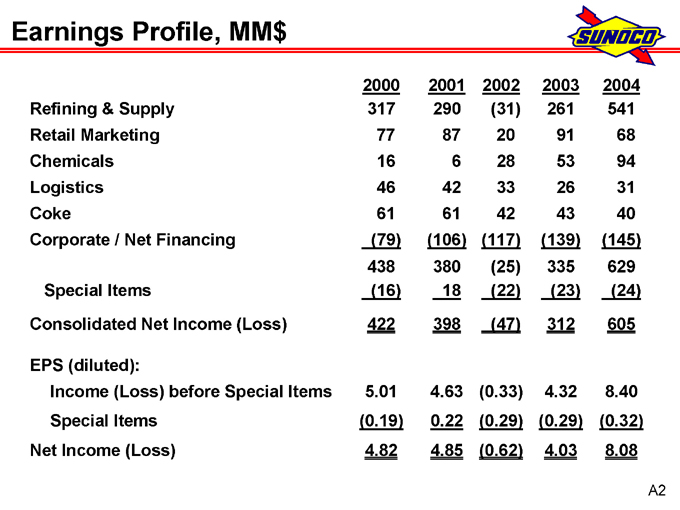
Earnings Profile, MM$
2000 2001 2002 2003 2004
Refining & Supply 317 290 (31) 261 541
Retail Marketing 77 87 20 91 68
Chemicals 16 6 28 53 94
Logistics 46 42 33 26 31
Coke 61 61 42 43 40
Corporate / Net Financing (79) (106) (117) (139) (145)
438 380 (25) 335 629
Special Items (16) 18 (22) (23) (24)
Consolidated Net Income (Loss) 422 398 (47) 312 605
EPS (diluted):
Income (Loss) before Special Items 5.01 4.63 (0.33) 4.32 8.40
Special Items (0.19) 0.22 (0.29) (0.29) (0.32)
Net Income (Loss) 4.82 4.85 (0.62) 4.03 8.08
A2
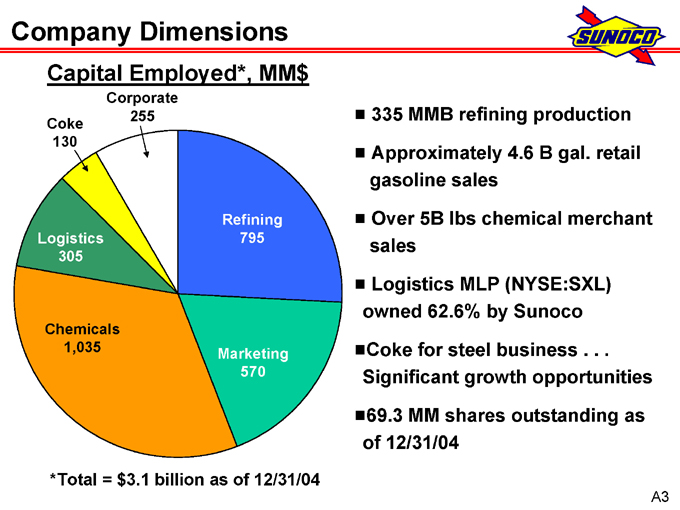
Company Dimensions
Capital Employed*, MM$
Coke 130
Corporate 255
Refining 795
Marketing 570
Chemicals 1,035
Logistics 305 g
335 MMB refining production
Approximately 4.6 B gal. retail gasoline sales
Over 5B lbs chemical merchant sales
Logistics MLP (NYSE:SXL) owned 62.6% by Sunoco
Coke for steel business . . . Significant growth opportunities
69.3 MM shares outstanding as of 12/31/04
*Total = $3.1 billion as of 12/31/04
A3
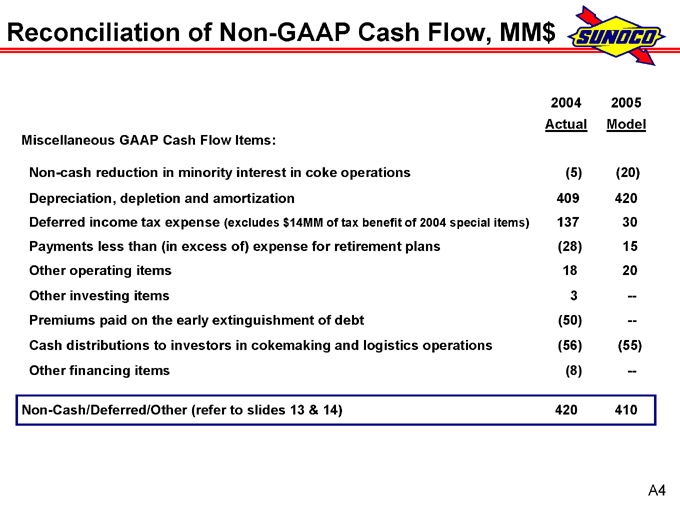
Reconciliation of Non-GAAP Cash Flow, MM$
2004 2005
Actual Model
Miscellaneous GAAP Cash Flow Items:
Non-cash reduction in minority interest in coke operations (5) (20)
Depreciation, depletion and amortization 409 420
Deferred income tax expense (excludes $14MM of tax benefit of 2004 special items) 137 30
Payments less than (in excess of) expense for retirement plans (28) 15
Other operating items 18 20
Other investing items 3 —
Premiums paid on the early extinguishment of debt (50) —
Cash distributions to investors in cokemaking and logistics operations (56) (55)
Other financing items (8) —
Non-Cash/Deferred/Other (refer to slides 13 & 14) 420 410
A4

Reconciliation of Non-GAAP Cash Flow, MM$
2004
Actual
Changes in working capital pertaining to operating activities (GAAP) 559
Less: Sale of proprietary credit card (100)
Income tax settlement (special item) 28
Working Capital (refer to slides 13 & 14) 487
A5
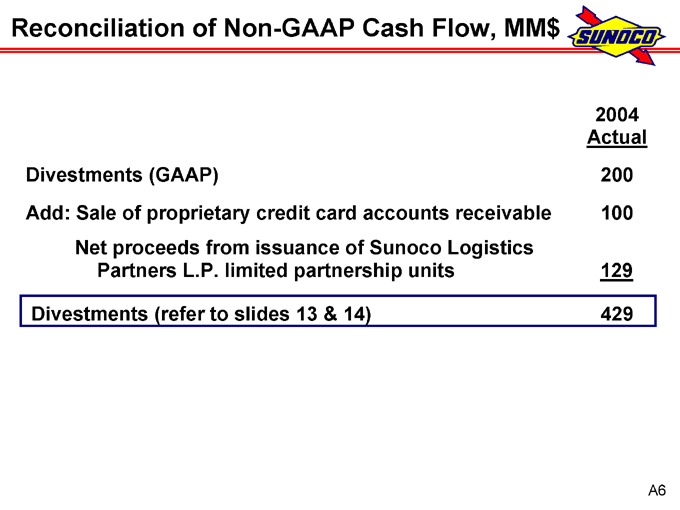
Reconciliation of Non-GAAP Cash Flow, MM$
2004
Actual
Divestments (GAAP) 200
Add: Sale of proprietary credit card accounts receivable 100
Net proceeds from issuance of Sunoco Logistics Partners L.P. limited partnership units 129
Divestments (refer to slides 13 & 14) 429
A6
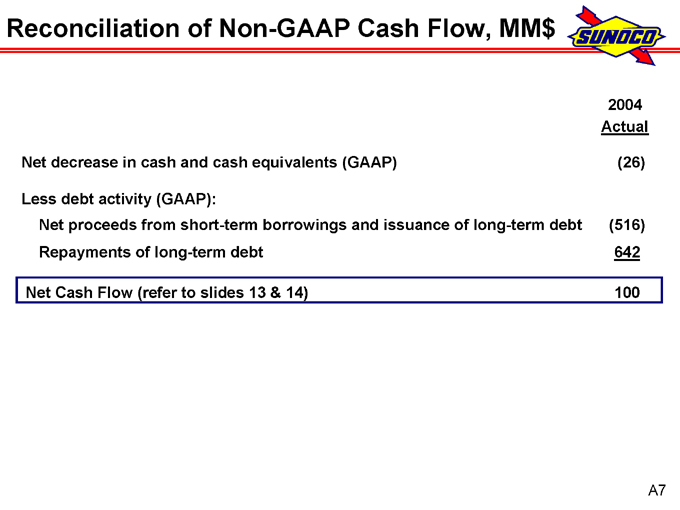
Reconciliation of Non-GAAP Cash Flow, MM$
2004
Actual
Net decrease in cash and cash equivalents (GAAP) (26)
Less debt activity (GAAP):
Net proceeds from short-term borrowings and issuance of long-term debt (516)
Repayments of long-term debt 642
Net Cash Flow (refer to slides 13 & 14) 100
A7
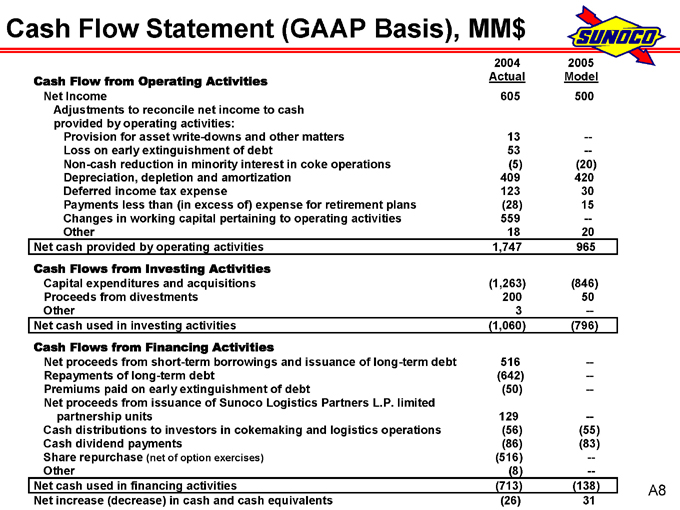
Cash Flow Statement (GAAP Basis), MM$
2004 2005
Cash Flow from Operating Activities Actual Model
Net Income 605 500
Adjustments to reconcile net income to cash
provided by operating activities:
Provision for asset write-downs and other matters 13 —
Loss on early extinguishment of debt 53 —
Non-cash reduction in minority interest in coke operations (5) (20)
Depreciation, depletion and amortization 409 420
Deferred income tax expense 123 30
Payments less than (in excess of) expense for retirement plans (28) 15
Changes in working capital pertaining to operating activities 559 —
Other 18 20
Net cash provided by operating activities 1,747 965
Cash Flows from Investing Activities
Capital expenditures and acquisitions (1,263) (846)
Proceeds from divestments 200 50
Other 3 —
Net cash used in investing activities (1,060) (796)
Cash Flows from Financing Activities
Net proceeds from short-term borrowings and issuance of long-term debt 516 —
Repayments of long-term debt (642) —
Premiums paid on early extinguishment of debt (50) —
Net proceeds from issuance of Sunoco Logistics Partners L.P. limited partnership units 129 —
Cash distributions to investors in cokemaking and logistics operations (56) (55)
Cash dividend payments (86) (83)
Share repurchase (net of option exercises) (516) —
Other (8) —
Net cash used in financing activities (713) (138)
Net increase (decrease) in cash and cash equivalents (26) 31
A8