Exhibit 99.2
1Q05 Earnings Conference Call May 5, 2005
Safe Harbor Statement
This slide presentation should be reviewed in conjunction with Sunoco’s First Quarter 2005 earnings conference call, held on May 5, 2005 at 3:00 p.m. ET. You may listen to the audio portion of the conference call on the website or an audio recording will be available after the call’s completion by calling 1-800-642-1687 and entering conference ID# 5517811.
Those statements made by representatives of Sunoco during the course of this conference call that are not historical facts are forward-looking statements intended to be covered by the safe harbor provisions of Section 27A of the Securities Act of 1933 and Section 21E of the Securities Exchange Act of 1934. These forward-looking statements are based upon a number of assumptions by Sunoco concerning future conditions, any or all of which may ultimately prove to be inaccurate. Forward-looking statements are inherently uncertain and necessarily involve risks that may affect Sunoco’s business prospects and performance, causing actual results to differ materially from those discussed during this conference call. Such risks and uncertainties include, by way of example and not of limitation: general business and economic conditions; competitive products and pricing; effects of weather conditions and natural disasters on the Company’s operating facilities and on product supply and demand; changes in refining, chemical and other product margins; variation in petroleum-based commodity prices and availability of crude oil and feedstock supply or transportation; effects of transportation disruptions; changes in the price differentials between light-sweet and heavy-sour crude oils; fluctuations in supply of feedstocks and demand for products manufactured; changes in product specifications; availability and pricing of oxygenates; phase-outs or restrictions on the use of MTBE; changes in operating conditions and costs; changes in the expected level of environmental capital, operating or remediation expenditures; age of, and changes in the reliability and efficiency of, the Company’s or a third party’s operating facilities; potential equipment malfunction; potential labor relations problems; the legislative and regulatory environment; ability to identify acquisitions, execute them under favorable terms and integrate them into the Company’s existing businesses; ability to enter into joint ventures and other similar arrangements with favorable terms; plant construction/repair delays; non-performance by major customers, suppliers, dealers, distributors or other business partners; changes in financial markets impacting pension expense and funding requirements; political and economic conditions, including the impact of potential terrorist acts and international hostilities; and changes in the status of, or initiation of, new litigation. These and other applicable risks and uncertainties have been described more fully in Sunoco’s 2004 Form 10-K filed with the Securities and Exchange Commission on March 4, 2005. Other factors not discussed herein could also have material adverse effects on forward-looking statements. All forward-looking statements included in this conference call are expressly qualified in their entirety by the foregoing cautionary statements.
Sunoco undertakes no obligation to update any forward-looking statements whether as a result of new information or future events.
1
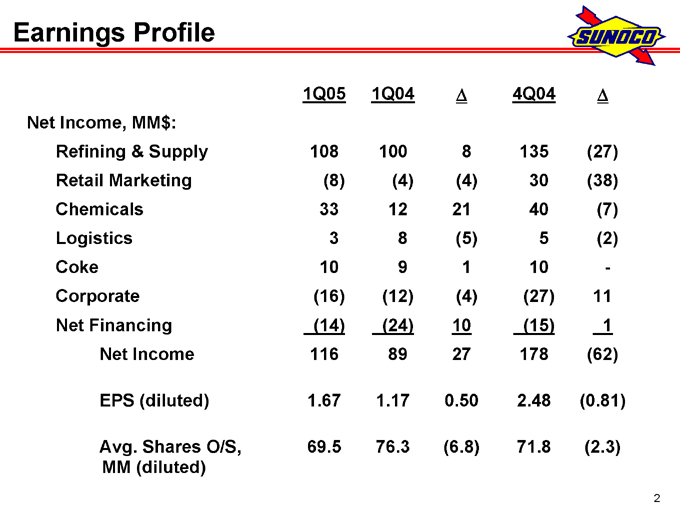
Earnings Profile
1Q05 1Q04 4Q04
Net Income, MM$ :
Refining & Supply 108 100 8 135 (27)
Retail Marketing (8) (4) (4) 30 (38)
Chemicals 33 12 21 40 (7)
Logistics 3 8 (5) 5 (2)
Coke 10 9 1 10 -
Corporate (16) (12) (4) (27) 11
Net Financing (14) (24) 10 (15) 1
Net Income 116 89 27 178 (62)
EPS (diluted) 1.67 1.17 0.50 2.48 (0.81)
Avg. Shares O/S, MM (diluted) 69.5 76.3 (6.8) 71.8 (2.3)
2
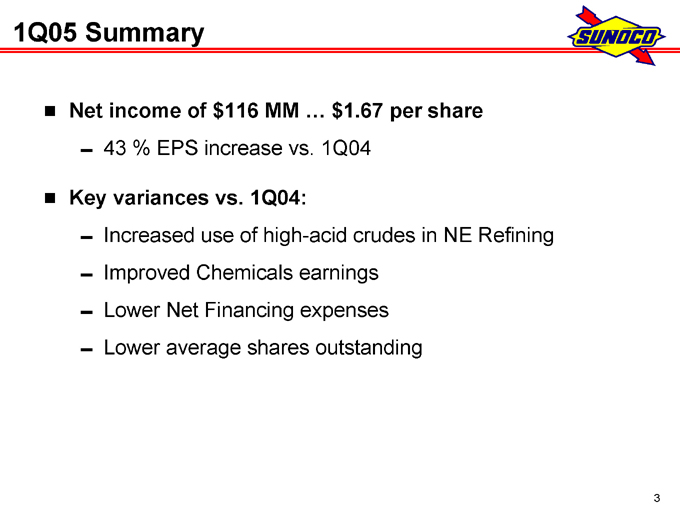
1Q05 Summary
Net income of $116 MM … $1.67 per share
– Increased use of high-acid crudes in NE Refining
– 43 % EPS increase vs. 1Q04
Key variances vs. 1Q04:
– Improved Chemicals earnings
– Lower Net Financing expenses
– Lower average shares outstanding
3
1Q05 Summary (cont’d)
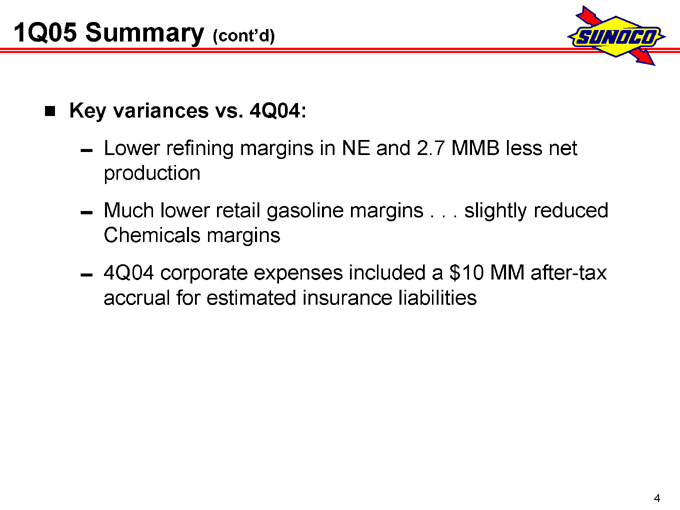
Key variances vs. 4Q04:
– Lower refining margins in NE and 2.7 MMB less net production
– Much lower retail gasoline margins . . . slightly reduced Chemicals margins
– 4Q04 corporate expenses included a $10 MM after-tax accrual for estimated insurance liabilities
4
1Q05 Summary (cont’d)
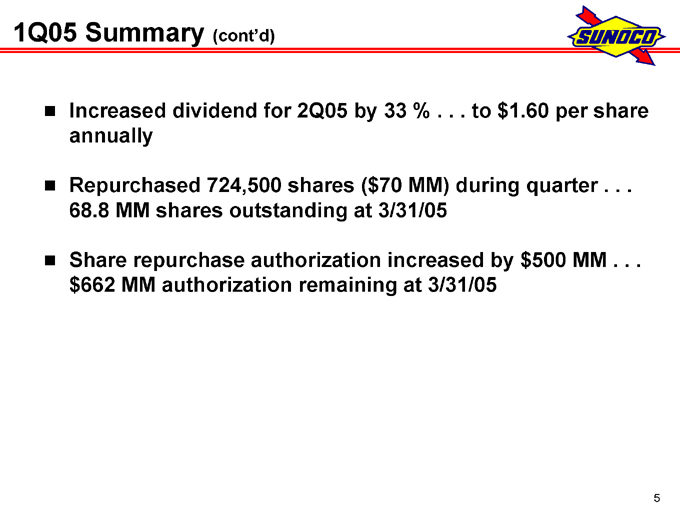
Increased dividend for 2Q05 by 33 % . . . to $1.60 per share annually
Repurchased 724,500 shares ($70 MM) during quarter . . . 68.8 MM shares outstanding at 3/31/05
Share repurchase authorization increased by $500 MM . . . $662 MM authorization remaining at 3/31/05
5
1Q05 Earnings Highlights
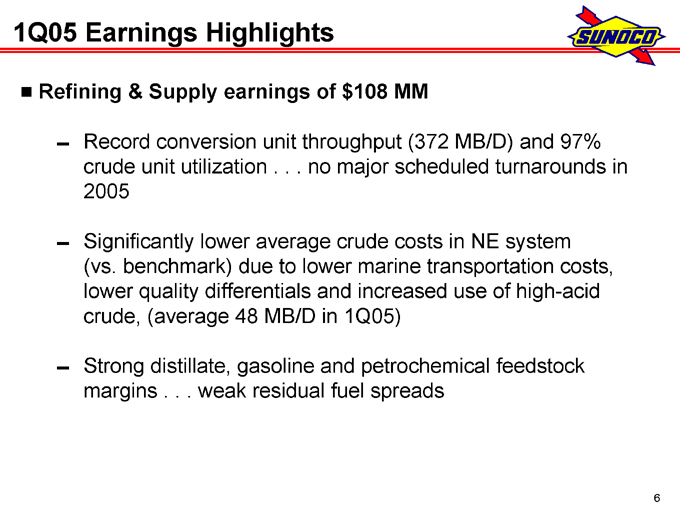
Refining & Supply earnings of $108 MM
– Record conversion unit throughput (372 MB/D) and 97% crude unit utilization . . . no major scheduled turnarounds in 2005
– Significantly lower average crude costs in NE system (vs. benchmark) due to lower marine transportation costs, lower quality differentials and increased use of high-acid crude, (average 48 MB/D in 1Q05)
– Strong distillate, gasoline and petrochemical feedstock margins . . . weak residual fuel spreads
6
Refining & Supply – Margins, $/B
1Q05 1Q04 ? 4Q04 ?
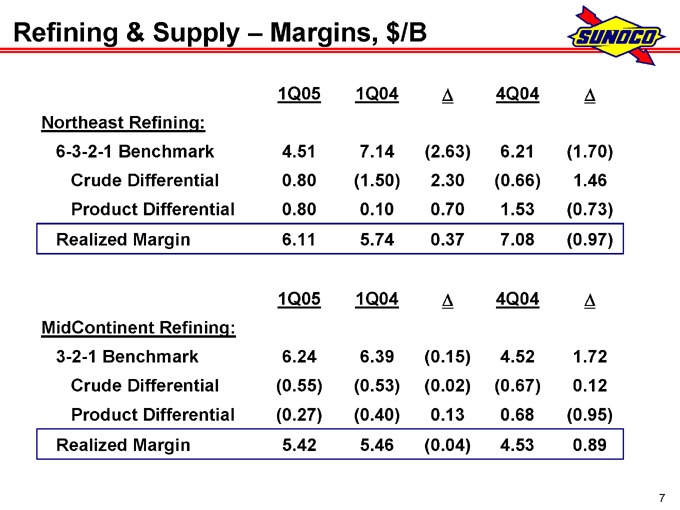
Northeast Refining:
6-3-2-1 Benchmark 4.51 7.14 (2.63) 6.21 (1.70)
Crude Differential 0.80 (1.50) 2.30 (0.66) 1.46
Product Differential 0.80 0.10 0.70 1.53 (0.73)
Realized Margin 6.11 5.74 0.37 7.08 (0.97)
1Q05 1Q04 ? 4Q04 ?
MidContinent Refining:
3-2-1 Benchmark 6.24 6.39 (0.15) 4.52 1.72
Crude Differential (0.55) (0.53) (0.02) (0.67) 0.12
Product Differential (0.27) (0.40) 0.13 0.68 (0.95)
Realized Margin 5.42 5.46 (0.04) 4.53 0.89
7
1Q05 Earnings Highlights
Retail Marketing loss of $8 MM
– Margins in all channels of distribution squeezed by wholesale gasoline price increases of over 40 cpg during 1Q05 . . . average gasoline margin of 5.6 cpg
– Sites acquired from ConocoPhillips earned $2 MM
8
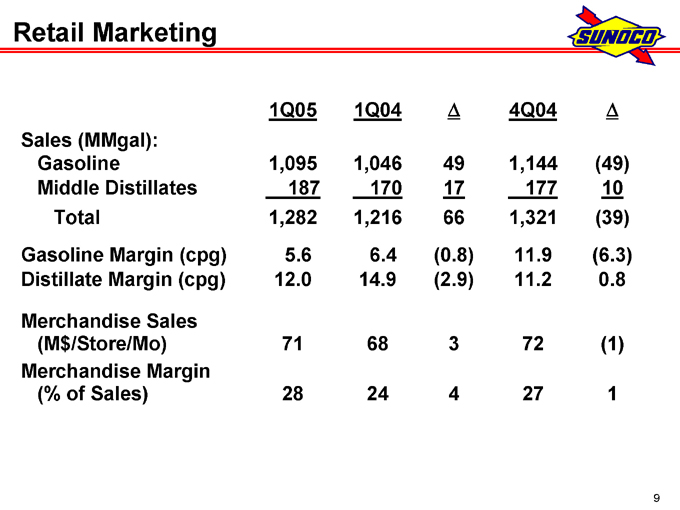
Retail Marketing
1Q05 1Q04 ? 4Q04 ?
Sales (MMgal):
Gasoline 1,095 1,046 49 1,144 (49)
Middle Distillates 187 170 17 177 10
Total 1,282 1,216 66 1,321 (39)
Gasoline Margin (cpg) 5.6 6.4 (0.8) 11.9 (6.3)
Distillate Margin (cpg) 12.0 14.9 (2.9) 11.2 0.8
Merchandise Sales (M$/Store/Mo) 71 68 3 72 (1)
Merchandise Margin (% of Sales) 28 24 4 27 1
9
1Q05 Earnings Highlights
Chemicals earnings of $33 MM
– Much improved vs. 1Q04 but down slightly from 4Q04 due to feedstock price increases and weakened polypropylene demand
– Production limited (approximately 2 %) by feedstock supply issues (early 1Q05) and scheduled maintenance at Haverhill phenol facility
– Steam supply from Haverhill Coke plant commenced in April . . . estimated annual fuel savings of $10-12 MM pretax
10
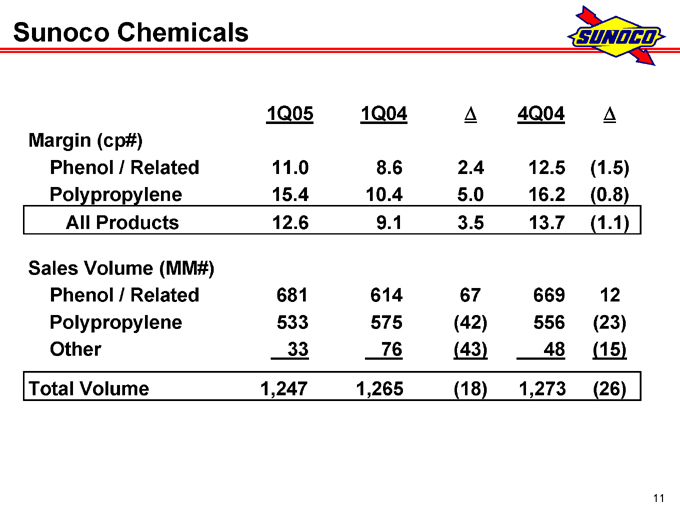
Sunoco Chemicals
1Q05 1Q04 ? 4Q04 ?
Margin (cp#)
Phenol / Related 11.0 8.6 2.4 12.5 (1.5)
Polypropylene 15.4 10.4 5.0 16.2 (0.8)
All Products 12.6 9.1 3.5 13.7 (1.1)
Sales Volume (MM#)
Phenol / Related 681 614 67 669 12
Polypropylene 533 575 (42) 556 (23)
Other 33 76 (43) 48 (15)
Total Volume 1,247 1,265 (18) 1,273 (26)
11
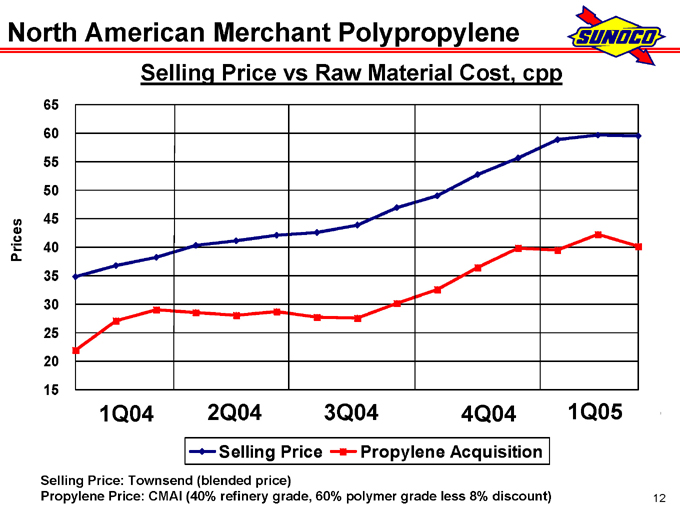
North American Merchant Polypropylene
Selling Price vs Raw Material Cost, cpp
Prices
65 60 55 50 45 40 35 30 25 20 15
1Q04 2Q04 3Q04 4Q04 1Q05
Selling Price Propylene Acquisition
Selling Price: Townsend (blended price)
Propylene Price: CMAI (40% refinery grade, 60% polymer grade less 8% discount)
12
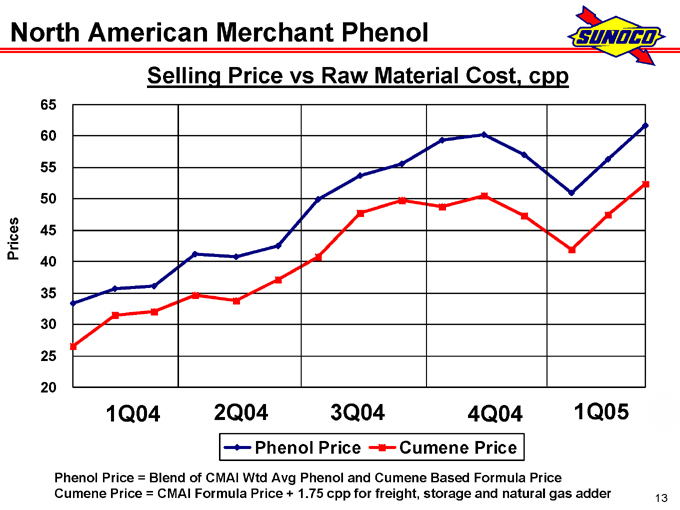
North American Merchant Phenol
Selling Price vs Raw Material Cost, cpp
Prices
65 60 55 50 45 40 35 30 25 20
1Q04 2Q04 3Q04 4Q04 1Q05
Phenol Price Cumene Price
Phenol Price = Blend of CMAI Wtd Avg Phenol and Cumene Based Formula Price Cumene Price = CMAI Formula Price + 1.75 cpp for freight, storage and natural gas adder
13
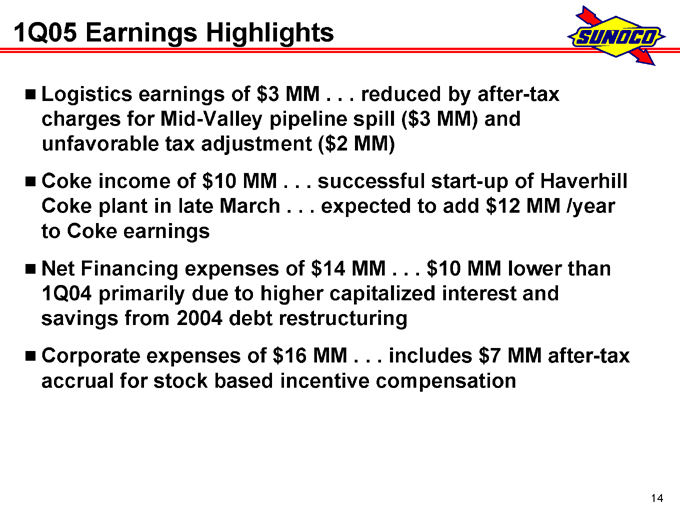
1Q05 Earnings Highlights
Logistics earnings of $3 MM . . . reduced by after-tax charges for Mid-Valley pipeline spill ($3 MM) and unfavorable tax adjustment ($2 MM)
Coke income of $10 MM . . . successful start-up of Haverhill Coke plant in late March . .. . expected to add $12 MM /year to Coke earnings
Net Financing expenses of $14 MM . . . $10 MM lower than 1Q04 primarily due to higher capitalized interest and savings from 2004 debt restructuring
Corporate expenses of $16 MM . . . includes $7 MM after-tax accrual for stock based incentive compensation
14
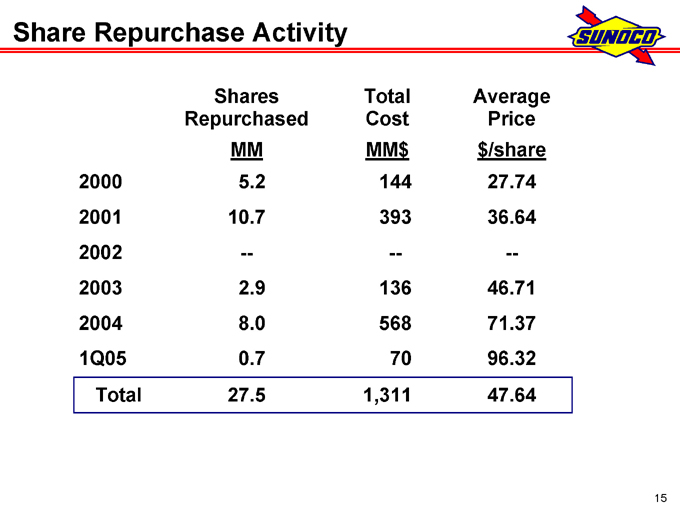
Share Repurchase Activity
Shares Repurchased MM Total Cost MM$ Average Price $/share
2000 5.2 144 27.74
2001 10.7 393 36.64
2002 — — —
2003 2.9 136 46.71
2004 8.0 568 71.37
1Q05 0.7 70 96.32
Total 27.5 1,311 47.64
15
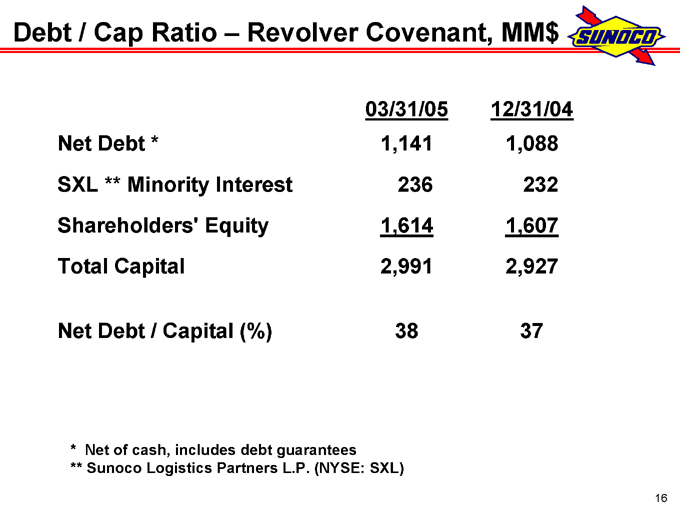
Debt / Cap Ratio – Revolver Covenant, MM$
03/31/05 12/31/04
Net Debt * 1,141 1,088
SXL ** Minority Interest 236 232
Shareholders’ Equity 1,614 1,607
Total Capital 2,991 2,927
Net Debt / Capital (%) 38 37
* Net of cash, includes debt guarantees ** Sunoco Logistics Partners L.P. (NYSE: SXL)
16
For More Information
Press releases and SEC filings are available on our website at www.SunocoInc.com
Contact for more information:
Terry Delaney (215) 977-6106 John Sadlowski (215) 977-6764
17