Exhibit 99.2

1Q06 Earnings Conference Call May 4, 2006
Safe Harbor Statement
This slide presentation should be reviewed in conjunction with Sunoco’s First Quarter 2006 earnings conference call, held on May 4, 2006 at 3:00 p.m. ET. You may listen to the audio portion of the conference call on the website or an audio recording will be available after the call’s completion by calling 1-800-642-1687 and entering conference ID# 8163181.
Those statements made by representatives of Sunoco during the course of this conference call that are not historical facts are forward-looking statements intended to be covered by the safe harbor provisions of Section 27A of the Securities Act of 1933 and Section 21E of the Securities Exchange Act of 1934. These forward-looking statements are based upon a number of assumptions by Sunoco concerning future conditions, any or all of which may ultimately prove to be inaccurate. Forward-looking statements are inherently uncertain and necessarily involve risks that may affect Sunoco’s business prospects and performance, causing actual results to differ materially from those discussed during this conference call. Such risks and uncertainties include, by way of example and not of limitation: general business and economic conditions; competitive products and pricing; effects of weather conditions and natural disasters on the Company’s operating facilities and on product supply and demand; changes in refined product and chemical margins; variation in petroleum-based commodity prices and availability of crude oil and feedstock supply or transportation; effects of transportation disruptions; changes in the price differentials between light-sweet and heavy-sour crude oils; fluctuations in supply of feedstocks and demand for products manufactured; changes in product specifications; availability and pricing of ethanol; changes in operating conditions and costs; changes in the expected level of environmental capital, operating or remediation expenditures; age of, and changes in the reliability, efficiency and capacity of, the Company’s or a third party’s operating facilities; potential equipment malfunction; potential labor relations problems; the legislative and regulatory environment; ability to identify acquisitions, execute them under favorable terms and integrate them into the Company’s existing businesses; ability to enter into joint ventures and other similar arrangements under favorable terms; delays and/or costs related to plant construction, improvements, or repairs and the issuance of applicable permits; non-performance by or disputes with major customers, suppliers, dealers, distributors or other business partners; changes in financial markets impacting pension expense and funding requirements; political and economic conditions, including the impact of potential terrorist acts and international hostilities; and changes in the status of, or initiation of, new litigation and/or arbitration proceedings. These and other applicable risks and uncertainties have been described more fully in Sunoco’s 2005 Form 10-K filed with the Securities and Exchange Commission on March 3, 2006. Other factors not discussed herein also could materially and adversely affect Sunoco’s business prospects and/or performance. All forward-looking statements included in this conference call are expressly qualified in their entirety by the foregoing cautionary statements. Sunoco undertakes no obligation to update any forward-looking statements whether as a result of new information or future events.
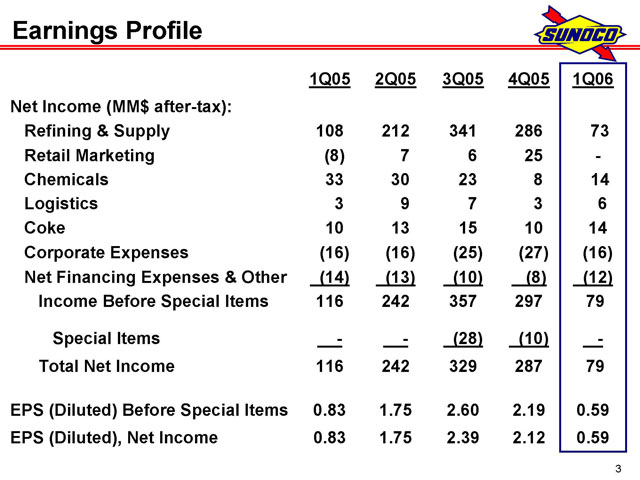
Earnings Profile
Net | | Income (MM$ after-tax): |
Refining | | & Supply 108 212 341 286 73 |
Retail | | Marketing (8) 7 6 25 - |
Corporate | | Expenses (16) (16) (25) (27) (16) |
Net | | Financing Expenses & Other (14) (13) (10) (8) (12) |
Income | | Before Special Items 116 242 357 297 79 |
Special | | Items—- (28) (10) - |
Total | | Net Income 116 242 329 287 79 |
EPS | | (Diluted) Before Special Items 0.83 1.75 2.60 2.19 0.59 |
EPS | | (Diluted), Net Income 0.83 1.75 2.39 2.12 0.59 |
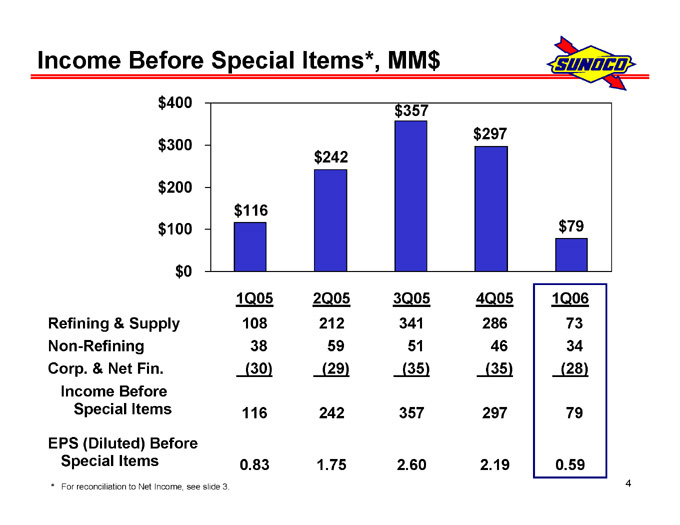
Income Before Special Items*, MM$
$400 $300 $200 $100 $0
$116
$242
$357
$297
$79
Refining | | & Supply 108 212 341 286 73 |
Non-Refining | | 38 59 51 46 34 |
Corp. | | & Net Fin. (30) (29) (35) (35) (28) |
Special | | Items 116 242 357 297 79 |
Special | | Items 0.83 1.75 2.60 2.19 0.59 |
*For | | reconciliation to Net Income, see slide 3. |

Earnings Before Special Items* – 1Q06 vs. 1Q05, MM$
116
1Q05 Actual
Margins | | R & S 10 Retail 7 Chemicals (13) |
Volume | | R & S (7) Retail (1) Chemicals (2) |
Expenses/Other | | R & S (38) Retail 2 Chemicals (4) |
9
Other | | Logistics 3 Coke 4 Net Financing 2 |
79
1Q06 Actual
5
*For | | reconciliation to Net Income, see slide 3. |

Earnings Before Special Items – 1Q06 vs. 4Q05, MM$
297
4Q05 Actual
(233)
Margins | | R & S (199) Retail (30) Chemicals (4) |
Volume | | R & S (22) Retail (2) Chemicals 4 |
21
Expenses/Other | | R & S 8 Retail 7 Chemicals 6 |
14
Other | | Logistics 3 Coke 4 Corporate 11 Net Financing (4) |
79
1Q06 Actual
* | | For reconciliation to Net Income, see slide 3. |

Key Margin Indicators
Realized | | NER 6.11 7.55 10.52 9.18 5.35 |
Realized | | MCR 5.42 8.80 11.60 12.25 8.38 |
Realized | | Total R&S 5.93 7.87 10.80 9.96 6.13 |
Gasoline | | 5.7 7.9 7.7 11.0 6.8 |
Distillate | | 12.0 7.9 8.8 13.5 12.0 |
Phenol | | and Related 11.0 12.8 10.7 9.3 9.1 |
Polypropylene | | 15.4 13.2 12.7 14.3 13.2 |
Total | | Chemicals 12.6 12.8 11.5 11.4 10.9 |
Delivered, | | $/B 48.93 52.73 62.70 58.15 63.13 |
Natural | | Gas, $/DT 6.48 6.95 9.71 12.86 7.88 |
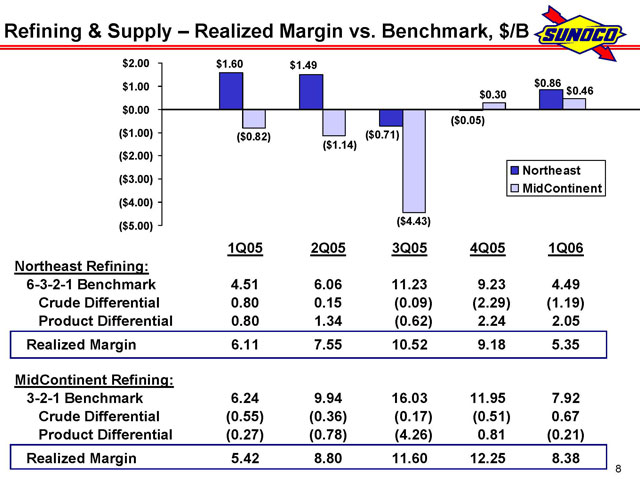
Refining & Supply – Realized Margin vs. Benchmark, $/B
$2.00 $1.00 $0.00
$1.60
$1.49
$0.30
$0.86
$0.46
Northeast MidContinent
6-3-2-1 | | Benchmark 4.51 6.06 11.23 9.23 4.49 |
Crude | | Differential 0.80 0.15 (0.09) (2.29) (1.19) |
Product | | Differential 0.80 1.34 (0.62) 2.24 2.05 |
Realized | | Margin 6.11 7.55 10.52 9.18 5.35 |
3-2-1 | | Benchmark 6.24 9.94 16.03 11.95 7.92 |
Crude | | Differential (0.55) (0.36) (0.17) (0.51) 0.67 |
Product | | Differential (0.27) (0.78) (4.26) 0.81 (0.21) |
Realized | | Margin 5.42 8.80 11.60 12.25 8.38 |

Key Volume Indicators
Crude | | Throughputs, MB/D 646 655 643 659 610 |
% | | Capacity 99 100 98 101 93 |
Net | | Production Available for Sale, MB/D 685 700 677 705 664 |
Crude | | Throughputs, MB/D 229 236 223 234 225 |
% | | Capacity 93 96 91 95 92 |
Net | | Production Available for Sale, MB/D 234 241 228 238 233 |
Crude | | Throughputs, MB/D 875 891 866 893 835 |
% | | Capacity 97 99 96 99 93 |
Net | | Production Available for Sale, MB/D 919 941 905 943 897 |
Net | | Production Available for Sale, MMB 83 86 83 87 81 |
Gasoline | | Sales, MM gal 1,095 1,167 1,195 1,115 1,086 |
Middle | | Distillates Sales, MM gal 187 161 165 181 176 |
Total | | Sales, MM gal 1,282 1,328 1,360 1,296 1,262 |
Gasoline | | and Diesel Throughput (MM gal/Site/Month) 132 139 143 131 132 |
(Company | | owned or leased outlets) |
Merchandise | | Sales (M$/Store/Month) 71 81 84 76 71 |
Phenol | | and Related Sales, MM# 681 617 662 619 633 |
Polypropylene | | Sales, MM# 533 583 590 512 562 |
Other | | Sales, MM# 33 16 20 22 21 |
Total, | | MM# 1,247 1,216 1,272 1,153 1,216 |
Production, | | M tons 503 625 643 634 631 |
Sales, | | M tons 497 621 647 610 647 |
9

Financial Indicators
Net | | Debt * 1,141 1,061 679 499 1,169 |
SXL | | ** Minority Interest 236 337 398 397 394 |
Shareholders’ | | Equity 1,614 1,802 2,062 2,051 2,027 |
Total | | Capital 2,991 3,200 3,139 2,947 3,590 |
Net | | Debt / Capital 38% 33% 22% 17% 33% |
Share | | Repurchase Activity |
Total | | Cost, MM$ 70 61 35 269 48 |
Shares | | Repurchased, MM 1.4 1.2 0.5 3.6 0.6 |
Average | | Price, $/share 48.16 51.22 65.77 75.57 76.98 |
Period | | End, MM 137.7 136.6 136.1 133.1 132.6 |
* | | Net of cash, includes debt guarantees |
** | | Sunoco Logistics Partners L.P. (NYSE: SXL) |
10
For More Information
Media releases and SEC filings are available on our website at www.SunocoInc.com
Contact for more information:
Terry | | Delaney (215) 977-6106 Tom Harr (215) 977-6764 |
11