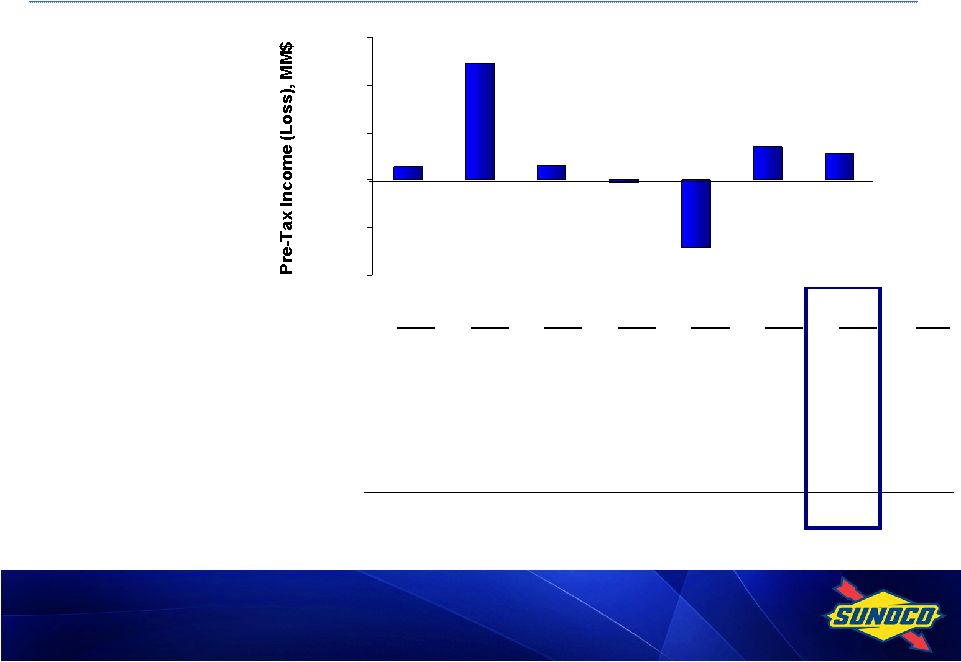
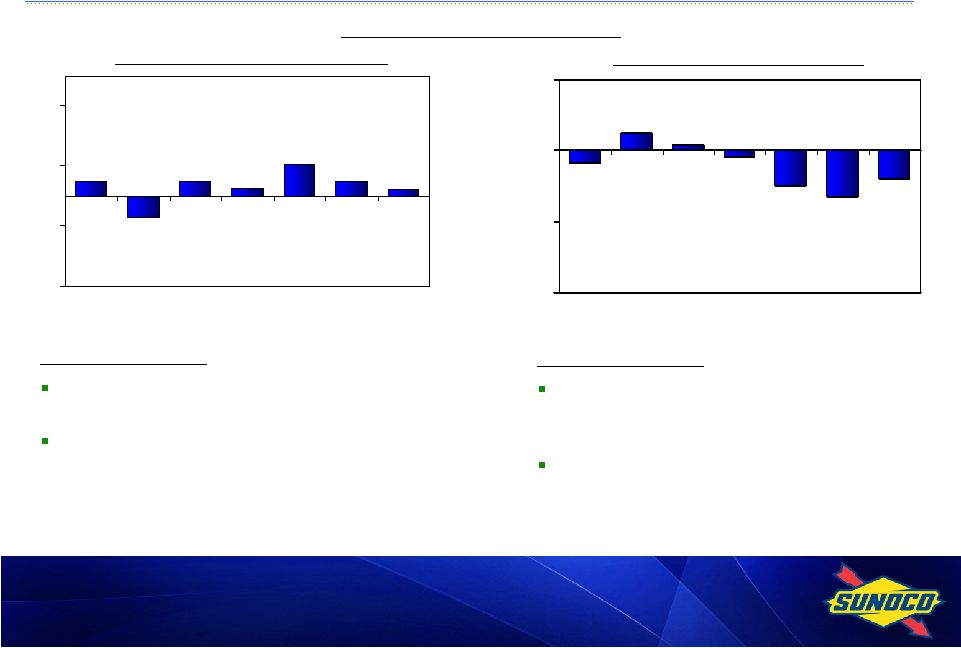
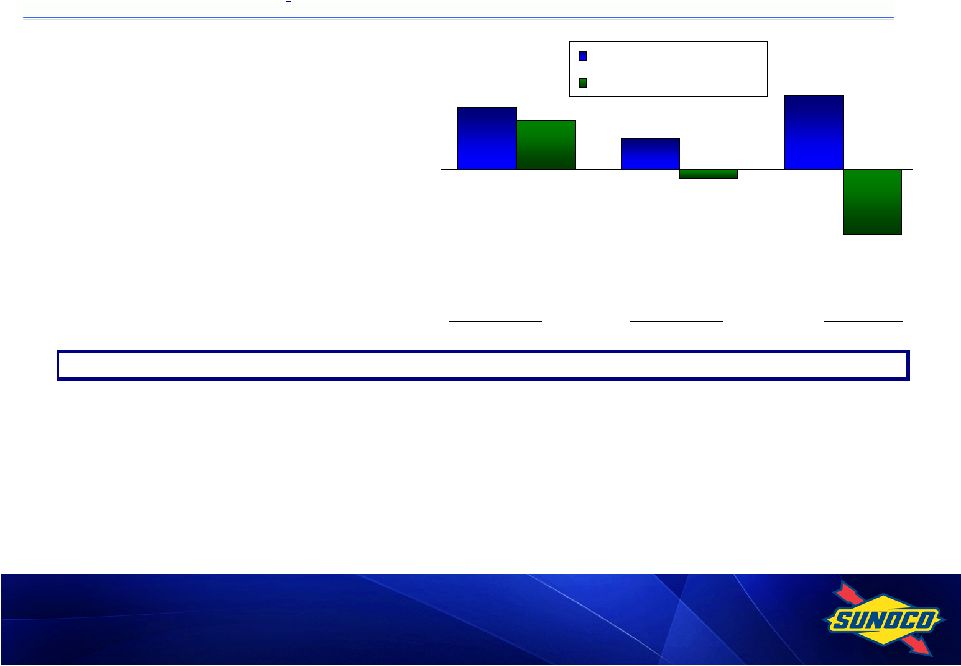
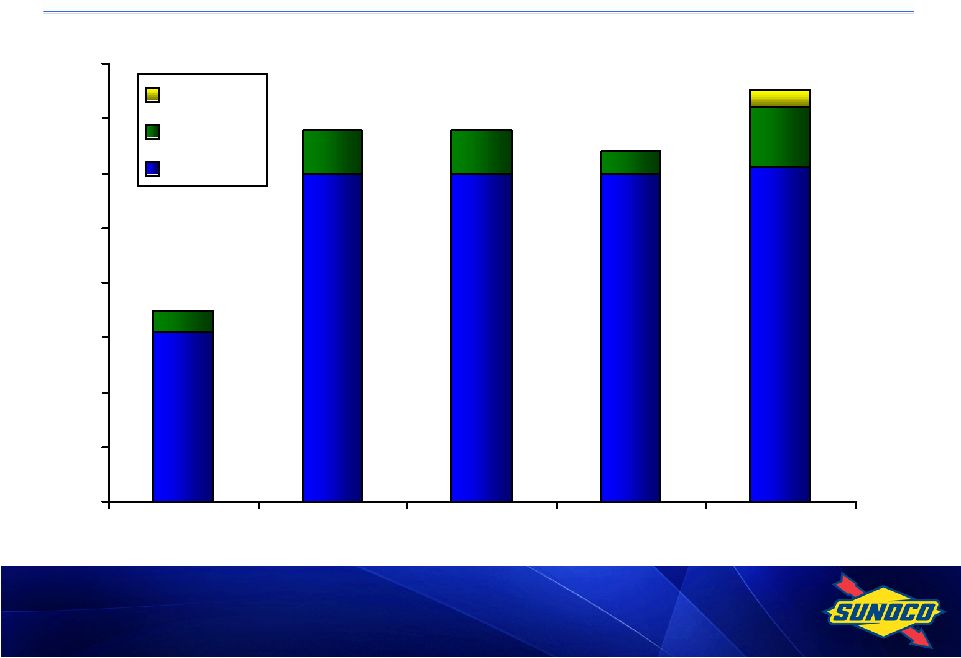
12 Earnings Profile, MM$ YTD 1Q10 2Q10 3Q10 4Q10 FY10 1Q11 2Q11 3Q11 2011 Refining & Supply (70) 138 (70) (17) (19) (138) (44) (17) (199) Retail Marketing 34 73 68 1 176 12 69 48 129 Logistics 27 30 40 35 132 31 54 53 138 Coke 51 56 44 25 176 9 20 24 53 Discontinued Chemicals Operations 38 7 5 6 56 (9) 6 1 (2) Corporate and Other: Corporate Expenses (23) (30) (28) (27) (108) (22) (18) (23) (63) Net Financing Expenses & Other (28) (27) (28) (27) (110) (24) (16) (29) (69) Pretax Income (Loss) attributable to Sunoco, Inc. shareholders before special items 29 247 31 (4) 303 (141) 71 57 (13) Income Tax Expense (Benefit) attributable to Sunoco, Inc. shareholders 12 89 4 (17) 88 (19) 22 (8) (5) Income (Loss) attributable to Sunoco, Inc. shareholders before special items 17 158 27 13 215 (122) 49 65 (8) Special Items: Continuing Operations* (45) (22) 62 123 118 51 (7) (1,966) (1,922) Discontinued Operations** (169) - - - (169) - (287) 32 (255) Pretax Income (Loss) from special items (214) (22) 62 123 (51) 51 (294) (1,934) (2,177) Income Tax Expense (Benefit) (134) (9) 24 49 (70) 30 (120) (773) (863) Income (Loss) from special items (80) (13) 38 74 19 21 (174) (1,161) (1,314) Net Income (Loss) attributable to Sunoco, Inc. shareholders (63) 145 65 87 234 (101) (125) (1,096) (1,322) * In 3Q 2011, recorded a $1,959MM noncash provision to write down assets at the Philadelphia and Marcus Hook refineries to their estimated fair values in connection with decision to exit refining business. ** In 1Q 2010 and 2Q 2011, recognized losses in connection with the divestment of the chemicals business; In 3Q 2011, recognized a $14MM gain on the divestment of the Frankford chemical facility and an $18 million gain attributable to a settlement connected to the Tulsa refining operation which was sold in 2009. |