
Forging the Future of Grocery Retailing
Jeff Noddle, Chairman and CEO
Pamela Knous, EVP and Chief Financial Officer
Meetings with Investment Community
March 14-17, 2006
Exhibit 99.1
Filed by SUPERVALU INC.
Pursuant to Rule 425 under the Securities Act of 1933
Subject Company: SUPERVALU INC., File #1-5418
1

Forward-Looking Statement
CAUTIONARY STATEMENTS RELEVANT TO FORWARD-LOOKING INFORMATION FOR THE PURPOSE OF “SAFE HARBOR”
PROVISIONS OF THE PRIVATE SECURITIES LITIGATION REFORM ACT OF 1995
Except for the historical and factual information contained herein, the matters set forth in this presentation, including statements as
to the expected benefits of the acquisition such as efficiencies, cost savings, market profile and financial strength, and the competitive
ability and position of the combined company, and other statements identified by words such as “estimates,” “expects,” “projects,”
“plans,” and similar expressions are forward-looking statements within the meaning of the “safe harbor” provisions of the Private
Securities Litigation Reform Act of 1995. These forward-looking statements are subject to risks and uncertainties that may cause actual
results to differ materially, including required approvals by Supervalu and Albertsons shareholders and regulatory agencies, the possibility
that the anticipated benefits from the acquisition cannot be fully realized or may take longer to realize than expected, the possibility that
costs or difficulties related to the integration of Albertsons operations into Supervalu will be greater than expected, the impact of
competition and other risk factors relating to our industry as detailed from time to time in each of Supervalu’s and Albertsons reports filed
with the SEC. You should not place undue reliance on these forward-looking statements, which speak only as of the date of this
presentation. Unless legally required, Supervalu undertakes no obligation to update publicly any forward-looking statements, whether as
a result of new information, future events or otherwise.
ADDITIONAL INFORMATION
Supervalu and Albertsons will file a joint proxy statement/prospectus with the Securities and Exchange Commission (SEC). INVESTORS
ARE URGED TO READ THE JOINT PROXY STATEMENT/PROSPECTUS WHEN IT BECOMES AVAILABLE BECAUSE IT WILL CONTAIN
IMPORTANT INFORMATION. You will be able to obtain the joint proxy statement/prospectus, as well as other filings containing information
about Supervalu and Albertsons, free of charge, at the website maintained by the SEC at www.sec.gov. Copies of the joint proxy
statement/prospectus and the filings with the SEC that will be incorporated by reference in the joint proxy statement/prospectus can also
be obtained, free of charge, by directing a request to Supervalu, Inc., 11840 Valley View Road, Eden Prairie, Minnesota, 55344, Attention:
Corporate Secretary, or to Albertsons, Inc., 250 East Parkcenter Boulevard, Boise, Idaho, 83706-3940, Attention: Corporate Secretary.
The respective directors and executive officers of Supervalu and Albertsons and other persons may be deemed to be participants in the
solicitation of proxies in respect of the proposed transaction. Information regarding Supervalu’s directors and executive officers is
available in its proxy statement filed with the SEC by Supervalu on May 12, 2005, and information regarding Albertsons directors and
executive officers is available in its proxy statement filed with the SEC by Albertsons on May 6, 2005. Other information regarding the
participants in the proxy solicitation and a description of their direct and indirect interests, by security holdings or otherwise, will be
contained the joint proxy statement/prospectus and other relevant materials to be filed with the SEC when they become available.
Investors should read the joint proxy statement/prospectus carefully when it becomes available before making any voting or investment
decisions.
2
Agenda
Company Overview
How We View the Market
Strategy for Change
The Deal
Financial Discussion
Implementing Change
Summary
3
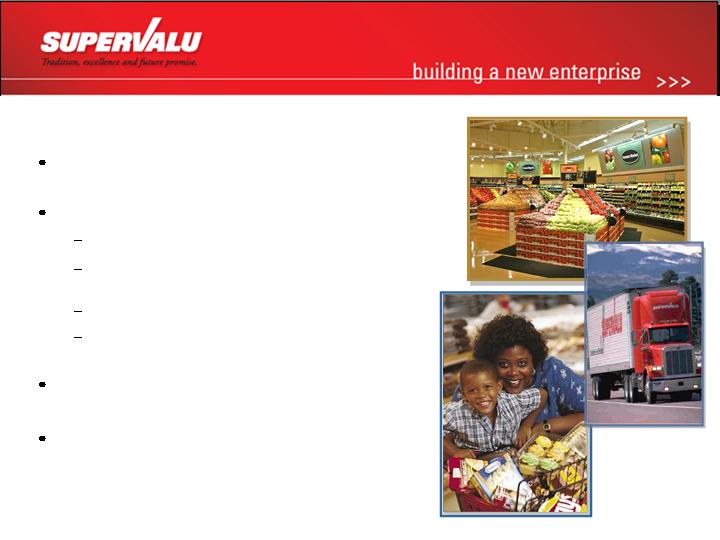
Who We Are: A SUPERVALU Overview
135-year legacy of grocery industry
excellence
Multi-format grocery retail leadership
1,381 retail locations across seven banners
Diverse portfolio of formats to address the full
spectrum of grocery shopping preferences
Industry leader in supply chain services
Serve more than 2,200 primary customer
sites, plus our own retail operations
Unparalleled basis-point discipline engrained
in all our businesses
60+ years of dividend payments
4

Extreme value
Small Box Format
Highly efficient model
National Banner
Super-Regional Banners
Super-regional
Two dominant
formats: Fresh Focus
and Price Impact
5
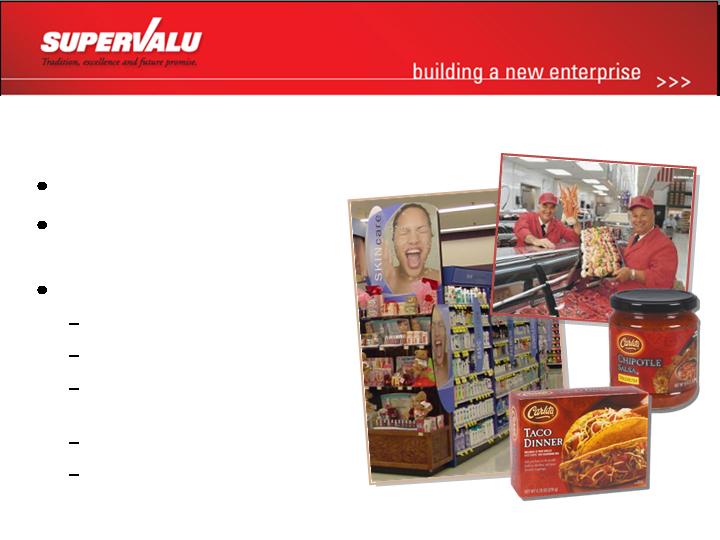
SUPER-Regional Banner Edges: Setting Ourselves Apart
227 stores in network
Providing products,
service, ambiance
Powerful differentiators:
Fresh departments
HBC departments
Ethnic specialty
departments
Store brands
Center store programs
6
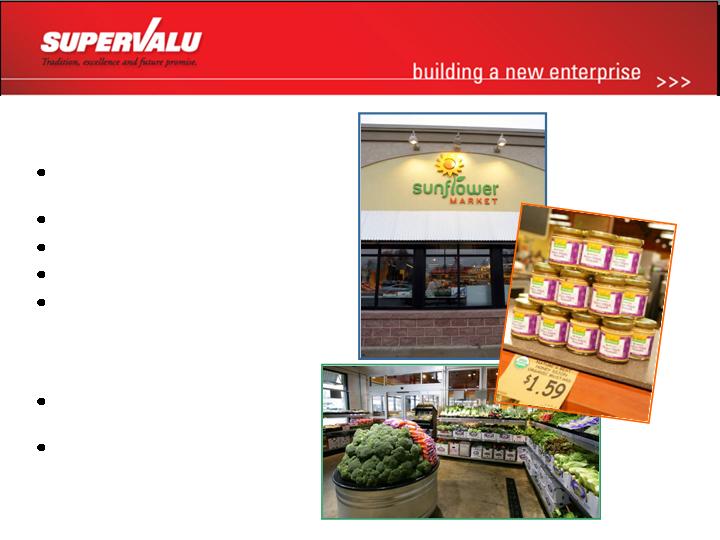
Our New Fresh Concept
January 2006,
Indianapolis
8,000 – 12,000 SKUs
12,000 – 15,000 sq. ft.
Limited assortment
Value-priced at 10%-15%
lower than conventional
and natural store
competitors
Focus on perishables,
especially produce
High-quality natural and
organic departments
7
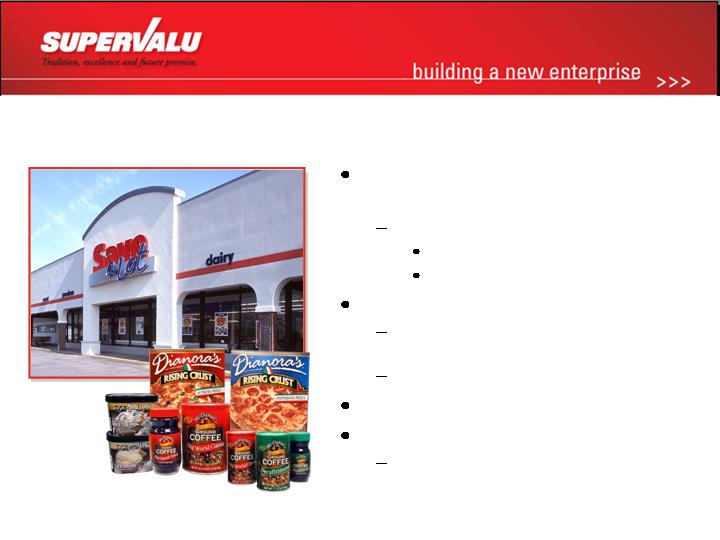
National Banner Save-A-Lot: Big Savings in a Small Box
The fastest-growing limited
assortment retailer in the U.S.
1,154 stores in 39 states
862 licensed
292 corporate
Target customer
Household incomes under
$35,000
43.3 million households
12,000 – 15,000 sq. ft. footprint
Approximately 1,250 SKUs
70% Custom Brand products
8
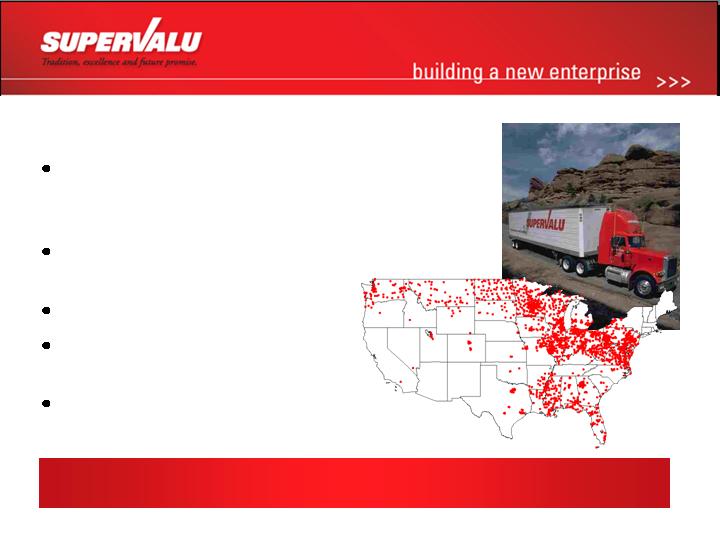
Our Supply Chain Services Profile
Serving more than 2,200 primary
customer sites and 227 corporate
retail locations
Travel almost 100 million miles
annually
Supported by 24 locations
Move more than
half-billion cases annually
Industry-leading service levels
Industry leader in efficiency and
service offerings to retail grocery channel
9

Our Customer Profile Today
SUPERVALU supports nearly 90 million sq. ft. of retail space
Mass Merchandisers
Independent Retailers
National
Banner
Super-Regional
Banners
10
How We View the Market
New Realities Creating Opportunities to Shape SUPERVALU and the
Grocery Retail Sector
Channel Blur - Everybody is selling food
Non-traditional retailers using food to build store traffic
Shopping patterns and preferences are shifting as store formats adapt
Industry ripe for rationalization
Excess supply of retail space
List of troubled players sets the stage for major consolidation events
Understanding and catering to the customer
Determining the right mix of merchandizing, shopping experience, and
price is critical
Food preferences remain locally driven
SUPERVALU is actively shaping its future and positioning itself
to succeed in the grocery retailing industry
11
Successfully competing requires a multi-faceted
approach to achieve sustainable grocery retail success
Ideally positioned to capitalize
on serving diverse customer
needs and wants
Extreme Value
Price Impact
Traditional / Full Service
Natural / Organic
High-end Gourmet
Fuel and Convenience
Scale and Diversity of
Retail Formats
Leveraging world-class
supply chain capabilities and
buying power
Develop unique scalable
competitive advantages like
W. Newell & Co. in produce
Robust technology
platforms: SV Harbor,
T-squared, and more
Strong Supply Chain
Backbone
Strong local management
Customized and innovative
local merchandising
Commitment to superior
shopping experience in
competitive atmosphere
Empowered People
Creating Sustainable Success
12

We Are Well Positioned to Capitalize
on Market Opportunity
Years of operational and financial staging
have prepared us
Proven ability to manage a variety
of retail formats
Track record of successful integration
of acquisitions
Basis-point discipline embedded in culture
In Albertsons, we see great assets,
markets and people
13

Our Acquisition Discipline Was Applied
Synergistic and
Accretive
Strong local market
leadership
Realizable synergies
Additive competencies
Don’t seek turnarounds
Fit with SVU strategy
Rigorous due diligence
Enhance shareholder value
Disciplined
Selection and
Rigorous Due
Diligence
14

The Deal
Transaction Summary
SUPERVALU, CVS and Cerberus-led
investment group to acquire Albertsons
for $17.4 billion in cash, stock and debt
assumption (with HITS).
SUPERVALU to acquire premier retail
properties - more than 1,100 stores:
Acme Markets
Bristol Farms
Jewel-Osco
Shaw’s and Star Markets
569 Albertsons stores in Idaho, Southern
California, Nevada, Utah and Northwestern U.S.
In-store pharmacies: Osco Drug and Sav-on
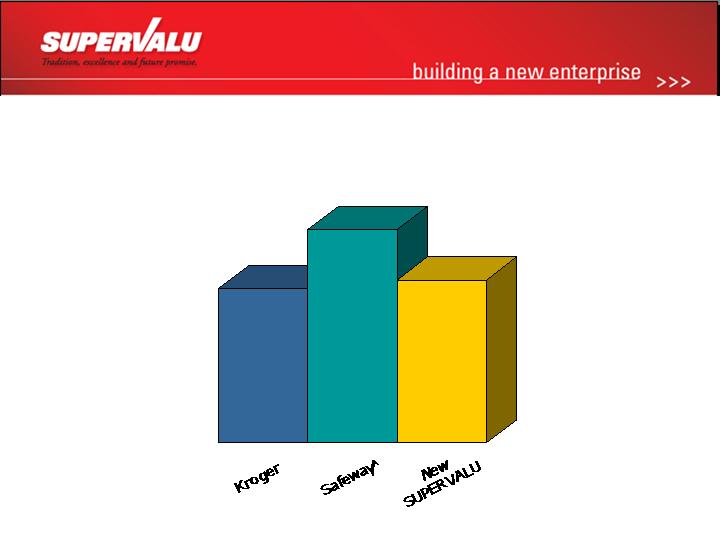
SUPERVALU takes No. 2 spot in the
grocery industry by revenue
15
878
722
156
In-store
Pharmacies
$150-$175 million
pretax over 3 yrs.
Synergies
89% Retail
67% Retail
EBITDA Mix
80% Retail
53% Retail
Revenue Mix
194,000
144,000
50,000
Employees
2,505
1,124
1,381*
Store Network*
Financial
Operational
117
107
10
Fuel Centers
$44B
$25B
$19B
Revenue (FY ’05)
New SUPERVALU
Business to be
Acquired
SUPERVALU
Transformation in Scope and Scale
(all data approximate)
*Store network adjusted for sale of Pittsburgh and Chicago stores and the announced sale of Deals
stores.
16
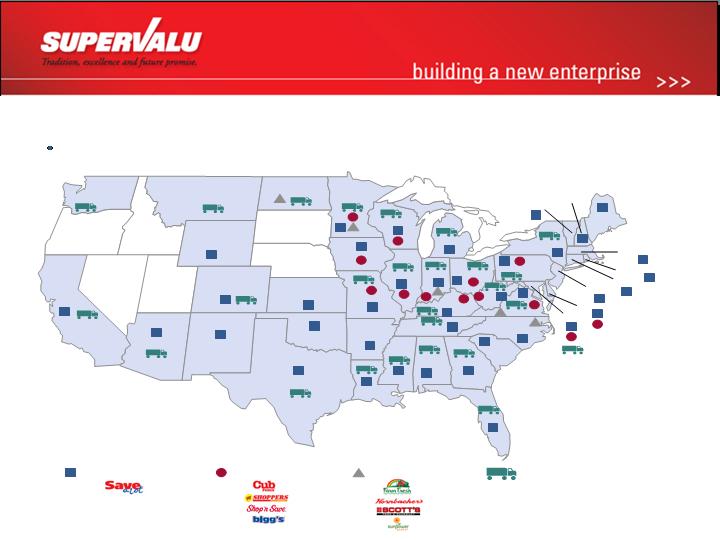
SUPERVALU’s Current Footprint
SUPERVALU has a retail or distribution presence in 42 states, and is predominately focused in the
East, Southeast and Midwest
(1)
Includes 27 TLC owned or managed
facilities
Supermarkets
Extreme Value Stores
Price Superstores
Supply Chain Services/
Distribution Centers (1)
Texas
New Mexico
Colorado
Wyoming
Montana
Idaho
California
Arizona
Nevada
Utah
Washington
Oregon
North Dakota
South Dakota
Nebraska
Kansas
Oklahoma
Arkansas
Missouri
Iowa
Minnesota
Michigan
Wisconsin
Illinois
Indiana
Ohio
Pennsylvania
New York
Kentucky
Tennessee
Louisiana
Mississippi
Alabama
Georgia
Florida
Maine
South
Carolina
North Carolina
Virginia
West
Virginia
Massachusetts
New Hampshire
Vermont
Connecticut
New Jersey
Delaware
Maryland
Rhode Island
18
23
15
5
6
1
89
31
64
20
48
1
19
7
3
7
117
1
18
20
39
12
92
62
1
22
53
22
9
43
4
105
16
18
55
13
3
9
103
1
19
22
40
39
17
7
3
2
1
3
3
1
2
2
5
6
3
2
1
1
4
3
1
4
2
1
8
2
2
9
7
2
14
1
2
37
1
17
1
3
1
1
1
17

Retail Store Footprint To Be Acquired
Banners
Combination / Conventional
Stores
85
55
Oregon
Washington
Montana
Idaho
Utah
Arizona
New Mexico
Colorado
North Dakota
South Dakota
Nebraska
Kansas
Missouri
Oklahoma
Texas
Arkansas
Louisiana
Iowa
Minnesota
Wisconsin
Illinois
Indiana
Ohio
Michigan
Kentucky
Tennessee
Mississippi
Alabama
Georgia
South
Carolina
North Carolina
Virginia
West
Virginia
Pennsylvania
New York
Vermont
Maine
New
Hampshire
Massachusetts
Rhode Island
Connecticut
New Jersey
Delaware
Maryland
Florida
43
34
47
1
1
2
1
15
178
6
53
18
23
35
94
16
25
61
12
8
32
280
California
Nevada
Northwestern /
Intermountain
Southern
California
Wyoming
2
1,124 Locations in 24 States
18

Proforma Operations Footprint of The New SUPERVALU
Supermarkets
Supply Chain Services/
Distribution Centers (1)
Supermarkets
Price Superstores
Extreme Value Stores
SUPERVALU
New Banners
Texas
New Mexico
Colorado
Wyoming
Montana
Idaho
California
Arizona
Nevada
Utah
Washington
Oregon
North Dakota
South Dakota
Nebraska
Kansas
Oklahoma
Arkansas
Missouri
Iowa
Minnesota
Michigan
Wisconsin
Illinois
Indiana
Ohio
Pennsylvania
New York
Kentucky
Tennessee
Louisiana
Mississippi
Alabama
Georgia
Florida
Maine
South
Carolina
North Carolina
Virginia
West
Virginia
Massachusetts
New Hampshire
Vermont
Connecticut
New Jersey
Delaware
Maryland
Rhode Island
18
23
15
5
6
1
89
31
64
48
1
19
7
3
7
117
1
18
20
39
12
92
62
1
22
53
22
9
43
4
105
16
18
55
13
3
9
103
1
19
22
40
39
17
7
3
2
1
3
3
1
2
2
5
8
3
2
1
1
5
3
1
6
1
2
1
8
2
2
9
7
2
14
1
2
37
1
17
1
280
55
85
34
43
47
32
2
178
15
6
1
2
61
53
94
16
25
35
18
12
8
22
1
1
3
1
1
1
1
1
1
1
(1)
Includes 27 TLC owned or managed
facilities
Northwestern /
Intermountain
Southern California
2,500+ Locations in 48 States…National Retail Powerhouse
19

Las Vegas
# 1 Market Share
Southern Cal.
# 1 or # 2
Market Share
Mpls. / St. Paul
# 1 Market Share
Chicago
# 1 Market Share
Boston / New
England
# 2 Market Share
Philadelphia
# 1 Market Share
St. Louis
# 2 Market Share
Washington
D.C. / Baltimore
# 3 Market Share
Leading Positions in Large and Growing Markets
Boise
# 1 Market Share
Virginia Beach /
Norfolk
# 2 Market Share
Los Angeles
#3 Market Share
20
Strong Positioning: 73% of Revenues
from #1 or #2 Market Positions
Safeway, Kroger
San Diego, Ventura, CA
Kroger, Wal-Mart
Salt Lake City/Ogden, UT
Kroger
#1
Las Vegas, NV
#3
#3
#3
#2
#2
#2
#2
#2
#2
#1
#1
#1
#1
#1
#1
#1
Share Rank
Sun Mart
Fargo, ND
Banner
Giant, Safeway
Washington, D.C./ Baltimore, MD
Safeway, Rosauers
Spokane, WA
Stop & Shop, Demoulas
Boston, MA-NH
Kroger, Meijer
Cincinnati, OH
Dominick’s
Chicago, IL
Wal-Mart
Billings, MT and Boise, ID
Stater Bros., Kroger
Riverside-San Bern., CA
Kroger
Orange County, CA
Safeway, Qual. Food Cent. / Fred Meyer
Seattle-Bellevue-Everett / Tacoma, WA
Schnuck’s, Dierberg’s
St. Louis, MO
Kroger, Safeway
Los Angeles-Long Beach, CA
Food Lion, Wal-Mart
Norfolk/Virginia Beach, VA
Kroger
Rainbow
Genuardi
Primary Competition
Fort Wayne, IN
Minneapolis – St. Paul, MN
Philadelphia, PA-NJ
MSA Markets
21

Advantages of Our Expanded Retail Portfolio
High-end Gourmet
Price Impact
Traditional Full
Service
Fuel / Convenience
Natural & Organic
Extreme Value
Formats
Strong geographic footprint, excellent market shares
combined with our collective competencies offer
tremendous opportunities
Increased Purchasing
Power
World Class Supply
Chain Backbone
Local Merchandising
Expertise
Expanded Market
Intelligence
Expanded Pharmacy
Footprint
Increased Fuel Program
Successful Licensee
Formula
Expanded Private Label
Offering
Competencies
Scalable and
Highly
Effective
Competitive
Retail Model
+
=
22

Investing in Strong and Growing Markets
Combined capital spending is $1.1B
To be allocated heavily toward remodeling
and expanding store network
Remodeling
Strong commitment to well-maintained,
contemporary store fleet
85% of SUPERVALU’s current fleet is new
or newly remodeled within past seven
years
Investing in key markets
Acquired Albertsons properties reflect the
company’s premier operations
Commitment to strengthening these key
market share positions
23

Everyone’s Favorite Question: What About Wal-Mart
States with the most
Wal-Mart stores
Texas 415
Florida 224
California 194
Illinois 158
Ohio 151
Pennsylvania 139
Georgia �� 137
Missouri 132
North Carolina 130
Tennessee 119
Source: http://www.walmartfacts.com, 2/1/06
High Share States
Low Share States
Total U.S. - All Outlets 52 w/e 12/25/04 - Wal-Mart banners only
Med Share States
Expansion States
24

Stacking up against Wal-Mart
Not Significant
Not Significant
WMT
2.2%
1.8%
WMT
23.3%
20.9%
Acme
Philadelphia
1.1%
0.7%
WMT
12.2%
12.3%
Albertsons
Los Angeles
WMT
Albertsons
Jewel
WMT
Shop’n Save
WMT
Farm Fresh
Chain
Trend
2005
2003
Market
18.1%
25.8%
36.6%
10.8%
20.9%
22.6%
19.1%
27.6%
Las Vegas
21.1%
St. Louis
18.4%
23.4%
43.9%
11.9%
21.8%
Chicago
Va. Beach
Market Share
Source: Trade Dimensions: 2003 and 2005 Market Scope
25
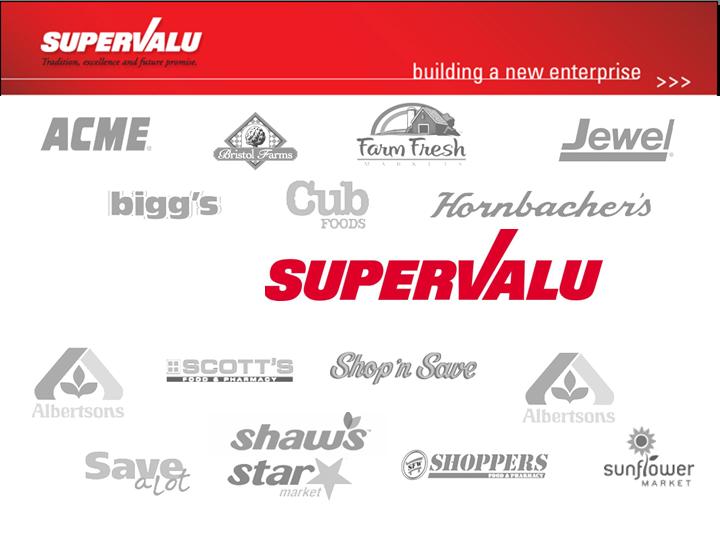
Creating a New Enterprise
Bringing two powerful
organizations together
In-market focus shared by
Albertsons and SUPERVALU
Preserving local focus and
customer experience is a
strategic key
Rich set of competencies at
both companies to leverage
the new enterprise
Planned and thoughtful
transition effort underway
Unlock the Value in the Combined Enterprise
26
Enterprise Building Framework
Collaborative, Thoughtful and Swift Process
Prepare
Transition
Plan
Implement
Plan
Capture
Initial
Synergies
Execute
Growth Plan
Track &
Validate
Post Close
Pre-Close
Enterprise Executive Lead:
Mike Jackson, SUPERVALU President and COO
27
Pamela Knous
Executive Vice President and Chief Financial Officer
Creating a New SUPERVALU
28
Transaction Progress
Preliminary proxy filed March 13
Debt syndication in process
Transaction moving forward
SUPERVALU’s 4th quarter available mid-April
ABS 10-K available in March; SVU 10K available late April
Plan to close in early summer
Process is moving along well
29
Key Transaction Highlights
SUPERVALU, CVS and Cerberus–led investment group to acquire
Albertsons for $17.4 billion in cash, stock and assumption of debt.
Assumes settlement of HITS.
Simultaneous transaction
Whereby sale of “standalone drug” to CVS and “non-core” properties to Cerberus
generates cash proceeds of $3.9B and $0.4B respectively. SUPERVALU to provide
temporary transition support services to both parties.
SUPERVALU’s consideration equals approximately $12.4B
HITS settle with transaction: $3.8B in cash, $2.5B in stock, $6.1B assumption of
debt. TOTAL: $12.4B
HITS settle 5/07: $4.1B in cash, $2.2B in stock, $6.1B assumption of debt. TOTAL:
$12.4B
EBITDA multiple of 7.0X
Newly capitalized company will be formed, comprised of:
SVU shareholders – approximately 65%
ABS shareholders – approximately 35%
SUPERVALU will continue to pay dividends
30

The New SUPERVALU Provides:
Broad-based Future Growth Potential and Immediate Diluted
Earnings Per Share Accretion on Annualized Basis
Excluding One-Time Costs
Expect transaction to be immediately double-digit accretive
when excluding one-time transaction costs
Proforma FY’06 EBITDA margins increase 140 basis points
from 4.8% to 6.2% through combination.
EBITDA margins expected to increase by additional 30 - 40
basis points to 6.5% - 6.6% after combined entity synergies
of $150-175 million realized.
31

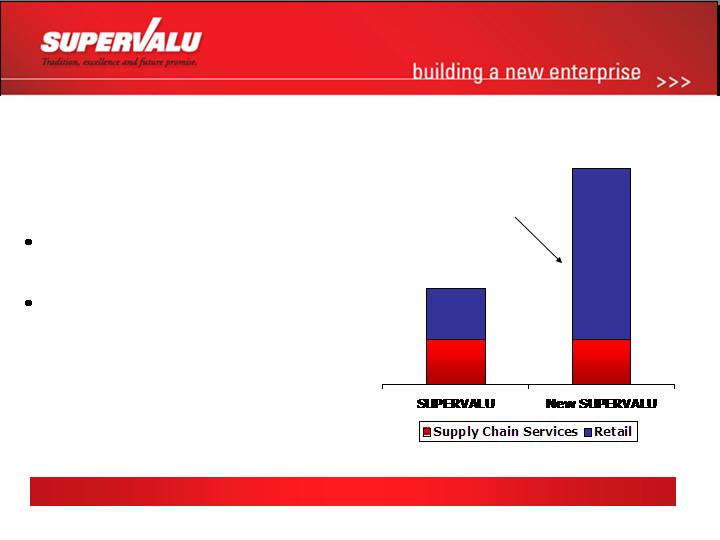
Scale, Improved Retail EBITDA Mix Enhances Business Model
($ Billions)
$19
$44
47%
53%
20%
80%
$0.9
$2.7
33%
67%
11%
89%
Sales
EBITDA
SVU figures represent First Call estimates, ABS figures represent management estimates
EBITDA Margin
4.8%
6.2%
6.5%
to
6.6%
32

Anticipated Synergies Breakdown
Expect Synergies to be Realized by the End of the Third Full Year
$150 - $175 million
Total Pretax Synergies
$25 - $30 million
Supply Chain Optimization
$50 - $60 million
Corporate Synergies
$75 - $85 million
Retail Leverage and Efficiencies
33

Illustrative EPS Accretion reflecting preliminary purchase
accounting treatment
$44 B
$44 B
$25* B
$19 B
Sales
+30%
+12%
Accretion
223
$2.92
$654
1,072
(1,018)
(760)
150
$2,700
Combined
with
Synergies
$2.51
$2.24
EPS
$ in million except EPS
223
77
146
Share Count Fully Diluted
$562
$242
$320
Net Income
922
414
508
Pretax
(1,018)
(706)
(312)
Depreciation/Amortization
(760)
(645)
(115)
Net Interest Expense
Synergies
$2,700
$1,765*
$935
EBITDA
Combined
w/o
Synergies
Combination
Adjustments
SUPERVALU
F’06E
First Call
*Represents Albertsons management estimates for Fiscal 2006. SVU First Call data for F06 does not reflect
impact of Hurricane, Pittsburgh exit, sale of Chicago stores, impairment related to announced sale of Deals,
and third quarter transaction costs. Combined data excludes one time transaction costs.
34

Comparison Illustrative EPS Accretion: Jan 23 to March 13*
$44 B
$44 B
$44 B
$44 B
Sales*
+30%
+12%
+35%
+17%
Accretion
223
$2.92
$654
1,072
(1,018)
(760)
150
$2,700
Combined
with
Synergies
$2.51
$3.02
$2.61
EPS
As presented January 23 As presented in proxy March 13
223
224
224
Share Count Fully Diluted
$562
$677
$585
Net Income
922
1,110
960
Pretax
(1,018)
(995)
(995)
Depreciation/Amortization
(760)
(745)
(745)
Net Interest Expense
150
Synergies
$2,700
$2,700
$2,700
EBITDA*
Combined
w/o
Synergies
Combined
with Synergies
Combined
w/o
Synergies
* Represents Albertsons management estimates for Fiscal 2006. SVU First Call data for F06 does not reflect
impact of Hurricane, Pittsburgh exit, sale of Chicago stores, impairment related to announced sale of Deals,
and third quarter transaction costs. Combined data excludes one time transaction costs.
35
Illustrative Combined Free Cash Flow
(Excluding One-Time Transaction Costs)
$ in million
540
371
169
Free Cash Flow
(925)
(550)
(375)
Cash Capital Expenditures
(150)
(62)
(88)
Dividends
(360)
(172)
(188)
Income Taxes
(725)
(610)
(115)
Interest (cash)
2,700
1,765*
935
EBITDA
Combined
Combination
Adjustments
SUPERVALU
F’06E
First Call
* EBITDA represents Albertsons management estimates for Fiscal 2006
36
Retail Capital Spending – Supporting Retail Growth
Fiscal 2006 Projected Retail Capital Expenditure
as % of Projected Retail Sales Compared to our Peers*
2.9%
3.8%
2.75%
*Based on First Call data
A Safeway’s figures represent cash cap ex as % of sales
37
Investing in our Future
Sufficient Capital Dollars to Grow and Support Store Network
Capital Spending
Committed to new stores
and remodels
Retail capital budget as % of
$34 B of retail revenues is 2.9%
Sales
$1.0 Billion
of capital
allocated to
retail
operations
38

Debt/EBITDA
Illustrative Combined Leverage
$ in million
3.6
4.6
1.8
Debt/EBITDA
2,700
1,765
935
EBITDA
9,718
8,035
1,683
Debt
Combined
Combination
Adjustments
SUPERVALU
FY’06 E
EBITDA represents SUPERVALU First Call and Albertsons management estimates for Fiscal 2006
39

Analysis of Sources
assuming HITS settle in conjunction with transaction
SVU Debt
Beginning debt $1.6 B
Assumed debt $6.1
New borrowings $2.0
Total $9.7
Sources
SVU new facility $2.0 B
SVU cash $0.6
ABS cash $0.3
Drug proceeds $3.9
Noncore proceeds $1.0
HITS $1.1
Expenses/Other ($0.3)
Total $8.6 B
Cash Required
424 million shares @$20.35 = $8.6 Billion
40
We Are Committed to Investment Grade and ROIC Improvement
Resetting the Clock on 2 Key Metrics
Strong Operating Discipline will Support Progress on
Important Benchmarks
ROIC
Committed to return to 15% ROIC
Proven track-record of delivering
returns in a variety of market
conditions
Disciplined asset management and
capital allocation
Debt to Capital Ratio
Committed to return to investment
grade
Proven track-record of debt reduction
Strong cash flow business model
Debt-to-Capital is calculated as debt, which includes notes payable, current debt, current obligations under capital leases, long-term debt
and long-term obligations under capital leases, divided by the sum of debt and stockholders’ equity. ROIC is defined as earnings before
interest and taxes (EBIT) divided by a five-quarter average invested capital, which is defined as total debt plus equity.
41

Proxy Related Disclosures
Proforma data reflects last full fiscal year and YTD third quarter
actuals
SVU – 52 weeks ended Feb 26, 2005; 40 weeks ending Dec 3, 2005
ABS – 53 weeks ended Feb 3, 2005; 39 weeks ending Nov 3, 2005
Proforma income statement data requires use of historical data
to create a depiction of the transaction as if it occurred on Feb
29, 2004
Historical data reflects Albertsons’ slow recovery from labor dispute in So.
California, SUPERVALU sale of Winco, impact of Pittsburgh and Chicago exit
Proforma balance sheet requires use of historical data to create
a depiction of transaction as if it occurred on December 3, 2005
Use of 12/3 balance sheet data necessitates utilizing cash and debt
balances to close transaction at that point in time
42

Proxy Related Disclosures
Preliminary purchase accounting estimates reflected
Significant items include: write up of pp&e to fair value, analysis of
goodwill and other intangibles, long term debt fair value adjustments,
conforming accounting policies. Also reflects transaction specifics: cash
paid, debt assumed, elimination of historical ABS equity, etc.
Neither synergies or one-time transaction costs are included
in the proforma financial statements
One-time transaction costs now estimated at $145 million which includes
retention bonuses, upfront costs to achieve synergies, consultant fees,
transfer taxes, and filing fees, etc.
Economics of transition services agreement reflected
43
Transition Services Agreement
CVS DRUG
CERBERUS
NEW SUPERVALU
2 year term
Fixed + variable payments
Allows for lower payments as store
support needs decline
6 month term
Fixed payment
Transition services agreement structure provides for
reimbursement of costs associated
with supporting Cerberus and CVS during transition period
44

Transition Services Agreement
Proforma financial statements for twelve months F05 and third-quarter YTD F06
results reflect cost reimbursement payments of $193 million and $127 million,
respectively for transition services.
Reimbursement amounts per agreement are based on current run rate of
expenses which are lower than amounts in the historical financial statements
included in the proforma financial statements.
Proforma presentation of cost reimbursement for transition services agreement
is separately identified as a proforma adjustment.
SVU will eliminate the costs of support for non core and stand alone drug as
transition service requirements decline.
Cost reductions from the elimination of corporate administrative costs related to
support of noncore and stand alone drug are not a component of synergies
identified by management.
45
Conditions for Acquisition Approval
File preliminary proxy
March ’06
File Hart-Scott-Rodino (HSR)
February ‘06
On
Track
Close
By Early Summer ’06
On
Track
Gain shareholder approval
By Early summer ’06
Both SUPERVALU and Albertsons boards of
directors recommend shareholder approval
January ‘06
Secure bank financing
December ‘05
Status
Action
Date
46
Summary – Enhancing Shareholder Value
Synergies, scale and a national retail portfolio will support
sustainable retail success
Strong cash flow: financial strength to invest in fleet and
aggressively reduce debt
More profitable business model – nearly 90% of Company’s
EBITDA will be in the higher-growth retail segment
Provides Albertsons shareholders with residual equity in the
New SUPERVALU.
47

No. 2 grocery retailer in the nation, with
The industry’s best regional nameplates
A broad-based future growth potential
The right formula for sustainable grocery retail
success
Forging the Future of Grocery Retailing
Unlocking the Value in the New SUPERVALU
48
THE NEW
Northwestern /
Intermountain
Southern California
49
Appendix: Illustrative Combined Key Metrics
35
11
24
Distribution Facilities
878
722
156
In-store Pharmacies
117
107
10
Fuel Centers
2,505
1,124
1,381
Store Network*
194,000
144,000
50,000
Employees
65%
N/A
39%
Debt-to-Capital Ratio
Financial
Operational
$1.1B
$650M
$450M
Capital Spending
$2.7B
$1.77B
$0.9B
EBITDA
$43.7B
$24.4B
$19.3B
Revenue
New SUPERVALU
Business to be
Acquired
SUPERVALU
EBITDA is SUPERVALU’s First Call and Albertsons management estimates for Fiscal 2006. Store network
adjusted for sale of Pittsburgh and Chicago stores, and announced sale of Deals stores.
50