UNITED STATES
SECURITIES AND EXCHANGE COMMISSION
WASHINGTON, D.C. 20549
FORM 10-K
x ANNUAL REPORT PURSUANT TO SECTION 13 OR 15(d) OF THE SECURITIES EXCHANGE ACT OF 1934
For the fiscal year ended December 30, 2007
OR
¨ TRANSITION REPORT PURSUANT TO SECTION 13 OR 15(d) OF THE SECURITIES EXCHANGE ACT OF 1934
For the transition period from _________ to _________
| | |
Commission file number 1-6615 |
| | |
| SUPERIOR INDUSTRIES INTERNATIONAL, INC. |
| |
| (Exact Name of Registrant as Specified in Its Charter) |
| | |
| California | 95-2594729 |
| (State or Other Jurisdiction of | (IRS Employer |
| Incorporation or Organization) | Identification No.) |
| | |
| 7800 Woodley Avenue, Van Nuys, California | 91406 |
| (Address of Principal Executive Offices) | (Zip Code) |
| | |
Registrant’s Telephone Number, Including Area Code: (818) 781-4973 |
| |
| Securities registered pursuant to Section 12(b) of the Act: |
| | |
| Title Of Each Class | Name Of Each Exchange On Which Registered |
| Common Stock, $0.50 par value | New York Stock Exchange |
| | |
| Securities registered pursuant to Section 12(g) of the Act: None |
Indicate by check mark if the registrant is a well-known seasoned issuer, as defined in Rule 405 of the Securities Act.
Indicate by check mark if the registrant is not required to file reports pursuant to Section 13 or Section 15(d) of the Act.
Indicate by check mark whether the registrant: (1) has filed all reports required to be filed by Section 13 or 15(d) of the Securities Exchange Act of 1934 during the preceding 12 months (or for such shorter period that the registrant was required to file such reports), and (2) has been subject to such filing requirements for the past 90 days.
Indicate by check mark if the disclosure of delinquent filers pursuant to Item 405 of Regulation S-K is not contained herein, and will not be contained, to the best of the registrant’s knowledge, in definitive proxy or information statements incorporated by reference in Part III of this Form 10-K or any amendment to this Form 10-K. [ ]
Indicate by check mark whether the registrant is a large accelerated filer, an accelerated filer, a non-accelerated filer, or a smaller reporting company. See the definitions of “large accelerated filer”, “accelerated filer” and “smaller reporting company” in Rule 12b-2 of the Exchange Act.
| Large accelerated filer | ¨ | Accelerated filer | x | Non-accelerated filer | ¨ | Smaller reporting company | ¨ |
Indicate by check mark whether the registrant is a shell company (as defined in Rule 12b-2 of the Exchange Act).
The aggregate market value of the registrant’s $0.50 per share par value common equity held by non-affiliates as of the last business day of the registrant’s most recently completed second quarter was $579,081,000, based on a closing price of $21.76. On March 14, 2008, there were 26,639,190 shares of common stock issued and outstanding.
DOCUMENTS INCORPORATED BY REFERENCE
Portions of the registrant’s 2008 Annual Proxy Statement, to be filed with the Securities and Exchange Commission within 120 days after the close of the registrant’s fiscal year, are incorporated by reference into Part III of this Form 10-K.
SUPERIOR INDUSTRIES INTERNATIONAL, INC. ANNUAL REPORT ON FORM 10-K
TABLE OF CONTENTS
| | | PAGE |
| | | | 1 |
| | | | 5 |
| | | | 10 |
| | | | 10 |
| | | | 11 |
| | | | 12 |
| | | | | 12 |
| | | | | |
| | | | |
| | | | |
| | | | | 14 |
| | | | 15 |
| | | | |
| | | | | 22 |
| | | | 33 |
| | | | 34 |
| | | | |
| | | | | 73 |
| | | | 74 |
| | | | 75 |
| | | | | |
| | | | |
| | | | 76 |
| | | | 76 |
| | | | |
| | | | | 76 |
| | | | 76 |
| | | | 76 |
| | | | | |
| | | | |
| | | | 77 |
| | | | | |
| | | |
| | | | | |
Forward-Looking Statements
The Private Securities Litigation Reform Act of 1995 provides a safe harbor for forward-looking statements made by us or on our behalf. We may from time to time make written or oral statements that are “forward-looking”, within the meaning of Section 27A of the Securities Act of 1933, as amended, and Section 21E of the Securities and Exchange Act of 1934, as amended, including statements contained in this report and other filings with the Securities and Exchange Commission and reports and other public statements to our shareholders. These statements may, for example, express expectations or projections about future actions or results that we may anticipate but, due to developments beyond our control, do not materialize. Actual results could differ materially because of issues and uncertainties such as those listed herein, which, among others, should be considered in evaluating our financial outlook. The principal factors that could cause our actual performance and future events and actions to differ materially from such forward-looking statements include, but are not limited to, changes in the automotive industry, increased global competitive pressures, our dependence on major customers and third party suppliers and manufacturers, our exposure to foreign currency fluctuations, and other factors or conditions described in Item 1A – Risk Factors section of this Annual Report on Form 10-K. We assume no obligation to update publicly any forward-looking statements.
EXPLANATORY NOTE REGARDING RESTATEMENTS
During the preparation and review of our 2007 income tax provision, we discovered that we had not properly reconciled our tax liabilities related to differences between the net book basis and the net tax basis of our depreciable property, plant and equipment and several other miscellaneous deferred tax liabilities. As a result of completing the necessary reconciliations for each year since 2002, we identified errors that impacted our previously filed financial statements for the fiscal years 2003 through 2006 and our previously filed interim financial statements for those years related to our tax liabilities and our income tax provisions.
During the fourth quarter of 2007, we determined the cumulative impact of known differences in our accounting for our equity method investment in Suoftec Light Metal Products Production and Distribution Ltd. (Suoftec) and our summary financial information presented for Suoftec, which we considered to be immaterial to any individual reporting period, required restatement. The errors relate to the quantification and recording of the adjustments to report the Suoftec earnings on the basis of U.S. GAAP versus on the Hungarian accounting rules followed by Suoftec. These differences principally relate to overhead cost capitalization into inventory and deferred income taxes on property, plant and equipment.
In accordance with the provisions of Statement of Financial Accounting Standards (SFAS) No. 154, “Accounting Changes and Error Corrections” (SFAS No. 154), we have restated, to the earliest period practical, our previously filed financial statements. See Item 6 – Selected Financial Data in Part I of this Annual Report on Form 10-K, for the effect of the restatements on fiscal years 2003 and 2004, Note 2 – Restatement of Consolidated Financial Statements in Notes to Consolidated Financial Statements in Item 8 – Financial Statements and Supplementary Data of this Annual Report on Form 10-K, for the effect of the restatements on fiscal years 2005 and 2006, and Exhibit 99.1 for the effect of the restatements on the interim consolidated condensed financial information for the first three quarters of fiscal year 2007 and all four quarters of fiscal year 2006. We have not amended and do not intend to amend any of our previously filed Annual Reports on Form 10-K or Quarterly Reports on Form 10-Q for the periods affected by these restatements.
We have reported a material weakness in our internal control over financial reporting, in this 2007 Annual Report on Form 10-K relating to corrections to our income tax provisions and deferred tax liabilities included in previously filed financial statements, and as such have concluded that our internal control over financial reporting was not effective as of December 30, 2007. See Item 9A – Controls and Procedures in Part II of this Annual Report on Form 10-K for further discussion regarding this material weakness.
General Development and Description of Business
Headquartered in Van Nuys, California, the principal business of Superior Industries International, Inc. (referred to herein as the “company” or in the first person notation “we,” “us” and “our”) is the design and manufacture of aluminum road wheels for sale to original equipment manufacturers (OEM). We are one of the largest suppliers of cast and forged aluminum wheels to the world’s leading automobile and light truck manufacturers, with wheel manufacturing operations in the United States, Mexico and Hungary. Customers in North America represent the principal market for our products, with approximately 19 percent of our unit shipments to international customers by our North American facilities, primarily delivered to their assembly operations in the United States.
The company was initially incorporated in Delaware in 1969 and reincorporated in California in 1994, as the successor to three businesses founded by Louis L. Borick, Founding Chairman and a Director of the company. These businesses had been engaged in the design, manufacture and sale of principally automotive accessories and related aftermarket products since 1957.
Aluminum Road Wheels - Our entry into the OEM aluminum road wheel business in 1973 resulted from our successful development of manufacturing technology, quality control and quality assurance techniques that enabled us to satisfy the quality and volume requirements of the OEM market. Initial production of an aluminum road wheel for a domestic customer was a Mustang wheel for Ford Motor Company (Ford). In 1990, we formed a sales and marketing joint venture, Topy-Superior Limited (TSL), with Topy Industries, Limited (Topy), Japan's largest wheel manufacturer. TSL markets our wheels to Japanese OEM customers with plants in Japan and in the United States. In 2007, TSL had agreements to provide 34 wheel programs being manufactured in our facilities for delivery to Japanese customers.
As part of our strategy to reduce costs, the company has located facilities in low labor cost regions of the world. In 1994, we built our first facility in Chihuahua, Mexico. Subsequently, another facility was built nearby and began operations at the end of 2001. A third facility was completed and began operations at the end of 2006. These facilities set the standard for state-of-the art worldwide cast aluminum wheel making and are optimized for production of larger diameter wheels. In addition, we completed the planned closure of our wheel manufacturing facility located in Johnson City, Tennessee, at the end of the first quarter of 2007. This was the latest step in our program to rationalize our production capacity and reduce costs.
Also in 1994, in response to the steadily growing popularity of chrome-plated aluminum wheels and to provide capacity due to increased customer demand, we completed construction of a wheel plating facility. We were the first OEM aluminum wheel manufacturer to develop this in-house capability and the operation was one of the largest of its kind in the world. In 1998, we added a polishing operation for aluminum wheels to this facility. Due to a recent shift in the market for chromed wheels to a less expensive chrome finishing process, the sales forecasts for our chromed wheels declined significantly. Accordingly, on December 1, 2005, we estimated that we would not be able to recover the carrying value of certain machinery and equipment in our chrome plating operation. Accordingly, such assets were written down to their estimated fair value and we recorded an asset impairment and other charges totaling approximately $9.2 million. In the third quarter of 2006, all of our chrome-plating requirements were outsourced to a third party supplier and we ceased operations of our chrome finishing operation.
In 1995, we entered into a 50-50 joint venture, Suoftec Light Metal Products Production & Distribution Ltd. (Suoftec), with Germany-based Otto Fuchs Metallwerke (Otto Fuchs) to establish a European manufacturing facility. The joint venture produces both lightweight forged and cast aluminum wheels for sale to OEM customers, principally in Europe. Shipments of forged and cast wheels began in 1997 and 1998, respectively, from our facility located in Tatabanya, Hungary. This venture established our commitment to enter the European market and introduced new wheel making technology to both the European and U.S. markets. In 1998, we completed an initial expansion of the cast aluminum production facility, which doubled its original casting capacity. Following a second expansion of the cast aluminum operations in 2002, the facility’s total capacity has increased to approximately 2.5 million wheels per year.
Aluminum Suspension Components - In 1999, we began to manufacture aluminum suspension and related underbody components using the licensed Cobapressä technology, which was another step toward expanding our sales to the OEM market. At the time, this diversification of our business emphasized the commitment to our long-term strategy to broaden our domestic and international OEM customer base and to expand our product lines into complementary areas, which utilize our design and manufacturing expertise. However, this strategy had not produced sufficient results to warrant the diversion of our attention away from our core business. Consequently, on September 24, 2006, we sold substantially all of the assets and working capital of the aluminum suspension components business to St. Jean Industries, SAS, from whom we licensed the Cobapressä technology, for $17.0 million. See Note 17 – Discontinued Operations in Notes to Consolidated Financial Statements in Item 8 – Financial Statements and Supplementary Data in this Annual Report on Form 10-K for further discussion.
Fiscal Year End
Our fiscal year is the 52- or 53-week period ending on the last Sunday of the calendar year. The fiscal year 2007 comprised the 52-week period ended December 30, 2007. The fiscal year 2006 comprised the 53-week period ended December 31, 2006. The fiscal years 2005, 2004 and 2003 comprised the 52-week periods ended December 25, 2005, December 26, 2004 and December 28, 2003, respectively. For convenience of presentation, all fiscal years are referred to as beginning as of January 1 and ending as of December 31, but actually reflect our financial position and results of operations for the periods described above.
Principal Products
Our OEM aluminum road wheels, including shipments from our 50 percent owned joint venture in Hungary, are sold for factory installation, or as optional or standard equipment on many vehicle models, to Ford, General Motors, Chrysler, Audi, BMW, Fiat, Jaguar, Land Rover, Mazda, Mercedes Benz, Mitsubishi, Nissan, Seat, Skoda, Subaru, Suzuki, Toyota, Volkswagen and Volvo. We currently supply cast and forged aluminum wheels for many North American model passenger cars and light trucks.
Customer Dependence
We have proven our ability to be a consistent producer of quality aluminum wheels with the capability of quickly expanding production capacity to meet increasing customer demand. We strive to continually enhance our relationships with our customers through continuous improvement programs, not only through our manufacturing operations but in the engineering, program development and quality areas, as well. These key business relationships have resulted in multiple vehicle supply contract awards with key customers over the past year.
Ford, GM and Chrysler LLC were the only customers accounting for more than 10 percent of our consolidated net sales in 2007. Sales to GM, as a percentage of consolidated net sales, were 36 percent in 2007, and 37 percent in 2006 and 2005. Sales to Ford, as a percentage of consolidated net sales, were 33 percent in 2007, 34 percent in 2006 and 33 percent in 2005. Sales to Chrysler LLC, as a percentage of consolidated net sales, were 13 percent in 2007, and 15 percent in 2006 and 2005.
The loss of all or a substantial portion of our sales to Ford, GM or Chrysler LLC would have a significant adverse effect on our financial results, unless the lost sales volume could be replaced. However, this risk is partially offset in part by the numerous multi-year purchase orders for wheel programs with these customers. We have had excellent long-term relationships, including contractual arrangements that are in place, with our other customers. However, intense global competitive pricing pressure continues to make it difficult to maintain these contractual arrangements, and we expect this trend to continue into the future.
Net Sales Backlog
We receive OEM purchase orders to produce aluminum road wheels and component parts typically for multiple model years. These purchase orders are for vehicle wheel programs that can last three to five years. However, customers can impose competitive pricing provisions in those purchase orders each year, thereby reducing our profit margins or increasing the risk of our losing future sales under those purchase orders. We manufacture and ship based on customer release schedules, normally provided on a weekly basis, which can vary due to cyclical automobile production or high dealer inventory levels. Accordingly, even though we have purchase orders covering multiple model years, weekly release schedules can vary with customer demand, thus firm backlog is insignificant.
Seasonal Variations
The automotive industry is cyclical and varies based on the timing of consumer purchases of vehicles, which in turn vary based on a variety of factors such as general economic conditions, interest rates and fuel costs. While there have been no significant seasonal variations in the past few years, production schedules in our industry can vary significantly from quarter to quarter to meet the scheduling demands of our customers. During the past few years, there have been no significant consistent seasonal variations.
Raw Materials
We purchase substantial quantities of aluminum for the manufacture of our aluminum road wheels, which accounted for approximately all of our total raw material requirements during 2007. The majority of our aluminum requirements are met through purchase orders with several major domestic and foreign producers. Generally, the orders are fixed as to minimum and maximum quantities of aluminum, which the producers must supply during the term of the orders. During 2007, we were able to successfully secure aluminum commitments from our primary suppliers to meet production requirements and we are not anticipating any problems with our aluminum requirements for our expected level of production in 2008.
When market conditions warrant, we may also enter into contracts to purchase certain commodities used in the manufacture of our products, such as aluminum, natural gas, environmental emission credits and other raw materials. Any such commodity commitments are expected to be purchased and used over a reasonable period of time in the normal course of business. Accordingly, pursuant to Statement of Financial Accounting Standards (SFAS) No. 133, “Accounting for Derivative Instruments and Hedging Activities,” they are not accounted for as a derivative. We currently have several purchase agreements for the delivery of natural gas through 2008. The contract value and fair value of these purchase commitments approximated $11 million at December 31, 2007. As of December 31, 2006, the aggregate contract value and fair value of these commitments were $15 million and $12 million, respectively. Percentage changes in the market prices of natural gas will impact the fair value by a similar percentage. We do not hold or purchase any natural gas forward contracts for trading purposes.
We obtain our requirements for other materials through numerous suppliers with whom we have established trade relationships. When an outside supplier produces components for our products, we normally own or have the right to purchase the tools and dies located in the supplier's facilities or have developed alternative sources.
Patents and Licensing Agreements
We currently hold patents for eight of our inventions and one other patent is pending. We have a policy of applying for patents when new products or processes are developed. However, we believe our success is more dependent upon manufacturing and engineering skills and the quality and market acceptance of our products, than upon our ability to obtain and defend patents.
Research and Development
Our policy is to continuously review, improve and develop engineering capabilities so that customer requirements are met in the most efficient and cost effective manner available. We strive to achieve this objective by attracting and retaining top engineering talent and by maintaining the latest state-of-the-art computer technology to support engineering development. Two fully staffed engineering centers, located in Van Nuys, California, and Fayetteville, Arkansas, support our research and development manufacturing needs. We also have a technical center in Detroit, Michigan, that maintains a complement of engineering staff centrally located near our largest customers’ headquarters, engineering and purchasing offices. Research and development costs (primarily engineering and related costs), which are expensed as incurred, are included in cost of sales in the consolidated statements of operations. Amounts expended during each of the three years were $6.3 million in 2007, $6.8 million in 2006 and $9.6 million in 2005.
Government Regulation
Safety standards in the manufacture of vehicles and automotive equipment have been established under the National Traffic and Motor Vehicle Safety Act of 1966. We believe that we are in compliance with all federal standards currently applicable to OEM suppliers and to automotive manufacturers.
Environmental Compliance
Our manufacturing facilities, like most other manufacturing companies, are subject to solid waste, water and air pollution control standards mandated by federal, state and local laws. Violators of these laws are subject to fines and, in extreme cases, plant closure. We believe our facilities are substantially in compliance with all standards presently applicable. However, costs related to environmental protection may continue to grow due to increasingly stringent laws and regulations and our ongoing commitment to rigorous internal standards. The cost of environmental compliance was approximately $1.3 million in 2007, $1.7 million in 2006 and $3.4 million in 2005. We expect that future environmental compliance expenditures will approximate these levels and will not have a material effect on our consolidated financial position.
Competition
The market for aluminum road wheels is highly competitive based primarily on price, technology, quality, delivery and overall customer service. We are one of the leading suppliers of aluminum road wheels for OEM installations in the world. We supply approximately 30 to 35 percent of the aluminum wheels installed on passenger cars and light trucks in North America. Competition is global in nature with growing exports from Asia. There are several competitors with facilities in North America, none of which aggregate greater than 10 percent of the total. See additional comments concerning competition in Item 1A – Risk Factors below. For the model year 2006, according to Wards Auto Info Bank, an industry publication, aluminum wheel installation rates on passenger cars and light trucks produced in North America were unchanged at approximately 63 percent for the model years 2006 and 2005. While aluminum wheel installation rates have grown from only 10 percent in the mid-1980s, in recent years, this growth rate has slowed. We expect the trend of slow growth or no growth in installation rates to continue. Accordingly, we expect that our ability to grow in the future will be dependent upon increasing our share of the existing market. In addition, intense global pricing pressure may decrease profitability and could potentially result in the loss of business in the future.
Employees
As of December 31, 2007, we had approximately 5,300 full-time employees including our joint venture, Suoftec, compared to 5,700 and 6,700 at December 31, 2006 and 2005, respectively. Our joint venture manufacturing facility in Hungary employed 488 full-time employees at December 31, 2007. None of our employees are part of a collective bargaining agreement.
Financial Information About Geographic Areas
Financial information about geographic areas is contained in Note 3 – Business Segments in Notes to Consolidated Financial Statements in Item 8 – Financial Statements and Supplementary Data of this Annual Report on Form 10-K.
Available Information
Our Annual Report on Form 10-K, quarterly reports on Form 10-Q, current reports on Form 8-K, proxy and information statements, and any amendments thereto are available, without charge, on or through our website www.supind.com under “Investor”, as soon as reasonably practicable after they are filed electronically with the Securities and Exchange Commission (SEC). The public may read and copy any materials filed with the SEC at the SEC’s Public Reference Room at 450 Fifth Street, NW, Washington, DC 20549. Information on the operation of the Public Reference Room can be obtained by calling the SEC at 1-800-SEC-0330. The SEC also maintains a website, www.sec.gov, that contains these reports, proxy and other information regarding the company. Also included on our website, www.supind.com under Investors is our Code of Business Conduct and Ethics, which, among others, applies to our Chief Executive Officer, Chief Financial Officer and Chief Accounting Officer. Copies of all SEC filings and our Code of Business Conduct and Ethics are also available, without charge, from Superior Industries International, Inc., Shareholder Relations, 7800 Woodley Avenue, Van Nuys, CA 91406.
The following discussion of risk factors contains “forward-looking” statements, which may be important to understanding any statement in this Annual Report on Form 10-K or elsewhere. The following information should be read in conjunction with Item 7 - Management’s Discussion and Analysis of Financial Condition and Results of Operations (MD&A) and Item 8 – Financial Statements and Supplementary Data of this Annual Report on Form 10-K.
Our business routinely encounters and addresses risks, some of which will cause our future results to differ, sometimes materially, from those originally anticipated. Discussion about the important operational risks that our businesses encounter can be found in the MD&A section of this Annual Report on Form 10-K and in the business descriptions in Item 1 – Business of this Annual Report on Form 10-K. Below, we have described our present view of certain important strategic risks. Our reactions to material future developments as well as our competitors’ reactions to those developments will determine our future results.
Risks Relating To Our Company
Automotive Industry Trends - A significant portion of our sales are to domestic automotive OEMs, and therefore our financial performance depends, in large part, on conditions in the automotive industry, which, in turn, are dependent upon the U.S. and global economies generally. As a result, economic and other factors adversely affecting automotive production and consumer spending could adversely impact our business. A further weakening of the U.S. and global economies could adversely affect consumer spending, and result in decreased demand for automobiles and light trucks. If OEMs were to decrease production due to such reduced demand or union work stoppages, our financial performance could be adversely affected. In addition, relatively modest declines in our customers’ production levels could have a significant adverse impact on our profitability because we have substantial fixed production costs. Due to the present uncertainty in the economy, some of our OEM customers have been reducing their forecasts for new vehicle production. If actual production volume were to be reduced accordingly, our business would be adversely affected. Our sales are also impacted by our customers’ inventory levels and production schedules. If our OEM customers significantly reduce their inventory levels and reduce their orders from us, our performance would be adversely impacted. In this environment, we cannot predict future production rates or inventory levels or the underlying economic factors. Continued uncertainty and unexpected fluctuations may have a significant negative impact on our business.
Changing Nature of the Automotive Industry - In the automotive industry, there has been a trend toward consolidation. Continued consolidation of the automotive industry could adversely affect our business. Such consolidation could result in a loss of some of our present customers to our competitors and could thereby lead to reduced demand, which may have a significant negative impact on our business. Additionally, our major customers have been seeking ways to lower their own costs of manufacturing through increased use of internal manufacturing or through relocation of production to countries with lower production costs. This internal manufacturing or reliance on local or other foreign suppliers may have a significant negative impact on our business.
Global Pricing Pressure - We continue to experience increased competition in our domestic and international markets. Since some products are being shipped to the U.S. from Asia and elsewhere, many of our North American competitors have excess capacity and, in order to promote volume, are placing intense pricing pressure in our market place. These competitive pressures are expected to continue and may result in decreased sales volumes and unit price reductions, resulting in lower revenues, gross profit and operating income.
Additionally, cost-cutting initiatives adopted by our customers generally result in increased downward pressure on pricing. OEMs historically have had significant leverage over their outside suppliers because the automotive component supply industry is fragmented and serves a limited number of automotive OEMs, and, as such, Tier 1 suppliers are subject to substantial continued pressure from OEMs to reduce the price of their products. If we are unable to generate sufficient production cost savings in the future to offset price reductions, our gross margin and profitability would be adversely affected. In addition, changes in OEMs’ purchasing policies or payment practices could have an adverse effect on our business.
Cyclical Nature of Industry - Our principal operations are directly related to domestic and, to a lesser extent, foreign production of passenger cars and light trucks. Industry sales and production are cyclical and therefore can be affected by the strength of the economy generally, by consumer spending, or, in specific regions such as North America or Europe, by prevailing interest rates and by other factors, which may have an effect on the level of sales of new automobiles. Any decline in the demand for new automobiles could have a material adverse impact on our financial condition and results of operations.
Competition - The automotive component supply industry is highly competitive, both domestically and internationally. Competition is based primarily on price, technology, quality, delivery and overall customer service. Some of our competitors are companies, or divisions or subsidiaries of companies that are larger and have greater financial and other resources than we do. We cannot assure you that our products will be able to compete successfully with the products of these or other companies. Furthermore, the rapidly evolving nature of the markets in which we compete has attracted new entrants, particularly in low cost countries. As a result, our sales levels and margins are being adversely affected by pricing pressures caused by such new entrants, especially in low-cost foreign markets, such as China. Such new entrants with lower cost structures pose a significant threat to our ability to compete internationally and domestically. These factors led to selective sourcing of future business by our customers to foreign competitors in the past and they may continue to do so in the future. In addition, any of our competitors may foresee the course of market development more accurately than us, develop products that are superior to our products, have the ability to produce similar products at a lower cost than us, or adapt more quickly than us to new technologies or evolving customer requirements. As a result, our products may not be able to compete successfully with their products. As a result of highly competitive market conditions in our industry, a number of our competitors have been forced to seek bankruptcy protection. These competitors may emerge and in some cases have emerged from bankruptcy protection with stronger balance sheets and a desire to gain market share by offering their products at a lower price than our products, which would have an adverse impact on our financial performance.
Dependence on Major Customers - - We derived approximately 82 percent of our fiscal 2007 net sales on a worldwide basis from Ford, GM and Chrysler LLC and their subsidiaries. We do not have guaranteed long-term agreements with these customers and cannot predict that we will maintain our current relationships with these customers or that we will continue to supply them at current levels. The loss of a significant portion of sales to Ford, GM or Chrysler LLC would have a material adverse effect on our business, unless the lost revenues were replaced. Ford and GM have been experiencing decreasing market share in North America. In addition, if any of our significant customers were to encounter financial difficulties, work stoppages or seek bankruptcy protection, our business could be adversely affected.
Furthermore, our OEM customers are not required to purchase any minimum amount of products from us. The contracts we have entered into with most of our customers provide for supplying the customers for a particular vehicle model, rather than for manufacturing a specific quantity of products. Such contracts range from one year to the life of the model (usually three to five years), typically are non-exclusive, and do not require the purchase by the customer of any minimum number of wheels from us. Therefore, a significant decrease in demand for certain key models or group of related models sold by any of our major customers, or a decision by a manufacturer not to purchase from us, or to discontinue purchasing from us, for a particular model or group of models, could have a material adverse effect on us.
Dependence on Third-Party Suppliers and Manufacturers - Generally, our raw materials, supplies and energy requirements are obtained from various sources and in the quantities desired. Although we currently maintain alternative sources, our business is subject to the risk of price increases and periodic delays in the delivery. Fluctuations in the prices of these requirements may be driven by the supply/demand relationship for that commodity or governmental regulation. In addition, if any of our suppliers seek bankruptcy relief or otherwise cannot continue their business as anticipated, the availability or price of these requirements could be adversely affected.
Although we are able to periodically pass aluminum cost increases onto our customers, our customers are not obligated to accept energy or other supply cost increases that we may attempt to pass along to them. This inability to pass on these cost increases to our customers could adversely affect our operating margins and cash flow, possibly resulting in lower operating income and profitability.
Existing Cost Structure – In recent years, we have implemented several cost cutting initiatives in order to reduce our overall costs and improve our margins in response to pricing pressures from our customers. We have built additional production facilities in Mexico with cost structures lower than our U.S. facilities, in order to optimize our global manufacturing capacity and align our cost structures more effectively with the realities of the automotive market. During 2006, we discontinued our in-house chrome-plating operation, downsized our Van Nuys, California wheel operations, and sold our unprofitable components business. During 2007, we completed our planned closure of our Johnson City, Tennessee, wheel manufacturing facility. In addition, we are continuing to evaluate our workforce requirements at all of our facilities. However, our strategy of optimizing our cost structures may never materialize or may not be sufficient to offset future price pressures from our customers and may have an adverse impact on our financial performance.
In light of the additional capacity coming on line in our new facility in Mexico, if North American production of passenger cars and light trucks using our wheel programs continues to decrease, it is possible that we will be unable to recover the full value of certain other production assets in our other plants in the United States. We will continue to monitor the recoverability of these assets.
Unexpected Production Interruptions - An interruption in production capabilities at any of our facilities as a result of equipment failure, interruption of supply, labor disputes or other reasons could result in our inability to produce our products, which would reduce our sales and earnings for the affected period. We have, from time to time, undertaken significant re-tooling and modernization initiatives at our facilities, which in the past have caused, and in the future may cause unexpected delays and plant underutilization, and such adverse consequences may continue to occur as we continue to modernize our production facilities. In addition, we generally deliver our products only after receiving the order from the customer and thus do not hold large inventories. In the event of a stoppage in production at any of our manufacturing facilities, even if only temporary, or if we experience delays as a result of events that are beyond our control, delivery times could be severely affected. Any significant delay in deliveries to our customers could lead to returns or cancellations and cause us to lose future sales, as well as expose us to claims for damages. Our manufacturing facilities are also subject to the risk of catastrophic loss due to unanticipated events such as fires, earthquakes, explosions or violent weather conditions. We have in the past and may in the future experience plant shutdowns or periods of reduced production as a result of facility modernization initiatives, equipment failure, delays in deliveries or catastrophic loss, which could have a material adverse effect on our results of operations or financial condition.
Dependence on Key Personnel - Our success depends in part on our ability to attract, hire, train, and retain qualified managerial, engineering, sales and marketing personnel. We face significant competition for these types of employees in our industry. We may be unsuccessful in attracting and retaining the personnel we require to conduct our operations successfully.
In addition, key personnel may leave us and compete against us. Our success also depends to a significant extent on the continued service of our senior management team. We may be unsuccessful in replacing key managers who either resign or retire. The loss of any member of our senior management team or other experienced, senior employees could impair our ability to execute our business plans and strategic initiatives, cause us to lose customers and reduce our net sales, or lead to employee morale problems and/or the loss of other key employees. In any such event, our financial condition, results of operations, internal control over financial reporting, or cash flows could be adversely affected.
Effective Internal Control Over Financial Reporting – Management is responsible for establishing and maintaining adequate internal control over financial reporting. Many of our key controls rely on maintaining a sufficient complement of personnel with an appropriate level of accounting knowledge, experience and training in the application of accounting principles generally accepted in the United States of America in order to operate effectively. If we are unable to attract, hire, train and retain a sufficient complement of qualified personnel required to operate these controls effectively, our financial statements may contain material misstatements, unintentional errors, or omissions and late filings with regulatory agencies may occur. We have reported a material weakness in our internal control over financial reporting, in this 2007 Annual Report on Form 10-K relating to corrections to our income tax provisions and deferred tax liabilities included in previously filed financial statements, and as such have concluded that our internal control over financial reporting was not effective as of December 30, 2007. Reporting of material weaknesses may result in negative perceptions of our business among our customers, suppliers, investors and others, which may have a material adverse impact on our business.
Impact of Aluminum Pricing - The cost of aluminum is a significant component in the overall production cost of a wheel. Additionally, a portion of our selling prices to OEM customers is tied to the cost of aluminum. Our selling prices are adjusted periodically to current aluminum market conditions based upon market price changes during specific pricing periods. Theoretically, assuming selling price adjustments and raw material purchase prices move at the same rate, as the price of aluminum increases, the effect is an overall decrease in the gross margin percentage, since the gross profit in absolute dollars would be the same. The opposite would then be true in periods during which the price of aluminum decreases.
However, since the pricing periods and pricing methodologies during which selling prices are adjusted for changes in the market prices of aluminum differ for each of our customers, and the selling price changes are fixed for various periods, our selling price adjustments may not entirely offset the increases or decreases experienced in our aluminum raw material purchase prices. This is especially true during periods of frequent increases or decreases in the market price of aluminum and when a portion of our aluminum purchases is via long-term fixed purchase agreements. Accordingly, our gross profit is subject to fluctuations, since the change in the product selling prices related to the cost of aluminum does not necessarily match the change in the aluminum raw material purchase prices during the period being reported, which may have a material adverse effect on our operating results.
Legal Proceedings - The nature of our business subjects us to litigation in the ordinary course of our business. We are exposed to potential product liability and warranty risks that are inherent in the design, manufacture and sale of automotive products, the failure of which could result in property damage, personal injury or death. Accordingly, individual or class action suits alleging product liability or warranty claims could result. Although we currently maintain what we believe to be suitable and adequate product liability insurance in excess of our self-insured amounts, we cannot assure you that we will be able to maintain such insurance on acceptable terms or that such insurance will provide adequate protection against potential liabilities. In addition, if any of our products prove to be defective, we may be required to participate in a recall involving such products. A successful claim brought against us in excess of available insurance coverage, if any, or a requirement to participate in any product recall, could have a material adverse effect on our results of operations or financial condition. In addition, we have been named as a nominal defendant in a shareholder derivative lawsuit relating to our historical stock option practices, and a number of our past and present directors, officers and employees have been named as individual defendants in this lawsuit. We may in the future be named in additional lawsuits or government inquiries relating to our historical stock price practices. See Item 3 - Legal Proceedings section of this Annual Report on Form 10-K for a description of the significant legal proceedings in which we are presently involved. We cannot assure you that any current or future claims will not adversely affect our cash flows, financial condition or results of operations.
Implementation of New Systems - - We are currently considering upgrades to our financial reporting and other operational functions within our business. We may encounter technical and operating difficulties during the implementation of these upgrades, as our employees learn and operate the systems, which are critical to our operations. Any difficulties that we encounter in upgrading the system may affect our internal control over financial reporting; disrupt our ability to deal effectively with our employees, customers and other companies with which we have commercial relationships; and also may prevent us from effectively reporting our financial results in a timely manner. Any such disruption could have a material adverse impact on our financial condition, cash flows or results of operations. In addition, the costs incurred in correcting any errors or problems with the upgraded system could be substantial.
Intellectual Property - We consider ourselves to be an industry leader in product and process technology. Therefore, protection of our intellectual properties is important to our business. We rely on a combination of intellectual property, principally patents, to provide protection in this regard, but this protection might be inadequate. For example, our pending or future patent applications might not be approved or, if allowed, they might not be of sufficient strength or scope. Conversely, third parties might assert that our technologies infringe upon their proprietary rights. In either case, litigation, which could result in substantial costs and diversion of our efforts, might be necessary, and whether or not we are ultimately successful, the litigation could adversely affect our business.
Implementation of Operational Improvements - As part of our ongoing focus on being a low-cost provider of high quality products, we continually analyze our business to further improve our operations and identify cost-cutting measures. Our continued analysis may include identifying and implementing opportunities for: (i) further rationalization of manufacturing capacity; (ii) streamlining of marketing and general and administrative overhead; (iii) implementation of lean manufacturing and Six Sigma initiatives; and (iv) efficient investment in new equipment and technologies and the upgrading of existing equipment. We may be unable to successfully identify or implement plans targeting these initiatives, or fail to realize the benefits of the plans we have already implemented, as a result of operational difficulties, a weakening of the economy or other factors.
We are continuing to implement action plans to improve operational performance and mitigate the impact of the severe pricing environment in which we now operate. We must emphasize, however, that while we continue to reduce costs through process automation and identification of industry best practices, the curve of customer price reductions may continue to be at a rate faster than our progress on achieving cost reductions for an indefinite period of time, due to the slow and methodical nature of developing and implementing these cost reduction programs. In addition, fixed price natural gas contracts that expire in the next year may expose us to higher costs that cannot be immediately recouped in selling prices. The impact of these factors on our future financial position and results of operations may be negative, to an extent that cannot be predicted, and we may not be able to implement sufficient cost saving strategies to mitigate any future impact.
Resources for Future Expansion - We have recently completed building a new facility in Chihuahua, Mexico, to supply aluminum wheels to the North American aluminum wheel market. This is our third manufacturing facility in Chihuahua, Mexico. A significant change in our business, the economy or an unexpected decrease in our cash flow for any reason could result in our inability to have the capital required to complete similar projects in the future without outside financing.
New Product Introduction - In order to effectively compete in the automotive supply industry, we must be able to launch new products to meet our customers’ demand in a timely manner. We cannot assure you, however, that we will be able to install and certify the equipment needed to produce products for new product programs in time for the start of production, or that the transitioning of our manufacturing facilities and resources to full production under new product programs will not impact production rates or other operational efficiency measures at our facilities. In addition, we cannot assure you that our customers will execute on schedule the launch of their new product programs, for which we might supply products. Our failure to successfully launch new products, or a failure by our customers to successfully launch new programs, could adversely affect our results.
Technological and Regulatory Changes - Changes in legislative, regulatory or industry requirements or in competitive technologies may render certain of our products obsolete or less attractive. Our ability to anticipate changes in technology and regulatory standards and to successfully develop and introduce new and enhanced products on a timely basis will be a significant factor in our ability to remain competitive. We cannot assure you that we will be able to achieve the technological advances that may be necessary for us to remain competitive or that certain of our products will not become obsolete. We are also subject to the risks generally associated with new product introductions and applications, including lack of market acceptance, delays in product development and failure of products to operate properly.
International Operations - We manufacture our products in Mexico and Hungary and sell our products throughout the world. Unfavorable changes in foreign cost structures, trade protection laws, policies and other regulatory requirements affecting trade and investments, social, political, labor, or economic conditions in a specific country or region, including foreign exchange rates, difficulties in staffing and managing foreign operations and foreign tax consequences, among other factors, could have a negative effect on our business and results of operations.
Labor Relations - We do not anticipate our workforce becoming unionized, but if such eventuality occurred, our labor costs could increase which would increase our overall production costs. In addition, we could be adversely affected by any labor difficulties or work stoppage involving our customers.
Foreign Currency Fluctuations – Due to the increase in our operations outside of the United States, we have experienced increased foreign currency gains and losses in the ordinary course of our business. As a result, fluctuations in the exchange rate between the U.S. dollar, the euro, the Mexican peso and any currencies of other countries in which we conduct our business may have a material impact on our financial condition as cash flows generated in other currencies will be used, in part, to service our U.S. dollar-denominated creditors.
In addition, fluctuations in foreign currency exchange rates may affect the value of our foreign assets as reported in U.S. dollars, and may adversely affect reported earnings and, accordingly, the comparability of period-to-period results of operations. Changes in currency exchange rates may affect the relative prices at which foreign competitors and we sell products in the same market. In addition, changes in the value of the relevant currencies may affect the cost of certain items required in our operations. We cannot assure you that fluctuations in exchange rates will not otherwise have a material adverse effect on our financial condition or results of operations, or cause significant fluctuations in quarterly and annual results of operations.
Environmental Matters - We are subject to various foreign, federal, state and local environmental laws, ordinances, and regulations, including those governing discharges into the air and water, the storage, handling and disposal of solid and hazardous wastes, the remediation of soil and groundwater contaminated by hazardous substances or wastes, and the health and safety of our employees. Under certain of these laws, ordinances or regulations, a current or previous owner or operator of property may be liable for the costs of removal or remediation of certain hazardous substances on, under, or in its property, without regard to whether the owner or operator knew of, or caused, the presence of the contaminants, and regardless of whether the practices that resulted in the contamination were legal at the time they occurred. The presence of, or failure to remediate properly, such substances may adversely affect the ability to sell or rent such property or to borrow using such property as collateral. Persons who generate, arrange for the disposal or treatment of, or dispose of hazardous substances may be liable for the costs of investigation, remediation or removal of these hazardous substances at or from the disposal or treatment facility, regardless of whether the facility is owned or operated by that person. Additionally, the owner of a site may be subject to common law claims by third parties based on damages and costs resulting from environmental contamination emanating from a site. We believe that we are in material compliance with environmental laws, ordinances and regulations and do not anticipate any material adverse effect on our earnings or competitive position relating to environmental matters. It is possible, however, that future developments could lead to material costs of environmental compliance for us. The nature of our current and former operations and the history of industrial uses at some of our facilities expose us to the risk of liabilities or claims with respect to environmental and worker health and safety matters which could have a material adverse effect on our financial health. We are also required to obtain permits from governmental authorities for certain operations. We cannot assure you that we have been or will be at all times in complete compliance with such permits. If we violate or fail to comply with these permits, we could be fined or otherwise sanctioned by regulators. In some instances, such a fine or sanction could be material. In addition, some of our properties are subject to indemnification and/or cleanup obligations of third parties with respect to environmental matters. However, in the event of the insolvency or bankruptcy of such third parties, we could be required to bear the liabilities that would otherwise be the responsibility of such third parties.
ITEM 1B – UNRESOLVED STAFF COMMENTS
None.
Our worldwide headquarters is located in leased office space adjacent to leased manufacturing and warehousing facilities in Van Nuys, California. We maintain and operate a total of eight facilities that produce aluminum wheels for the automotive industry, located in Arkansas, California, Kansas, Chihuahua, Mexico, and Tatabanya, Hungary. In 2004, we started construction of our third aluminum wheel facility in Chihuahua, Mexico, which began producing aluminum wheels at the end of 2006. These eight facilities encompass 3,652,000 square feet of manufacturing space, 50,000 square feet of warehouse space and 30,000 square feet of office space. We own all of our facilities with the exception of two warehouses, one in Rogers, Arkansas, and the other in Chihuahua, Mexico, and our worldwide headquarters and adjacent manufacturing and warehousing facilities located in Van Nuys, California, that are leased. We ceased wheel manufacturing operations in our Johnson City, Tennessee facility, totaling 301,500 square feet, at the end of the first quarter of 2007. This property is available for sale at this time.
In general, these facilities, which have been constructed at various times over the past several years, are in good operating condition and are adequate to meet our productive capacity requirements. There are active maintenance programs to keep these facilities in good condition, and we have an active capital spending program to replace equipment as needed to keep technologically competitive on a worldwide basis.
Additionally, reference is made to Note 1 - Summary of Significant Accounting Policies, Note 6 - - Property, Plant and Equipment and Note 9 - Leases and Related Parties, in Notes to the Consolidated Financial Statements in Item 8 – Financial Statements and Supplementary Data of this Annual Report on Form 10-K.
In late 2006, two shareholder derivative complaints were filed, one each by plaintiffs Gary B. Eldred and Darrell D. Mack, based on allegations concerning some of the company’s past stock option grants and practices. These cases were subsequently consolidated as In re Superior Industries International, Inc. Derivative Litigation, which is pending in the United States District Court for the Central District of California. In the plaintiffs’ consolidated complaint, filed on March 23, 2007, the company was named only as a nominal defendant from whom the plaintiffs sought no monetary recovery. In addition to naming the company as a nominal defendant, the plaintiffs named various present and former employees, officers and directors of the company as individual defendants from whom they sought monetary and/or equitable relief, purportedly for the benefit of the company.
Plaintiffs purported to base their claims against the individual defendants on allegations that the grant dates for some of the options granted to certain company directors, officers and employees occurred prior to upward movements in the stock price, and that the stock option grants were not properly accounted for in the company’s financial reports and not properly disclosed in the company’s SEC filings. The company and the individual defendants filed motions to dismiss plaintiffs’ consolidated complaint on May 14, 2007. In an order dated August 9, 2007, the court granted Superior's motion to dismiss the consolidated complaint, and granted the plaintiffs leave to file an amended complaint.
On August 29, 2007, the plaintiffs filed an amended consolidated complaint that is substantially similar to the prior consolidated complaint. In response, the company and the individual defendants filed motions to dismiss on September 21, 2007. These renewed motions to dismiss were originally scheduled to be heard on November 12, 2007. However, the hearing on the motions was taken off calendar to accommodate the reassignment of the case to a new judge. As of March 24, 2008, the court has yet to reset on the calendar of the new judge the motions to dismiss. Discovery is stayed in the case pending resolution of motions to dismiss. As this litigation remains at a preliminary stage, it would be premature to anticipate the probable outcome of this case and whether such an outcome would be materially adverse to the company.
In 2006, we were served with notice of a class action lawsuit against the company. The complaint alleges that among other claims, certain employees at our Van Nuys, California, facility were denied rest and meal periods as required under the California Labor Code. After conducting initial discovery, the parties participated in mediation that concluded on August 22, 2007. The mediator proposed that the parties settle the lawsuit for a total settlement payment not to exceed $2,700,000. This settlement amount is all-inclusive and includes the company’s settlement payment to the lead plaintiff and the settlement class, together with costs and attorneys’ fees for plaintiff’s counsel. In addition, the mediator proposed that the settlement payment to the class would be on a “claims made” basis, with a minimum of 40 percent of the net settlement being distributed to the settlement class. Provided the minimum settlement claims are paid to the settlement class, the company will not be liable for any claim that is not valid or timely filed.
Subject to certain conditions, both parties agreed to the mediator’s proposal and executed a Settlement Term Sheet on August 22, 2007. The parties submitted the proposed settlement for preliminary approval with the Superior Court of Los Angeles County, which granted preliminary approval on December 19, 2007. On March 17, 2008, the court granted final approval of the proposed settlement, thereby giving the settlement class until May 16, 2008 to appeal the court’s order. Management estimates that its expected liability is $2.2 million and has accordingly recorded a charge to selling, general and administrative expenses during the year ended December 31, 2007.
We are party to various other legal and environmental proceedings incidental to our business. Certain claims, suits and complaints arising in the ordinary course of business have been filed or are pending against us. Based on facts now known, we believe all such matters are adequately provided for, covered by insurance, are without merit, and/or involve such amounts that would not materially adversely affect our consolidated results of operations, cash flows or financial position.
ITEM 4 - SUBMISSION OF MATTERS TO A VOTE OF SECURITY HOLDERS
During the fourth quarter of 2007, no matters were submitted to a vote of security holders through the solicitation of proxies or otherwise.
EXECUTIVE OFFICERS OF THE REGISTRANT
Information regarding executive officers that are Directors is contained in our 2008 Annual Proxy Statement under the caption “Election of Directors”. Such information is incorporated herein by reference. All executive officers are appointed annually by the Board of Directors and serve one-year terms. Also see “Employment Agreements” in our 2008 Annual Proxy Statement, which is incorporated herein by reference.
Listed below are the name, age, position and business experience of each of our officers who are not directors:
| | | | | | | | | | Assumed | |
| Name | | | Age | | | Position | | | Position | |
| | | | | | | | | | | |
| Robert H. Bouskill | | | 62 | | | Senior Vice President, Manufacturing Technology | | | 2005 | |
| | | | | | | Vice President, Manufacturing Technology | | | 2000 | |
| | | | | | | | | | | |
| Robert D. Bracy | | | 60 | | | Senior Vice President, Facilities | | | 2005 | |
| | | | | | | Vice President, Facilities | | | 1997 | |
| | | | | | | | | | | |
| Robert A. Earnest | | | 46 | | | Vice President, General Counsel and Corporate Secretary | | | 2007 | |
| | | | | | | Director, Tax and Legal and Corporate Secretary | | | 2006 | |
| | | | | | | Director, Tax and Customs – Nissan North America | | | 2001 | |
| | | | | | | | | | | |
| Emil J. Fanelli | | | 65 | | | Vice President and Corporate Controller | | | 2008 | |
| | | | | | | Acting Chief Financial Officer | | | 2007 | |
| | | | | | | Vice President and Corporate Controller | | | 2001 | |
| | | | | | | | | | | |
| Stephen H. Gamble | | | 53 | | | Vice President, Treasurer | | | 2006 | |
| | | | | | | Director, Financial Planning and Analysis | | | 2001 | |
| | | | | | | | | | | |
| Parveen Kakar | | | 41 | | | Vice President, Program Development | | | 2003 | |
| | | | | | | Director, Engineering Services | | | 1989 | |
| | | | | | | | | | | |
| Michael J. O’Rourke | | | 47 | | | Executive Vice President, Sales and Administration | | | 2008 | |
| | | | | | | Senior Vice President, Sales and Administration | | | 2003 | |
| | | | | | | Vice President, OEM Program Administration | | | 1995 | |
| | | | | | | | | | | |
| Razmik Perian | | | 50 | | | Chief Information Officer | | | 2006 | |
| | | | | | | Director, Corporate Information Technology | | | 2000 | |
| | | | | | | | | | | |
| Name | | | Age | | | Position | | | Position | |
| | | | | | | | | | | |
| Eddie Rodriquez | | | 53 | | | Vice President, Human Resources | | | 2007 | |
| | | | | | | Director, Human Resources – The Coca-Cola Company | | | 2004 | |
| | | | | | | Vice President, Operations – First Data Corporation | | | 1999 | |
| | | | | | | | | | | |
| Gabriel Soto | | | 59 | | | Vice President, Mexico Operations | | | 2004 | |
| | | | | | | General Manager, Mexico Operations | | | 1994 | |
| | | | | | | | | | | |
| | | | | | | | | | | |
| Kenneth A. Stakas | | | 56 | | | Senior Vice President, Manufacturing | | | 2006 | |
| | | | | | | Vice President of Operations - | | | | |
| | | | | | | Amcast Automotive, Components Group | | | 2000 | |
| | | | | | | | | | | |
| Cameron Toyne | | | 48 | | | Vice President, Supply Chain | | | 2008 | |
| | | | | | | Vice President, Purchasing | | | 2007 | |
| | | | | | | Director of Purchasing | | | 2004 | |
| | | | | | | Manager of Supply Chain – L-3 Communications | | | 2002 | |
| | | | | | | | | | | |
| Erika H. Turner | | | 53 | | | Chief Financial Officer | | | 2008 | |
| | | | | | | Chief Financial Officer/ Vice President, Finance – Monogram Systems | | | 2004 | |
| | | | | | | Chief Financial Officer – Quantum Corporation, Storage Solutions Group | | | 2003 | |
| | | | | | | | | | | |
ITEM 5 - MARKET FOR REGISTRANT'S COMMON EQUITY, RELATED STOCKHOLDER MATTERS AND ISSUER PURCHASES OF EQUITY SECURITIES
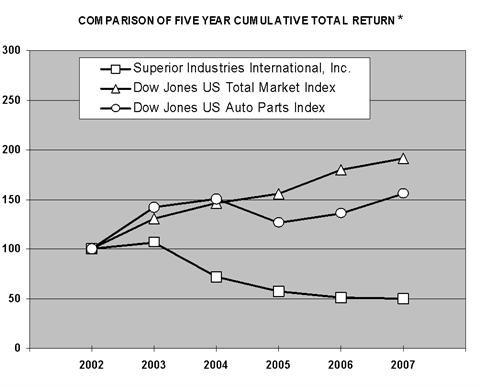
Our common stock is traded on the New York Stock Exchange (symbol: SUP). We had approximately 591 shareholders of record as of December 30, 2007 and 26.6 million shares issued and outstanding as of March 14, 2008. Information relating to equity securities authorized under our equity compensation plans and a five-year cumulative total return of our Common Stock as of December 31, 2007 is set forth below.
*Assumes the value of the investment in Superior Industries International common stock and each index was $100 on December 31, 2002 and that all dividends were reinvested.
| | | | | | | | | | |
| | | Superior Industries | | | Dow Jones US Total | | | Dow Jones US Auto | |
| | | International, Inc. | | | Market Index | | | Parts Index | |
| | | | | | | | | | |
| 2002 | | $ | 100.00 | | | $ | 100.00 | | | $ | 100.00 | |
| 2003 | | $ | 106.59 | | | $ | 130.75 | | | $ | 142.21 | |
| 2004 | | $ | 72.48 | | | $ | 146.45 | | | $ | 150.00 | |
| 2005 | | $ | 57.05 | | | $ | 155.72 | | | $ | 126.40 | |
| 2006 | | $ | 51.13 | | | $ | 179.96 | | | $ | 135.37 | |
| 2007 | | $ | 49.74 | | | $ | 190.77 | | | $ | 155.51 | |
Quarterly Common Stock Price Information
The following table sets forth the high and low closing sales price per share of our common stock during the periods indicated.
| | | 2007 | | | | 2006 | |
| | | High | | | Low | | | | High | | | | Low | |
| | | | | | | | | | | | | | | |
| First Quarter | $ | 23.19 | | $ | 19.07 | | | $ | 23.21 | | | $ | 19.06 | |
| Second Quarter | $ | 24.06 | | $ | 21.25 | | | $ | 19.63 | | | $ | 17.25 | |
| Third Quarter | $ | 23.05 | | $ | 18.33 | | | $ | 18.88 | | | $ | 16.38 | |
| Fourth Quarter | $ | 22.23 | | $ | 17.81 | | | $ | 20.23 | | | $ | 16.40 | |
Securities Authorized for Issuance Under Equity Compensation Plans
The table below contains information about securities authorized for issuance under equity compensation plans. The features of these plans are described further in Note 13 – Stock-based Compensation in Notes to the Consolidated Financial Statements in Item 8 – Financial Statements and Supplementary Data of this Annual Report on Form 10-K.
| | | Number of securities | | | | | Number of securities |
| | | to be issued | | Weighted-average | | remaining available |
| | | upon exercise of | | exercise price of | | for future issuance |
| | | outstanding options, | | outstanding options, | | under equity |
| Plan Category | | warrants and rights | | warrants and rights | | compensation plans |
| | | | | | | | |
| Equity compensation plans approved by security holders | | 3,198,111 | | $ | 26.53 | | 746,902 |
| | | | | | | | |
| Equity compensation plans not approved by security holders | | - | | | - | | - |
| | | | | | | | |
| Total | | 3,198,111 | | $ | 26.53 | | 746,902 |
| | | | | | | | |
Dividend Policy
Cash dividends declared during 2007 and 2006 totaled $0.64 per share in each year and were paid on a quarterly basis. We anticipate continuing the policy of paying dividends quarterly, which is contingent upon various factors, including economic and market conditions, none of which can be accurately predicted.
Purchases of Equity Securities by the Issuer and Affiliated Purchasers
On March 17, 2000, the Board of Directors authorized the repurchase of 4.0 million shares of our common stock as part of the 2000 Stock Repurchase Plan (Plan). During the fourth quarter of 2007, there were no repurchases of common stock. As of December 31, 2007, approximately 3.2 million shares remained available for repurchase under the Plan.
ITEM 6 - SELECTED FINANCIAL DATA
The following selected consolidated financial data should be read in conjunction with Item 7 - Management’s Discussion and Analysis of Financial Condition and Results of Operations and Item 8 – Financial Statements and Supplementary Data of this Annual Report on Form 10-K.
Our fiscal year is the 52- or 53-week period ending on the last Sunday of the calendar year. The fiscal year 2007 comprised the 52-week period ended December 30, 2007. The fiscal year 2006 comprised the 53-week period ended December 31, 2006. The fiscal years 2005, 2004 and 2003 comprised the 52-week periods ended December 25, 2005, December 26, 2004 and December 28, 2003, respectively. For convenience of presentation, all fiscal years are referred to as beginning as of January 1 and ending as of December 31, but actually reflect our financial position and results of operations for the periods described above.
The consolidated statements of operations data for the years ended December 31, 2007, 2006 and 2005, and the consolidated balance sheet data at December 31, 2007 and 2006, are derived from our audited consolidated financial statements appearing Item 8 – Financial Statements and Supplementary Data in this Annual Report on Form 10-K. The consolidated statements of operations data for the years ended December 31, 2004 and 2003 and the consolidated balance sheet data at December 31, 2005, 2004 and 2003 are derived from our unaudited financial statements that are not included in this Annual Report on Form 10-K. The financial statements as of and for the fiscal years 2006, 2005, 2004 and 2003 have been restated to correct errors in the accounting for certain deferred tax liabilities and our equity method investment in Suoftec, as further described in Note 2 – Restatement of Consolidated Financial Statements in Notes to Consolidated Financial Statements in Item 8 – Financial Statements and Supplementary Data in this Annual Report on Form 10-K. These historical results are not indicative of the results to be expected in any future period.
| Fiscal Year Ended December 31, | | 2007 | | | 2006 | | | 2005 (4) | | | 2004 (4) | | | 2003 (4) | |
| | | | | | As restated | | | As restated | | | As restated | | | As restated | |
| | | | | | | | | | | | | | | | |
| Statement of Operations (000's) | | | | | | | | | | | | | | | |
| Net Sales | | $ | 956,892 | | | $ | 789,862 | | | $ | 804,161 | | | $ | 872,258 | | | $ | 825,940 | |
| Net Income (Loss) from Continuing Operations | | $ | 9,292 | | | $ | (10,799 | ) | | $ | 19,375 | | | $ | 53,167 | | | $ | 80,550 | |
| | | | | | | | | | | | | | | | | | | | | |
| Balance Sheet (000's) | | | | | | | | | | | | | | | | | | | | |
| Current Assets | | $ | 356,079 | | | $ | 346,593 | | | $ | 359,740 | | | $ | 368,976 | | | $ | 388,510 | |
| Current Liabilities | | | 95,596 | | | | 112,083 | | | | 110,634 | | | | 87,343 | | | | 83,621 | |
| Working Capital | | | 260,483 | | | | 234,510 | | | | 249,106 | | | | 281,633 | | | | 304,889 | |
| Total Assets | | | 729,922 | | | | 712,505 | | | | 719,895 | | | | 745,180 | | | | 703,205 | |
| Long-Term Debt | | | - | | | | - | | | | - | | | | - | | | | - | |
| Shareholders' Equity | | $ | 550,573 | | | $ | 563,114 | | | $ | 583,988 | | | $ | 609,731 | | | $ | 581,368 | |
| | | | | | | | | | | | | | | | | | | | | |
| Financial Ratios | | | | | | | | | | | | | | | | | | | | |
Current Ratio (1) | | 3.7:1 | | | 3.1:1 | | | 3.3:1 | | | 4.2:1 | | | 4.6:1 | |
Long-Term Debt/Total Capitalization (2) | | | 0.0 | % | | | 0.0 | % | | | 0.0 | % | | | 0.0 | % | | | 0.0 | % |
Return on Average Shareholders' Equity (3) | | | 1.7 | % | | | -1.8 | % | | | -1.2 | % | | | 7.6 | % | | | 13.9 | % |
| | | | | | | | | | | | | | | | | | | | | |
| Share Data | | | | | | | | | | | | | | | | | | | | |
| Net Income (Loss) from Continuing Operations | | | | | | | | | | | | | | | | | | | | |
| - Basic | | $ | 0.35 | | | $ | (0.41 | ) | | $ | 0.73 | | | $ | 2.00 | | | $ | 3.01 | |
| - Diluted | | $ | 0.35 | | | $ | (0.41 | ) | | $ | 0.73 | | | $ | 1.99 | | | $ | 2.97 | |
| | | | | | | | | | | | | | | | | | | | | |
| Shareholders' Equity at Year-End | | $ | 20.67 | | | $ | 21.16 | | | $ | 21.95 | | | $ | 22.90 | | | $ | 21.72 | |
| Dividends Declared | | $ | 0.6400 | | | $ | 0.6400 | | | $ | 0.6350 | | | $ | 0.6025 | | | $ | 0.5375 | |
| (1) The Current Ratio is current assets divided by current liabilities. | | | | | | | | | | | | |
| (2) Long-term Debt/Total Capitalization represents long-term debit divided by total shareholders' equity plus long-term debt. | |
| (3) Return on Average Shareholders' Equity is net income (loss) divided by average shareholders' equity. Average shareholders' equity |
| | is the beginning of the year shareholders' equity plus the end of year shareholders' equity divided by two. | | | | |
| (4) Restated consolidated statements of operations for the fiscal years 2004 and 2003 and consolidated balance sheets for the | |
| fiscal years ended December 31, 2005, 2004 and 2003 are unaudited. | | | | | | | | | | | |
SUPERIOR INDUSTRIES INTERNATIONAL, INC.
CONSOLIDATED STATEMENT OF OPERATIONS
(Thousands of dollars, except per share amounts)
(Unaudited)
| Fiscal Year 2004 | | As reported | | | Adjustments | | | As restated | |
| | | | | | | | | | |
| NET SALES | | $ | 872,258 | | | $ | - | | | $ | 872,258 | |
| Cost of sales | | | 779,752 | | | | - | | | | 779,752 | |
| | | | | | | | | | | | | |
| GROSS PROFIT | | | 92,506 | | | | - | | | | 92,506 | |
| | | | | | | | | | | | | |
| Selling, general and administrative expenses | | | 24,154 | | | | - | | | | 24,154 | |
| Impairments of long-lived assets | | | - | | | | - | | | | - | |
| | | | | | | | | | | | | |
| INCOME (LOSS) FROM OPERATIONS | | | 68,352 | | | | - | | | | 68,352 | |
| | | | | | | | | | | | | |
| Interest income, net | | | 2,772 | | | | - | | | | 2,772 | |
| Other income (expense), net | | | (1,614 | ) | | | - | | | | (1,614 | ) |
| | | | | | | | | | | | | |
| INCOME (LOSS) FROM CONTINUING OPERATIONS | | | | | | | | | | | | |
| BEFORE INCOME TAXES AND EQUITY EARNINGS | | | 69,510 | | | | - | | | | 69,510 | |
| | | | | | | | | | | | | |
| Income tax (provision) benefit | | | (26,209 | ) | | | 592 | | | | (25,617 | ) |
| Equity in earnings of joint ventures | | | 8,611 | | | | 663 | | | | 9,274 | |
| | | | | | | | | | | | | |
| NET INCOME (LOSS) FROM CONTINUING OPERATIONS | | | 51,912 | | | | 1,255 | | | | 53,167 | |
| | | | | | | | | | | | | |
| Income (loss) from discontinued operations, net of taxes | | | (8,108 | ) | | | - | | | | (8,108 | ) |
| | | | | | | | | | | | | |
| NET INCOME (LOSS) BEFORE CUMULATIVE EFFECT | | | | | | | | | | | | |
| OF ACCOUNTING CHANGE | | | 43,804 | | | | 1,255 | | | | 45,059 | |
| | | | | | | | | | | | | |
| Cumulative effect of accounting change, net of taxes | | | - | | | | - | | | | - | |
| | | | | | | | | | | | | |
| NET INCOME (LOSS) | | $ | 43,804 | | | $ | 1,255 | | | $ | 45,059 | |
| | | | | | | | | | | | | |
| EARNINGS (LOSS) PER SHARE - BASIC: | | | | | | | | | | | | |
| | | | | | | | | | | | | |
| Net income (loss) from continuing operations | | $ | 1.95 | | | $ | 0.05 | | | $ | 2.00 | |
| Income (loss) from discontinued operations, net of taxes | | | (0.30 | ) | | | - | | | | (0.30 | ) |
| Cumulative effect of accounting change, net of taxes | | | - | | | | - | | | | - | |
| Net income (loss) | | $ | 1.65 | | | $ | 0.05 | | | $ | 1.70 | |
| | | | | | | | | | | | | |
| EARNINGS (LOSS) PER SHARE - DILUTED: | | | | | | | | | | | | |
| | | | | | | | | | | | | |
| Net income (loss) from continuing operations | | $ | 1.94 | | | $ | 0.05 | | | $ | 1.99 | |
| Income (loss) from discontinued operations, net of taxes | | | (0.30 | ) | | | - | | | | (0.30 | ) |
| Cumulative effect of accounting change, net of taxes | | | - | | | | - | | | | - | |
| Net income (loss) | | $ | 1.64 | | | $ | 0.05 | | | $ | 1.69 | |
SUPERIOR INDUSTRIES INTERNATIONAL, INC.
CONSOLIDATED STATEMENT OF OPERATIONS
(Thousands of dollars, except per share amounts)
(Unaudited)
| Fiscal Year 2003 | | As reported | | | Adjustments | | | As restated | |
| | | | | | | | | | |
| NET SALES | | $ | 825,940 | | | $ | - | | | $ | 825,940 | |
| Cost of sales | | | 691,531 | | | | - | | | | 691,531 | |
| | | | | | | | | | | | | |
| GROSS PROFIT | | | 134,409 | | | | - | | | | 134,409 | |
| | | | | | | | | | | | | |
| Selling, general and administrative expenses | | | 24,309 | | | | - | | | | 24,309 | |
| Impairments of long-lived assets | | | - | | | | - | | | | - | |
| | | | | | | | | | | | | |
| INCOME (LOSS) FROM OPERATIONS | | | 110,100 | | | | - | | | | 110,100 | |
| | | | | | | | | | | | | |
| Interest income, net | | | 2,727 | | | | - | | | | 2,727 | |
| Other income (expense), net | | | 1,144 | | | | - | | | | 1,144 | |
| | | | | | | | | | | | | |
| INCOME (LOSS) FROM CONTINUING OPERATIONS | | | | | | | | | | | | |
| BEFORE INCOME TAXES AND EQUITY EARNINGS | | | 113,971 | | | | - | | | | 113,971 | |
| | | | | | | | | | | | | |
| Income tax (provision) benefit | | | (43,345 | ) | | | 1,269 | | | | (42,076 | ) |
| Equity in earnings of joint ventures | | | 8,655 | | | | - | | | | 8,655 | |
| | | | | | | | | | | | | |
| NET INCOME (LOSS) FROM CONTINUING OPERATIONS | | | 79,281 | | | | 1,269 | | | | 80,550 | |
| | | | | | | | | | | | | |
| Income (loss) from discontinued operations, net of taxes | | | (6,476 | ) | | | - | | | | (6,476 | ) |
| | | | | | | | | | | | | |
| NET INCOME (LOSS) BEFORE CUMULATIVE EFFECT | | | | | | | | | | | | |
| OF ACCOUNTING CHANGE | | | 72,805 | | | | 1,269 | | | | 74,074 | |
| | | | | | | | | | | | | |
| Cumulative effect of accounting change, net of taxes | | | - | | | | - | | | | - | |
| | | | | | | | | | | | | |
| NET INCOME (LOSS) | | $ | 72,805 | | | $ | 1,269 | | | $ | 74,074 | |
| | | | | | | | | | | | | |
| EARNINGS (LOSS) PER SHARE - BASIC: | | | | | | | | | | | | |
| | | | | | | | | | | | | |
| Net income (loss) from continuing operations | | $ | 2.97 | | | $ | 0.05 | | | $ | 3.02 | |
| Income (loss) from discontinued operations, net of taxes | | | (0.24 | ) | | | - | | | | (0.24 | ) |
| Cumulative effect of accounting change, net of taxes | | | - | | | | - | | | | - | |
| Net income (loss) | | $ | 2.73 | | | $ | 0.05 | | | $ | 2.78 | |
| | | | | | | | | | | | | |
| EARNINGS (LOSS) PER SHARE - DILUTED: | | | | | | | | | | | | |
| | | | | | | | | | | | | |
| Net income (loss) from continuing operations | | $ | 2.93 | | | $ | 0.05 | | | $ | 2.98 | |
| Income (loss) from discontinued operations, net of taxes | | | (0.24 | ) | | | - | | | | (0.24 | ) |
| Cumulative effect of accounting change, net of taxes | | | - | | | | - | | | | - | |
| Net income (loss) | | $ | 2.69 | | | $ | 0.05 | | | $ | 2.74 | |
SUPERIOR INDUSTRIES INTERNATIONAL, INC.
CONSOLIDATED BALANCE SHEET
(Thousands of dollars, except per share amounts)
(Unaudited)
| Fiscal Year Ended December 31, 2005 | | As reported | | | Adjustments | | | As restated | |
| | | | | | | | | | |
| ASSETS | | | | | | | | | |
| Current assets: | | | | | | | | | |
| Cash and cash equivalents | | $ | 107,349 | | | $ | - | | | $ | 107,349 | |
| Short-term investments | | | - | | | | - | | | | - | |
| Accounts receivable, net | | | 135,501 | | | | - | | | | 135,501 | |
| Inventories, net | | | 107,726 | | | | - | | | | 107,726 | |
| Income taxes receivable | | | - | | | | - | | | | - | |
| Deferred income taxes | | | 2,585 | | | | - | | | | 2,585 | |
| Other current assets | | | 6,579 | | | | - | | | | 6,579 | |
| Total current assets | | | 359,740 | | | | - | | | | 359,740 | |
| | | | | | | | | | | | | |
| Property, plant and equipment, net | | | 292,289 | | | | - | | | | 292,289 | |
| Investments | | | 59,572 | | | | 416 | | | | 59,988 | |
| Non-current deferred tax asset, net | | | - | | | | - | | | | - | |
| Other assets | | | 7,878 | | | | - | | | | 7,878 | |
| | | | | | | | | | | | | |
| Total assets | | $ | 719,479 | | | $ | 416 | | | $ | 719,895 | |
| | | | | | | | | | | | | |
| LIABILITIES AND SHAREHOLDERS' EQUITY | | | | | | | | | | | | |
| Current liabilities: | | | | | | | | | | | | |
| Accounts payable | | $ | 53,527 | | | $ | - | | | $ | 53,527 | |
| Accrued expenses | | | 39,401 | | | | - | | | | 39,401 | |
| Income taxes payable | | | 17,706 | | | | - | | | | 17,706 | |
| Total current liabilities | | | 110,634 | | | | - | | | | 110,634 | |
| | | | | | | | | | | | | |
| Non-current tax liabilities | | | - | | | | - | | | | - | |
| Executive retirement liabilities | | | 18,747 | | | | - | | | | 18,747 | |
| Non-current deferred tax liabilities, net | | | 10,209 | | | | (3,683 | ) | | | 6,526 | |
| Commitments and contingent liabilities | | | - | | | | - | | | | - | |
| Shareholders' equity: | | | | | | | | | | | | |
| Preferred stock, $25.00 par value | | | | | | | | | | | | |
| Authorized - 1,000,000 shares | | | | | | | | | | | | |
| Issued - none | | | - | | | | - | | | | - | |
| Common stock, $0.50 par value | | | | | | | | | | | | |
| Authorized - 100,000,000 shares | | | | | | | | | | | | |
| Issued and outstanding - 26,910,161 shares | | | 13,305 | | | | - | | | | 13,305 | |
| Additional paid-in capital | | | 32,062 | | | | - | | | | 32,062 | |
| Accumulated other comprehensive loss | | | (40,717 | ) | | | (80 | ) | | | (40,797 | ) |
| Retained earnings | | | 575,239 | | | | 4,179 | | | | 579,418 | |
| Total shareholders' equity | | | 579,889 | | | | 4,099 | | | | 583,988 | |
| | | | | | | | | | | | | |
| Total liabilities and shareholders' equity | | $ | 719,479 | | | $ | 416 | | | $ | 719,895 | |
SUPERIOR INDUSTRIES INTERNATIONAL, INC.
CONSOLIDATED BALANCE SHEET
(Thousands of dollars, except per share amounts)
(Unaudited)
| Fiscal Year Ended December 31, 2004 | | As reported | | | Adjustments | | | As restated | |
| | | | | | | | | | |
| ASSETS | | | | | | | | | |
| Current assets: | | | | | | | | | |
| Cash and cash equivalents | | $ | 119,644 | | | $ | - | | | $ | 119,644 | |
| Short-term investments | | | - | | | | - | | | | - | |
| Accounts receivable, net | | | 150,560 | | | | - | | | | 150,560 | |
| Inventories, net | | | 89,984 | | | | - | | | | 89,984 | |
| Deferred income taxes | | | 2,583 | | | | - | | | | 2,583 | |
| Other current assets | | | 6,205 | | | | - | | | | 6,205 | |
| Total current assets | | | 368,976 | | | | - | | | | 368,976 | |
| | | | | | | | | | | | | |
| Property, plant and equipment, net | | | 274,830 | | | | - | | | | 274,830 | |
| Investments | | | 91,860 | | | | 652 | | | | 92,512 | |
| Other assets | | | 8,862 | | | | - | | | | 8,862 | |
| | | | | | | | | | | | | |
| Total assets | | $ | 744,528 | | | $ | 652 | | | $ | 745,180 | |
| | | | | | | | | | | | | |
| LIABILITIES AND SHAREHOLDERS' EQUITY | | | | | | | | | | | | |
| Current liabilities: | | | | | | | | | | | | |
| Accounts payable | | $ | 42,351 | | | $ | - | | | $ | 42,351 | |
| Accrued expenses | | | 44,814 | | | | - | | | | 44,814 | |
| Income taxes payable | | | 178 | | | | - | | | | 178 | |
| Total current liabilities | | | 87,343 | | | | - | | | | 87,343 | |
| | | | | | | | | | | | | |
| Executive retirement liabilities | | | 17,203 | | | | - | | | | 17,203 | |
| Non-current deferred tax liabilities, net | | | 35,263 | | | | (4,360 | ) | | | 30,903 | |
| Commitments and contingent liabilities | | | - | | | | - | | | | - | |
| Shareholders' equity: | | | | | | | | | | | | |
| Preferred stock, $25.00 par value | | | | | | | | | | | | |
| Authorized - 1,000,000 shares | | | | | | | | | | | | |
| Issued - none | | | - | | | | - | | | | - | |
| Common stock, $0.50 par value | | | | | | | | | | | | |
| Authorized - 100,000,000 shares | | | | | | | | | | | | |
| Issued and outstanding - 26,621,191 shares | | | 13,310 | | | | - | | | | 13,310 | |
| Additional paid-in capital | | | 31,484 | | | | - | | | | 31,484 | |
| Accumulated other comprehensive loss | | | (38,586 | ) | | | (11 | ) | | | (38,597 | ) |
| Retained earnings | | | 598,511 | | | | 5,023 | | | | 603,534 | |
| Total shareholders' equity | | | 604,719 | | | | 5,012 | | | | 609,731 | |
| | | | | | | | | | | | | |
| Total liabilities and shareholders' equity | | $ | 744,528 | | | $ | 652 | | | $ | 745,180 | |
SUPERIOR INDUSTRIES INTERNATIONAL, INC.
CONSOLIDATED BALANCE SHEET
(Thousands of dollars, except per share amounts)
(Unaudited)
| Fiscal Year Ended December 31, 2003 | | As reported | | | Adjustments | | | As restated | |
| | | | | | | | | | |
| ASSETS | | | | | | | | | |
| Current assets: | | | | | | | | | |
| Cash and cash equivalents | | $ | 156,847 | | | $ | - | | | $ | 156,847 | |
| Short-term investments | | | - | | | | - | | | | - | |
| Accounts receivable, net | | | 147,579 | | | | - | | | | 147,579 | |
| Inventories, net | | | 68,228 | | | | - | | | | 68,228 | |
| Deferred income taxes | | | 3,616 | | | | - | | | | 3,616 | |
| Other current assets | | | 12,240 | | | | - | | | | 12,240 | |
| Total current assets | | | 388,510 | | | | - | | | | 388,510 | |
| | | | | | | | | | | | | |
| Property, plant and equipment, net | | | 261,733 | | | | - | | | | 261,733 | |
| Investments | | | 45,503 | | | | | | | | 45,503 | |
| Other assets | | | 7,459 | | | | - | | | | 7,459 | |
| | | | | | | | | | | | | |
| Total assets | | $ | 703,205 | | | $ | - | | | $ | 703,205 | |
| | | | | | | | | | | | | |
| LIABILITIES AND SHAREHOLDERS' EQUITY | | | | | | | | | | | | |
| Current liabilities: | | | | | | | | | | | | |
| Accounts payable | | $ | 30,398 | | | $ | - | | | $ | 30,398 | |
| Accrued expenses | | | 38,534 | | | | - | | | | 38,534 | |
| Income taxes payable | | | 14,689 | | | | - | | | | 14,689 | |
| Total current liabilities | | | 83,621 | | | | - | | | | 83,621 | |
| | | | | | | | | | | | | |
| Executive retirement liabilities | | | 15,024 | | | | - | | | | 15,024 | |
| Non-current deferred tax liabilities, net | | | 26,960 | | | | (3,768 | ) | | | 23,192 | |
| Commitments and contingent liabilities | | | - | | | | - | | | | - | |
| Shareholders' equity: | | | | | | | | | | | | |
| Preferred stock, $25.00 par value | | | | | | | | | | | | |
| Authorized - 1,000,000 shares | | | | | | | | | | | | |
| Issued - none | | | - | | | | - | | | | - | |
| Common stock, $0.50 par value | | | | | | | | | | | | |
| Authorized - 100,000,000 shares | | | | | | | | | | | | |
| Issued and outstanding - 26,768,666 shares | | | 13,384 | | | | - | | | | 13,384 | |
| Additional paid-in capital | | | 35,392 | | | | - | | | | 35,392 | |
| Accumulated other comprehensive loss | | | (41,935 | ) | | | - | | | | (41,935 | ) |
| Retained earnings | | | 570,759 | | | | 3,768 | | | | 574,527 | |
| Total shareholders' equity | | | 577,600 | | | | 3,768 | | | | 581,368 | |
| | | | | | | | | | | | | |
| Total liabilities and shareholders' equity | | $ | 703,205 | | | $ | - | | | $ | 703,205 | |
ITEM 7 - MANAGEMENT'S DISCUSSION AND ANALYSIS OF FINANCIAL CONDITION AND RESULTS OF OPERATIONS
The following discussion of our financial condition and results of operations, which is based on restated data as described below, should be read in conjunction with our Consolidated Financial Statements and the Notes to the Consolidated Financial Statements included in Item 8 - Financial Statements and Supplementary Data in this Annual Report on Form 10-K. This discussion contains forward-looking statements, which involve risks and uncertainties. Our actual results could differ materially from those anticipated in the forward-looking statements as a result of certain factors, including but not limited to those discussed in Item 1A - Risk Factors and elsewhere in this Annual Report on Form 10-K.
Restatement and Impact on Financial Statements
During the preparation and review of our 2007 income tax provision, we discovered that we had not properly reconciled our tax liabilities related to differences between the net book basis and the net tax basis of our depreciable property, plant and equipment and several other miscellaneous deferred tax liabilities. As a result of completing the necessary reconciliations for each year since 2002, we identified errors that impacted our previously filed financial statements for the fiscal years 2003 through 2006 and our previously filed interim financial statements for those years related to our tax liabilities and our income tax provisions.
During the fourth quarter of 2007, we determined the cumulative impact of known differences in our accounting for our equity method investment in Suoftec and our summary financial information presented for Suoftec, which we considered to be immaterial to any individual reporting period, required restatement. The errors relate to the quantification and recording of the adjustments to report the Suoftec earnings on the basis of U.S. GAAP versus on the Hungarian accounting rules followed by Suoftec. These differences principally relate to overhead cost capitalization into inventory and deferred income taxes on property, plant and equipment.
In accordance with the provisions of Statement of Financial Accounting Standards (SFAS) No. 154, “Accounting Changes and Error Corrections” (SFAS No. 154), we have restated, to the earliest period practical, our previously filed financial statements. See Note 2 – Restatement of Consolidated Financial Statements in Notes to Consolidated Financial Statements in Item 8 – Financial Statements and Supplementary Data of this Annual Report on Form 10-K, for the effect of the restatements on fiscal years 2005 and 2006.
The following table details the net income effect of these corrections for fiscal years 2005 and 2006:
| | | Net | | | | | | | | | | |
| | | Income (Loss) | | | Income Tax | | | Equity Earnings | | | Net | |
| | | as Previously | | | (Provision) | | | (Losses) of | | | Income (Loss) | |
| Fiscal Year | | Reported | | | Benefit | | | Joint Ventures | | | as Restated | |
| (Thousands of dollars) | | | | | | | | | | | | |
| | | | | | | | | | | | | |
| 2005 | | $ | (6,367 | ) | | $ | (677 | ) | | $ | (167 | ) | | $ | (7,211 | ) |
| 2006 | | $ | (9,321 | ) | | $ | (1,249 | ) | | $ | 28 | | | $ | (10,542 | ) |
See Note 2 – Restatement of Consolidated Financial Statements in Notes to Consolidated Financial Statements in Item 8 – Financial Statements and Supplementary Data in this Annual Report on Form 10-K for further discussion on the effect of these corrections for fiscal years 2006 and 2005 to the previously reported amounts.
Executive Overview
Our unit shipments increased 10 percent in 2007 and our units produced increased 13 percent, both factors contributing to the increase in gross profit. During 2007, we also completed the closing of our Johnson City, Tennessee plant as discussed below. While we have ongoing programs to reduce our own costs through process automation and identification of industry best practices, and had been successful in substantially mitigating these pricing pressures in the past, it has become increasingly more difficult to do so. Given the continuing nature of customer requests for price reductions, and the lengthy transitional periods necessary to implement best practices and to reduce labor and other costs through automation, our profit margins may continue to be lower than our historical levels. We will continue to attempt to increase our operating margins from current operating levels by aggressively implementing cost-saving strategies to meet customer-pricing expectations and mitigate increasing industry-wide price competition. However, as we incur costs to implement these strategies, the initial impact on our future financial position, results of operations and cash flow may be negative, the extent to which cannot be predicted, and even if successfully implemented, these strategies may not be sufficient to offset the impact of on-going pricing pressures and additional reductions in customer demand in future periods.
In September 2006, we announced the planned closure of our wheel manufacturing facility located in Johnson City, Tennessee, and the resulting layoff of approximately 500 employees. This was the latest step in our program to rationalize our production capacity after announcements by our major customers of sweeping production cuts, particularly in the light truck and SUV platforms. An asset impairment charge against pretax earnings totaling $4.5 million was recorded in the third quarter of 2006 to reduce the carrying value of certain long-lived assets in this facility. The closure of this facility was completed at the end of the first quarter of 2007.
Listed in the table below are several key indicators we use to monitor our financial condition and operating performance.
Results of Operations
| Fiscal Year End | | 2007 | | | 2006 | | | 2005 | |
| (Thousands of dollars, except per share amounts) | | | | | As restated | | | As restated | |
| | | | | | | | | | |
| Net sales | | $ | 956,892 | | | $ | 789,862 | | | $ | 804,161 | |
| Gross profit | | $ | 32,492 | | | $ | 8,740 | | | $ | 48,824 | |
| Percentage of net sales | | | 3.4 | % | | | 1.1 | % | | | 6.1 | % |
| Income (loss) from operations | | $ | 3,321 | | | $ | (21,409 | ) | | $ | 19,167 | |
| Percentage of net sales | | | 0.3 | % | | | -2.7 | % | | | 2.4 | % |
| Net income (loss) from continuing operations | | $ | 9,292 | | | $ | (10,799 | ) | | $ | 19,375 | |
| Percentage of net sales | | | 1.0 | % | | | -1.4 | % | | | 2.4 | % |
| Diluted earnings (loss) per share - continuing operations | | $ | 0.35 | | | $ | (0.41 | ) | | $ | 0.73 | |
Sales
In 2007, total revenues increased approximately 21 percent, while unit shipments to our OEM customers increased 10 percent versus the prior year. Consolidated net sales increased $167.0 million to $956.9 million in 2007 from $789.9 million in 2006. Wheel program development revenues decreased to $12.4 million this year compared to $19.8 million a year ago, while aluminum wheel sales increased $174.4 million in 2007 to $944.5 million from $770.1 million a year ago, a 23 percent increase compared to the 10 percent increase in unit shipments. The average selling price of our wheels increased approximately 12 percent in 2007, due principally to the continued shift in sales mix to larger, higher-priced wheels. The pass-through price of aluminum increased the average selling price by approximately 3 percent in 2007.
Unit shipments to Ford and GM totaled 68 percent of total OEM unit shipments in 2007 compared to 69 percent a year ago. Unit shipments to Chrysler LLC decreased to 13 percent from 16 percent in 2006, while shipments to our international customers totaled 19 percent compared to 15 percent in 2006. According to Wards Auto Info Bank, an industry publication, overall North American production of passenger cars and light trucks in 2007 decreased approximately 2 percent compared to our 10 percent increase in aluminum wheel unit shipments. Furthermore, production of the specific passenger cars and light trucks using our wheel programs decreased 6 percent compared to our 10 percent increase in shipments, indicating an increase in market share. Production of passenger cars with our wheel programs was down 11 percent compared to our 12 percent increase in shipments. Likewise, production of light trucks and SUVs with our wheel programs decreased 3 percent compared to our 9 percent increase in shipments.
According to Wards Auto Info Bank, an industry publication, aluminum wheel installation rates on passenger cars and light trucks in the U.S. remained flat at 63 percent for the 2006 and 2005 model years. Aluminum wheel installation rates have increased to this level since the mid-1980s, when this rate was only 10 percent. However, in recent years, this growth rate has slowed with the aluminum wheel installation rate increasing only 11 percentage points from 52 percent for the 1997 model year, while experiencing a slight decrease between 2004 and 2005. We expect this trend of slow growth or no growth to continue. In addition, our ability to grow in the future may be negatively impacted by continued customer pricing pressures and overall economic conditions that impact the sales of passenger cars and light trucks, such as continued high fuel prices and declines in the construction industry.
Consolidated net sales in 2006 decreased $14.3 million, or 2 percent, to $789.9 million from $804.2 million in 2005. Excluding wheel program development revenues, which totaled $19.8 million in 2006 compared to $18.6 million in 2005, OEM wheel sales decreased $15.5 million to $770.1 million from $785.6 million in 2005, a 2 percent decrease compared to a decrease in unit shipments of 12 percent. Our decrease in OEM aluminum wheel unit shipments in 2006 compared unfavorably to the decrease of 3 percent in North American automotive production of passenger cars and light trucks. However, production of the specific passenger cars and light trucks using our wheel programs decreased 10 percent compared to our 12 percent decrease in shipments, indicating only a slight decrease in market share. The average selling price of our wheels in 2006 increased approximately 11 percent from 2005, due principally to an increase of 9 percent in the pass-through price of aluminum.
Gross Profit
During 2007, consolidated gross profit increased $23.8 million to $32.5.million, or 3.4 percent of net sales, from $8.7 million, or 1.1 percent of net sales, in 2006, which included $10.1 million of preproduction start-up costs of our new wheel plant in Mexico. Due to a higher level of new wheel programs and additional take-over business, gross profit in 2007 included an additional $4.5 million of wheel program development costs compared to a year ago. These additional costs were more than offset by the 10 percent increase in unit shipments and the increased plant productivity from a 13 percent increase in production. Operational performance improved in our plants in 2007, and our newest wheel plant in Chihuahua, Mexico steadily increased production of larger diameter aluminum wheels. The improvements seen in our financial performance indicate that our multi-year restructuring program is starting to deliver the positive operating results we have been working hard to achieve. Gross profit in the fourth quarter of 2007 also included normal adjustments for physical inventory results and the true-up of workers’ compensation reserves, which were favorable and totaled $2.8 million compared to $0.3 million in 2006.
During 2006, gross profit decreased $40.1 million, or 82 percent, to $8.7 million, or 1.1 percent of net sales, from $48.8 million, or 6.1 percent of net sales, in 2005. Gross profit in 2006 included $10.1 million of preproduction start-up costs of our newest wheel plant in Mexico, compared to only $0.9 million of such costs in 2005. The principal factor impacting our gross profit in 2006 was related to the overall reduction in North American production of passenger cars and light trucks, which was reported as being down by 3 percent. However, domestic OEMs, who are our principal customers, were down 6 percent overall, while production of light trucks was down 13 percent. Being one of those suppliers who sell predominately to GM and Ford and are most heavily oriented to the SUV platforms, we were impacted greatly by these factors. As indicated above, our unit shipments in 2006 decreased 12 percent and our units produced during the same period decreased 15 percent. Accordingly, gross profit in 2006 declined significantly due to the reduced unit shipments and the lost absorption of fixed costs on the sharply reduced production. Gross profit was also impacted, although to a lesser extent, by continued global pricing pressures from our customers, decreased demand for high-volume, high-profit specialty wheels, and operating issues and inefficiencies in two of our Midwest facilities related to productivity on larger diameter wheels.
The cost of aluminum is a significant component in the overall cost of a wheel. Additionally, a portion of our selling prices to OEM customers is attributable to the cost of aluminum. Our selling prices are adjusted periodically to current aluminum market conditions based upon market price changes during specific pricing periods. Theoretically, assuming selling price adjustments and raw material purchase prices move at the same rate, as the price of aluminum increases, the effect is an overall decrease in the gross margin percentage, since the gross profit in absolute dollars would be the same. The opposite would then be true in periods during which the price of aluminum decreases.
Selling, General and Administrative Expenses
Selling, general and administrative expenses were $29.2 million, or 3.0 percent of net sales in 2007, compared to $25.7 million, or 3.3 percent of net sales in 2006 and $21.8 million, or 2.7 percent of net sales in 2005. In accordance with the adoption of SFAS No. 123R, as of the beginning of 2006, we began recording stock-based compensation expense related to all outstanding unvested stock options. The impact on selling, general and administrative expenses in 2007 was $2.6 million, compared to $2.4 million in 2006 and $0.8 million in 2005. See Note 13 – Stock-Based Compensation in Notes to Consolidated Financial Statements in Item 8 – Financial Statements and Supplementary Data of this Annual Report on Form 10-K for additional information regarding stock-based compensation. Other increases in 2007 included professional fees, principally legal and accounting costs of $2.9 million, and payroll related benefit accruals. Selling, general and administrative expenses were $3.9 million higher in 2006 than 2005, due principally to an increase of $1.6 million related to stock-based compensation expense and accruals for professional fees and retirement benefits.
Impairment of Long-Lived Assets and Other Charges
On September 15, 2006, we announced the planned closure of our wheel manufacturing facility located in Johnson City, Tennessee, and the resulting lay off of approximately 500 employees. The planned closure of the Johnson City facility was completed in the first quarter of 2007. This was the latest step in our program to rationalize our production capacity and reduce costs. A pretax asset impairment charge against earnings totaling $4.5 million, reducing the carrying value of certain assets at the Johnson City facility to their respective fair values, was recorded in 2006 when we estimated that the future undiscounted cash flows of our facility would not be sufficient to recover the carrying value of our long-lived assets attributable to that facility. We estimated the fair value of the long-lived assets based on an appraisal of the assets. These assets are classified as held and used, in accordance with SFAS No. 144, “Accounting for the Impairment or Disposal of Long-Lived Assets”.
On June 16, 2006, we announced that we were discontinuing our chrome plating business located in Fayetteville, Arkansas, that would result in a lay off of approximately 225 employees during the third quarter of 2006. This decision was the result of a shift in customer preference to less expensive bright finishing processes that reduced the sales outlook for chromed wheel products. The shift away from chromed wheel products and the resulting impact on the company’s chrome plating business had been previously disclosed in the fourth quarter of 2005, when the company estimated that it would not be able to eventually recover the carrying value of certain machinery and equipment in the chrome plating operation. Accordingly, such assets were written down to their estimated fair value by recording an asset impairment charge against earnings of $7.9 million in the fourth quarter of 2005. Actual expenditures related to machinery and equipment shutdown and removal totaled approximately $0.9 million.
Interest Income, net and Other Income (Expense), net
Interest income, net for the year decreased 34 percent to $3.7 million from $5.6 million in 2006, due principally to a decrease in the average balance invested to $87.1 million from $111.2 million in 2006, offsetting an increase in the average rate of return. Interest income, net in 2006 increased to $5.6 million from $5.3 million in 2005, as the average rate of return in 2006 increased to 4.9 percent from 3.1 percent in 2005. Other income (expense), net in 2007 included a gain on the sale of available-for-sale investments totaling $2.9 million.
Effective Income Tax Rate
Our pretax income (loss) from continuing operations was $10.2 million in 2007, $(16.1) million in 2006, and $23.9 million in 2005. The effective tax rate on the 2007 pretax income from continuing operations was a tax provision of 61.4 percent compared to a benefit of 1.8 percent in 2006 and a tax provision of 40.0 percent in 2005. The relationship of federal tax credits, changes in tax liabilities, permanent tax differences and foreign income, which is taxed at rates other than the U.S. statutory federal rate, to pretax income (loss) from continuing operations are the principal reasons for increases and decreases in the effective income tax rate. We are a multinational company subject to taxation in many jurisdictions. We record liabilities dealing with uncertainty in the application of complex tax laws and regulations in the various taxing jurisdictions in which we operate. If we determine that payment of these liabilities will be unnecessary, we reverse the liability and recognize the tax benefit during the period in which we determine the liability no longer applies. Conversely, we record additional tax liabilities in a period in which we determine that a recorded liability is less than we expect the ultimate assessment to be.
As a multinational corporation, we are subject to taxation in many jurisdictions, and the calculation of our tax liabilities involves dealing with uncertainties in the application of complex tax laws and regulations in the various jurisdictions. The effects of recording liability increases and decreases are included in the effective income tax rate.
In 2007 the company adopted FASB Interpretation No. 48, “Accounting for Uncertainty in Income Taxes” (FIN 48). As a result of adopting the provisions of FIN 48, we recognized a reduction in retained earnings of $16.8 million at January 1, 2007. The initial recording of the liability at adoption of FIN 48 did not impact our effective rate. The effect was recorded as a cumulative effect of accounting change, the recording of a deferred tax asset, a reclassification in our reserve for taxes balance, and an increase to our valuation allowance. Increases and decreases to the liability during the year 2007 were reflected in our current year effective income tax rate, and had an overall increase to our rate of 18.30 percent.
Equity in Earnings of Joint Ventures and Cumulative Effect of Accounting Change
We have two 50 percent owned joint ventures – Topy-Superior Limited (TSL), which earns a commission for marketing our products to potential OEM customers based in Asia, and Suoftec, a manufacturer of both light-weight forged and cast aluminum wheels in Hungary. The investment in these joint ventures is accounted for utilizing the equity method of accounting. Accordingly, our share of joint venture net income is included in the consolidated statements of operations in “Equity in Earnings of Joint Ventures”. The net operating results of the TSL joint venture did not have a material impact on our results of operations or financial condition.
Suoftec Joint Venture
Net sales of our 50-percent owned joint venture in Hungary, Suoftec, increased $13.7 million, or 10.4 percent, in 2007 to $145.7 million from $132.0 million in 2006. The majority of this increase, or 9.6 percent, was due to the sharp increase in the average exchange rate of the U.S. dollar to the euro, the functional currency of the joint venture, with the balance of the increase due to an increase of less than 1 percent in the average selling price. The average exchange rate increased in 2007 to $1.3715 from $1.2510 in 2006. Unit shipments were virtually flat with those of the prior year at 2.3 million units. Net sales in 2006 increased $22.9 million, or 21.0 percent, to $132.0 million from $109.1 million in 2005. The increase in net sales was due to the 15.6 percent increase in unit shipments and a 3.9 percent increase in the average selling price. There was only a minor change in the average exchange rate in 2006 compared to 2005.
Gross profit in 2007 increased slightly to $14.9 million, or 10.3 percent of net sales, from $14.7 million, or 11.2 percent of net sales, in 2006. Gross profit margin in 2007 was impacted negatively by additional unreimbursed wheel development costs and higher utility costs than in the prior year. Gross profit in 2006 decreased $0.8 million to $14.7 million, or 11.2 percent of net sales, from $15.5 million, or 14.2 percent of net sales in 2005, due principally to a 30 percent increase in aluminum costs, which due to contractual arrangements with customers was only partially offset by allowable pass-through price increases.
Selling, general and administrative costs in 2007 were $2.0 million, or 1.4 percent of net sales, compared to $1.7 million, or 1.3 percent of net sales in 2006 and $1.5 million, or 1.4 percent of net sales in 2005. The principal reason for the $0.3 million increase in 2007 over 2006 was the average exchange rate increase in the current year.
The $1.9 million improvement in other income (expense), net in 2007 was due principally to foreign exchange transaction gains increasing by $1.1 million and interest income increasing by $0.4 million.
The statutory income tax rate in Hungary was 16.0 percent in all periods. The annual effective income tax rates were 18.7 percent in 2007, compared to 16.4 percent in 2006 and 15.9 percent in 2005. The increase in 2007 was due to the addition of a new solidarity tax of 4.0 percent. These rates were also impacted slightly by various permanent differences, such as for depreciation of property, plant and equipment.
The resulting net income was $11.2 million in 2007, compared to $10.0 million in 2006 and $10.7 million in 2005. Our 50-percent share of these earnings was $5.6 million, $5.0 million and $5.4 million, respectively. After adjusting for the elimination of intercompany profits on wheels purchased from Suoftec, our equity earnings in each year were $5.2 million in 2007, $4.9 million in 2006 and $5.4 million in 2005.
Cash at the end of 2007 was $29.5 million compared to $24.7 million a year ago. Working capital increased $14.9 million to $55.3 million from $40.4 million at the end of 2006, due principally to a reduction of $5.8 million in current liabilities and the $4.8 million increase in cash. The current ratio increased to 4.9:1 from 3.0:1 a year ago. Capital expenditures in 2007 were $10.5 million, compared to $4.6 million in 2006. There were no dividends declared in 2007 compared to $10.1 million declared in 2006. The joint venture’s cash balance is more than sufficient for future capital expenditure requirements and cash dividends.
Our previous disclosures of summary financial information of Suoftec, did not give effect to any differences between U.S. GAAP and Hungarian accounting rules, since management believed that these differences were not material to any one reporting period. As a result of the restatement of Suoftec equity earnings, to give effect to these differences, we have revised our Suoftec summary financial information, as described in Note 2 – Restatement of Consolidated Financial Statements in Notes to Consolidated Financial Statements in Item 8 – Financial Statements and Supplementary Data of this Annual Report on Form 10-K.
In 2005, we aligned the accounting period for our Suoftec 50-percent owned joint venture with the fiscal year period reported by our other operations. Our share of the joint venture’s net income was previously recorded one month in arrears. The impact of this change in accounting principle added $1.2 million, or $0.05 per diluted share, to our net income in 2005, representing our share of Suoftec’s earnings for the month of December 2004. See Note 7 – Investments in Notes to Consolidated Financial Statements in Item 8 – Financial Statements and Supplementary Data of this Annual Report on Form 10-K for additional information regarding the Suoftec joint venture.
Continuing Operations
Net income from continuing operations in 2007 was $9.3 million, compared to a loss of $10.8 million last year and income of $19.4 million in 2005. Diluted earnings (loss) per share from continuing operations for the year ended December 31, 2007 was $0.35 per diluted share compared to $(0.41) per diluted share in 2006 and $0.73 per diluted share in 2005.
Discontinued Operations
On September 20, 2006, we entered into an agreement with St. Jean Industries, Inc., a Delaware corporation, as buyer, and the buyer’s parent, St. Jean Industries, SAS, a French simplified joint stock company, to sell substantially all of the assets and working capital of our suspension components business for $17.0 million, including a $2.0 million promissory note. The $2.0 million promissory note is due in two equal installments on the 24th and 36th month anniversary date of the completion date, and bears interest at LIBOR plus 1 percent, adjusted quarterly. Discontinued operations for the year ended December 31, 2006, including a $1.1 million pretax gain on disposal, was income of $0.3 million, or $0.01 per diluted share, compared to a loss of $27.8 million, or $(1.05) per diluted share, for the same period in 2005. See Note 17 – Discontinued Operations in Notes to Consolidated Financial Statements in Item 8 – Financial Statements and Supplementary Data of this Annual Report on Form 10-K for further discussion of the disposal of the components business.
Net Income (Loss)
Net income in 2007 was $9.3 million, or 1.0 percent of net sales, compared to a loss in 2006 of $10.5 million, or –1.3 percent of net sales, and a loss of $7.2 million, or –0.9 percent of net sales, in 2005. Diluted earnings (loss) per share was $0.35 per diluted share in 2007 compared to $(0.40) in 2006 and $(0.27) in 2005.
Liquidity and Capital Resources
Our sources of cash liquidity include cash and short-term investments, net cash provided by operating activities, and other external sources of funds. During the three years ended December 31, 2007, we had no long-term debt. At December 31, 2007, our cash and cash equivalents totaled $106.8 million compared to cash and short-term investments totaling $78.1 million a year ago and $107.3 million at the end of 2005. The $38.4 million increase in cash and cash equivalents in 2007 was due principally to net cash provided by operating activities of $74.9 million offsetting net cash used in investing activities and financing activities of $19.9 million and $16.6 million, respectively. The $29.2 million decrease in cash and short-term investments in 2006 was due principally to fund capital expenditure requirements for our new plant in Chihuahua, Mexico. Accordingly, all working capital requirements, investing activities, cash dividend payments and repurchases of our common stock during these three years have been funded from internally generated funds, the exercise of stock options or existing cash and short-term investments. The following table summarizes the cash flows from operating, investing and financing activities as reflected in the consolidated statements of cash flows.
| Fiscal Year End | | 2007 | | | 2006 | | | 2005 | |
| (Thousands of dollars) | | | | | | | | | |
| | | | | | | | | | |
| Net cash provided by operating activities | | $ | 74,858 | | | $ | 36,130 | | | $ | 76,501 | |
| Net cash used in investing activities | | | (19,872 | ) | | | (58,062 | ) | | | (71,775 | ) |
| Net cash used in financing activities | | | (16,602 | ) | | | (17,032 | ) | | | (17,021 | ) |
| | | | | | | | | | | | | |
| Net increase (decrease) in cash and cash equivalents | | $ | 38,384 | | | $ | (38,964 | ) | | $ | (12,295 | ) |
We generate our principal working capital resources primarily through operations. Net cash provided by operating activities increased $38.7 million to $74.9 million in 2007, compared to $36.1 million for the same period a year ago. In addition to the $19.8 million increase in net income, the change in non-cash items was unfavorable by $6.6 million offset by favorable changes in operating assets and liabilities totaling $25.5 million. The principal changes in non-cash items were unfavorable variances in impairment charges of $4.5 million, and equity earnings of joint ventures, net of dividends received, of $3.5 million. The favorable change in operating assets and liabilities was due principally to favorable changes in inventories of $26.6 million, accounts receivable of $11.4 million and income taxes of $8.8 million, reduced by unfavorable changes in funding requirements of accounts payable of $20.2 million.
The favorable change in inventories was due to a reduction in work-in-process and finished goods funding of $11.0 million in the current year versus a funding requirement of $15.6 million a year ago. The favorable change in accounts receivable in the current period was due to the collection of a dividend receivable from our equity joint venture in Hungary, totaling $5.3 million, and a reduction in wheel program development receivables of $3.1 million, compared to an unfavorable change a year ago, due to the recording of the dividend receivable in 2006. The unfavorable change in funding of accounts payable in the current period was due to a lower requirement for capital expenditures for our newest plant in Mexico.
The $74.9 million cash flow from operating activities in 2007, $68.4 million of cash and cash equivalents from a year ago and the $17.8 million cash portion of the proceeds from the sale of certain assets were used in part for capital expenditures of $37.6 million and for cash dividends of $17.0 million. Capital expenditures in 2007 included $25.0 million for our latest wheel facility in Chihuahua, Mexico. The balance of capital expenditures was for automation projects and ongoing improvements in our other wheel facilities.
Net cash provided by operating activities decreased $40.4 million to $36.1 million in 2006, compared to $76.5 million for the same period in 2005. In addition to the $3.3 million decrease in net income, the change in non-cash items was unfavorable by $7.5 million and unfavorable changes in operating assets and liabilities totaled $29.6 million. The principal changes in non-cash items were unfavorable variances in impairment charges of $37.4 million and depreciation and amortization of $7.3 million, reduced by favorable changes in deferred taxes totaling $27.7 million, equity earnings of joint ventures, net of dividends received of $3.8 million and stock-based compensation totaling $2.2 million. The unfavorable change in operating assets and liabilities was due principally to unfavorable changes in funding requirements of income taxes payable, totaling $26.0 million, and accounts receivable totaling $17.9 million, reduced by a favorable change in funding requirements of other assets and liabilities totaling $13.1 million, due principally to the change in funding requirements for payroll and related fringe benefits. The unfavorable change in requirements for income taxes payable in 2006 was due principally to a lower tax liability at the end of fiscal year 2006 compared to the year prior, while the favorable change in 2005 was due to an over payment situation at the end of 2004. The unfavorable change in accounts receivable in 2006 was due to decreased customer sales, resulting in a net cash outflow of $4.3 million compared to a cash inflow of $13.6 million in 2005.
The $36.1 million cash flow from operating activities in 2006, $39.0 million of cash and cash equivalents from 2005 and the $15.0 million cash portion of the proceeds from the sale of our components business were used for capital expenditures of $73.1 million and for cash dividends of $17.0 million. Capital expenditures in 2006 included $54.2 million for our new wheel facility in Chihuahua, Mexico. The balance of capital expenditures was for automation projects and ongoing improvements in our other wheel facilities.
Our financial condition remained strong in 2007. Working capital of $260.5 million at December 31, 2007 included $106.8 million in cash and cash equivalents. The current ratio at year-end was 3.7:1 compared to 3.1:1 a year ago. Accordingly, we believe we are well positioned to take advantage of new and complementary business opportunities, to further expand into international markets and to withstand any moderate downturns in the economy.
Risk Management
We are subject to various risks and uncertainties in the ordinary course of business due, in part, to the competitive global nature of the industry in which we operate, to changing commodity prices for the materials used in the manufacture of our products, and to development of new products.
We have foreign operations in Mexico and Hungary that, due to the settlement of accounts receivable and accounts payable, require the transfer of funds denominated in their respective functional and legal currencies – the Mexican peso and the euro. The value of the Mexican peso in relation to the U.S. dollar in 2007 remained relatively unchanged. The euro experienced an 11 percent increase versus the U.S. dollar in 2007. Foreign currency transaction gains and losses, which are included in other income (expense) in the consolidated statements of operations, have not been significant.
As it relates to foreign currency translation losses, however, since 1990, the Mexican peso has experienced periods of relative stability followed by periods of major declines in value. The impact of these changes in value relative to our Mexico operations has resulted in a cumulative unrealized translation loss at December 31, 2007 of $34.1 million. Since our initial investment in our joint venture in Hungary in 1995, the fluctuations in functional currencies have resulted in a cumulative unrealized translation gain at December 31, 2007 of $8.2 million. Translation gains and losses are included in other comprehensive income (loss) in the consolidated statements of shareholders’ equity.
Our primary risk exposure relating to derivative financial instruments results from the periodic use of foreign currency forward contracts to offset the impact of currency rate fluctuations with regard to foreign-currency-denominated receivables, payables or purchase obligations. At December 31, 2007 and 2006, we held no foreign currency euro forward contracts.
When market conditions warrant, we may also enter into contracts to purchase certain commodities used in the manufacture of our products, such as aluminum, natural gas and other raw materials. Any such commodity commitments are expected to be purchased and used over a reasonable period of time in the normal course of business. Accordingly, pursuant to SFAS No. 133, “Accounting for Derivative Instruments and Hedging Activities,” they are not accounted for as a derivative. We currently have several purchase agreements for the delivery of natural gas through 2008. The contract value and fair value of these purchase commitments approximated $11 million, at December 31, 2007. As of December 31, 2006, the aggregate contract value and fair value of these commitments were $15 million and $12 million, respectively. Percentage changes in the market prices of natural gas will impact the fair value by a similar percentage. We do not hold or purchase any natural gas forward contracts for trading purposes.
Contractual obligations as of December 31, 2007 are as follows (amounts in millions):
| | | Payments Due by Fiscal Year | |
| Contractual Obligations | | 2008 | | | 2009 | | | 2010 | | | 2011 | | | 2012 | | | Thereafter | | | Total | |
| | | | | | | | | | | | | | | | | | | | | | |
| Commodity contracts | | $ | 11 | | | $ | - | | | $ | - | | | $ | - | | | $ | - | | | $ | - | | | $ | 11 | |
| Retirement plans | | | 2 | | | | 2 | | | | 2 | | | | 2 | | | | 2 | | | | 52 | | | | 62 | |
| Operating leases | | | 3 | | | | 3 | | | | 2 | | | | 2 | | | | 1 | | | | - | | | | 11 | |
| | | | | | | | | | | | | | | | | | | | | | | | | | | | | |
| Total | | $ | 16 | | | $ | 5 | | | $ | 4 | | | $ | 4 | | | $ | 3 | | | $ | 52 | | | $ | 84 | |
The table above does not reflect unrecognized tax benefits of $62.2 million, the timing of which is uncertain.
Inflation
Inflation has not had a material impact on our results of operations or financial condition for the three years ended December 31, 2007. Wage increases have averaged 2 to 3 percent during this period and, as indicated above, cost increases of our principal raw material, aluminum, are passed through to our customers. However, cost increases for our other raw materials and for energy may not be similarly recovered in our selling prices. Additionally, the competitive global pricing pressures we have experienced recently are expected to continue, which may also lessen the possibility of recovering these types of cost increases.
Critical Accounting Policies
The preparation of consolidated financial statements in conformity with accounting principles generally accepted in the United States of America requires management to apply significant judgment in making estimates and assumptions that affect amounts reported therein, as well as financial information included in this Management’s Discussion and Analysis of Financial Condition and Results of Operations. These estimates and assumptions, which are based upon historical experience, industry trends, terms of various past and present agreements and contracts, and information available from other sources that are believed to be reasonable under the circumstances, form the basis for making judgments about the carrying values of assets and liabilities that are not readily apparent through other sources. There can be no assurance that actual results reported in the future will not differ from these estimates, or that future changes in these estimates will not adversely impact our results of operations or financial condition.
As described below, the most significant accounting estimates inherent in the preparation of our financial statements include estimates and assumptions as to revenue recognition, inventory valuation, impairment of and the estimated useful lives of our long-lived assets, as well as those used in the determination of liabilities related to self-insured portions of employee benefits, workers’ compensation, general liability programs and taxation.
Revenue Recognition – Our products are manufactured to customer specification under standard purchase orders. We ship our products to OEM customers based on release schedules provided weekly by our customers. Our sales and production levels are highly dependent upon the weekly forecasted production levels of our customers. Sales of these products, net of estimated pricing adjustments, and their related costs are recognized when title and risk of loss transfers to the customer, generally upon shipment. A portion of our selling prices to OEM customers is attributable to the aluminum content of our wheels. Our selling prices are adjusted periodically for changes in the current aluminum market based upon specified aluminum price indices during specific pricing periods, as agreed with our customers. Wheel program development revenues for the development of wheels and components and related initial tooling that are reimbursed by our customers are recognized as such related costs and expenses are incurred and recoverability is confirmed by the issuance of a customer purchase order.
Allowance for Doubtful Accounts – We maintain an allowance for doubtful accounts receivable based upon the expected collectability of all trade receivables. The allowance is reviewed continually and adjusted for accounts deemed uncollectible by management.
Inventories – Inventories are stated at the lower of cost or market value and categorized as raw material, work-in-process or finished goods. When necessary, management uses estimates of net realizable value to record inventory reserves for obsolete and/or slow-moving inventory. Our inventory values, which are based upon standard costs for raw materials and labor and overhead established at the beginning of the year, are adjusted to actual costs on a first-in, first-out (FIFO) basis. Current raw material prices and labor and overhead costs are utilized in developing these adjustments.
Impairment of Long-Lived Assets – In accordance with SFAS No. 144, “Accounting for Impairment or Disposal of Long-Lived Assets”(SFAS No. 144), we periodically review the carrying value of our property and equipment and intangible assets, with finite lives, to test whether current events or circumstances indicate that such carrying value may not be recoverable. If the tests indicate that the carrying value of the asset is greater than the expected undiscounted cash flows to be generated by such asset, then an impairment adjustment needs to be recognized. Such adjustments consist of the amount by which the carrying value of such asset exceeds fair value. We generally measure fair value by considering sale prices for similar assets or by discounting estimated future cash flows from such asset using an appropriate discount rate. Considerable management judgment is necessary to estimate the fair value of assets, and accordingly, actual results could vary significantly from such estimates. Assets to be disposed of are carried the lower of their carrying value or fair value less costs to sell.
Retirement Plans – Subject to certain vesting requirements, our unfunded retirement plan generally provides for a benefit based on final average compensation, which becomes payable on the employee’s death or upon attaining age 65, if retired. The net periodic pension cost and related benefit obligations are based on, among other things, assumptions of the discount rate, future salary increases and the mortality of the participants. The net periodic pension costs and related obligations are measured using actuarial techniques and assumptions. See Note 10 – Retirement Plans in Notes to Consolidated Financial Statements in Item 8 – Financial Statements and Supplementary Data for a description of these assumptions.
The following information illustrates the sensitivity to a change in certain assumptions of our unfunded retirement plans as of December 31, 2007. Note that these sensitivities may be asymmetrical, and are specific to 2007. They also may not be additive, so the impact of changing multiple factors simultaneously cannot be calculated by combining the individual sensitivities shown. The effect of the indicated increase (decrease) in selected factors is shown below (in thousands):
| | | | | | Increase (Decrease) in: | |
| | | | | Projected Benefit | | | | |
| | | | | Obligation | | | 2007 | |
| | | Percentage | | at December 31, | | | Net Periodic | |
| Assumption | | Change | | 2007 | | | Pension Cost | |
| | | | | | | | | | | | | | | | | | |
| Discount rate | | + 1.0% | | $ | (2,154 | ) | | $ | (181 | ) |
| Rate of compensation increase | | + 1.0% | | $ | 779 | | | $ | 164 | |
Stock-Based Compensation – Prior to January 1, 2006, we applied APB Opinion No. 25, “Accounting for Stock Issued to Employees,” and its related Interpretations and provided the required pro forma disclosures under SFAS No. 123, “Accounting for Stock-Based Compensation.” In accordance with APB Opinion No. 25, a non-cash, stock-based compensation expense was to be recognized for any options for which the exercise price was below the market price on the actual grant date. The charge for the options with an exercise price below the market price on the actual grant date was equal to the number of options multiplied by the difference between the exercise price and the market price of the option shares on the actual grant date. That expense was to be amortized over the vesting period of the option. Beginning January 1, 2006, we have accounted for stock-based compensation using the fair value of stock options using a Black-Scholes valuation model.. Accordingly, during fiscal year 2006 and 2007, we recorded stock-based compensation cost totaling the amount that would have been recognized had the fair value method under SFAS No. 123 been applied since the effective date of SFAS No. 123 for any unvested pre-fiscal 2006 grants and under SFAS No. 123R for the fiscal year 2006 and 2007 grants, using the Black-Scholes option-pricing model. Option-pricing models require the input of highly subjective assumptions, including the option’s expected life, stock price volatility of the underlying stock, an expected dividend yield and a risk-free interest rate. See Note 13 – Stock-Based Compensation in Notes to the Consolidated Financial Statements in Item 8 – Financial Statements and Supplementary Data for a detailed description of these assumptions.
Product Liability and Loss Reserves – Workers’ compensation accruals are based upon reported claims in process and actuarial estimates for losses incurred but not reported. Loss reserves, including incurred but not reported reserves, are estimated using actuarial methods and ultimate settlements may vary significantly from such estimates due to increased claims frequency or the severity of claims.
Accounting for in Income Taxes – Despite our belief that our tax return positions are consistent with applicable tax laws, experience has shown that taxing authorities can challenge certain positions. Settlement of any challenge can result in no change, a complete disallowance or some partial adjustment reached through negotiations or even litigation. Accordingly, accounting judgment is required in evaluating our tax positions, which are adjusted only in light of substantive changes in facts and circumstances, such as the resolution of an audit by taxing authorities or the expiration of a statute of limitations. Accordingly, our tax expense for a given period will include provisions for newly identified uncertainties, as well as reductions for uncertainties resolved through audit, expiration of a statute of limitations, audit adjustments, estimates of future earnings, changes in the valuation allowance, or other substantive changes in facts and circumstances. We believe that the determination to record a valuation allowance to reduce a deferred income tax asset is a significant accounting estimate because it is based on an estimate of future taxable income in the United States and certain other jurisdictions, which is susceptible to change and may or may not occur, and because the impact of adjusting a valuation allowance may be material.
The company adopted FIN 48 during 2007. The purpose of FIN 48 is to clarify accounting for uncertain tax positions recognized. FIN 48 utilizes a two-step approach to evaluate tax positions. Recognition, step one, requires evaluation of the tax position to determine if based solely on technical merits it is more likely than not to be sustained upon examination. Measurement, step two, is addressed only if a position is more likely than not to be sustained. In step two, the tax benefit is measured as the largest amount of benefit, determined on a cumulative probability basis, which is more likely than not to be realized upon ultimate settlement with tax authorities. If a position does not meet the more likely than not threshold for recognition in step one, no benefit is recorded until the first subsequent period in which the more likely than not standard is met, the issue is resolved with the taxing authority, or the statute of limitations expires. Positions previously recognized are derecognized when a Company subsequently determines the position no longer is more likely than not to be sustained. Evaluation of tax positions, their technical merits, and measurement using cumulative probability are highly subjective management estimates. Actual results could differ materially from these estimates.
As a result of adopting the provisions of FIN 48, we recognized a reduction in retained earnings of $16.8 million at January 1, 2007. The initial recording of the liability at adoption of FIN 48 did not impact our effective rate. The effect was recorded as a cumulative effect of accounting change, the recording of a deferred tax asset, a reclassification in our reserve for taxes account, and an increase to our valuation allowance.
Included in the unrecognized tax benefits of $62.2 million, at December 31, 2007 was $29.1 million of tax benefit that, if recognized, would reduce our annual effective tax rate.
Within the next twelve-month period ending December 31, 2008, it is reasonably possible that up to $3.6 million of unrecognized tax benefits will be recognized due to the expiration of certain statues of limitation.
New Accounting Standards
In September 2006, the Financial Accounting Standards Board (FASB) issued SFAS No. 157, “Fair Value Measurements” (SFAS No. 157). SFAS No. 157 establishes a common definition for fair value to be applied to U.S. GAAP guidance requiring use of fair value, establishes a framework for measuring fair value, and expands disclosure about such fair value measurements. SFAS No. 157 is effective for fiscal years beginning after November 15, 2007. In February 2008, the FASB decided to issue a final Staff Position to allow a one-year deferral of adoption of SFAS No. 157 for nonfinancial assets and nonfinancial liabilities that are recognized or disclosed at fair value in the financial statements on a nonrecurring basis. The FASB also decided to amend SFAS No. 157 to exclude Statement of Financial Accounting Standard No. 13 and its related interpretive accounting pronouncements that address leasing transactions. We are currently evaluating the expected impact on our financial statements of adopting SFAS No. 157.
In February 2007, the FASB issued SFAS No. 159, “The Fair Value Option for Financial Assets and Financial Liabilities” (SFAS No. 159) which provides companies with an option to report selected financial assets and liabilities at fair value. The objective of SFAS No. 159 is to reduce both the complexity in accounting for financial instruments and the volatility in earnings caused by measuring related assets and liabilities differently. SFAS No. 159 also establishes presentation and disclosure requirements designed to facilitate comparisons between companies that choose different measurement attributes for similar types of assets and liabilities. SFAS No. 159 is effective for fiscal years beginning after November 15, 2007. We do not expect the adoption of SFAS No. 159 to have a material effect on our operating results or financial position.
ITEM 7A – QUANTITATIVE AND QUALITATIVE DISCLOSURES ABOUT MARKET RISK
Information related to Quantitative and Qualitative Disclosures About Market Risk are set forth in Item 1A – Risk Factors and Item 7 – Management’s Discussion and Analysis of Financial Condition and Results of Operation, under the caption “Risk Management”.
ITEM 8 – FINANCIAL STATEMENTS AND SUPPLEMENTARY DATA
| Index to the Consolidated Financial Statements And Financial Statement Schedule: |
| | | | PAGE |
| | | | |
| | 35 |
| | | | | |
| Financial Statements | | |
| | | | | |
| | | | |
| | | | | 37 |
| | | | |
| | | | 38 |
| | | | |
| | | | |
| | | | | 39 |
| | | | | |
| | | | |
| | | | | 41 |
| | | | | |
| | | | 42 |
| | | | | |
| | Supporting Financial Statement Schedule Covered By Forgoing | | |
| | Report of Independent Registered Public Accounting Firm: | | |
| | | Schedule II – Valuation and Qualifying Accounts and Reserves | | S-1 |
| | | | | |
| | | | | |
| | All other financial statement schedules have been omitted as they are not applicable, not | |
| | material or the required information is included in the financial statements or notes thereto. | |
| | | | | |
| | | | | |
Report of Independent Registered Public Accounting Firm
To the Board of Directors and Shareholders
of Superior Industries International, Inc.
In our opinion, the consolidated financial statements listed in the accompanying index present fairly, in all material respects, the financial position of Superior Industries International, Inc. and its subsidiaries at December 30, 2007 and December 31, 2006, and the results of their operations and their cash flows for each of the three years in the period ended December 30, 2007 in conformity with accounting principles generally accepted in the United States of America. Additionally, in our opinion, the financial statement schedule listed in the accompanying index presents fairly, in all material respects, the information set forth therein when read in conjunction with the related consolidated financial statements. Also in our opinion, the Company did not maintain, in all material respects, effective internal control over financial reporting as of December 30, 2007, based on criteria established in Internal Control - Integrated Framework issued by the Committee of Sponsoring Organizations of the Treadway Commission (COSO), because a material weakness in internal control over financial reporting related to the completeness, accuracy and valuation of the accounting for and disclosure of income taxes existed as of that date. A material weakness is a deficiency, or a combination of deficiencies, in internal control over financial reporting, such that there is a reasonable possibility that a material misstatement of the annual or interim financial statements will not be prevented or detected on a timely basis. The material weakness referred to above is described in Management's Report on Internal Control Over Financial Reporting appearing under Item 9A. We considered this material weakness in determining the nature, timing, and extent of audit tests applied in our audit of the 2007 consolidated financial statements and our opinion regarding the effectiveness of the Company’s internal control over financial reporting does not affect our opinion on those consolidated financial statements. The Company's management is responsible for these financial statements and financial statement schedule, for maintaining effective internal control over financial reporting and for its assessment of the effectiveness of internal control over financial reporting, included in management’s report referred to above. Our responsibility is to express opinions on these financial statements, on the financial statement schedule, and on the Company's internal control over financial reporting based on our integrated audits. We conducted our audits in accordance with the standards of the Public Company Accounting Oversight Board (United States). Those standards require that we plan and perform the audits to obtain reasonable assurance about whether the financial statements are free of material misstatement and whether effective internal control over financial reporting was maintained in all material respects. Our audits of the financial statements included examining, on a test basis, evidence supporting the amounts and disclosures in the financial statements, assessing the accounting principles used and significant estimates made by management, and evaluating the overall financial statement presentation. Our audit of internal control over financial reporting included obtaining an understanding of internal control over financial reporting, assessing the risk that a material weakness exists, and testing and evaluating the design and operating effectiveness of internal control based on the assessed risk. Our audits also included performing such other procedures as we considered necessary in the circumstances. We believe that our audits provide a reasonable basis for our opinions.
As discussed in Note 2 to the consolidated financial statements, the Company has restated its 2006 and 2005 consolidated financial statements.
As discussed in Note 1 to the consolidated financial statements, the Company changed the manner in which it accounts for uncertain tax positions in 2007 and the manner in which accounts it accounts for share-based compensation in 2006.
A company’s internal control over financial reporting is a process designed to provide reasonable assurance regarding the reliability of financial reporting and the preparation of financial statements for external purposes in accordance with generally accepted accounting principles. A company’s internal control over financial reporting includes those policies and procedures that (i) pertain to the maintenance of records that, in reasonable detail, accurately and fairly reflect the transactions and dispositions of the assets of the company; (ii) provide reasonable assurance that transactions are recorded as necessary to permit preparation of financial statements in accordance with generally accepted accounting principles, and that receipts and expenditures of the company are being made only in accordance with authorizations of management and directors of the company; and (iii) provide reasonable assurance regarding prevention or timely detection of unauthorized acquisition, use, or disposition of the company’s assets that could have a material effect on the financial statements.
Because of its inherent limitations, internal control over financial reporting may not prevent or detect misstatements. Also, projections of any evaluation of effectiveness to future periods are subject to the risk that controls may become inadequate because of changes in conditions, or that the degree of compliance with the policies or procedures may deteriorate.
/s/ PricewaterhouseCoopers LLP
Los Angeles, California
March 31, 2008
SUPERIOR INDUSTRIES INTERNATIONAL, INC. CONSOLIDATED STATEMENTS OF OPERATIONS
(Thousands of dollars, except per share amounts)
| Fiscal Year | | 2007 | | | 2006 | | | 2005 | |
| | | | | | As restated | | | As restated | |
| | | | | | | | | | |
| NET SALES | | $ | 956,892 | | | $ | 789,862 | | | $ | 804,161 | |
| Cost of sales | | | 924,400 | | | | 781,122 | | | | 755,337 | |
| | | | | | | | | | | | | |
| GROSS PROFIT | | | 32,492 | | | | 8,740 | | | | 48,824 | |
| | | | | | | | | | | | | |
| Selling, general and administrative expenses | | | 29,171 | | | | 25,679 | | | | 21,802 | |
| Impairments of long-lived assets | | | - | | | | 4,470 | | | | 7,855 | |
| | | | | | | | | | | | | |
| INCOME (LOSS) FROM OPERATIONS | | | 3,321 | | | | (21,409 | ) | | | 19,167 | |
| | | | | | | | | | | | | |
| Interest income, net | | | 3,684 | | | | 5,589 | | | | 5,329 | |
| Other income (expense), net | | | 3,195 | | | | (268 | ) | | | (588 | ) |
| | | | | | | | | | | | | |
| INCOME (LOSS) FROM CONTINUING OPERATIONS | | | | | | | | | | | | |
| BEFORE INCOME TAXES AND EQUITY EARNINGS | | | 10,200 | | | | (16,088 | ) | | | 23,908 | |
| | | | | | | | | | | | | |
| Income tax (provision) benefit | | | (6,263 | ) | | | 285 | | | | (9,572 | ) |
| Equity in earnings of joint ventures | | | 5,355 | | | | 5,004 | | | | 5,039 | |
| | | | | | | | | | | | | |
| NET INCOME (LOSS) FROM CONTINUING OPERATIONS | | | 9,292 | | | | (10,799 | ) | | | 19,375 | |
| | | | | | | | | | | | | |
| Income (loss) from discontinued operations, net of taxes | | | - | | | | 257 | | | | (27,811 | ) |
| | | | | | | | | | | | | |
| NET INCOME (LOSS) BEFORE CUMULATIVE EFFECT | | | | | | | | | |
| OF ACCOUNTING CHANGE | | | 9,292 | | | | (10,542 | ) | | | (8,436 | ) |
| | | | | | | | | | | | | |
| Cumulative effect of accounting change, net of taxes | | | - | | | | - | | | | 1,225 | |
| | | | | | | | | | | | | |
| NET INCOME (LOSS) | | $ | 9,292 | | | $ | (10,542 | ) | | $ | (7,211 | ) |
| | | | | | | | | | | | | |
| EARNINGS (LOSS) PER SHARE - BASIC: | | | | | | | | | | | | |
| | | | | | | | | | | | | |
| Net income (loss) from continuing operations | | $ | 0.35 | | | $ | (0.41 | ) | | $ | 0.73 | |
| Income (loss) from discontinued operations, net of taxes | | | - | | | | 0.01 | | | | (1.05 | ) |
| Cumulative effect of accounting change, net of taxes | | | - | | | | - | | | | 0.05 | |
| Net income (loss) | | $ | 0.35 | | | $ | (0.40 | ) | | $ | (0.27 | ) |
| | | | | | | | | | | | | |
| EARNINGS (LOSS) PER SHARE - DILUTED: | | | | | | | | | | | | |
| | | | | | | | | | | | | |
| Net income (loss) from continuing operations | | $ | 0.35 | | | $ | (0.41 | ) | | $ | 0.73 | |
| Income (loss) from discontinued operations, net of taxes | | | - | | | | 0.01 | | | | (1.05 | ) |
| Cumulative effect of accounting change, net of taxes | | | - | | | | - | | | | 0.05 | |
| Net income (loss) | | $ | 0.35 | | | $ | (0.40 | ) | | $ | (0.27 | ) |
See notes to consolidated financial statements.
SUPERIOR INDUSTRIES INTERNATIONAL, INC. CONSOLIDATED BALANCE SHEETS
(Thousands of dollars, except per share amounts)
| Fiscal Year End | | 2007 | | | 2006 | |
| | | | | | As restated | |
| ASSETS | | | | | | |
| Current assets: | | | | | | |
| Cash and cash equivalents | | $ | 106,769 | | | $ | 68,385 | |
| Short-term investments | | | - | | | | 9,750 | |
| Accounts receivable, net | | | 125,704 | | | | 138,552 | |
| Inventories, net | | | 107,170 | | | | 118,724 | |
| Income taxes receivable | | | 6,677 | | | | - | |
| Deferred income taxes | | | 6,569 | | | | 6,416 | |
| Other current assets | | | 3,190 | | | | 4,766 | |
| Total current assets | | | 356,079 | | | | 346,593 | |
| | | | | | | | | |
| Property, plant and equipment, net | | | 302,253 | | | | 310,414 | |
| Investments | | | 51,055 | | | | 46,739 | |
| Non-current deferred tax asset, net | | | 12,673 | | | | - | |
| Other assets | | | 7,862 | | | | 8,759 | |
| | | | | | | | | |
| Total assets | | $ | 729,922 | | | $ | 712,505 | |
| | | | | | | | | |
| LIABILITIES AND SHAREHOLDERS' EQUITY | | | | | | | | |
| Current liabilities: | | | | | | | | |
| Accounts payable | | $ | 51,603 | | | $ | 60,959 | |
| Accrued expenses | | | 43,993 | | | | 41,898 | |
| Income taxes payable | | | - | | | | 9,226 | |
| Total current liabilities | | | 95,596 | | | | 112,083 | |
| | | | | | | | | |
| Non-current tax liabilities (Note 8) | | | 62,223 | | | | - | |
| Executive retirement liabilities | | | 21,530 | | | | 21,666 | |
| Non-current deferred tax liabilities, net | | | - | | | | 15,642 | |
| Commitments and contingent liabilities (Note 12) | | | | | | | | |
| Shareholders' equity: | | | | | | | | |
| Preferred stock, $25.00 par value | | | | | | | | |
| Authorized - 1,000,000 shares | | | | | | | | |
| Issued - none | | | - | | | | - | |
| Common stock, $0.50 par value | | | | | | | | |
| Authorized - 100,000,000 shares | | | | | | | | |
| Issued and outstanding - 26,633,440 shares | | | | | | | | |
| (26,610,191 shares at December 31, 2006) | | | 13,317 | | | | 13,305 | |
| Additional paid-in capital | | | 38,516 | | | | 35,094 | |
| Accumulated other comprehensive loss | | | (28,578 | ) | | | (37,129 | ) |
| Retained earnings | | | 527,318 | | | | 551,844 | |
| Total shareholders' equity | | | 550,573 | | | | 563,114 | |
| | | | | | | | | |
| Total liabilities and shareholders' equity | | $ | 729,922 | | | $ | 712,505 | |
See notes to consolidated financial statements.
SUPERIOR INDUSTRIES INTERNATIONAL, INC. CONSOLIDATED STATEMENTS OF SHAREHOLDERS’ EQUITY AND COMPREHESIVE INCOME (LOSS)
(Thousands of dollars, except per share amounts)
| | | | | | | | | | | | Accumulated | | | | | | | |
| | | Common Stock | | | Additional | | | Other | | | | | | | |
| | | Number of | | | | | | Paid-In | | | Comprehensive | | | Retained | | | | |
| As restated | | Shares | | | Amount | | | Capital | | | Income (Loss) | | | Earnings | | | Total | |
| | | | | | | | | | | | | | | | | | | |
| BALANCE AT FISCAL YEAR END | | | | | | | | | | | | | | | | |
| 2004, AS REPORTED | | | 26,621,191 | | | $ | 13,310 | | | $ | 31,484 | | | $ | (38,586 | ) | | $ | 598,511 | | | $ | 604,719 | |
| | | | | | | | | | | | | | | | | | | | | | | | | |
| Cumulative effect of error | | | | | | | | | | | | | | | | | | | | | | | | |
| corrections (Note 2) | | | - | | | | - | | | | - | | | | (11 | ) | | | 5,023 | | | | 5,012 | |
| | | | | | | | | | | | | | | | | | | | | | | | | |
| BALANCE AT FISCAL YEAR END | | | | | | | | | | | | | | | | | | | | | |
| 2004, AS RESTATED | | | 26,621,191 | | | | 13,310 | | | | 31,484 | | | | (38,597 | ) | | | 603,534 | | | | 609,731 | |
| | | | | | | | | | | | | | | | | | | | | | | | | |
| Comprehensive loss: | | | | | | | | | | | | | | | | | | | | | | | | |
| Net loss, as restated | | | - | | | | - | | | | - | | | | - | | | | (7,211 | ) | | | (7,211 | ) |
| Other comprehensive loss | | | - | | | | - | | | | - | | | | (2,200 | ) | | | - | | | | (2,200 | ) |
| Comprehensive loss | | | | | | | | | | | | | | | | | | | | | | | (9,411 | ) |
| | | | | | | | | | | | | | | | | | | | | | | | | |
| Stock-based compensation | | | | | | | | | | | | | | | | | | | | | | | | |
| expense | | | - | | | | - | | | | 817 | | | | - | | | | - | | | | 817 | |
| | | | | | | | | | | | | | | | | | | | | | | | | |
| Stock options exercised, | | | | | | | | | | | | | | | | | | | | | | | | |
| net of related tax benefit | | | 5,000 | | | | 3 | | | | 130 | | | | - | | | | - | | | | 133 | |
| | | | | | | | | | | | | | | | | | | | | | | | | |
| Repurchase of common stock | | | (16,000 | ) | | | (8 | ) | | | (369 | ) | | | - | | | | - | | | | (377 | ) |
| | | | | | | | | | | | | | | | | | | | | | | | | |
| Cash divided declared | | | | | | | | | | | | | | | | | | | | | | | | |
| ($0.635 per share) | | | - | | | | - | | | | - | | | | - | | | | (16,905 | ) | | | (16,905 | ) |
| BALANCE AT FISCAL YEAR END | | | | | | | | | | | | | | | | | | | | | |
| 2005, AS RESTATED | | | 26,610,191 | | | | 13,305 | | | | 32,062 | | | | (40,797 | ) | | | 579,418 | | | | 583,988 | |
| | | | | | | | | | | | | | | | | | | | | | | | | |
| Comprehensive income (loss): | | | | | | | | | | | | | | | | | | | | | | | | |
| Net loss, as restated | | | - | | | | - | | | | - | | | | - | | | | (10,542 | ) | | | (10,542 | ) |
| Other comprehensive income | | | - | | | | - | | | | - | | | | 5,458 | | | | - | | | | 5,458 | |
| Comprehensive loss | | | | | | | | | | | | | | | | | | | | | | | (5,084 | ) |
| | | | | | | | | | | | | | | | | | | | | | | | | |
| Stock-based compensation | | | | | | | | | | | | | | | | | | | | | | | | |
| expense | | | - | | | | - | | | | 3,032 | | | | - | | | | - | | | | 3,032 | |
| | | | | | | | | | | | | | | | | | | | | | | | | |
| Adjustment to initially apply | | | | | | | | | | | | | | | | | | | | | | | | |
| SFAS No. 158 | | | - | | | | - | | | | - | | | | (1,790 | ) | | | - | | | | (1,790 | ) |
| | | | | | | | | | | | | | | | | | | | | | | | | |
| Repurchase of common stock | | | - | | | | - | | | | - | | | | - | | | | - | | | | - | |
| | | | | | | | | | | | | | | | | | | | | | | | | |
| Cash divided declared | | | | | | | | | | | | | | | | | | | | | | | | |
| ($0.64 per share) | | | - | | | | - | | | | - | | | | - | | | | (17,032 | ) | | | (17,032 | ) |
| BALANCE AT FISCAL YEAR END | | | | | | | | | | | | | | | | | | | | | |
| 2006, AS RESTATED | | | 26,610,191 | | | $ | 13,305 | | | $ | 35,094 | | | $ | (37,129 | ) | | $ | 551,844 | | | $ | 563,114 | |
SUPERIOR INDUSTRIES INTERNATIONAL, INC.
CONSOLIDATED STATEMENTS OF SHAREHOLDERS’ EQUITY AND COMPREHESIVE INCOME (LOSS)
(Thousands of dollars, except per share amounts)
| | | | | | | | | | | | Accumulated | | | | | | | |
| | | Common Stock | | | Additional | | | Other | | | | | | | |
| | | Number of | | | | | | Paid-In | | | Comprehensive | | | Retained | | | | |
| | | Shares | | | Amount | | | Capital | | | Income (Loss) | | | Earnings | | | Total | |
| | | | | | | | | | | | | | | | | | | |
| BALANCE AT FISCAL YEAR END | | | | | | | | | | | | | | | | |
| 2006, AS RESTATED | | | 26,610,191 | | | $ | 13,305 | | | $ | 35,094 | | | $ | (37,129 | ) | | $ | 551,844 | | | $ | 563,114 | |
| | | | | | | | | | | | | | | | | | | | | | | | | |
| Cumulative effect of adoption | | | | | | | | | | | | | | | | | | | | | |
| of FIN 48 (Note 8) | | | - | | | | - | | | | - | | | | - | | | | (16,786 | ) | | | (16,786 | ) |
| | | | | | | | | | | | | | | | | | | | | | | | | |
| Comprehensive income: | | | | | | | | | | | | | | | | | | | | | | | | |
| Net income | | | - | | | | - | | | | - | | | | - | | | | 9,292 | | | | 9,292 | |
| Other comprehensive income | | | - | | | | - | | | | - | | | | 8,551 | | | | - | | | | 8,551 | |
| Comprehensive income | | | | | | | | | | | | | | | | | | | | | | | 17,843 | |
| | | | | | | | | | | | | | | | | | | | | | | | | |
| Stock-based compensation | | | | | | | | | | | | | | | | | | | | | | | | |
| expense | | | - | | | | - | | | | 3,073 | | | | - | | | | - | | | | 3,073 | |
| | | | | | | | | | | | | | | | | | | | | | | | | |
| Stock options exercised | | | 23,249 | | | | 12 | | | | 418 | | | | - | | | | - | | | | 430 | |
| | | | | | | | | | | | | | | | | | | | | | | | | |
| Repricing of stock option grants | | | - | | | | - | | | | (57 | ) | | | - | | | | - | | | | (57 | ) |
| | | | | | | | | | | | | | | | | | | | | | | | | |
| Tax impact of stock options | | | | | | | | | | | | | | | | | | | | | | | | |
| exercised | | | - | | | | - | | | | (12 | ) | | | - | | | | - | | | | (12 | ) |
| | | | | | | | | | | | | | | | | | | | | | | | | |
| Cash dividend declared | | | | | | | | | | | | | | | | | | | | | | | | |
| ($0.64 per share) | | | - | | | | - | | | | - | | | | - | | | | (17,032 | ) | | | (17,032 | ) |
| BALANCE AT FISCAL | | | | | | | | | | | | | | | | | | | | | | | | |
| YEAR END 2007 | | | 26,633,440 | | | $ | 13,317 | | | $ | 38,516 | | | $ | (28,578 | ) | | $ | 527,318 | | | $ | 550,573 | |
See notes to consolidated financial statements.
SUPERIOR INDUSTRIES INTERNATIONAL, INC. CONSOLIDATED STATEMENTS OF CASH FLOW
(Thousands of dollars)
| Fiscal Year | | 2007 | | | 2006 | | | 2005 | |
| | | | | | As restated | | | As restated | |
| | | | | | | | | | |
| NET INCOME (LOSS) | | $ | 9,292 | | | $ | (10,542 | ) | | $ | (7,211 | ) |
| Adjustment to reconcile net income (loss) to net cash | | | | | | | | | | | | |
| provided by operating activities: | | | | | | | | | | | | |
| | | | | | | | | | | | | |
| Depreciation and amortization | | | 42,925 | | | | 39,137 | | | | 46,468 | |
| Equity in earnings of joint ventures, net of dividends received | | | 258 | | | | 3,723 | | | | (73 | ) |
| Stock-based compensation | | | 3,073 | | | | 3,032 | | | | 817 | |
| Impairments of long-lived assets | | | - | | | | 4,470 | | | | 41,895 | |
| Deferred income taxes | | | 5,890 | | | | 5,285 | | | | (22,417 | ) |
| Other non-cash items | | | 3,667 | | | | 4,936 | | | | 1,494 | |
| Gain on sale of available for sale securities | | | (2,906 | ) | | | - | | | | - | |
| Gain on sale of discontinued operations | | | - | | | | (1,077 | ) | | | - | |
| Cumulative effect of accounting change | | | - | | | | - | | | | (1,225 | ) |
| Changes in operating assets and liabilities: | | | | | | | | | | | | |
| Accounts receivable | | | 7,136 | | | | (4,278 | ) | | | 13,647 | |
| Inventories | | | 11,037 | | | | (15,568 | ) | | | (16,838 | ) |
| Other assets | | | 2,330 | | | | 3,100 | | | | (604 | ) |
| Accounts payable | | | (9,310 | ) | | | 10,915 | | | | 10,916 | |
| Income taxes | | | 350 | | | | (8,485 | ) | | | 17,528 | |
| Other liabilities | | | 241 | | | | 1,482 | | | | (7,896 | ) |
| Non-current tax liabilities | | | 875 | | | | - | | | | - | |
| NET CASH PROVIDED BY OPERATING ACTIVITIES | | | 74,858 | | | | 36,130 | | | | 76,501 | |
| | | | | | | | | | | | | |
| CASH FLOWS FROM INVESTING ACTIVITIES: | | | | | | | | | | | | |
| | | | | | | | | | | | | |
| Additions to property, plant and equipment | | | (37,639 | ) | | | (73,062 | ) | | | (100,800 | ) |
| Proceeds from a held-to-maturity security | | | 9,750 | | | | - | | | | 29,025 | |
| Proceeds from sale of available-for-sale securities | | | 5,198 | | | | - | | | | - | |
| Proceeds from sale of fixed assets | | | 1,530 | | | | - | | | | - | |
| Proceeds from affordable-housing partnership investment | | | 1,289 | | | | - | | | | - | |
| Proceeds from sale of discontinued operations | | | - | | | | 15,000 | | | | - | |
| NET CASH USED IN INVESTING ACTIVITIES | | | (19,872 | ) | | | (58,062 | ) | | | (71,775 | ) |
| | | | | | | | | | | | | |
| CASH FLOWS FROM FINANCING ACTIVITIES: | | | | | | | | | | | | |
| | | | | | | | | | | | | |
| Cash dividends paid | | | (17,032 | ) | | | (17,032 | ) | | | (16,772 | ) |
| Stock options exercised | | | 430 | | | | - | | | | 128 | |
| Repurchases of common stock | | | - | | | | - | | | | (377 | ) |
| NET CASH USED IN FINANCING ACTIVITIES | | | (16,602 | ) | | | (17,032 | ) | | | (17,021 | ) |
| | | | | | | | | | | | | |
| Net increase (decrease) in cash and cash equivalents | | | 38,384 | | | | (38,964 | ) | | | (12,295 | ) |
| | | | | | | | | | | | | |
| Cash and cash equivalents at the beginning of the year | | | 68,385 | | | | 107,349 | | | | 119,644 | |
| | | | | | | | | | | | | |
| Cash and cash equivalents at the end of the year | | $ | 106,769 | | | $ | 68,385 | | | $ | 107,349 | |
See notes to consolidated financial statements.
SUPERIOR INDUSTRIES INTERNATIONAL, INC. NOTES TO CONSOLIDATED FINANCIAL STATEMENTS
NOTE 1 - SUMMARY OF SIGNIFICANT ACCOUNTING POLICIES
Business Description
Headquartered in Van Nuys, California, our principal business is the design and manufacture of aluminum road wheels for sale to OEMs. We are one of the largest suppliers of cast and forged aluminum wheels to the world’s leading automobile and light truck manufacturers, with wheel manufacturing operations in the United States, Mexico and Hungary. Customers in North America represent the principal market for our products, with approximately 19 percent of our products being sold to international customers.
GM, Ford and Chrysler LLC together represented approximately 82 percent of our annual sales in 2007 and 86 percent and 85 percent of annual sales in 2006 and 2005, respectively. Although the loss of all or a substantial portion of our sales to any of these customers would have a significant adverse impact on our financial results, unless the lost volume could be replaced, we believe this risk is partially offset due to long-term relationships with each, including multi-year program arrangements. However, recent global competition pricing pressures have put these multi-year arrangements at risk. Including our 50 percent-owned joint venture in Europe, we also manufacture aluminum wheels for, Audi, BMW, Fiat, Isuzu, Jaguar, Land Rover, Mazda, Mercedes Benz, Mitsubishi, Nissan, Seat, Skoda, Subaru, Suzuki, Toyota, Volkswagen and Volvo.
On September 20, 2006, we entered into an agreement with St. Jean Industries, Inc., a Delaware corporation, as buyer, and the buyer’s parent, St. Jean Industries, SAS, a French simplified joint stock company, to sell substantially all of the assets and working capital of our suspension components business for $17.0 million. See Note 17 – Discontinued Operations for further discussion of the aluminum suspension components business.
On September 15, 2006, we announced the planned closure of our wheel manufacturing facility located in Johnson City, Tennessee, and the resulting lay off of approximately 500 employees. The closure was completed at the end of the first quarter of 2007. This was the latest step in our program to rationalize our production capacity and reduce costs. A pretax asset impairment charge against earnings totaling $4.5 million, reducing the carrying value of certain assets at the Johnson City facility to their respective fair values, was recorded in 2006.
Presentation of Consolidated Financial Statements
The consolidated financial statements include the accounts of the company and its wholly owned subsidiaries. All significant intercompany transactions are eliminated in consolidation. Affiliated 50 percent-owned joint ventures are recorded in the financial statements using the equity method of accounting. The carrying value of these equity investments is reported in long-term investments and the company’s equity in net earnings of these investments is reported separately in the consolidated statements of operations.
In 2005, we changed the method of recording our 50 percent share of Suoftec earnings from recording on a one-month lag to recording the results of operations on a current basis. The purpose of the change was to have this 50 percent-owned investee report on the same basis as our fiscal reporting period, as its financial information is now available on a timely basis. As a result, net income for the year ended December 31, 2005 includes a cumulative effect of accounting change of $1.2 million, representing the company’s share of Suoftec’s net income for the month of December 2004.
We have made a number of estimates and assumptions related to the reporting of assets, liabilities, revenues and expenses to prepare these financial statements in conformity with accounting principles generally accepted in the United States of America. Generally, assets and liabilities that are subject to estimation and judgment include the allowance for doubtful accounts, inventory valuation reserves, depreciation and amortization periods of long-lived assets, self-insurance accruals, fair value of stock-based compensation and income taxes. While actual results could differ, we believe such estimates to be reasonable.
Our fiscal year is the 52- or 53-week period ending on the last Sunday of the calendar year. The fiscal year 2007 comprised the 52-week period ended on December 30, 2007. The 2006 fiscal year comprised the 53-week period ended on December 31, 2006 while fiscal year 2005 comprises the 52-week period ended on December 25, 2005. For convenience of presentation, all fiscal years are referred to as beginning as of January 1 and ending as of December 31, but actually reflect our financial position and results of operations for the periods described above.
Cash and Cash Equivalents
Cash and cash equivalents generally consist of cash, certificates of deposit, money market funds and short-term, highly liquid investments with original maturities of three months or less. Our cash and cash equivalents are not subject to significant interest rate risk due to the short maturities of these investments. At times throughout the year and at year-end, cash balances held at financial institutions were in excess of federally insured limits.
Marketable Investments
Marketable debt and equity securities, not classified as cash equivalents, are classified as held-to-maturity or available-for-sale. Securities are classified as held-to-maturity when we have the positive intent and ability to hold the securities to maturity. We record held-to-maturity securities, which are stated at amortized cost, as either short-term or long-term on the balance sheet based upon contractual maturity dates. Securities not classified as held-to-maturity are classified as available-for-sale and are carried at fair value, with the associated unrealized gains and losses, net of deferred taxes, excluded from operating results and reported in shareholders’ equity as a component of accumulated other comprehensive income (loss) until realized, or until any unrealized losses are determined to be other than temporary, at which time the losses would be recognized in our operating results. The fair values of securities are determined based upon quoted market prices. Gains or losses on securities sold are based on the specific identification method.
In the first quarter of 2007, the short-term corporate debt security, which was classified as held-to-maturity as of December 31, 2006, matured and was redeemed for $9.8 million. In addition, long-term corporate equity securities, which were classified as available-for-sale at the end of 2006, were sold for $5.1 million and gains totaling $2.9 million were recognized in our operating results in other income (expense), net. As of December 31, 2007, we held no short-term investments.
Fair Values of Financial Instruments and Commitments
The carrying amounts for cash and cash equivalents, short-term investments, accounts receivable, accounts payable and accrued expenses approximate their fair values due to the short period of time until maturity. Fair values of long-term marketable investments and future purchase commitments, which are discussed further in Note 12 – Commitments and Contingent Liabilities, are based upon quoted market prices.
Inventories
Inventories, which are categorized as raw materials, work-in-process or finished goods, are stated at the lower of cost or market using the first-in, first-out method.
Property, Plant and Equipment
Property, plant and equipment are carried at cost, less accumulated depreciation. The cost of additions, improvements and interest during construction, if any, are capitalized. Our maintenance and repair costs are charged to expense when incurred. Depreciation is calculated generally on the straight-line method based on the estimated useful lives of the assets.
| Classification | Expected Useful Life |
| | |
| Computer equipment | 3 to 5 years |
| Production machinery and equipment | 7 to 10 years |
| Buildings | 25 years |
When property and equipment is replaced, retired or disposed of, the cost and related accumulated depreciation are removed from the accounts. Property and equipment no longer used in operations, which are generally insignificant in amount, are stated at the lower of cost or estimated net realizable value. Gains and losses, if any, are recorded in other income or expense in the period of disposition or write down.
Impairment of Long-Lived Assets
The company’s policy regarding long-lived assets is to evaluate the recoverability of its assets at least annually or when the facts and circumstances suggest that the assets may be impaired. This assessment of recoverability is performed based on the estimated undiscounted cash flows compared to the carrying value of the assets. If the future cash flows (undiscounted and without interest charges) are less than the carrying value, a write-down would be recorded to reduce the related asset to its estimated fair value. See Note 16 – Impairment of Long-Lived Assets and Other Charges for further discussion of asset impairments.
Derivative Instruments and Hedging Activities
We may periodically enter into foreign currency forward contracts to reduce the risk from exchange rate fluctuations associated with future purchase commitments, such as wheel purchases denominated in euros from our 50 percent owned joint venture in Hungary. This type of risk management activity, which attempts to protect our planned gross margin as of the date of the purchase commitment, may qualify as a cash flow hedge under SFAS No. 133, “Accounting for Derivative Instruments and Hedging Activities.” Accordingly, we assess whether the cash flow hedge is effective both at inception and periodically thereafter. The effective portion of the related gains and losses is recorded as an asset or liability in the consolidated balance sheets with the offset as a component of other comprehensive income (loss) in shareholders’ equity. The ineffective portion of related gains or losses, if any, is reported in current earnings. As hedged transactions are consummated, amounts previously accumulated in other comprehensive income (loss) are reclassified into current earnings. At December 31, 2007 and 2006, we held no euro forward contracts.
We also enter into contracts to purchase certain commodities used in the manufacture of our products, such as aluminum, natural gas, and other raw materials. Such contracts are considered normal purchases as the commodities are physically delivered and, therefore, pursuant to SFAS No. 133 are not accounted for as derivatives. See Note 12 – Commitments and Contingent Liabilities for additional information pertaining to these purchase commitments.
Foreign Currency Transactions
We have foreign operations in Mexico and Hungary that, due to the settlement of accounts receivable and accounts payable, require the transfer of funds denominated in their respective functional currencies – the Mexican peso and the euro. Foreign currency asset and liability accounts are translated using the exchange rates in effect at the end of the accounting period. Revenue and expense accounts are translated at the weighted average of exchange rates during the period. The cumulative effect of translation is recorded as a separate component of accumulated other comprehensive income (loss) in shareholders' equity, as reflected in Note 15 – Other Comprehensive Income (Loss). Foreign exchange transaction gains and (losses) of $0.5 million, $(0.0) million and $(0.9) million have been recorded as part of other income, net during 2007, 2006 and 2005, respectively.
Revenue Recognition
Sales of products and any related costs are recognized when title and risk of loss transfers to the purchaser, generally upon shipment. Wheel program development revenues and initial tooling that are reimbursed by our customers are recognized as such related costs and expenses are incurred and recoverability is probable, generally upon issuance of a customer purchase order. Wheel program development revenues totaled $12.4 million in 2007, $19.8 million in 2006, and $18.6 million in 2005, and are included in net sales in the consolidated statements of operations.
Research and Development
Research and development costs (primarily engineering and related costs), which are expensed as incurred, are included in cost of sales in the consolidated statements of operations. Amounts expended during each of the three years in the period ended December 31, 2007 were $6.3 million in 2007, $6.8 million in 2006, and $9.6 million in 2005.
Stock-Based Compensation
Effective January 1, 2006, we adopted the fair value recognition provisions of SFAS No. 123 (revised 2004), "Share-Based Payment" (SFAS No. 123R), using the modified prospective transition method and, therefore, have not restated results for prior periods. Under this transition method, stock-based compensation expense for the years subsequent to December 31, 2005 include compensation expense for all stock-based compensation awards granted prior to, but not yet vested as of January 1, 2006, based on the grant date fair value estimated in accordance with the provisions of SFAS No. 123. For options granted subsequent to January 1, 2006, such expense is in accordance with the provisions of SFAS No. 123R. We recognize these compensation costs on a straight-line basis over the requisite service period of the award, which is generally the option vesting term of four years. Prior to the adoption of SFAS No. 123R, we recognized stock-based compensation expense in accordance with the intrinsic value method that followed the recognition and measurement principles of Accounting Principles Board (APB) Opinion No. 25, "Accounting for Stock Issued to Employees" (APB 25), and we provided pro forma disclosure amounts in accordance with SFAS No. 148, “Accounting for Stock-Based Compensation – Transition and Disclosure” (SFAS No. 148), as if the fair value method defined by SFAS No. 123 had been applied to our stock-based compensation. In March 2005, the SEC issued Staff Accounting Bulletin No. 107 (SAB 107) regarding the SEC's interpretation of SFAS No. 123R and the valuation of share-based payments for public companies. We have applied the provisions of SAB 107 in our adoption of SFAS No. 123R.
Since the only awards issued under our equity incentive plans have been, and are currently, stock option awards, the stock-based compensation expense recorded in 2007 and 2006, as detailed in Note 13 – Stock-Based Compensation presents the impact of the adoption of SFAS No. 123R. This expense is comparable to the previously disclosed stock-based compensation expense presented as pro forma information. The table below reflects the pro forma net earnings and basic and diluted earnings (loss) per share for the year ended December 31, 2005, had we applied the fair value recognition provisions of SFAS No. 123:
| Year Ended December 31, | | 2005 | |
| (Thousands of dollars) | | As restated | |
| | | | |
| Net loss | | $ | (7,211 | ) |
| Stock-based compensation expense included | | | | |
| in reported net loss, net of taxes | | | 531 | |
| Stock-based compensation expense determined | | | | |
| under fair value method for all awards, net of | | | | |
| taxes | | | (5,617 | ) |
| | | | | |
| Pro forma net loss | | $ | (12,297 | ) |
| | | | | |
| Year Ended December 31, | | 2005 | |
| | | As restated | |
| | | | |
| Loss per share: | | | |
| Basic – as reported | | $ | (0.27 | ) |
| Basic – pro forma | | $ | (0.46 | ) |
| | | | | |
| Diluted – as reported | | $ | (0.27 | ) |
| Diluted – pro forma | | $ | (0.46 | ) |
Income Taxes
We account for income taxes using the asset and liability method. The asset and liability method requires the recognition of deferred tax assets and liabilities for expected future tax consequences of temporary differences that currently exist between the tax basis and financial reporting basis of our assets and liabilities. We calculate current and deferred tax provisions based on estimates and assumptions that could differ from actual results reflected on the income tax returns filed during the following years. Adjustments based on filed returns are recorded when identified in the subsequent years.
The effect on deferred taxes for a change in tax rates is recognized in income in the period of enactment. In assessing the realizability of deferred tax assets, we consider whether it is more likely than not that some portion of the deferred tax assets will not be realized. A valuation allowance is provided for deferred income taxes when, in our judgment, based upon currently available information and other factors, it is more likely than not that all or a portion of such deferred income tax assets will not be realized. The determination of the need for a valuation allowance is based on an on-going evaluation of current information including, among other things, estimates of future earnings in different taxing jurisdictions and the expected timing of the reversals of temporary differences. We believe that the determination to record a valuation allowance to reduce a deferred income tax asset is a significant accounting estimate because it is based on an estimate of future taxable income in the United States and certain other jurisdictions, which is susceptible to change and may or may not occur, and because the impact of adjusting a valuation allowance may be material.
The company adopted FIN 48 during 2007. The purpose of FIN 48 is to clarify accounting for uncertain tax positions recognized. FIN 48 utilizes a two-step approach to evaluate tax positions. Recognition, step one, requires evaluation of the tax position to determine if based solely on technical merits it is more likely than not to be sustained upon examination. Measurement, step two, is addressed only if a position is more likely than not to be sustained. In step two, the tax benefit is measured as the largest amount of benefit, determined on a cumulative probability basis, which is more likely than not to be realized upon ultimate settlement with tax authorities. If a position does not meet the more likely than not threshold for recognition in step one, no benefit is recorded until the first subsequent period in which the more likely than not standard is met, the issue is resolved with the taxing authority, or the statute of limitations expires. Positions previously recognized are derecognized when a Company subsequently determines the position no longer is more likely than not to be sustained. Evaluation of tax positions, their technical merits, and measurement using cumulative probability are highly subjective management estimates. Actual results could differ materially from these estimates.
Presently we have not recorded a deferred tax liability for temporary differences related to investments in foreign subsidiaries that are essentially permanent in duration. These temporary differences may become taxable upon a repatriation of earnings from the subsidiaries or a sale or liquidation of the subsidiaries. At this time the company does not have any plans to repatriate income from its foreign subsidiaries.
The company adopted FIN 48 during 2007. Our tax positions are analyzed at least quarterly, and adjustments are made as events occur to warrant adjustment. As a result of adopting the provisions of FIN 48, we recognized a reduction in retained earnings of $16.8 million at January 1, 2007. The initial recording of the liability at adoption of FIN 48 did not impact our effective rate. The effect was recorded as a cumulative effect of accounting change, the recording of a deferred tax asset, a reclassification in our reserve for taxes account, and an increase to our valuation allowance. Increases and decreases to the liability during the year 2007 were reflected in our current year effective income tax rate, and had an overall increase to our rate of 18.30 percent.
Earnings (Loss) Per Share
As summarized below, basic earnings (loss) per share is computed by dividing net income (loss) for the period by the weighted average number of common shares outstanding for the period. For purposes of calculating diluted earnings per share, net income is divided by the total of the weighted average shares outstanding plus the dilutive effect of our outstanding stock options under the treasury stock method, which includes consideration of stock-based compensation required by SFAS No. 123R and SFAS No. 128, “Earnings Per Share.”
| Year Ended December 31, | | 2007 | | | 2006 | | | 2005 | |
| (Thousands of dollars, except per share amounts) | | | | | As restated | | | As restated | |
| | | | | | | | | | |
| Basic Earnings (Loss) Per Share | | | | | | | | | |
| | | | | | | | | | |
| Reported net income (loss) | | $ | 9,292 | | | $ | (10,542 | ) | | $ | (7,211 | ) |
| | | | | | | | | | | | | |
| Weighted average shares outstanding | | | 26,617 | | | | 26,610 | | | | 26,614 | |
| | | | | | | | | | | | | |
| Basic earnings (loss) per share | | $ | 0.35 | | | $ | (0.40 | ) | | $ | (0.27 | ) |
| | | | | | | | | | | | | |
| Diluted Earnings (Loss) Per Share | | | | | | | | | | | | |
| | | | | | | | | | | | | |
| Reported net income (loss) | | $ | 9,292 | | | $ | (10,542 | ) | | $ | (7,211 | ) |
| | | | | | | | | | | | | |
| Weighted average shares outstanding | | | 26,617 | | | | 26,610 | | | | 26,614 | |
| Weighted average dilutive stock options | | | 18 | | | | - | | | | 6 | |
| | | | | | | | | | | | | |
| Weighted average shares outstanding - diluted | | | 26,635 | | | | 26,610 | | | | 26,620 | |
| | | | | | | | | | | | | |
| Diluted earnings (loss) per share | | $ | 0.35 | | | $ | (0.40 | ) | | $ | (0.27 | ) |
The following potential shares of common stock were excluded from the diluted earnings per share calculations because they would have been anti-dilutive due to their exercise prices exceeding the market prices for the respective periods: for the year ended December 31, 2007, options to purchase 3,147,792 shares at prices ranging from $21.72 to $43.22 and for the year ended December 31, 2005, options to purchase 2,292,775 shares at prices ranging from $24.80 to $42.87 per share.
New Accounting Standards
In September 2006, the Financial Accounting Standards Board issued SFAS No. 157, “Fair Value Measurements” (SFAS No. 157). SFAS No. 157 establishes a common definition for fair value to be applied to U.S. GAAP guidance requiring use of fair value, establishes a framework for measuring fair value, and expands disclosure about such fair value measurements. SFAS No. 157 is effective for fiscal years beginning after November 15, 2007. In February 2008, the FASB decided to issue a final Staff Position to allow a one-year deferral of adoption of SFAS No. 157 for nonfinancial assets and nonfinancial liabilities that are recognized or disclosed at fair value in the financial statements on a nonrecurring basis. The FASB also decided to amend SFAS No. 157 to exclude FASB Statement No. 13 and its related interpretive accounting pronouncements that address leasing transactions. We are currently evaluating the expected impact on its financial statements of adopting SFAS No. 157.
In February 2007, the FASB issued SFAS No. 159, “The Fair Value Option for Financial Assets and Financial Liabilities” (SFAS No. 159) which provides companies with an option to report selected financial assets and liabilities at fair value. The objective of SFAS No. 159 is to reduce both the complexity in accounting for financial instruments and the volatility in earnings caused by measuring related assets and liabilities differently. SFAS No. 159 also establishes presentation and disclosure requirements designed to facilitate comparisons between companies that choose different measurement attributes for similar types of assets and liabilities. SFAS No. 159 is effective for fiscal years beginning after November 15, 2007. We do not expect the adoption of SFAS No. 159 to have a material effect on our operating results or financial position.
NOTE 2 – RESTATEMENT OF PRIOR PERIODS’ FINANCIAL STATEMENTS
During the fourth quarter of 2007, we identified errors in the accounting for certain tax liabilities and we determined the cumulative impact of known differences in our accounting for our equity method investment in Suoftec, relating to differences between U.S. GAAP and those accepted in Hungary which we considered immaterial to any individual reporting period, requires restatement. These errors are more fully described below. In accordance with the provisions of Statement on Financial Accounting Standards No. 154 – “Accounting Changes and Error Corrections", we have restated our prior years’ financial statements. Details of the restatements for fiscal years 2005 and 2006 are included below.
The following table details the net income effect of these corrections for fiscal years 2005 and 2006:
| | | Net | | | | | | | | | | |
| | | Income (Loss) | | | Income Tax | | | Equity Earnings | | | Net | |
| | | as Previously | | | (Provision) | | | (Losses) of | | | Income (Loss) | |
| Fiscal Year | | Reported | | | Benefit | | | Joint Ventures | | | as Restated | |
| (Thousands of dollars) | | | | | | | | | | | | |
| | | | | | | | | | | | | |
| Cumulative error - beginning of fiscal 2005 | | | $ | 4,360 | | | $ | 663 | | | | |
| | | | | | | | | | | | | | | |
| 2005 | | $ | (6,367 | ) | | | (677 | ) | | | (167 | ) | | $ | (7,211 | ) |
| 2006 | | $ | (9,321 | ) | | | (1,249 | ) | | | 28 | | | $ | (10,542 | ) |
| | | | | | | | | | | | | | | | | |
| Cumulative error - end of fiscal 2006 | | | | | | $ | 2,434 | | | $ | 524 | | | | | |
Restatement of Tax Liabilities
During the preparation and review of our 2007 income tax provision, we discovered that we had not properly reconciled our tax liabilities primarily related to differences between the net book basis and the net tax basis of our depreciable property, plant and equipment and several other miscellaneous deferred tax liabilities. Other unreconciled deferred tax differences approximating $0.5 million were also identified. As a result of completing the necessary reconciliations for each year since 2002, we identified the errors listed above.
The following tables detail the effect of the corrections to our previously reported income tax provisions for fiscal years 2006 and 2005:
| Year Ended December 31, 2006 | | As reported | | | Adjustments | | | As restated | |
| (Thousands of dollars) | | | | | | | | | |
| | | | | | | | | | |
| Continuing operations | | | | | | | | | |
| Current Taxes | | | | | | | | | |
| Federal | | $ | 1,329 | | | $ | 1,027 | | | $ | 2,356 | |
| State | | | (1,029 | ) | | | - | | | | (1,029 | ) |
| Foreign | | | (3,925 | ) | | | - | | | | (3,925 | ) |
| Total Current | | | (3,625 | ) | | | 1,027 | | | | (2,598 | ) |
| Deferred Taxes | | | | | | | | | | | | |
| Federal | | | 6,084 | | | | (1,763 | ) | | | 4,321 | |
| State | | | 687 | | | | (513 | ) | | | 174 | |
| Foreign | | | (1,612 | ) | | | - | | | | (1,612 | ) |
| Total Deferred Taxes | | | 5,159 | | | | (2,276 | ) | | | 2,883 | |
| | | | | | | | | | | | | |
| (Provision) benefit for income taxes from: | | | | | | | | | | | | |
| | | | | | | | | | | | | |
| Continuing operations | | $ | 1,534 | | | $ | (1,249 | ) | | $ | 285 | |
| | | | | | | | | | | | | |
| Discontinued operations | | $ | (173 | ) | | $ | - | | | $ | (173 | ) |
| Year Ended December 31, 2005 | | As reported | | | Adjustments | | | As restated | |
| (Thousands of dollars) | | | | | | | | | |
| | | | | | | | | | |
| Continuing operations | | | | | | | | | |
| Current Taxes | | | | | | | | | |
| Federal | | $ | (10,949 | ) | | $ | - | | | $ | (10,949 | ) |
| State | | | (3,005 | ) | | | - | | | | (3,005 | ) |
| Foreign | | | (4,648 | ) | | | - | | | | (4,648 | ) |
| Total Current | | | (18,602 | ) | | | - | | | | (18,602 | ) |
| Deferred Taxes | | | | | | | | | | | | |
| Federal | | | 6,015 | | | | (758 | ) | | | 5,257 | |
| State | | | 579 | | | | 81 | | | | 660 | |
| Foreign | | | 3,113 | | | | - | | | | 3,113 | |
| Total Deferred Taxes | | | 9,707 | | | | (677 | ) | | | 9,030 | |
| | | | | | | | | | | | | |
| (Provision) benefit for income taxes from: | | | | | | | | | | | | |
| | | | | | | | | | | | | |
| Continuing operations | | $ | (8,895 | ) | | $ | (677 | ) | | $ | (9,572 | ) |
| | | | | | | | | | | | | |
| Discontinued operations | | $ | 18,852 | | | $ | - | | | $ | 18,852 | |
The following tables detail the effect of the corrections to our previously reported reconciliation of the statutory United States federal income tax rate for fiscal years 2006 and 2005:
| Year Ended December 31, 2006 | | As reported | | | Adjustments | | | As restated | |
| | | | | | | | | | |
| Statutory rate - (provision) benefit | | | 35.0 | % | | | - | % | | | 35.0 | % |
| State tax (provisions), net of federal income tax benefit | | | (1.9 | ) | | | - | | | | (1.9 | ) |
| Permanent differences | | | (18.0 | ) | | | (7.7 | ) | | | (25.7 | ) |
| Tax credits | | | 0.8 | | | | - | | | | 0.8 | |
| Foreign income taxed at rates of than the statutory rate | | | 3.2 | | | | - | | | | 3.2 | |
| Valuation allowance | | | (4.4 | ) | | | - | | | | (4.4 | ) |
| Changes in reserves, net | | | (3.7 | ) | | | - | | | | (3.7 | ) |
| Other | | | (1.5 | ) | | | - | | | | (1.5 | ) |
| | | | | | | | | | | | | |
| Effective income tax rate for continuing operations | | | 9.5 | % | | | (7.7 | ) % | | | 1.8 | % |
| Year Ended December 31, 2005 | | As reported | | | Adjustments | | | As restated | |
| | | | | | | | | | |
| Statutory rate - (provision) benefit | | | (35.0 | ) % | | | - | % | | | (35.0 | ) % |
| State tax (provisions), net of federal income tax benefit | | | (6.6 | ) | | | - | | | | (6.6 | ) |
| Permanent differences | | | 0.2 | | | | (2.8 | ) | | | (2.6 | ) |
| Tax credits | | | 3.2 | | | | - | | | | 3.2 | |
| Foreign income taxed at rates of than the statutory rate | | | 2.8 | | | | - | | | | 2.8 | |
| Valuation allowance | | | (3.0 | ) | | | - | | | | (3.0 | ) |
| Changes in reserves, net | | | (1.1 | ) | | | - | | | | (1.1 | ) |
| Other | | | 2.3 | | | | - | | | | 2.3 | |
| | | | | | | | | | | | | |
| Effective income tax rate for continuing operations | | | (37.2 | ) % | | | (2.8 | ) % | | | (40.0 | ) % |
The following table details the effects of the corrections to our previously reported tax effects of temporary differences for fiscal year 2006:
| Year Ended December 31, 2006 | | As reported | | | Adjustments | | | As restated | |
| (Thousands of dollars) | | | | | | | | | |
| | | | | | | | | | |
| Deferred Tax Assets | | | | | | | | | |
| Other comprehensive income and loss adjustments | | $ | 658 | | | $ | - | | | $ | 658 | |
| Reserves for deductible in the future | | | 7,435 | | | | - | | | | 7,435 | |
| Deferred compensation | | | 9,786 | | | | - | | | | 9,786 | |
| Net loss carryforward | | | - | | | | - | | | | - | |
| Tax credit carryforward | | | - | | | | - | | | | - | |
| Differences with financial and tax accounting related | | | | | | | | | | | | |
| to foreign operations | | | - | | | | - | | | | - | |
| State taxes expensed currently, deductible for taxes | | | | | | | | | | | | |
| in the following year | | | 1,221 | | | | - | | | | 1,221 | |
| | | | 19,100 | | | | - | | | | 19,100 | |
| Valuation allowance | | | (1,418 | ) | | | | | | | (1,418 | ) |
| | | | | | | | | | | | | |
| Net deferred tax assets | | | 17,682 | | | | - | | | | 17,682 | |
| | | | | | | | | | | | | |
| Deferred Tax Liabilities | | | | | | | | | | | | |
| Differences between the book and tax basis of property, plant | | | | | | | | | |
| and equipment | | | (18,140 | ) | | | 1,407 | | | | (16,733 | ) |
| Differences between financial and tax accounting associated | | | | | | | | | |
| with foreign operations | | | (12,100 | ) | | | - | | | | (12,100 | ) |
| Other | | | 1,925 | | | | - | | | | 1,925 | |
| | | | | | | | | | | | | |
| Deferred tax liabilities | | | (28,315 | ) | | | 1,407 | | | | (26,908 | ) |
| | | | | | | | | | | | | |
| Net Deferred Tax Asset (Liability) | | $ | (10,633 | ) | | $ | 1,407 | | | $ | (9,226 | ) |
Restatement of Equity Method Investment in Suoftec
During the fourth quarter of 2007, we determined the cumulative impact of known differences in our accounting for our equity method investment in Suoftec and our summary financial information presented for Suoftec, which we considered to be immaterial to any individual reporting period, required restatement. The errors relate to the quantification and recording of the adjustments to report the Suoftec earnings on the basis of U.S. GAAP versus on the Hungarian accounting rules followed by Suoftec. These differences principally relate to overhead cost capitalization into inventory and deferred income taxes on property, plant and equipment.
The following tables detail the effect of the corrections to our previously reported Summary Statements of Operations for Suoftec for fiscal years 2006 and 2005:
| Summary Statement of Operation - Suoftec | | | | | | | | | |
| Year Ended December 31, 2006 | | As reported | | | Adjustments | | | As restated | |
| (Thousands of dollars) | | | | | | | | | |
| | | | | | | | | | |
| Net sales | | $ | 132,020 | | | $ | - | | | $ | 132,020 | |
| Cost of sales | | | 117,323 | | | | (29 | ) | | | 117,294 | |
| | | | | | | | | | | | | |
| Gross profit | | | 14,697 | | | | 29 | | | | 14,726 | |
| | | | | | | | | | | | | |
| Selling, general and administrative expenses | | | 1,680 | | | | - | | | | 1,680 | |
| | | | | | | | | | | | | |
| Income from operations | | | 13,017 | | | | 29 | | | | 13,046 | |
| | | | | | | | | | | | | |
| Other income (expense), net | | | (1,096 | ) | | | - | | | | (1,096 | ) |
| | | | | | | | | | | | | |
| Income before income taxes | | | 11,921 | | | | 29 | | | | 11,950 | |
| | | | | | | | | | | | | |
| Income tax (provision) benefit | | | (1,980 | ) | | | 26 | | | | (1,954 | ) |
| | | | | | | | | | | | | |
| Net income | | $ | 9,941 | | | $ | 55 | | | $ | 9,996 | |
| | | | | | | | | | | | | |
| Superior's share of net income | | $ | 4,971 | | | $ | 28 | | | $ | 4,998 | |
| Summary Statement of Operation - Suoftec | | | | | | | | | |
| Year Ended December 31, 2005 | | As reported | | | Adjustments | | | As restated | |
| (Thousands of dollars) | | | | | | | | | |
| | | | | | | | | | |
| Net sales | | $ | 109,131 | | | $ | - | | | $ | 109,131 | |
| Cost of sales | | | 93,191 | | | | 410 | | | | 93,601 | |
| | | | | | | | | | | | | |
| Gross profit | | | 15,940 | | | | (410 | ) | | | 15,530 | |
| | | | | | | | | | | | | |
| Selling, general and administrative expenses | | | 1,514 | | | | - | | | | 1,514 | |
| | | | | | | | | | | | | |
| Income from operations | | | 14,426 | | | | (410 | ) | | | 14,016 | |
| | | | | | | | | | | | | |
| Other income (expense), net | | | (1,242 | ) | | | - | | | | (1,242 | ) |
| | | | | | | | | | | | | |
| Income before income taxes | | | 13,184 | | | | (410 | ) | | | 12,774 | |
| | | | | | | | | | | | | |
| Income tax (provision) benefit | | | (2,111 | ) | | | 76 | | | | (2,035 | ) |
| | | | | | | | | | | | | |
| Net income (loss) | | $ | 11,073 | | | $ | (334 | ) | | $ | 10,739 | |
| | | | | | | | | | | | | |
| Superior's share of net income (loss) | | $ | 5,537 | | | $ | (167 | ) | | $ | 5,370 | |
The following table details the effect of the corrections to our previously reported Summary Balance Sheet for Suoftec as of December 31, 2006:
| Summary Balance Sheet - Suoftec | | | | | | | | | |
| as of December 31, 2006 | | As reported | | | Adjustments | | | As restated | |
| (Thousands of dollars) | | | | | | | | | |
| | | | | | | | | | |
| Cash and cash equivalents | | $ | 24,688 | | | $ | - | | | $ | 24,688 | |
| Accounts receivable, net | | | 21,420 | | | | - | | | | 21,420 | |
| Inventories, net | | | 13,904 | | | | 328 | | | | 14,232 | |
| | | | | | | | | | | | | |
| Total current assets | | | 60,012 | | | | 328 | | | | 60,340 | |
| | | | | | | | | | | | | |
| Property, plant and equipment, net | | | 37,878 | | | | - | | | | 37,878 | |
| Other assets | | | 201 | | | | 708 | | | | 909 | |
| Total assets | | | 98,091 | | | | 1,036 | | | | 99,127 | |
| | | | | | | | | | | | | |
| Current liabilities | | | 19,885 | | | | 53 | | | | 19,938 | |
| Non-current liabilities | | | 42 | | | | - | | | | 42 | |
| | | | | | | | | | | | | |
| Total liabilities | | | 19,927 | | | | 53 | | | | 19,980 | |
| | | | | | | | | | | | | |
| Net assets | | $ | 78,164 | | | $ | 983 | | | $ | 79,147 | |
| | | | | | | | | | | | | |
| Superior's share of net assets | | $ | 39,082 | | | $ | 492 | | | $ | 39,574 | |
Restatement of Financial Statements
The “Adjustments” column in the following tables reflects the effect of the corrections to our previously reported financial statements indicated above.
SUPERIOR INDUSTRIES INTERNATIONAL, INC.
CONSOLIDATED STATEMENT OF OPERATIONS
(Thousands of dollars, except per share amounts)
| Fiscal Year 2006 | | As reported | | | Adjustments | | | As restated | |
| | | | | | | | | | |
| NET SALES | | $ | 789,862 | | | $ | - | | | $ | 789,862 | |
| Cost of sales | | | 781,122 | | | | - | | | | 781,122 | |
| | | | | | | | | | | | | |
| GROSS PROFIT | | | 8,740 | | | | - | | | | 8,740 | |
| | | | | | | | | | | | | |
| Selling, general and administrative expenses | | | 25,679 | | | | - | | | | 25,679 | |
| Impairments of long-lived assets | | | 4,470 | | | | - | | | | 4,470 | |
| | | | | | | | | | | | | |
| INCOME (LOSS) FROM OPERATIONS | | | (21,409 | ) | | | - | | | | (21,409 | ) |
| | | | | | | | | | | | | |
| Interest income, net | | | 5,589 | | | | - | | | | 5,589 | |
| Other income (expense), net | | | (268 | ) | | | - | | | | (268 | ) |
| | | | | | | | | | | | | |
| INCOME (LOSS) FROM CONTINUING OPERATIONS | | | | | | | | | | | | |
| BEFORE INCOME TAXES AND EQUITY EARNINGS | | | (16,088 | ) | | | - | | | | (16,088 | ) |
| | | | | | | | | | | | | |
| Income tax (provision) benefit | | | 1,534 | | | | (1,249 | ) | | | 285 | |
| Equity in earnings of joint ventures | | | 4,976 | | | | 28 | | | | 5,004 | |
| | | | | | | | | | | | | |
| NET INCOME (LOSS) FROM CONTINUING OPERATIONS | | | (9,578 | ) | | | (1,221 | ) | | | (10,799 | ) |
| | | | | | | | | | | | | |
| Income (loss) from discontinued operations, net of taxes | | | 257 | | | | - | | | | 257 | |
| | | | | | | | | | | | | |
| NET INCOME (LOSS) BEFORE CUMULATIVE EFFECT | | | | | | | | | |
| OF ACCOUNTING CHANGE | | | (9,321 | ) | | | (1,221 | ) | | | (10,542 | ) |
| | | | | | | | | | | | | |
| Cumulative effect of accounting change, net of taxes | | | - | | | | - | | | | - | |
| | | | | | | | | | | | | |
| NET INCOME (LOSS) | | $ | (9,321 | ) | | $ | (1,221 | ) | | $ | (10,542 | ) |
| | | | | | | | | | | | | |
| EARNINGS (LOSS) PER SHARE - BASIC: | | | | | | | | | | | | |
| | | | | | | | | | | | | |
| Net income (loss) from continuing operations | | $ | (0.36 | ) | | $ | (0.05 | ) | | $ | (0.41 | ) |
| Income (loss) from discontinued operations, net of taxes | | | 0.01 | | | | - | | | | 0.01 | |
| Cumulative effect of accounting change, net of taxes | | | - | | | | - | | | | - | |
| Net income (loss) | | $ | (0.35 | ) | | $ | (0.05 | ) | | $ | (0.40 | ) |
| | | | | | | | | | | | | |
| EARNINGS (LOSS) PER SHARE - DILUTED: | | | | | | | | | | | | |
| | | | | | | | | | | | | |
| Net income (loss) from continuing operations | | $ | (0.36 | ) | | $ | (0.05 | ) | | $ | (0.41 | ) |
| Income (loss) from discontinued operations, net of taxes | | | 0.01 | | | | - | | | | 0.01 | |
| Cumulative effect of accounting change, net of taxes | | | - | | | | - | | | | - | |
| Net income (loss) | | $ | (0.35 | ) | | $ | (0.05 | ) | | $ | (0.40 | ) |
See notes to consolidated financial statements.
SUPERIOR INDUSTRIES INTERNATIONAL, INC.
CONSOLIDATED STATEMENT OF OPERATIONS
(Thousands of dollars, except per share amounts)
| Fiscal Year 2005 | | As reported | | | Adjustments | | | As restated | |
| | | | | | | | | | |
| NET SALES | | $ | 804,161 | | | $ | - | | | $ | 804,161 | |
| Cost of sales | | | 755,337 | | | | - | | | | 755,337 | |
| | | | | | | | | | | | | |
| GROSS PROFIT | | | 48,824 | | | | - | | | | 48,824 | |
| | | | | | | | | | | | | |
| Selling, general and administrative expenses | | | 21,802 | | | | - | | | | 21,802 | |
| Impairments of long-lived assets | | | 7,855 | | | | - | | | | 7,855 | |
| | | | | | | | | | | | | |
| INCOME (LOSS) FROM OPERATIONS | | | 19,167 | | | | - | | | | 19,167 | |
| | | | | | | | | | | | | |
| Interest income, net | | | 5,329 | | | | - | | | | 5,329 | |
| Other income (expense), net | | | (588 | ) | | | - | | | | (588 | ) |
| | | | | | | | | | | | | |
| INCOME (LOSS) FROM CONTINUING OPERATIONS | | | | | | | | | | | | |
| BEFORE INCOME TAXES AND EQUITY EARNINGS | | | 23,908 | | | | - | | | | 23,908 | |
| | | | | | | | | | | | | |
| Income tax (provision) benefit | | | (8,895 | ) | | | (677 | ) | | | (9,572 | ) |
| Equity in earnings of joint ventures | | | 5,206 | | | | (167 | ) | | | 5,039 | |
| | | | | | | | | | | | | |
| NET INCOME (LOSS) FROM CONTINUING OPERATIONS | | | 20,219 | | | | (844 | ) | | | 19,375 | |
| | | | | | | | | | | | | |
| Income (loss) from discontinued operations, net of taxes | | | (27,811 | ) | | | - | | | | (27,811 | ) |
| | | | | | | | | | | | | |
| NET INCOME (LOSS) BEFORE CUMULATIVE EFFECT | | | | | | | | | |
| OF ACCOUNTING CHANGE | | | (7,592 | ) | | | (844 | ) | | | (8,436 | ) |
| | | | | | | | | | | | | |
| Cumulative effect of accounting change, net of taxes | | | 1,225 | | | | - | | | | 1,225 | |
| | | | | | | | | | | | | |
| NET INCOME (LOSS) | | $ | (6,367 | ) | | $ | (844 | ) | | $ | (7,211 | ) |
| | | | | | | | | | | | | |
| EARNINGS (LOSS) PER SHARE - BASIC: | | | | | | | | | | | | |
| | | | | | | | | | | | | |
| Net income (loss) from continuing operations | | $ | 0.76 | | | $ | (0.03 | ) | | $ | 0.73 | |
| Income (loss) from discontinued operations, net of taxes | | | (1.05 | ) | | | - | | | | (1.05 | ) |
| Cumulative effect of accounting change, net of taxes | | | 0.05 | | | | - | | | | 0.05 | |
| Net income (loss) | | $ | (0.24 | ) | | $ | (0.03 | ) | | $ | (0.27 | ) |
| | | | | | | | | | | | | |
| EARNINGS (LOSS) PER SHARE - DILUTED: | | | | | | | | | | | | |
| | | | | | | | | | | | | |
| Net income (loss) from continuing operations | | $ | 0.76 | | | $ | (0.03 | ) | | $ | 0.73 | |
| Income (loss) from discontinued operations, net of taxes | | | (1.05 | ) | | | - | | | | (1.05 | ) |
| Cumulative effect of accounting change, net of taxes | | | 0.05 | | | | - | | | | 0.05 | |
| Net income (loss) | | $ | (0.24 | ) | | $ | (0.03 | ) | | $ | (0.27 | ) |
See notes to consolidated financial statements.
SUPERIOR INDUSTRIES INTERNATIONAL, INC.
CONSOLIDATED BALANCE SHEET
(Thousands of dollars, except per share amounts)
| Fiscal Year Ended December 31, 2006 | | As reported | | | Adjustments | | | As restated | |
| | | | | | | | | | |
| ASSETS | | | | | | | | | |
| Current assets: | | | | | | | | | |
| Cash and cash equivalents | | $ | 68,385 | | | $ | - | | | $ | 68,385 | |
| Short-term investments | | | 9,750 | | | | - | | | | 9,750 | |
| Accounts receivable, net | | | 138,552 | | | | - | | | | 138,552 | |
| Inventories, net | | | 118,724 | | | | - | | | | 118,724 | |
| Income taxes receivable | | | - | | | | - | | | | - | |
| Deferred income taxes | | | 6,416 | | | | - | | | | 6,416 | |
| Other current assets | | | 4,766 | | | | - | | | | 4,766 | |
| Total current assets | | | 346,593 | | | | - | | | | 346,593 | |
| | | | | | | | | | | | | |
| Property, plant and equipment, net | | | 310,414 | | | | - | | | | 310,414 | |
| Investments | | | 46,247 | | | | 492 | | | | 46,739 | |
| Non-current deferred tax asset, net | | | - | | | | - | | | | - | |
| Other assets | | | 8,759 | | | | - | | | | 8,759 | |
| | | | | | | | | | | | | |
| Total assets | | $ | 712,013 | | | $ | 492 | | | $ | 712,505 | |
| | | | | | | | | | | | | |
| LIABILITIES AND SHAREHOLDERS' EQUITY | | | | | | | | | | | | |
| Current liabilities: | | | | | | | | | | | | |
| Accounts payable | | $ | 60,959 | | | $ | - | | | $ | 60,959 | |
| Accrued expenses | | | 41,898 | | | | - | | | | 41,898 | |
| Income taxes payable | | | 10,253 | | | | (1,027 | ) | | | 9,226 | |
| Total current liabilities | | | 113,110 | | | | (1,027 | ) | | | 112,083 | |
| | | | | | | | | | | | | |
| Non-current tax liabilities (Note 8) | | | - | | | | - | | | | - | |
| Executive retirement liabilities | | | 21,666 | | | | - | | | | 21,666 | |
| Non-current deferred tax liabilities, net | | | 17,049 | | | | (1,407 | ) | | | 15,642 | |
| Commitments and contingent liabilities (Note 12) | | | - | | | | - | | | | - | |
| Shareholders' equity: | | | | | | | | | | | | |
| Preferred stock, $25.00 par value | | | | | | | | | | | | |
| Authorized - 1,000,000 shares | | | | | | | | | | | | |
| Issued - none | | | - | | | | - | | | | - | |
| Common stock, $0.50 par value | | | | | | | | | | | | |
| Authorized - 100,000,000 shares | | | | | | | | | | | | |
| Issued and outstanding - 26,610,191 shares | | | 13,305 | | | | - | | | | 13,305 | |
| Additional paid-in capital | | | 35,094 | | | | - | | | | 35,094 | |
| Accumulated other comprehensive loss | | | (37,097 | ) | | | (32 | ) | | | (37,129 | ) |
| Retained earnings | | | 548,886 | | | | 2,958 | | | | 551,844 | |
| Total shareholders' equity | | | 560,188 | | | | 2,926 | | | | 563,114 | |
| | | | | | | | | | | | | |
| Total liabilities and shareholders' equity | | $ | 712,013 | | | $ | 492 | | | $ | 712,505 | |
See notes to consolidated financial statements.
SUPERIOR INDUSTRIES INTERNATIONAL, INC.
CONSOLIDATED STATEMENT OF CASH FLOW
(Thousands of dollars, except per share amounts)
| Fiscal Year 2006 | | As reported | | | Adjustments | | | As restated | |
| | | | | | | | | | |
| NET INCOME (LOSS) | | $ | (9,321 | ) | | $ | (1,221 | ) | | $ | (10,542 | ) |
| Adjustment to reconcile net income (loss) to net cash | | | | | | | | | | | | |
| provided by operating activities: | | | | | | | | | | | | |
| | | | | | | | | | | | | |
| Depreciation and amortization | | | 39,137 | | | | - | | | | 39,137 | |
| Equity in earnings of joint ventures, net of dividends received | | | 3,751 | | | | (28 | ) | | | 3,723 | |
| Stock based compensation | | | 3,032 | | | | - | | | | 3,032 | |
| Impairments of long-lived assets | | | 4,470 | | | | - | | | | 4,470 | |
| Deferred income taxes | | | 3,009 | | | | 2,276 | | | | 5,285 | |
| Other non-cash items | | | 4,936 | | | | - | | | | 4,936 | |
| Gain on sale of available for sale securities | | | - | | | | - | | | | - | |
| Gain on affordable housing partnership investment | | | - | | | | - | | | | - | |
| Gain on sale of discontinued operations | | | (1,077 | ) | | | - | | | | (1,077 | ) |
| Cumulative effect of accounting change | | | - | | | | - | | | | - | |
| Changes in operating assets and liabilities: | | | | | | | | | | | - | |
| Accounts receivable | | | (4,278 | ) | | | - | | | | (4,278 | ) |
| Inventories | | | (15,568 | ) | | | - | | | | (15,568 | ) |
| Other assets | | | 3,100 | | | | - | | | | 3,100 | |
| Accounts payable | | | 10,915 | | | | - | | | | 10,915 | |
| Income taxes | | | (7,458 | ) | | | (1,027 | ) | | | (8,485 | ) |
| Other liabilities | | | 1,482 | | | | - | | | | 1,482 | |
| Non-current tax liabilities | | | - | | | | - | | | | - | |
| | | | | | | | | | | | | |
| NET CASH PROVIDED BY OPERATING ACTIVITIES | | | 36,130 | | | | - | | | | 36,130 | |
| | | | | | | | | | | | | |
| CASH FLOWS FROM INVESTING ACTIVITIES: | | | | | | | | | | | | |
| | | | | | | | | | | | | |
| Additions to property, plant and equipment | | | (73,062 | ) | | | - | | | | (73,062 | ) |
| Proceeds from a held-to maturity security | | | - | | | | - | | | | - | |
| Proceeds from sale of available-for-sale securities | | | - | | | | - | | | | - | |
| Proceeds from sale of fixed assets | | | - | | | | - | | | | - | |
| Proceeds from affordable housing partnership investment | | | - | | | | - | | | | - | |
| Proceeds from sale of discontinued operations | | | 15,000 | | | | - | | | | 15,000 | |
| | | | | | | | | | | | | |
| NET CASH USED IN INVESTING ACTIVITIES | | | (58,062 | ) | | | - | | | | (58,062 | ) |
| | | | | | | | | | | | | |
| CASH FLOWS FROM FINANCING ACTIVITIES: | | | | | | | | | | | | |
| | | | | | | | | | | | | |
| Cash dividends paid | | | (17,032 | ) | | | - | | | | (17,032 | ) |
| Stock options exercised | | | - | | | | - | | | | - | |
| Repurchases of common stock | | | - | | | | - | | | | - | |
| | | | | | | | | | | | | |
| NET CASH USED IN FINANCING ACTIVITIES | | | (17,032 | ) | | | - | | | | (17,032 | ) |
| | | | | | | | | | | | | |
| Net increase (decrease) in cash and cash equivalents | | | (38,964 | ) | | | - | | | | (38,964 | ) |
| | | | | | | | | | | | | |
| Cash and cash equivalents at the beginning of the period | | | 107,349 | | | | - | | | | 107,349 | |
| | | | | | | | | | | | | |
| Cash and cash equivalents at the end of the period | | $ | 68,385 | | | $ | - | | | $ | 68,385 | |
See notes to consolidated financial statements.
SUPERIOR INDUSTRIES INTERNATIONAL, INC.
CONSOLIDATED STATEMENT OF CASH FLOW
(Thousands of dollars, except per share amounts)
| Fiscal Year 2005 | | As reported | | | Adjustments | | | As restated | |
| | | | | | | | | | |
| NET INCOME (LOSS) | | $ | (6,367 | ) | | $ | (844 | ) | | $ | (7,211 | ) |
| Adjustment to reconcile net income (loss) to net cash | | | | | | | | | | | | |
| provided by operating activities: | | | | | | | | | | | | |
| | | | | | | | | | | | | |
| Depreciation and amortization | | | 46,468 | | | | - | | | | 46,468 | |
| Equity in earnings of joint ventures, net of dividends received | | | (240 | ) | | | 167 | | | | (73 | ) |
| Stock based compensation | | | 817 | | | | - | | | | 817 | |
| Impairments of long-lived assets | | | 41,895 | | | | - | | | | 41,895 | |
| Deferred income taxes | | | (23,094 | ) | | | 677 | | | | (22,417 | ) |
| Other non-cash items | | | 1,494 | | | | - | | | | 1,494 | |
| Gain on sale of available for sale securities | | | - | | | | - | | | | - | |
| Gain on affordable housing partnership investment | | | - | | | | - | | | | - | |
| Gain on sale of discontinued operations | | | - | | | | - | | | | - | |
| Cumulative effect of accounting change | | | (1,225 | ) | | | - | | | | (1,225 | ) |
| Changes in operating assets and liabilities: | | | | | | | | | | | | |
| Accounts receivable | | | 13,647 | | | | - | | | | 13,647 | |
| Inventories | | | (16,838 | ) | | | - | | | | (16,838 | ) |
| Other assets | | | (604 | ) | | | - | | | | (604 | ) |
| Accounts payable | | | 10,916 | | | | - | | | | 10,916 | |
| Income taxes | | | 17,528 | | | | - | | | | 17,528 | |
| Other liabilities | | | (7,896 | ) | | | - | | | | (7,896 | ) |
| Non-current tax liabilities | | | - | | | | - | | | | - | |
| | | | | | | | | | | | | |
| NET CASH PROVIDED BY OPERATING ACTIVITIES | | | 76,501 | | | | - | | | | 76,501 | |
| | | | | | | | | | | | | |
| CASH FLOWS FROM INVESTING ACTIVITIES: | | | | | | | | | | | | |
| | | | | | | | | | | | | |
| Additions to property, plant and equipment | | | (100,800 | ) | | | - | | | | (100,800 | ) |
| Proceeds from a held-to maturity security | | | 29,025 | | | | - | | | | 29,025 | |
| Proceeds from sale of available-for-sale securities | | | - | | | | - | | | | - | |
| Proceeds from sale of fixed assets | | | - | | | | - | | | | - | |
| Proceeds from affordable housing partnership investment | | | - | | | | - | | | | - | |
| Proceeds from sale of discontinued operations | | | - | | | | - | | | | - | |
| | | | | | | | | | | | | |
| NET CASH USED IN INVESTING ACTIVITIES | | | (71,775 | ) | | | - | | | | (71,775 | ) |
| | | | | | | | | | | | | |
| CASH FLOWS FROM FINANCING ACTIVITIES: | | | | | | | | | | | | |
| | | | | | | | | | | | | |
| Cash dividends paid | | | (16,772 | ) | | | - | | | | (16,772 | ) |
| Stock options exercised | | | 128 | | | | - | | | | 128 | |
| Repurchases of common stock | | | (377 | ) | | | - | | | | (377 | ) |
| | | | | | | | | | | | | |
| NET CASH USED IN FINANCING ACTIVITIES | | | (17,021 | ) | | | - | | | | (17,021 | ) |
| | | | | | | | | | | | | |
| Net increase (decrease) in cash and cash equivalents | | | (12,295 | ) | | | - | | | | (12,295 | ) |
| | | | | | | | | | | | | |
| Cash and cash equivalents at the beginning of the period | | | 119,644 | | | | - | | | | 119,644 | |
| | | | | | | | | | | | | |
| Cash and cash equivalents at the end of the period | | $ | 107,349 | | | $ | - | | | $ | 107,349 | |
See notes to consolidated financial statements.
NOTE 3 – BUSINESS SEGMENTS
Our chief operating decision-maker assesses operating performance, makes operating decisions, and allocates resources at the plant level. As each of our plants manufactures aluminum automotive road wheels and exhibit similar economic characteristics, they have been aggregated into one reportable segment. Consequently, we currently have only one reportable segment – automotive wheels.
| Net sales and net property, plant and equipment by geographic area are summarized below: | | | | |
| | | | | | | | | | |
| Year Ended December 31, | | 2007 | | | 2006 | | | 2005 | |
| (Thousands of dollars) | | | | | | | | | |
| | | | | | | | | | |
| Net sales: | | | | | | | | | |
| U.S. | | $ | 568,489 | | | $ | 572,863 | | | $ | 634,987 | |
| Mexico | | | 388,403 | | | | 216,999 | | | | 169,174 | |
| Consolidated net sales | | $ | 956,892 | | | $ | 789,862 | | | $ | 804,161 | |
| | | | | | | | | | | | | |
| | | | | | | | | | | | | |
| December 31, | | | | | | 2007 | | | 2006 | |
| (Thousands of dollars) | | | | | | | | | | | | |
| | | | | | | | | | | | | |
| Property, plant and equipment, net: | | | | | | | | | | | | |
| U.S. | | | | | | $ | 116,599 | | | $ | 141,653 | |
| Mexico | | | | | | | 185,654 | | | | 168,761 | |
| Consolidated property, plant and equipment, net | | | | | | $ | 302,253 | | | $ | 310,414 | |
NOTE 4 – ACCOUNTS RECEIVABLE
| December 31, | | 2007 | | | 2006 | |
| (Thousands of dollars) | | | | | | |
| | | | | | | |
| Trade receivables | | $ | 119,175 | | | $ | 121,707 | |
| Wheel program development receivables | | | 5,102 | | | | 8,199 | |
| Dividend receivable from Suoftec | | | - | | | | 5,266 | |
| Value-added tax receivables | | | - | | | | 1,414 | |
| Other receivables | | | 3,854 | | | | 4,755 | |
| | | | | | | | | |
| | | | 128,131 | | | | 141,341 | |
| | | | | | | | | |
| Allowance for doubtful accounts | | | (2,427 | ) | | | (2,789 | ) |
| | | | | | | | | |
| Accounts receivable, net | | $ | 125,704 | | | $ | 138,552 | |
The following percentages of our consolidated net sales were made to GM, Ford and Chrysler LLC: 2007 - 36 percent, 33 percent and 13 percent; 2006 - 37 percent, 34 percent and 15 percent; and 2005 - 37 percent, 33 percent and 15 percent, respectively. These three customers represented 79 percent and 87 percent of trade receivables at December 31, 2007 and 2006, respectively.
NOTE 5 – INVENTORIES
| December 31, | | 2007 | | | 2006 | |
| (Thousands of dollars) | | | | | | |
| | | | | | | |
| Raw materials | | $ | 16,482 | | | $ | 16,279 | |
| Work-in-process | | | 30,004 | | | | 35,810 | |
| Finished goods | | | 60,684 | | | | 66,635 | |
| | | | | | | | | |
| Inventories, net | | $ | 107,170 | | | $ | 118,724 | |
NOTE 6 – PROPERTY, PLANT AND EQUIPMENT
| December 31, | | 2007 | | | 2006 | |
| (Thousands of dollars) | | | | | | |
| | | | | | | |
| Land and buildings | | $ | 94,610 | | | $ | 95,712 | |
| Machinery and equipment | | | 519,869 | | | | 498,243 | |
| Leasehold improvements and others | | | 14,055 | | | | 13,829 | |
| Construction in progress | | | 29,739 | | | | 55,455 | |
| | | | | | | | | |
| | | | 658,273 | | | | 663,239 | |
| Accumulated depreciation | | | (356,020 | ) | | | (352,825 | ) |
| | | | | | | | | |
| Property, plant and equipment, net | | $ | 302,253 | | | $ | 310,414 | |
The 2006 $4.5 million asset impairment charge related to our Johnson City, Tennessee wheel manufacturing facility, as discussed in Note 16 – Impairment of Long-Lived Assets and Other Charges, was recorded in the appropriate fixed asset cost categories in the table above.
NOTE 7 - INVESTMENTS
| December 31, | | 2007 | | | 2006 | |
| (Thousands of dollars) | | | | | As restated | |
| | | | | | | |
| Investments in and advances to 50% owned joint ventures: | | | | | | |
| Suoftec Light Metal Products, Ltd. | | $ | 49,902 | | | $ | 39,574 | |
| Topy-Superior Limited | | | 209 | | | | 135 | |
| | | | 50,111 | | | | 39,709 | |
| | | | | | | | | |
| Corporate equities | | | - | | | | 4,894 | |
| Other | | | 944 | | | | 2,136 | |
| | | | | | | | | |
| Investments | | $ | 51,055 | | | $ | 46,739 | |
In 1995, we entered into a joint venture with Otto Fuchs, to form Suoftec to manufacture cast and forged aluminum wheels in Hungary for the European automobile industry. During each of the three years in the period ended December 31, 2007, we acquired cast and forged wheels from this joint venture, totaling $50.0 million in 2007, $56.3 million in 2006 and $44.2 million in 2005. At December 31, 2007 and 2006, accounts payable included amounts owed to Suoftec for unpaid wheel purchases totaling $10.3 million and $7.2 million, respectively.
In 2005, we changed the method of recording our 50 percent share of Suoftec’s earnings from recording on a one- month lag to recording the results of operations on a current basis. As a result, net income for the year ended December 31, 2005 includes a cumulative effect of accounting change of $1.2 million, representing the company’s share of Suoftec’s net income for month of December 2004.
During the fourth quarter of 2007, the Company identified errors relating to our equity method accounting for our investee, Suoftec, and our summary financial information presented for Suoftec, which we had previously considered to be immaterial to any individual reporting period. The errors relate to the quantification and recording of the adjustments to report the Suoftec earnings on the basis of U.S. GAAP versus on the Hungarian accounting rules followed by Suoftec. These differences principally relate to overhead cost capitalization into inventory and deferred income taxes on property, plant and equipment.
Included below are summary statements of operations and balance sheets for Suoftec, which is 50 percent-owned, non-controlled, and, therefore, not consolidated but accounted for using the equity method.
| | | Year Ended December 31, | |
| Summary Statements of Operations | | 2007 | | | 2006 | | | 2005 | |
| (Thousands of dollars) | | | | | As restated | | | As restated | |
| | | | | | | | | | |
| Net sales | | $ | 145,707 | | | $ | 132,020 | | | $ | 109,131 | |
| Cost of sales | | | 130,769 | | | | 117,294 | | | | 93,601 | |
| | | | | | | | | | | | | |
| Gross profit | | | 14,938 | | | | 14,726 | | | | 15,530 | |
| | | | | | | | | | | | | |
| Selling, general and administrative expenses | | | 2,011 | | | | 1,680 | | | | 1,514 | |
| | | | | | | | | | | | | |
| Income from operations | | | 12,927 | | | | 13,046 | | | | 14,016 | |
| | | | | | | | | | | | | |
| Other income (expense), net | | | 812 | | | | (1,096 | ) | | | (1,242 | ) |
| | | | | | | | | | | | | |
| Income before income taxes | | | 13,739 | | | | 11,950 | | | | 12,774 | |
| | | | | | | | | | | | | |
| Income tax provision | | | (2,569 | ) | | | (1,954 | ) | | | (2,035 | ) |
| | | | | | | | | | | | | |
| Net income | | $ | 11,170 | | | $ | 9,996 | | | $ | 10,739 | |
| | | | | | | | | | | | | |
| Superior's share of net income | | $ | 5,585 | | | $ | 4,998 | | | $ | 5,370 | |
| Summary Balance Sheets as of December 31, | | 2007 | | | 2006 | |
| (Thousands of dollars) | | | | | As restated | |
| | | | | | | |
| Cash and cash equivalents | | $ | 29,485 | | | $ | 24,688 | |
| Accounts receivable, net | | | 23,331 | | | | 21,420 | |
| Inventories, net | | | 16,641 | | | | 14,232 | |
| | | | | | | | | |
| Total current assets | | | 69,457 | | | | 60,340 | |
| | | | | | | | | |
| Property, plant and equipment, net | | | 43,384 | | | | 37,878 | |
| Other assets | | | 1,369 | | | | 909 | |
| Total assets | | | 114,210 | | | | 99,127 | |
| | | | | | | | | |
| Current liabilities | | | 14,188 | | | | 19,938 | |
| Non-current liabilities | | | 218 | | | | 42 | |
| | | | | | | | | |
| Total liabilities | | | 14,406 | | | | 19,980 | |
| | | | | | | | | |
| Net assets | | $ | 99,804 | | | $ | 79,147 | |
| | | | | | | | | |
| Superior's share of net assets | | $ | 49,902 | | | $ | 39,574 | |
Other Investments
In the first quarter of 2007, the short-term corporate debt security, which was classified as held-to-maturity as of December 31, 2006, matured and was redeemed for $9.8 million. In addition, long-term corporate equity securities, which were classified as available-for-sale at the end of 2006, were sold for $5.1 million and gains totaling $2.9 million were recognized in other income (expense), net. As of December 31, 2007, we held no marketable debt or equity securities that were not classified as cash equivalents.
NOTE 8 – INCOME TAXES
| Year Ended December 31, | | 2007 | | | 2006 | | | 2005 | |
| (Thousands of dollars) | | | | | As restated | | | As restated | |
| | | | | | | | | | |
| Income (loss) from continuing operations before income | | | | | | | | | |
| taxes, equity earnings and effect of accounting change: | | | | | | | | | |
| Domestic | | $ | (13,168 | ) | | $ | (21,275 | ) | | $ | 10,740 | |
| International | | | 23,368 | | | | 5,187 | | | | 13,168 | |
| | | | 10,200 | | | | (16,088 | ) | | | 23,908 | |
| Income (loss) from discontinued operations before | | | | | | | | | | | | |
| income taxes | | $ | - | | | $ | 430 | | | $ | (46,663 | ) |
The (provision) benefit for income taxes is comprised of the following:
| Year Ended December 31, | | 2007 | | | 2006 | | | 2005 | |
| (Thousands of dollars) | | | | | As restated | | | As restated | |
| | | | | | | | | | |
| Continuing operations | | | | | | | | | |
| Current Taxes | | | | | | | | | |
| Federal | | $ | (41 | ) | | $ | 2,356 | | | $ | (10,949 | ) |
| State | | | 1,040 | | | | (1,029 | ) | | | (3,005 | ) |
| Foreign | | | (1,372 | ) | | | (3,925 | ) | | | (4,648 | ) |
| Total Current | | | (373 | ) | | | (2,598 | ) | | | (18,602 | ) |
| Deferred Taxes | | | | | | | | | | | | |
| Federal | | | 2,714 | | | | 4,321 | | | | 5,257 | |
| State | | | (605 | ) | | | 174 | | | | 660 | |
| Foreign | | | (7,999 | ) | | | (1,612 | ) | | | 3,113 | |
| Total Deferred Taxes | | | (5,890 | ) | | | 2,883 | | | | 9,030 | |
| | | | | | | | | | | | | |
| (Provision) benefit for income taxes from: | | | | | | | | | | | | |
| | | | | | | | | | | | | |
| Continuing operations | | $ | (6,263 | ) | | $ | 285 | | | $ | (9,572 | ) |
| | | | | | | | | | | | | |
| Discontinued operations | | $ | - | | | $ | (173 | ) | | $ | 18,852 | |
The following is a reconciliation of the statutory United States federal tax rate to our effective income tax rate:
| Year Ended December 31, | | 2007 | | | 2006 | | | 2005 | |
| | | | | | As restated | | | As restated | |
| | | | | | | | | | |
| Statutory rate - (provision) benefit | | | (35.0 | ) % | | | 35.0 | % | | | (35.0 | ) % |
| State tax (provisions), net of federal income tax benefit | | | (0.6 | ) | | | (1.9 | ) | | | (6.6 | ) |
| Permanent differences | | | (20.9 | ) | | | (25.7 | ) | | | (2.6 | ) |
| Tax credits | | | 0.7 | | | | 0.8 | | | | 3.2 | |
| Foreign income taxed at rates of than the statutory rate | | | 19.6 | | | | 3.2 | | | | 2.8 | |
| Valuation allowance | | | (6.5 | ) | | | (4.4 | ) | | | (3.0 | ) |
| Changes in tax liabilities, net | | | (18.3 | ) | | | (3.7 | ) | | | (1.1 | ) |
| Other | | | (0.4 | ) | | | (1.5 | ) | | | 2.3 | |
| | | | | | | | | | | | | |
| Effective income tax rate for continuing operations | | | (61.4 | ) % | | | 1.8 | % | | | (40.0 | ) % |
The state tax provisions, net of federal income tax benefit, varies year to year primarily because we file state income tax returns on a non-consolidated basis for several of our subsidiaries. The permanent differences in 2007 increased primarily due to significant permanent differences in our foreign operations. Foreign income taxed at rates other than statutory rates increased as a result of foreign income representing a greater percentage of our total income. An increase in foreign income at a percentage greater than total income growth will result in significant impact on our effective rate. The change in liabilities relates to increases in our unrecognized tax benefits, primarily increases in interest, and penalty expenses.
Tax effects of temporary differences that gave rise to significant portions of the deferred tax assets and deferred liabilities at December 31, 2007 and 2006:
| December 31, | | 2007 | | | 2006 | |
| (Thousands of dollars) | | | | | As restated | |
| | | | | | | |
| Deferred Tax Assets | | | | | | |
| Other comprehensive income and loss adjustments | | $ | 6,665 | | | $ | 658 | |
| Liabilities deductible in the future | | | 6,016 | | | | 7,435 | |
| Deferred compensation | | | 11,777 | | | | 9,786 | |
| Net loss carryforward | | | 3,390 | | | | - | |
| Tax credit carryforward | | | 11,436 | | | | - | |
| Differences with financial and tax accounting related to foreign operations | | | 28,377 | | | | - | |
| Other | | | 311 | | | | 1,221 | |
| | | | 67,972 | | | | 19,100 | |
| Valuation allowance | | | (12,083 | ) | | | (1,418 | ) |
| Net deferred tax assets | | | 55,889 | | | | 17,682 | |
| | | | | | | | | |
| Deferred Tax Liabilities | | | | | | | | |
| Differences between the book and tax basis of property, plant | | | | | | | | |
| | | (12,586 | ) | | | (16,733 | ) |
| Differences between financial and tax accounting associated | | | | | | | | |
| with foreign operations | | | (23,627 | ) | | | (12,100 | ) |
| Other | | | (434 | ) | | | 1,925 | |
| | | | | | | | | |
| Deferred tax liabilities | | | (36,647 | ) | | | (26,908 | ) |
| | | | | | | | | |
| Net Deferred Tax Asset (Liability) | | $ | 19,242 | | | $ | (9,226 | ) |
As of December 31, 2007, we had approximately $19.2 million in U.S. net deferred tax asset. Realization of the deferred tax assets of $68.0 million is dependent on the company generating sufficient taxable income in the future. We established a valuation allowance for deferred tax assets of $12.0 million at December 31, 2007, based on management’s assessment of the company’s ability to utilize these deferred tax assets. The amount of deferred tax assets considered realizable, however, could be increased in the future if estimates of future taxable income are increased. We have federal tax credit carry forwards of $10.5 million for 2007 that begin to expire in 2014. We have federal and state net operating loss carryforwards for 2007 of $0.1 million and $9.4 million respectively that begin to expire 2011. We have state tax credit carryforwards for 2007 and 2006 of $0.9 million and $1.4 million, respectively. The state tax credit carryforwards begin to expire in 2008. The valuation allowance for 2007 and 2006 is $12.0 million and $1.4 million, respectively. We establish a valuation allowance for certain state deferred tax assets based on our assessment of our ability to utilize these deferred tax assets.
We have not provided for deferred income taxes or foreign withholding tax on basis differences in our non-U.S. subsidiaries of $116.6 million that result primarily from undistributed earnings the company intends to reinvest indefinitely. Determination of the deferred income tax liability on these basis differences is not reasonably estimable because such liability, if any, is dependent on circumstances existing if and when remittance occurs.
The Company adopted the provisions of FASB Interpretation No. 48, “Accounting for Uncertainty in Income Taxes”, on January 1, 2007. As a result of the implementation of Interpretation 48, the Company established approximately a $37 million as a liability for unrecognized tax benefits. A reconciliation of the beginning and ending amount of unrecognized tax benefits is as follows:
| Summary of Unrecognized Tax Benefits | | Amount | |
| (Thousands of dollars) | | | |
| | | | |
| Balance at January 1, 2007 | | $ | 36,521 | |
| | | | | |
| Increases (decreases) as a result of positions taken during: | | | | |
| Prior period | | | - | |
| Current period | | | - | |
| Settlements with taxing authorities | | | - | |
| Expiration of applicable statue of limitations | | | (1,659 | ) |
| Other | | | (58 | ) |
| | | | | |
Balance at December 31, 2007 (1) | | $ | 34,804 | |
| | | | | |
(1) Excludes $27.4 million of potential interest and penalties associated with uncertain tax positions. | |
At December 31, 2007, we had unrecognized tax benefits in the amount of $62.2 million. We also accrued potential penalties and interest of $0.6 million and $4.2 million, respectively, related to unrecognized tax benefits during 2007, and in total, as of December 31, 2007, we have recorded a liability for potential penalties and interest of $13.7 million and $13.7 million, respectively.
Included in the unrecognized tax benefits of $62.2 million at December 31, 2007, was $29.1 million of tax benefit that, if recognized, would reduce our annual effective tax rate.
Within the next twelve-month period ending December 31, 2008, it is reasonably possible that up to $3.6 million of unrecognized tax benefits will be recognized due to the expiration of certain statues of limitation.
The company's policy regarding interest and penalties related to unrecognized tax benefits is to record interest and penalties as an element of the tax expense. The cumulative amounts related to interest and penalties are added to the total FIN 48 tax liability in the balance sheet. Accordingly, the total amount on the balance sheet includes the unrecognized tax benefit, cumulative interest accrued on the liability, and penalties accrued on the liability.
We conduct business internationally and, as a result, one or more of our subsidiaries files income tax returns in U.S. federal, U.S. state and certain foreign jurisdictions. Accordingly, in the normal course of business, we are subject to examination by taxing authorities throughout the world, including Hungary, Mexico, the Netherlands, Japan and the United States. We are no longer subject to U.S. federal, state and local, or Mexico (our major filing jurisdictions) income tax examinations for years before 2002.
Superior Industries International, Inc. and subsidiaries are under audit for 2004, 2005 and 2006 tax years by the Internal Revenue Service (IRS). In 2007 we received notice that Mexico’s Tax Administration Service (Servicio de Administracion Tributaria) was reviewing the work papers prepared by our tax preparers in relation to Superior Industries de Mexico S.A. de C.V. for the 2003 tax year. It is not reasonably possible to quantify at this time any estimated reductions in the recognized or unrecognized tax benefits.
Total income tax payments made were $4.9 million in 2007, $6.9 million in 2006 and $2.5 million in 2005.
NOTE 9 - LEASES AND RELATED PARTIES
We lease certain land, facilities and equipment under long-term operating leases expiring at various dates through 2012. Total lease expense for all operating leases amounted to $3.8 million in 2007, $3.0 million in 2006 and $3.2 million in 2005.
Our corporate office and manufacturing facility in Van Nuys, California, are leased from the Louis L. Borick Trust and the Juanita A. Borick Management Trust (the Trusts). The Trusts are controlled by Mr. L. Borick, Founding Chairman and a Director of the company, and Juanita A. Borick, Mr. L. Borick’s former spouse, respectively. The current operating lease expires in June 2012. An option to extend the lease for ten years was exercised as of July 2002. There is one additional ten-year lease extension option remaining. The current annual lease payment is $2.1 million. The facilities portion of the lease agreement requires rental increases every five years based upon the change in a specific Consumer Price Index. The last such adjustment was as of July 1, 2006. A lease arrangement for another facility that had been leased for $0.3 million annually from a related entity owned by Steven J. Borick, Chairman, CEO and President, and two other children of Mr. L. Borick’s was terminated in the first half of 2007. Total lease payments to these related entities were $1.7 million in 2007, $1.8 million for 2006 and $1.6 million for 2005. During 2007, a $1.0 million payment was made to the Trusts as settlement for a retroactive rental rate adjustment on the ground lease portion of the agreement for our Van Nuys, California, property for the five year period ended June 30, 2007.
The following are summarized future minimum payments under all leases:
| Year Ended December 31, | | Operating Leases | |
| (Dollars in thousands) | | | | |
| | | | | |
| 2008 | | $ | 2,948 | |
| 2009 | | | 2,754 | |
| 2010 | | | 2,477 | |
| 2011 | | | 2,172 | |
| 2012 | | | 1,047 | |
| Thereafter | | | - | |
| | | | | |
| | | $ | 11,398 | |
NOTE 10 – RETIREMENT PLANS
Beginning December 31, 2006, we recognized a net liability or asset to report the funded status of their defined benefit pension and other postretirement benefit plans on their balance sheets.
We have an unfunded supplemental executive retirement plan covering our directors, officers and other key members of management. We purchase life insurance policies on the participants to provide for future liabilities. Cash surrender value of these policies, totaling $4.3 million at December 31, 2007 and $4.4 million as of December 31, 2006, are included in Other Assets as general assets of the company. Subject to certain vesting requirements, the plan provides for a benefit based on final average compensation, which becomes payable on the employee's death or upon attaining age 65, if retired. We have measured the plan assets and obligations of our supplemental executive retirement plan as of our fiscal year end for all periods presented.
| Year Ended December 31, | | 2007 | | | 2006 | |
| (Thousands of dollars) | | | | | | |
| | | | | | | |
| Change in benefit obligation | | | | | | |
| Beginning benefit obligation | | $ | 19,972 | | | $ | 19,084 | |
| Service cost | | | 567 | | | | 916 | |
| Interest cost | | | 1,121 | | | | 1,032 | |
| Actuarial (gain) loss | | | (28 | ) | | | (1,101 | ) |
| Contractual termination benefits | | | - | | | | 572 | |
| Benefit payments | | | (837 | ) | | | (531 | ) |
| | | | | | | | | |
| Ending benefit obligation | | $ | 20,795 | | | $ | 19,972 | |
| Year Ended December 31, | | 2007 | | | 2006 | |
| (Thousands of dollars) | | | | | | |
| | | | | | | |
| Change in plan assets | | | | | | |
| Fair value of plan assets at beginning of year | | $ | - | | | $ | - | |
| Employer contribution | | | 837 | | | | 531 | |
| Benefit payments | | | (837 | ) | | | (531 | ) |
| Fair value of plan assets at end of year | | $ | - | | | $ | - | |
| | | | | | | | | |
| Funded Status | | $ | (20,795 | ) | | $ | (19,972 | ) |
| | | | | | | | | |
| Amounts recognized in the Consolidated Balance Sheet consist of: | | | | | | | | |
| Current liabilities | | $ | (1,333 | ) | | $ | (925 | ) |
| Non-current liabilities | | | (19,462 | ) | | | (19,047 | ) |
| Net amount recognized | | $ | (20,795 | ) | | $ | (19,972 | ) |
| | | | | | | | | |
| Amounts recognized in Accumulated Other Comprehensive Loss consist of: | | | | | | | | |
| Net actuarial loss | | $ | 4,257 | | | $ | 4,477 | |
| Prior service cost | | | - | | | | - | |
| | | | | | | | | |
| Net amount recognized, before tax effect | | $ | 4,257 | | | $ | 4,477 | |
| | | | | | | | | |
| Weighted average assumptions used to determine benefit obligations: | | | | | | | | |
| Discount rate | | | 5.75 | % | | | 5.75 | % |
| Rate of compensation increase | | | 3.50 | % | | | 3.50 | % |
Components of net periodic pension cost are:
| Year Ended December 31, | | 2007 | | | 2006 | | | 2005 | |
| (Thousands of dollars) | | | | | | | | | |
| | | | | | | | | | |
| Components of net periodic pension cost | | | | | | | | | |
| Service cost | | $ | 567 | | | $ | 916 | | | $ | 731 | |
| Interest cost | | | 1,121 | | | | 1,032 | | | | 904 | |
| Contractual termination benefits | | | - | | | | 572 | | | | - | |
| Amortization of actuarial loss | | | 192 | | | | 334 | | | | 158 | |
| Net periodic pension cost | | $ | 1,880 | | | $ | 2,854 | | | $ | 1,793 | |
| | | | | | | | | | | | | |
| Weighted average assumptions used to determine net periodic pension cost | | | | | | | | | |
| Discount rate | | | 5.75 | % | | | 5.50 | % | | | 6.00 | % |
| Rate of compensation increase | | | 3.50 | % | | | 3.50 | % | | | 3.50 | % |
| The benefit payments, which reflect applicable future service, are expected to be paid in the following years: | |
| | | | |
| Year Ended December 31, | | Amount | |
| (Thousands of dollars) | | | |
| | | | |
| 2008 | | $ | 1,060 | |
| 2009 | | | 1,137 | |
| 2010 | | | 1,191 | |
| 2011 | | | 1,280 | |
| 2012 | | | 1,404 | |
| Years 2013 - 2017 | | | 7,353 | |
| | | | | |
| The following is an estimate of the components of net periodic pension cost in 2008: | | | | |
| | | | | |
| Estimated Year Ended December 31, | | 2008 | |
| (Thousands of dollars) | | | | |
| | | | | |
| Service cost | | $ | 472 | |
| Interest cost | | | 1,156 | |
| Amortization of actuarial loss | | | 167 | |
| Estimated 2008 net periodic pension cost | | $ | 1,795 | |
We also have a contributory employee retirement savings plan covering substantially all of our employees. The employer contribution was determined at the discretion of the company and totaled $2.9 million, $3.1 million and $3.6 million for 2007, 2006 and 2005, respectively.
Pursuant to the deferred compensation provision of his 1994 Employment Agreement (Agreement), Mr. Louis L. Borick, Founding Chairman and a Director, is being paid an annual amount of $1.0 million in 26 equal payments per year. The Agreement calls for such payments to be made at this level in 2008 and 2009, followed by similar payments at one-half of such amount for up to 10 years, or until his death. As of December 31, 2007, the actuarial present value of the remaining payments under the Agreement, totaling $3.0 million, has been accrued for and is included in accrued expenses and executive retirement liabilities.
NOTE 11 – ACCRUED EXPENSES
| December 31, | | 2007 | | | 2006 | |
| (Thousands of dollars) | | | | | | |
| | | | | | | |
| Payroll and related benefits | | $ | 14,390 | | | $ | 16,208 | |
| Insurance | | | 8,880 | | | | 10,555 | |
| Dividends | | | 4,261 | | | | 4,258 | |
| Taxes, other than income taxes | | | 8,144 | | | | 4,397 | |
| Other | | | 8,318 | | | | 6,480 | |
| | | | | | | | | |
| Accrued expenses | | $ | 43,993 | | | $ | 41,898 | |
NOTE 12 - COMMITMENTS AND CONTINGENT LIABILITIES
In late 2006, two purported shareholder derivative complaints were filed, one each by plaintiffs Gary B. Eldred and Darrell D. Mack, based on allegations concerning some of the company’s past stock option grants and practices. These cases were subsequently consolidated as In re Superior Industries International, Inc. Derivative Litigation, which is pending in the United States District Court for the Central District of California. In the plaintiffs’ consolidated complaint, filed on March 23, 2007, the company was named only as a nominal defendant from whom the plaintiffs sought no monetary recovery. In addition to naming the company as a nominal defendant, the plaintiffs named various present and former employees, officers and directors of the company as individual defendants from whom they sought monetary and/or equitable relief, purportedly for the benefit of the company.
Plaintiffs purported to base their claims against the individual defendants on allegations that the grant dates for some of the options granted to certain company directors, officers and employees occurred prior to upward movements in the stock price, and that the stock option grants were not properly accounted for in the company’s financial reports and not properly disclosed in the company’s SEC filings. The company and the individual defendants filed motions to dismiss plaintiffs’ consolidated complaint on May 14, 2007. In an order dated August 9, 2007, the court granted Superior's motion to dismiss the consolidated complaint, and granted the plaintiffs leave to file an amended complaint.
On August 29, 2007, the plaintiffs filed an amended consolidated complaint that is substantially similar to the prior consolidated complaint. In response, the company and the individual defendants filed motions to dismiss on September 21, 2007. These renewed motions to dismiss were originally scheduled to be heard on November 12, 2007. However, the hearing on the motions was taken off calendar to accommodate the reassignment of the case to a new judge. As of March 24, 2008, the court has yet to reset on the calendar of the new judge the motions to dismiss. Discovery is stayed in the case pending resolution of motions to dismiss. As this litigation remains at a preliminary stage, it would be premature to anticipate the probable outcome of this case and whether such an outcome would be materially adverse to the company.
In 2006, we were served with notice of a class action lawsuit against the company. The complaint alleges that among other claims, certain employees at our Van Nuys, California, facility were denied rest and meal periods as required under the California Labor Code. After conducting initial discovery, the parties participated in mediation that concluded on August 22, 2007. The mediator proposed that the parties settle the lawsuit for a total settlement payment not to exceed $2,700,000. This settlement amount is all-inclusive and includes the company’s settlement payment to the lead plaintiff and the settlement class, together with costs and attorneys’ fees for plaintiff’s counsel. In addition, the mediator proposed that the settlement payment to the class would be on a “claims made” basis, with a minimum of 40 percent of the net settlement being distributed to the settlement class. Provided the minimum settlement claims are paid to the settlement class, the company will not be liable for any claim that is not valid or timely filed.
Subject to certain conditions, both parties agreed to the mediator’s proposal and executed a Settlement Term Sheet on August 22, 2007. The parties submitted the proposed settlement for preliminary approval with the Superior Court of Los Angeles County, which granted preliminary approval on December 19, 2007. On March 17, 2008, the court granted final approval of the proposed settlement, thereby giving the settlement class until May 16, 2008 to appeal the court’s order. Management estimates that its expected liability is $2.2 million and has accordingly recorded a charge to selling, general and administrative expenses during the year ended December 31, 2007.
We are party to various other legal and environmental proceedings incidental to our business. Certain claims, suits and complaints arising in the ordinary course of business have been filed or are pending against us. Based on facts now known, we believe all such matters are adequately provided for, covered by insurance, are without merit, and/or involve such amounts that would not materially adversely affect our consolidated results of operations, cash flows or financial position.
We have foreign operations in Mexico and Hungary that, due to the settlement of accounts receivable and accounts payable, require the transfer of funds denominated in their respective functional and legal currencies – the Mexican peso and the euro. The value of the Mexican peso in relation to the U.S. dollar in 2007 remained relatively unchanged. The euro experienced an 11 percent increase versus the U.S. dollar in 2007. Foreign currency transaction gains and losses, which are included in other income (expense) in the consolidated statements of operations, have not been significant.
As it relates to foreign currency translation losses, however, since 1990, the Mexican peso has experienced periods of relative stability followed by periods of major declines in value. The impact of these changes in value relative to our Mexico operations has resulted in a cumulative unrealized translation loss at December 31, 2007 of $34.1 million. Since our initial investment in our joint venture in Hungary in 1995, the fluctuations in functional currencies have resulted in a cumulative unrealized translation gain at December 31, 2007 of $8.2 million. Translation gains and losses are included in other comprehensive income (loss) in the consolidated statements of shareholders’ equity.
Our primary risk exposure relating to derivative financial instruments results from the periodic use of foreign currency forward contracts to offset the impact of currency rate fluctuations with regard to foreign-currency-denominated receivables, payables or purchase obligations. At December 31, 2007 and 2006, we held no foreign currency euro forward contracts.
When market conditions warrant, we may also enter into contracts to purchase certain commodities used in the manufacture of our products, such as aluminum, natural gas and other raw materials. Any such commodity commitments are expected to be purchased and used over a reasonable period of time in the normal course of business. Accordingly, they are not accounted for as a derivative. We currently have several purchase agreements for the delivery of natural gas through 2008. The contract value and fair value of these purchase commitments approximated $11 million, at December 31, 2007. As of December 31, 2006, the aggregate contract value and fair value of these commitments were $15 million and $12 million, respectively. Percentage changes in the market prices of natural gas will impact the fair value by a similar percentage. We do not hold or purchase any natural gas forward contracts for trading purposes.
At December 31, 2007 and 2006, we had outstanding letters of credit of approximately $7.5 million and $6.8 million, respectively.
NOTE 13 – STOCK-BASED COMPENSATION
We have one unexpired stock option plan that authorizes us to issue incentive and non-qualified stock options to our directors, officers and key employees totaling up to 3.0 million shares of common stock. Our policy is to issue shares from authorized but not issued shares upon the exercise of stock options. At December 31, 2007, there were 0.7 million shares available for future grants under this plan. Options are generally granted at not less than fair market value on the date of grant and expire no later than ten years after the date of grant. Options granted generally vest ratably over a four-year service period.
Effective January 1, 2006, we adopted the fair value recognition provisions of SFAS No. 123R, using the modified prospective transition method and, therefore, have not restated prior periods' results. Under this transition method, stock-based compensation expense for the years ended subsequent to December 31, 2005 included compensation expense for all stock-based compensation awards granted prior to, but not yet vested as of, January 1, 2006, based on the grant date fair value estimated in accordance with the provisions of SFAS No. 123. For options granted subsequent to January 1, 2006, stock-based compensation expense was calculated in accordance with the provisions of SFAS No. 123R. We recognize these compensation costs net of the applicable forfeiture rate and recognize the compensation costs for only those shares expected to vest on a straight-line basis over the requisite service period of the award, which is generally the option vesting term of four years. We estimated the forfeiture rate based on our historical experience. The aggregate intrinsic value of options exercised during the year was approximately $62,000 and the aggregate intrinsic value of shares vested during the year was approximately $151,000.
We have elected to adopt the alternative transition method for calculating the initial pool of excess tax benefits and to determine the subsequent impact on the Additional Paid-In-Capital (APIC) pool and Consolidated Statements of Cash Flows of the tax effects of employee stock-based compensation awards that are outstanding upon adoption of SFAS No. 123R.
| | | | | | Weighted | | | | | | | |
| | | | | | Average | | | Remaining | | | Aggregate | |
| | | | | | Exercise | | | Contractual | | | Intrinsic | |
| | | Outstanding | | | Price | | | Life in Years | | | Value | |
| | | | | | | | | | | | | |
| Balance at December 31, 2006 | | | 3,147,792 | | | $ | 26.36 | | | | | | | |
| Granted | | | 473,000 | | | | 19.53 | | | | | | | |
| Exercised | | | (23,249 | ) | | | 18.48 | | | | | | | |
| Cancelled | | | (399,432 | ) | | | 26.98 | | | | | | | |
| | | | | | | | | | | | | | | |
| Balance at December 31, 2007 | | | 3,198,111 | | | $ | 26.53 | | | | 6.37 | | | $ | 437,483 | |
| | | | | | | | | | | | | | | | | |
| Options vested or expected to vest | | | 3,109,283 | | | $ | 26.74 | | | | 6.55 | | | $ | 413,452 | |
| | | | | | | | | | | | | | | | | |
| Exercisable at December 31, 2007 | | | 2,097,388 | | | $ | 30.32 | | | | 4.98 | | | $ | 140,816 | |
Options outstanding at December 31, 2007:
| | | | | | | | | | Weighted | | | Weighted | | | | | | Weighted | |
| | | | | | | Options | | | Average | | | Average | | | Options | | | Average | |
| Range of | | | Outstanding | | | Remaining | | | Exercise | | | Exercisable | | | Exercise | |
| Exercise Prices | | | at 12/31/07 | | | Contractual Life | | | Price | | | at 12/31/07 | | | Price | |
| | | | | | | | | | (in years) | | | | | | | | | | |
| $ | 17.29 | - | | $ | 21.61 | | | | 1,086,525 | | | | 8.84 | | | $ | 17.96 | | | | 256,120 | | | $ | 17.85 | |
| $ | 21.61 | - | | $ | 25.93 | | | | 1,059,750 | | | | 5.60 | | | | 24.39 | | | | 822,249 | | | | 25.12 | |
| $ | 25.93 | - | | $ | 30.25 | | | | 126,791 | | | | 2.67 | | | | 28.23 | | | | 126,791 | | | | 28.23 | |
| $ | 30.25 | - | | $ | 34.58 | | | | 201,374 | | | | 5.08 | | | | 33.46 | | | | 168,557 | | | | 33.34 | |
| $ | 34.58 | - | | $ | 38.90 | | | | 321,502 | | | | 3.79 | | | | 36.80 | | | | 321,502 | | | | 36.80 | |
| $ | 38.90 | - | | $ | 43.22 | | | | 402,169 | | | | 5.60 | | | | 43.08 | | | | 402,169 | | | | 43.08 | |
| | | | | | | | | | | | | | | | | | | | | | | | | | | |
| | | | | | | | | | 3,198,111 | | | | 6.37 | | | $ | 26.53 | | | | 2,097,388 | | | $ | 30.32 | |
The aggregate intrinsic value represents the total pretax difference between the closing stock price on the last trading day of the reporting period and the option exercise price, multiplied by the number of in-the-money options. This is the amount that would have been received by the option holders had they exercised and sold their options on that day. This amount varies based on changes in the fair market value of our common stock. The closing price of our common stock on the last day of the year was $18.26.
The 2007 stock-based compensation expense related to stock option plans under SFAS No. 123R was allocated as follows:
| Year Ended December 31, | | 2007 | | | 2006 | |
| (Thousands of dollars) | | | | | | |
| | | | | | | |
| Cost of sales | | $ | 487 | | | $ | 622 | |
| Selling, general and administrative expenses | | | 2,586 | | | | 2,410 | |
| | | | | | | | | |
| Stock-based compensation expense before income taxes | | | 3,073 | | | | 3,032 | |
| Income tax benefit | | | (1,038 | ) | | | (289 | ) |
| | | | | | | | | |
| Total stock-based compensation expense after income taxes | | $ | 2,035 | | | $ | 2,743 | |
| | | | | | | | | |
| Loss per share: | | | | | | | | |
| Basic | | $ | 0.08 | | | $ | 0.10 | |
| Diluted | | $ | 0.08 | | | $ | 0.10 | |
As of December 31, 2007, there was $4.5 million of unrecognized stock-based compensation expense related to unvested stock options. That cost is expected to be recognized over a weighted-average period of 3.01 years.
Prior to the adoption of SFAS No. 123R, we presented the tax benefit of stock option exercises as operating cash flows in the consolidated statement of cash flows. Upon the adoption of SFAS No. 123R, tax benefits resulting from tax deductions in excess of the compensation cost recognized for those options are classified as financing cash flows in that statement. We received cash proceeds of $430,000 from stock options exercised in 2007 and $128,000 from stock options exercised in 2005. There were no stock options exercised in 2006.
The fair value of each option grant was estimated as of the date of grant using the Black-Scholes option-pricing model with the following assumptions:
| Year Ended December 31, | | 2007 | | | 2006 | | | 2005 | |
| | | | | | | | | | |
| Expected dividend yield (a) | | | 3.3 | % | | | 3.5 | % | | | 2.8 | % |
| Expected stock price volatility (b) | | | 30.1 | % | | | 31.2 | % | | | 31.5 | % |
| Risk-free interest rate (c) | | | 4.0 | % | | | 4.9 | % | | | 4.2 | % |
| Expected option lives in years (d) | | | 7.30 | | | | 7.48 | | | | 7.79 | |
| Weighted average grant date fair value of | | | | | | | | | | | | |
| options granted during the period | | $ | 5.14 | | | $ | 4.99 | | | $ | 8.06 | |
| (a) | This assumes that cash dividends of $0.16 per share are paid each quarter on our common stock. |
| (b) | Expected volatility is based on the historical volatility of our stock price, over the expected life of the option. |
| (c) | The risk-free rate is based upon the rate on a U.S. Treasury note for the period representing the average remaining contractual life of all options in effect at the time of the grant. |
| (d) | The expected term of the option is based on historical employee exercise behavior, the vesting terms of the respective option and a contractual life of ten years. |
NOTE 14 - COMMON STOCK REPURCHASE PROGRAMS
Since 1995, our Board of Directors has authorized several common stock repurchase programs totaling 8.0 million shares, under which we have repurchased approximately 4.8 million shares for approximately $131 million, or $27.16 per share. Under the latest authorization to repurchase up to 4.0 million shares, approved in March 2000, we repurchased 16,000 shares in 2005 at a total cost of $0.4 million or $23.56 per share. In 2006 and 2007 there were no stock repurchases. All repurchased shares are immediately cancelled and retired. As of December 31, 2007, an additional 3.2 million shares can be repurchased under the current authorization.
NOTE 15 - OTHER COMPREHENSIVE INCOME (LOSS)
Components of other comprehensive income (loss) as reflected in the consolidated statements of shareholders’ equity as follows:
| Year Ended December 31, | | 2007 | | | 2006 | | | 2005 | |
| (Thousands of dollars) | | | | | As restated | | | As restated | |
| | | | | | | | | | |
| Foreign currency translation adjustments | | $ | 10,112 | | | $ | 4,205 | | | $ | 531 | |
| | | | | | | | | | | | | |
| Net actuarial gain (loss) on pension obligation (Note 10) | | | 221 | | | | 1,147 | | | | (1,587 | ) |
| | | | | | | | | | | | | |
| Unrealized gain (loss) on marketable securities | | | 40 | | | | 1,102 | | | | (267 | ) |
| Reclassification adjustment for realized gains from | | | | | | | | | | | | |
| marketable securities included in net income | | | (2,720 | ) | | | - | | | | - | |
| | | | | | | | | | | | | |
| Net unrealized (loss) gain | | | (2,680 | ) | | | 1,102 | | | | (267 | ) |
| | | | | | | | | | | | | |
| Unrealized gain (loss) on forward foreign currency contracts | | | - | | | | - | | | | (203 | ) |
| Reclassification adjustment for realized gains from forward | | | | | | | | | | | | |
| foreign currency contracts included in net income | | | - | | | | 203 | | | | (2,620 | ) |
| | | | | | | | | | | | | |
| Net unrealized gain (loss) | | | - | | | | 203 | | | | (2,823 | ) |
| | | | | | | | | | | | | |
| Income tax benefit (provision) | | | 898 | | | | (1,199 | ) | | | 1,946 | |
| Other comprehensive income (loss) | | $ | 8,551 | | | $ | 5,458 | | | $ | (2,200 | ) |
Accumulated balances of other comprehensive income (loss) as reflected in the consolidated balance sheets and statements of shareholders’ equity as follows:
| Year Ended December 31, | | 2007 | | | 2006 | | | 2005 | |
| (Thousands of dollars) | | | | | As restated | | | As restated | |
| | | | | | | | | | |
| Foreign currency translation adjustments | | $ | (25,877 | ) | | $ | (35,990 | ) | | $ | (40,195 | ) |
| Unrealized gain (loss) on marketable securities | | | - | | | | 2,680 | | | | 1,578 | |
| Net actuarial gain (loss) on pension obligation (Note 10) | | | (4,257 | ) | | | (4,477 | ) | | | (2,800 | ) |
| Unrealized gain (loss) on forward foreign currency contracts | | | - | | | | - | | | | (203 | ) |
| Income tax (provision) benefit | | | 1,556 | | | | 658 | | | | 823 | |
| Accumulated other comprehensive (loss) | | $ | (28,578 | ) | | $ | (37,129 | ) | | $ | (40,797 | ) |
NOTE 16 – IMPAIRMENT OF LONG-LIVED ASSETS AND OTHER CHARGES
On September 15, 2006, we announced the planned closure of and the resulting lay off of approximately 500 employees at our Johnson City, Tennessee facility. This was the latest step in our program to rationalize our production capacity after the recent announcements by our customers of sweeping production cuts, particularly in the light truck and sport utility platforms, that have reduced our requirements for the near future. In the third quarter of 2006, events or changes in circumstances suggested the carrying value of certain long-lived assets at our Johnson City, Tennessee wheel manufacturing facility was not recoverable and the undiscounted future cash flows did not support the carrying value of those long-lived assets. Accordingly, an asset impairment charge against pretax earnings totaling $4.5 million, reducing the carrying value of certain long-lived assets to their respective fair values, was recorded in the third quarter of 2006. We estimated the fair value of the long-lived assets based in part on an appraisal of the assets. These assets were classified as held and used.
On June 16, 2006, we announced that we were restructuring our chrome plating business located in Fayetteville, Arkansas, that would result in a lay off of approximately 225 employees. The restructuring of the chrome plating business was the result of a shift in customer preference to less expensive bright finishing processes that reduced the sales outlook for chromed wheel products. The shift away from chromed wheel products and the resulting impact on the company’s chrome plating business had been previously disclosed in the fourth quarter of 2005, when the company estimated that it would not be able to recover the carrying value of certain machinery and equipment in the chrome plating operation. Accordingly, such assets were written down to their estimated fair value by recording an asset impairment charge against pretax earnings of $7.9 million in the fourth quarter of 2005. At the same time, an accrual of $1.3 million was recorded for potential environmental exposure related to machinery and equipment shutdown and removal. Other costs related to this restructuring were insignificant. The out-sourcing of our current and future customer requirements for chrome plated wheels to a third-party processor was completed by the end of the third quarter of 2006. This restructuring does not affect the company’s bright polish operation, which is located at the same facility.
NOTE 17 – DISCONTINUED OPERATIONS
On September 20, 2006, we entered into an agreement with St. Jean Industries, Inc., a Delaware corporation, as buyer, and the buyer’s parent, St. Jean Industries, SAS, a French simplified joint stock company, to sell substantially all of the assets and working capital of our suspension components business for $17.0 million, including a $2.0 million promissory note. The $2.0 million promissory note is due in two equal installments on the 24th and 36th month anniversary dates of the completion date, and bears interest at LIBOR plus 1 percent, adjusted quarterly.
Selected financial information for the components business included in discontinued operations in the consolidated statement of operations follows:
| | | | | | | | | |
| Year Ended December 31, | | | 2006 | | | | 2005 | |
| (Thousands of dollars) | | | | | | | | |
| Net sales | | $ | 37,006 | | | $ | 40,723 | |
| | | | | | | | | |
| Loss from operations before income taxes | | $ | (647 | ) | | $ | (46,663 | ) |
| Income tax benefit | | | 263 | | | | 18,852 | |
| | | | | | | | | |
| Loss from operations, net of taxes | | $ | (384 | ) | | $ | (27,811 | ) |
| | | | | | | | | |
| Gain on disposal of discontinued operations, net of $436 tax provision | | $ | 641 | | | $ | - | |
| | | | | | | | | |
| Discontinued operations, net of taxes | | $ | 257 | | | $ | (27,811 | ) |
NOTE 18 - QUARTERLY FINANCIAL DATA (UNAUDITED)
(Thousands of dollars, except per share amounts)
As discussed in Note 2- Restatement of Consolidated Financial Statements, we have restated our annual results for fiscal year 2006 as well as the quarterly periods therein to correct errors in our accounting for deferred tax liabilities and our equity method investment in Suoftec. We have also corrected the interim results for the first three quarters of fiscal 2007 for these same errors. The amounts below have been restated to give effect of these corrections to the interim periods in 2006 and 2007.
| | | As Restated | | | | | | | |
| | | First | | | Second | | | Third | | | Fourth | | | | |
| Year 2007 | | Quarter | | | Quarter | | | Quarter | | | Quarter | | | Year | |
| | | | | | | | | | | | | | | | |
| Net sales | | $ | 244,875 | | | $ | 255,217 | | | $ | 227,557 | | | $ | 229,243 | | | $ | 956,892 | |
| Gross profit | | $ | 2,145 | | | $ | 13,578 | | | $ | 5,276 | | | $ | 11,493 | | | $ | 32,492 | |
| Net income (loss) | | $ | 2,051 | | | $ | 3,232 | | | $ | (739 | ) | | $ | 4,748 | | | $ | 9,292 | |
| | | | | | | | | | | | | | | | | | | | | |
| Earnings (loss) per share: | | | | | | | | | | | | | | | | | | | | |
| | | | | | | | | | | | | | | | | | | | | |
| Basic | | $ | 0.08 | | | $ | 0.12 | | | $ | (0.03 | ) | | $ | 0.18 | | | $ | 0.35 | |
| Diluted | | $ | 0.08 | | | $ | 0.12 | | | $ | (0.03 | ) | | $ | 0.18 | | | $ | 0.35 | |
| | | | | | | | | | | | | | | | | | | | | |
| Dividend declared per share | | $ | 0.16 | | | $ | 0.16 | | | $ | 0.16 | | | $ | 0.16 | | | $ | 0.64 | |
| | | As Restated | |
| | | First | | | Second | | | Third | | | Fourth | | | | |
| Year 2006 | | Quarter | | | Quarter | | | Quarter | | | Quarter | | | Year | |
| | | | | | | | | | | | | | | | |
| Net sales | | $ | 183,525 | | | $ | 219,880 | | | $ | 174,288 | | | $ | 212,169 | | | $ | 789,862 | |
| Gross profit (loss) | | $ | 4,223 | | | $ | 9,176 | | | $ | (3,711 | ) | | $ | (948 | ) | | $ | 8,740 | |
| Net income (loss) from: | | | | | | | | | | | | | | | | | | | | |
| Continuing operations | | $ | 1,124 | | | $ | 1,916 | | | $ | (9,108 | ) | | $ | (4,731 | ) | | $ | (10,799 | ) |
| Discontinued operations | | $ | (326 | ) | | $ | (121 | ) | | $ | 1,085 | | | $ | (381 | ) | | $ | 257 | |
| Net income (loss) | | $ | 798 | | | $ | 1,795 | | | $ | (8,023 | ) | | $ | (5,112 | ) | | $ | (10,542 | ) |
| | | | | | | | | | | | | | | | | | | | | |
| Earnings (loss) per share - Basic: | | | | | | | | | | | | | | | | | | | | |
| | | | | | | | | | | | | | | | | | | | | |
| Continuing operations | | $ | 0.04 | | | $ | 0.07 | | | $ | (0.34 | ) | | $ | (0.18 | ) | | $ | (0.41 | ) |
| Discontinued operations | | | (0.01 | ) | | | (0.01 | ) | | | 0.04 | | | | (0.01 | ) | | | 0.01 | |
| Net income (loss) | | $ | 0.03 | | | $ | 0.06 | | | $ | (0.30 | ) | | $ | (0.19 | ) | | $ | (0.40 | ) |
| | | | | | | | | | | | | | | | | | | | | |
| Earnings (loss) per share - Diluted: | | | | | | | | | | | | | | | | | | | | |
| | | | | | | | | | | | | | | | | | | | | |
| Continuing operations | | $ | 0.04 | | | $ | 0.07 | | | $ | (0.34 | ) | | $ | (0.18 | ) | | $ | (0.41 | ) |
| Discontinued operations | | | (0.01 | ) | | | (0.01 | ) | | | 0.04 | | | | (0.01 | ) | | | 0.01 | |
| Net income (loss) | | $ | 0.03 | | | $ | 0.06 | | | $ | (0.30 | ) | | $ | (0.19 | ) | | $ | (0.40 | ) |
| | | | | | | | | | | | | | | | | | | | | |
| Dividend declared per share | | $ | 0.16 | | | $ | 0.16 | | | $ | 0.16 | | | $ | 0.16 | | | $ | 0.64 | |
ITEM 9 - CHANGES IN AND DISAGREEMENTS WITH ACCOUNTANTS ON ACCOUNTING AND FINANCIAL DISCLOSURE
None.
Evaluation of Disclosure Controls
The company's management, with the participation of the Chief Executive Officer and Chief Financial Officer, evaluated the effectiveness of the company's disclosure controls and procedures (as defined in Rules 13a-15(e) and 15d-15(e) under the Securities Exchange Act of 1934, as amended (the “Exchange Act”)) as of December 30, 2007. Our disclosure controls and procedures are designed to ensure that information required to be disclosed in reports we file or submit under the Exchange Act is recorded, processed, summarized and reported within the time periods specified in SEC rules and forms and that such information is accumulated and communicated to our management, including our Chief Executive Officer and Chief Financial Officer, to allow timely decision regarding required disclosures.
Based on our evaluation and the identification of the material weakness in internal control over financial reporting described below in Management's Report on Internal Control Over Financial Reporting, our Chief Executive Officer and Chief Financial Officer concluded that, as of December 30, 2007, our disclosure controls and procedures were not effective. Notwithstanding the material weakness, management has concluded that the consolidated financial statements included in this Annual Report on Form 10-K fairly represent in all material respects our financial condition, results of operations and cash flows for the periods presented in conformity with accounting principles generally accepted in the United States of America.
Management’s Report on Internal Control Over Financial Reporting
Management is responsible for establishing and maintaining adequate internal control over financial reporting. Internal control over financial reporting is a process designed to provide reasonable assurance regarding the reliability of financial reporting and the preparation of financial statements for external purposes in accordance with generally accepted accounting principles. The company's internal control over financial reporting includes those policies and procedures that (i) pertain to the maintenance of records that, in reasonable detail, accurately and fairly reflect the transactions and dispositions of the assets of the company; (ii) provide reasonable assurance that transactions are recorded as necessary to permit preparation of financial statements in accordance with generally accepted accounting principles, and that receipts and expenditures of the company are being made only in accordance with authorizations of management and directors of the company; and (iii) provide reasonable assurance regarding prevention or timely detection of unauthorized acquisition, use, or disposition of the company's assets that could have a material effect on the financial statements.
Because of its inherent limitations, internal control over financial reporting may not prevent or detect misstatements. Also, projections of any evaluation of effectiveness to future periods are subject to the risk that controls may become inadequate because of changing conditions, or that the degree of compliance with policies or procedures may deteriorate.
Management performed an assessment of the effectiveness of the company’s internal control over financial reporting as of December 30, 2007 based upon criteria established in Internal Control -- Integrated Framework issued by the Committee of Sponsoring Organizations of the Treadway Commission ("COSO").
A material weakness is a deficiency, or a combination of deficiencies, in internal control over financial reporting, such that there is a reasonable possibility that a material misstatement of the company's annual or interim financial statements will not be prevented or detected on a timely basis. Management identified the following material weakness in the company’s internal control over financial reporting as of December 30, 2007:
We did not maintain effective controls over the completeness, accuracy and valuation of the accounting for and disclosure of income taxes. Specifically, we did not have effective controls to ensure that the income tax provision and related taxes payable and deferred tax liabilities were properly reconciled to the differences between the net book basis and net tax basis of our depreciable property, plant and equipment subsidiary ledgers. Also, we did not have sufficient resources to enable us to properly consider and apply GAAP for income taxes. These control deficiencies resulted in the misstatement of our deferred income tax provision and deferred tax liabilities accounts and related financial disclosures in the consolidated financial statements, and in the restatement of our annual consolidated financial statements for 2006 and 2005, each of the quarters of 2006 and the first three quarters of 2007. Additionally, these control deficiencies could result in the misstatement of the aforementioned accounts and disclosures that would result in a material misstatement in our annual or interim consolidated financial statements that would not be prevented or detected. Accordingly, management has determined that these control deficiencies constitute a material weakness.
Because of the material weakness, described above, management has concluded that company did not maintain effective internal control over financial reporting as of December 30, 2007, based on the criteria in the Internal Control-Integrated Framework issued by COSO.
The effectiveness of internal control over financial reporting as of December 30, 2007 has been audited by PricewaterhouseCoopers LLP, an independent registered public accounting firm, as stated in their report, which appears herein.
Changes in Internal Control Over Financial Reporting
In December 2007, we hired a Director of Tax with the appropriate level of knowledge, experience and training commensurate with our financial reporting requirements. This addition is not certain to remedy our material weakness in internal control over financial reporting. There were no changes, other than the above, in our internal control over financial reporting during the fourth quarter of fiscal 2007 that have materially affected, or are reasonably likely to materially affect, our internal control over financial reporting.
Statement Regarding NYSE Mandated Disclosures
The company has filed with the SEC as exhibits to its 2007 Annual Report on Form 10-K the certifications of the company's Chief Executive Officer and its Chief Financial Officer required under Section 302 of the Sarbanes-Oxley Act and SEC Rule 13a-14(a) regarding the company's financial statements, disclosure controls and procedures and other matters. On June 4, 2007, following its 2007 annual meeting of stockholders, the company submitted to the NYSE the annual certificate of the company's Chief Executive Officer required under Section 303A.12(a) of the NYSE Listed Company Manual, that he was not aware of any violation by the company of the NYSE's corporate governance listing standards.
None.
ITEM 10 – DIRECTORS, EXECUTIVE OFFICERS AND CORPORATE GOVERNANCE
Except as set forth herein, the information required by this Item is incorporated by reference to our 2008 Annual Proxy Statement.
Executive Officers
The names of corporate executive officers as of fiscal year end that are not also Directors are listed at the end of Items 4 – Submission of Matters to a Vote of Security Holders. Information regarding executive officers that are Directors is contained in our 2008 Annual Proxy Statement under the caption “Election of Directors”. Such information is incorporated herein by reference. All executive officers are appointed annually by the Board of Directors and serve one-year terms. Also see “Employment Agreements” in our 2008 Annual Proxy Statement, which is incorporated herein by reference.
Code of Ethics
Included on our website, www.supind.com, under “Investors,” is our Code of Business Conduct and Ethics, which, among others, applies to our Chief Executive Officer, Chief Financial Officer and Chief Accounting Officer. Copies of our Code of Business Conduct and Ethics are available, without charge, from Superior Industries International, Inc., Shareholder Relations, 7800 Woodley Avenue, Van Nuys, CA 91406.
Information relating to Executive Compensation is set forth under the captions “Compensation of Directors” and “Compensation Discussion and Analysis” in our 2008 Annual Proxy Statement, which is incorporated herein by reference.
ITEM 12 - SECURITY OWNERSHIP OF CERTAIN BENEFICIAL OWNERS AND MANAGEMENT AND RELATED STOCKHOLDER MATTERS
Information related to Security Ownership of Certain Beneficial Owners and Management and Related Stockholder Matters is set forth under the caption “Voting Securities and Principal Holders” in our 2008 Annual Proxy Statement. Also see Note 13- Stock Based Compensation in Notes to the Consolidated Financial Statements in Item 8 – Financial Statements and Supplementary Data of this Annual Report on Form 10-K.
ITEM 13 - CERTAIN RELATIONSHIPS AND RELATED TRANSACTIONS, AND DIRECTOR INDEPENDENCE
Information related to Certain Relationships and Related Transactions is set forth under the captions, “Election of Directors” and “Transactions with Related Persons”, in our 2008 Annual Proxy Statement, and in Note – 9 - Leases and Related Parties in Notes to the Consolidated Financial Statements in Item 8 – Financial Statements and Supplementary Data of this Annual Report on Form 10-K.
ITEM 14 – PRINCIPAL ACCOUNTANT FEES AND SERVICES
Information related to Principal Accountant Fees and Services is set forth under the caption “Audit Fees”, “Audit Related Fees” and “Tax Fees” in our 2008 Annual Proxy Statement and is incorporated herein by reference.
ITEM 15 – EXHIBITS AND FINANCIAL STATEMENT SCHEDULES
| (a) | The following documents are filed as a part of this report: |
| | 1. | Financial Statements: See the “Index to the Consolidated Financial Statements” in Item 8 of this Annual Report. |
| | 2. | Financial Statement Schedule |
Schedule II – Valuation and Qualifying Accounts for the Years Ended
December 31, 2007, 2006 and 2005 S-1
| | 2.1 | Asset Purchase Agreement with St. Jean Industries, Inc. and St. Jean Industries, SAS (Incorporated by reference to Exhibit 2.1 to Registrant’s Annual Report on Form 10-K for the year ended December 31, 2006.) |
| | 3.1 | Articles of Incorporation of the Registrant (Incorporated by reference to Exhibit 3.1 to Registrant’s Annual Report on Form 10-K for the year ended December 31, 1994.) |
| | 3.2 | By-Laws of the Registrant (Incorporated by reference to Exhibit 3.2 to Registrant’s Annual Report on Form 10-K for the year ended December 31, 1994.) |
| | 10.2 | Lease dated March 2, 1976 between the Registrant and Louis L. Borick filed on Form 8-K dated May 1976 (Incorporated by reference to Exhibit 10.2 to Registrant's Annual Report on Form 10-K for the year ended December 31, 1983.) |
| | 10.20 | Supplemental Executive Individual Retirement Plan of the Registrant (Incorporated by reference to Exhibit 10.20 to Registrant's Annual Report on Form 10-K for the year ended December 31, 1987.) |
| | 10.32 | Employment Agreement dated January 1, 1994 between Louis L. Borick and the Registrant (Incorporated by reference to Exhibit 10.32 to Registrant’s Annual Report on Form 10-K for the year ended December 31, 1993, as amended.) |
| | 10.33 | 1993 Stock Option Plan of the Registrant (Incorporated by reference to Exhibit 28.1 to Registrant's Form S-8 filed June 10, 1993, as amended. Registration No. 33-64088.) |
| | 10.36 | Stock Option Agreement dated March 9, 1993 between Louis L. Borick and the Registrant (Incorporated by Reference to Exhibit 28.2 to Registrant's Form S-8 filed June 10, 1993. Registration No. 33-64088.) |
| | 10.39 | Chief Executive Officer Annual Incentive Program dated May 9, 1994 between Louis L. Borick and the Registrant (Incorporated by reference to Exhibit 10.39 to Registrant’s Annual Report on Form 10-K for the year ended December 31, 1994.) |
| | 10.42 | 2003 Equity Incentive Plan of the Registrant (Incorporated by reference to Exhibit 99.1 to Registrant’s Form S-8 dated July 28, 2003. Registration No. 333-107380.) |
| | 10.43 | Executive Employment Agreement dated January 1, 2005 between Steven J. Borick and the registrant (Incorporated by reference to Exhibit 10.43 to Registrant’s Annual Report on Form 10-K for the year ended December 25, 2005.) |
| | 10.44 | Executive Annual Incentive Plan dated January 1, 2005 between Steven J. Borick and the registrant (Incorporated by reference to Exhibit 10.44 to Registrant’s Annual Report on Form 10-K for the year ended December 25, 2005.) |
| | 10.45 | 2006 Option Repricing Agreement entered into between the Registrant and each of the following persons separately: Raymond C. Brown, Philip C. Colburn, V. Bond Evans, R. Jeffery Ornstein, Emil J. Fanelli, Stephen H. Gamble and Kola Phillips dated December 28, 2006; Sheldon I. Ausman, Steven J. Borick, Jack H. Parkinson, Robert H. Bouskill, Bob Bracy, Parveen Kakar, Michael J. O’Rourke and Gabriel Soto dated December 29, 2006 (Incorporated by reference to Exhibit 10.45 to Registrant’s Annual Report on Form 10-K for the year ended December 31, 2006.) |
| | 10.46 | 2006 Option Correction Amendment entered into between the Registrant and each of the following persons separately: Louis L. Borick, James H. Ferguson and William B. Kelley dated December 29, 2006 (Incorporated by reference to Exhibit 10.46 to Registrant’s Annual Report on Form 10-K for the year ended December 31, 2006.) |
| | 10.47 | Amendment to Stock Option Agreement entered into between the Registrant and each of the following persons separately: Robert A. Earnest, Razmick Perian and Cameron Toyne dated October 9, 2007 (filed herewith) |
| | 11 | Computation of Earnings Per Share (contained in Note 1 – Summary of Significant Accounting Policies in Notes to Consolidated Financial Statements in Item 8 – Financial Statements and Supplementary Data of this Annual Report on Form 10-K) |
| | 14 | Code of Business Conduct and Ethics (posted on the Registrant’s Internet Website pursuant to Regulation S-K, item 406 (c)(2).) |
| | 21 | List of Subsidiaries of the Company (filed herewith) |
| | 23 | Consent of PricewaterhouseCoopers LLP, our Independent Registered Public Accounting Firm (filed herewith) |
| | 31.1 | Chief Executive Officer Certification Pursuant to 18 U.S.C. Section 1350, as Adopted Pursuant to Section 302(a) of the Sarbanes-Oxley Act of 2002 (filed herewith) |
| | 31.2 | Chief Financial Officer Certification Pursuant to 18 U.S.C. Section 1350, as Adopted Pursuant to Section 302(a) of the Sarbanes-Oxley Act of 2002 (filed herewith) |
| | 32 | Certification of Steven J. Borick, Chairman, Chief Executive Officer and President, and Erika H. Turner, Chief Financial Officer, Pursuant to 18 U.S.C. Section 1350, as Adopted Pursuant to Section 906 of the Sarbanes-Oxley Act of 2002 (furnished herewith) |
| | 99.1 | Selected Unaudited Quarterly Consolidated Financial Data (filed herewith) |
SUPERIOR INDUSTRIES INTERNATIONAL, INC.
ANNUAL REPORT OF FORM 10-K
Schedule II
VALUATION AND QUALIFYING ACCOUNTS
FOR THE YEARS ENDED DECEMBER 31, 2007, 2006 AND 2005
(Thousands of dollars)
| | | | | | Additions | | | | | | | |
| | | Balance at | | | Charge to | | | Adoption of | | | Deductions | | | Balance at | |
| | | Beginning of | | | Costs and | | | New Accounting | | | From | | | End of | |
| | | Year | | | Expenses | | | Principles | | | Reserves | | | Year | |
| | | | | | | | | | | | | | | | |
| 2007 | | | | | | | | | | | | | | | |
| | | | | | | | | | | | | | | | |
| Allowance for doubtful | | | | | | | | | | | | | | | |
| accounts | | $ | 2,789 | | | $ | 95 | | | $ | - | | | $ | (457 | ) | | $ | 2,427 | |
| Inventory reserve | | | 1,204 | | | | 896 | | | | - | | | | (449 | ) | | | 1,651 | |
| Valuation allowance for | | | | | | | | | | | | | | | | | | | | |
| deferred tax assets | | | 1,418 | | | | 665 | | | | 10,000 | | | | - | | | | 12,083 | |
| | | | | | | | | | | | | | | | | | | | | |
| 2006 | | | | | | | | | | | | | | | | | | | | |
| | | | | | | | | | | | | | | | | | | | | |
| Allowance for doubtful | | | | | | | | | | | | | | | | | | | | |
| accounts | | $ | 2,000 | | | $ | 2,154 | | | $ | - | | | $ | (1,365 | ) | | $ | 2,789 | |
| Inventory reserve | | | 512 | | | | 714 | | | | - | | | | (22 | ) | | | 1,204 | |
| Valuation allowance for | | | | | | | | | | | | | | | | | | | | |
| deferred tax assets | | | 705 | | | | 713 | | | | - | | | | - | | | | 1,418 | |
| | | | | | | | | | | | | | | | | | | | | |
| 2005 | | | | | | | | | | | | | | | | | | | | |
| | | | | | | | | | | | | | | | | | | | | |
| Valuation Reserve | | | | | | | | | | | | | | | | | | | | |
| accounts | | $ | 3,384 | | | $ | 644 | | | $ | - | | | $ | (2,028 | ) | | $ | 2,000 | |
| Inventory reserve | | | 983 | | | | 79 | | | | - | | | | (550 | ) | | | 512 | |
| Valuation allowance for | | | | | | | | | | | | | | | | | | | | |
| deferred tax assets | | | - | | | | 705 | | | | - | | | | - | | | | 705 | |
S-1
SUPERIOR INDUSTRIES INTERNATIONAL, INC. ANNUAL REPORT OF FORM 10-K
SIGNATURES
Pursuant to the requirements of Section 13 or 15(d) of the Securities Exchange Act of 1934, the Registrant has duly caused this report to be signed on its behalf by the undersigned, thereunto duly authorized.
| | | | | | |
| SUPERIOR INDUSTRIES INTERNATIONAL, INC. | | | |
| (Registrant) | | | |
| | | | | | |
| | By | /s/ Steven J. Borick | | | March 31, 2008 |
| | | Steven J. Borick | | | |
| | | Chairman, Chief Executive Officer and President | | | |
Pursuant to the requirements of the Securities Exchange Act of 1934, this report has been signed below by the following persons on behalf of the registrant and in the capacity and on the dates indicated.
| | | | | | | | |
/s/ Louis L. Borick | | | Founding Chairman and Director | | | March 31, 2008 | |
| Louis L. Borick | | | | | | | |
| | | | | | | | |
| | | | | | | | |
/s/ Steven J. Borick | | | Chairman, Chief Executive Officer and President | | | March 31, 2008 | |
| Steven J. Borick | | | (Principal Executive Officer) | | | | |
| | | | | | | | |
| | | | | | | | |
/s/ Erika H. Turner | | | Chief Financial Officer | | | March 31, 2008 | |
| Erika H. Turner | | | (Principal Financial Officer) | | | | |
| | | | | | | | |
| | | | | | | | |
/s/ Emil J. Fanelli | | | Vice President and Corporate Controller | | | March 31, 2008 | |
| Emil J. Fanelli | | | (Principal Accounting Officer) | | | | |
| | | | | | | | |
| | | | | | | | |
/s/ Sheldon I. Ausman | | | Lead Director | | | March 31, 2008 | |
| Sheldon I. Ausman | | | | | | | |
| | | | | | | | |
| | | | | | | | |
/s/ Philip W. Colburn | | | Director | | | March 31, 2008 | |
| Philip W. Colburn | | | | | | | |
| | | | | | | | |
| | | | | | | | |
/s/ Margaret S. Dano | | | Director | | | March 31, 2008 | |
| Margaret S. Dano | | | | | | | |
| | | | | | | | |
| | | | | | | | |
/s/ V. Bond Evans | | | Director | | | March 31, 2008 | |
| V. Bond Evans | | | | | | | |
| | | | | | | | |
| | | | | | | | |
/s/ Michael J. Joyce | | | Director | | | March 31, 2008 | |
| Michael J. Joyce | | | | | | | |
| | | | | | | | |
| | | | | | | | |
/s/ Francisco S. Uranga | | | Director | | | March 31, 2008 | |
| Francisco S. Uranga | | | | | | | |