UNITED STATES
SECURITIES AND EXCHANGE COMMISSION
WASHINGTON, D. C. 20549
FORM N-CSR
Investment Company Act file number: 811-01236
Deutsche Market Trust
(Exact Name of Registrant as Specified in Charter)
345 Park Avenue
New York, NY 10154-0004
(Address of Principal Executive Offices) (Zip Code)
Registrant’s Telephone Number, including Area Code: (212) 250-3220
Paul Schubert
60 Wall Street
New York, NY 10005
(Name and Address of Agent for Service)
| Date of fiscal year end: | 8/31 |
| Date of reporting period: | 8/31/2015 |
| ITEM 1. | REPORT TO STOCKHOLDERS |

August 31, 2015
Annual Report
to Shareholders
Deutsche Strategic Equity Long/Short Fund
![]()
Contents
3 Letter to Shareholders 5 Portfolio Management Review 11 Performance Summary 13 Investment Portfolio 27 Statement of Assets and Liabilities 29 Statement of Operations 30 Statement of Changes in Net Assets 31 Financial Highlights 35 Notes to Financial Statements 50 Report of Independent Registered Public Accounting Firm 51 Information About Your Fund's Expenses 52 Tax Information 53 Advisory Agreement Board Considerations and Fee Evaluation 56 Board Members and Officers 61 Account Management Resources |
This report must be preceded or accompanied by a prospectus. To obtain a summary prospectus, if available, or prospectus for any of our funds, refer to the Account Management Resources information provided in the back of this booklet. We advise you to consider the fund's objectives, risks, charges and expenses carefully before investing. The summary prospectus and prospectus contain this and other important information about the fund. Please read the prospectus carefully before you invest.
Investing in derivatives entails special risks relating to liquidity, leverage and credit that may reduce returns and/or increase volatility. Emerging markets tend to be more volatile than the markets of more mature economies, and generally have less diverse and less mature economic structures and less stable political systems than those of developed countries. Investing in foreign securities presents certain risks, such as currency fluctuations, political and economic changes, and market risks. Since the fund will typically hold both long and short positions, the fund’s results will suffer both when there is a general market advance and the fund holds significant short positions, or when there is a general market decline and the fund holds significant long positions. Investment strategies employed by the fund’s investment management teams are intended to be complementary, but may not be. The interplay of the various strategies may result in the fund holding a significant amount of certain types of securities and could increase the fund’s portfolio turnover rates which may result in higher transactional costs and/or capital gains or losses. Some money managers will have a greater degree of correlation with each other and with the market than others. The degree of correlation will vary as a result of market conditions and other factors. This fund is non-diversified and can take larger positions in fewer issues, increasing its potential risk. The fund may lend securities to approved institutions. Short sales — which involve selling borrowed securities in anticipation of a price decline, then returning an equal number of the securities at some point in the future — could magnify losses and increase volatility. Stocks may decline in value. See the prospectus for details.
Deutsche Asset & Wealth Management represents the asset management and wealth management activities conducted by Deutsche Bank AG or any of its subsidiaries, including the Advisor and DeAWM Distributors, Inc.
NOT FDIC/NCUA INSURED NO BANK GUARANTEE MAY LOSE VALUE NOT A DEPOSIT NOT INSURED BY ANY FEDERAL GOVERNMENT AGENCY
Letter to Shareholders
Dear Shareholder:
Despite slow growth during the first half of 2015 and disturbing market volatility in late summer, the U.S. economy’s underlying fundamentals remain sound. Employment growth has been solid, the housing market continues to improve and households have strengthened their finances. Real income is firming and, while consumers remain cautious, they’re likely to loosen their purse strings over time.
In short, our economists see an environment that should support modestly above-trend domestic growth. The strong U.S. dollar continues to act as a headwind to exports and (for those whose positions are not hedged) a detractor from foreign equity returns.
The Federal Reserve Board is likely to start raising short-term interest rates in the coming months. However, the specific timing remains unclear. In any case, analysts expect the process to be gradual. Meanwhile, Europe’s slow but steady recovery remains on track, and central bank easing should continue to stimulate growth, albeit at the cost of increased volatility.
This view may seem overly optimistic in light of recent developments in China. Indeed, our Chief Investment Officer, Asoka Wohrmann, wrote in his September update: "The risks from China’s transformation should not be underestimated. The country has a one-sixth share of global trade, and its growth looks set to be more unpredictable in the future." Nevertheless, he adds "We are still optimistic about the global economy and about most stock exchanges…. Our scenario is based on the assumption that the upswings in Europe and the United States are sufficiently self-supporting not to be derailed by developments in China."
We encourage you to visit us at deutschefunds.com for timely information and insights about economic developments and your Deutsche fund investment. With frequent updates from Mr. Wohrmann and our economists, we want to ensure that you have the resources you need to make informed decisions.
Thank you for your continued investment. We appreciate the opportunity to serve your investment needs.
Best regards,

 |
Brian Binder President, Deutsche Funds |
Portfolio Management Review (Unaudited)
Market Overview and Fund Performance
All performance information below is historical and does not guarantee future results. Returns shown are for Class A shares, unadjusted for sales charges. Investment return and principal fluctuate, so your shares may be worth more or less when redeemed. Current performance may differ from performance data shown. Please visit deutschefunds.com for the most recent month-end performance of all share classes. Fund performance includes reinvestment of all distributions. Unadjusted returns do not reflect sales charges and would have been lower if they had.
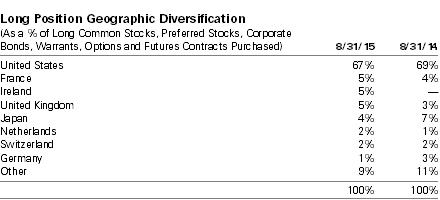
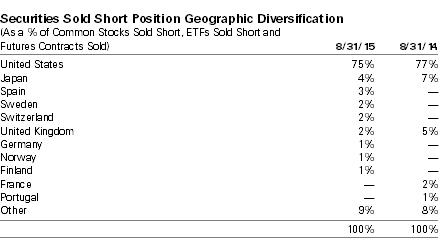
Investment Strategy The fund seeks to achieve its investment objective by employing a multi-manager approach whereby the fund's assets are allocated among separate subadvisors that employ a variety of long/short investment strategies that take long and short positions. The fund may have exposure to equity securities of U.S. and foreign companies of all sizes. Some subadvisors may focus on certain sectors of the market or geographic locations. |
For the fiscal period ending August 31, 2015, the fund posted a –6.44% total return, compared with the –1.00% return of the HFRX Equity Hedge Index and the 0.48% return of the Standard & Poor's 500® (S&P 500) Index.
Positive Contributors to Performance
Chilton Investment Company, LLC (Chilton) was weighted at 33.14% of the fund's portfolio as of August 31, 2015. During the period, the manager took a "growth at a reasonable price" approach to investing, with a focus on consumer, health care, industrials and materials-related companies. This was rewarded with a strong positive return as growth-oriented stocks returned to investor favor during the period. Concurrently, Chilton effectively managed downside risk through its short portfolio when equity markets sold off.
Negative Contributors to Performance
Atlantic Investment Management, Inc. (Atlantic) was weighted at 19.46% of the fund's portfolio as of August 31, 2015. Due to the contrarian and concentrated nature of their approach, our exposure to the manager carried a higher degree of volatility. Unfortunately, volatility came at the expense of performance during the prolonged sell-off in the commodity markets due to overweight exposure in the energy, industrials and materials sectors. The manager took advantage of the weakness by adding to their highest-conviction names.
Lazard Asset Management LLC (Lazard) was weighted at 24.69% of the fund's portfolio as of August 31, 2015. During the period, the manager shifted its geographic exposure to be net long developed markets Europe and Asia while going market neutral with respect to North America. This was punished as international equities periodically sold off from uncertainties over Greece and Chinese financial markets.
Omega Advisors, Inc. (Omega) was weighted at 22.71% of the fund's portfolio as of August 31, 2015. The manager's value-oriented strategy suffered from holdings in energy and financials. During the period ending August 31, 2015, Omega steadily increased their long exposure to the market despite the fact that the manager believes equities are fairly valued after recent gains. This positioning is based on the view that investors remain underweight equities by historical standards. In addition, investors have little in the way of attractive alternatives to equities, with interest rates at extraordinarily low levels and corporate debt priced for perfection.
During the period, one or more subadvisors utilized derivatives in the form of forward or futures contracts in order to minimize the impact of fluctuating currency exchange rates on returns.
Outlook and Positioning
The Advisor believes that conditions have been progressively improving with respect to implementation of the fund's long/short equity approach. While markets remain concerned over geopolitical and macroeconomic events, the focus has begun to shift toward the fundamental prospects of individual companies. As a result, there has been an increase in the dispersion of performance across individual equities, increasing the opportunity set for the fund's strategy.
| Ten Largest Long Common Stock Holdings at August 31, 2015 (19.1% of Net Assets) | |
1. Allergan PLC Manufactures specialty pharmaceuticals | 3.0% |
2. W.R. Grace & Co. Supplier of specialty chemical and container products | 2.4% |
3. Owens-Illinois, Inc. Manufactures plastic and glass packing products | 2.1% |
4. FMC Corp. Produces diverse chemical solutions, applications and products | 1.8% |
5. Costco Wholesale Corp. Operator of wholesale warehouse stores | 1.7% |
6. Becton, Dickinson & Co. Provider of medical supplies and devices | 1.7% |
7. IDEXX Laboratories, Inc. Provides diagnostic, detection and information systems for veterinary, food and water testing applications | 1.7% |
8. Home Depot, Inc. Home improvement retailer that sells building materials and home improvements products | 1.6% |
9. The Sherwin-Williams Co. Manufacturer of paints, coatings and related products | 1.6% |
10. Buffalo Wild Wings, Inc. Owns and operates Buffalo Wild Wings Bar and Restaurant | 1.5% |
| Ten Largest Common Stock Sold Short Equity Holdings at August 31, 2015 (3.0% of Net Assets) | |
1. Banco Bilbao Vizcaya Argentaria SA Attracts, deposits and offers retail wholesale and investment banking services | 0.4% |
2. Bolsas y Mercados Espanoles SHMSF SA Operator of all stock markets and financial systems in Spain | 0.4% |
3. Hain Celestial Group, Inc. Distributor and seller of natural, organic and specialty food products | 0.3% |
4. AGCO Corp. Manufactures and distributes agricultural equipment throughout the world | 0.3% |
5. Berkshire Hathaway, Inc. Holding company of insurance business and a variety of other businesses | 0.3% |
6. Mediaset Espana Comunicacion SA Television broadcaster; conducts television, cinema and music production operations | 0.3% |
7. ICA Gruppen AB Operates and manages food retail stores | 0.3% |
8. Hexagon AB Global provider of technologies | 0.3% |
9. DNB ASA Commercial bank | 0.2% |
10. Nestle SA Multinational packaged food company | 0.2% |
Portfolio holdings and characteristics are subject to change. For more complete details about the fund's investment portfolio, see page 13. A quarterly Fact Sheet is available on deutschefunds.com or upon request. Please see the Account Management Resources section on page 61 for contact information. | |
Portfolio Management Team
Effective September 16, 2015, the fund's portfolio management team is as follows:
Deutsche Investment Management Americas Inc.
Mihir Meswani, Director, DIMA
Portfolio Manager of the fund. Began managing the fund in 2014.
— Joined Deutsche Asset & Wealth Management in 2014 with 21 years of industry experience in asset allocation and portfolio management of multi-asset class portfolios.
— Previously, he worked at Mount Yale Capital Group where he was a portfolio manager for the group’s alternative mutual funds. Prior to that, he was Chief Investment Strategist at Sandalwood Securities, where he was a member of the Investment Committee with direct responsibility for the portfolio management of Sandalwood’s fund of hedge funds and alternative mutual fund portfolio.
— Previously, he held a position as Director of Public Investments for the Robert Wood Johnson Foundation where he managed assets across equity and fixed income, hedge funds, credit and real assets. He also worked for Bank of America and JP Morgan in similar roles.
— BS in Finance and a BA in Economics, Rutgers University.
Subadvisors
Atlantic Investment Management, Inc.
Alexander Roepers, President of Atlantic Investment Management, Inc.
Portfolio Manager of a sleeve of the fund. Began managing the fund in 2014.
— Founded Atlantic Investment Management, Inc. in 1988.
Chilton Investment Company, LLC
Richard L. Chilton, Jr., Founder, Chairman, Chief Executive Officer and Chief Investment Officer of Chilton Investment Company, LLC
Portfolio Manager of a sleeve of the fund. Began managing the fund in 2014.
— Founded Chilton Investment Company, LLC in 1992.
Lazard Asset Management LLC
Jean-Daniel Malan, Director at Lazard Asset Management LLC
Portfolio Manager of a sleeve of the fund. Began managing the fund in 2014.
— Joined Lazard Asset Management LLC in 1998 as an Equity Analyst and then worked as a Portfolio Manager for European Equity, and rejoined Lazard in 2008 after working as a Portfolio Manager for two years at BlueCrest Capital Management.
Omega Advisors, Inc.
Leon G. Cooperman, Chairman and Chief Executive Officer of Omega Advisors, Inc.
Portfolio Manager of a sleeve of the fund. Began managing the fund in 2014.
— Founded Omega Advisors, Inc. in 1991.
The views expressed reflect those of the portfolio management team only through the end of the period of the report as stated on the cover. The management team's views are subject to change at any time based on market and other conditions and should not be construed as a recommendation. Past performance is no guarantee of future results. Current and future portfolio holdings are subject to risk.
Terms to Know
The HFRX Equity Hedge Index tracks the performance of strategies that maintain both long and short positions in equity and equity-derivative securities.
The Standard & Poor's 500 (S&P 500) Index is an unmanaged, capitalization- weighted index of 500 stocks. The index is designed to measure performance of the broad domestic economy through changes in the aggregate market value of 500 stocks representing all major industries.
Index returns do not reflect fees or expenses and it is not possible to invest directly into an index.
Net exposure is the percentage difference between a fund's long and short exposure.
A long position is the purchase of a security with the expectation that its value will rise.
A short position is the sale of a borrowed security with the expectation that its value will fall.
Performance Summary August 31, 2015 (Unaudited)
| Class A | 1-Year | Life of Fund* |
| Average Annual Total Returns as of 8/31/15 | ||
| Unadjusted for Sales Charge | –6.44% | –4.42% |
| Adjusted for the Maximum Sales Charge (max 5.75% load) | –11.82% | –8.69% |
| HFRX Equity Hedge Index† | –1.00% | 0.46% |
| Class C | 1-Year | Life of Fund* |
| Average Annual Total Returns as of 8/31/15 | ||
| Unadjusted for Sales Charge | –7.06% | –5.13% |
| Adjusted for the Maximum Sales Charge (max 1.00% CDSC) | –7.06% | –5.13% |
| HFRX Equity Hedge Index† | –1.00% | 0.46% |
| Class S | 1-Year | Life of Fund* |
| Average Annual Total Returns as of 8/31/15 | ||
| No Sales Charge | –6.24% | –4.34% |
| HFRX Equity Hedge Index† | –1.00% | 0.46% |
| Institutional Class | 1-Year | Life of Fund* |
| Average Annual Total Returns as of 8/31/15 | ||
| No Sales Charge | –6.14% | –4.19% |
| HFRX Equity Hedge Index† | –1.00% | 0.46% |
Performance in the Average Annual Total Returns table above and the Growth of an Assumed $10,000 Investment line graph that follows is historical and does not guarantee future results. Investment return and principal fluctuate so your shares may be worth more or less when redeemed. Current performance may differ from performance data shown. Please visit deutschefunds.com for the Fund's most recent month-end performance. Fund performance includes reinvestment of all distributions. Unadjusted returns do not reflect sales charges and would have been lower if they had.
The gross expense ratios of the Fund, as stated in the fee table of the prospectus dated December 1, 2014 are 3.26%, 4.02%, 3.16% and 2.97% for Class A, Class C, Class S and Institutional Class shares, respectively, and may differ from the expense ratios disclosed in the Financial Highlights tables in this report.
Index returns do not reflect any fees or expenses and it is not possible to invest directly into an index.
Performance figures do not reflect the deduction of taxes that a shareholder would pay on fund distributions or the redemption of fund shares.
| Growth of an Assumed $10,000 Investment (Adjusted for Maximum Sales Charge) |
■ Deutsche Strategic Equity Long/Short Fund — Class A ■ HFRX Equity Hedge Index† |
 |
The Fund's growth of an assumed $10,000 investment is adjusted for the maximum sales charge of 5.75%. This results in a net initial investment of $9,425.
The growth of $10,000 is cumulative.
Performance of other share classes will vary based on the sales charges and the fee structure of those classes.
* The Fund commenced operations on May 15, 2014. The performance shown for the index is for the time period of May 31, 2014 through August 31, 2015, which is based on the performance period of the life of the Fund.
† The HFRX Equity Hedge Index tracks the performance of investing strategies that maintain both long and short positions primarily in equity and equity-derivative securities.
| Class A | Class C | Class S | Institutional Class | |
| Net Asset Value | ||||
| 8/31/15 | $ 9.37 | $ 9.28 | $ 9.38 | $ 9.40 |
| 8/31/14 | $ 10.08 | $ 10.05 | $ 10.07 | $ 10.08 |
| Distribution Information as of 8/31/15 | ||||
| Income Dividends, Twelve Months | $ .04 | $ .04 | $ .04 | $ .04 |
| Capital Gain Distributions, Twelve Months | $ .02 | $ .02 | $ .02 | $ .02 |
Investment Portfolio as of August 31, 2015
Shares | Value ($) | |
| Long Positions 130.5% | ||
| Common Stocks 100.7% | ||
| Consumer Discretionary 25.1% | ||
| Auto Components 5.6% | ||
| American Axle & Manufacturing Holdings, Inc.* (a) | 37,487 | 757,237 |
| Cie Generale des Etablissements Michelin | 8,205 | 795,005 |
| Faurecia | 12,074 | 437,278 |
| Goodyear Tire & Rubber Co. (a) (b) | 51,488 | 1,532,798 |
| Koito Manufacturing Co., Ltd. | 18,400 | 630,520 |
| Lear Corp. (a) | 7,472 | 768,047 |
| Magna International, Inc. (a) | 14,217 | 699,334 |
| 5,620,219 | ||
| Hotels, Restaurants & Leisure 5.0% | ||
| Ainsworth Game Technology Ltd. (b) | 75,991 | 162,241 |
| Bloomin' Brands, Inc. (b) | 17,682 | 366,018 |
| Buffalo Wild Wings, Inc.* (b) | 8,173 | 1,550,255 |
| Domino's Pizza, Inc. (b) | 11,011 | 1,166,505 |
| Hilton Worldwide Holdings, Inc. | 5,000 | 124,150 |
| Melco Crown Entertainment Ltd. (ADR) | 14,000 | 246,680 |
| MGM Resorts International* | 13,200 | 269,676 |
| Sonic Corp. (a) (b) | 46,480 | 1,254,960 |
| Starwood Hotels & Resorts Worldwide, Inc. | 100 | 7,147 |
| 5,147,632 | ||
| Internet & Catalog Retail 1.5% | ||
| The Priceline Group, Inc.* | 440 | 549,401 |
| Wayfair, Inc. "A"* (b) | 25,756 | 960,699 |
| 1,510,100 | ||
| Leisure Products 0.0% | ||
| Polaris Industries, Inc. (b) | 142 | 18,442 |
| Media 7.5% | ||
| Cineplex, Inc. | 2,947 | 107,208 |
| Comcast Corp. "A" | 2,000 | 114,480 |
| DISH Network Corp. "A"* | 5,800 | 343,766 |
| Liberty Global PLC "A"* (a) | 20,489 | 985,931 |
| Liberty Global PLC LiLAC "A"* (b) | 1,751 | 60,182 |
| Loral Space & Communications, Inc.* | 5,400 | 292,734 |
| New Media Investment Group, Inc. | 13,820 | 206,194 |
| Pearson PLC | 30,016 | 522,568 |
| Sirius XM Holdings, Inc.* | 128,900 | 491,754 |
| Societe Television Francaise 1 | 35,483 | 571,203 |
| Time Warner, Inc. | 5,200 | 369,720 |
| Tribune Media Co. "A" | 9,300 | 371,442 |
| Twenty-First Century Fox, Inc. "A" | 9,100 | 249,249 |
| UBM PLC | 32,117 | 243,135 |
| Vivendi SA | 26,060 | 645,282 |
| Walt Disney Co. (b) | 12,451 | 1,268,508 |
| Wolters Kluwer NV | 24,754 | 784,914 |
| 7,628,270 | ||
| Multiline Retail 0.2% | ||
| Dollar General Corp. | 600 | 44,694 |
| Europris ASA, 144A* | 22,955 | 112,384 |
| J.C. Penney Co., Inc.* | 2,000 | 18,220 |
| 175,298 | ||
| Specialty Retail 4.0% | ||
| AutoZone, Inc.* (a) | 2,029 | 1,452,744 |
| Gulliver International Co., Ltd. | 45,700 | 404,645 |
| Home Depot, Inc. (a) (b) | 14,271 | 1,662,000 |
| O'Reilly Automotive, Inc.* (b) | 2,487 | 597,054 |
| 4,116,443 | ||
| Textiles, Apparel & Luxury Goods 1.3% | ||
| NIKE, Inc. "B" (a) | 11,203 | 1,251,935 |
| PVH Corp. | 700 | 83,286 |
| 1,335,221 | ||
| Consumer Staples 8.1% | ||
| Beverages 1.9% | ||
| Anheuser-Busch InBev SA | 1,605 | 175,543 |
| Brown-Forman Corp. "B" (b) | 7,554 | 741,047 |
| Davide Campari-Milano SpA | 56,740 | 423,366 |
| Diageo PLC | 19,629 | 522,799 |
| Diageo PLC (ADR) | 1,205 | 128,176 |
| 1,990,931 | ||
| Food & Staples Retailing 1.7% | ||
| Costco Wholesale Corp. (a) (b) | 12,325 | 1,726,116 |
| Food Products 3.0% | ||
| Associated British Foods PLC | 10,632 | 521,848 |
| Blue Buffalo Pet Products, Inc.* | 1,100 | 28,105 |
| Chocoladefabriken Lindt & Sprungli AG (Registered) | 22 | 1,481,897 |
| Kerry Group PLC "A" (c) | 2,890 | 212,093 |
| Kerry Group PLC "A" (c) | 584 | 43,482 |
| Kraft Heinz Co. (b) | 3,456 | 251,113 |
| Origin Enterprises PLC* | 1 | 9 |
| The JM Smucker Co. (a) (b) | 4,640 | 546,221 |
| 3,084,768 | ||
| Household Products 1.1% | ||
| HRG Group, Inc.* | 47,200 | 607,936 |
| Procter & Gamble Co. (a) (b) | 6,824 | 482,252 |
| 1,090,188 | ||
| Personal Products 0.4% | ||
| Asaleo Care Ltd. | 326,574 | 419,494 |
| Energy 2.4% | ||
| Energy Equipment & Services 0.4% | ||
| Halliburton Co. (a) (b) | 6,921 | 272,341 |
| Nordic American Offshore Ltd.* | 15,250 | 105,225 |
| Transocean Partners LLC (Units) | 5,400 | 59,346 |
| 436,912 | ||
| Oil, Gas & Consumable Fuels 2.0% | ||
| Anadarko Petroleum Corp. | 4,200 | 300,636 |
| Atlas Energy Group LLC* | 20,827 | 68,937 |
| Atlas Resource Partners LP | 21,300 | 84,987 |
| Black Stone Minerals LP | 2,200 | 34,452 |
| Caltex Australia Ltd. | 5,947 | 135,316 |
| Encana Corp. (a) | 18,589 | 138,302 |
| Enviva Partners LP | 1,900 | 24,795 |
| Freehold Royalties Ltd. (b) | 14,000 | 116,206 |
| Gener8 Maritime, Inc.* | 400 | 5,200 |
| Gulf Coast Ultra Deep Royalty Trust* | 71,049 | 21,315 |
| Gulfport Energy Corp.* | 6,700 | 240,061 |
| Kinder Morgan, Inc. | 7,800 | 252,798 |
| Premier Oil PLC* | 65,206 | 105,958 |
| RSP Permian, Inc.* | 600 | 14,364 |
| Targa Resources Corp. | 5,500 | 363,330 |
| Targa Resources Partners LP | 4,587 | 138,481 |
| 2,045,138 | ||
| Financials 14.9% | ||
| Banks 4.3% | ||
| Banca Popolare dell'Emilia Romagna SC | 9,302 | 80,305 |
| Banca Popolare di Milano Scarl | 78,890 | 83,873 |
| Banco Popolare SC* | 4,746 | 81,814 |
| Bank of Ireland* | 1,457,521 | 569,701 |
| Barclays PLC | 42,600 | 171,207 |
| BOC Hong Kong (Holdings) Ltd. | 95,500 | 323,498 |
| Citigroup, Inc. | 10,200 | 545,496 |
| Credito Valtellinese SC* | 60,874 | 84,510 |
| Israel Discount Bank Ltd. "A"* | 90,887 | 168,416 |
| JPMorgan Chase & Co. | 5,800 | 371,780 |
| Kasikornbank PCL (Foreign Registered) | 29,400 | 148,666 |
| Permanent TSB Group Holdings PLC* | 49,191 | 267,719 |
| Swedbank AB "A" | 23,308 | 533,322 |
| Unione di Banche Italiane SCpA | 10,009 | 78,276 |
| Wells Fargo & Co. (a) | 17,411 | 928,529 |
| 4,437,112 | ||
| Capital Markets 2.1% | ||
| Credit Suisse Group AG (Registered) | 9,471 | 255,025 |
| E*TRADE Financial Corp.* | 12,200 | 320,738 |
| Henderson Group PLC | 64,041 | 253,260 |
| KKR & Co. LP | 10,800 | 206,172 |
| SEI Investments Co. | 5,447 | 275,509 |
| Tetragon Financial Group Ltd. (c) | 6,300 | 64,193 |
| Tetragon Financial Group Ltd. (c) | 35,500 | 355,000 |
| The Goldman Sachs Group, Inc. | 1,479 | 278,939 |
| THL Credit, Inc. | 7,211 | 89,849 |
| 2,098,685 | ||
| Consumer Finance 1.2% | ||
| Navient Corp. | 33,855 | 433,006 |
| Provident Financial PLC | 4,360 | 197,439 |
| Springleaf Holdings, Inc.* (a) | 12,700 | 568,452 |
| 1,198,897 | ||
| Diversified Financial Services 1.4% | ||
| Euronext NV, 144A | 859 | 39,314 |
| Moody's Corp. (a) (b) | 13,485 | 1,379,650 |
| 1,418,964 | ||
| Insurance 1.4% | ||
| American International Group, Inc. | 13,000 | 784,420 |
| Prudential PLC | 7,747 | 168,974 |
| Sampo Oyj "A" | 10,952 | 528,996 |
| 1,482,390 | ||
| Real Estate Investment Trusts 2.0% | ||
| Chimera Investment Corp. (REIT) | 48,740 | 682,847 |
| Gaming and Leisure Properties, Inc. (REIT) | 3,200 | 99,008 |
| Klepierre (REIT) | 11,844 | 521,445 |
| New Residential Investment Corp. (REIT) | 23,000 | 325,680 |
| New Senior Investment Group, Inc. (REIT) | 21,416 | 243,928 |
| PennyMac Mortgage Investment Trust (REIT) | 9,900 | 149,193 |
| 2,022,101 | ||
| Real Estate Management & Development 2.3% | ||
| Altisource Portfolio Solutions SA* | 4,700 | 126,477 |
| Altus Group Ltd. (b) | 6,733 | 107,781 |
| Daiwa House Industry Co., Ltd. | 21,900 | 538,973 |
| Hulic Co., Ltd. (b) | 27,900 | 256,728 |
| LEG Immobilien AG | 7,391 | 555,260 |
| Mitsubishi Estate Co., Ltd. | 9,000 | 193,581 |
| Pruksa Real Estate PCL (Foreign Registered) | 253,300 | 180,197 |
| Realogy Holdings Corp.* | 10,200 | 411,060 |
| 2,370,057 | ||
| Thrifts & Mortgage Finance 0.2% | ||
| PennyMac Financial Services, Inc. "A"* | 12,200 | 209,474 |
| Health Care 13.1% | ||
| Biotechnology 1.3% | ||
| Actelion Ltd. (Registered) | 4,768 | 651,493 |
| Incyte Corp.* (b) | 3,100 | 360,189 |
| Seattle Genetics, Inc.* | 951 | 38,297 |
| United Therapeutics Corp.* (a) (b) | 1,535 | 231,201 |
| 1,281,180 | ||
| Health Care Equipment & Supplies 3.4% | ||
| Becton, Dickinson & Co. (a) (b) | 12,177 | 1,717,200 |
| IDEXX Laboratories, Inc.* (a) (b) | 23,939 | 1,710,920 |
| TearLab Corp.* (b) | 16,226 | 44,135 |
| 3,472,255 | ||
| Health Care Providers & Services 0.9% | ||
| Fresenius SE & Co. KGaA | 3,729 | 263,836 |
| McKesson Corp. | 2,800 | 553,224 |
| Spire Healthcare Group PLC, 144A | 23,232 | 126,912 |
| 943,972 | ||
| Life Sciences Tools & Services 1.3% | ||
| Thermo Fisher Scientific, Inc. (a) (b) | 10,326 | 1,294,571 |
| Pharmaceuticals 6.2% | ||
| Allergan PLC* (a) (b) | 10,010 | 3,040,438 |
| AstraZeneca PLC | 8,105 | 512,688 |
| Auris Medical Holding AG* | 200 | 951 |
| Bayer AG (Registered) | 2,697 | 366,376 |
| Bristol-Myers Squibb Co. (a) | 5,951 | 353,906 |
| Carbylan Therapeutics, Inc.* | 300 | 1,629 |
| Ipsen SA | 9,075 | 609,470 |
| Paratek Pharmaceuticals, Inc. | 500 | 12,990 |
| Pfizer, Inc. | 10,700 | 344,754 |
| Shire PLC | 3,455 | 267,000 |
| Valeant Pharmaceuticals International, Inc.* | 1,603 | 369,652 |
| Zoetis, Inc. (a) | 11,108 | 498,416 |
| Zogenix, Inc.* | 500 | 9,610 |
| 6,387,880 | ||
| Industrials 15.0% | ||
| Aerospace & Defense 3.3% | ||
| Huntington Ingalls Industries, Inc. | 4,998 | 562,675 |
| TransDigm Group, Inc.* (b) | 5,633 | 1,294,632 |
| Triumph Group, Inc. (a) (b) | 30,472 | 1,505,012 |
| 3,362,319 | ||
| Air Freight & Logistics 1.0% | ||
| FedEx Corp. (a) | 7,074 | 1,065,415 |
| Airlines 1.4% | ||
| American Airlines Group, Inc. (a) | 7,380 | 287,673 |
| Delta Air Lines, Inc. | 3,800 | 166,364 |
| International Consolidated Airlines Group SA* | 31,180 | 257,664 |
| United Continental Holdings, Inc.* | 12,100 | 689,337 |
| 1,401,038 | ||
| Building Products 0.5% | ||
| Fortune Brands Home & Security, Inc. (b) | 10,263 | 491,085 |
| Commercial Services & Supplies 0.7% | ||
| De La Rue PLC | 25,536 | 191,909 |
| Elior, 144A | 11,300 | 229,640 |
| KAR Auction Services, Inc. | 1,900 | 70,376 |
| Spotless Group Holdings Ltd. | 174,764 | 247,498 |
| 739,423 | ||
| Construction & Engineering 0.1% | ||
| Louis XIII Holdings Ltd.* | 301,000 | 93,212 |
| Electrical Equipment 0.6% | ||
| Alstom SA* | 13,205 | 410,054 |
| Sensata Technologies Holding NV* (a) (b) | 3,045 | 144,333 |
| Sunrun, Inc.* | 1,300 | 15,444 |
| 569,831 | ||
| Industrial Conglomerates 0.2% | ||
| Alliance Global Group, Inc. | 603,188 | 255,400 |
| Machinery 2.6% | ||
| Crane Co. (a) (b) | 13,317 | 699,675 |
| FANUC Corp. | 1,500 | 243,484 |
| Kurita Water Industries Ltd. | 24,900 | 518,223 |
| Milacron Holdings Corp.* | 1,600 | 31,824 |
| Oshkosh Corp. | 18,737 | 787,891 |
| SKF AB "B" | 17,326 | 330,883 |
| Vallourec SA | 5,080 | 65,096 |
| 2,677,076 | ||
| Road & Rail 2.7% | ||
| CSX Corp. (a) | 28,116 | 769,816 |
| Norfolk Southern Corp. (a) (b) | 9,997 | 778,866 |
| Union Pacific Corp. (a) (b) | 14,593 | 1,251,204 |
| 2,799,886 | ||
| Trading Companies & Distributors 1.8% | ||
| AerCap Holdings NV* | 16,900 | 710,476 |
| Neff Corp. "A"* | 200 | 1,318 |
| WESCO International, Inc.* (a) (b) | 19,327 | 1,081,732 |
| 1,793,526 | ||
| Transportation Infrastructure 0.1% | ||
| BBA Aviation PLC | 29,192 | 130,455 |
| Information Technology 8.3% | ||
| Communications Equipment 0.6% | ||
| Motorola Solutions, Inc. | 10,400 | 674,128 |
| Electronic Equipment, Instruments & Components 1.8% | ||
| Anixter International, Inc.* (a) | 11,722 | 746,222 |
| Ingram Micro, Inc. "A" (a) | 40,530 | 1,096,742 |
| 1,842,964 | ||
| Internet Software & Services 1.6% | ||
| Facebook, Inc. "A"* | 4,100 | 366,663 |
| Google, Inc. "A"* | 1,490 | 965,252 |
| Google, Inc. "C"* | 438 | 270,793 |
| 1,602,708 | ||
| IT Services 2.9% | ||
| Amadeus IT Holding SA "A" | 2,000 | 83,814 |
| Amdocs Ltd. (a) | 17,684 | 1,011,702 |
| Atos | 6,862 | 523,459 |
| Itochu Techno-Solutions Corp. | 22,200 | 489,053 |
| MasterCard, Inc. "A" | 9,100 | 840,567 |
| 2,948,595 | ||
| Semiconductors & Semiconductor Equipment 0.4% | ||
| SunEdison, Inc.* | 38,100 | 396,240 |
| Software 1.0% | ||
| Intuit, Inc. (a) | 10,977 | 941,278 |
| Monitise PLC* | 1,333,600 | 117,323 |
| 1,058,601 | ||
| Materials 13.4% | ||
| Chemicals 8.1% | ||
| Arkema | 5,499 | 388,950 |
| Ashland, Inc. | 4,500 | 472,365 |
| Dow Chemical Co. | 10,000 | 437,600 |
| Eastman Chemical Co. | 3,400 | 246,364 |
| FMC Corp. (a) (b) | 43,216 | 1,828,469 |
| Kuraray Co., Ltd. | 49,900 | 589,862 |
| LyondellBasell Industries NV "A" | 2,000 | 170,760 |
| Orion Engineered Carbons SA | 2,400 | 39,360 |
| The Sherwin-Williams Co. (a) (b) | 6,337 | 1,621,068 |
| W.R. Grace & Co.* (a) | 25,469 | 2,519,903 |
| 8,314,701 | ||
| Construction Materials 2.8% | ||
| CRH PLC | 27,188 | 814,286 |
| Martin Marietta Materials, Inc. (b) | 7,780 | 1,305,484 |
| Summit Materials, Inc. "A"* | 28,755 | 674,592 |
| 2,794,362 | ||
| Containers & Packaging 2.5% | ||
| Nampak Ltd. | 109,175 | 254,245 |
| Owens-Illinois, Inc.* (a) (b) | 103,560 | 2,159,226 |
| Pact Group Holdings Ltd. | 37,704 | 118,329 |
| 2,531,800 | ||
| Utilities 0.4% | ||
| Independent Power & Renewable Eletricity Producers 0.4% | ||
| Abengoa Yield PLC | 1,800 | 40,968 |
| Infinis Energy PLC | 86,749 | 171,055 |
| TerraForm Global, Inc. "A"* | 18,200 | 177,268 |
| 389,291 | ||
| Total Common Stocks (Cost $104,385,430) | 102,894,766 | |
| Preferred Stocks 0.1% | ||
| Financials | ||
| Federal Home Loan Mortgage Corp. "X"* | 1,000 | 4,100 |
| Federal Home Loan Mortgage Corp. "V"* | 2,500 | 9,750 |
| Federal National Mortgage Association "S"* | 3,500 | 25,900 |
| Federal National Mortgage Association "N"* | 1,700 | 12,920 |
| Federal National Mortgage Association "M"* | 4,500 | 22,185 |
| Total Preferred Stocks (Cost $62,906) | 74,855 | |
| Principal Amount ($) | Value ($) | ||
| Corporate Bonds 0.2% | |||
| Telecommunication Services | |||
| HC2 Holdings, Inc., 144A, 11.0%, 12/1/2019 | 70,000 | 68,250 | |
| Intelsat Jackson Holdings SA, 6.625%, 12/15/2022 | 60,000 | 52,500 | |
| Intelsat Luxembourg SA: | |||
| 7.75%, 6/1/2021 | 80,000 | 59,940 | |
| 8.125%, 6/1/2023 | 30,000 | 22,050 | |
| Total Corporate Bonds (Cost $225,600) | 202,740 | ||
Shares | Value ($) | ||
| Warrants 0.0% | |||
| Financials | |||
| Alpha Bank AE, Expiration Date 12/10/2017* (Cost $31,633) | 60,500 | 1,833 | |
| Securities Lending Collateral 22.4% | |||
| Daily Assets Fund Institutional, 0.16% (d) (e) (Cost $22,951,057) | 22,951,057 | 22,951,057 | |
| Cash Equivalents 7.1% | |||
| Central Cash Management Fund, 0.11% (d) (Cost $7,256,333) | 7,256,333 | 7,256,333 | |
| % of Net Assets | Value ($) | |
| Total Long Positions (Cost $134,912,959)† | 130.5 | 133,381,584 |
| Other Assets and Liabilities, Net | 7.2 | 7,407,771 |
| Securities Sold Short | (37.7) | (38,555,991) |
| Net Assets | 100.0 | 102,233,364 |
† The cost for federal income tax purposes was $137,076,064. At August 31, 2015, net unrealized depreciation for all securities based on tax cost was $3,694,480. This consisted of aggregate gross unrealized appreciation for all securities in which there was an excess of value over tax cost of $7,359,075 and aggregate gross unrealized depreciation for all securities in which there was an excess of tax cost over value of $11,053,555.
Shares | Value ($) | |
| Common Stocks Sold Short 6.7% | ||
| Consumer Discretionary 1.1% | ||
| Auto Components 0.2% | ||
| Continental AG | 1,153 | 245,180 |
| Household Durables 0.3% | ||
| Barratt Developments PLC | 16,185 | 158,826 |
| Berkeley Group Holdings PLC | 2,598 | 134,429 |
| 293,255 | ||
| Media 0.3% | ||
| Mediaset Espana Comunicacion SA | 24,547 | 293,487 |
| Specialty Retail 0.1% | ||
| Fast Retailing Co., Ltd. | 300 | 122,139 |
| Textiles, Apparel & Luxury Goods 0.2% | ||
| lululemon athletica, Inc. | 2,990 | 191,390 |
| Consumer Staples 1.3% | ||
| Food & Staples Retailing 0.3% | ||
| ICA Gruppen AB | 7,526 | 280,437 |
| Food Products 0.7% | ||
| Hain Celestial Group, Inc. | 5,859 | 356,579 |
| Nestle SA (Registered) | 3,555 | 261,956 |
| Yakult Honsha Co., Ltd. | 2,200 | 122,735 |
| 741,270 | ||
| Household Products 0.3% | ||
| Unicharm Corp. | 11,800 | 239,173 |
| Financials 2.1% | ||
| Banks 0.6% | ||
| Banco Bilbao Vizcaya Argentaria SA | 41,523 | 385,269 |
| DNB ASA | 18,340 | 262,597 |
| 647,866 | ||
| Capital Markets 0.6% | ||
| Eaton Vance Corp. | 3,700 | 128,279 |
| GAM Holding AG | 14,160 | 260,527 |
| Julius Baer Group Ltd. | 3,643 | 177,335 |
| 566,141 | ||
| Diversified Financial Services 0.7% | ||
| Berkshire Hathaway, Inc. "B" | 2,319 | 310,697 |
| Bolsas y Mercados Espanoles SHMSF SA | 9,721 | 379,889 |
| 690,586 | ||
| Insurance 0.2% | ||
| Hannover Rueck SE | 2,523 | 255,609 |
| Health Care 0.6% | ||
| Biotechnology 0.1% | ||
| Exact Sciences Corp. | 5,351 | 118,311 |
| Health Care Equipment & Supplies 0.3% | ||
| Getinge AB "B" | 7,764 | 172,754 |
| Varian Medical Systems, Inc. | 1,551 | 126,019 |
| 298,773 | ||
| Pharmaceuticals 0.2% | ||
| Merck & Co., Inc. | 3,490 | 187,936 |
| Industrials 1.0% | ||
| Airlines 0.1% | ||
| Deutsche Lufthansa AG (Registered) | 9,440 | 115,178 |
| Machinery 0.7% | ||
| AGCO Corp. | 6,396 | 313,660 |
| Metso Oyj | 10,145 | 249,991 |
| NTN Corp. | 19,000 | 99,232 |
| 662,883 | ||
| Trading Companies & Distributors 0.2% | ||
| Ashtead Group PLC | 16,596 | 240,786 |
| Information Technology 0.6% | ||
| Communications Equipment 0.2% | ||
| NetScout Systems, Inc. | 4,044 | 147,808 |
| Electronic Equipment, Instruments & Components 0.3% | ||
| Hexagon AB "B" | 8,256 | 266,309 |
| Yaskawa Electric Corp. | 6,700 | 76,650 |
| 342,959 | ||
| Internet Software & Services 0.1% | ||
| Zoopla Property Group PLC, 144A | 35,790 | 144,604 |
| Total Common Stocks Sold Short (Proceeds $6,934,352) | 6,825,771 | |
| Exchange-Traded Funds Sold Short 31.0% | ||
| Energy Select Sector SPDR Fund | 30,504 | 2,026,381 |
| iShares MSCI Japan Fund | 85,824 | 1,040,187 |
| iShares Nasdaq Biotechnology Fund | 3,436 | 1,175,078 |
| SPDR S&P 500 ETF Trust | 120,638 | 23,846,513 |
| SPDR S&P MidCap 400 Trust | 10,078 | 2,600,124 |
| Vanguard FTSE Europe Fund | 20,220 | 1,041,937 |
| Total Exchange-Traded Funds Sold Short (Proceeds $33,458,672) | 31,730,220 | |
| Total Positions Sold Short (Proceeds $40,393,024) | 38,555,991 | |
* Non-income producing security.
(a) All or a portion of these securities are pledged as collateral for short sales.
(b) All or a portion of these securities were on loan. In addition, "Other Assets and Liabilities, Net" may include pending sales that are also on loan. The value of securities loaned at August 31, 2015 amounted to $22,435,362, which is 21.9% of net assets.
(c) Securities with the same description are the same corporate entity but trade on different stock exchanges.
(d) Affiliated fund managed by Deutsche Investment Management Americas Inc. The rate shown is the annualized seven-day yield at period end.
(e) Represents collateral held in connection with securities lending. Income earned by the Fund is net of borrower rebates.
144A: Security exempt from registration under Rule 144A of the Securities Act of 1933. These securities may be resold in transactions exempt from registration, normally to qualified institutional buyers.
ADR: American Depositary Receipt
FTSE: Financial Times and the London Stock Exchange
MSCI: Morgan Stanley Capital International
REIT: Real Estate Investment Trust
S&P: Standard & Poor's
SPDR: Standard & Poor's Depositary Receipt
At August 31, 2015, open futures contracts sold were as follows:
| Futures | Currency | Expiration Date | Contracts | Notional Value ($) | Unrealized Appreciation ($) |
| 90 Day Eurodollar | USD | 12/19/2016 | 2 | 494,050 | 195 |
As of August 31, 2015, the Fund had the following open forward foreign currency exchange contracts:
| Contracts to Deliver | In Exchange For | Settlement Date | Unrealized Appreciation ($) | Counterparty | ||||
| USD | 379,832 | HKD | 2,944,400 | 11/18/2015 | 17 | State Street Bank and Trust | ||
| EUR | 590,000 | USD | 663,492 | 11/20/2015 | 585 | State Street Bank and Trust | ||
| EUR | 290,000 | USD | 326,975 | 11/19/2015 | 1,145 | State Street Bank and Trust | ||
| EUR | 1,250,000 | USD | 1,407,831 | 9/16/2015 | 4,861 | State Street Bank and Trust | ||
| USD | 65,073 | EUR | 60,000 | 9/21/2015 | 2,275 | State Street Bank and Trust | ||
| USD | 49,628 | EUR | 45,393 | 9/16/2015 | 1,319 | State Street Bank and Trust | ||
| USD | 314,360 | CHF | 305,600 | 11/18/2015 | 2,628 | State Street Bank and Trust | ||
| USD | 690,779 | JPY | 84,583,800 | 11/18/2015 | 7,712 | State Street Bank and Trust | ||
| USD | 285,857 | PHP | 13,461,000 | 11/17/2015 | 998 | State Street Bank and Trust | ||
| USD | 279,438 | EUR | 250,000 | 11/20/2015 | 1,454 | State Street Bank and Trust | ||
| GBP | 260,000 | USD | 406,314 | 9/21/2015 | 7,388 | State Street Bank and Trust | ||
| USD | 18,757 | THB | 678,300 | 11/18/2015 | 107 | State Street Bank and Trust | ||
| GBP | 84,426 | USD | 131,611 | 9/16/2015 | 2,069 | State Street Bank and Trust | ||
| AUD | 1,617,613 | USD | 1,185,743 | 11/18/2015 | 39,073 | State Street Bank and Trust | ||
| GBP | 2,671,231 | USD | 4,167,975 | 11/18/2015 | 70,691 | State Street Bank and Trust | ||
| ILS | 1,738,154 | USD | 456,707 | 11/18/2015 | 13,079 | State Street Bank and Trust | ||
| ZAR | 14,131,678 | USD | 1,090,417 | 11/18/2015 | 39,071 | State Street Bank and Trust | ||
| NOK | 1,019,100 | USD | 124,804 | 11/18/2015 | 1,769 | State Street Bank and Trust | ||
| CAD | 847,629 | USD | 651,804 | 11/18/2015 | 7,639 | State Street Bank and Trust | ||
| PHP | 25,885,600 | USD | 552,993 | 11/17/2015 | 1,369 | State Street Bank and Trust | ||
| THB | 11,863,100 | USD | 331,928 | 11/18/2015 | 2,014 | State Street Bank and Trust | ||
| SEK | 2,299,000 | USD | 272,524 | 11/18/2015 | 447 | State Street Bank and Trust | ||
| GBP | 80,000 | USD | 125,169 | 1/26/2016 | 2,493 | State Street Bank and Trust | ||
| USD | 660,202 | SEK | 5,640,193 | 11/18/2015 | 7,292 | State Street Bank and Trust | ||
| SGD | 369,900 | USD | 262,740 | 11/18/2015 | 1,462 | State Street Bank and Trust | ||
| CHF | 1,476,200 | USD | 1,577,233 | 9/16/2015 | 49,416 | State Street Bank and Trust | ||
| USD | 271,940 | NOK | 2,260,000 | 11/18/2015 | 908 | State Street Bank and Trust | ||
| Total unrealized appreciation | 269,281 | |||||||
| Contracts to Deliver | In Exchange For | Settlement Date | Unrealized Depreciation ($) | Counterparty | ||||
| USD | 201,216 | GBP | 130,000 | 9/21/2015 | (1,753) | State Street Bank and Trust | ||
| USD | 275,113 | ILS | 1,075,400 | 11/18/2015 | (640) | State Street Bank and Trust | ||
| USD | 722,977 | GBP | 461,800 | 11/18/2015 | (14,643) | State Street Bank and Trust | ||
| USD | 125,388 | EUR | 110,000 | 11/19/2015 | (1,797) | State Street Bank and Trust | ||
| USD | 277,527 | CAD | 365,000 | 11/18/2015 | (140) | State Street Bank and Trust | ||
| USD | 262,828 | SGD | 369,900 | 11/18/2015 | (1,550) | State Street Bank and Trust | ||
| EUR | 572,082 | USD | 638,710 | 9/16/2015 | (3,382) | State Street Bank and Trust | ||
| USD | 1,413,883 | EUR | 1,250,000 | 9/16/2015 | (10,912) | State Street Bank and Trust | ||
| HKD | 5,475,864 | USD | 705,898 | 11/18/2015 | (528) | State Street Bank and Trust | ||
| EUR | 6,006,833 | USD | 6,714,378 | 11/18/2015 | (34,482) | State Street Bank and Trust | ||
| JPY | 90,492,101 | USD | 729,709 | 11/18/2015 | (17,573) | State Street Bank and Trust | ||
| EUR | 190,000 | USD | 210,074 | 1/27/2016 | (3,689) | State Street Bank and Trust | ||
| USD | 129,116 | AUD | 176,600 | 11/18/2015 | (3,931) | State Street Bank and Trust | ||
| USD | 1,816,447 | EUR | 1,593,400 | 11/18/2015 | (26,214) | State Street Bank and Trust | ||
| CHF | 361,300 | USD | 371,786 | 11/18/2015 | (2,977) | State Street Bank and Trust | ||
| USD | 31,093 | GBP | 19,967 | 9/16/2015 | (457) | State Street Bank and Trust | ||
| USD | 808,279 | ZAR | 10,691,700 | 11/18/2015 | (12,855) | State Street Bank and Trust | ||
| EUR | 60,000 | USD | 65,094 | 9/21/2015 | (2,254) | State Street Bank and Trust | ||
| Total unrealized depreciation | (139,777) | |||||||
| Currency Abbreviations |
AUD Australian Dollar CAD Canadian Dollar CHF Swiss Franc EUR Euro GBP Great British Pound HKD Hong Kong Dollar ILS Israeli Shekel JPY Japanese Yen NOK Norwegian Krone PHP Philippine Peso SEK Swedish Krona SGD Singapore Dollar THB Thai Baht USD United States Dollar ZAR South African Rand |
For information on the Fund's policy and additional disclosures regarding futures contracts and forward foreign currency exchange contracts, please refer to the Derivatives section of Note B in the accompanying Notes to Financial Statements.
Fair Value Measurements
Various inputs are used in determining the value of the Fund's investments. These inputs are summarized in three broad levels. Level 1 includes quoted prices in active markets for identical securities. Level 2 includes other significant observable inputs (including quoted prices for similar securities, interest rates, prepayment speeds and credit risk). Level 3 includes significant unobservable inputs (including the Fund's own assumptions in determining the fair value of investments). The level assigned to the securities valuations may not be an indication of the risk or liquidity associated with investing in those securities.
The following is a summary of the inputs used as of August 31, 2015 in valuing the Fund's investments. For information on the Fund's policy regarding the valuation of investments, please refer to the Security Valuation section of Note A in the accompanying Notes to Financial Statements.
| Assets | Level 1 | Level 2 | Level 3 | Total |
| Common Stocks (f) | $ 77,877,425 | $ 25,017,341 | $ — | $ 102,894,766 |
| Preferred Stocks | 74,855 | — | — | 74,855 |
| Corporate Bonds | — | 202,740 | — | 202,740 |
| Warrants | — | 1,833 | — | 1,833 |
| Short-Term Investments (f) | 30,207,390 | — | — | 30,207,390 |
| Derivatives (g) | ||||
| Futures Contracts | 195 | — | — | 195 |
| Forward Foreign Currency Exchange Contracts | — | 269,281 | — | 269,281 |
| Total | $ 108,159,865 | $ 25,491,195 | $ — | $ 133,651,060 |
| Liabilities | Level 1 | Level 2 | Level 3 | Total |
| Common Stocks Sold Short, at Value (f) | $ (1,880,679) | $ (4,945,092) | $ — | $ (6,825,771) |
| Exchange-Traded Funds Sold Short | (31,730,220) | — | — | (31,730,220) |
| Derivatives (g) | ||||
| Forward Foreign Currency Exchange Contracts | — | (139,777) | — | (139,777) |
| Total | $ (33,610,899) | $ (5,084,869) | $ — | $ (38,695,768) |
There have been no transfers between fair value measurement levels during the year ended August 31, 2015.
(f) See Investment Portfolio for additional detailed categorizations.
(g) Derivatives include unrealized appreciation (depreciation) on futures contracts and forward foreign currency exchange contracts.
The accompanying notes are an integral part of the financial statements.
Statement of Assets and Liabilities
| as of August 31, 2015 | |
| Assets | |
Investments: Investments in non-affiliated securities, at value (cost $104,705,569) — including $22,435,362 of securities loaned | $ 103,174,194 |
| Investment in Daily Assets Fund Institutional (cost $22,951,057)* | 22,951,057 |
| Investment in Central Cash Management Fund (cost $7,256,333) | 7,256,333 |
| Total investments in securities, at value (cost $134,912,959) | 133,381,584 |
| Cash | 1,358,395 |
| Deposit with broker for futures contracts | 208,567 |
| Deposit with broker for securities sold short | 30,096,449 |
| Receivable for investments sold | 5,765,978 |
| Receivable for Fund shares sold | 134,365 |
| Dividends receivable | 121,552 |
| Interest receivable | 7,918 |
| Receivable for variation margin on futures contracts | 762 |
| Unrealized appreciation on forward foreign currency exchange contracts | 269,281 |
| Foreign taxes recoverable | 29,629 |
| Other assets | 29,328 |
| Total assets | 171,403,808 |
| Liabilities | |
| Foreign currency overdraft, at value (cost $63,877) | 63,140 |
| Payable upon return of securities loaned | 22,951,057 |
| Payable for investments purchased | 6,188,037 |
| Payable for securities sold short, at value (proceeds of $40,393,024) | 38,555,991 |
| Payable for Fund shares redeemed | 883,259 |
| Unrealized depreciation on forward foreign currency exchange contracts | 139,777 |
| Dividends payable for securities sold short | 7,251 |
| Accrued management fee | 160,290 |
| Accrued Trustees' fee | 2,347 |
| Other accrued expenses and payables | 219,295 |
| Total liabilities | 69,170,444 |
| Net assets, at value | $ 102,233,364 |
* Represents collateral on securities loaned.
The accompanying notes are an integral part of the financial statements.
| Statement of Assets and Liabilities as of August 31, 2015 (continued) | |
| Net Assets Consist of | |
| Undistributed net investment income | 901,969 |
Net unrealized appreciation (depreciation) on: Investments | (1,531,375) |
| Securities sold short | 1,837,033 |
| Futures | 195 |
| Foreign currency | 126,266 |
| Accumulated net realized gain (loss) | (12,862,798) |
| Paid-in capital | 113,762,074 |
| Net assets, at value | $ 102,233,364 |
| Net Asset Value | |
Class A Net Asset Value and redemption price per share ($13,854,173 ÷ 1,478,156 outstanding shares of beneficial interest, no par value, unlimited number of shares authorized) | $ 9.37 |
| Maximum offering price per share (100 ÷ 94.25 of $9.37) | $ 9.94 |
Class C Net Asset Value, offering and redemption price (subject to contingent deferred sales charge) per share ($6,186,821 ÷ 666,932 outstanding shares of beneficial interest, no par value, unlimited number of shares authorized) | $ 9.28 |
Class S Net Asset Value, offering and redemption price per share ($17,372,275 ÷ 1,852,244 outstanding shares of beneficial interest, no par value, unlimited number of shares authorized) | $ 9.38 |
Institutional Class Net Asset Value, offering and redemption price per share ($64,820,095 ÷ 6,899,225 outstanding shares of beneficial interest, no par value, unlimited number of shares authorized) | $ 9.40 |
The accompanying notes are an integral part of the financial statements.
Statement of Operations
| for the year ended August 31, 2015 | |
| Investment Income | |
Income: Dividends (net of foreign taxes withheld of $81,716) | $ 2,598,357 |
| Income distributions — Central Cash Management Fund | 7,155 |
| Securities lending income, including income from Daily Assets Fund Institutional, net of borrower rebates | 13,962 |
| Total income | 2,619,474 |
Expenses: Management fee | 2,534,869 |
| Administration fee | 144,850 |
| Services to shareholders | 80,990 |
| Distribution and service fees | 96,609 |
| Custodian fee | 70,782 |
| Professional fees | 120,400 |
| Reports to shareholders | 28,006 |
| Registration fees | 36,684 |
| Trustees' fees and expenses | 9,275 |
| Dividend expense on securities sold short | 752,259 |
| Interest expense on securities sold short | 326,642 |
| Other | 53,311 |
| Total expenses before expense reductions | 4,254,677 |
| Expense reductions | (14,463) |
| Total expenses after expense reductions | 4,240,214 |
| Net investment income (loss) | (1,620,740) |
| Realized and Unrealized Gain (Loss) | |
Net realized gain (loss) from: Investments | (8,612,149) |
| Securities sold short | (2,861,150) |
| Futures | 18,092 |
| Written options | 23,149 |
| Foreign currency | 3,784,362 |
| (7,647,696) | |
Change in net unrealized appreciation (depreciation) on: Investments | (6,004,436) |
| Securities sold short | 3,768,012 |
| Futures | (40,195) |
| Foreign currency | (307,251) |
| (2,583,870) | |
| Net gain (loss) | (10,231,566) |
| Net increase (decrease) in net assets resulting from operations | $ (11,852,306) |
The accompanying notes are an integral part of the financial statements.
Statement of Changes in Net Assets
| Increase (Decrease) in Net Assets | Year Ended August 31, 2015 | Period Ended August 31, 2014* |
Operations: Net investment income (loss) | $ (1,620,740) | $ (1,018,476) |
| Net realized gain (loss) | (7,647,696) | (448,010) |
| Change in net unrealized appreciation (depreciation) | (2,583,870) | 3,015,989 |
| Net increase (decrease) in net assets resulting from operations | (11,852,306) | 1,549,503 |
Distributions to shareholders from: Net investment income: Class A | (63,700) | — |
| Class C | (20,723) | — |
| Class S | (90,055) | — |
| Institutional Class | (575,753) | — |
Net realized gains: Class A | (40,816) | — |
| Class C | (13,279) | — |
| Class S | (57,703) | — |
| Institutional Class | (368,914) | — |
| Total distributions | (1,230,943) | — |
Fund share transactions: Proceeds from shares sold | 45,911,583 | 52,499,529 |
| Reinvestment of distributions | 1,224,962 | — |
| Cost of shares redeemed | (141,534,969) | (44,337,995) |
| Net increase (decrease) in net assets from Fund share transactions | (94,398,424) | 8,161,534 |
| Increase (decrease) in net assets | (107,481,673) | 9,711,037 |
| Net assets at beginning of period | 209,715,037 | 200,004,000 |
| Net assets at end of period (including undistributed net investment income and accumulated net investment loss of $901,969 and $454,342, respectively) | $ 102,233,364 | $ 209,715,037 |
* For the period from May 15, 2014 (commencement of operations) to August 31, 2014.
The accompanying notes are an integral part of the financial statements.
Financial Highlights
| Class A | Year Ended 8/31/15 | Period Ended 8/31/14a |
| Selected Per Share Data | ||
| Net asset value, beginning of period | $ 10.08 | $ 10.00 |
Income (loss) from investment operations: Net investment income (loss)b | (.13) | (.06) |
| Net realized and unrealized gain (loss) | (.52) | .14 |
| Total from investment operations | (.65) | .08 |
Less distributions from: Net investment income | (.04) | — |
| Net realized gains on investment | (.02) | — |
| Total distributions | (.06) | — |
| Net asset value, end of period | $ 9.37 | $ 10.08 |
| Total Return (%)c | (6.44)d | .80** |
| Ratios to Average Net Assets and Supplemental Data | ||
| Net assets, end of period ($ millions) | 14 | 16 |
| Ratio of expenses before expense reductions (including interest expense and dividend expense for securities sold short) (%) | 3.19 | 3.25* |
| Ratio of expenses after expense reductions (including interest expense and dividend expense for securities sold short) (%) | 3.14 | 3.25* |
| Ratio of expenses after expense reductions (excluding interest expense and dividend expense for securities sold short) (%) | 2.40 | 2.40* |
| Ratio of net investment income (loss) (%) | (1.35) | (1.95)* |
| Portfolio turnover rate (%) | 316 | 119** |
a For the period from May 15, 2014 (commencement of operations) to August 31, 2014. b Based on average shares outstanding during the period. c Total return does not reflect the effect of any sales charges. d Total return would have been lower had certain expenses not been reduced. * Annualized ** Not annualized | ||
| Class C | Year Ended 8/31/15 | Period Ended 8/31/14a |
| Selected Per Share Data | ||
| Net asset value, beginning of period | $ 10.05 | $ 10.00 |
Income (loss) from investment operations: Net investment income (loss)b | (.20) | (.08) |
| Net realized and unrealized gain (loss) | (.51) | .13 |
| Total from investment operations | (.71) | .05 |
Less distributions from: Net investment income | (.04) | — |
| Net realized gains on investment | (.02) | — |
| Total distributions | (.06) | — |
| Net asset value, end of period | $ 9.28 | $ 10.05 |
| Total Return (%)c,d | (7.06) | .50** |
| Ratios to Average Net Assets and Supplemental Data | ||
| Net assets, end of period ($ millions) | 6 | 4 |
| Ratio of expenses before expense reductions (including interest expense and dividend expense for securities sold short) (%) | 3.93 | 4.01* |
| Ratio of expenses after expense reductions (including interest expense and dividend expense for securities sold short) (%) | 3.89 | 4.00* |
| Ratio of expenses after expense reductions (excluding interest expense and dividend expense for securities sold short) (%) | 3.15 | 3.15* |
| Ratio of net investment income (loss) (%) | (2.10) | (2.74)* |
| Portfolio turnover rate (%) | 316 | 119** |
a For the period from May 15, 2014 (commencement of operations) to August 31, 2014. b Based on average shares outstanding during the period. c Total return does not reflect the effect of any sales charges. d Total return would have been lower had certain expenses not been reduced. * Annualized ** Not annualized | ||
| Class S | Year Ended 8/31/15 | Period Ended 8/31/14a |
| Selected Per Share Data | ||
| Net asset value, beginning of period | $ 10.07 | $ 10.00 |
Income (loss) from investment operations: Net investment income (loss)b | (.12) | (.05) |
| Net realized and unrealized gain (loss) | (.51) | .12 |
| Total from investment operations | (.63) | .07 |
Less distributions from: Net investment income | (.04) | — |
| Net realized gains on investment | (.02) | — |
| Total distributions | (.06) | — |
| Net asset value, end of period | $ 9.38 | $ 10.07 |
| Total Return (%)c | (6.24) | .70** |
| Ratios to Average Net Assets and Supplemental Data | ||
| Net assets, end of period ($ millions) | 17 | 24 |
| Ratio of expenses before expense reductions (including interest expense and dividend expense for securities sold short) (%) | 3.01 | 3.15* |
| Ratio of expenses after expense reductions (including interest expense and dividend expense for securities sold short) (%) | 2.99 | 3.10* |
| Ratio of expenses after expense reductions (excluding interest expense and dividend expense for securities sold short) (%) | 2.25 | 2.25* |
| Ratio of net investment income (loss) (%) | (1.22) | (1.69)* |
| Portfolio turnover rate (%) | 316 | 119** |
a For the period from May 15, 2014 (commencement of operations) to August 31, 2014. b Based on average shares outstanding during the period. c Total return would have been lower had certain expenses not been reduced. * Annualized ** Not annualized | ||
| Institutional Class | Year Ended 8/31/15 | Period Ended 8/31/14a |
| Selected Per Share Data | ||
| Net asset value, beginning of period | $ 10.08 | $ 10.00 |
Income (loss) from investment operations: Net investment income (loss)b | (.10) | (.05) |
| Net realized and unrealized gain (loss) | (.52) | .13 |
| Total from investment operations | (.62) | .08 |
Less distributions from: Net investment income | (.04) | — |
| Net realized gains on investment | (.02) | — |
| Total distributions | (.06) | — |
| Net asset value, end of period | $ 9.40 | $ 10.08 |
| Total Return (%) | (6.14) | .80** |
| Ratios to Average Net Assets and Supplemental Data | ||
| Net assets, end of period ($ millions) | 65 | 166 |
| Ratio of expenses (including interest expense and dividend expense for securities sold short) (%) | 2.82 | 2.96* |
| Ratio of expenses (excluding interest expense and dividend expense for securities sold short) (%) | 2.08 | 2.11* |
| Ratio of net investment income (loss) (%) | (1.01) | (1.60)* |
| Portfolio turnover rate (%) | 316 | 119** |
a For the period from May 15, 2014 (commencement of operations) to August 31, 2014. b Based on average shares outstanding during the period. * Annualized ** Not annualized | ||
Notes to Financial Statements
A. Organization and Significant Accounting Policies
Deutsche Strategic Equity Long/Short Fund (the "Fund") is a diversified series of Deutsche Market Trust (the "Trust"), which is registered under the Investment Company Act of 1940, as amended (the "1940 Act"), as an open-end management investment company organized as a Massachusetts business trust.
The Fund offers multiple classes of shares which provide investors with different purchase options. Class A shares are subject to an initial sales charge. Class C shares are not subject to an initial sales charge but are subject to higher ongoing expenses than Class A shares and a contingent deferred sales charge payable upon certain redemptions within one year of purchase. Class S shares are not subject to initial or contingent deferred sales charges and are only available to a limited group of investors. Institutional Class shares are not subject to initial or contingent deferred sales charges and are generally available only to qualified institutions.
Investment income, realized and unrealized gains and losses, and certain fund-level expenses and expense reductions, if any, are borne pro rata on the basis of relative net assets by the holders of all classes of shares, except that each class bears certain expenses unique to that class such as services to shareholders, distribution and service fees and certain other class-specific expenses. Differences in class-level expenses may result in payment of different per share dividends by class. All shares of the Fund have equal rights with respect to voting subject to class-specific arrangements.
The Fund's financial statements are prepared in accordance with accounting principles generally accepted in the United States of America which require the use of management estimates. Actual results could differ from those estimates. The policies described below are followed consistently by the Fund in the preparation of its financial statements.
Security Valuation. Investments are stated at value determined as of the close of regular trading on the New York Stock Exchange on each day the exchange is open for trading.
Various inputs are used in determining the value of the Fund's investments. These inputs are summarized in three broad levels. Level 1 includes quoted prices in active markets for identical securities. Level 2 includes other significant observable inputs (including quoted prices for similar securities, interest rates, prepayment speeds and credit risk). Level 3 includes significant unobservable inputs (including the Fund's own assumptions in determining the fair value of investments). The level assigned to the securities valuations may not be an indication of the risk or liquidity associated with investing in those securities.
Equity securities and exchange-traded funds ("ETFs") are valued at the most recent sale price or official closing price reported on the exchange (U.S. or foreign) or over-the-counter market on which they trade. Long equity securities and ETFs for which no sales are reported are valued at the calculated mean between the most recent bid and asked quotations on the relevant market or, if a mean cannot be determined, at the most recent bid quotation. Short equity securities and ETFs for which no sales are reported are valued at the calculated mean between the most recent bid and ask quotations on the relevant market or, if a mean cannot be determined, at the most recent ask quotation. Equity securities and ETFs are generally categorized as Level 1 For certain international equity securities, in order to adjust for events which may occur between the close of the foreign exchanges and the close of the New York Stock Exchange, a fair valuation model may be used. This fair valuation model takes into account comparisons to the valuation of American Depository Receipts (ADRs), exchange-traded funds, futures contracts and certain indices, and these securities are categorized as Level 2.
Investments in open-end investment companies are valued at their net asset value each business day and are categorized as Level 1.
Futures contracts are generally valued at the settlement prices established each day on the exchange on which they are traded and are categorized as Level 1.
Forward currency contracts are valued at the prevailing forward exchange rate of the underlying currencies and are categorized as Level 2.
Exchange-traded options are valued at the last sale price or, in the absence of a sale, the mean between the closing bid and asked prices or at the most recent asked price (bid for purchased options) if no bid or asked price are available. Exchange-traded options are categorized as Level 1. Over-the-counter written or purchased options are valued at prices supplied by a Board approved pricing vendor, if available, and otherwise are valued at the price provided by the broker-dealer with which the option was traded. Over-the-counter written or purchased options are generally categorized as Level 2.
Securities and other assets for which market quotations are not readily available or for which the above valuation procedures are deemed not to reflect fair value are valued in a manner that is intended to reflect their fair value as determined in accordance with procedures approved by the Board and are generally categorized as Level 3. In accordance with the Fund's valuation procedures, factors considered in determining value may include, but are not limited to, the type of the security; the size of the holding; the initial cost of the security; the existence of any contractual restrictions on the security's disposition; the price and extent of public trading in similar securities of the issuer or of comparable companies; quotations or evaluated prices from broker-dealers and/or pricing services; information obtained from the issuer, analysts, and/or the appropriate stock exchange (for exchange-traded securities); an analysis of the company's or issuer's financial statements; an evaluation of the forces that influence the issuer and the market(s) in which the security is purchased and sold; and with respect to debt securities, the maturity, coupon, creditworthiness, currency denomination and the movement of the market in which the security is normally traded. The value determined under these procedures may differ from published values for the same securities.
Disclosure about the classification of fair value measurements is included in a table following the Fund's Investment Portfolio.
Securities Lending. State Street Bank and Trust, as lending agent, lends securities of the Fund to certain financial institutions under the terms of the Security Lending Agreement. The Fund retains benefits of owning the securities it has loaned and continues to receive interest and dividends generated by the securities and to participate in any changes in their market value. The Fund requires the borrowers of the securities to maintain collateral with the Fund consisting of either cash or liquid, unencumbered assets having a value at least equal to the value of the securities loaned. When the collateral falls below specified amounts, the lending agent will use its best effort to obtain additional collateral on the next business day to meet required amounts under the security lending agreement. The Fund may invest the cash collateral into a joint trading account in an affiliated money market fund pursuant to Exemptive Orders issued by the SEC. During the year ended August 31, 2015, the Fund invested the cash collateral in Daily Assets Fund Institutional, an affiliated money market fund managed by Deutsche Investment Management Americas Inc. The Fund receives compensation for lending its securities either in the form of fees or by earning interest on invested cash collateral net of borrower rebates and fees paid to a lending agent. Either the Fund or the borrower may terminate the loan. There may be risks of delay and costs in recovery of securities or even loss of rights in the collateral should the borrower of the securities fail financially. If the Fund is not able to recover securities lent, the Fund may sell the collateral and purchase a replacement investment in the market, incurring the risk that the value of the replacement security is greater than the value of the collateral. The Fund is also subject to all investment risks associated with the reinvestment of any cash collateral received, including, but not limited to, interest rate, credit and liquidity risk associated with such investments.
As of August 31, 2015, the Fund had securities on loan. The value of the related collateral exceeded the value of the securities loaned at period end.
Foreign Currency Translations. The books and records of the Fund are maintained in U.S. dollars. Investment securities and other assets and liabilities denominated in a foreign currency are translated into U.S. dollars at the prevailing exchange rates at period end. Purchases and sales of investment securities, income and expenses are translated into U.S. dollars at the prevailing exchange rates on the respective dates of the transactions.
Net realized and unrealized gains and losses on foreign currency transactions represent net gains and losses between trade and settlement dates on securities transactions, the acquisition and disposition of foreign currencies, and the difference between the amount of net investment income accrued and the U.S. dollar amount actually received. That portion of both realized and unrealized gains and losses on investments that results from fluctuations in foreign currency exchange rates is not separately disclosed but is included with net realized and unrealized gain/appreciation and loss/depreciation on investments.
Short Sales. When the Fund takes a short position, it sells at the current market price a security it does not own but has borrowed in anticipation that the market price of the security will decline. To complete, or close out, the short sale transaction, the Fund buys the same security in the market and returns it to the lender.
Upon entering into a short sale, the Fund is required to designate liquid assets it owns in the form of cash or securities as segregated assets at its custodian in an amount at least equal to its obligations to purchase the securities sold short. For financial statements purposes, segregated cash is reflected as an asset on the Statement of Assets and Liabilities, and the settlement amount for securities sold short is reflected as a corresponding liability. Securities segregated as collateral are identified in the Investment Portfolio. The amount of the liability is marked-to-market to reflect the current value of the short position.
The Fund may receive or pay the net of the borrowing fee on securities sold short and any income earned on the cash held as collateral for securities sold short. The net amounts of income or fees are included as interest income, or interest expense on securities sold short, in the Statement of Operations.
Short sales involve the risk that the Fund will incur a loss by subsequently buying a security at a higher price than the price at which the Fund previously sold the security short. Any loss will be increased by the amount of compensation, interest or dividends, and transaction costs the Fund must pay to a lender of the security. In addition, because the Fund's loss on a short sale stems from increases in the value of the security sold short, the extent of such loss, like the price of the security sold short, is theoretically unlimited. By contrast, the Fund's loss on a long position arises from decreases in the value of the security held by the Fund and therefore is limited by the fact that a security's value cannot drop below zero.
Taxes. The Fund's policy is to comply with the requirements of the Internal Revenue Code, as amended, which are applicable to regulated investment companies, and to distribute all of its taxable income to its shareholders.
Additionally, the Fund may be subject to taxes imposed by the governments of countries in which it invests and are generally based on income and/or capital gains earned or repatriated. Estimated tax liabilities on certain foreign securities are recorded on an accrual basis and are reflected as components of interest income or net change in unrealized gain/loss on investments. Tax liabilities realized as a result of security sales are reflected as a component of net realized gain/loss on investments.
At August 31, 2015, the Fund had $9,381,000 of tax basis capital loss carryforwards, which may be applied against realized net taxable capital gains indefinitely, including short-term losses ($7,656,000) and long-term losses ($1,725,000).
The Fund has reviewed the tax positions for the open tax years as of August 31, 2015, and has determined that no provision for income tax and/or uncertain tax provisions is required in the Fund's financial statements.
Distribution of Income and Gains. Distributions from net investment income of the Fund, if any, are declared and distributed to shareholders annually. Net realized gains from investment transactions, in excess of available capital loss carryforwards, would be taxable to the Fund if not distributed, and, therefore, will be distributed to shareholders at least annually. The Fund may also make additional distributions for tax purposes if necessary.
The timing and characterization of certain income and capital gain distributions are determined annually in accordance with federal tax regulations which may differ from accounting principles generally accepted in the United States of America. These differences primarily relate to investment in foreign denominated investments, investments in futures, investments in passive foreign investment companies, investments in short sales, recognition of certain foreign currency gains (losses) as ordinary income (loss) and certain securities sold at a loss. As a result, net investment income (loss) and net realized gain (loss) on investment transactions for a reporting period may differ significantly from distributions during such period. Accordingly, the Fund may periodically make reclassifications among certain of its capital accounts without impacting the net asset value of the Fund.
At August 31, 2015, the Fund's components of distributable earnings (accumulated losses) on a tax basis were as follows:
| Undistributed ordinary income* | $ 1,022,575 |
| Capital loss carryforwards | $ (9,381,000) |
| Net unrealized appreciation (depreciation) on investments | $ (3,694,480) |
In addition, the tax character of distributions paid to shareholders by the Fund is summarized as follows:
| Year Ended August 31, 2015 | |
| Distributions from ordinary income* | $ 1,207,447 |
| Distributions from long-term capital gains | $ 23,496 |
* For tax purposes, short-term capital gain distributions are considered ordinary income distributions.
Expenses. Expenses of the Trust arising in connection with a specific fund are allocated to that fund. Other Trust expenses which cannot be directly attributed to a fund are apportioned among the funds in the Trust based upon the relative net assets or other appropriate measures.
Contingencies. In the normal course of business, the Fund may enter into contracts with service providers that contain general indemnification clauses. The Fund's maximum exposure under these arrangements is unknown as this would involve future claims that may be made against the Fund that have not yet been made. However, based on experience, the Fund expects the risk of loss to be remote.
Other. Investment transactions are accounted for on a trade date plus one basis for daily net asset value calculations. However, for financial reporting purposes, investment transactions are reported on trade date. Interest income is recorded on the accrual basis. Dividend income is recorded on the ex-dividend date. Dividend income on short sale transactions is recorded on ex-date and disclosed as an expense in the Statement of Operations. Realized gains and losses from investment transactions are recorded on an identified cost basis. Proceeds from litigation payments, if any, are included in net realized gain (loss) from investments.
B. Derivative Instruments
Futures Contracts. A futures contract is an agreement between a buyer or seller and an established futures exchange or its clearinghouse in which the buyer or seller agrees to take or make a delivery of a specific amount of a financial instrument at a specified price on a specific date (settlement date). For the year ended August 31, 2015, the Fund entered into futures contracts as a substitute for direct investment in a particular market, to hedge exposure to changes in foreign currency exchange rates on foreign currency denominated portfolio holdings or to maintain full long and short exposure and for non-hedging purposes to seek to enhance potential gains.
Upon entering into a futures contract, the Fund is required to deposit with a financial intermediary cash or securities ("initial margin") in an amount equal to a certain percentage of the face value indicated in the futures contract. Subsequent payments ("variation margin") are made or received by the Fund dependent upon the daily fluctuations in the value and are recorded for financial reporting purposes as unrealized gains or losses by the Fund. Gains or losses are realized when the contract expires or is closed. Since all futures contracts are exchange traded, counterparty risk is minimized as the exchange's clearinghouse acts as the counterparty, and guarantees the futures against default.
Certain risks may arise upon entering into futures contracts, including the risk that an illiquid market will limit the Fund's ability to close out a futures contract prior to the settlement date and the risk that the futures contract is not well correlated with the security, index or currency to which it relates. Risk of loss may exceed amounts disclosed in the Statement of Assets and Liabilities.
A summary of the open futures contracts as of August 31, 2015 is included in a table following the Fund's Investment Portfolio. For the year ended August 31, 2015, the investment in futures contracts purchased had a total notional value generally indicative of a range from $0 to approximately $3,886,000, and the investment in futures contracts sold had a total notional value generally indicative of a range from $0 to approximately $30,085,000.
Options. An option contract is a contract in which the writer (seller) of the option grants the buyer of the option, upon payment of a premium, the right to purchase from (call option), or sell to (put option), the writer a designated instrument at a specified price within a specified period of time. Certain options, including options on indices, will require cash settlement by the Fund if exercised. For the year ended August 31, 2015, the Fund entered into options on futures contracts as a substitute for direct investment in a particular security or market or to maintain full long and short exposure and for non-hedging purposes to seek to enhance potential gains.
If the Fund writes a covered call option, the Fund foregoes, in exchange for the premium, the opportunity to profit during the option period from an increase in the market value of the underlying security above the exercise price. If the Fund writes a put option it accepts the risk of a decline in the value of the underlying security below the exercise price. Over-the-counter options have the risk of the potential inability of counterparties to meet the terms of their contracts. The Fund’s maximum exposure to purchased options is limited to the premium initially paid. In addition, certain risks may arise upon entering into option contracts including the risk that an illiquid secondary market will limit the Fund’s ability to close out an option contract prior to the expiration date and that a change in the value of the option contract may not correlate exactly with changes in the value of the securities hedged.
There were no open purchased option contracts as of August 31, 2015. There were no open written option contracts as of August 31, 2015. For the year ended August 31, 2015, the investment in written option contracts with total values ranging from $0 to approximately $5,000 and purchased option contracts had a total value generally indicative of a range from $0 to approximately $34,000.
Forward Foreign Currency Exchange Contracts. A forward foreign currency exchange contract ("forward currency contract") is a commitment to purchase or sell a foreign currency at the settlement date at a negotiated rate. For the year ended August 31, 2015, the Fund entered into forward currency contracts in order to hedge its exposure to changes in foreign currency exchange rates on its foreign currency denominated assets and to facilitate transactions in foreign currency denominated securities.
Forward currency contracts are valued at the prevailing forward exchange rate of the underlying currencies and unrealized gain (loss) is recorded daily. On the settlement date of the forward currency contract, the Fund records a realized gain or loss equal to the difference between the value of the contract at the time it was opened and the value of the contract at the time it was closed. Certain risks may arise upon entering into forward currency contracts from the potential inability of counterparties to meet the terms of their contracts. The maximum counterparty credit risk to the Fund is measured by the unrealized gain on appreciated contracts. Additionally, when utilizing forward currency contracts to hedge, the Fund gives up the opportunity to profit from favorable exchange rate movements during the term of the contract.
A summary of the open forward currency contracts as of August 31, 2015 is included in a table following the Fund's Investment Portfolio. For the year ended August 31, 2015, the investment in forward currency contracts short vs. U.S. dollars had a total contract value generally indicative of a range from approximately $23,172,000 to $35,949,000, and the investment in forward currency contracts long vs. U.S. dollars had a total contract value generally indicative of a range from approximately $5,909,000 to $17,588,000.
The following tables summarize the value of the Fund's derivative instruments held as of August 31, 2015 and the related location in the accompanying Statement of Assets and Liabilities, presented by primary underlying risk exposure:
| Asset Derivatives | Forward Contracts | Futures Contracts | Total |
| Interest Rate Contracts (a) | $ — | $ 195 | $ 195 |
| Foreign Exchange Contracts (b) | 269,281 | — | 269,281 |
| $ 269,281 | $ 195 | $ 269,476 | |
Each of the above derivatives is located in the following Statement of Assets and Liabilities accounts: (a) Includes cumulative appreciation of futures contracts as disclosed in the Investment Portfolio. Unsettled variation margin is disclosed separately within the Statement of Assets and Liabilities. (b) Unrealized appreciation on forward foreign currency exchange contracts | |||
| Liability Derivatives | Forward Contracts |
| Foreign Exchange Contracts (b) | (139,777) |
The above derivative is located in the following Statement of Assets and Liabilities accounts: (a) Unrealized depreciation on forward foreign currency exchange contracts | |
Additionally, the amount of unrealized and realized gains and losses on derivative instruments recognized in Fund earnings during the year ended August 31, 2015 and the related location in the accompanying Statement of Operations is summarized in the following tables by primary underlying risk exposure:
| Realized Gain (Loss) | Purchased Options | Written Options | Forward Contracts | Futures Contracts | Total |
| Interest Rate Contracts (a) | $ — | $ — | $ — | $ (41,513) | $ (41,513) |
| Equity Contracts (a) | 209,374 | 23,149 | — | 33,806 | 266,329 |
| Foreign Exchange Contracts (a)(b) | — | — | 4,299,067 | 25,799 | 4,324,866 |
| $ 209,374 | $ 23,149 | $ 4,299,067 | $ 18,092 | $ 4,549,682 | |
Each of the above derivatives is located in the following Statement of Operations accounts: (a) Net realized gain (loss) from investments (includes purchased options), futures and written options, respectively. (b) Net realized gain (loss) from foreign currency (Statement of Operations includes both forward currency contracts and foreign currency transactions) | |||||
| Change in Net Unrealized Appreciation (Depreciation) | Forward Contracts | Futures Contracts | Total |
| Interest Rate Contracts (a) | $ — | $ 195 | $ 195 |
| Equity Contracts (a) | — | (30,540) | (30,540) |
| Foreign Exchange Contracts (a)(b) | (306,079) | (9,850) | (315,929) |
| $ (306,079) | $ (40,195) | $ (346,274) | |
Each of the above derivatives is located in the following Statement of Operations accounts: (a) Change in net unrealized appreciation (depreciation) on futures. (b) Change in net unrealized appreciation (depreciation) on foreign currency (Statement of Operations includes both forward currency contracts and foreign currency transactions) | |||
As of August 31, 2015, the Fund has transactions subject to enforceable master netting agreements. A reconciliation of the gross amounts on the Statement of Assets and Liabilities to the net amounts by counterparty, including any collateral exposure, is included in the following tables:
| Counterparty | Gross Amounts of Assets Presented in the Statement of Assets and Liabilities | Financial Instruments and Derivatives Available for Offset | Cash Collateral Received | Net Amount of Derivative Assets |
| State Street Bank and Trust | $ 269,281 | $ (139,777) | $ — | $ 129,504 |
| Counterparty | Gross Amounts of Liabilities Presented in the Statement of Assets and Liabilities | Financial Instruments and Derivatives Available for Offset | Cash Collateral Pledged | Net Amount of Derivative Liabilities |
| State Street Bank and Trust | $ 139,777 | $ (139,777) | $ — | $ — |
C. Purchases and Sales of Securities
During the year ended August 31, 2015, purchases and sales of investment securities (excluding short sale transactions and short-term investments) aggregated $197,794,565 and $279,338,804, respectively. Purchases to cover securities sold short and securities sold short aggregated $251,089,334 and $218,945,877, respectively.
For the year ended August 31, 2015, transactions for written options on interest rate swap contracts were as follows:
| Contract Amount | Total | |
| Outstanding, beginning of period | — | $ — |
| Options written | 100 | 28,449 |
| Options closed | (100) | (28,449) |
| Outstanding, end of period | — | $ — |
D. Related Parties
Management Agreement. Under the Investment Management Agreement with Deutsche Investment Management Americas Inc. ("DIMA" or the "Advisor"), an indirect, wholly owned subsidiary of Deutsche Bank AG, the Advisor directs the investments of the Fund in accordance with its investment objectives, policies and restrictions. The Advisor determines the securities, instruments and other contracts relating to investments to be purchased, sold or entered into by the Fund or delegates such responsibility to the Fund's subadvisors.
The Advisor allocates the Fund's assets across four sub-advised sleeves managed by Atlantic Investment Management, Inc. (Atlantic), Chilton Investment Company, LLC (Chilton), Lazard Asset Management LLC (Lazard), Omega Advisors, Inc. (Omega). Each investment management team employs different long/short investment strategies when managing the assets of the fund allocated to it. Atlantic, Chilton, Lazard and Omega are paid by the Advisor, not the Fund, for the services Atlantic, Chilton, Lazard and Omega provide to the Fund.
Under the Investment Management Agreement with the Advisor, the Fund pays a monthly management fee based on the Fund’s average daily net assets, computed and accrued daily and payable monthly, at an annual rate (exclusive of any applicable waivers/reimbursements) of 1.75%.
For the period from September 1, 2014 through September 30, 2016, the Advisor has contractually agreed to waive its fees and/or reimburse certain operating expenses of the Fund to the extent necessary to maintain the total annual operating expenses (excluding certain expenses such as extraordinary expenses, taxes, brokerage, interest and dividend expenses on short sales) of each class as follows:
| Class A | 2.40% |
| Class C | 3.15% |
| Class S | 2.25% |
| Institutional Class | 2.15% |
For year ended August 31, 2015, fees waived and/or expenses reimbursed for each class are as follows:
| Class A | $ 7,455 |
| Class C | 2,352 |
| Class S | 4,656 |
| $ 14,463 |
Administration Fee. Pursuant to an Administrative Services Agreement, DIMA provides most administrative services to the Fund. For all services provided under the Administrative Services Agreement, the Fund pays the Advisor an annual fee ("Administration Fee") of 0.10% of the Fund's average daily net assets, computed and accrued daily and payable monthly. For the year ended August 31, 2015, the Administration Fee was $144,850, of which $9,170 is unpaid.
Service Provider Fees. DeAWM Service Company ("DSC"), an affiliate of the Advisor, is the transfer agent, dividend-paying agent and shareholder service agent for the Fund. Pursuant to a sub-transfer agency agreement between DSC and DST Systems, Inc. ("DST"), DSC has delegated certain transfer agent, dividend-paying agent and shareholder service agent functions to DST. DSC compensates DST out of the shareholder servicing fees it receives from the Fund. For the year ended August 31, 2015, the amounts charged to the Fund by DSC were as follows:
| Services to Shareholders | Total Aggregated | Unpaid at August 31, 2015 |
| Class A | $ 2,120 | $ 389 |
| Class C | 1,016 | 230 |
| Class S | 1,575 | 303 |
| Institutional Class | 2,815 | 373 |
| $ 7,526 | $ 1,295 |
Distribution and Services Fees. Under the Fund's Class C 12b-1 Plan, DeAWM Distributors, Inc. ("DDI"), an affiliate of the Advisor, receives a fee ("Distribution Fee") of 0.75% of average daily net assets of Class C shares. In accordance with the Fund's Underwriting and Distribution Services Agreement, DDI enters into related selling group agreements with various firms at various rates for sales of Class C shares. For the year ended August 31, 2015, the Distribution Fee was as follows:
| Distribution Fee | Total Aggregated | Unpaid at August 31, 2015 |
| Class C | $ 43,508 | $ 4,093 |
In addition, DDI provides information and administrative services for a fee ("Service Fee") to the shareholders of Class A and Class C shareholders at an annual rate of up to 0.25% of average daily net assets for each such class. DDI in turn has various agreements with financial services firms that provide these services and pays these fees based upon the assets of shareholder accounts the firms service. For the year ended August 31, 2015, the Service Fee was as follows:
| Service Fee | Total Aggregated | Unpaid at August 31, 2015 | Annual Rate |
| Class A | $ 38,607 | $ 12,612 | .24% |
| Class C | 14,494 | 4,114 | .25% |
| $ 53,101 | $ 16,726 |
Underwriting Agreement and Contingent Deferred Sales Charge. DDI is the principal underwriter for the Fund. Underwriting commissions paid in connection with the distribution of Class A shares for the year ended August 31, 2015 aggregated $8,073.
In addition, DDI receives any contingent deferred sales charge ("CDSC") from Class C share redemptions occurring within one year of purchase. There is no such charge upon redemption of any share appreciation or reinvested dividends. The CDSC is based on 1% of the value of the shares redeemed for Class C. For the year ended August 31, 2015, the CDSC for Class C shares aggregated $7,469. A deferred sales charge of up to 0.75% is assessed on certain redemptions of Class A shares. For the year ended August 31, 2015, DDI received $12,271 for Class A shares.
Trustees' Fees and Expenses. The Fund paid retainer fees to each Trustee not affiliated with the Advisor, plus specified amounts to the Board Chairperson and Vice Chairperson and to each committee Chairperson.
Typesetting and Filing Service Fees. Under an agreement with DIMA, DIMA is compensated for providing typesetting and certain regulatory filing services to the Fund. For the year ended August 31, 2015, the amount charged to the Fund by DIMA included in the Statement of Operations under "Reports to shareholders" aggregated $16,043, of which $8,123 is unpaid.
Affiliated Cash Management Vehicles. The Fund may invest uninvested cash balances in Central Cash Management Fund and Deutsche Variable NAV Money Fund, affiliated money market funds which are managed by the Advisor. Each affiliated money market fund seeks to provide a high level of current income consistent with liquidity and the preservation of capital. Each affiliated money market fund is managed in accordance with Rule 2a-7 under the 1940 Act, which governs the quality, maturity, diversity and liquidity of instruments in which a money market fund may invest. Central Cash Management Fund seeks to maintain a stable net asset value, and Deutsche Variable NAV Money Fund maintains a floating net asset value. The Fund indirectly bears its proportionate share of the expenses of each affiliated money market fund in which it invests. Central Cash Management Fund does not pay the Advisor an investment management fee. To the extent that Deutsche Variable NAV Money Fund pays an investment management fee to the Advisor, the Advisor will waive an amount of the investment management fee payable to the Advisor by the Fund equal to the amount of the investment management fee payable on the Fund's assets invested in Deutsche Variable NAV Money Fund.
E. Concentration of Ownership
From time to time, the Fund may have a concentration of several shareholder accounts holding a significant percentage of shares outstanding. Investment activities of these shareholders could have a material impact on the Fund. At August 31, 2015, Deutsche Bank AG and its affiliates held approximately 46% of the outstanding shares of the Fund.
F. Line of Credit
The Fund and other affiliated funds (the "Participants") share in a $400 million revolving credit facility provided by a syndication of banks. The Fund may borrow for temporary or emergency purposes, including the meeting of redemption requests that otherwise might require the untimely disposition of securities. The Participants are charged an annual commitment fee which is allocated based on net assets, among each of the Participants. Interest is calculated at a rate per annum equal to the sum of the Federal Funds Rate plus 1.25 percent plus if the one-month LIBOR exceeds the Federal Funds Rate, the amount of such excess. The Fund may borrow up to a maximum of 20 percent of its net assets under the agreement. The Fund had no outstanding loans at August 31, 2015.
G. Share Transactions
The following table summarizes share and dollar activity in the Fund:
| Year Ended August 31, 2015 | Period Ended August 31, 2014* | |||
| Shares | Dollars | Shares | Dollars | |
| Shares sold | ||||
| Class A | 506,186 | $ 4,916,849 | 1,656,144 | $ 16,780,338 |
| Class C | 363,800 | 3,507,716 | 446,585 | 4,514,192 |
| Class S | 1,877,940 | 18,260,795 | 2,347,683 | 23,709,752 |
| Institutional Class | 1,958,531 | 19,226,223 | 743,434 | 7,495,247 |
| $ 45,911,583 | $ 52,499,529 | |||
| Shares issued to shareholders in reinvestment of distributions | ||||
| Class A | 11,046 | $ 103,390 | — | $ — |
| Class C | 3,558 | 33,162 | — | — |
| Class S | 15,733 | 147,262 | — | — |
| Institutional Class | 100,443 | 941,148 | — | — |
| $ 1,224,962 | $ — | |||
| Shares redeemed | ||||
| Class A | (610,891) | $ (5,991,576) | (84,429) | $ (853,806) |
| Class C | (137,159) | (1,327,281) | (9,952) | (99,987) |
| Class S | (2,376,186) | (22,607,239) | (13,026) | (131,294) |
| Institutional Class | (11,624,293) | (111,608,873) | (4,278,990) | (43,252,908) |
| $ (141,534,969) | $ (44,337,995) | |||
| Net increase (decrease) | ||||
| Class A | (93,659) | $ (971,337) | 1,571,715 | $ 15,926,532 |
| Class C | 230,199 | 2,213,597 | 436,633 | 4,414,205 |
| Class S | (482,513) | (4,199,182) | 2,334,657 | 23,578,458 |
| Institutional Class | (9,565,319) | (91,441,502) | (3,535,556) | (35,757,661) |
| $ (94,398,424) | $ 8,161,534 | |||
| Initial capital | ||||
| Class A | — | $ — | 100 | $ 1,000 |
| Class C | — | — | 100 | 1,000 |
| Class S | — | — | 100 | 1,000 |
| Institutional Class | — | — | 20,000,100 | 200,001,000 |
| $ — | $ 200,004,000 | |||
* For the period from May 15, 2014 (commencement of operations) to August 31, 2014.
Report of Independent Registered Public Accounting Firm
To the Board of Trustees of Deutsche Market Trust and the Shareholders of Deutsche Strategic Equity Long/Short Fund:
We have audited the accompanying statement of assets and liabilities, including the investment portfolio, of Deutsche Strategic Equity Long/Short Fund, (one of the funds constituting the Deutsche Market Trust (the Fund)) as of August 31, 2015, and the related statement of operations for the year then ended, the statements of changes in net assets and the financial highlights for each of the periods indicated therein. These financial statements and financial highlights are the responsibility of the Fund’s management. Our responsibility is to express an opinion on these financial statements and financial highlights based on our audits.
We conducted our audits in accordance with the standards of the Public Company Accounting Oversight Board (United States). Those standards require that we plan and perform the audit to obtain reasonable assurance about whether the financial statements and financial highlights are free of material misstatement. We were not engaged to perform an audit of the Fund’s internal control over financial reporting. Our audits included consideration of internal control over financial reporting as a basis for designing audit procedures that are appropriate in the circumstances, but not for the purpose of expressing an opinion on the effectiveness of the Fund’s internal control over financial reporting. Accordingly, we express no such opinion. An audit also includes examining, on a test basis, evidence supporting the amounts and disclosures in the financial statements and financial highlights, assessing the accounting principles used and significant estimates made by management, and evaluating the overall financial statement presentation. Our procedures included confirmation of securities owned as of August 31, 2015, by correspondence with the custodian and brokers or by other appropriate auditing procedures where replies from brokers were not received. We believe that our audits provide a reasonable basis for our opinion.
In our opinion, the financial statements and financial highlights referred to above present fairly, in all material respects, the financial position of Deutsche Strategic Equity Long/Short Fund (one of the funds constituting the Deutsche Market Trust) at August 31, 2015, the results of its operations for the year then ended, the changes in its net assets and the financial highlights for each of the periods indicated therein, in conformity with U.S. generally accepted accounting principles.
 | ||
| Boston, Massachusetts October 29, 2015 |
Information About Your Fund's Expenses
As an investor of the Fund, you incur two types of costs: ongoing expenses and transaction costs. Ongoing expenses include management fees, distribution and service (12b-1) fees and other Fund expenses. Examples of transaction costs include sales charges (loads), redemption fees and account maintenance fees, which are not shown in this section. The following tables are intended to help you understand your ongoing expenses (in dollars) of investing in the Fund and to help you compare these expenses with the ongoing expenses of investing in other mutual funds. In the most recent six-month period, Class A, C and S shares limited these expenses; had it not done so, expenses would have been higher. The example in the table is based on an investment of $1,000 invested at the beginning of the six-month period and held for the entire period (March 1, 2015 to August 31, 2015).
The tables illustrate your Fund's expenses in two ways:
— Actual Fund Return. This helps you estimate the actual dollar amount of ongoing expenses (but not transaction costs) paid on a $1,000 investment in the Fund using the Fund's actual return during the period. To estimate the expenses you paid over the period, simply divide your account value by $1,000 (for example, an $8,600 account value divided by $1,000 = 8.6), then multiply the result by the number in the "Expenses Paid per $1,000" line under the share class you hold.
— Hypothetical 5% Fund Return. This helps you to compare your Fund's ongoing expenses (but not transaction costs) with those of other mutual funds using the Fund's actual expense ratio and a hypothetical rate of return of 5% per year before expenses. Examples using a 5% hypothetical fund return may be found in the shareholder reports of other mutual funds. The hypothetical account values and expenses may not be used to estimate the actual ending account balance or expenses you paid for the period.
Please note that the expenses shown in these tables are meant to highlight your ongoing expenses only and do not reflect any transaction costs. The "Expenses Paid per $1,000" line of the tables is useful in comparing ongoing expenses only and will not help you determine the relative total expense of owning different funds. Subject to certain exceptions, an account maintenance fee of $20.00 assessed once per calendar year for Classes A, C and S shares may apply for accounts with balances less than $10,000. This fee is not included in these tables. If it was, the estimate of expenses paid for Classes A, C and S shares during the period would be higher, and account value during the period would be lower, by this amount.
| Expenses and Value of a $1,000 Investment for the six months ended August 31, 2015 (Unaudited) | ||||
| Actual Fund Return | Class A | Class C | Class S | Institutional Class |
| Beginning Account Value 3/1/15 | $ 1,000.00 | $ 1,000.00 | $ 1,000.00 | $ 1,000.00 |
| Ending Account Value 8/31/15 | $ 948.40 | $ 945.00 | $ 949.40 | $ 950.50 |
| Expenses Paid per $1,000* | $ 16.01 | $ 19.61 | $ 15.08 | $ 14.70 |
| Hypothetical 5% Fund Return | Class A | Class C | Class S | Institutional Class |
| Beginning Account Value 3/1/15 | $ 1,000.00 | $ 1,000.00 | $ 1,000.00 | $ 1,000.00 |
| Ending Account Value 8/31/15 | $ 1,008.77 | $ 1,005.04 | $ 1,009.73 | $ 1,010.13 |
| Expenses Paid per $1,000* | $ 16.51 | $ 20.22 | $ 15.55 | $ 15.15 |
* Expenses are equal to the Fund's annualized expense ratio for each share class, multiplied by the average account value over the period, multiplied by 184 (the number of days in the most recent six-month period), then divided by 365.
| Annualized Expense Ratios | Class A | Class C | Class S | Institutional Class |
| Deutsche Strategic Equity Long/Short Fund† | 3.26% | 4.00% | 3.07% | 2.99% |
† Includes interest and dividend expense on securities sold short of 0.80% for each class.
For more information, please refer to the Fund's prospectuses.
For an analysis of the fees associated with an investment in the Fund or similar funds, please refer to http://apps.finra.org/fundanalyzer/1/fa.aspx.
Tax Information (Unaudited)
The Fund paid distributions of $0.0003 per share from net long-term capital gains during its year ended August 31, 2015.
For corporate shareholders, 100% of the ordinary dividends (i.e., income dividends plus short-term capital gains) paid during the Fund's fiscal year ended August 31, 2015, qualified for the dividends received deduction.
For federal income tax purposes, the Fund designates $3,000,000, or the maximum amount allowable under tax law, as qualified dividend income.
Please consult a tax advisor if you have questions about federal or state income tax laws, or on how to prepare your tax returns. If you have specific questions about your account, please call (800) 728-3337.
Advisory Agreement Board Considerations and Fee Evaluation
The Board of Trustees approved DWS Strategic Equity Long/Short Fund’s (now known as Deutsche Strategic Equity Long/Short Fund) (the "Fund") investment management agreement (the "Agreement") with Deutsche Investment Management Americas Inc. ("DIMA"); the sub-advisory agreement between DIMA and Atlantic Investment Management, Inc. ("Atlantic") (the "Atlantic Sub-Advisory Agreement"); the sub-advisory agreement between DIMA and Chilton Investment Company, LLC ("Chilton") (the "Chilton Sub-Advisory Agreement"); the sub-advisory agreement between DIMA and Lazard Asset Management LLC ("Lazard") (the "Lazard Sub-Advisory Agreement"); and the sub-advisory agreement between DIMA and Omega Advisors, Inc. ("Omega" and together with Atlantic, Chilton and Lazard, the "Sub-Advisers") (the "Omega Sub-Advisory Agreement" and together with the Atlantic Sub-Advisory Agreement, the Chilton Sub-Advisory Agreement and the Lazard Sub-Advisory Agreement, the "Sub-Advisory Agreements") in March 2014. The Agreement and the Sub-Advisory Agreements are referred to collectively herein as the "Agreements."
In terms of the process that the Board followed prior to approving the Agreements, shareholders should know that:
— In March 2014, all of the Fund’s Trustees were independent of DIMA and its affiliates.
— The Trustees meet frequently to discuss fund matters. The Trustees met privately with their independent counsel to discuss the Agreements and other matters relating to the Fund. The Trustees were also advised by a fee consultant retained by the Trustees (the "Fee Consultant") in the course of their review of the Agreements and considered a report prepared by the Fee Consultant in connection with their deliberations.
In determining to approve the Agreements, the Board considered factors that it believed relevant to the interests of the Fund. The Board noted that DIMA is part of Deutsche Bank AG ("DB"), a major global banking institution that is engaged in a wide range of financial services. The Board believes that there are advantages to being part of a global asset management business that offers a wide range of investing expertise and resources, including hundreds of portfolio managers and analysts with research capabilities in many countries throughout the world.
Nature, Quality and Extent of Services. The Board considered the terms of the Agreements, including the scope of advisory services to be provided under the Agreements. The Board noted that, under the Agreements, DIMA and the Sub-Advisers will provide portfolio management services to the Fund and that, pursuant to a separate administrative services agreement, DIMA will provide administrative services to the Fund. The Board considered the experience and skills of senior management and investment personnel, the resources made available to such personnel, the ability of DIMA to attract and retain high-quality personnel, and the organizational depth and stability of DIMA. The Board also considered information provided on the proposed investment strategy of each Sub-Adviser and the investment personnel of each Sub-Adviser. The Board also requested and received information regarding DIMA’s planned oversight of the Sub-Advisers. Because the Fund had not yet commenced operations, no information relating to the Fund’s past performance could be considered by the Board. On the basis of this evaluation, the Board concluded that the nature, quality and extent of services are expected to be satisfactory.
Fees and Expenses. The Board considered the Fund’s proposed investment management fee schedule, estimated operating expenses and estimated total expense ratios, and comparative information provided by Lipper Inc. and DIMA. The Board noted that DIMA proposed to cap expenses (excluding certain expenses such as extraordinary expenses, taxes, brokerage and interest expenses) at 2.40%, 3.15%, 2.25% and 2.15% of average net assets of Class A, Class C, Class S and Institutional Class shares, respectively, for a one-year period following the Fund’s commencement of operations. The Board considered the Fund’s management fee schedule as compared to fees charged by DIMA to comparable funds, noting that DIMA indicated that it does not provide services to any other comparable funds. With respect to the sub-advisory fees to be paid to the Sub-Advisers, the Board noted that the fees are paid by DIMA out of its fee and not directly by the Fund. On the basis of the information provided, including the report provided by the Fee Consultant, the Board concluded that the proposed management fees were reasonable and appropriate in light of the nature, quality and extent of services to be provided by DIMA and the Sub-Advisers.
Profitability. Because the Fund had not yet commenced operations, no information regarding DIMA’s or the Sub-Advisers’ costs and profits from providing investment management services to the Fund could be considered by the Board.
Economies of Scale. Given the uncertainty regarding the Fund’s size and related operating costs, the Board deferred evaluation of the economies of scale to a future date. The Board observed that while the proposed investment management fee schedule does not include breakpoints, the Board would consider implementation of one or more breakpoints once the Fund reached an efficient operating size.
Other Benefits to DIMA and the Sub-Advisers and Their Affiliates. The Board considered the character and amount of other incidental benefits to be received by DIMA and the Sub-Advisers and their affiliates, including any fees to be received by DIMA for administrative services provided to the Fund and any fees to be received by an affiliate of DIMA for distribution services. The Board also considered benefits to DIMA and the Sub-Advisers related to brokerage and soft dollar allocations, including that each Sub-Adviser may allocate brokerage to pay for research services generated by parties other than the executing broker-dealers. The Board also noted the incidental public relations benefits to DIMA and the Sub-Advisers related to DWS Funds (now known as Deutsche Funds) advertising and cross-selling opportunities among DIMA products and services. The Board concluded that the proposed management fees were reasonable in light of these fallout benefits.
Compliance. The Board considered the significant attention and resources dedicated by DIMA to documenting and enhancing its compliance processes in recent years. The Board noted in particular (i) the experience and seniority of both DIMA’s chief compliance officer and the Fund’s chief compliance officer; (ii) the large number of DIMA compliance personnel; and (iii) the substantial commitment of resources by DIMA and its affiliates to compliance matters. The Board also considered the attention and resources to be dedicated by DIMA to the oversight of each Sub-Adviser’s compliance program and compliance with the applicable fund policies and procedures.
Based on all of the information considered and the conclusions reached, the Board unanimously determined to approve the Agreements and concluded that the Agreements were in the best interests of the Fund. In making this determination, the Board did not give particular weight to any single factor identified above. It is possible that individual Trustees may have weighed these factors differently in reaching their individual decisions to approve the Agreements.
Board Members and Officers
The following table presents certain information regarding the Board Members and Officers of the fund. Each Board Member's year of birth is set forth in parentheses after his or her name. Unless otherwise noted, (i) each Board Member has engaged in the principal occupation(s) noted in the table for at least the most recent five years, although not necessarily in the same capacity; and (ii) the address of each Independent Board Member is c/o Kenneth C. Froewiss, Chairman, Deutsche Mutual Funds, P.O. Box 390601, Cambridge, MA 02139. Except as otherwise noted below, the term of office for each Board Member is until the election and qualification of a successor, or until such Board Member sooner dies, resigns, is removed or as otherwise provided in the governing documents of the fund. Because the fund does not hold an annual meeting of shareholders, each Board Member will hold office for an indeterminate period. The Board Members may also serve in similar capacities with other funds in the fund complex.
| Independent Board Members | |||
| Name, Year of Birth, Position with the Fund and Length of Time Served1 | Business Experience and Directorships During the Past Five Years | Number of Funds in Deutsche Fund Complex Overseen | Other Directorships Held by Board Member |
Kenneth C. Froewiss (1945) Chairperson since 2013, and Board Member since 2001 | Retired Clinical Professor of Finance, NYU Stern School of Business (1997–2014); Member, Finance Committee, Association for Asian Studies (2002–present); Director, Mitsui Sumitomo Insurance Group (US) (2004–present); prior thereto, Managing Director, J.P. Morgan (investment banking firm) (until 1996) | 106 | — |
William McClayton (1944) Vice Chairperson since 2013, and Board Member since 2004 | Private equity investor (since October 2009); previously, Managing Director, Diamond Management & Technology Consultants, Inc. (global consulting firm) (2001–2009); Directorship: Board of Managers, YMCA of Metropolitan Chicago; formerly: Senior Partner, Arthur Andersen LLP (accounting) (1966–2001); Trustee, Ravinia Festival | 106 | — |
John W. Ballantine (1946) Board Member since 1999 | Retired; formerly, Executive Vice President and Chief Risk Management Officer, First Chicago NBD Corporation/The First National Bank of Chicago (1996–1998); Executive Vice President and Head of International Banking (1995–1996); former Directorships: Director and former Chairman of the Board, Healthways, Inc.2 (provider of disease and care management services) (2003–2014); Stockwell Capital Investments PLC (private equity); First Oak Brook Bancshares, Inc. and Oak Brook Bank; Prisma Energy International
| 106 | Portland General Electric2 (utility company) (2003– present) |
Henry P. Becton, Jr. (1943) Board Member since 1990 | Vice Chair and former President, WGBH Educational Foundation. Directorships: Public Radio International; Public Radio Exchange (PRX); former Directorships: Belo Corporation2 (media company); The PBS Foundation; Association of Public Television Stations; Boston Museum of Science; American Public Television; Concord Academy; New England Aquarium; Mass. Corporation for Educational Telecommunications; Committee for Economic Development; Public Broadcasting Service; Connecticut College; North Bennett Street School (Boston) | 106 | Director, Becton Dickinson and Company2 (medical technology company) |
Dawn-Marie Driscoll (1946) Board Member since 1987 | Emeritus Executive Fellow, Center for Business Ethics, Bentley University; formerly: President, Driscoll Associates (consulting firm); Partner, Palmer & Dodge (law firm) (1988–1990); Vice President of Corporate Affairs and General Counsel, Filene's (retail) (1978–1988). Directorships: Director of ICI Mutual Insurance Company (since 2007); Advisory Board, Center for Business Ethics, Bentley University; Trustee and former Chairman of the Board, Southwest Florida Community Foundation (charitable organization); former Directorships: Sun Capital Advisers Trust (mutual funds) (2007–2012), Investment Company Institute (audit, executive, nominating committees) and Independent Directors Council (governance, executive committees) | 106 | — |
Keith R. Fox, CFA (1954) Board Member since 1996 | Managing General Partner, Exeter Capital Partners (a series of private investment funds) (since 1986). Directorships: Progressive International Corporation (kitchen goods importer and distributor); The Kennel Shop (retailer); former Chairman, National Association of Small Business Investment Companies; former Directorships: BoxTop Media Inc. (advertising); Sun Capital Advisers Trust (mutual funds) (2011–2012) | 106 | — |
Paul K. Freeman (1950) Board Member since 1993 | Consultant, World Bank/Inter-American Development Bank; Chair, Independent Directors Council; Investment Company Institute (executive and nominating committees); formerly, Chairman of Education Committee of Independent Directors Council; Project Leader, International Institute for Applied Systems Analysis (1998–2001); Chief Executive Officer, The Eric Group, Inc. (environmental insurance) (1986–1998); Directorships: Denver Zoo Foundation (December 2012–present); former Directorships: Prisma Energy International | 106 | — |
Richard J. Herring (1946) Board Member since 1990 | Jacob Safra Professor of International Banking and Professor, Finance Department, The Wharton School, University of Pennsylvania (since July 1972); Co-Director, Wharton Financial Institutions Center; Co-Chair, U.S. Shadow Financial Regulatory Committee; Executive Director, Financial Economists Roundtable; formerly: Vice Dean and Director, Wharton Undergraduate Division (July 1995–June 2000); Director, Lauder Institute of International Management Studies (July 2000–June 2006) | 106 | Director, Aberdeen Singapore and Japan Funds (since 2007); Independent Director of Barclays Bank Delaware (since September 2010) |
Rebecca W. Rimel (1951) Board Member since 1995 | President and Chief Executive Officer, The Pew Charitable Trusts (charitable organization) (1994 to present); formerly: Executive Vice President, The Glenmede Trust Company (investment trust and wealth management) (1983–2004); Board Member, Investor Education (charitable organization) (2004–2005); Trustee, Executive Committee, Philadelphia Chamber of Commerce (2001–2007); Director, Viasys Health Care2 (January 2007–June 2007); Trustee, Thomas Jefferson Foundation (charitable organization) (1994–2012) | 106 | Director, Becton Dickinson and Company2 (medical technology company) (2012– present); Director, BioTelemetry Inc.2 (health care) (2009– present) |
William N. Searcy, Jr. (1946) Board Member since 1993 | Private investor since October 2003; formerly: Pension & Savings Trust Officer, Sprint Corporation2 (telecommunications) (November 1989–September 2003); Trustee, Sun Capital Advisers Trust (mutual funds) (1998–2012) | 106 | — |
Jean Gleason Stromberg (1943) Board Member since 1997 | Retired. Formerly, Consultant (1997–2001); Director, Financial Markets U.S. Government Accountability Office (1996–1997); Partner, Norton Rose Fulbright, L.L.P. (law firm) (1978–1996). Directorships: The William and Flora Hewlett Foundation (charitable organization); former Directorships: Service Source, Inc. (nonprofit), Mutual Fund Directors Forum (2002–2004), American Bar Retirement Association (funding vehicle for retirement plans) (1987–1990 and 1994–1996) | 106 | — |
| Officers4 | |
| Name, Year of Birth, Position with the Fund and Length of Time Served5 | Business Experience and Directorships During the Past Five Years |
Brian E. Binder8 (1972) President and Chief Executive Officer, 2013–present | Managing Director3 and Head of Fund Administration, Deutsche Asset & Wealth Management (2013–present); formerly: Head of Business Management and Consulting at Invesco, Ltd. (2010–2012); Chief Administrative Officer, Van Kampen Funds Inc. (2008–2010); and Chief Administrative Officer, Morgan Stanley Investment Management Americas Distribution (2003–2008) |
John Millette7 (1962) Vice President and Secretary, 1999–present | Director,3 Deutsche Asset & Wealth Management |
Melinda Morrow6 (1970) Vice President, 2012–present | Director,3 Deutsche Asset & Wealth Management |
Paul H. Schubert6 (1963) Chief Financial Officer, 2004–present Treasurer, 2005–present | Managing Director,3 Deutsche Asset & Wealth Management (since July 2004); formerly: Executive Director, Head of Mutual Fund Services and Treasurer for UBS Family of Funds (1998–2004); Vice President and Director of Mutual Fund Finance at UBS Global Asset Management (1994–1998) |
Caroline Pearson7 (1962) Chief Legal Officer, 2010–present | Managing Director,3 Deutsche Asset & Wealth Management; formerly: Assistant Secretary for DWS family of funds (1997–2010) |
Robert Kloby6 (1962) Chief Compliance Officer, 2006–present | Managing Director,3 Deutsche Asset & Wealth Management |
Wayne Salit6 (1967) Anti-Money Laundering Compliance Officer, 2014–present | Director,3 Deutsche Asset & Wealth Management; formerly: Managing Director, AML Compliance Officer at BNY Mellon (2011–2014); and Director, AML Compliance Officer at Deutsche Bank (2004–2011) |
Hepsen Uzcan6 (1974) Assistant Secretary, 2013–present | Director,3 Deutsche Asset & Wealth Management |
Paul Antosca7 (1957) Assistant Treasurer, 2007–present | Director,3 Deutsche Asset & Wealth Management |
Jack Clark7 (1967) Assistant Treasurer, 2007–present | Director,3 Deutsche Asset & Wealth Management |
Diane Kenneally7 (1966) Assistant Treasurer, 2007–present | Director,3 Deutsche Asset & Wealth Management |
1 The length of time served represents the year in which the Board Member joined the board of one or more Deutsche funds currently overseen by the Board.
2 A publicly held company with securities registered pursuant to Section 12 of the Securities Exchange Act of 1934.
3 Executive title, not a board directorship.
4 As a result of their respective positions held with the Advisor, these individuals are considered "interested persons" of the Advisor within the meaning of the 1940 Act. Interested persons receive no compensation from the fund.
5 The length of time served represents the year in which the officer was first elected in such capacity for one or more Deutsche funds.
6 Address: 60 Wall Street, New York, NY 10005.
7 Address: One Beacon Street, Boston, MA 02108.
8 Address: 222 South Riverside Plaza, Chicago, IL 60606.
The fund's Statement of Additional Information ("SAI") includes additional information about the Board Members. The SAI is available, without charge, upon request. If you would like to request a copy of the SAI, you may do so by calling the following toll-free number: (800) 728-3337.
Account Management Resources
| For More Information | The automated telephone system allows you to access personalized account information and obtain information on other Deutsche funds using either your voice or your telephone keypad. Certain account types within Classes A, C, S and Institutional also have the ability to purchase, exchange or redeem shares using this system. For more information, contact your financial advisor. You may also access our automated telephone system or speak with a Shareholder Service representative by calling: (800) 728-3337 |
| Web Site | deutschefunds.com View your account transactions and balances, trade shares, monitor your asset allocation, subscribe to fund and account updates by e-mail, and change your address, 24 hours a day. Obtain prospectuses and applications, blank forms, interactive worksheets, news about Deutsche funds, retirement planning information, and more. |
| Written Correspondence | Deutsche Asset & Wealth Management PO Box 219151 |
| Proxy Voting | The fund's policies and procedures for voting proxies for portfolio securities and information about how the fund voted proxies related to its portfolio securities during the 12-month period ended June 30 are available on our Web site — deutschefunds.com (click on "proxy voting"at the bottom of the page) — or on the SEC's Web site — sec.gov. To obtain a written copy of the fund's policies and procedures without charge, upon request, call us toll free at (800) 728-3337. |
| Portfolio Holdings | Following the fund's fiscal first and third quarter-end, a complete portfolio holdings listing is filed with the SEC on Form N-Q. This form will be available on the SEC's Web site at sec.gov, and it also may be reviewed and copied at the SEC's Public Reference Room in Washington, D.C. Information on the operation of the SEC's Public Reference Room may be obtained by calling (800) SEC-0330. The fund's portfolio holdings are also posted on deutschefunds.com from time to time. Please see the fund's current prospectus for more information. |
| Principal Underwriter | If you have questions, comments or complaints, contact: DeAWM Distributors, Inc. 222 South Riverside Plaza (800) 621-1148 |
| Investment Management | Deutsche Investment Management Americas Inc. ("DIMA" or the "Advisor"), which is part of Deutsche Asset & Wealth Management, is the investment advisor for the fund. DIMA and its predecessors have more than 80 years of experience managing mutual funds and DIMA provides a full range of investment advisory services to both institutional and retail clients. DIMA is an indirect, wholly owned subsidiary of Deutsche Bank AG. Deutsche Bank AG is a major global banking institution engaged in a wide variety of financial services, including investment management, retail, private and commercial banking, investment banking and insurance. Deutsche Asset & Wealth Management is the retail brand name in the U.S. for the wealth management and asset management activities of Deutsche Bank AG and DIMA. Deutsche Asset & Wealth Management is committed to delivering the investing expertise, insight and resources of this global investment platform to American investors. |
| Class A | Class C | Class S | Institutional Class | |
| Nasdaq Symbol | DSLAX | DSLCX | DSLSX | DSLIX |
| CUSIP Number | 25159K 762 | 25159K 754 | 25159K 747 | 25159K 739 |
| Fund Number | 1004 | 1304 | 2004 | 1404 |
Notes

| ITEM 2. | CODE OF ETHICS |
As of the end of the period covered by this report, the registrant has adopted a code of ethics, as defined in Item 2 of Form N-CSR, that applies to its Principal Executive Officer and Principal Financial Officer.
There have been no amendments to, or waivers from, a provision of the code of ethics during the period covered by this report that would require disclosure under Item 2.
A copy of the code of ethics is filed as an exhibit to this Form N-CSR. | |
| ITEM 3. | AUDIT COMMITTEE FINANCIAL EXPERT |
| The fund’s audit committee is comprised solely of trustees who are "independent" (as such term has been defined by the Securities and Exchange Commission ("SEC") in regulations implementing Section 407 of the Sarbanes-Oxley Act (the "Regulations")). The fund’s Board of Trustees has determined that there are several "audit committee financial experts" (as such term has been defined by the Regulations) serving on the fund’s audit committee including Mr. Paul K. Freeman, the chair of the fund’s audit committee. An “audit committee financial expert” is not an “expert” for any purpose, including for purposes of Section 11 of the Securities Act of 1933 and the designation or identification of a person as an “audit committee financial expert” does not impose on such person any duties, obligations or liability that are greater than the duties, obligations and liability imposed on such person as a member of the audit committee and board of directors in the absence of such designation or identification. | |
| ITEM 4. | PRINCIPAL ACCOUNTANT FEES AND SERVICES |
Deutsche strategic equity long/short fund
form n-csr disclosure re: AUDIT FEES
The following table shows the amount of fees that Ernst & Young LLP (“EY”), the Fund’s Independent Registered Public Accounting Firm, billed to the Fund during the Fund’s last two fiscal years. The Audit Committee approved in advance all audit services and non-audit services that EY provided to the Fund.
Services that the Fund’s Independent Registered Public Accounting Firm Billed to the Fund
| Fiscal Year Ended August 31, | Audit Fees Billed to Fund | Audit-Related Fees Billed to Fund | Tax Fees Billed to Fund | All Other Fees Billed to Fund |
| 2015 | $76,600 | $0 | $8,400 | $0 |
| 2014 | $75,000 | $0 | $8,000 | $0 |
The above “Tax Fees” were billed for professional services rendered for tax return preparation.
Services that the Fund’s Independent Registered Public Accounting Firm Billed to the Adviser and Affiliated Fund Service Providers
The following table shows the amount of fees billed by EY to Deutsche Investment Management Americas, Inc. (“DIMA” or the “Adviser”), and any entity controlling, controlled by or under common control with DIMA (“Control Affiliate”) that provides ongoing services to the Fund (“Affiliated Fund Service Provider”), for engagements directly related to the Fund’s operations and financial reporting, during the Fund’s last two fiscal years.
| Fiscal Year Ended August 31, | Audit-Related Fees Billed to Adviser and Affiliated Fund Service Providers | Tax Fees Billed to Adviser and Affiliated Fund Service Providers | All Other Fees Billed to Adviser and Affiliated Fund Service Providers |
| 2015 | $0 | $498,574 | $3,642,017 |
| 2014 | $0 | $266,072 | $6,090,049 |
The above “Tax Fees” were billed in connection with tax compliance services and agreed upon procedures. All other engagement fees were billed for services in connection with agreed upon procedures for DIMA and other related entities.
Non-Audit Services
The following table shows the amount of fees that EY billed during the Fund’s last two fiscal years for non-audit services. The Audit Committee pre-approved all non-audit services that EY provided to the Adviser and any Affiliated Fund Service Provider that related directly to the Fund’s operations and financial reporting. The Audit Committee requested and received information from EY about any non-audit services that EY rendered during the Fund’s last fiscal year to the Adviser and any Affiliated Fund Service Provider. The Committee considered this information in evaluating EY’s independence.
| Fiscal Year Ended August 31, | Total (A) | Total Non-Audit Fees billed to Adviser and Affiliated Fund Service Providers (engagements related directly to the operations and financial reporting of the Fund) (B) | Total Non-Audit Fees billed to Adviser and Affiliated Fund Service Providers (all other engagements) (C) | Total of (A), (B) and (C) |
| 2015 | $8,400 | $4,140,591 | $880,336 | $5,029,327 |
| 2014 | $8,000 | $6,356,121 | $411,123 | $6,775,244 |
All other engagement fees were billed for services in connection with agreed upon procedures and tax compliance for DIMA and other related entities.
Audit Committee Pre-Approval Policies and Procedures. Generally, each Fund’s Audit Committee must pre approve (i) all services to be performed for a Fund by a Fund’s Independent Registered Public Accounting Firm and (ii) all non-audit services to be performed by a Fund’s Independent Registered Public Accounting Firm for the DIMA Entities with respect to operations and financial reporting of the Fund, except that the Chairperson or Vice Chairperson of each Fund’s Audit Committee may grant the pre-approval for non-audit services described in items (i) and (ii) above for non-prohibited services for engagements of less than $100,000. All such delegated pre approvals shall be presented to each Fund’s Audit Committee no later than the next Audit Committee meeting.
There were no amounts that were approved by the Audit Committee pursuant to the de minimis exception under Rule 2-01 of Regulation S-X.
According to the registrant’s principal Independent Registered Public Accounting Firm, substantially all of the principal Independent Registered Public Accounting Firm's hours spent on auditing the registrant's financial statements were attributed to work performed by full-time permanent employees of the principal Independent Registered Public Accounting Firm.
***
In connection with the audit of the 2014 and 2015 financial statements, the Fund entered into an engagement letter with EY. The terms of the engagement letter required by EY, and agreed to by the Audit Committee, include provisions in which the parties consent to the sole jurisdiction of federal courts in New York, Boston or the Northern District of Illinois, as well as a waiver of right to a trial by jury and, for the 2014 audit, an exclusion of punitive damages.
***
| ITEM 5. | AUDIT COMMITTEE OF LISTED REGISTRANTS | |
| Not applicable | ||
| ITEM 6. | SCHEDULE OF INVESTMENTS | |
| Not applicable | ||
| ITEM 7. | DISCLOSURE OF PROXY VOTING POLICIES AND PROCEDURES FOR CLOSED-END MANAGEMENT INVESTMENT COMPANIES | |
| Not applicable | ||
| ITEM 8. | PORTFOLIO MANAGERS OF CLOSED-END MANAGEMENT INVESTMENT COMPANIES | |
| Not applicable | ||
| ITEM 9. | PURCHASES OF EQUITY SECURITIES BY CLOSED-END MANAGEMENT INVESTMENT COMPANY AND AFFILIATED PURCHASERS | |
| Not applicable | ||
| ITEM 10. | SUBMISSION OF MATTERS TO A VOTE OF SECURITY HOLDERS | |
| There were no material changes to the procedures by which shareholders may recommend nominees to the Fund’s Board. The primary function of the Nominating and Governance Committee is to identify and recommend individuals for membership on the Board and oversee the administration of the Board Governance Guidelines. Shareholders may recommend candidates for Board positions by forwarding their correspondence by U.S. mail or courier service to Kenneth C. Froewiss, Independent Chairman, Deutsche Mutual Funds, P.O. Box 390601, Cambridge, MA 02139. | ||
| ITEM 11. | CONTROLS AND PROCEDURES | |
| (a) | The Chief Executive and Financial Officers concluded that the Registrant’s Disclosure Controls and Procedures are effective based on the evaluation of the Disclosure Controls and Procedures as of a date within 90 days of the filing date of this report. | |
| (b) | There have been no changes in the registrant’s internal control over financial reporting that occurred during the second fiscal quarter of the period covered by this report that has materially affected, or is reasonably likely to materially affect, the registrant’s internal controls over financial reporting. | |
| ITEM 12. | EXHIBITS | |
| (a)(1) | Code of Ethics pursuant to Item 2 of Form N-CSR is filed and attached hereto as EX-99.CODE ETH. | |
| (a)(2) | Certification pursuant to Rule 30a-2(a) under the Investment Company Act of 1940 (17 CFR 270.30a-2(a)) is filed and attached hereto as Exhibit 99.CERT. | |
| (b) | Certification pursuant to Rule 30a-2(b) under the Investment Company Act of 1940 (17 CFR 270.30a-2(b)) is furnished and attached hereto as Exhibit 99.906CERT. | |
SIGNATURES
Pursuant to the requirements of the Securities Exchange Act of 1934 and the Investment Company Act of 1940, the registrant has duly caused this report to be signed on its behalf by the undersigned, thereunto duly authorized.
| Registrant: | Deutsche Strategic Equity Long/Short Fund, a series of Deutsche Market Trust |
| By: | /s/Brian E. Binder Brian E. Binder President |
| Date: | October 30, 2015 |
Pursuant to the requirements of the Securities Exchange Act of 1934 and the Investment Company Act of 1940, this report has been signed below by the following persons on behalf of the registrant and in the capacities and on the dates indicated.
| By: | /s/Brian E. Binder Brian E. Binder President |
| Date: | October 30, 2015 |
| By: | /s/Paul Schubert Paul Schubert Chief Financial Officer and Treasurer |
| Date: | October 30, 2015 |