UNITED STATES
SECURITIES AND EXCHANGE COMMISSION
WASHINGTON, D. C. 20549
FORM N-CSR
Investment Company Act file number: 811-01236
Deutsche DWS Market Trust
(Exact Name of Registrant as Specified in Charter)
345 Park Avenue
New York, NY 10154-0004
(Address of Principal Executive Offices) (Zip Code)
Registrant’s Telephone Number, including Area Code: (212) 250-2500
Diane Kenneally8
One International Place
Boston, MA 02110
(Name and Address of Agent for Service)
| Date of fiscal year end: | 10/31 |
| Date of reporting period: | 10/31/2018 |
| ITEM 1. | REPORT TO STOCKHOLDERS |
Table of Contents

October 31, 2018
Annual Report
to Shareholders
DWS Global Income Builder Fund
(formerly Deutsche Global Income Builder Fund)

Table of Contents
This report must be preceded or accompanied by a prospectus. To obtain a summary prospectus, if available, or prospectus for any of our funds, refer to the Account Management Resources information provided in the back of this booklet. We advise you to consider the Fund’s objectives, risks, charges and expenses carefully before investing. The summary prospectus and prospectus contain this and other important information about the Fund. Please read the prospectus carefully before you invest.
Although allocation among different asset categories generally limits risk, portfolio management may favor an asset category that underperforms other assets or markets as a whole. Bond investments are subject to interest-rate, credit, liquidity and market risks to varying degrees. When interest rates rise, bond prices generally fall. Credit risk refers to the ability of an issuer to make timely payments of principal and interest. Investing in derivatives entails special risks relating to liquidity, leverage and credit that may reduce returns and/or increase volatility. Dividends are not guaranteed. If the dividend-paying stocks held by the Fund reduce or stop paying dividends, the Fund’s ability to generate income may be adversely affected. Preferred stocks, a type of dividend-paying stock, present certain additional risks. Emerging markets tend to be more volatile and less liquid than the markets of more mature economies, and generally have less diverse and less mature economic structures and less stable political systems than those of developed countries. Because Exchange Traded Funds (ETFs) trade on a securities exchange, their shares may trade at a premium or discount to their net asset value. ETFs also incur fees and expenses so they may not fully match the performance of the indexes they are designed to track. Any fund that focuses in a particular segment of the market or region of the world will generally be more volatile than a fund that invests more broadly. Investing in foreign securities presents certain risks, such as currency fluctuations, political and economic changes, and market risks. The Fund may lend securities to approved institutions. Small company stocks tend to be more volatile than medium-sized or large company stocks. Stocks may decline in value. Please read the prospectus for details.
The brand DWS represents DWS Group GmbH & Co. KGaA and any of its subsidiaries such as DWS Distributors, Inc. which offers investment products or DWS Investment Management Americas, Inc. and RREEF America L.L.C. which offer advisory services.
NOT FDIC/NCUA INSURED NO BANK GUARANTEE MAY LOSE VALUE
NOT A DEPOSIT NOT INSURED BY ANY FEDERAL GOVERNMENT AGENCY
| 2 | | | DWS Global Income Builder Fund |
Table of Contents
Dear Shareholder:
The U.S. economy seems still to be in a cyclical sweet spot. Against a backdrop of solid growth, a tight labor market and inflation near the Federal Reserve Bank’s target, the expansion appears set to continue.
This is not to say there are no risks. Concerns regarding trade and other geopolitical issues have contributed to increased volatility and bear close watching. Overall, however, our Chief Investment Officer (“CIO”) and Chief Economist agree that the equity market is broadly attractive, thanks to strong earnings growth and the October dip in global equity markets. Meanwhile, our outlook is for interest rates to rise gradually as the economic recovery continues into 2019.
Our CIO Office, Chief Economist and Investment Specialists frequently post their perspectives on new developments, opportunities and emerging risks in the “Insight” section of our web site, dws.com. We invite you to visit us online frequently to access our most current views.
Best regards,
 |
Hepsen Uzcan
President, DWS Funds |

Assumptions, estimates and opinions contained in this document constitute our judgment as of the date of the document and are subject to change without notice. Any projections are based on a number of assumptions as to market conditions and there can be no guarantee that any projected results will be achieved. Past performance is not a guarantee of future results.
| DWS Global Income Builder Fund | | | 3 |
Table of Contents
| Portfolio Management Review | (Unaudited) |
Market Overview and Fund Performance
All performance information below is historical and does not guarantee future results. Returns shown are for Class A shares, unadjusted for sales charges. Investment return and principal fluctuate, so your shares may be worth more or less when redeemed. Current performance may differ from performance data shown. Please visit dws.com for the most recent month-end performance of all share classes. Fund performance includes reinvestment of all distributions. Unadjusted returns do not reflect sales charges and would have been lower if they had. Please refer to pages 10 through 12 for more complete performance information.
Investment Strategy
Portfolio management seeks to maximize risk adjusted returns by allocating the Fund’s assets among various asset categories. Portfolio management periodically reviews the Fund’s allocations and may adjust them based on current or anticipated market conditions or to manage risk consistent with the Fund’s overall investment strategy.
Within each asset category, portfolio management uses one or more investment strategies for selecting equity and debt securities. Each investment strategy is managed by a team that specializes in a particular asset category, and that may use a variety of quantitative and qualitative techniques. The portfolio management teams utilize in-house research and resources to determine suitability of specific securities and use sector specialists to determine relative value within each relevant sector.
Examples of the Fund’s asset categories are U.S. and foreign equity of any size and style (including emerging-market equity), U.S. and foreign fixed income of any credit quality (including emerging-market bonds and inflation-indexed bonds), and alternative assets. Some asset categories may be represented by exchange-traded funds (ETFs).
DWS Global Income Builder Fund returned –1.11% during the 12-month period ending October 31, 2018. The Fund slightly outperformed the –1.25% return of the S&P® Target Risk Moderate Index, but it underperformed the –1.05% return of its secondary benchmark, the Blended Index. The Blended Index is an equally-weighted blend (50%/50%) of the MSCI World High Dividend Yield Index and the Bloomberg Barclays U.S. Universal Index. The two indices returned –0.35% and –1.95%, respectively.
The Fund’s results compared favorably with the –3.32% average return of its Morningstar peer group, World Allocation Funds. It also outpaced the average return of its peers in the three-, five-, and 10-year periods ended October 31, 2018.
| 4 | | | DWS Global Income Builder Fund |
Table of Contents
The world financial markets experienced mixed results in the past year, with healthy gains for U.S. equities but weaker performance for most other categories. The strength of the U.S. economy was the primary driver of the divergent returns across asset classes. Spurred on by the combination of reduced regulation and lower taxes, the U.S. economy accelerated at a faster pace than most other developed markets. Improving growth, in turn, fueled better-than-expected corporate earnings. Together, these factors helped U.S. equities close the 12-month period with a positive return despite their sharp sell-off in October. Conversely, international stocks finished in the red due to the combination of slower growth overseas and the poor showing for foreign currencies against the U.S. dollar. Growth stocks remained in high demand throughout the period, while defensive dividend-payers generally underperformed.
The strong U.S. economy prompted the U.S. Federal Reserve (Fed) to tighten policy by raising interest rates and continuing to unwind its stimulative quantitative easing program. U.S. Treasury yields rose as a result, pressuring returns across the investment-grade category. Rising rates also contributed to a downturn in emerging-markets debt, as did uncertainty surrounding U.S. trade policy, political instability in a number of emerging countries, and the strong U.S. dollar. On the other end of the spectrum, high-yield bonds performed relatively well as the robust U.S. economy provided support to lower-rated issuers.
Fund Performance
The Fund’s broader asset allocation was the largest contributor to its 12-month results. We averaged weightings of approximately 68% in equities and 32% in bonds, which contributed to returns versus the 50/50 benchmark due to stocks’ strong relative performance. We consistently held an overweight in stocks on the belief that they were likely to outperform bonds at a time of healthy global growth and tighter Fed policy, and that indeed proved to be the case in both the past year and the time since we first established the overweight in mid-2016. With that said, this aspect of our positioning was a detractor in the October selloff. Although we reduced the equity allocation somewhat in June by taking it down to just under 59%, the remaining overweight was nonetheless a headwind to performance late in the period. We sought to capitalize on the selloff by boosting the equity weighting back above 64% in late October through an increased allocation to international stocks.
| DWS Global Income Builder Fund | | | 5 |
Table of Contents
Stock selection also contributed to returns, as the Fund’s stock portfolio posted a gain and outpaced the equity portion of the 50/50 index. We generated the best results in the industrials, energy, and real estate sectors, which offset our somewhat weaker showing in communications services and financials. At the individual stock level, key contributors included overweight positions in the U.S. technology giants Apple, Inc., Microsoft Corp., and Amazon.com, Inc., as well as in the Russian energy company LUKOIL PJSC.
| “We | averaged allocations of about 68% in equities and 32% in bonds, which contributed to returns versus the 50/50 benchmark due to stocks’ strong relative performance.” |
We maintained our approach of holding core positions consistent with our longer-term views, and then adjusting these weightings in a tactical fashion as market conditions warranted. Throughout the course of the past year, for instance, we periodically adjusted the Fund’s weightings in Europe, the emerging markets, real estate investment trusts, and other market segments in order to take advantage of volatility by capturing relative values. This flexible approach, which we believe is well suited to volatile market conditions, has added value since we began managing the Fund’s equity portfolio in March 2016.
The Fund’s bond portfolio underperformed the fixed-income benchmark, primarily as a result of an overweight position in the emerging markets. At the peak in late 2017, the Fund’s allocation to the asset class was above 30%. While this aspect of our positioning helped performance in the early part of the period, it acted as a sizable detractor once emerging-markets debt turned lower in 2018. Holdings in local-currency issues had the largest adverse impact on results, with positions in Indonesia, Mexico, and the VanEck Vectors J.P. Morgan EM Local Currency Bond ETF* all detracting from performance. An allocation to Argentina, which came under pressure from the combination of rising inflation and weaker growth prospects, also detracted. We pared back the Fund’s weighting in the emerging markets in mid-2018 by eliminating its investments in local-currency debt and modestly reducing its allocation to hard-currency issues. While we expect additional volatility in the near term, we continue to have a positive long-term view on the asset class. We view the Africa/Middle East region as a particularly attractive longer-term opportunity.
| 6 | | | DWS Global Income Builder Fund |
Table of Contents
The Fund’s overweight in domestic high-yield bonds, which provided outsize exposure to one of the best-performing areas of the market, made the largest contribution to results. We saw a large allocation to high yield as being appropriate at a time of strong economic growth, low defaults, and robust investor sentiment. The portfolio also benefited from our decision to keep its duration (interest-rate sensitivity) below that of the benchmark at a time of rising yields.
The Fund used derivatives during the course of the period. On the equity side, the Fund used futures on equity indices to achieve its desired weightings in a more efficient manner than buying and selling individual securities. In the bond portfolio, we used credit default swaps to facilitate exposure to the high-yield market, along with derivatives to manage the foreign currency exposure of certain positions in foreign bonds. We also used interest-rate futures and swaps to manage the Fund’s duration. In the aggregate, our use of derivatives was a small net contributor. Derivatives are used to achieve the Fund’s risk and return objectives and should therefore be evaluated within the context of the entire portfolio rather than as a standalone strategy.
Outlook and Positioning
Consistent with the Fund’s income orientation, we maintained an emphasis on conservative, dividend-paying equities. This category has trailed the broader market in recent years amid the continued flows into faster-growing and momentum-driven stocks. Although this trend has been a somewhat headwind for the Fund, we also believe it creates the latitude for a mean reversion in dividend stocks’ relative performance over the next 12-24 months. At the close of the period, we maintained a globally diversified equity portfolio with overweights in Japan and higher-quality U.S. large caps. The portfolio was underweight in Europe and the emerging markets for most of the period, but we moved closer to a neutral weighting in late October.
Our positioning in fixed income reflects our belief that the investment environment remains generally stable despite the disruptions that occurred in the latter half of the period. Economic growth is strong enough to support performance in the credit sectors, and the Fed continues to employ a gradual approach designed to minimize uncertainty. Nevertheless, we remain alert for potential risks stemming from issues such as trade policy, inflation, instability in the emerging markets, and headlines related to U.S. politics. We believe these circumstances argue
| DWS Global Income Builder Fund | | | 7 |
Table of Contents
for a continued emphasis on the credit sectors, but with close attention to risk factors that may call for a more defensive approach. More broadly speaking, we are maintaining a yield-focused strategy while also taking great care to maintain appropriate liquidity and manage the risks inherent in the fixed-income portfolio.
| * | Not held in the portfolio as of October 31, 2018. |
Portfolio Management Team
John D. Ryan, Managing Director
Portfolio Manager of the Fund. Began managing the Fund in 2012.
| – | Joined DWS in 2010 from Northern Trust where he served as a senior portfolio manager. Previously, he served as portfolio manager and head of credit trading for Deutsche Asset Management from 1998–2003. |
| – | Portfolio Manager for US and UK Unconstrained Funds: London. |
| – | Investment industry experience began in 1993. |
| – | BA in Economics, University of Chicago; MBA, University of Chicago. |
Darwei Kung, Managing Director
Portfolio Manager of the Fund. Began managing the Fund in 2015.
| – | Joined DWS in 2006; previously has worked as a Director, Engineering and Business Development at Calpoint LLC from 2001–2004. |
| – | Portfolio Manager: New York. |
| – | BS and MS, University of Washington, Seattle; MS and MBA, Carnegie Mellon University. |
Di Kumble, CFA, Managing Director
Portfolio Manager of the Fund. Began managing the Fund in 2017.
| – | Joined DWS in 2003 with seven years of industry experience. Prior to joining, she served as a Portfolio Manager at Graham Capital Management. Previously, she worked as a Quantitative Strategist at ITG Inc. and Morgan Stanley. |
| – | Senior Portfolio Manager, Head of Tax Managed Equities: New York. |
| – | BS, Beijing University; PhD in Chemistry, Princeton University. |
Kevin Bliss, Director
Portfolio Manager of the Fund. Began managing the Fund in 2017.
| – | Joined DWS in 2000. Prior to his current role, he served as a rates and credit portfolio manager in London from 2009 to 2016. |
| – | Fixed Income Portfolio Manager: New York. |
| – | BA in International Relations (Concentration in Security Studies, Minor in Business), Boston University. |
Dokyoung Lee, CFA, Director
Portfolio Manager of the Fund. Began managing the Fund on December 6, 2018.
| – | Joined DWS in 2018 with 24 years of industry experience; previously, worked as Head of Research and Portfolio Manager in the Global Multi-Asset Group at Oppenheimer Funds, and in research and portfolio management roles at AllianceBernstein. |
| – | BSE, Princeton University. |
The views expressed reflect those of the portfolio management team only through the end of the period of the report as stated on the cover. The management team's views are subject to change at any time based on market and other conditions and should not be construed as a recommendation. Past performance is no guarantee of future results. Current and future portfolio holdings are subject to risk.
| 8 | | | DWS Global Income Builder Fund |
Table of Contents
Terms to Know
The S&P Target Risk Moderate Index offers significant exposure to fixed income, while also increasing opportunities for higher returns through equities.
The Blended Index consists of an equally weighted blend (50%/50%) of the MSCI World High Dividend Yield Index and Bloomberg Barclays U.S. Universal Index.
The MSCI World High Dividend Yield Index includes securities that offer a meaningfully higher-than-average dividend yield relative to the MSCI World Index and pass dividend sustainability and persistence screens. The index offers broad market coverage, and is free-float market capitalization-weighted to ensure that its performance can be replicated in institutional and retail portfolios. The index is calculated using closing local market prices and translates into U.S. dollars using the London close foreign exchange rates. The Bloomberg Barclays U.S. Universal Index represents the union of the U.S. Aggregate Index, U.S. Corporate High-Yield Index, Investment Grade 144A Index, Eurodollar Index, U.S. Emerging Markets Index, and the non-ERISA eligible portion of the CMBS Index.
Morningstar World Allocation portfolios seek to provide both capital appreciation and income by investing in three major areas: stocks, bonds, and cash. The average category returns for the one-, three-, five- and 10-year periods ending 10/31/18 were -3.32%, 4.05%, 2.82% and 7.14%, respectively.
Index returns do not reflect any fees or expenses and it is not possible to invest directly into an index.
Contribution and detraction incorporate both a stock’s total return and its weighting in the Fund.
Overweight means the Fund holds a higher weighting in a given sector or security than the benchmark. Underweight means the Fund holds a lower weighting.
Duration measures the sensitivity of the price of a bond or bond fund to a change in interest rates.
A default occurs when an issuer fails to make an interest or principal payment on a bond.
An exchange-traded fund (ETF) is a security that tracks an index, a commodity or a basket of assets like an index fund but that trades like a stock on an exchange.
A swap is a derivative in which two counterparties exchange cash flows of one party’s financial instrument for those of the other party’s financial instrument for a set period of time.
Derivatives are contracts whose value is based on the performance of an underlying financial asset. Derivatives afford leverage, but when used by investors who are able to handle the inherent risks, can enhance returns or protect a portfolio. Derivatives experience significant losses if the underlying security moves contrary to the investor’s expectations.
A forward currency contract is a contract in the foreign exchange market that locks in the exchange rate for the purchase or sale of a currency on a future date as a means to hedge a fund’s currency risk.
Futures contracts are contractual agreements to buy or sell a particular commodity or financial instrument at a pre-determined price in the future.
| DWS Global Income Builder Fund | | | 9 |
Table of Contents
| Performance Summary | October 31, 2018 (Unaudited) |
| Class A | 1-Year | 5-Year | 10-Year | |||||||||
| Average Annual Total Returns as of 10/31/18 | ||||||||||||
| Unadjusted for Sales Charge | –1.11% | 3.83% | 7.24% | |||||||||
| Adjusted for the Maximum Sales Charge (max 5.75% load) | –6.80% | 2.61% | 6.60% | |||||||||
| S&P® Target Risk Moderate Index† | –1.25% | 3.89% | 6.20% | |||||||||
| Blended Index†† | –1.05% | 3.57% | 7.02% | |||||||||
| Class C | 1-Year | 5-Year | 10-Year | |||||||||
| Average Annual Total Returns as of 10/31/18 | ||||||||||||
| Unadjusted for Sales Charge | –1.80% | 3.05% | 6.39% | |||||||||
| Adjusted for the Maximum Sales Charge (max 1.00% CDSC) | –1.80% | 3.05% | 6.39% | |||||||||
| S&P® Target Risk Moderate Index† | –1.25% | 3.89% | 6.20% | |||||||||
| Blended Index†† | –1.05% | 3.57% | 7.02% | |||||||||
| Class R6 | 1-Year | Life of Class* | ||||||||||
| Average Annual Total Returns as of 10/31/18 | ||||||||||||
| No Sales Charges | –0.67% | 2.97% | ||||||||||
| S&P® Target Risk Moderate Index† | –1.25% | 3.14% | ||||||||||
| Blended Index†† | –1.05% | 2.75% | ||||||||||
| Class S | 1-Year | 5-Year | 10-Year | |||||||||
| Average Annual Total Returns as of 10/31/18 | ||||||||||||
| No Sales Charges | –0.79% | 4.07% | 7.47% | |||||||||
| S&P® Target Risk Moderate Index† | –1.25% | 3.89% | 6.20% | |||||||||
| Blended Index†† | –1.05% | 3.57% | 7.02% | |||||||||
| Institutional Class | 1-Year | 5-Year | 10-Year | |||||||||
| Average Annual Total Returns as of 10/31/18 | ||||||||||||
| No Sales Charges | –0.78% | 4.09% | 7.51% | |||||||||
| S&P® Target Risk Moderate Index† | –1.25% | 3.89% | 6.20% | |||||||||
| Blended Index†† | –1.05% | 3.57% | 7.02% | |||||||||
| 10 | | | DWS Global Income Builder Fund |
Table of Contents
Performance in the Average Annual Total Returns table(s) above and the Growth of an Assumed $10,000 Investment line graph that follows is historical and does not guarantee future results. Investment return and principal fluctuate, so your shares may be worth more or less when redeemed. Current performance may differ from performance data shown. Please visit dws.com for the Fund’s most recent month-end performance. Fund performance includes reinvestment of all distributions. Unadjusted returns do not reflect sales charges and would have been lower if they had.
The gross expense ratios of the Fund, as stated in the fee table of the prospectus dated March 1, 2018 are 0.95%, 1.78%, 0.61%, 0.74% and 0.73% for Class A, Class C, Class R6, Class S and Institutional Class shares, respectively, and may differ from the expense ratios disclosed in the Financial Highlights tables in this report.
Index returns do not reflect any fees or expenses and it is not possible to invest directly into an index.
Performance figures do not reflect the deduction of taxes that a shareholder would pay on fund distributions or the redemption of fund shares.
Generally accepted accounting principles require adjustments to be made to the net assets of the Fund at period end for financial reporting purposes only, and as such, the total return based on the unadjusted net asset value per share may differ from the total return reported in the financial highlights.
Growth of an Assumed $10,000 Investment (Adjusted for Maximum Sales Charge) |
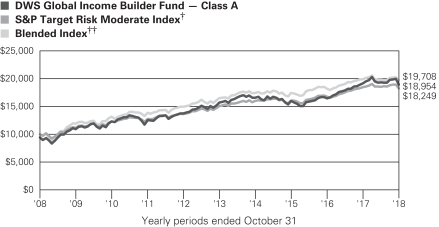
The Fund’s growth of an assumed $10,000 investment is adjusted for the maximum sales charge of 5.75%. This results in a net initial investment of $9,425.
The growth of $10,000 is cumulative.
Performance of other share classes will vary based on the sales charges and the fee structure of those classes.
| DWS Global Income Builder Fund | | | 11 |
Table of Contents
| * | Class R6 shares commenced operations on August 25, 2014. The performance shown for the Blended Index is for the time period of August 31, 2014 through October 31, 2018, which is based on the performance period of the life of Class R6. |
| † | The S&P Target Risk Moderate Index offers significant exposure to fixed income, while also increasing opportunities for higher returns through equities. |
| †† | The Blended Index consists of an equally weighted blend (50%/50%) of the MSCI World High Dividend Yield Index and Bloomberg Barclays U.S. Universal Index. |
MSCI World High Dividend Yield Index includes securities that offer a meaningfully higher-than-average dividend yield relative to the MSCI World Index and pass dividend sustainability and persistence screens. The index offers broad market coverage, and is free-float market capitalization-weighted to ensure that its performance can be replicated in institutional and retail portfolios. The index is calculated using closing local market prices and translates into US dollars using the London close foreign exchange rates. |
Bloomberg Barclays U.S. Universal Index represents the union of the U.S. Aggregate Index, the U.S. High-Yield Corporate Index, the 144A Index, the Eurodollar Index, the Emerging Markets Index and the non-ERISA portion of the CMBS Index. |
| 12 | | | DWS Global Income Builder Fund |
Table of Contents
| DWS Global Income Builder Fund | | | 13 |
Table of Contents
Five Largest Equity Holdings at October 31, 2018 (4.8% of Net Assets) | Percent | |||||
| 1 | Apple, Inc. | 1.4% | ||||
| Designs, manufactures and markets personal computing and mobile communication devices | ||||||
| 2 | Microsoft Corp. | 1.1% | ||||
| Develops, manufactures, licenses, sells and supports software products | ||||||
| 3 | AT&T, Inc. | 0.8% | ||||
| Provides communications and digital entertainment services | ||||||
| 4 | Amazon.com, Inc. | 0.8% | ||||
| Online retailer offering a wide range of products | ||||||
| 5 | JPMorgan Chase & Co. | 0.7% | ||||
| Operates as a financial services company worldwide | ||||||
| Five Largest Fixed-Income Long-Term Securities at October 31, 2018 (4.0% of Net Assets) | Percent | |||||
| 1 | Dryden 55 CLO Ltd. | 1.1% | ||||
| 3.986%, 4/15/2031 | ||||||
| 2 | Apidos CLO XXIX | 1.1% | ||||
| 3.942%, 7/25/2030 | ||||||
| 3 | Royal Bank of Scotland Group PLC | 0.7% | ||||
| 7.500%, 8/10/2020 | ||||||
| 4 | Neuberger Berman CLO Ltd | 0.6% | ||||
| 4.069%, 4/20/2030 | ||||||
| 5 | Barclays PLC | 0.5% | ||||
| 4.836%, 5/9/2028 | ||||||
Portfolio holdings and characteristics are subject to change.
For more complete details about the Fund’s investment portfolio, see page 15. A quarterly Fact Sheet is available on dws.com or upon request. Please see the Account Management Resources section on page 85 for contact information.
| 14 | | | DWS Global Income Builder Fund |
Table of Contents
| Investment Portfolio | as of October 31, 2018 | |||
| Shares | Value ($) | |||||||
| Common Stocks 53.2% | ||||||||
| Communication Services 5.7% | ||||||||
Diversified Telecommunication Services 2.7% | ||||||||
AT&T, Inc. | 115,115 | 3,531,728 | ||||||
BCE, Inc. | 30,311 | 1,173,114 | ||||||
BT Group PLC | 386,099 | 1,187,639 | ||||||
Deutsche Telekom AG (Registered) | 68,441 | 1,123,686 | ||||||
Elisa Oyj | 20,774 | 826,567 | ||||||
Nippon Telegraph & Telephone Corp. | 21,600 | 897,829 | ||||||
Orange SA | 52,337 | 818,665 | ||||||
Proximus SA | 32,624 | 835,082 | ||||||
Singapore Telecommunications Ltd. | 427,600 | 970,011 | ||||||
Swisscom AG (Registered) | 2,792 | 1,277,177 | ||||||
Telefonica SA | 106,273 | 870,900 | ||||||
Telenor ASA | 42,318 | 775,604 | ||||||
Telia Co. AB | 215,569 | 971,364 | ||||||
TELUS Corp. | 35,497 | 1,215,545 | ||||||
Verizon Communications, Inc. | 58,540 | 3,342,049 | ||||||
|
| |||||||
| 19,816,960 | ||||||||
Entertainment 0.4% | ||||||||
NetEase, Inc. (ADR) | 5,954 | 1,237,539 | ||||||
Walt Disney Co. | 13,570 | 1,558,243 | ||||||
|
| |||||||
| 2,795,782 | ||||||||
Interactive Media & Services 1.3% | ||||||||
Alphabet, Inc. “A”* | 2,133 | 2,326,207 | ||||||
Alphabet, Inc. “C”* | 2,279 | 2,453,959 | ||||||
Baidu, Inc. (ADR)* | 6,298 | 1,196,998 | ||||||
Facebook, Inc. “A”* | 15,818 | 2,401,014 | ||||||
Tencent Holdings Ltd. (ADR) | 41,104 | 1,411,100 | ||||||
|
| |||||||
| 9,789,278 | ||||||||
Media 1.0% | ||||||||
Comcast Corp. “A” | 39,998 | 1,525,524 | ||||||
Eutelsat Communications SA | 34,377 | 698,498 | ||||||
Interpublic Group of Companies, Inc. | 36,831 | 853,006 | ||||||
ITV PLC | 382,684 | 728,367 | ||||||
Omnicom Group, Inc. | 13,359 | 992,841 | ||||||
SES SA “A” (ADR) | 35,818 | 771,676 | ||||||
Shaw Communications, Inc. “B” | 43,333 | 806,785 | ||||||
WPP PLC | 56,888 | 645,241 | ||||||
|
| |||||||
| 7,021,938 | ||||||||
The accompanying notes are an integral part of the financial statements.
| DWS Global Income Builder Fund | | | 15 |
Table of Contents
| Shares | Value ($) | |||||||
Wireless Telecommunication Services 0.3% | ||||||||
KDDI Corp. | 37,800 | 928,678 | ||||||
NTT DoCoMo, Inc. | 57,100 | 1,435,644 | ||||||
|
| |||||||
| 2,364,322 | ||||||||
| Consumer Discretionary 5.4% | ||||||||
Auto Components 0.2% | ||||||||
Bridgestone Corp. | 23,700 | 915,836 | ||||||
Nokian Renkaat Oyj | 21,522 | 684,523 | ||||||
|
| |||||||
| 1,600,359 | ||||||||
Automobiles 1.1% | ||||||||
Daimler AG (Registered) | 25,921 | 1,535,174 | ||||||
General Motors Co. | 29,351 | 1,073,953 | ||||||
Honda Motor Co., Ltd. | 45,900 | 1,318,270 | ||||||
Nissan Motor Co., Ltd. | 176,200 | 1,605,300 | ||||||
Subaru Corp. | 34,500 | 930,690 | ||||||
Toyota Motor Corp. | 31,900 | 1,871,530 | ||||||
|
| |||||||
| 8,334,917 | ||||||||
Diversified Consumer Services 0.2% | ||||||||
New Oriental Education & Technology Group, Inc. (ADR)* | 23,013 | 1,346,491 | ||||||
Hotels, Restaurants & Leisure 1.0% | ||||||||
Carnival Corp. | 14,360 | 804,734 | ||||||
Darden Restaurants, Inc. | 9,843 | 1,048,772 | ||||||
Las Vegas Sands Corp. | 19,400 | 989,982 | ||||||
McDonald’s Corp. | 10,218 | 1,807,564 | ||||||
Sands China Ltd. | 191,600 | 759,287 | ||||||
Starbucks Corp. | 19,544 | 1,138,829 | ||||||
TUI AG | 44,844 | 744,602 | ||||||
|
| |||||||
| 7,293,770 | ||||||||
Household Durables 0.5% | ||||||||
Berkeley Group Holdings PLC | 18,292 | 818,606 | ||||||
Garmin Ltd. | 15,048 | 995,576 | ||||||
Leggett & Platt, Inc. | 20,980 | 761,784 | ||||||
Sekisui House Ltd. | 66,300 | 974,635 | ||||||
|
| |||||||
| 3,550,601 | ||||||||
Internet & Direct Marketing Retail 1.1% | ||||||||
Alibaba Group Holding Ltd. (ADR)* | 9,918 | 1,411,133 | ||||||
Amazon.com, Inc.* | 3,472 | 5,548,291 | ||||||
Ctrip.com International Ltd. (ADR)* | 29,302 | 975,170 | ||||||
|
| |||||||
| 7,934,594 | ||||||||
Leisure Products 0.3% | ||||||||
Bandai Namco Holdings, Inc. | 22,300 | 792,354 | ||||||
Hasbro, Inc. (a) | 8,177 | 749,913 | ||||||
The accompanying notes are an integral part of the financial statements.
| 16 | | | DWS Global Income Builder Fund |
Table of Contents
| Shares | Value ($) | |||||||
Sega Sammy Holdings, Inc. | 58,300 | 749,147 | ||||||
|
| |||||||
| 2,291,414 | ||||||||
Multiline Retail 0.2% | ||||||||
Marks & Spencer Group PLC | 259,745 | 980,499 | ||||||
Target Corp. | 9,548 | 798,499 | ||||||
|
| |||||||
| 1,778,998 | ||||||||
Specialty Retail 0.2% | ||||||||
Home Depot, Inc. | 9,113 | 1,602,794 | ||||||
Textiles, Apparel & Luxury Goods 0.6% | ||||||||
Cie Financiere Richemont SA (Registered) | 10,908 | 796,191 | ||||||
LVMH Moet Hennessy Louis Vuitton SE | 2,688 | 818,511 | ||||||
NIKE, Inc. “B” | 11,865 | 890,349 | ||||||
Tapestry, Inc. | 18,509 | 783,116 | ||||||
VF Corp. | 9,670 | 801,450 | ||||||
|
| |||||||
| 4,089,617 | ||||||||
| Consumer Staples 4.2% | ||||||||
Beverages 0.8% | ||||||||
Ambev SA (ADR) | 179,522 | 777,330 | ||||||
Anheuser-Busch InBev SA | 9,842 | 726,742 | ||||||
Coca-Cola Co. | 51,903 | 2,485,116 | ||||||
PepsiCo, Inc. | 16,906 | 1,899,896 | ||||||
|
| |||||||
| 5,889,084 | ||||||||
Food & Staples Retailing 0.5% | ||||||||
Lawson, Inc. | 14,100 | 889,678 | ||||||
Sysco Corp. | 12,005 | 856,317 | ||||||
Walmart, Inc. | 14,184 | 1,422,371 | ||||||
Wesfarmers Ltd. | 23,967 | 792,057 | ||||||
|
| |||||||
| 3,960,423 | ||||||||
Food Products 1.3% | ||||||||
Archer-Daniels-Midland Co. | 19,328 | 913,248 | ||||||
Bunge Ltd. | 12,300 | 760,140 | ||||||
General Mills, Inc. | 18,893 | 827,513 | ||||||
Kellogg Co. | 12,113 | 793,159 | ||||||
Kraft Heinz Co. | 14,911 | 819,658 | ||||||
Marine Harvest ASA | 46,573 | 1,127,589 | ||||||
Mondelez International, Inc. “A” | 22,700 | 952,946 | ||||||
Nestle SA (Registered) | 30,514 | 2,577,409 | ||||||
The Hershey Co. | 8,038 | 861,272 | ||||||
|
| |||||||
| 9,632,934 | ||||||||
Household Products 0.6% | ||||||||
Colgate-Palmolive Co. | 12,779 | 760,989 | ||||||
Kimberly-Clark Corp. | 7,213 | 752,316 | ||||||
Procter & Gamble Co. | 32,339 | 2,867,823 | ||||||
|
| |||||||
| 4,381,128 | ||||||||
The accompanying notes are an integral part of the financial statements.
| DWS Global Income Builder Fund | | | 17 |
Table of Contents
| Shares | Value ($) | |||||||
Tobacco 1.0% | ||||||||
Altria Group, Inc. | 29,231 | 1,901,184 | ||||||
British American Tobacco PLC | 24,923 | 1,081,806 | ||||||
Imperial Brands PLC | 33,072 | 1,121,024 | ||||||
Japan Tobacco, Inc. | 34,600 | 886,830 | ||||||
Philip Morris International, Inc. | 22,856 | 2,012,928 | ||||||
|
| |||||||
| 7,003,772 | ||||||||
| Energy 5.0% | ||||||||
Oil, Gas & Consumable Fuels | ||||||||
BP PLC | 299,277 | 2,163,329 | ||||||
Chevron Corp. | 22,564 | 2,519,271 | ||||||
Enagas SA | 32,451 | 861,636 | ||||||
Enbridge, Inc. | 31,764 | 989,752 | ||||||
Eni SpA | 43,370 | 770,553 | ||||||
Exxon Mobil Corp. | 49,358 | 3,932,845 | ||||||
Gazprom PJSC (ADR) | 570,144 | 2,679,677 | ||||||
Inter Pipeline Ltd. | 67,553 | 1,095,565 | ||||||
Kinder Morgan, Inc. | 57,028 | 970,617 | ||||||
LUKOIL PJSC (ADR) | 43,095 | 3,216,611 | ||||||
Occidental Petroleum Corp. | 14,859 | 996,593 | ||||||
ONEOK, Inc. | 18,168 | 1,191,821 | ||||||
Pembina Pipeline Corp. | 27,926 | 903,254 | ||||||
Phillips 66 | 8,307 | 854,126 | ||||||
Plains GP Holdings LP “A” | 37,508 | 801,546 | ||||||
Repsol SA | 54,147 | 969,738 | ||||||
Royal Dutch Shell PLC “A” | 71,126 | 2,267,649 | ||||||
Royal Dutch Shell PLC “B” | 60,025 | 1,963,070 | ||||||
Snam SpA | 203,750 | 843,340 | ||||||
Targa Resources Corp. | 30,876 | 1,595,363 | ||||||
Tatneft PJSC (ADR) (a) | 12,554 | 891,334 | ||||||
TOTAL SA | 29,311 | 1,719,328 | ||||||
TransCanada Corp. | 21,343 | 804,790 | ||||||
Valero Energy Corp. | 7,584 | 690,827 | ||||||
Williams Companies, Inc. | 34,835 | 847,535 | ||||||
|
| |||||||
| 36,540,170 | ||||||||
| Financials 7.7% | ||||||||
Banks 4.8% | ||||||||
Aozora Bank Ltd. | 24,100 | 834,220 | ||||||
Australia & New Zealand Banking Group Ltd. | 48,852 | 901,411 | ||||||
Banco Bradesco SA (ADR) (Preferred) | 119,960 | 1,100,033 | ||||||
Bank of America Corp. | 74,634 | 2,052,435 | ||||||
Bank of Montreal (a) | 10,040 | 750,683 | ||||||
Bank of Nova Scotia | 18,846 | 1,011,409 | ||||||
Bank of Queensland Ltd. | 116,998 | 802,832 | ||||||
The accompanying notes are an integral part of the financial statements.
| 18 | | | DWS Global Income Builder Fund |
Table of Contents
| Shares | Value ($) | |||||||
BB&T Corp. | 16,834 | 827,559 | ||||||
BNP Paribas SA | 14,588 | 762,087 | ||||||
Canadian Imperial Bank of Commerce (a) | 10,120 | 873,897 | ||||||
Citigroup, Inc. | 16,171 | 1,058,554 | ||||||
Commonwealth Bank of Australia | 23,512 | 1,157,248 | ||||||
Danske Bank AS | 41,468 | 795,783 | ||||||
HSBC Holdings PLC | 262,472 | 2,157,634 | ||||||
Japan Post Bank Co., Ltd. | 70,600 | 824,304 | ||||||
JPMorgan Chase & Co. | 28,265 | 3,081,450 | ||||||
Lloyds Banking Group PLC | 1,231,904 | 899,439 | ||||||
Mizuho Financial Group, Inc. | 528,600 | 910,849 | ||||||
National Australia Bank Ltd. | 71,166 | 1,274,992 | ||||||
Nordea Bank Abp | 97,359 | 846,945 | ||||||
People’s United Financial, Inc. | 48,516 | 759,761 | ||||||
Royal Bank of Canada | 17,450 | 1,271,453 | ||||||
Sberbank of Russia PJSC (ADR) | 243,616 | 2,847,871 | ||||||
Skandinaviska Enskilda Banken AB “A” | 79,702 | 825,858 | ||||||
Sumitomo Mitsui Financial Group, Inc. | 22,300 | 876,157 | ||||||
Swedbank AB “A” | 38,338 | 862,951 | ||||||
Toronto-Dominion Bank | 17,771 | 985,845 | ||||||
U.S. Bancorp. | 16,057 | 839,299 | ||||||
Wells Fargo & Co. | 38,503 | 2,049,515 | ||||||
Westpac Banking Corp. | 64,661 | 1,231,534 | ||||||
|
| |||||||
| 35,474,008 | ||||||||
Capital Markets 0.1% | ||||||||
CME Group, Inc. | 4,804 | 880,285 | ||||||
Diversified Financial Services 0.3% | ||||||||
Berkshire Hathaway, Inc. “B”* | 6,507 | 1,335,757 | ||||||
Standard Life Aberdeen PLC | 197,986 | 683,735 | ||||||
|
| |||||||
| 2,019,492 | ||||||||
Insurance 2.3% | ||||||||
Admiral Group PLC | 31,398 | 808,324 | ||||||
Ageas | 16,718 | 836,603 | ||||||
Allianz SE (Registered) | 4,121 | 861,149 | ||||||
American Financial Group, Inc. | 7,750 | 775,233 | ||||||
Assicurazioni Generali SpA | 48,463 | 783,078 | ||||||
Aviva PLC | 138,304 | 757,736 | ||||||
AXA SA | 39,025 | 976,982 | ||||||
Baloise Holding AG (Registered) | 5,501 | 787,636 | ||||||
Chubb Ltd. | 7,715 | 963,681 | ||||||
Japan Post Holdings Co., Ltd. | 69,900 | 830,634 | ||||||
Legal & General Group PLC | 304,527 | 980,063 | ||||||
MetLife, Inc. | 18,376 | 756,907 | ||||||
Muenchener Rueckversicherungs-Gesellschaft AG (Registered) | 3,704 | 795,365 | ||||||
The accompanying notes are an integral part of the financial statements.
| DWS Global Income Builder Fund | | | 19 |
Table of Contents
| Shares | Value ($) | |||||||
Poste Italiane SpA 144A | 128,185 | 921,366 | ||||||
Power Financial Corp. | 36,262 | 780,909 | ||||||
Sampo Oyj “A” | 28,047 | 1,292,181 | ||||||
Swiss Re AG | 14,985 | 1,353,060 | ||||||
Zurich Insurance Group AG | 4,863 | 1,510,204 | ||||||
|
| |||||||
| 16,771,111 | ||||||||
Thrifts & Mortgage Finance 0.2% | ||||||||
New York Community Bancorp., Inc. | 161,511 | 1,547,275 | ||||||
| Health Care 4.9% | ||||||||
Biotechnology 0.6% | ||||||||
AbbVie, Inc. | 20,076 | 1,562,917 | ||||||
Amgen, Inc. | 9,122 | 1,758,630 | ||||||
Gilead Sciences, Inc. | 20,739 | 1,413,985 | ||||||
|
| |||||||
| 4,735,532 | ||||||||
Health Care Equipment & Supplies 0.3% | ||||||||
Abbott Laboratories | 13,779 | 949,924 | ||||||
Medtronic PLC | 12,445 | 1,117,810 | ||||||
|
| |||||||
| 2,067,734 | ||||||||
Health Care Providers & Services 0.4% | ||||||||
CVS Health Corp. | 11,027 | 798,245 | ||||||
UnitedHealth Group, Inc. | 8,772 | 2,292,562 | ||||||
|
| |||||||
| 3,090,807 | ||||||||
Pharmaceuticals 3.6% | ||||||||
Astellas Pharma, Inc. | 61,900 | 961,410 | ||||||
AstraZeneca PLC | 14,096 | 1,077,881 | ||||||
Bayer AG (Registered) | 9,340 | 714,831 | ||||||
Bristol-Myers Squibb Co. | 21,538 | 1,088,530 | ||||||
Daiichi Sankyo Co., Ltd. | 19,200 | 733,289 | ||||||
Eli Lilly & Co. | 13,557 | 1,470,121 | ||||||
GlaxoSmithKline PLC | 105,686 | 2,044,665 | ||||||
Johnson & Johnson | 31,603 | 4,424,104 | ||||||
Merck & Co., Inc. | 36,680 | 2,700,015 | ||||||
Novartis AG (Registered) | 26,874 | 2,351,266 | ||||||
Novo Nordisk AS ‘‘B” | 20,980 | 906,269 | ||||||
Pfizer, Inc. | 76,608 | 3,298,740 | ||||||
Roche Holding AG (Genusschein) | 10,290 | 2,502,176 | ||||||
Sanofi | 15,734 | 1,402,067 | ||||||
Takeda Pharmaceutical Co., Ltd. (a) | 22,700 | 928,341 | ||||||
|
| |||||||
| 26,603,705 | ||||||||
| Industrials 5.8% | ||||||||
Aerospace & Defense 1.1% | ||||||||
BAE Systems PLC | 107,982 | 725,090 | ||||||
Boeing Co. | 5,552 | 1,970,182 | ||||||
The accompanying notes are an integral part of the financial statements.
| 20 | | | DWS Global Income Builder Fund |
Table of Contents
| Shares | Value ($) | |||||||
General Dynamics Corp. | 4,100 | 707,578 | ||||||
Harris Corp. | 5,142 | 764,667 | ||||||
Lockheed Martin Corp. | 3,587 | 1,054,040 | ||||||
Northrop Grumman Corp. | 2,683 | 702,812 | ||||||
Raytheon Co. | 4,948 | 866,098 | ||||||
United Technologies Corp. | 9,771 | 1,213,656 | ||||||
|
| |||||||
| 8,004,123 | ||||||||
Air Freight & Logistics 0.2% | ||||||||
Royal Mail PLC | 207,841 | 953,544 | ||||||
United Parcel Service, Inc. “B” | 7,240 | 771,350 | ||||||
|
| |||||||
| 1,724,894 | ||||||||
Airlines 0.2% | ||||||||
Japan Airlines Co., Ltd. | 39,500 | 1,407,047 | ||||||
Building Products 0.1% |
| |||||||
Johnson Controls International PLC | 29,652 | 947,974 | ||||||
Resideo Technologies, Inc.* | 1,445 | 30,414 | ||||||
|
| |||||||
| 978,388 | ||||||||
Commercial Services & Supplies 0.4% |
| |||||||
Park24 Co., Ltd. | 26,000 | 684,252 | ||||||
Quad Graphics, Inc. | 10 | 154 | ||||||
Republic Services, Inc. | 12,216 | 887,859 | ||||||
Secom Co., Ltd. | 9,500 | 779,716 | ||||||
Waste Management, Inc. | 9,990 | 893,806 | ||||||
|
| |||||||
| 3,245,787 | ||||||||
Construction & Engineering 0.4% |
| |||||||
Kajima Corp. | 58,700 | 755,206 | ||||||
Obayashi Corp. | 87,900 | 777,347 | ||||||
Skanska AB “B” | 50,973 | 802,018 | ||||||
Taisei Corp. | 17,800 | 762,655 | ||||||
|
| |||||||
| 3,097,226 | ||||||||
Electrical Equipment 0.3% |
| |||||||
ABB Ltd. (Registered) | 38,248 | 769,847 | ||||||
Eaton Corp. PLC | 11,494 | 823,775 | ||||||
Emerson Electric Co. | 12,487 | 847,617 | ||||||
|
| |||||||
| 2,441,239 | ||||||||
Industrial Conglomerates 0.6% |
| |||||||
3M Co. | 6,694 | 1,273,600 | ||||||
General Electric Co. | 99,257 | 1,002,496 | ||||||
Honeywell International, Inc. | 8,669 | 1,255,445 | ||||||
Siemens AG (Registered) | 6,912 | 795,917 | ||||||
|
| |||||||
| 4,327,458 | ||||||||
The accompanying notes are an integral part of the financial statements.
| DWS Global Income Builder Fund | | | 21 |
Table of Contents
| Shares | Value ($) | |||||||
Machinery 0.8% |
| |||||||
Caterpillar, Inc. | 5,637 | 683,881 | ||||||
Cummins, Inc. | 5,460 | 746,327 | ||||||
Illinois Tool Works, Inc. | 6,093 | 777,284 | ||||||
Ingersoll-Rand PLC | 8,543 | 819,615 | ||||||
Kone Oyj “B” | 16,377 | 798,130 | ||||||
MAN SE | 8,342 | 869,193 | ||||||
Mitsubishi Heavy Industries Ltd. | 27,900 | 984,345 | ||||||
|
| |||||||
| 5,678,775 | ||||||||
Marine 0.1% |
| |||||||
Kuehne + Nagel International AG (Registered) | 5,697 | 791,586 | ||||||
Professional Services 0.5% |
| |||||||
Adecco Group AG (Registered) | 17,273 | 844,418 | ||||||
Nielsen Holdings PLC | 31,874 | 828,087 | ||||||
RELX PLC | 41,209 | 815,051 | ||||||
SGS SA (Registered) | 345 | 818,233 | ||||||
|
| |||||||
| 3,305,789 | ||||||||
Road & Rail 0.2% |
| |||||||
Aurizon Holdings Ltd. | 285,469 | 848,189 | ||||||
Union Pacific Corp. | 6,081 | 889,164 | ||||||
|
| |||||||
| 1,737,353 | ||||||||
Trading Companies & Distributors 0.9% |
| |||||||
Fastenal Co. | 15,628 | 803,436 | ||||||
ITOCHU Corp. | 64,600 | 1,200,857 | ||||||
Marubeni Corp. | 103,100 | 838,317 | ||||||
Mitsubishi Corp. | 39,900 | 1,126,042 | ||||||
Mitsui & Co., Ltd. | 78,300 | 1,311,093 | ||||||
Sumitomo Corp. | 71,200 | 1,082,732 | ||||||
|
| |||||||
| 6,362,477 | ||||||||
| Information Technology 9.2% |
| |||||||
Communications Equipment 0.8% |
| |||||||
Cisco Systems, Inc. | 66,082 | 3,023,252 | ||||||
Juniper Networks, Inc. | 30,700 | 898,589 | ||||||
Motorola Solutions, Inc. | 6,875 | 842,600 | ||||||
Nokia Oyj | 168,554 | 954,870 | ||||||
|
| |||||||
| 5,719,311 | ||||||||
Electronic Equipment, Instruments & Components 0.2% |
| |||||||
Corning, Inc. | 24,969 | 797,760 | ||||||
TE Connectivity Ltd. | 9,974 | 752,239 | ||||||
|
| |||||||
| 1,549,999 | ||||||||
IT Services 2.3% |
| |||||||
Accenture PLC “A” | 9,026 | 1,422,678 | ||||||
Automatic Data Processing, Inc. | 9,077 | 1,307,814 | ||||||
The accompanying notes are an integral part of the financial statements.
| 22 | | | DWS Global Income Builder Fund |
Table of Contents
| Shares | Value ($) | |||||||
Broadridge Financial Solutions, Inc. | 6,772 | 791,918 | ||||||
Cognizant Technology Solutions Corp. “A” | 14,261 | 984,437 | ||||||
Fidelity National Information Services, Inc. | 8,236 | 857,368 | ||||||
Infosys Ltd. (ADR) | 121,566 | 1,151,230 | ||||||
International Business Machines Corp. | 19,259 | 2,223,066 | ||||||
Leidos Holdings, Inc. | 15,570 | 1,008,625 | ||||||
MasterCard, Inc. “A” | 9,878 | 1,952,584 | ||||||
Otsuka Corp. | 24,200 | 803,368 | ||||||
Paychex, Inc. | 15,480 | 1,013,785 | ||||||
Visa, Inc. “A” | 18,057 | 2,489,157 | ||||||
Western Union Co. | 61,964 | 1,117,831 | ||||||
|
| |||||||
| 17,123,861 | ||||||||
Semiconductors & Semiconductor Equipment 1.8% |
| |||||||
Analog Devices, Inc. | 9,674 | 809,811 | ||||||
Broadcom, Inc. | 5,454 | 1,218,914 | ||||||
Intel Corp. | 49,752 | 2,332,374 | ||||||
KLA-Tencor Corp. | 8,582 | 785,596 | ||||||
Maxim Integrated Products, Inc. | 15,925 | 796,568 | ||||||
NVIDIA Corp. | 3,253 | 685,830 | ||||||
QUALCOMM., Inc. | 21,447 | 1,348,802 | ||||||
Taiwan Semiconductor Manufacturing Co., Ltd. (ADR) | 79,427 | 3,026,169 | ||||||
Texas Instruments, Inc. | 11,899 | 1,104,584 | ||||||
Tokyo Electron Ltd. | 6,200 | 863,680 | ||||||
|
| |||||||
| 12,972,328 | ||||||||
Software 2.0% |
| |||||||
Adobe, Inc.* | 3,636 | 893,583 | ||||||
CA, Inc. | 19,044 | 844,792 | ||||||
Intuit, Inc. | 3,919 | 826,909 | ||||||
Micro Focus International PLC | 54,125 | 842,077 | ||||||
Microsoft Corp. | 74,819 | 7,991,417 | ||||||
Oracle Corp. | 32,107 | 1,568,106 | ||||||
salesforce.com, Inc.* | 5,900 | 809,716 | ||||||
SAP SE | 7,241 | 775,059 | ||||||
|
| |||||||
| 14,551,659 | ||||||||
Technology Hardware, Storage & Peripherals 2.1% |
| |||||||
Apple, Inc. | 48,461 | 10,606,174 | ||||||
Canon, Inc. | 38,900 | 1,110,651 | ||||||
HP, Inc. | 34,877 | 841,931 | ||||||
Samsung Electronics Co., Ltd. (GDR) | 1,067 | 995,511 | ||||||
Seagate Technology PLC | 19,027 | 765,456 | ||||||
Xerox Corp. | 31,701 | 883,507 | ||||||
|
| |||||||
| 15,203,230 | ||||||||
The accompanying notes are an integral part of the financial statements.
| DWS Global Income Builder Fund | | | 23 |
Table of Contents
| Shares | Value ($) | |||||||
| Materials 0.5% |
| |||||||
Chemicals 0.4% |
| |||||||
Air Products & Chemicals, Inc. | 5,214 | 804,781 | ||||||
DowDuPont, Inc. | 19,354 | 1,043,568 | ||||||
GEO Specialty Chemicals, Inc.* (b) | 315,970 | 53,715 | ||||||
LyondellBasell Industries NV “A” | 10,802 | 964,294 | ||||||
|
| |||||||
| 2,866,358 | ||||||||
Paper & Forest Products 0.1% |
| |||||||
UPM-Kymmene Oyj | 22,835 | 735,379 | ||||||
| Real Estate 3.0% |
| |||||||
Equity Real Estate Investment Trusts (REITs) | ||||||||
Ascendas Real Estate Investment Trust | 439,900 | 800,387 | ||||||
AvalonBay Communities, Inc. | 4,830 | 847,085 | ||||||
Brookfield Property REIT, Inc. “A” | 64,100 | 1,236,489 | ||||||
Camden Property Trust | 9,090 | 820,554 | ||||||
Crown Castle International Corp. | 7,859 | 854,588 | ||||||
H&R Real Estate Investment Trust | 60,800 | 919,540 | ||||||
HCP, Inc. | 50,749 | 1,398,135 | ||||||
Iron Mountain, Inc. | 41,198 | 1,261,071 | ||||||
Kimco Realty Corp. | 71,638 | 1,152,655 | ||||||
Liberty Property Trust | 19,284 | 807,421 | ||||||
Mid-America Apartment Communities, Inc. | 8,612 | 841,479 | ||||||
National Retail Properties, Inc. | 23,956 | 1,119,943 | ||||||
Prologis, Inc. | 12,934 | 833,855 | ||||||
Public Storage | 4,348 | 893,384 | ||||||
Realty Income Corp. | 18,277 | 1,101,555 | ||||||
RioCan Real Estate Investment Trust | 48,865 | 890,850 | ||||||
Simon Property Group, Inc. | 6,794 | 1,246,835 | ||||||
Stockland | 284,067 | 725,138 | ||||||
The Macerich Co. | 17,854 | 921,623 | ||||||
Ventas, Inc. | 21,038 | 1,221,046 | ||||||
Vicinity Centres | 486,461 | 911,506 | ||||||
Welltower, Inc. | 20,998 | 1,387,338 | ||||||
|
| |||||||
| 22,192,477 | ||||||||
| Utilities 1.9% |
| |||||||
Electric Utilities 1.2% |
| |||||||
American Electric Power Co., Inc. | 11,720 | 859,779 | ||||||
Duke Energy Corp. | 13,959 | 1,153,432 | ||||||
Endesa SA | 43,255 | 906,187 | ||||||
Entergy Corp. | 11,107 | 932,433 | ||||||
Exelon Corp. | 20,629 | 903,757 | ||||||
Fortum Oyj | 36,182 | 762,909 | ||||||
NextEra Energy, Inc. | 5,193 | 895,793 | ||||||
The accompanying notes are an integral part of the financial statements.
| 24 | | | DWS Global Income Builder Fund |
Table of Contents
| Shares | Value ($) | |||||||
PPL Corp. | 31,548 | 959,059 | ||||||
Southern Co. | 34,233 | 1,541,512 | ||||||
|
| |||||||
| 8,914,861 | ||||||||
Multi-Utilities 0.7% |
| |||||||
CenterPoint Energy, Inc. | 29,134 | 786,909 | ||||||
Consolidated Edison, Inc. | 10,912 | 829,312 | ||||||
Dominion Energy, Inc | 13,427 | 958,956 | ||||||
Engie SA | 58,690 | 782,808 | ||||||
National Grid PLC | 82,682 | 874,465 | ||||||
WEC Energy Group, Inc. | 12,022 | 822,305 | ||||||
|
| |||||||
| 5,054,755 | ||||||||
| Total Common Stocks (Cost $382,798,523) | 392,195,655 | |||||||
| Preferred Stocks 5.6% |
| |||||||
| Communication Services 0.5% |
| |||||||
AT&T, Inc. 5.35% | 100,000 | 2,357,000 | ||||||
Verizon Communications, Inc. 5.9% | 60,000 | 1,527,000 | ||||||
|
| |||||||
| 3,884,000 | ||||||||
| Financials 3.5% |
| |||||||
Bank of America Corp. Series Y, 6.5% | 75,000 | 1,929,000 | ||||||
BB&T Corp. 5.625% | 75,000 | 1,878,750 | ||||||
Capital One Financial Corp. Series G, 5.2% | 100,000 | 2,311,000 | ||||||
Charles Schwab Corp. Series D, 5.95% | 75,000 | 1,938,750 | ||||||
Citigroup, Inc. Series S, 6.3% | 75,000 | 1,953,000 | ||||||
Fifth Third Bancorp. Series I, 6.625% | 75,000 | 2,052,750 | ||||||
JPMorgan Chase & Co. Series AA, 6.1% | 75,000 | 1,897,500 | ||||||
KeyCorp Series E, 6.125%* | 75,000 | 1,972,500 | ||||||
Morgan Stanley Series K, 5.85% | 75,000 | 1,890,000 | ||||||
PNC Financial Services Group, Inc. Series P, 6.125% | 75,000 | 1,976,250 | ||||||
Regions Financial Corp. Series B, 6.375% | 80,000 | 2,131,200 | ||||||
The Goldman Sachs Group, Inc. Series J, 5.5% | 73,000 | 1,842,520 | ||||||
Wells Fargo & Co. Series Y, 5.625% | 75,000 | 1,863,750 | ||||||
|
| |||||||
| 25,636,970 | ||||||||
| Real Estate 1.1% |
| |||||||
AGNC Investment Corp. Series C, 7.0% | 64,439 | 1,630,307 | ||||||
AGNC Investment Corp. Series B, 7.75% | 80,000 | 2,032,800 | ||||||
Kimco Realty Corp. Series L, 5.125% | 75,000 | 1,575,000 | ||||||
Prologis, Inc. Series Q, 8.54% | 236 | 14,974 | ||||||
Simon Property Group, Inc. Series J, 8.375% | 17,000 | 1,188,300 | ||||||
VEREIT, Inc. Series F, 6.7% | 75,000 | 1,866,000 | ||||||
|
| �� | ||||||
| 8,307,381 | ||||||||
The accompanying notes are an integral part of the financial statements.
| DWS Global Income Builder Fund | | | 25 |
Table of Contents
| Shares | Value ($) | |||||||
| Utilities 0.5% |
| |||||||
Dominion Energy, Inc. Series A, 5.25% | 60,000 | 1,383,600 | ||||||
Southern Co. 5.25% | 100,000 | 2,302,000 | ||||||
|
| |||||||
| 3,685,600 | ||||||||
| Total Preferred Stocks (Cost $44,523,393) |
| 41,513,951 | ||||||
| Warrant 0.0% |
| |||||||
| Materials |
| |||||||
Hercules Trust II, Expiration Date 3/31/2029* (b) | 506 | 15,995 | ||||||
| Principal Amount ($)(c) | Value ($) | |||||||
| Corporate Bonds 13.5% |
| |||||||
| Communication Services 1.9% |
| |||||||
Altice Financing SA, 144A, 7.5%, 5/15/2026 | 1,800,000 | 1,692,001 | ||||||
CCO Holdings LLC, 144A, 5.875%, 5/1/2027 | 2,035,000 | 1,999,387 | ||||||
CenturyLink, Inc., Series Y, 7.5%, 4/1/2024 (a) | 370,000 | 388,500 | ||||||
Cequel Communications Holdings I LLC, 144A, 5.125%, 12/15/2021 | 1,390,000 | 1,386,219 | ||||||
Clear Channel Worldwide Holdings, Inc., Series B, 6.5%, 11/15/2022 | 595,000 | 604,044 | ||||||
CSC Holdings LLC, 144A, 5.5%, 4/15/2027 | 1,800,000 | 1,728,000 | ||||||
DISH DBS Corp., 5.0%, 3/15/2023 (a) | 845,000 | 739,375 | ||||||
Expedia Group, Inc., 3.8%, 2/15/2028 | 820,000 | 742,198 | ||||||
MDC Partners, Inc., 144A, 6.5%, 5/1/2024 | 50,000 | 41,000 | ||||||
Netflix, Inc., 4.375%, 11/15/2026 (a) | 1,000,000 | 918,750 | ||||||
Sprint Corp., 7.125%, 6/15/2024 | 1,485,000 | 1,518,413 | ||||||
Virgin Media Secured Finance PLC, 144A, | 2,000,000 | 1,865,000 | ||||||
Zayo Group LLC, 6.375%, 5/15/2025 | 265,000 | 270,963 | ||||||
|
| |||||||
| 13,893,850 | ||||||||
| Consumer Discretionary 0.6% |
| |||||||
1011778 B.C. Unlimited Liability Co., 144A, | 2,000,000 | 1,875,000 | ||||||
American Axle & Manufacturing, Inc., | 1,750,000 | 1,651,562 | ||||||
Asbury Automotive Group, Inc., 6.0%, 12/15/2024 | 105,000 | 103,163 | ||||||
Dana, Inc., 5.5%, 12/15/2024 | 170,000 | 163,795 | ||||||
Penske Automotive Group, Inc., 5.5%, 5/15/2026 | 165,000 | 156,750 | ||||||
|
| |||||||
| 3,950,270 | ||||||||
| Consumer Staples 0.1% |
| |||||||
B&G Foods, Inc., 5.25%, 4/1/2025 (a) | 1,030,000 | 981,075 | ||||||
The accompanying notes are an integral part of the financial statements.
| 26 | | | DWS Global Income Builder Fund |
Table of Contents
| Principal Amount ($)(c) | Value ($) | |||||||
| Energy 4.7% |
| |||||||
Antero Resources Corp., 5.125%, 12/1/2022 | 440,000 | 436,975 | ||||||
Boardwalk Pipelines LP, 4.95%, 12/15/2024 | 2,000,000 | 2,018,829 | ||||||
Buckeye Partners LP, 3.95%, 12/1/2026 | 1,000,000 | 913,270 | ||||||
Cheniere Corpus Christi Holdings LLC, 5.875%, 3/31/2025 | 2,000,000 | 2,060,000 | ||||||
Chesapeake Energy Corp., 8.0%, 1/15/2025 (a) | 630,000 | 637,875 | ||||||
Crestwood Midstream Partners LP, 6.25%, 4/1/2023 | 2,000,000 | 2,040,000 | ||||||
CrownRock LP, 144A, 5.625%, 10/15/2025 | 1,000,000 | 951,250 | ||||||
Enbridge, Inc., 5.5%, 7/15/2077 | 1,500,000 | 1,333,796 | ||||||
Energy Transfer LP, 5.5%, 6/1/2027 | 1,000,000 | 1,016,550 | ||||||
EnLink Midstream Partners LP, 4.85%, 7/15/2026 | 1,500,000 | 1,418,729 | ||||||
Hilcorp Energy I LP, 144A, 5.75%, 10/1/2025 | 870,000 | 846,075 | ||||||
KazMunayGas National Co. JSC: |
| |||||||
144A, 4.4%, 4/30/2023 | 1,000,000 | 988,960 | ||||||
144A, 4.75%, 4/19/2027 | 2,000,000 | 1,955,516 | ||||||
Laredo Petroleum, Inc., 6.25%, 3/15/2023 | 210,000 | 206,325 | ||||||
Marathon Petroleum Corp., 144A, 5.125%, 12/15/2026 | 2,000,000 | 2,052,498 | ||||||
MEG Energy Corp., 144A, 6.5%, 1/15/2025 | 500,000 | 517,500 | ||||||
Oasis Petroleum, Inc., 6.875%, 3/15/2022 (a) | 549,000 | 552,431 | ||||||
Petrobras Global Finance BV, 5.299%, 1/27/2025 | 2,000,000 | 1,907,500 | ||||||
Petroleos Mexicanos, REG S, 3.75%, 2/21/2024 | EUR | 1,220,000 | 1,399,106 | |||||
Plains All American Pipeline LP, 2.85%, 1/31/2023 | 230,000 | 216,622 | ||||||
Range Resources Corp.: |
| |||||||
4.875%, 5/15/2025 (a) | 140,000 | 129,850 | ||||||
5.0%, 8/15/2022 | 2,000,000 | 1,965,000 | ||||||
5.875%, 7/1/2022 | 175,000 | 176,094 | ||||||
Resolute Energy Corp., 8.5%, 5/1/2020 | 1,000,000 | 997,500 | ||||||
Southwestern Energy Co., 7.75%, 10/1/2027 | 1,000,000 | 1,012,500 | ||||||
Targa Resources Partners LP, 5.375%, 2/1/2027 | 2,000,000 | 1,945,000 | ||||||
Weatherford International Ltd., 9.875%, 2/15/2024 (a) | 1,500,000 | 1,170,000 | ||||||
Whiting Petroleum Corp., 6.25%, 4/1/2023 | 985,000 | 997,313 | ||||||
WildHorse Resource Development Corp., 6.875%, 2/1/2025 | 1,000,000 | 995,000 | ||||||
WPX Energy, Inc., 5.25%, 9/15/2024 | 2,000,000 | 1,975,000 | ||||||
|
| |||||||
| 34,833,064 | ||||||||
| Financials 3.1% |
| |||||||
AerCap Ireland Capital DAC, 3.75%, 5/15/2019 | 70,000 | 70,137 | ||||||
Akbank Turk AS, 144A, 5.0%, 10/24/2022 | 500,000 | 455,116 | ||||||
Barclays PLC, 4.836%, 5/9/2028 | 4,300,000 | 3,968,661 | ||||||
BPCE SA, 144A, 4.875%, 4/1/2026 | 3,300,000 | 3,249,808 | ||||||
Credit Suisse Group AG, 144A, 7.5%, 12/11/2023 | 1,500,000 | 1,561,740 | ||||||
FS Investment Corp., 4.75%, 5/15/2022 | 310,000 | 307,658 | ||||||
HSBC Holdings PLC, 6.0%, 5/22/2027 | 1,500,000 | 1,380,000 | ||||||
The accompanying notes are an integral part of the financial statements.
| DWS Global Income Builder Fund | | | 27 |
Table of Contents
| Principal Amount ($)(c) | Value ($) | |||||||
Lincoln Finance Ltd., 144A, 7.375%, 4/15/2021 | 105,000 | 106,575 | ||||||
National Savings Bank, 144A, 5.15%, 9/10/2019 | 500,000 | 489,500 | ||||||
Royal Bank of Scotland Group PLC, 7.5%, 8/10/2020 | 5,000,000 | 5,082,500 | ||||||
TC Ziraat Bankasi AS: |
| |||||||
144A, 5.125%, 5/3/2022 | 1,000,000 | 887,420 | ||||||
144A, 5.125%, 9/29/2023 | 1,500,000 | 1,270,467 | ||||||
The Goldman Sachs Group, Inc., Series P, 5.0%, 11/10/2022 | 2,000,000 | 1,840,000 | ||||||
Westpac Banking Corp., 5.0%, 9/21/2027 (a) | 2,605,000 | 2,279,135 | ||||||
|
| |||||||
| 22,948,717 | ||||||||
| Health Care 0.2% |
| |||||||
Endo Dac: |
| |||||||
144A, 6.0%, 7/15/2023 | 230,000 | 197,800 | ||||||
144A, 6.0%, 2/1/2025 | 160,000 | 134,000 | ||||||
HCA, Inc., 5.25%, 6/15/2026 | 1,000,000 | 1,017,500 | ||||||
LifePoint Health, Inc., 5.375%, 5/1/2024 (a) | 45,000 | 47,196 | ||||||
|
| |||||||
| 1,396,496 | ||||||||
| Industrials 0.3% |
| |||||||
Bombardier, Inc., 144A, 5.75%, 3/15/2022 | 1,480,000 | 1,463,350 | ||||||
Masonite International Corp., 144A, 5.625%, 3/15/2023 | 116,000 | 115,275 | ||||||
Park Aerospace Holdings Ltd., 144A, 5.25%, 8/15/2022 | 850,000 | 843,625 | ||||||
|
| |||||||
| 2,422,250 | ||||||||
| Information Technology 0.0% |
| |||||||
Cardtronics, Inc., 5.125%, 8/1/2022 | 135,000 | 129,600 | ||||||
| Materials 1.8% |
| |||||||
AK Steel Corp., 7.0%, 3/15/2027 (a) | 2,500,000 | 2,212,500 | ||||||
Ardagh Packaging Finance PLC, 144A, 7.25%, 5/15/2024 | 2,000,000 | 2,010,000 | ||||||
Cascades, Inc., 144A, 5.5%, 7/15/2022 | 36,000 | 35,730 | ||||||
CF Industries, Inc., 144A, 4.5%, 12/1/2026 | 95,000 | 93,253 | ||||||
Chemours Co., 6.625%, 5/15/2023 | 905,000 | 925,363 | ||||||
Constellium NV, 144A, 6.625%, 3/1/2025 (a) | 1,000,000 | 980,000 | ||||||
Evraz Group SA, 144A, 5.375%, 3/20/2023 (a) | 1,600,000 | 1,572,000 | ||||||
Hexion, Inc., 6.625%, 4/15/2020 | 315,000 | 278,775 | ||||||
Metinvest BV, 144A, 7.75%, 4/23/2023 | 1,750,000 | 1,680,000 | ||||||
Teck Resources Ltd., 144A, 8.5%, 6/1/2024 | 50,000 | 54,250 | ||||||
United States Steel Corp., 6.875%, 8/15/2025 | 2,000,000 | 1,960,000 | ||||||
Vedanta Resources PLC, 144A, 7.125%, 5/31/2023 (a) | 1,800,000 | 1,689,750 | ||||||
|
| |||||||
| 13,491,621 | ||||||||
The accompanying notes are an integral part of the financial statements.
| 28 | | | DWS Global Income Builder Fund |
Table of Contents
| Principal Amount ($)(c) | Value ($) | |||||||
| Real Estate 0.3% |
| |||||||
Government Properties Income Trust, (REIT), 4.0%, 7/15/2022 | 555,000 | 547,172 | ||||||
Hospitality Properties Trust, (REIT), 3.95%, 1/15/2028 | 400,000 | 357,772 | ||||||
Omega Healthcare Investors, Inc., (REIT), 4.75%, 1/15/2028 (a) | 490,000 | 473,954 | ||||||
Select Income REIT: |
| |||||||
(REIT), 4.15%, 2/1/2022 | 260,000 | 256,061 | ||||||
(REIT), 4.25%, 5/15/2024 | 210,000 | 200,120 | ||||||
|
| |||||||
| 1,835,079 | ||||||||
| Utilities 0.5% |
| |||||||
AmeriGas Partners LP, 5.75%, 5/20/2027 | 2,000,000 | 1,855,000 | ||||||
Eskom Holdings SOC Ltd., 144A, 6.75%, 8/6/2023 | 800,000 | 748,000 | ||||||
NGL Energy Partners LP, 5.125%, 7/15/2019 | 175,000 | 175,437 | ||||||
NRG Energy, Inc., 6.25%, 5/1/2024 | 870,000 | 888,166 | ||||||
|
| |||||||
| 3,666,603 | ||||||||
| Total Corporate Bonds (Cost $105,271,971) | 99,548,625 | |||||||
| Asset-Backed 5.2% |
| |||||||
| Miscellaneous |
| |||||||
Apidos CLO XXIX, “A2”, Series 2018-29A, 144A, 3-month USD-LIBOR + 1.550%, | 8,500,000 | 8,498,827 | ||||||
Dell Equipment Finance Trust, “D”, Series 2017-1, 144A, 3.44%, 4/24/2023 | 980,000 | 973,415 | ||||||
Domino’s Pizza Master Issuer LLC, “A23”, Series 2017-1A, 144A, 4.118%, 7/25/2047 | 1,570,125 | 1,537,137 | ||||||
Dryden 55 CLO Ltd.: |
| |||||||
“B”, Series 2018-55A, 144A, 3-month USD-LIBOR + 1.550%, 3.986%** , 4/15/2031 | 8,500,000 | 8,499,872 | ||||||
“D”, Series 2018-55A, 144A, 3-month USD-LIBOR + 2.850%, 5.286%** , 4/15/2031 | 2,000,000 | 1,978,378 | ||||||
Dryden Senior Loan Fund, “B”, Series 2017-49A, 144A, 3-month USD-LIBOR + 1.700%, | 1,130,000 | 1,130,784 | ||||||
Hilton Grand Vacations Trust, “B”, Series 2014-AA, 144A, 2.07%, 11/25/2026 | 451,548 | 443,450 | ||||||
Jubilee CLO BV, “C1”, Series 2018-21A, 144A, 3-month EURIBOR + 2.500% floor, 2.5%**, 1/15/2032 (d) | EUR | 2,500,000 | 2,831,626 | |||||
Madison Park Funding XIV Ltd., “DRR”, Series 2014-14A, 144A, 3-month USD-LIBOR + 2.950%, 5.149%**, 10/22/2030 | 2,500,000 | 2,499,958 | ||||||
The accompanying notes are an integral part of the financial statements.
| DWS Global Income Builder Fund | | | 29 |
Table of Contents
| Principal Amount ($)(c) | Value ($) | |||||||
Neuberger Berman CLO Ltd.: |
| |||||||
“B”, Series 2018-28A, 144A, 3-month USD-LIBOR + 1.600%, 4.069%** , 4/20/2030 | 4,250,000 | 4,249,957 | ||||||
“D”, Series 2018-28A, 144A, 3-month USD-LIBOR + 2.850%, 5.319%** , 4/20/2030 | 1,000,000 | 989,291 | ||||||
Venture XXVIII CLO Ltd., “A2”, Series 2017-28A, 144A, 3-month USD-LIBOR + 1.110%, 3.579%**, 7/20/2030 | 2,000,000 | 1,994,936 | ||||||
Voya CLO Ltd., “CR”, Series 2016-3A, 144A, 3-month USD-LIBOR + 3.250%, 5.721%**, 10/18/2031 | 2,000,000 | 2,000,000 | ||||||
Wendy’s Funding LLC, “A2I”, Series 2018-1A, 144A, 3.573%, 3/15/2048 | 923,025 | 886,122 | ||||||
| ||||||||
| Total Asset-Backed (Cost $38,636,904) |
| 38,513,753 | ||||||
| Mortgage-Backed Securities Pass-Throughs 0.3% |
| |||||||
Federal Home Loan Mortgage Corp., 6.0%, 11/1/2021 | 19,816 | 21,392 | ||||||
Federal National Mortgage Association, 4.0%, 12/1/2042 | 2,189,215 | 2,205,845 | ||||||
Government National Mortgage Association, 6.5%, 8/20/2034 | 48,187 | 54,537 | ||||||
| ||||||||
| Total Mortgage-Backed Securities Pass-Throughs (Cost $2,388,085) |
| 2,281,774 | ||||||
| Commercial Mortgage-Backed Securities 0.4% |
| |||||||
BX Commercial Mortgage Trust, “D”, Series 2018-IND, 144A, 1-month USD-LIBOR + 1.300%, 3.58%**, 11/15/2035 | 1,000,000 | 1,001,855 | ||||||
FHLMC Multifamily Structured Pass-Through Certificates, “X1”, Series K043, Interest Only, 0.543%**, 12/25/2024 | 7,393,164 | 209,097 | ||||||
GMAC Commercial Mortgage Securities, Inc., “G”, Series 2004-C1, 144A, 5.455%, 3/10/2038 | 2,165,159 | 2,004,616 | ||||||
| ||||||||
| Total Commercial Mortgage-Backed Securities (Cost $3,389,723) |
| 3,215,568 | ||||||
| Collateralized Mortgage Obligations 2.9% |
| |||||||
Fannie Mae Connecticut Avenue Securities: |
| |||||||
“1M2”, Series 2018-C06, 1-month USD-LIBOR + 2.000%, 4.281%** , 3/25/2031 | 1,041,667 | 1,028,026 | ||||||
“1M1”, Series 2016-C02, 1-month USD-LIBOR + 2.150%, 4.431%** , 9/25/2028 | 200,203 | 200,850 | ||||||
“1M2”, Series 2018-C03, 1-month USD-LIBOR + 2.150%, 4.431%** , 10/25/2030 | 1,000,000 | 998,048 | ||||||
The accompanying notes are an integral part of the financial statements.
| 30 | | | DWS Global Income Builder Fund |
Table of Contents
| Principal Amount ($)(c) | Value ($) | |||||||
“1M2”, Series 2018-C05, 1-month USD-LIBOR + 2.350%, 4.631%** , 1/25/2031 | 2,400,000 | 2,411,912 | ||||||
Federal Home Loan Mortgage Corp.: |
| |||||||
“H”, Series 4685, 4.0%, 8/15/2044 | 2,663,318 | 2,703,363 | ||||||
“PI”, Series 3940, Interest Only, 4.0%, 2/15/2041 | 253,519 | 39,136 | ||||||
“C31”, Series 303, Interest Only, 4.5%, 12/15/2042 | 4,410,348 | 1,077,513 | ||||||
“PI”, Series 3843, Interest Only, 4.5%, 5/15/2038 | 1,081,811 | 68,736 | ||||||
Federal National Mortgage Association: |
| |||||||
“WO”, Series 2013-27, Principal Only, Zero Coupon, 12/25/2042 | 1,200,000 | 671,255 | ||||||
“ZL” , Series 2017-55, 3.0%, 10/25/2046 | 1,561,138 | 1,285,350 | ||||||
“4”, Series 406, Interest Only, 4.0%, 9/25/2040 | 1,139,089 | 244,887 | ||||||
“JZ”, Series 2012-4, 4.0%, 9/25/2041 | 3,331,610 | 3,338,398 | ||||||
“I”, Series 2003-84, Interest Only, 6.0%, 9/25/2033 | 307,137 | 48,316 | ||||||
Freddie Mac Structured Agency Credit Risk Debt Notes: |
| |||||||
“M2”, Series 2017-DNA3, 1-month USD-LIBOR + 2.500%, 4.781%** , 3/25/2030 | 1,000,000 | 1,036,551 | ||||||
“M2”, Series 2017-DNA2, 1-month USD-LIBOR + 3.450%, 5.731%** , 10/25/2029 | 1,500,000 | 1,637,522 | ||||||
Government National Mortgage Association: |
| |||||||
“PI”, Series 2015-40, Interest Only, 4.0%, 4/20/2044 | 972,105 | 165,632 | ||||||
“BI”, Series 2010-30, Interest Only, 4.5%, 7/20/2039 | 156,774 | 19,401 | ||||||
“IP”, Series 2014-11, Interest Only, 4.5%, 1/20/2043 | 1,205,695 | 199,499 | ||||||
“IP”, Series 2014-115, Interest Only, 4.5%, 2/20/2044 | 105,734 | 25,596 | ||||||
“PI”, Series 2014-108, Interest Only, 4.5%, 12/20/2039 | 144,757 | 29,210 | ||||||
“IN”, Series 2009-69, Interest Only, 5.5%, 8/20/2039 | 708,279 | 139,149 | ||||||
“IQ”, Series 2011-18, Interest Only, 5.5%, 1/16/2039 | 150,151 | 12,129 | ||||||
“IV”, Series 2009-69, Interest Only, 5.5%, 8/20/2039 | 690,573 | 143,076 | ||||||
“IJ”, Series 2009-75, Interest Only, 6.0%, 8/16/2039 | 472,144 | 79,176 | ||||||
RESIMAC, “A2”, Series 2017-2, Australian Bank Bill Short Term Rates 1 Month Mid + 1.200%, 3.05%**, 1/15/2049 | AUD | 2,519,607 | 1,775,934 | |||||
STACR Trust, “M2”, Series 2018-DNA3, 144A, 1-month USD-LIBOR + 2.100%, 4.234%**, 9/25/2048 | 1,945,946 | 1,929,465 | ||||||
| ||||||||
| Total Collateralized Mortgage Obligations (Cost $20,597,157) |
| 21,308,130 | ||||||
| Government & Agency Obligations 7.5% |
| |||||||
| Other Government Related (e) 1.0% |
| |||||||
Banque Centrale de Tunisie International Bond, 144A, 5.75%, 1/30/2025 | 900,000 | 762,990 | ||||||
Gazprom OAO, 144A, 4.95%, 7/19/2022 | 1,500,000 | 1,503,108 | ||||||
Southern Gas Corridor CJSC, 144A, 6.875%, 3/24/2026 | 3,000,000 | 3,218,034 | ||||||
The accompanying notes are an integral part of the financial statements.
| DWS Global Income Builder Fund | | | 31 |
Table of Contents
| Principal Amount ($)(c) | Value ($) | |||||||
Vnesheconombank, 144A, 6.902%, 7/9/2020 | 2,000,000 | 2,017,840 | ||||||
|
| |||||||
| 7,501,972 | ||||||||
| Sovereign Bonds 3.7% |
| |||||||
Government of Indonesia, Series FR56, 8.375%, 9/15/2026 | IDR | 22,520,000,000 | 1,459,481 | |||||
Islamic Republic of Pakistan, 144A, 6.875%, 12/5/2027 | 900,000 | 830,884 | ||||||
Ivory Coast Government International Bond: |
| |||||||
144A, 5.375%, 7/23/2024 | 900,000 | 841,140 | ||||||
144A, 6.375%, 3/3/2028 | 400,000 | 370,744 | ||||||
Kingdom of Bahrain, 144A, 6.125%, 8/1/2023 | 2,150,000 | 2,169,156 | ||||||
Mexican Udibonos Inflation-Linked Bond, Series S, 2.0%, 6/9/2022 | MXN | 40,835,510 | 1,861,005 | |||||
Oman Government International Bond, 144A, 4.75%, 6/15/2026 | 1,900,000 | 1,748,000 | ||||||
Republic of Angola, 144A, 9.5%, 11/12/2025 | 1,450,000 | 1,596,595 | ||||||
Republic of Argentina, Series NY, Step-up Coupon, 2.5% to 3/31/2019, 3.75% to 3/31/2029, 5.25% to 12/31/2038 | 2,500,000 | 1,392,500 | ||||||
Republic of Ecuador, 144A, 8.75%, 6/2/2023 | 1,400,000 | 1,337,000 | ||||||
Republic of Hungary, Series 19/A, 6.5%, 6/24/2019 | HUF | 90,600,000 | 328,770 | |||||
Republic of Kenya, 144A, 6.875%, 6/24/2024 | 1,400,000 | 1,362,071 | ||||||
Republic of Namibia, 144A, 5.25%, 10/29/2025 | 2,000,000 | 1,800,160 | ||||||
Republic of Nigeria, 144A, 6.5%, 11/28/2027 | 1,300,000 | 1,192,802 | ||||||
Republic of Senegal, 144A, 6.25%, 7/30/2024 (a) | 2,500,000 | 2,437,700 | ||||||
Republic of Sri Lanka, 144A, 5.75%, 1/18/2022 | 525,000 | 487,710 | ||||||
Republic of Zambia, 144A, 5.375%, 9/20/2022 | 2,000,000 | 1,346,460 | ||||||
State of Qatar, 144A, 3.25%, 6/2/2026 | 2,400,000 | 2,277,984 | ||||||
United Mexican States, Series M, 5.75%, 3/5/2026 | MXN | 55,104,200 | 2,268,785 | |||||
|
| |||||||
| 27,108,947 | ||||||||
| U.S. Treasury Obligations 2.8% |
| |||||||
U.S. Treasury Bond, 3.0%, 2/15/2048 | 75,000 | 69,355 | ||||||
U.S. Treasury Inflation Indexed Note, 0.625%, 4/15/2023 | 20,302,000 | 19,914,993 | ||||||
U.S. Treasury Notes: |
| |||||||
1.625%, 8/31/2022 | 1,000,000 | 951,523 | ||||||
2.375%, 5/15/2027 | 30,000 | 28,316 | ||||||
|
| |||||||
| 20,964,187 | ||||||||
| Total Government & Agency Obligations (Cost $58,035,040) |
| 55,575,106 | ||||||
The accompanying notes are an integral part of the financial statements.
| 32 | | | DWS Global Income Builder Fund |
Table of Contents
| Principal Amount ($)(c) | Value ($) | |||||||
| Convertible Bond 0.1% | ||||||||
| Materials | ||||||||
GEO Specialty Chemicals, Inc., 3-month USD-LIBOR + 14.0%, 16.321%** PIK, 10/18/2025 (b) (Cost $765,766) | 761,010 | 821,130 | ||||||
| Loan Participations and Assignments 1.2% |
| |||||||
| Senior Loans** | ||||||||
Altice U.S. Finance I Corp., Term Loan B, 1-month USD LIBOR + 2.250%, 4.552%, 7/28/2025 | 3,536 | 3,535 | ||||||
Berry Global, Inc., Term Loan S, 3-month USD LIBOR + 1.750%, 4.027%, 2/8/2020 | 984 | 984 | ||||||
DaVita, Inc., Term Loan B, 1-month USD LIBOR + 2.750%, 5.052%, 6/24/2021 | 2,283,335 | 2,290,481 | ||||||
FCA U.S. LLC, Term Loan B, 1-month USD LIBOR + 2.000%, 4.3%, 12/31/2018 | 582,217 | 583,493 | ||||||
Hilton Worldwide Finance LLC, Term Loan B2, 1-month USD LIBOR + 1.750%, 4.031%, 10/25/2023 | 1,522,846 | 1,526,181 | ||||||
NRG Energy, Inc., Term Loan B, 3-month USD LIBOR + 1.750%, 4.136%, 6/30/2023 | 1,085,944 | 1,083,289 | ||||||
Outfront Media Capital LLC, Term Loan B, 1-month USD LIBOR + 2.000%, 4.256%, 3/18/2024 | 1,237,500 | 1,241,175 | ||||||
SBA Senior Finance II LLC, Term Loan B, 1-month USD LIBOR + 2.000%, 4.31%, 4/11/2025 | 710,956 | 710,351 | ||||||
TransDigm, Inc., Term Loan F, 1-month USD LIBOR + 2.500%, 4.802%, 6/9/2023 | 1,280,955 | 1,276,895 | ||||||
| Total Loan Participations and Assignments (Cost $8,713,182) |
| 8,716,384 | ||||||
| Shares | Value ($) | |||||||
| Exchange-Traded Funds 3.5% | ||||||||
iShares JP Morgan USD Emerging Markets Bond ETF | 68,317 | 7,150,057 | ||||||
SPDR Bloomberg Barclays Convertible Securities ETF | 377,000 | 18,940,480 | ||||||
| Total Exchange-Traded Funds (Cost $27,248,220) |
| 26,090,537 | ||||||
| Principal Amount ($)(c) | Value ($) | |||||||
| Short-Term U.S. Treasury Obligations 2.2% |
| |||||||
U.S. Treasury Bills: | ||||||||
2.362%***, 8/15/2019 (f) | 8,300,000 | 8,132,591 | ||||||
2.573%***, 10/10/2019 (g) (h) | 8,297,000 | 8,092,947 | ||||||
| ||||||||
| Total Short-Term U.S. Treasury Obligations (Cost $16,237,307) |
| 16,225,538 | ||||||
The accompanying notes are an integral part of the financial statements.
| DWS Global Income Builder Fund | | | 33 |
Table of Contents
| Shares | Value ($) | |||||||
| Securities Lending Collateral 2.2% | ||||||||
DWS Government & Agency Securities Portfolio “DWS Government Cash Institutional Shares”, 2.09% (i) (j) (Cost $16,553,728) | 16,553,728 | 16,553,728 | ||||||
| Cash Equivalents 4.4% | ||||||||
DWS Central Cash Management Government Fund, 2.19% (i) (Cost $32,523,513) | 32,523,513 | 32,523,513 | ||||||
| % of Net Assets | Value ($) | |||||||
| Total Investment Portfolio (Cost $757,772,721) | 102.2 | 755,099,387 | ||||||
| Other Assets and Liabilities, Net | (2.2 | ) | (15,989,766 | ) | ||||
| ||||||||
| Net Assets | 100.0 | 739,109,621 | ||||||
A summary of the Fund’s transactions with affiliated investments during the year ended October 31, 2018 are as follows:
| Value ($) at 10/31/2017 | Pur- chases Cost ($) | Sales Proceeds ($) | Net Real- ized Gain/ (Loss) ($) | Net Change in Unreal- ized Appreci- ation (Depreci- ation) ($) | Income ($) | Capital Gain Distri- butions ($) | Number of Shares at 10/31/2018 | Value ($) at 10/31/2018 | ||||||||||||||||||||||||
| Securities Lending Collateral 2.2% |
| |||||||||||||||||||||||||||||||
DWS Government & Agency Securities Portfolio “DWS Government Cash Institutional Shares”, 2.09% (i) (j) |
| |||||||||||||||||||||||||||||||
| 31,098,510 | — | 14,544,782 | (k) | — | — | 463,644 | — | 16,553,728 | 16,553,728 | |||||||||||||||||||||||
| Cash Equivalents 4.4% |
| |||||||||||||||||||||||||||||||
| DWS Central Cash Management Government Fund, 2.19% (i) |
| |||||||||||||||||||||||||||||||
| 12,186,338 | 532,294,569 | 511,957,394 | — | — | 308,861 | — | 32,523,513 | 32,523,513 | ||||||||||||||||||||||||
| 43,284,848 | 532,294,569 | 526,502,176 | — | — | 772,505 | — | 49,077,241 | 49,077,241 | ||||||||||||||||||||||||
| * | Non-income producing security. |
| ** | Variable or floating rate security. These securities are shown at their current rate as of October 31, 2018. For securities based on a published reference rate and spread, the reference rate and spread are indicated within the description above. Certain variable rate securities are not based on a published reference rate and spread but adjust periodically based on current market conditions, prepayment of underlying positions and/or other variables. |
| *** | Annualized yield at time of purchase; not a coupon rate. |
| (a) | All or a portion of these securities were on loan. In addition, “Other Assets and Liabilities, Net” may include pending sales that are also on loan. The value of securities loaned at October 31, 2018 amounted to $16,053,087, which is 2.2% of net assets. |
| (b) | Investment was valued using significant unobservable inputs. |
The accompanying notes are an integral part of the financial statements.
| 34 | | | DWS Global Income Builder Fund |
Table of Contents
| (c) | Principal amount stated in U.S. dollars unless otherwise noted. |
| (d) | When-issued security. |
| (e) | Government-backed debt issued by financial companies or government sponsored enterprises. |
| (f) | At October 31, 2018, this security has been pledged, in whole or in part, to cover initial margin requirements for open futures contracts. |
| (g) | At October 31, 2018, this security has been pledged, in whole or in part, as collateral for open over-the-counter derivatives. |
| (h) | At October 31, 2018, this security has been pledged, in whole or in part, to cover initial margin requirements for open centrally cleared swap contracts. |
| (i) | Affiliated fund managed by DWS Investment Management Americas, Inc. The rate shown is the annualized seven-day yield at period end. |
| (j) | Represents collateral held in connection with securities lending. Income earned by the Fund is net of borrower rebates. |
| (k) | Represents the net increase (purchase cost) or decrease (sales proceeds) in the amount invested for the year ended October 31, 2018. |
144A: Security exempt from registration under Rule 144A of the Securities Act of 1933. These securities may be resold in transactions exempt from registration, normally to qualified institutional buyers.
ADR: American Depositary Receipt
CJSC: Closed Joint Stock Company
CLO: Collateralized Loan Obligation
EURIBOR: Euro Interbank Offered Rate
GDR: Global Depositary Receipt
Interest Only: Interest Only (IO) bonds represent the “interest only” portion of payments on a pool of underlying mortgages or mortgage-backed securities. IO securities are subject to prepayment risk of the pool of underlying mortgages.
JSC: Joint Stock Company
LIBOR: London Interbank Offered Rate
MSCI: Morgan Stanley Capital International
PIK: Denotes that all or a portion of the income is paid in-kind in the form of additional principal.
PJSC: Public Joint Stock Company
Principal Only: Principal Only (PO) bonds represent the “principal only” portion of payments on a pool of underlying mortgages or mortgage-backed securities.
REG S: Securities sold under Regulation S may not be offered, sold or delivered within the United States or to, or for the account or benefit of, U.S. persons, except pursuant to an exemption from, or in a transaction not subject to, the registration requirements of the Securities Act of 1933.
REIT: Real Estate Investment Trust
SPDR: Standard & Poor’s Depositary Receipt
The accompanying notes are an integral part of the financial statements.
| DWS Global Income Builder Fund | | | 35 |
Table of Contents
At October 31, 2018, open futures contracts purchased were as follows:
| Futures | Currency | Expiration Date | Contracts | Notional Amount ($) | Notional Value ($) | Unrealized Appreciation (Depreciation) ($) | ||||||||||||||||||
| 10 Year U.S. Treasury Note | USD | 12/19/2018 | 173 | 20,759,016 | 20,489,688 | (269,328 | ) | |||||||||||||||||
| 2 Year U.S. Treasury Note | USD | 12/31/2018 | 153 | 32,300,012 | 32,230,406 | (69,606 | ) | |||||||||||||||||
| 3 Month Euro Euribor Interest Rate | EUR | 9/16/2019 | 11 | 3,120,413 | 3,121,796 | 1,383 | ||||||||||||||||||
| 3 Month Euro Swiss Franc (Euroswiss) Interest Rate | CHF | 9/16/2019 | 13 | 3,247,922 | 3,248,548 | 626 | ||||||||||||||||||
| 3 Month Euroyen | JPY | 9/13/2019 | 14 | 3,098,194 | 3,098,617 | 423 | ||||||||||||||||||
| 3 Month Sterling (Short Sterling) Interest Rate | GBP | 9/18/2019 | 20 | 3,159,261 | 3,160,989 | 1,728 | ||||||||||||||||||
| 90 Day Eurodollar | USD | 9/16/2019 | 13 | 3,148,795 | 3,148,112 | (683 | ) | |||||||||||||||||
| ASX 90 Day Bank Accepted Bills | AUD | 9/12/2019 | 18 | 12,684,495 | 12,685,084 | 589 | ||||||||||||||||||
| MSCI Mini Emerging Market Index | USD | 12/21/2018 | 402 | 21,140,569 | 19,229,670 | (1,910,899 | ) | |||||||||||||||||
| MSCI World Index | USD | 12/21/2018 | 502 | 31,330,198 | 29,166,200 | (2,163,998 | ) | |||||||||||||||||
| S&P 500 E-Mini Index | USD | 12/21/2018 | 212 | 29,006,075 | 28,737,660 | (268,415 | ) | |||||||||||||||||
| Total net unrealized depreciation |
| (4,678,180 | ) | |||||||||||||||||||||
At October 31, 2018, open futures contracts sold were as follows:
| Futures | Currency | Expiration Date | Contracts | Notional Amount ($) | Notional Value ($) | Unrealized Appreciation (Depreciation) ($) | ||||||||||||||||||
| 5 Year U.S. Treasury Note | USD | 12/31/2018 | 276 | 31,140,680 | 31,017,656 | 123,024 | ||||||||||||||||||
| Euro-Schatz | EUR | 12/6/2018 | 553 | 70,127,479 | 70,136,172 | (8,693 | ) | |||||||||||||||||
| Total net unrealized appreciation |
| 114,331 | ||||||||||||||||||||||
The accompanying notes are an integral part of the financial statements.
| 36 | | | DWS Global Income Builder Fund |
Table of Contents
At October 31, 2018, open credit default swap contracts purchased were as follows:
| Centrally Cleared Swaps | ||||||||||||||||||||||||||
| Underlying Reference Obligation | Fixed Cash Flows Paid/ Frequency | Expiration Date | Notional Amount ($) | Currency | Value ($) | Upfront Payments Paid ($) | Unrealized (Depreciation) ($) | |||||||||||||||||||
| iTRAXX Europe Series 29 | 1.0%/ Quarterly | 6/20/2023 | 18,000,000 | EUR | (356,282 | ) | (344,250 | ) | (12,032 | ) | ||||||||||||||||
| Markit CDX North America Investment Grade Index | 1.0%/ Quarterly | 6/20/2023 | 18,000,000 | USD | (309,029 | ) | (300,764 | ) | (8,265 | ) | ||||||||||||||||
Total unrealized depreciation |
| (20,297 | ) | |||||||||||||||||||||||
At October 31, 2018, open credit default swap contracts sold were as follows:
| Centrally Cleared Swaps | ||||||||||||||||||||||||||
| Underlying Reference Obligation | Fixed Cash Flows Received/ Frequency | Expiration Date | Notional Amount ($) (l) | Currency | Value ($) | Upfront Payments Paid/ (Received) ($) | Unrealized Appreciation/ (Depreciation) ($) | |||||||||||||||||||
| iTRAXX Europe Crossover Series 29 | 5.0%/ Quarterly | 6/20/2023 | 9,000,000 | EUR | 932,816 | 909,745 | 23,071 | |||||||||||||||||||
| Markit CDX North America High Yield Index | 5.0%/ Quarterly | 6/20/2023 | 16,700,000 | USD | 1,108,035 | 1,052,648 | 55,387 | |||||||||||||||||||
| Markit CDX North America High Yield Index | 5.0%/ Quarterly | 12/20/2023 | 16,100,000 | USD | 935,768 | 1,155,207 | (219,439 | ) | ||||||||||||||||||
Total net unrealized depreciation |
| (140,981 | ) | |||||||||||||||||||||||
| (l) | The maximum potential amount of future undiscounted payments that the Fund could be required to make under a credit default swap contract would be the notional amount of the contract. These potential amounts would be partially offset by any recovery values of the referenced debt obligation or net amounts received from the settlement of buy protection credit default swap contracts entered into by the Fund for the same referenced debt obligation, if any. |
The accompanying notes are an integral part of the financial statements.
| DWS Global Income Builder Fund | | | 37 |
Table of Contents
At October 31, 2018, open interest rate swap contracts were as follows:
| Centrally Cleared Swaps | ||||||||||||||||||||||||||
| Cash Flows Paid by the Fund/ Frequency | Cash Flows | Effective/ Expiration Date | Notional Amount ($) | Currency | Value ($) | Upfront Payments Paid/ (Received) ($) | Unrealized Appreciation/ (Depreciation) ($) | |||||||||||||||||||
| Fixed — 2.75% Semi-Annually | Floating — 3-Month LIBOR Quarterly | | 12/14/2018 12/14/2020 | | 2,000,000 | USD | 14,323 | 4,668 | 9,655 | |||||||||||||||||
| Fixed — 3.00% Semi-Annually | Floating — 3-Month LIBOR Quarterly | | 12/14/2018 12/14/2028 | | 32,000,000 | USD | 722,413 | (101,419 | ) | 823,832 | ||||||||||||||||
| Floating — 3-Month LIBOR Quarterly | Fixed — 2.75% Semi-Annually | | 12/14/2018 12/14/2023 | | 8,250,000 | USD | (157,793 | ) | (61,077 | ) | (96,716 | ) | ||||||||||||||
| Floating — 3-Month LIBOR Quarterly | Fixed — 3.00% Semi-Annually | | 12/14/2018 12/14/2038 | | 5,800,000 | USD | (296,892 | ) | (5,737 | ) | (291,155 | ) | ||||||||||||||
| Floating — 3-Month LIBOR Quarterly | Fixed — 3.261% Semi-Annually | | 3/20/2019 3/20/2049 | | 22,500,000 | USD | (322,265 | ) | — | (322,265 | ) | |||||||||||||||
Total net unrealized appreciation |
| 123,351 | ||||||||||||||||||||||||
LIBOR: London Interbank Offered Rate; 3-month LIBOR rate as of October 31, 2018 is 2.559%.
At October 31, 2018, the Fund had the following open forward foreign currency contracts:
| Contracts to Deliver | In Exchange For | Settlement Date | Unrealized Appreciation ($) | Counterparty | ||||||||||||||||
| GBP | 10,470,000 | USD | 13,611,994 | 11/7/2018 | 226,470 | Morgan Stanley | ||||||||||||||
| GBP | 12,253,200 | USD | 15,953,706 | 11/7/2018 | 288,424 | Barclays Bank PLC | ||||||||||||||
| AUD | 2,966,000 | USD | 2,152,844 | 11/16/2018 | 52,146 | Bank of America | ||||||||||||||
| EUR | 26,600,000 | USD | 31,080,318 | 11/20/2018 | 910,016 | Credit Agricole | ||||||||||||||
| JPY | 2,308,355,248 | USD | 20,600,000 | 11/20/2018 | 116,420 | Morgan Stanley | ||||||||||||||
| EUR | 31,600,000 | USD | 36,640,074 | 1/9/2019 | 618,094 | State Street Bank and Trust | ||||||||||||||
| CNY | 48,298,950 | USD | 6,948,253 | 1/9/2019 | 23,474 | Toronto-Dominion Bank | ||||||||||||||
| GBP | 10,800,000 | USD | 14,219,248 | 1/9/2019 | 363,701 | Credit Agricole | ||||||||||||||
| USD | 20,334,087 | JPY | 2,308,355,248 | 11/20/2018 | 149,493 | Morgan Stanley | ||||||||||||||
| MXN | 54,000,000 | USD | 2,766,568 | 1/23/2019 | 142,437 | State Street Bank and Trust | ||||||||||||||
| Total unrealized appreciation | 2,890,675 | |||||||||||||||||||
The accompanying notes are an integral part of the financial statements.
| 38 | | | DWS Global Income Builder Fund |
Table of Contents
| Contracts to Deliver | In Exchange For | Settlement Date | Unrealized Depreciation ($) | Counterparty | ||||||||||||||||
| USD | 12,219,603 | GBP | 9,240,000 | 11/7/2018 | (406,591 | ) | Morgan Stanley | |||||||||||||
| USD | 17,921,879 | GBP | 13,483,200 | 11/7/2018 | (684,086 | ) | Barclays Bank PLC | |||||||||||||
| USD | 31,461,868 | EUR | 26,600,000 | 11/20/2018 | (1,291,566 | ) | Credit Agricole | |||||||||||||
| USD | 3,417,011 | CNY | 23,813,005 | 1/9/2019 | (2,862 | ) | Credit Agricole | |||||||||||||
| JPY | 2,164,550,000 | USD | 19,155,340 | 1/9/2019 | (145,358 | ) | Morgan Stanley | |||||||||||||
| USD | 21,148,954 | EUR | 18,202,500 | 1/9/2019 | (399,267 | ) | State Street Bank and Trust | |||||||||||||
| Total unrealized depreciation | (2,929,730 | ) | ||||||||||||||||||
| Currency Abbreviations |
| AUD Australian Dollar |
| CHF Swiss Franc |
| CNY Yuan Renminbi |
| EUR Euro |
| GBP British Pound |
| HUF Hungarian Forint |
| IDR Indonesian Rupiah |
| JPY Japanese Yen |
| MXN Mexican Peso |
| USD United States Dollar |
For information on the Fund’s policy and additional disclosures regarding futures contracts, credit default swap contracts, interest rate swap contracts, written options contracts and forward foreign currency contracts, please refer to the Derivatives section of Note B in the accompanying Notes to Financial Statements.
Fair Value Measurements
Various inputs are used in determining the value of the Fund’s investments. These inputs are summarized in three broad levels. Level 1 includes quoted prices in active markets for identical securities. Level 2 includes other significant observable inputs (including quoted prices for similar securities, interest rates, prepayment speeds and credit risk). Level 3 includes significant unobservable inputs (including the Fund’s own assumptions in determining the fair value of investments). The level assigned to the securities valuations may not be an indication of the risk or liquidity associated with investing in those securities.
The following is a summary of the inputs used as of October 31, 2018 in valuing the Fund’s investments. For information on the Fund’s policy regarding the valuation of investments, please refer to the Security Valuation section of Note A in the accompanying Notes to Financial Statements.
| Assets | Level 1 | Level 2 | Level 3 | Total | ||||||||||||
| Common Stocks | ||||||||||||||||
Communication Services | $ | 26,025,652 | $ | 15,762,628 | $ | — | $ | 41,788,280 | ||||||||
Consumer Discretionary | 23,528,400 | 16,295,155 | — | 39,823,555 | ||||||||||||
Consumer Staples | 21,664,206 | 9,203,135 | — | 30,867,341 | ||||||||||||
Energy | 24,981,527 | 11,558,643 | — | 36,540,170 | ||||||||||||
Financials | 26,549,811 | 30,142,360 | — | 56,692,171 | ||||||||||||
Health Care | 22,875,583 | 13,622,195 | — | 36,497,778 | ||||||||||||
Industrials | 21,561,317 | 21,540,825 | — | 43,102,142 | ||||||||||||
Information Technology | 61,770,683 | 5,349,705 | — | 67,120,388 | ||||||||||||
Materials | 2,812,643 | 735,379 | 53,715 | 3,601,737 | ||||||||||||
Real Estate | 19,755,446 | 2,437,031 | — | 22,192,477 | ||||||||||||
Utilities | 10,643,247 | 3,326,369 | — | 13,969,616 | ||||||||||||
The accompanying notes are an integral part of the financial statements.
| DWS Global Income Builder Fund | | | 39 |
Table of Contents
| Assets | Level 1 | Level 2 | Level 3 | Total | ||||||||||||
| Preferred Stocks (m) | $ | 41,513,951 | $ | — | $ | — | $ | 41,513,951 | ||||||||
| Warrant | — | — | 15,995 | 15,995 | ||||||||||||
| Fixed Income Investments (m) | ||||||||||||||||
Corporate Bonds | — | 99,548,625 | — | 99,548,625 | ||||||||||||
Asset-Backed | — | 38,513,753 | — | 38,513,753 | ||||||||||||
Mortgage-Backed Securities Pass-Throughs | — | 2,281,774 | — | 2,281,774 | ||||||||||||
Commercial Mortgage-Backed Securities | — | 3,215,568 | — | 3,215,568 | ||||||||||||
Collateralized Mortgage Obligations | — | 21,308,130 | — | 21,308,130 | ||||||||||||
Government & Agency Obligations | — | 55,575,106 | — | 55,575,106 | ||||||||||||
Convertible Bond | — | — | 821,130 | 821,130 | ||||||||||||
Loan Participations and Assignments | — | 8,716,384 | — | 8,716,384 | ||||||||||||
Short-Term U.S. Treasury Obligations | — | 16,225,538 | — | 16,225,538 | ||||||||||||
| Exchange-Traded Funds | 26,090,537 | — | — | 26,090,537 | ||||||||||||
| Short-Term Investments (m) | 49,077,241 | — | — | 49,077,241 | ||||||||||||
| Derivatives (n) | ||||||||||||||||
Futures Contracts | $ | 127,773 | $ | — | $ | — | $ | 127,773 | ||||||||
Credit Default Swap Contracts | — | 78,458 | — | 78,458 | ||||||||||||
Interest Rate Swap Contracts | — | 833,487 | — | 833,487 | ||||||||||||
Forward Foreign Currency Contracts | — | 2,890,675 | — | 2,890,675 | ||||||||||||
| Total | $ | 378,978,017 | $ | 379,160,923 | $ | 890,840 | $ | 759,029,780 | ||||||||
| Liabilities | Level 1 | Level 2 | Level 3 | Total | ||||||||||||
| Derivatives (n) | ||||||||||||||||
Futures Contracts | $ | (4,691,622 | ) | $ | — | $ | — | $ | (4,691,622 | ) | ||||||
Credit Default Swap Contracts | — | (239,736 | ) | — | (239,736 | ) | ||||||||||
Interest Rate Swap Contracts | — | (710,136 | ) | — | (710,136 | ) | ||||||||||
Forward Foreign Currency Contracts | — | (2,929,730 | ) | — | (2,929,730 | ) | ||||||||||
| Total | $ | (4,691,622 | ) | $ | (3,879,602 | ) | $ | — | $ | (8,571,224 | ) | |||||
| (m) | See Investment Portfolio for additional detailed categorizations. |
| (n) | Derivatives include unrealized appreciation (depreciation) on open futures contracts, credit default swap contracts, interest rate swap contracts, forward foreign currency contracts. |
The accompanying notes are an integral part of the financial statements.
| 40 | | | DWS Global Income Builder Fund |
Table of Contents
Statement of Assets and Liabilities
| as of October 31, 2018 | ||||
| Assets | ||||
| Investments in non-affiliated securities, at value (cost $708,695,480) — including $16,053,087 of securities loaned | $ | 706,022,146 | ||
| Investment in DWS Government & Agency Securities Portfolio (cost $16,553,728)* | 16,553,728 | |||
| Investment in DWS Central Cash Management Government Fund (cost $32,523,513) | 32,523,513 | |||
| Foreign currency, at value (cost $302,402) | 281,481 | |||
| Receivable for investments sold | 1,771,875 | |||
| Receivable for Fund shares sold | 28,596 | |||
| Dividends receivable | 1,233,157 | |||
| Interest receivable | 2,514,063 | |||
| Receivable for variation margin on futures contracts | 985,378 | |||
| Unrealized appreciation on forward foreign currency contracts | 2,890,675 | |||
| Foreign taxes recoverable | 223,780 | |||
| Other assets | 36,357 | |||
| Total assets | 765,064,749 | |||
| Liabilities | ||||
| Cash overdraft | 2,100,512 | |||
| Payable upon return of securities loaned | 16,553,728 | |||
| Payable for investments purchased — when-issued/delayed delivery securities | 2,831,626 | |||
| Payable for Fund shares redeemed | 402,609 | |||
| Payable for variation margin for centrally cleared swaps | 60,599 | |||
| Unrealized depreciation on forward foreign currency contracts | 2,929,730 | |||
| Accrued management fee | 236,150 | |||
| Accrued Trustees’ fees | 9,383 | |||
| Other accrued expenses and payables | 830,791 | |||
| Total liabilities | 25,955,128 | |||
| Net assets, at value | $ | 739,109,621 | ||
| * | Represents collateral on securities loaned. |
The accompanying notes are an integral part of the financial statements.
| DWS Global Income Builder Fund | | | 41 |
Table of Contents
| Statement of Assets and Liabilities as of October 31, 2018 (continued) |
| Net Assets Consist of | ||||
| Distributable earnings (loss) | $ | 15,661,813 | ||
| Paid-in capital | 723,447,808 | |||
| Net assets, at value | $ | 739,109,621 | ||
| Net Asset Value | ||||
Class A | ||||
| Net Asset Value and redemption price per share ($534,339,555 ÷ 59,596,658 outstanding shares of beneficial interest, no par value, unlimited number of shares authorized) | $ | 8.97 | ||
| Maximum offering price per share (100 ÷ 94.25 of $8.97) | $ | 9.52 | ||
Class C | ||||
Net Asset Value, offering and redemption price no par value, unlimited number of shares authorized) | $ | 8.96 | ||
Class R6 | ||||
| Net Asset Value, offering and redemption price per share ($559,771 ÷ 62,537 outstanding shares of beneficial interest, no par value, unlimited number of shares authorized) | $ | 8.95 | ||
Class S | ||||
| Net Asset Value, offering and redemption price per share ($182,169,688 ÷ 20,315,959 outstanding shares of beneficial interest, no par value, unlimited number of shares authorized) | $ | 8.97 | ||
Institutional Class | ||||
| Net Asset Value, offering and redemption price per share ($12,120,611 ÷ 1,353,814 outstanding shares of beneficial interest, no par value, unlimited number of shares authorized) | $ | 8.95 | ||
The accompanying notes are an integral part of the financial statements.
| 42 | | | DWS Global Income Builder Fund |
Table of Contents
| for the year ended October 31, 2018 | ||||
| Investment Income | ||||
| Income: | ||||
| Dividends (net of foreign taxes withheld of $851,656) | $ | 19,767,602 | ||
| Interest (net of foreign taxes withheld of $48,843) | 10,020,615 | |||
| Income distributions — DWS Central Cash Management Government Fund | 308,861 | |||
| Securities lending income, net of borrower rebates | 463,644 | |||
| Other income | 1,481 | |||
| Total income | 30,562,203 | |||
| Expenses: | ||||
| Management fee | 2,948,773 | |||
| Administration fee | 796,966 | |||
| Services to shareholders | 1,098,418 | |||
| Distribution and service fees | 1,518,228 | |||
| Custodian fee | 82,722 | |||
| Professional fees | 126,790 | |||
| Reports to shareholders | 93,398 | |||
| Registration fees | 69,163 | |||
| Trustees’ fees and expenses | 39,025 | |||
| Other | 101,628 | |||
| Total expenses | 6,875,111 | |||
| Net investment income | 23,687,092 | |||
The accompanying notes are an integral part of the financial statements.
| DWS Global Income Builder Fund | | | 43 |
Table of Contents
| Statement of Operations for the year ended October 31, 2018 (continued) |
| Realized and Unrealized Gain (Loss) | ||||
| Net realized gain (loss) from: | ||||
| Investments | $ | 7,031,287 | ||
| Swap contracts | 8,495,216 | |||
| Futures | (2,044,812 | ) | ||
| Written options | 1,952,458 | |||
| Forward foreign currency contracts | 1,921,891 | |||
| Foreign currency | 61,588 | |||
| 17,417,628 | ||||
| Change in net unrealized appreciation (depreciation) on: | ||||
| Investments | (37,246,373 | ) | ||
| Swap contracts | (3,351,522 | ) | ||
| Futures | (7,278,931 | ) | ||
| Written options | (266,400 | ) | ||
| Forward foreign currency contracts | 342,427 | |||
| Foreign currency | (14,916 | ) | ||
| (47,815,715 | ) | |||
| Net gain (loss) | (30,398,087 | ) | ||
| Net increase (decrease) in net assets resulting from operations | $ | (6,710,995 | ) | |
The accompanying notes are an integral part of the financial statements.
| 44 | | | DWS Global Income Builder Fund |
Table of Contents
Statements of Changes in Net Assets
| Years Ended October 31, | ||||||||
| Increase (Decrease) in Net Assets | 2018 | 2017 | ||||||
| Operations: | ||||||||
| Net investment income (loss) | $ | 23,687,092 | $ | 22,419,466 | ||||
| Net realized gain (loss) | 17,417,628 | 80,822,857 | ||||||
| Change in net unrealized appreciation (depreciation) | (47,815,715 | ) | 20,307,529 | |||||
| Net increase (decrease) in net assets resulting from operations | (6,710,995 | ) | 123,549,852 | |||||
| Distributions to shareholders : | ||||||||
Class A | (59,770,503 | ) | (16,682,269 | ) | ||||
Class C | (1,802,962 | ) | (406,247 | ) | ||||
Class R6 | (292,492 | ) | (58,522 | ) | ||||
Class S | (19,898,219 | ) | (5,778,503 | ) | ||||
Institutional Class | (1,111,125 | ) | (259,525 | ) | ||||
| Total distributions | (82,875,301 | ) | (23,185,066 | )* | ||||
| Fund share transactions: | ||||||||
| Proceeds from shares sold | 43,798,469 | 49,781,467 | ||||||
| Reinvestment of distributions | 79,673,426 | 22,138,763 | ||||||
| Payments for shares redeemed | (125,907,591 | ) | (136,652,792 | ) | ||||
| Net increase (decrease) in net assets from Fund share transactions | (2,435,696 | ) | (64,732,562 | ) | ||||
| Increase (decrease) in net assets | (92,021,992 | ) | 35,632,224 | |||||
| Net assets at beginning of year | 831,131,613 | 795,499,389 | ||||||
| Net assets at end of year | $ | 739,109,621 | $ | 831,131,613 | ** | |||
| * | Includes distributions from net investment income. |
| ** | Includes undistributed net investment income of $11,454,008. |
The accompanying notes are an integral part of the financial statements.
| DWS Global Income Builder Fund | | | 45 |
Table of Contents
| Years Ended October 31, | ||||||||||||||||||||
| Class A | 2018 | 2017 | 2016 | 2015 | 2014 | |||||||||||||||
| Selected Per Share Data | ||||||||||||||||||||
| Net asset value, beginning of period | $ | 10.06 | $ | 8.89 | $ | 8.91 | $ | 10.36 | $ | 10.31 | ||||||||||
| Income (loss) from investment operations: | ||||||||||||||||||||
Net investment incomea | .28 | .26 | .21 | .29 | .32 | |||||||||||||||
Net realized and unrealized gain (loss) | (.36 | ) | 1.18 | .03 | (.64 | ) | .23 | |||||||||||||
Total from investment operations | (.08 | ) | 1.44 | .24 | (.35 | ) | .55 | |||||||||||||
| Less distributions from: | ||||||||||||||||||||
Net investment income | (.34 | ) | (.27 | ) | (.26 | ) | (.37 | ) | (.34 | ) | ||||||||||
Net realized gains | (.67 | ) | — | — | (.73 | ) | (.16 | ) | ||||||||||||
Total distributions | (1.01 | ) | (.27 | ) | (.26 | ) | (1.10 | ) | (.50 | ) | ||||||||||
| Net asset value, end of period | $8.97 | $ | 10.06 | $ | 8.89 | $ | 8.91 | $ | 10.36 | |||||||||||
| Total Return (%)b | (1.11 | ) | 16.39 | 2.82 | (3.32 | ) | 5.49 | |||||||||||||
| Ratios to Average Net Assets and Supplemental Data |
| |||||||||||||||||||
| Net assets, end of period ($ millions) | 534 | 603 | 582 | 639 | 751 | |||||||||||||||
| Ratio of expenses (%) | .90 | .91 | .92 | .91 | .90 | |||||||||||||||
| Ratio of net investment income (%) | 2.93 | 2.71 | 2.39 | 3.09 | 3.10 | |||||||||||||||
| Portfolio turnover rate (%) | 67 | 137 | 123 | 115 | 100 | |||||||||||||||
| a | Based on average shares outstanding during the period. |
| b | Total return does not reflect the effect of any sales charges. |
The accompanying notes are an integral part of the financial statements.
| 46 | | | DWS Global Income Builder Fund |
Table of Contents
Years Ended October 31, | ||||||||||||||||||||
| Class C | 2018 | 2017 | 2016 | 2015 | 2014 | |||||||||||||||
| Selected Per Share Data | ||||||||||||||||||||
| Net asset value, beginning of period | $ | 10.05 | $ | 8.88 | $ | 8.90 | $ | 10.35 | $ | 10.29 | ||||||||||
| Income (loss) from investment operations: |
| |||||||||||||||||||
Net investment incomea | .21 | .18 | .14 | .22 | .24 | |||||||||||||||
Net realized and unrealized gain (loss) | (.37 | ) | 1.18 | .03 | (.64 | ) | .24 | |||||||||||||
Total from investment operations | (.16 | ) | 1.36 | .17 | (.42 | ) | .48 | |||||||||||||
| Less distributions from: | ||||||||||||||||||||
Net investment income | (.26 | ) | (.19 | ) | (.19 | ) | (.30 | ) | (.26 | ) | ||||||||||
Net realized gains | (.67 | ) | — | — | (.73 | ) | (.16 | ) | ||||||||||||
Total distributions | (.93 | ) | (.19 | ) | (.19 | ) | (1.03 | ) | (.42 | ) | ||||||||||
| Net asset value, end of period | $8.96 | $ | 10.05 | $ | 8.88 | $ | 8.90 | $ | 10.35 | |||||||||||
| Total Return (%)b | (1.91 | ) | 15.47 | c | 2.00 | (3.99 | ) | 4.74 | ||||||||||||
| Ratios to Average Net Assets and Supplemental Data |
| |||||||||||||||||||
| Net assets, end of period ($ millions) | 10 | 20 | 20 | 22 | 27 | |||||||||||||||
| Ratio of expenses before expense reductions (%) | 1.65 | 1.74 | 1.72 | 1.70 | 1.69 | |||||||||||||||
| Ratio of expenses after expense reductions (%) | 1.65 | 1.72 | 1.72 | 1.70 | 1.69 | |||||||||||||||
| Ratio of net investment income (%) | 2.18 | 1.90 | 1.59 | 2.30 | 2.31 | |||||||||||||||
| Portfolio turnover rate (%) | 67 | 137 | 123 | 115 | 100 | |||||||||||||||
| a | Based on average shares outstanding during the period. |
| b | Total return does not reflect the effect of any sales charges. |
| c | Total return would have been lower had certain expenses not been reduced. |
The accompanying notes are an integral part of the financial statements.
| DWS Global Income Builder Fund | | | 47 |
Table of Contents
Years Ended October 31, | Period Ended | |||||||||||||||||||
| Class R6 | 2018 | 2017 | 2016 | 2015 | 10/31/14a | |||||||||||||||
| Selected Per Share Data | ||||||||||||||||||||
| Net asset value, beginning of period | $ | 10.04 | $8.87 | $ | 8.88 | $ | 10.35 | $ | 10.70 | |||||||||||
| Income (loss) from investment operations: |
| |||||||||||||||||||
Net investment incomeb | .31 | .32 | .22 | .29 | .05 | |||||||||||||||
Net realized and unrealized gain (loss) | (.36 | ) | 1.14 | .04 | (.63 | ) | (.29 | ) | ||||||||||||
Total from investment operations | (.05 | ) | 1.46 | .26 | (.34 | ) | (.24 | ) | ||||||||||||
| Less distributions from: | ||||||||||||||||||||
Net investment income | (.37 | ) | (.29 | ) | (.27 | ) | (.40 | ) | (.11 | ) | ||||||||||
Net realized gains | (.67 | ) | — | — | (.73 | ) | — | |||||||||||||
Total distributions | (1.04 | ) | (.29 | ) | (.27 | ) | (1.13 | ) | (.11 | ) | ||||||||||
| Net asset value, end of period | $8.95 | $ | 10.04 | $ | 8.87 | $8.88 | $ | 10.35 | ||||||||||||
| Total Return (%) | (.78 | ) | 16.74 | 3.08 | (3.15 | ) | (2.26 | )** | ||||||||||||
| Ratios to Average Net Assets and Supplemental Data |
| |||||||||||||||||||
| Net assets, end of period ($ millions) | 1 | 4 | .05 | .01 | .01 | |||||||||||||||
| Ratio of expenses (%) | .56 | .57 | .67 | .83 | .56 | * | ||||||||||||||
| Ratio of net investment income (%) | 3.19 | 3.28 | 2.58 | 3.15 | 2.83 | * | ||||||||||||||
| Portfolio turnover rate (%) | 67 | 137 | 123 | 115 | 100 | c | ||||||||||||||
| a | For the period from August 25, 2014 (commencement of operations) to October 31, 2014. |
| b | Based on average shares outstanding during the period. |
| c | Represents the Fund’s portfolio turnover rate for the year ended October 31, 2014. |
| * | Annualized |
| ** | Not annualized |
The accompanying notes are an integral part of the financial statements.
| 48 | | | DWS Global Income Builder Fund |
Table of Contents
| Years Ended October 31, | ||||||||||||||||||||
| Class S | 2018 | 2017 | 2016 | 2015 | 2014 | |||||||||||||||
| Selected Per Share Data | ||||||||||||||||||||
| Net asset value, beginning of period | $ | 10.06 | $8.89 | $8.91 | $ | 10.36 | $ | 10.31 | ||||||||||||
| Income (loss) from investment operations: |
| |||||||||||||||||||
Net investment incomea | .30 | .28 | .23 | .31 | .34 | |||||||||||||||
Net realized and unrealized gain (loss) | (.36 | ) | 1.18 | .03 | (.64 | ) | .23 | |||||||||||||
Total from investment operations | (.06 | ) | 1.46 | .26 | (.33 | ) | .57 | |||||||||||||
| Less distributions from: | ||||||||||||||||||||
Net investment income | (.36 | ) | (.29 | ) | (.28 | ) | (.39 | ) | (.36 | ) | ||||||||||
Net realized gains | (.67 | ) | — | — | (.73 | ) | (.16 | ) | ||||||||||||
Total distributions | (1.03 | ) | (.29 | ) | (.28 | ) | (1.12 | ) | (.52 | ) | ||||||||||
| Net asset value, end of period | $8.97 | $ | 10.06 | $8.89 | $8.91 | $ | 10.36 | |||||||||||||
| Total Return (%) | (.90 | ) | 16.62 | 3.02 | (3.01 | ) | 5.70 | |||||||||||||
| Ratios to Average Net Assets and Supplemental Data |
| |||||||||||||||||||
| Net assets, end of period ($ millions) | 182 | 195 | 186 | 205 | 249 | |||||||||||||||
| Ratio of expenses (%) | .69 | .70 | .71 | .71 | .69 | |||||||||||||||
| Ratio of net investment income (%) | 3.15 | 2.92 | 2.60 | 3.30 | 3.30 | |||||||||||||||
| Portfolio turnover rate (%) | 67 | 137 | 123 | 115 | 100 | |||||||||||||||
| a | Based on average shares outstanding during the period. |
The accompanying notes are an integral part of the financial statements.
| DWS Global Income Builder Fund | | | 49 |
Table of Contents
Years Ended October 31, | ||||||||||||||||||||
| Institutional Class | 2018 | 2017 | 2016 | 2015 | 2014 | |||||||||||||||
| Selected Per Share Data | ||||||||||||||||||||
| Net asset value, beginning of period | $ | 10.05 | $8.88 | $8.90 | $ | 10.35 | $ | 10.30 | ||||||||||||
| Income (loss) from investment operations: |
| |||||||||||||||||||
Net investment incomea | .30 | .28 | .23 | .29 | .35 | |||||||||||||||
Net realized and unrealized gain (loss) | (.37 | ) | 1.18 | .03 | (.61 | ) | .23 | |||||||||||||
Total from investment operations | (.07 | ) | 1.46 | .26 | (.32 | ) | .58 | |||||||||||||
| Less distributions from: | ||||||||||||||||||||
Net investment income | (.36 | ) | (.29 | ) | (.28 | ) | (.40 | ) | (.37 | ) | ||||||||||
Net realized gains | (.67 | ) | — | — | (.73 | ) | (.16 | ) | ||||||||||||
Total distributions | (1.03 | ) | (.29 | ) | (.28 | ) | (1.13 | ) | (.53 | ) | ||||||||||
| Net asset value, end of period | $8.95 | $ | 10.05 | $8.88 | $8.90 | $ | 10.35 | |||||||||||||
| Total Return (%) | (.99 | ) | 16.55 | 3.06 | (3.07 | ) | 5.77 | |||||||||||||
| Ratios to Average Net Assets and Supplemental Data |
| |||||||||||||||||||
| Net assets, end of period ($ millions) | 12 | 10 | 8 | 8 | 3 | |||||||||||||||
| Ratio of expenses (%) | .66 | .69 | .69 | .68 | .64 | |||||||||||||||
| Ratio of net investment income (%) | 3.18 | 2.94 | 2.63 | 3.15 | 3.34 | |||||||||||||||
| Portfolio turnover rate (%) | 67 | 137 | 123 | 115 | 100 | |||||||||||||||
| a | Based on average shares outstanding during the period. |
The accompanying notes are an integral part of the financial statements.
| 50 | | | DWS Global Income Builder Fund |
Table of Contents
| Notes to Financial Statements |
A. Organization and Significant Accounting Policies
DWS Global Income Builder Fund (formerly Deutsche Global Income Builder Fund) (the “Fund”) is a diversified series of DWS Market Trust (formerly Deutsche Market Trust) (the “Trust”), which is registered under the Investment Company Act of 1940, as amended (the “1940 Act”), as an open-end management investment company organized as a Massachusetts business trust.
The Fund offers multiple classes of shares which provide investors with different purchase options. Class A shares are subject to an initial sales charge. Class C shares are not subject to an initial sales charge but are subject to higher ongoing expenses than Class A shares and a contingent deferred sales charge payable upon certain redemptions within one year of purchase. Effective on August 10, 2018, Class C shares automatically convert to Class A shares in the same fund after 10 years, provided that the fund or the financial intermediary through which the shareholder purchased the Class C shares has records verifying that the Class C shares have been held for at least 10 years. Class R6 shares are not subject to initial or contingent deferred sales charges and are generally available only to certain retirement plans. Class S shares are not subject to initial or contingent deferred sales charges and are only available to a limited group of investors. Institutional Class shares are not subject to initial or contingent deferred sales charges and are generally available only to qualified institutions.
Investment income, realized and unrealized gains and losses, and certain fund-level expenses and expense reductions, if any, are borne pro rata on the basis of relative net assets by the holders of all classes of shares, except that each class bears certain expenses unique to that class such as distribution and service fees, services to shareholders and certain other class-specific expenses. Differences in class-level expenses may result in payment of different per share dividends by class. All shares of the Fund have equal rights with respect to voting subject to class-specific arrangements.
The Fund’s financial statements are prepared in accordance with accounting principles generally accepted in the United States of America (“U.S. GAAP”) which require the use of management estimates. Actual results could differ from those estimates. The Fund qualifies as an investment company under Topic 946 of Accounting Standards Codification of U.S. GAAP. The policies described below are followed consistently by the Fund in the preparation of its financial statements.
In October 2018, the Securities and Exchange Commission adopted amendments to certain disclosure requirements in Securities Act Release
| DWS Global Income Builder Fund | | | 51 |
Table of Contents
No. 33-10532, Disclosure Update and Simplification, which is intended to facilitate the disclosure of information to investors and simplify compliance without significantly altering the total mix of information provided to investors. Effective with the current reporting period, the Fund adopted the amendments with the impacts being that the Fund is no longer required to present components of distributable earnings on the Statement of Assets and Liabilities or the sources of distributable earnings and the amount of undistributed net investment income on the Statements of Changes in Net Assets.
Security Valuation. Investments are stated at value determined as of the close of regular trading on the New York Stock Exchange on each day the exchange is open for trading.
Various inputs are used in determining the value of the Fund’s investments. These inputs are summarized in three broad levels. Level 1 includes quoted prices in active markets for identical securities. Level 2 includes other significant observable inputs (including quoted prices for similar securities, interest rates, prepayment speeds and credit risk). Level 3 includes significant unobservable inputs (including the Fund’s own assumptions in determining the fair value of investments). The level assigned to the securities valuations may not be an indication of the risk or liquidity associated with investing in those securities.
Equity securities and exchange-traded funds (“ETFs”) are valued at the most recent sale price or official closing price reported on the exchange (U.S. or foreign) or over-the-counter market on which they trade. Equity securities or ETFs for which no sales are reported are valued at the calculated mean between the most recent bid and asked quotations on the relevant market or, if a mean cannot be determined, at the most recent bid quotation. Equity securities or ETFs are generally categorized as Level 1 securities. For certain international equity securities, in order to adjust for events which may occur between the close of the foreign exchanges and the close of the New York Stock Exchange, a fair valuation model may be used. This fair valuation model takes into account comparisons to the valuation of American Depository Receipts (ADRs), exchange-traded funds, futures contracts and certain indices and these securities are categorized as Level 2.
Debt securities and loan participations and assignments are valued at prices supplied by independent pricing services approved by the Fund’s Board. Such services may use various pricing techniques which take into account appropriate factors such as yield, quality, coupon rate, maturity, type of issue, trading characteristics, prepayment speeds and other data, as well as broker quotes. If the pricing services are unable to provide valuations, debt securities are valued at the average of the most recent reliable bid quotations or evaluated prices, as applicable, obtained from
| 52 | | | DWS Global Income Builder Fund |
Table of Contents
broker-dealers, and loan participations and assignments are valued at the mean of the most recent bid and ask quotations or evaluated prices, as applicable, obtained from broker-dealers. These securities are generally categorized as Level 2. Certain securities may be valued on the basis of a price provided by a single source or broker-dealer. No active trading market may exist for some senior loans and they may be subject to restrictions on resale. The inability to dispose of senior loans in a timely fashion could result in losses. These securities are generally categorized as Level 3.
Investments in open-end investment companies are valued at their net asset value each business day and are categorized as Level 1.
Futures contracts are generally valued at the settlement prices established each day on the exchange on which they are traded and are categorized as Level 1.
Forward currency contracts are valued at the prevailing forward exchange rate of the underlying currencies and are categorized as Level 2.
Swap contracts are valued daily based upon prices supplied by a Board approved pricing vendor, if available, and otherwise are valued at the price provided by the broker-dealer. Swap contracts are generally categorized as Level 2.
Exchange-traded options are valued at the last sale price or, in the absence of a sale, the mean between the closing bid and asked prices or at the most recent asked price (bid for purchased options) if no bid or asked price are available. Exchange-traded options are generally categorized as Level 1. Over-the-counter written or purchased options are valued at prices supplied by a Board approved pricing vendor, if available, and otherwise are valued at the price provided by the broker-dealer with which the option was traded. Over-the-counter written or purchased options are generally categorized as Level 2.
Securities and other assets for which market quotations are not readily available or for which the above valuation procedures are deemed not to reflect fair value are valued in a manner that is intended to reflect their fair value as determined in accordance with procedures approved by the Board and are generally categorized as Level 3. In accordance with the Fund’s valuation procedures, factors considered in determining value may include, but are not limited to, the type of the security; the size of the holding; the initial cost of the security; the existence of any contractual restrictions on the security’s disposition; the price and extent of public trading in similar securities of the issuer or of comparable companies; quotations or evaluated prices from broker-dealers and/or pricing services; information obtained from the issuer, analysts, and/or the appropriate stock exchange (for exchange-traded securities); an analysis of the
| DWS Global Income Builder Fund | | | 53 |
Table of Contents
company’s or issuer’s financial statements; an evaluation of the forces that influence the issuer and the market(s) in which the security is purchased and sold; and with respect to debt securities, the maturity, coupon, creditworthiness, currency denomination and the movement of the market in which the security is normally traded. The value determined under these procedures may differ from published values for the same securities.
Disclosure about the classification of fair value measurements is included in a table following the Fund’s Investment Portfolio.
Foreign Currency Translations. The books and records of the Fund are maintained in U.S. dollars. Investment securities and other assets and liabilities denominated in a foreign currency are translated into U.S. dollars at the prevailing exchange rates at period end. Purchases and sales of investment securities, income and expenses are translated into U.S. dollars at the prevailing exchange rates on the respective dates of the transactions.
Net realized and unrealized gains and losses on foreign currency transactions represent net gains and losses between trade and settlement dates on securities transactions, the acquisition and disposition of foreign currencies, and the difference between the amount of net investment income accrued and the U.S. dollar amount actually received. The portion of both realized and unrealized gains and losses on investments that results from fluctuations in foreign currency exchange rates is not separately disclosed but is included with net realized and unrealized gain/appreciation and loss/depreciation on investments.
Securities Lending. Deutsche Bank AG, as lending agent, lends securities of the Fund to certain financial institutions under the terms of its securities lending agreement. During the term of the loans, the Fund continues to receive interest and dividends generated by the securities and to participate in any changes in their market value. The Fund requires the borrowers of the securities to maintain collateral with the Fund consisting of either cash or liquid, unencumbered assets having a value at least equal to the value of the securities loaned. When the collateral falls below specified amounts, the lending agent will use its best effort to obtain additional collateral on the next business day to meet required amounts under the securities lending agreement. As of period end, any securities on loan were collateralized by cash. During the year ended October 31, 2018, the Fund invested the cash collateral into a joint trading account in affiliated money market funds managed by DWS Investment Management Americas, Inc. As of October 31, 2018, the Fund invested the cash collateral in DWS Government & Agency Securities Portfolio. DWS Investment Management Americas, Inc. receives a management/administration fee (0.12% annualized effective rate as of October 31, 2018) on the cash collateral invested in DWS Government & Agency
| 54 | | | DWS Global Income Builder Fund |
Table of Contents
Securities Portfolio. The Fund receives compensation for lending its securities either in the form of fees or by earning interest on invested cash collateral net of borrower rebates and fees paid to a lending agent. Either the Fund or the borrower may terminate the loan at any time, and the borrower, after notice, is required to return borrowed securities within a standard time period. There may be risks of delay and costs in recovery of securities or even loss of rights in the collateral should the borrower of the securities fail financially. If the Fund is not able to recover securities lent, the Fund may sell the collateral and purchase a replacement investment in the market, incurring the risk that the value of the replacement security is greater than the value of the collateral. The Fund is also subject to all investment risks associated with the reinvestment of any cash collateral received, including, but not limited to, interest rate, credit and liquidity risk associated with such investments.
As of October 31, 2018, the Fund had securities on loan, which were classified as common stocks, corporate bonds, government & agency obligations and exchange-traded funds in the Investment Portfolio. The value of the related collateral exceeded the value of the securities loaned at period end. As of period end, the remaining contractual maturity of the collateral agreements was overnight and continuous.
| Remaining Contractual Maturity of the Agreements as of October 31, 2018 | ||||||||||||||||||||
| Overnight and Continuous | <30 days | Between 30 & 90 days | >90 days | Total | ||||||||||||||||
Securities Lending Transactions |
| |||||||||||||||||||
| Common Stocks | $ | 3,571,145 | $ | — | $ | — | $ | — | $ | 3,571,145 | ||||||||||
| Corporate Bonds | 11,970,083 | — | — | — | 11,970,083 | |||||||||||||||
| Government & Agency Obligations | 1,012,500 | — | — | — | 1,012,500 | |||||||||||||||
| Total Borrowings | $ | 16,553,728 | $ | — | $ | — | $ | — | $ | 16,553,728 | ||||||||||
Gross amount of recognized liabilities for securities lending transactions |
| $ | 16,553,728 | |||||||||||||||||
Loan Participations and Assignments. Loan Participations and
Assignments are portions of loans originated by banks and sold in pieces to investors. These floating-rate loans (“Loans”) in which the Fund invests are arranged between the borrower and one or more financial institutions (“Lenders”). These Loans may take the form of Senior Loans, which are corporate obligations often issued in connection with recapitalizations, acquisitions, leveraged buyouts and refinancing. The Fund invests in such Loans in the form of participations in Loans (“Participations”) or assignments of all or a portion of Loans from third parties (“Assignments”). Participations typically result in the Fund having a contractual relationship with only the Lender, not with the borrower. The Fund has the right to receive payments of principal, interest and any fees to which it is entitled
| DWS Global Income Builder Fund | | | 55 |
Table of Contents
from the Lender selling the Participation and only upon receipt by the Lender of the payments from the borrower. In connection with purchasing Participations, the Fund generally has no right to enforce compliance by the borrower with the terms of the loan agreement relating to the Loan, or any rights of set off against the borrower, and the Fund will not benefit directly from any collateral supporting the Loan in which it has purchased the Participation. As a result, the Fund assumes the credit risk of both the borrower and the Lender that is selling the Participation. Assignments typically result in the Fund having a direct contractual relationship with the borrower, and the Fund may enforce compliance by the borrower with the terms of the loan agreement. Loans held by the Fund are generally in the form of Assignments, but the Fund may also invest in Participations. If affiliates of the Advisor participate in the primary and secondary market for senior loans, legal limitations may restrict the Fund’s ability to participate in restructuring or acquiring some senior loans. All Loans involve interest rate risk, liquidity risk and credit risk, including the potential default or insolvency of the borrower.
When-Issued/Delayed Delivery Securities. The Fund may purchase or sell securities with delivery or payment to occur at a later date beyond the normal settlement period. At the time the Fund enters into a commitment to purchase or sell a security, the transaction is recorded and the value of the transaction is reflected in the net asset value. The price of such security and the date when the security will be delivered and paid for are fixed at the time the transaction is negotiated. The value of the security may vary with market fluctuations. At the time the Fund enters into a purchase transaction it is required to segregate cash or other liquid assets at least equal to the amount of the commitment. Additionally, the Fund may be required to post securities and/or cash collateral in accordance with the terms of the commitment.
Certain risks may arise upon entering into when-issued or delayed delivery transactions from the potential inability of counterparties to meet the terms of their contracts or if the issuer does not issue the securities due to political, economic, or other factors. Additionally, losses may arise due to changes in the value of the underlying securities.
Federal Income Taxes. The Fund’s policy is to comply with the requirements of the Internal Revenue Code, as amended, which are applicable to regulated investment companies, and to distribute all of its taxable income to its shareholders.
The Fund has reviewed the tax positions for the open tax years as of October 31, 2018 and has determined that no provision for income tax and/or uncertain tax positions is required in the Fund’s financial statements. The Fund’s federal tax returns for the prior three fiscal years remain open subject to examination by the Internal Revenue Service.
| 56 | | | DWS Global Income Builder Fund |
Table of Contents
Distribution of Income and Gains. Distributions from net investment income of the Fund are declared and distributed to shareholders quarterly. Net realized gains from investment transactions, in excess of available capital loss carryforwards, would be taxable to the Fund if not distributed, and, therefore, will be distributed to shareholders at least annually. The Fund may also make additional distributions for tax purposes if necessary.
The timing and characterization of certain income and capital gain distributions are determined annually in accordance with federal tax regulations which may differ from accounting principles generally accepted in the United States of America. These differences primarily relate to paydown losses on mortgage-backed securities, premium amortization on debt securities, investments in futures, swap contracts, forward foreign currency exchange contracts, recognition of certain foreign currency gains (losses) as ordinary income (loss) and certain securities sold at a loss. As a result, net investment income (loss) and net realized gain (loss) on investment transactions for a reporting period may differ significantly from distributions during such period. Accordingly, the Fund may periodically make reclassifications among certain of its capital accounts without impacting the net asset value of the Fund.
At October 31, 2018, the Fund’s components of distributable earnings (accumulated losses) on a tax basis were as follows:
| Undistributed ordinary income* | $ | 20,460,802 | ||
| Net unrealized appreciation (depreciation) on investments | $ | (4,777,656 | ) |
At October 31, 2018, the aggregate cost of investments for federal income tax purposes was $760,006,076. The net unrealized depreciation for all investments based on tax cost was $4,777,656, consisting of aggregate gross unrealized appreciation for all investments which there was an excess of value over tax cost of $42,175,655, and aggregate gross unrealized depreciation for all investments in which there was an excess of tax cost over value of $46,953,311.
In addition, the tax character of distributions paid to shareholders by the Fund is summarized as follows:
| Years Ended October 31, | ||||||||
| 2018 | 2017 | |||||||
| Distributions from ordinary income* | $ | 28,458,372 | $ | 23,185,066 | ||||
| Distributions from long-term capital gains | $ | 54,416,929 | $ | — | ||||
| * | For tax purposes, short-term capital gain distributions are considered ordinary income distributions. |
Expenses. Expenses of the Trust arising in connection with a specific fund are allocated to that fund. Other Trust expenses which cannot be directly attributed to a fund are apportioned among the funds in the Trust based upon the relative net assets or other appropriate measures.
| DWS Global Income Builder Fund | | | 57 |
Table of Contents
Contingencies. In the normal course of business, the Fund may enter into contracts with service providers that contain general indemnification clauses. The Fund’s maximum exposure under these arrangements is unknown, as this would involve future claims that may be made against the Fund that have not yet been made. However, based on experience, the Fund expects the risk of loss to be remote.
Other. Investment transactions are accounted for on a trade date plus one basis for daily net asset value calculations. However, for financial reporting purposes, investment transactions are reported on trade date. Interest income is recorded on the accrual basis. Dividend income is recorded on the ex-dividend date net of foreign withholding taxes. Certain dividends from foreign securities may be recorded subsequent to the ex-dividend date as soon as the Fund is informed of such dividends. Realized gains and losses from investment transactions are recorded on an identified cost basis. Proceeds from litigation payments, if any, are included in net realized gain (loss) from investments. All premiums and discounts are amortized/accreted for financial reporting purposes, with the exception of securities in default of principal.
B. Derivative Instruments
Swaps. A swap is a contract between two parties to exchange future cash flows at periodic intervals based on the notional amount of the swap. A bilateral swap is a transaction between the fund and a counterparty where cash flows are exchanged between the two parties. A centrally cleared swap is a transaction executed between the fund and a counterparty, then cleared by a clearing member through a central clearinghouse. The central clearinghouse serves as the counterparty, with whom the fund exchanges cash flows.
The value of a swap is adjusted daily, and the change in value, if any, is recorded as unrealized appreciation or depreciation in the Statement of Assets and Liabilities. Gains or losses are realized when the swap expires or is closed. Certain risks may arise when entering into swap transactions including counterparty default; liquidity; or unfavorable changes in interest rates or the value of the underlying reference security, commodity or index. In connection with bilateral swaps, securities and/or cash may be identified as collateral in accordance with the terms of the swap agreement to provide assets of value and recourse in the event of default. The maximum counterparty credit risk is the net present value of the cash flows to be received from or paid to the counterparty over the term of the swap, to the extent that this amount is beneficial to the Fund, in addition to any related collateral posted to the counterparty by the Fund. This risk may be partially reduced by a master netting arrangement between the Fund and the counterparty. Upon entering into a centrally cleared swap, the Fund is required to deposit with a financial intermediary cash or
| 58 | | | DWS Global Income Builder Fund |
Table of Contents
securities (“initial margin”) in an amount equal to a certain percentage of the notional amount of the swap. Subsequent payments (“variation margin”) are made or received by the Fund dependent upon the daily fluctuations in the value of the swap. In a cleared swap transaction, counterparty risk is minimized as the central clearinghouse acts as the counterparty.
An upfront payment, if any, made by the Fund is recorded as an asset in the Statement of Assets and Liabilities. An upfront payment, if any, received by the Fund is recorded as a liability in the Statement of Assets and Liabilities. Payments received or made at the end of the measurement period are recorded as realized gain or loss in the Statement of Operations.
Interest Rate Swaps. Interest rate swaps are agreements in which the Fund agrees to pay to the counterparty a fixed rate payment in exchange for the counterparty agreeing to pay to the Fund a variable rate payment, or the Fund agrees to receive from the counterparty a fixed rate payment in exchange for the counterparty agreeing to receive from the Fund a variable rate payment. The payment obligations are based on the notional amount of the swap. For the year ended October 31, 2018, the Fund entered into interest rate swap agreements to gain exposure to different parts of the yield curve while managing overall duration.
A summary of the open interest rate swap contracts as of October 31, 2018 is included in a table following the Fund’s Investment Portfolio. For the year ended October 31, 2018, the investment in interest rate swap contracts had a total notional amount generally indicative of a range from approximately $57,900,000 to $80,000,000.
Credit Default Swaps. Credit default swaps are agreements between a buyer and a seller of protection against predefined credit events for the reference entity. The Fund may enter into credit default swaps to gain exposure to an underlying issuer’s credit quality characteristics without directly investing in that issuer or to hedge against the risk of a credit event on debt securities. As a seller of a credit default swap, the Fund is required to pay the par (or other agreed-upon) value of the referenced entity to the counterparty with the occurrence of a credit event by a third party, such as a U.S. or foreign corporate issuer, on the reference entity, which would likely result in a loss to the Fund. In return, the Fund receives from the counterparty a periodic stream of payments over the term of the swap provided that no credit event has occurred. If no credit event occurs, the Fund keeps the stream of payments with no payment obligations. The Fund may also buy credit default swaps, in which case the Fund functions as the counterparty referenced above. This involves the risk that the swap may expire worthless. It also involves counterparty risk that the seller may fail to satisfy its payment obligations to the Fund with the occurrence of a credit event. When the Fund sells a credit
| DWS Global Income Builder Fund | | | 59 |
Table of Contents
default swap, it will cover its commitment. This may be achieved by, among other methods, maintaining cash or liquid assets equal to the aggregate notional value of the reference entities for all outstanding credit default swaps sold by the Fund. For the year ended October 31, 2018, the Fund entered into credit default swap agreements to gain exposure to the underlying issuer’s credit quality characteristics and to hedge the risk of default or other specified credit events on portfolio assets.
Under the terms of a credit default swap, the Fund receives or makes periodic payments based on a specified interest rate on a fixed notional amount. These payments are recorded as a realized gain or loss in the Statement of Operations. Payments received or made as a result of a credit event or termination of the swap are recognized, net of a proportional amount of the upfront payment, as realized gains or losses in the Statement of Operations.
A summary of the open credit default swap contracts as of October 31, 2018 is included in a table following the Fund’s Investment Portfolio. For the year ended October 31, 2018, the investment in credit default swap contracts purchased had a total notional amount generally indicative of a range from $0 to approximately $36,000,000. The investment in credit default swap contracts sold had a total notional amount generally indicative of a range from approximately $12,256,000 to $41,800,000.
Total Return Swap Contracts. Total return swaps involve commitments to pay interest in exchange for a market-linked return based on a notional amount. One counterparty pays out the total return of the reference security or index underlying the total return swap, and in return receives a fixed or variable rate. As a receiver, the Fund would receive payments based on any positive total return and would owe payments in the event of a negative total return. As the payer, the Fund would owe payments on any net positive total return, and would receive payments in the event of a negative total return. For the year ended October 31, 2018, the Fund entered into total return swap transactions as a means of gaining exposure to a particular asset class without investing directly in such asset class.
A summary of the open total return swap contracts as of October 31, 2018 is included in a table following the Fund’s Investment Portfolio. For the year ended October 31, 2018, the investment in total return swap contracts had a total notional amount generally indicative of a range from $0 to approximately $88,913,000.
Futures Contracts. A futures contract is an agreement between a buyer or seller and an established futures exchange or its clearinghouse in which the buyer or seller agrees to take or make a delivery of a specific amount of a financial instrument at a specified price on a specific date (settlement date). For the year ended October 31, 2018, the Fund entered
| 60 | | | DWS Global Income Builder Fund |
Table of Contents
into interest rate futures to gain exposure to different parts of the yield curve while managing overall duration. The Fund also entered into interest rate futures contracts for non-hedging purposes to seek to enhance potential gains and entered into equity index futures in order to reduce the Fund’s exposure to, or as a substitute for direct investment in, the equity asset class.
Upon entering into a futures contract, the Fund is required to deposit with a financial intermediary cash or securities (“initial margin”) in an amount equal to a certain percentage of the face value indicated in the futures contract. Subsequent payments (“variation margin”) are made or received by the Fund dependent upon the daily fluctuations in the value and are recorded for financial reporting purposes as unrealized gains or losses by the Fund. Gains or losses are realized when the contract expires or is closed. Since all futures contracts are exchange traded, counterparty risk is minimized as the exchange’s clearinghouse acts as the counterparty and guarantees the futures against default.
Certain risks may arise upon entering into futures contracts, including the risk that an illiquid market will limit the Fund’s ability to close out a futures contract prior to the settlement date and the risk that the futures contract is not well correlated with the security, index or currency to which it relates. Risk of loss may exceed amounts disclosed in the Statement of Assets and Liabilities.
A summary of the open futures contracts as of October 31, 2018, is included in a table following the Fund’s Investment Portfolio. For the year ended October 31, 2018, the investment in futures contracts purchased had a total notional value generally indicative of a range from approximately $110,311,000 to $165,289,000, and the investment in futures contracts sold had a total notional value generally indicative of a range from approximately $101,154,000 to $192,749,000.
Options. An option contract is a contract in which the writer (seller) of the option grants the buyer of the option, upon payment of a premium, the right to purchase from (call option), or sell to (put option), the writer a designated instrument at a specified price within a specified period of time. The Fund may write or purchase interest rate swaption agreements which are options to enter into a pre-defined swap agreement. The interest rate swaption agreement will specify whether the buyer of the swaption will be a fixed-rate receiver or a fixed-rate payer upon exercise. Certain options, including options on indices and interest rate options, will require cash settlement by the Fund if exercised. For the year ended October 31, 2018, the Fund entered into options contracts in order to manage the risk of stock market volatility and in order to hedge against potential adverse interest rate movements of portfolio assets.
| DWS Global Income Builder Fund | | | 61 |
Table of Contents
If the Fund writes a covered call option, the Fund foregoes, in exchange for the premium, the opportunity to profit during the option period from an increase in the market value of the underlying security above the exercise price. If the Fund writes a put option it accepts the risk of a decline in the value of the underlying security below the exercise price. Over-the-counter options have the risk of the potential inability of counterparties to meet the terms of their contracts. The Fund’s maximum exposure to purchased options is limited to the premium initially paid. In addition, certain risks may arise upon entering into option contracts including the risk that an illiquid secondary market will limit the Fund’s ability to close out an option contract prior to the expiration date and that a change in the value of the option contract may not correlate exactly with changes in the value of the securities hedged.
There were no open purchased option contracts held by the Fund as of October 31, 2018. A summary of open written option contracts is included in the table following the Fund’s Investment Portfolio. For the year ended October 31, 2018, the investment in written option contracts had a total value generally indicative of a range from $0 to approximately $3,708,000, and purchased option contracts had a total value generally indicative of a range from $0 to approximately $360,000.
Forward Foreign Currency Exchange Contracts. A forward foreign currency exchange contract (“forward currency contract”) is a commitment to purchase or sell a foreign currency at the settlement date at a negotiated rate. For the year ended October 31, 2018, the Fund entered into forward currency contracts in order to hedge its exposure to changes in foreign currency exchange rates on its foreign currency denominated portfolio holdings, to facilitate transactions in foreign currency denominated securities and for non-hedging purposes to seek to enhance potential gains.
Forward currency contracts are valued at the prevailing forward exchange rate of the underlying currencies and unrealized gain (loss) is recorded daily. On the settlement date of the forward currency contract, the Fund records a realized gain or loss equal to the difference between the value of the contract at the time it was opened and the value of the contract at the time it was closed. Certain risks may arise upon entering into forward currency contracts from the potential inability of counterparties to meet the terms of their contracts. The maximum counterparty credit risk to the Fund is measured by the unrealized gain on appreciated contracts. Additionally, when utilizing forward currency contracts to hedge, the Fund gives up the opportunity to profit from favorable exchange rate movements during the term of the contract.
A summary of the open forward currency contracts as of October 31, 2018, is included in a table following the Fund’s Investment Portfolio. For the year ended October 31, 2018, the investment in forward currency contracts short vs. U.S. dollars had a total contract value generally
| 62 | | | DWS Global Income Builder Fund |
Table of Contents
indicative of a range from approximately $101,688,000 to $209,204,000, and the investment in forward currency contracts long vs. U.S. dollars had a total contract value generally indicative of a range from approximately $18,094,000 to $143,398,000.
The following tables summarize the value of the Fund’s derivative instruments held as of October 31, 2018 and the related location in the accompanying Statement of Assets and Liabilities, presented by primary underlying risk exposure:
| Asset Derivatives | Forward Contracts | Swap Contracts | Futures Contracts | Total | ||||||||||||
| Interest Rate Contracts (a) | $ | — | $ | 833,487 | $ | 127,773 | $ | 961,260 | ||||||||
| Credit Contracts (a) | — | 78,458 | — | 78,458 | ||||||||||||
| Foreign Exchange Contracts (b) | 2,890,675 | — | — | 2,890,675 | ||||||||||||
| $ | 2,890,675 | $ | 911,945 | $ | 127,773 | $ | 3,930,393 | |||||||||
Each of the above derivatives is located in the following Statement of Assets and Liabilities
accounts:
| (a) | Includes cumulative appreciation of futures and centrally cleared swap contracts as disclosed in the Investment Portfolio. Unsettled variation margin is disclosed separately within the Statement of Assets and Liabilities. |
| (b) | Unrealized appreciation on forward foreign currency contracts |
| Liability Derivatives | Forward Contracts | Swap Contracts | Futures Contracts | Total | ||||||||||||
| Equity Contracts (c) | $ | — | $ | — | $ | (4,343,312 | ) | $ | (4,343,312 | ) | ||||||
| Interest Rate Contracts (c) | — | (710,136 | ) | (348,310 | ) | (1,058,446 | ) | |||||||||
| Credit Contracts (c) | — | (239,736 | ) | — | (239,736 | ) | ||||||||||
| Foreign Exchange Contracts (d) | (2,929,730 | ) | — | — | (2,929,730 | ) | ||||||||||
| $ | (2,929,730 | ) | $ | (949,872 | ) | $ | (4,691,622 | ) | $ | (8,571,224 | ) | |||||
| (c) | Includes cumulative depreciation of futures and centrally cleared swap contracts as disclosed in the Investment Portfolio. Unsettled variation margin is disclosed separately within the Statement of Assets and Liabilities. |
| (d) | Unrealized depreciation on forward foreign currency contracts |
Additionally, the amount of unrealized and realized gains and losses on derivative instruments recognized in Fund earnings during the year ended October 31, 2018 and the related location in the accompanying Statement
| DWS Global Income Builder Fund | | | 63 |
Table of Contents
of Operations is summarized in the following tables by primary underlying risk exposure:
| Realized Gain (Loss) | ||||||||||||||||||||||||
Purchased Options | Written Options | Forward Contracts | Swap Contracts | Futures Contracts | Total | |||||||||||||||||||
| Equity Contracts (e) | $ | (371,043 | ) | $ | (585,000 | ) | $ | — | $ | 6,264,510 | $ | (41,939 | ) | $ | 5,266,528 | |||||||||
| Interest Rate Contracts (e) | — | 2,537,458 | — | 1,694,000 | (2,002,873 | ) | 2,228,585 | |||||||||||||||||
| Credit Contracts (e) | — | — | — | 536,706 | — | 536,706 | ||||||||||||||||||
| Foreign Exchange Contracts (e) | — | — | 1,921,891 | — | — | 1,921,891 | ||||||||||||||||||
| $ | (371,043 | ) | $ | 1,952,458 | $ | 1,921,891 | $ | 8,495,216 | $ | (2,044,812 | ) | $ | 9,953,710 | |||||||||||
Each of the above derivatives is located in the following Statement of Operations accounts:
| (e) | Net realized gain (loss) from investments (includes purchased options), written options, forward foreign currency contracts, swap contracts and futures, respectively |
| Change in Appreciation (Depreciation) | ||||||||||||||||||||||||
Purchased Options | Written Options | Forward Contracts | Swap Contracts | Futures Contracts | Total | |||||||||||||||||||
| Equity Contracts (f) | $ | 680,643 | $ | (266,400 | ) | $ | — | $ | (2,216,322 | ) | $ | (7,137,223 | ) | $ | (8,939,302 | ) | ||||||||
| Interest Rate Contracts (f) | — | — | — | (594,170 | ) | (141,708 | ) | (735,878 | ) | |||||||||||||||
| Credit Contracts (f) | — | — | — | (541,030 | ) | — | (541,030 | ) | ||||||||||||||||
| Foreign Exchange Contracts (f) | — | — | 342,427 | — | — | 342,427 | ||||||||||||||||||
| $ | 680,643 | $ | (266,400 | ) | $ | 342,427 | $ | (3,351,522 | ) | $ | (7,278,931 | ) | $ | (9,873,783 | ) | |||||||||
Each of the above derivatives is located in the following Statement of Operations accounts:
| (f) | Change in net unrealized appreciation (depreciation) on investments (includes purchased options), written options, forward foreign currency contracts, swap contracts and futures, respectively |
As of October 31, 2018, the Fund has transactions subject to enforceable master netting agreements which govern the terms of certain transactions, and reduce the counterparty risk associated with such transactions. Master netting agreements allow a Fund to close out and net total exposure to a counterparty in the event of a deterioration in the credit quality or contractual default with respect to all of the transactions with a counterparty. As defined by the master netting agreement, the Fund may have collateral agreements with certain counterparties to mitigate risk. For financial reporting purposes the Statement of Assets and Liabilities generally shows derivatives assets and liabilities on a gross basis, which reflects the full risks and exposures prior to netting. A reconciliation of the gross amounts on the Statement of Assets and
| 64 | | | DWS Global Income Builder Fund |
Table of Contents
Liabilities to the net amounts by counterparty, including any collateral exposure, is included in the following tables:
| Counterparty | Gross Amounts of Assets Presented in the Statement of Assets and Liabilities | Financial Instruments and Derivatives Available for Offset | Non-Cash Collateral Received | Cash Collateral Received | Net Amount of Derivative Assets | |||||||||||||||
| Bank of America | $ | 52,146 | $ | — | $ | — | $ | — | $ | 52,146 | ||||||||||
| Barclays Bank PLC | 288,424 | (288,424 | ) | — | — | — | ||||||||||||||
| Credit Agricole | 1,273,717 | (1,273,717 | ) | — | — | — | ||||||||||||||
| Morgan Stanley | 492,383 | (492,383 | ) | — | — | — | ||||||||||||||
| State Street Bank and Trust | 760,531 | (399,267 | ) | — | — | 361,264 | ||||||||||||||
| Toronto-Dominion Bank | 23,474 | — | — | — | 23,474 | |||||||||||||||
| $ | 2,890,675 | $ | (2,453,791 | ) | $ | — | $ | — | $ | 436,884 | ||||||||||
| Counterparty | Gross Amounts of Liabilities Presented in the Statement of Assets and Liabilities | Financial Instruments and Derivatives Available for Offset | Non-Cash Collateral Pledged (i) | Cash Collateral Pledged | Net Amount of Derivative Liabilities | |||||||||||||||
| Barclays Bank PLC | $ | 684,086 | $ | (288,424 | ) | $ | — | $ | — | $ | 395,662 | |||||||||
| Credit Agricole | 1,294,428 | (1,273,717 | ) | — | — | 20,711 | ||||||||||||||
| Morgan Stanley | 551,949 | (492,383 | ) | — | — | 59,566 | ||||||||||||||
| State Street Bank and Trust | 399,267 | (399,267 | ) | — | — | — | ||||||||||||||
| $ | 2,929,730 | $ | (2,453,791 | ) | $ | — | $ | — | $ | 475,939 | ||||||||||
| (i) | The actual collateral pledged may be more than the amounts shown. |
C. Purchases and Sales of Securities
During the year ended October 31, 2018, purchases and sales of investment securities, excluding short-term investments, were as follows:
| Purchases | Sales | |||||||
| Non-U.S. Treasury Obligations | $ | 477,087,643 | $ | 554,378,092 | ||||
| U.S. Treasury Obligations | $ | 20,087,338 | $ | 14,985,961 | ||||
D. Related Parties
Management Agreement. Under the Investment Management Agreement with DWS Investment Management Americas, Inc. (formerly
| DWS Global Income Builder Fund | | | 65 |
Table of Contents
Deutsche Investment Management Americas Inc.) (“DIMA” or the “Advisor”), an indirect, wholly owned subsidiary of DWS Group GmbH & Co. KGaA (“DWS Group”), the Advisor directs the investments of the Fund in accordance with its investment objectives, policies and restrictions. The Advisor determines the securities, instruments and other contracts relating to investments to be purchased, sold or entered into by the Fund.
Deutsche Alternative Asset Management (Global) Limited (DAAM Global), also an indirect, wholly owned subsidiary of Deutsche Bank AG, serves as subadvisor for the Fund and, as such, provides portfolio manager services to the Fund. Pursuant to a sub-advisory agreement between DIMA and DAAM Global, DIMA, not the Fund, compensates DAAM Global for the services it provides to the Fund.
Under the Management Agreement, the Fund pays a monthly management fee based on the Fund’s average daily net assets, computed and accrued daily and payable monthly at the following rates:
| First $1.5 billion of the Fund’s average daily net assets | .370% | |||
| Next $500 million of such net assets | .345% | |||
| Next $1.5 billion of such net assets | .310% | |||
| Next $2.0 billion of such net assets | .300% | |||
| Next $2.0 billion of such net assets | .290% | |||
| Next $2.5 billion of such net assets | .280% | |||
| Next $2.5 billion of such net assets | .270% | |||
| Over $12.5 billion of such net assets | .260% |
Accordingly, for the year ended October 31, 2018, the fee pursuant to the Investment Management Agreement was equivalent to an annual rate (exclusive of any applicable waivers/reimbursements) of 0.370% of the Fund’s average daily net assets.
For the period from November 1, 2017 through September 30, 2018, the Advisor had contractually agreed to waive its fees and/or reimburse certain operating expenses of the Fund to the extent necessary to maintain the total annual operating expenses (excluding certain expenses such as extraordinary expenses, taxes, brokerage and interest) of each class as follows:
| Class A | 1.21% | |||
| Class C | 1.96% | |||
| Class R6 | .96% | |||
| Class S | .96% | |||
| Institutional Class | .96% |
| 66 | | | DWS Global Income Builder Fund |
Table of Contents
Effective October 1, 2018 through September 30, 2019, the Advisor has contractually agreed to waive its fees and/or reimburse certain operating expenses of the Fund to the extent necessary to maintain the total annual operating expenses (excluding certain expenses such as extraordinary expenses, taxes, brokerage and interest) of each class as follows:
| Class A | 1.25% | |||
| Class C | 2.00% | |||
| Class R6 | 1.00% | |||
| Class S | 1.00% | |||
| Institutional Class | 1.00% |
In addition, for the period from November 1,2017 through February 12, 2018, the Advisor had voluntarily agreed to waive its fees and/or reimburse certain operating expenses of Class R6 shares to the extent necessary to maintain the total annual operating expenses (excluding certain expenses such as extraordinary expenses, taxes, brokerage and interest) at 0.68%. This voluntary waiver or reimbursement might be terminated at any time at the option of the Advisor.
Administration Fee. Pursuant to an Administrative Services Agreement, DIMA provides most administrative services to the Fund. For all services provided under the Administrative Services Agreement, the Fund pays the Advisor an annual fee (“Administration Fee”) of 0.10% of the Fund’s average daily net assets, computed and accrued daily and payable monthly. For the year ended October 31, 2018, the Administration Fee was $796,966, of which $63,824 is unpaid.
Service Provider Fees. DWS Service Company (“DSC”), an affiliate of the Advisor, is the transfer agent, dividend-paying agent and shareholder service agent for the Fund. Pursuant to a sub-transfer agency agreement among DSC and DST Systems, Inc. (“DST”), DSC has delegated certain transfer agent, dividend-paying agent and shareholder service agent functions to DST. DSC compensates DST out of the shareholder servicing fee it receives from the Fund. For the year ended October 31, 2018, the amounts charged to the Fund by DSC were as follows:
| Services to Shareholders | Total Aggregated | Unpaid at October 31, 2018 | ||||||
| Class A | $ | 321,261 | $ | 105,529 | ||||
| Class C | 9,282 | 3,025 | ||||||
| Class R6 | 101 | 19 | ||||||
| Class S | 184,446 | 60,753 | ||||||
| Institutional Class | 560 | 199 | ||||||
| $ | 515,650 | $ | 169,525 | |||||
| DWS Global Income Builder Fund | | | 67 |
Table of Contents
In addition, for the year ended October 31, 2018, the amounts charged to the Fund for recordkeeping and other administrative services provided by unaffiliated third parties, included in the Statement of Operations under “Services to shareholders”, were as follows:
Sub-Recordkeeping | Total Aggregated | |||
| Class A | $ | 284,697 | ||
| Class C | 7,611 | |||
| Class S | 63,593 | |||
| Institutional Class | 10,553 | |||
| $ | 366,454 | |||
Distribution and Service Fees. Under the Fund’s Class C 12b-1 Plan, DWS Distributors, Inc. (“DDI”), an affiliate of the Advisor, receives a fee (“Distribution Fee”) of 0.75% of average daily net assets of Class C shares. In accordance with the Fund’s Underwriting and Distribution Services Agreement, DDI enters into related selling group agreements with various firms at various rates for sales of Class C shares. For the year ended October 31, 2018, the Distribution Fee was as follows:
| Distribution Fee | Total Aggregated | Unpaid at October 31, 2018 | ||||||
| Class C | $ | 129,733 | $ | 6,618 | ||||
In addition, DDI provides information and administrative services for a fee (“Service Fee”) to Class A and C shareholders at an annual rate of up to 0.25% of average daily net assets for each such class. DDI in turn has various agreements with financial services firms that provide these services and pays these fees based upon the assets of shareholder accounts the firms service. For the year ended October 31, 2018, the Service Fee was as follows:
| Service Fee | Total Aggregated | Unpaid at October 31, 2018 | Annual Rate | |||||||||
| Class A | $ | 1,346,254 | $ | 229,138 | .23 | % | ||||||
| Class C | 42,241 | 4,534 | .24 | % | ||||||||
| $ | 1,388,495 | $ | 233,672 | |||||||||
Underwriting and Contingent Deferred Sales Charge. DDI is the principal underwriter for the Fund. Underwriting commissions paid in connection with the distribution of Class A shares for the year ended October 31, 2018 aggregated $17,131.
In addition, DDI receives any contingent deferred sales charge (“CDSC”) from Class C share redemptions occurring within one year of purchase. There is no such charge upon redemption of any share appreciation or reinvested dividends. The CDSC is 1% of the value of the shares
| 68 | | | DWS Global Income Builder Fund |
Table of Contents
redeemed for Class C. For the year ended October 31, 2018, the CDSC for Class C shares aggregated $361. A deferred sales charge of up to 1% is assessed on certain redemptions for Class A shares. For the year ended October 31, 2018, DDI received $1,084 for Class A shares.
Typesetting and Filing Service Fees. Under an agreement with DIMA, DIMA is compensated for providing certain pre-press and regulatory filing services to the Fund. For the year ended October 31, 2018, the amount charged to the Fund by DIMA included in the Statement of Operations under “Reports to shareholders” aggregated $28,289, of which $13,433 is unpaid.
Trustees’ Fees and Expenses. The Fund paid retainer fees to each Trustee not affiliated with the Advisor, plus specified amounts to the Board Chairperson and to each committee Chairperson.
Affiliated Cash Management Vehicles. The Fund may invest uninvested cash balances in DWS Central Cash Management Government Fund and DWS ESG Liquidity Fund, affiliated money market funds which are managed by the Advisor. Each affiliated money market fund is managed in accordance with Rule 2a-7 under the 1940 Act, which governs the quality, maturity, diversity and liquidity of instruments in which a money market fund may invest. DWS Central Cash Management Government Fund seeks to maintain a stable net asset value, and DWS ESG Liquidity Fund maintains a floating net asset value. The Fund indirectly bears its proportionate share of the expenses of each affiliated money market fund in which it invests. DWS Central Cash Management Government Fund does not pay the Advisor an investment management fee. To the extent that DWS ESG Liquidity Fund pays an investment management fee to the Advisor, the Advisor will waive an amount of the investment management fee payable to the Advisor by the Fund equal to the amount of the investment management fee payable on the Fund’s assets invested in DWS ESG Liquidity Fund.
Security Lending Fees. Deutsche Bank AG serves as lending agent for the Fund. For the year ended October 31, 2018, the Fund incurred lending agent fees to Deutsche Bank AG for the amount of $34,898.
E. Line of Credit
The Fund and other affiliated funds (the “Participants”) share in a $400 million revolving credit facility provided by a syndication of banks. The Fund may borrow for temporary or emergency purposes, including the meeting of redemption requests that otherwise might require the untimely disposition of securities. The Participants are charged an annual commitment fee which is allocated based on net assets, among each of the Participants. Interest is calculated at a rate per annum equal to the sum of the Federal Funds Rate plus 1.25 percent plus if the one-month
| DWS Global Income Builder Fund | | | 69 |
Table of Contents
LIBOR exceeds the Federal Funds Rate, the amount of such excess. The Fund may borrow up to a maximum of 33 percent of its net assets under the agreement. The Fund had no outstanding loans at October 31, 2018.
F. Fund Share Transactions
The following table summarizes share and dollar activity in the Fund:
| Year Ended October 31, 2018 | Year Ended October 31, 2017 | |||||||||||||||
| Shares | Dollars | Shares | Dollars | |||||||||||||
| Shares sold | ||||||||||||||||
| Class A | 2,052,643 | $ | 19,471,375 | 2,002,577 | $ | 19,021,183 | ||||||||||
| Class C | 226,823 | 2,181,745 | 339,349 | 3,184,591 | ||||||||||||
| Class R6 | 117,606 | 1,157,370 | 385,057 | 3,709,283 | ||||||||||||
| Class S | 1,718,089 | 15,948,905 | 1,750,291 | 16,576,202 | ||||||||||||
| Institutional Class | 533,190 | 5,039,074 | 765,386 | 7,290,208 | ||||||||||||
| $ | 43,798,469 | $ | 49,781,467 | |||||||||||||
| Shares issued to shareholders in reinvestment of distributions |
| |||||||||||||||
| Class A | 6,112,892 | $ | 57,859,550 | 1,687,650 | $ | 16,054,677 | ||||||||||
| Class C | 187,993 | 1,781,112 | 42,009 | 399,559 | ||||||||||||
| Class R6 | 30,941 | 292,492 | 6,045 | 58,522 | ||||||||||||
| Class S | 1,968,919 | 18,631,607 | 564,139 | 5,366,480 | ||||||||||||
| Institutional Class | 117,392 | 1,108,665 | 27,284 | 259,525 | ||||||||||||
| $ | 79,673,426 | $ | 22,138,763 | |||||||||||||
| Shares redeemed |
| |||||||||||||||
| Class A | (8,458,369 | ) | $ | (80,579,761 | ) | (9,238,650 | ) | $ | (87,661,983 | ) | ||||||
| Class C | (1,295,599 | ) | (12,195,418 | ) | (621,426 | ) | (5,906,590 | ) | ||||||||
| Class R6 | (476,320 | ) | (4,504,044 | ) | (5,899 | ) | (59,035 | ) | ||||||||
| Class S | (2,703,608 | ) | (25,642,028 | ) | (3,889,244 | ) | (36,859,559 | ) | ||||||||
| Institutional Class | (313,309 | ) | (2,986,340 | ) | (651,666 | ) | (6,165,625 | ) | ||||||||
| $ | (125,907,591 | ) | $ | (136,652,792 | ) | |||||||||||
| Net increase (decrease) |
| |||||||||||||||
| Class A | (292,834 | ) | $ | (3,248,836 | ) | (5,548,423 | ) | $ | (52,586,123 | ) | ||||||
| Class C | (880,783 | ) | (8,232,561 | ) | (240,068 | ) | (2,322,440 | ) | ||||||||
| Class R6 | (327,773 | ) | (3,054,182 | ) | 385,203 | 3,708,770 | ||||||||||
| Class S | 983,400 | 8,938,484 | (1,574,814 | ) | (14,916,877 | ) | ||||||||||
| Institutional Class | 337,273 | 3,161,399 | 141,004 | 1,384,108 | ||||||||||||
| $ | (2,435,696 | ) | $ | (64,732,562 | ) | |||||||||||
| 70 | | | DWS Global Income Builder Fund |
Table of Contents
Report of Independent Registered Public Accounting Firm
To the Board of Trustees of Deutsche DWS Market Trust and Shareholders of DWS Global Income Builder Fund:
Opinion on the Financial Statements
We have audited the accompanying statement of assets and liabilities of DWS Global Income Builder Fund (formerly Deutsche Global Income Builder Fund) (the “Fund”) (one of the funds constituting Deutsche DWS Market Trust (formerly Deutsche Market Trust)) (the “Trust”), including the investment portfolio, as of October 31, 2018, and the related statement of operations for the year then ended, the statements of changes in net assets for each of the two years in the period then ended, the financial highlights for each of the five years in the period then ended and the related notes (collectively referred to as the “financial statements”). In our opinion, the financial statements present fairly, in all material respects, the financial position of the Fund (one of the funds constituting Deutsche DWS Market Trust) at October 31, 2018, the results of its operations for the year then ended, the changes in its net assets for each of the two years in the period then ended and its financial highlights for each of the five years in the period then ended, in conformity with U.S. generally accepted accounting principles.
Basis for Opinion
These financial statements are the responsibility of the Trust’s management. Our responsibility is to express an opinion on the Fund’s financial statements based on our audits. We are a public accounting firm registered with the Public Company Accounting Oversight Board (United States) (“PCAOB”) and are required to be independent with respect to the Trust in accordance with the U.S. federal securities laws and the applicable rules and regulations of the Securities and Exchange Commission and the PCAOB.
We conducted our audits in accordance with the standards of the PCAOB. Those standards require that we plan and perform the audit to obtain reasonable assurance about whether the financial statements are free of material misstatement, whether due to error or fraud. The Trust is not required to have, nor were we engaged to perform, an audit of the Trust’s
| DWS Global Income Builder Fund | | | 71 |
Table of Contents
internal control over financial reporting. As part of our audits, we are required to obtain an understanding of internal control over financial reporting, but not for the purpose of expressing an opinion on the effectiveness of the Trust’s internal control over financial reporting. Accordingly, we express no such opinion.
Our audits included performing procedures to assess the risks of material misstatement of the financial statements, whether due to error or fraud, and performing procedures that respond to those risks. Such procedures included examining, on a test basis, evidence regarding the amounts and disclosures in the financial statements. Our procedures included confirmation of securities owned as of October 31, 2018, by correspondence with the custodian and brokers or by other appropriate auditing procedures where replies from brokers were not received. Our audits also included evaluating the accounting principles used and significant estimates made by management, as well as evaluating the overall presentation of the financial statements. We believe that our audits provide a reasonable basis for our opinion.

We have served as the auditor of one or more investment companies in the DWS family of funds since at least 1979, but we are unable to determine the specific year.
Boston, Massachusetts
December 20, 2018
| 72 | | | DWS Global Income Builder Fund |
Table of Contents
Information About Your Fund’s Expenses
As an investor of the Fund, you incur two types of costs: ongoing expenses and transaction costs. Ongoing expenses include management fees, distribution and service (12b-1) fees and other Fund expenses. Examples of transaction costs include sales charges (loads) and account maintenance fees, which are not shown in this section. The following tables are intended to help you understand your ongoing expenses (in dollars) of investing in the Fund and to help you compare these expenses with the ongoing expenses of investing in other mutual funds. The example in the table is based on an investment of $1,000 invested at the beginning of the six-month period and held for the entire period (May 1, 2018 to October 31, 2018).
The tables illustrate your Fund’s expenses in two ways:
| – | Actual Fund Return. This helps you estimate the actual dollar amount of ongoing expenses (but not transaction costs) paid on a $1,000 investment in the Fund using the Fund’s actual return during the period. To estimate the expenses you paid over the period, simply divide your account value by $1,000 (for example, an $8,600 account value divided by $1,000 = 8.6), then multiply the result by the number in the “Expenses Paid per $1,000” line under the share class you hold. |
| – | Hypothetical 5% Fund Return. This helps you to compare your Fund’s ongoing expenses (but not transaction costs) with those of other mutual funds using the Fund’s actual expense ratio and a hypothetical rate of return of 5% per year before expenses. Examples using a 5% hypothetical fund return may be found in the shareholder reports of other mutual funds. The hypothetical account values and expenses may not be used to estimate the actual ending account balance or expenses you paid for the period. |
Please note that the expenses shown in these tables are meant to highlight your ongoing expenses only and do not reflect any transaction costs. The “Expenses Paid per $1,000” line of the tables is useful in comparing ongoing expenses only and will not help you determine the relative total expense of owning different funds. Subject to certain exceptions, an account maintenance fee of $20.00 assessed once per calendar year for Classes A, C and S shares may apply for accounts with balances less than $10,000. This fee is not included in these tables. If it was, the estimate of expenses paid for Classes A, C and S shares during the period would be higher, and account value during the period would be lower, by this amount.
| DWS Global Income Builder Fund | | | 73 |
Table of Contents
| Expenses and Value of a $1,000 Investment for the six months ended October 31, 2018 | ||||||||||||||||||||
| Actual Fund Return | Class A | Class C | Class R6 | Class S | Institutional Class | |||||||||||||||
| Beginning Account Value 5/1/18 | $ | 1,000.00 | $ | 1,000.00 | $ | 1,000.00 | $ | 1,000.00 | $ | 1,000.00 | ||||||||||
| Ending Account Value 10/31/18 | $ | 980.90 | $ | 978.10 | $ | 982.50 | $ | 983.10 | $ | 982.00 | ||||||||||
| Expenses Paid per $1,000* | $ | 4.49 | $ | 8.18 | $ | 2.90 | $ | 3.45 | $ | 3.30 | ||||||||||
| Hypothetical 5% Fund Return | ||||||||||||||||||||
| Beginning Account Value 5/1/18 | $ | 1,000.00 | $ | 1,000.00 | $ | 1,000.00 | $ | 1,000.00 | $ | 1,000.00 | ||||||||||
| Ending Account Value 10/31/18 | $ | 1,020.67 | $ | 1,016.94 | $ | 1,022.28 | $ | 1,021.73 | $ | 1,021.88 | ||||||||||
| Expenses Paid per $1,000* | $ | 4.58 | $ | 8.34 | $ | 2.96 | $ | 3.52 | $ | 3.36 | ||||||||||
| * | Expenses are equal to the Fund’s annualized expense ratio for each share class, multiplied by the average account value over the period, multiplied by 184 (the number of days in the most recent six-month period), then divided by 365. |
| Annualized Expense Ratios | Class A | Class C | Class R6 | Class S | Institutional Class | |||||||||||||||
| DWS Global Income Builder Fund | .90 | % | 1.64 | % | .58 | % | .69 | % | .66 | % | ||||||||||
For more information, please refer to the Fund’s prospectus.
For an analysis of the fees associated with an investment in the Fund or
similar funds, please refer to http://apps.finra.org/fundanalyzer/1/fa.aspx.
| Tax Information | (Unaudited) |
The Fund paid distributions of $0.67 per share from net long-term capital gains during its year ended October 31, 2018.
For corporate shareholders, 27% of the income dividends paid during the Fund’s fiscal year ended October 31, 2018 qualified for the dividends received deduction.
For federal income tax purposes, the Fund designates approximately $22,929,000, or the maximum amount allowable under tax law, as qualified dividend income.
A total of 1% of the dividends distributed during the fiscal year was derived from interest on U.S. government securities, which is generally exempt from state income tax.
Please consult a tax advisor if you have questions about federal or state income tax laws, or on how to prepare your tax returns. If you have specific questions about your account, please call (800) 728-3337.
| 74 | | | DWS Global Income Builder Fund |
Table of Contents
Advisory Agreement Board Considerations and Fee Evaluation
The Board of Trustees (hereinafter referred to as the “Board” or “Trustees”) approved the renewal of DWS Global Income Builder Fund’s (the “Fund”) investment management agreement (the “Agreement”) with DWS Investment Management Americas, Inc. (“DIMA”) and sub-advisory agreement (the “Sub-Advisory Agreement” and together with the Agreement, the “Agreements”) between DIMA and Deutsche Alternative Asset Management (Global) Limited (“DAAM Global”), an affiliate of DIMA, in September 2018.
In terms of the process that the Board followed prior to approving the Agreements, shareholders should know that:
| – | During the entire process, all of the Fund’s Trustees were independent of DIMA and its affiliates (the “Independent Trustees”). |
| – | The Board met frequently during the past year to discuss fund matters and dedicated a substantial amount of time to contract review matters. Over the course of several months, the Board’s Contract Committee reviewed extensive materials received from DIMA, independent third parties and independent counsel. These materials included an analysis of the Fund’s performance, fees and expenses, and profitability from a fee consultant retained by the Fund’s Independent Trustees (the “Fee Consultant”). Based on its evaluation of the information provided, the Contract Committee presented its findings and recommendations to the Board. The Board then reviewed the Contract Committee’s findings and recommendations. |
| – | The Board also received extensive information throughout the year regarding performance of the Fund. |
| – | The Independent Trustees regularly met privately with counsel to discuss contract review and other matters. In addition, the Independent Trustees were advised by the Fee Consultant in the course of their review of the Fund’s contractual arrangements and considered a comprehensive report prepared by the Fee Consultant in connection with their deliberations. |
| – | In connection with reviewing the Agreements, the Board also reviewed the terms of the Fund’s Rule 12b-1 plan, distribution agreement, administrative services agreement, transfer agency agreement and other material service agreements. |
In connection with the contract review process, the Contract Committee and the Board considered the factors discussed below, among others. The Board also considered that DIMA and its predecessors have managed
| DWS Global Income Builder Fund | | | 75 |
Table of Contents
the Fund since its inception, and the Board believes that a long-term relationship with a capable, conscientious advisor is in the best interests of the Fund. The Board considered, generally, that shareholders chose to invest or remain invested in the Fund knowing that DIMA managed the Fund. DIMA and DAAM Global are part of DWS Group GmbH & Co. KGaA (“DWS Group”). DWS Group is a global asset management business that offers a wide range of investing expertise and resources, including research capabilities in many countries throughout the world. In 2018, approximately 20% of DWS Group’s shares were sold in an initial public offering, with Deutsche Bank AG owning the remaining shares.
As part of the contract review process, the Board carefully considered the fees and expenses of each DWS fund overseen by the Board in light of the fund’s performance. In many cases, this led to the negotiation and implementation of expense caps. As part of these negotiations, the Board indicated that it would consider relaxing these caps in future years following sustained improvements in performance, among other considerations.
While shareholders may focus primarily on fund performance and fees, the Fund’s Board considers these and many other factors, including the quality and integrity of DIMA’s and DAAM Global’s personnel and administrative support services provided by DIMA, such as back-office operations, fund valuations, and compliance policies and procedures.
Nature, Quality and Extent of Services. The Board considered the terms of the Agreements, including the scope of advisory services provided under the Agreements. The Board noted that, under the Agreements, DIMA and DAAM Global provide portfolio management services to the Fund and that, pursuant to a separate administrative services agreement, DIMA provides administrative services to the Fund. The Board considered the experience and skills of senior management and investment personnel and the resources made available to such personnel. Throughout the course of the year, the Board also received information regarding DIMA’s oversight of Fund sub-advisers, including DAAM Global. The Board reviewed the Fund’s performance over short-term and long-term periods and compared those returns to various agreed-upon performance measures, including market index(es) and a peer universe compiled using information supplied by Morningstar Direct (“Morningstar”), an independent fund data service. The Board also noted that it has put into place a process of identifying “Funds in Review” (e.g., funds performing poorly relative to a peer universe), and receives additional reporting from DIMA regarding such funds and, where appropriate, DIMA’s plans to address underperformance. The Board believes this process is an effective manner of identifying and addressing underperforming funds. Based on the information provided, the Board noted that, for the one-, three- and five-year periods ended December 31,
| 76 | | | DWS Global Income Builder Fund |
Table of Contents
2017, the Fund’s performance (Class A shares) was in the 2nd quartile, 1st quartile and 2nd quartile, respectively, of the applicable Morningstar universe (the 1st quartile being the best performers and the 4th quartile being the worst performers). The Board also observed that the Fund has outperformed its benchmark in the one-, three- and five-year periods ended December 31, 2017.
Fees and Expenses. The Board considered the Fund’s investment management fee schedule, sub-advisory fee schedule, operating expenses and total expense ratios, and comparative information provided by Broadridge Financial Solutions, Inc. (“Broadridge”) and the Fee Consultant regarding investment management fee rates paid to other investment advisors by similar funds (1st quartile being the most favorable and 4th quartile being the least favorable). With respect to management fees paid to other investment advisors by similar funds, the Board noted that the contractual fee rates paid by the Fund, which include a 0.10% fee paid to DIMA under the Fund’s administrative services agreement, were lower than the median (1st quartile) of the applicable Broadridge peer group (based on Broadridge data provided as of December 31, 2017). With respect to the sub-advisory fee paid to DAAM Global, the Board noted that the fee is paid by DIMA out of its fee and not directly by the Fund. The Board noted that the Fund’s Class A shares total (net) operating expenses (excluding 12b-1 fees) were expected to be lower than the median (1st quartile) of the applicable Broadridge expense universe (based on Broadridge data provided as of December 31, 2017, and analyzing Broadridge expense universe Class A (net) expenses less any applicable 12b-1 fees) (“Broadridge Universe Expenses”). The Board also reviewed data comparing each share class’s total (net) operating expenses to the applicable Broadridge Universe Expenses. The Board noted that the expense limitations agreed to by DIMA were expected to help the Fund’s total (net) operating expenses remain competitive. The Board considered the Fund’s management fee rate as compared to fees charged by DIMA to a comparable DWS U.S. registered fund (“DWS Funds”) and considered differences between the Fund and the comparable DWS Fund. The information requested by the Board as part of its review of fees and expenses also included information about institutional accounts (including any sub-advised funds and accounts) and funds offered primarily to European investors (“DWS Europe Funds”) managed by DWS Group. The Board noted that DIMA indicated that DWS Group does not manage any institutional accounts or DWS Europe Funds comparable to the Fund.
On the basis of the information provided, the Board concluded that management fees were reasonable and appropriate in light of the nature, quality and extent of services provided by DIMA and DAAM Global.
| DWS Global Income Builder Fund | | | 77 |
Table of Contents
Profitability. The Board reviewed detailed information regarding revenues received by DIMA under the Agreement. The Board considered the estimated costs to DIMA, and pre-tax profits realized by DIMA, from advising the DWS Funds, as well as estimates of the pre-tax profits attributable to managing the Fund in particular. The Board also received information regarding the estimated enterprise-wide profitability of DIMA and its affiliates with respect to all fund services in totality and by fund. The Board and the Fee Consultant reviewed DIMA’s methodology in allocating its costs to the management of the Fund. Based on the information provided, the Board concluded that the pre-tax profits realized by DIMA in connection with the management of the Fund were not unreasonable. The Board also reviewed certain publicly available information regarding the profitability of certain similar investment management firms. The Board noted that, while information regarding the profitability of such firms is limited (and in some cases is not necessarily prepared on a comparable basis), DIMA and its affiliates’ overall profitability with respect to the DWS Funds (after taking into account distribution and other services provided to the funds by DIMA and its affiliates) was lower than the overall profitability levels of most comparable firms for which such data was available.
Economies of Scale. The Board considered whether there are economies of scale with respect to the management of the Fund and whether the Fund benefits from any economies of scale. The Board noted that the Fund’s investment management fee schedule includes fee breakpoints. The Board concluded that the Fund’s fee schedule represents an appropriate sharing between the Fund and DIMA of such economies of scale as may exist in the management of the Fund at current asset levels.
Other Benefits to DIMA and Its Affiliates. The Board also considered the character and amount of other incidental or “fall-out” benefits received by DIMA and its affiliates, including any fees received by DIMA for administrative services provided to the Fund, any fees received by an affiliate of DIMA for transfer agency services provided to the Fund and any fees received by an affiliate of DIMA for distribution services. The Board also considered benefits to DIMA related to brokerage and soft-dollar allocations, including allocating brokerage to pay for research generated by parties other than the executing broker dealers, which pertain primarily to funds investing in equity securities. In addition, the Board considered the incidental public relations benefits to DIMA related to DWS Funds advertising and cross-selling opportunities among DIMA products and services. The Board considered these benefits in reaching its conclusion that the Fund’s management fees were reasonable.
Compliance. The Board considered the significant attention and resources dedicated by DIMA to its compliance processes in recent years. The Board noted in particular (i) the experience, seniority and time
| 78 | | | DWS Global Income Builder Fund |
Table of Contents
commitment of the individuals serving as DIMA’s and the Fund’s chief compliance officers and (ii) the substantial commitment of resources by DIMA and its affiliates to compliance matters, including the retention of compliance personnel.
Based on all of the information considered and the conclusions reached, the Board unanimously determined that the continuation of the Agreements is in the best interests of the Fund. In making this determination, the Board did not give particular weight to any single factor identified above. The Board considered these factors over the course of numerous meetings, certain of which were in executive session with only the Independent Trustees and counsel present. It is possible that individual Independent Trustees may have weighed these factors differently in reaching their individual decisions to approve the continuation of the Agreements.
| DWS Global Income Builder Fund | | | 79 |
Table of Contents
The following table presents certain information regarding the Board Members and Officers of the Fund. Each Board Member’s year of birth is set forth in parentheses after his or her name. Unless otherwise noted, (i) each Board Member has engaged in the principal occupation(s) noted in the table for at least the most recent five years, although not necessarily in the same capacity; and (ii) the address of each Independent Board Member is c/o Keith R. Fox, DWS Funds Board Chair, c/o Thomas R. Hiller, Ropes & Gray LLP, Prudential Tower, 800 Boylston Street, Boston, MA 02199-3600. Except as otherwise noted below, the term of office for each Board Member is until the election and qualification of a successor, or until such Board Member sooner dies, resigns, is removed or as otherwise provided in the governing documents of the Fund. Because the Fund does not hold an annual meeting of shareholders, each Board Member will hold office for an indeterminate period. The Board Members may also serve in similar capacities with other funds in the fund complex.
| Independent Board Members | ||||||||
| Name, Year of Birth, Position with the Fund and Length of Time Served1 | Business Experience and Directorships During the Past Five Years | Number of Funds in DWS Fund Complex Overseen | Other Directorships Held by Board Member | |||||
Keith R. Fox, CFA (1954)
Chairperson since 2017, and Board Member since 1996 | Managing General Partner, Exeter Capital Partners (a series of private investment funds) (since 1986). Directorships: Progressive International Corporation (kitchen goods importer and distributor); The Kennel Shop (retailer); former Chairman, National Association of Small Business Investment Companies; former Directorships: BoxTop Media Inc. (advertising); Sun Capital Advisers Trust (mutual funds) (2011–2012) | 85 | — | |||||
John W. Ballantine (1946)
Board Member since 1999 | Retired; formerly, Executive Vice President and Chief Risk Management Officer, First Chicago NBD Corporation/The First National Bank of Chicago (1996–1998); Executive Vice President and Head of International Banking (1995–1996); former Directorships: Director and former Chairman of the Board, Healthways, Inc.2 (population well-being and wellness services) (2003–2014); Stockwell Capital Investments PLC (private equity); Enron Corporation; FNB Corporation; Tokheim Corporation; First Oak Brook Bancshares, Inc. and Oak Brook Bank; Prisma Energy International. Not-for-Profit Director, Trustee: Palm Beach Civic Association; Public Radio International; Window to the World Communications (public media); Harris Theater for Music and Dance (Chicago) | 85 | Portland General Electric2 (utility company) (2003– present) | |||||
| 80 | | | DWS Global Income Builder Fund |
Table of Contents
| Name, Year of Birth, Position with the Fund and Length of Time Served1 | Business Experience and Directorships During the Past Five Years | Number of Funds in DWS Fund Complex Overseen | Other Directorships Held by Board Member | |||||
Henry P. Becton, Jr. (1943)
Board Member since 1990 | Vice Chair and former President, WGBH Educational Foundation. Directorships: Public Radio International; Public Radio Exchange (PRX); The Pew Charitable Trusts (charitable organization); Massachusetts Humane Society; American Documentary, Inc. (public media); Overseer of the New England Conservatory; former Directorships: Becton Dickinson and Company2 (medical technology company); Belo Corporation2 (media company); The PBS Foundation; Association of Public Television Stations; Boston Museum of Science; American Public Television; Concord Academy; New England Aquarium; Mass. Corporation for Educational Telecommunications; Committee for Economic Development; Public Broadcasting Service; Connecticut College; North Bennett Street School (Boston) | 85 | — | |||||
Dawn-Marie Driscoll (1946)
Board Member since 1987 | Emeritus Executive Fellow, Center for Business Ethics, Bentley University; formerly: President, Driscoll Associates (consulting firm); Partner, Palmer & Dodge (law firm) (1988–1990); Vice President of Corporate Affairs and General Counsel, Filene’s (retail) (1978–1988). Directorships: Advisory Board, Center for Business Ethics, Bentley University; Trustee and former Chairman of the Board, Southwest Florida Community Foundation (charitable organization); former Directorships: ICI Mutual Insurance Company (2007–2015); Sun Capital Advisers Trust (mutual funds) (2007–2012), Investment Company Institute (audit, executive, nominating committees) and Independent Directors Council (governance, executive committees) | 85 | — | |||||
Paul K. Freeman (1950)
Board Member since 1993 | Consultant, World Bank/Inter-American Development Bank; Independent Directors Council (former chair); Investment Company Institute (executive committee); Adjunct Professor, University of Denver Law School (2017–present); formerly: Chairman of Education Committee of Independent Directors Council; Project Leader, International Institute for Applied Systems Analysis (1998–2001); Chief Executive Officer, The Eric Group, Inc. (environmental insurance) (1986–1998); Directorships: Knoebel Institute for Healthy Aging, University of Denver (2017–present); former Directorships: Prisma Energy International; Denver Zoo Foundation (2012–2018) | 85 | — | |||||
| DWS Global Income Builder Fund | | | 81 |
Table of Contents
| Name, Year of Birth, Position with the Fund and Length of Time Served1 | Business Experience and Directorships During the Past Five Years | Number of Funds in DWS Fund Complex Overseen | Other Directorships Held by Board Member | |||||
Richard J. Herring (1946)
Board Member since 1990 | Jacob Safra Professor of International Banking and Professor, Finance Department, The Wharton School, University of Pennsylvania (since July 1972); Co-Director, Wharton Financial Institutions Center; formerly: Vice Dean and Director, Wharton Undergraduate Division (July 1995–June 2000); Director, Lauder Institute of International Management Studies (July 2000–June 2006) | 85 | Director, Aberdeen Singapore and Japan Funds (since 2007); Independent Director of Barclays Bank Delaware (since September 2010) | |||||
William McClayton (1944)
Board Member since 2004 | Private equity investor (since October 2009); previously, Managing Director, Diamond Management & Technology Consultants, Inc. (global consulting firm) (2001–2009); Directorship: Board of Managers, YMCA of Metropolitan Chicago; formerly: Senior Partner, Arthur Andersen LLP (accounting) (1966–2001); Trustee, Ravinia Festival | 85 | — | |||||
Rebecca W. Rimel (1951)
Board Member since 1995 | President, Chief Executive Officer and Director, The Pew Charitable Trusts (charitable organization) (1994–present); formerly: Executive Vice President, The Glenmede Trust Company (investment trust and wealth management) (1983–2004); Board Member, Investor Education (charitable organization) (2004–2005); Trustee, Executive Committee, Philadelphia Chamber of Commerce (2001–2007); Director, Viasys Health Care2 (January 2007–June 2007); Trustee, Thomas Jefferson Foundation (charitable organization) (1994–2012) | 85 | Director, Becton Dickinson and Company2 (medical technology company) (2012– present); Director, BioTelemetry Inc.2 (health care) (2009– present) | |||||
William N. Searcy, Jr. (1946)
Board Member since 1993 | Private investor since October 2003; formerly: Pension & Savings Trust Officer, Sprint Corporation2 (telecommunications) (November 1989–September 2003); Trustee, Sun Capital Advisers Trust (mutual funds) (1998–2012) | 85 | — | |||||
| 82 | | | DWS Global Income Builder Fund |
Table of Contents
| Name, Year of Birth, Position with the Fund and Length of Time Served1 | Business Experience and Directorships During the Past Five Years | Number of Funds in DWS Fund Complex Overseen | Other Directorships Held by Board Member | |||||
Jean Gleason Stromberg (1943)
Board Member since 1997 | Retired. Formerly, Consultant (1997–2001); Director, Financial Markets U.S. Government Accountability Office (1996–1997); Partner, Norton Rose Fulbright, L.L.P. (law firm) (1978–1996); former Directorships: The William and Flora Hewlett Foundation (charitable organization) (2000–2015); Service Source, Inc. (nonprofit), Mutual Fund Directors Forum (2002–2004), American Bar Retirement Association (funding vehicle for retirement plans) (1987–1990 and 1994–1996) | 85 | — | |||||
| Officers4 | ||
Name, Year of Birth, Position with the Fund and Length of Time Served5 | Business Experience and Directorships During the Past Five Years | |
Hepsen Uzcan6,9 (1974)
President and Chief Executive Officer, 2017–present
Assistant Secretary, 2013–present | Managing Director,3 DWS; Secretary, DWS USA Corporation (since March 2018); Assistant Secretary, DWS Distributors, Inc. (since June 25, 2018); Director and Vice President, DWS Service Company (since June 25, 2018); Assistant Secretary, DWS Investment Management Americas, Inc. (since June 25, 2018); and Director and President, DB Investment Managers, Inc. (since June 25, 2018); formerly: Vice President for the Deutsche funds (2016–2017) | |
John Millette8 (1962)
Vice President and Secretary, 1999–present | Director,3 DWS; Chief Legal Officer, DWS Investment Management Americas, Inc. (2015–present); and Director and Vice President, DWS Trust Company (2016–present); formerly: Secretary, Deutsche Investment Management Americas Inc. (2015–2017) | |
Diane Kenneally8,10 (1966)
Treasurer and Chief Financial Officer since 2018 | Director,3 DWS; formerly: Assistant Treasurer for the DWS funds (2007–2018) | |
Caroline Pearson8 (1962)
Chief Legal Officer, 2010–present | Managing Director,3 DWS; formerly: Secretary, Deutsche AM Distributors, Inc. (2002–2017); and Secretary, Deutsche AM Service Company (2010–2017) | |
Scott D. Hogan8 (1970)
Chief Compliance Officer, 2016–present | Director,3 DWS | |
Wayne Salit7 (1967)
Anti-Money Laundering Compliance Officer, 2014–present | Director,3 Deutsche Bank; and AML Officer, DWS Trust Company; formerly: Managing Director, AML Compliance Officer at BNY Mellon (2011–2014); and Director, AML Compliance Officer at Deutsche Bank (2004–2011) | |
Sheila Cadogan8 (1966)
Assistant Treasurer, 2017–present | Director,3 DWS; Director and Vice President, DWS Trust Company (since 2018) |
| DWS Global Income Builder Fund | | | 83 |
Table of Contents
Name, Year of Birth, Position with the Fund and Length of Time Served5 | Business Experience and Directorships During the Past Five Years | |
Paul Antosca8 (1957)
Assistant Treasurer, 2007–present | Director,3 DWS |
| 1 | The length of time served represents the year in which the Board Member joined the board of one or more DWS funds currently overseen by the Board. |
| 2 | A publicly held company with securities registered pursuant to Section 12 of the Securities Exchange Act of 1934. |
| 3 | Executive title, not a board directorship. |
| 4 | As a result of their respective positions held with the Advisor or its affiliates, these individuals are considered “interested persons” of the Advisor within the meaning of the 1940 Act. Interested persons receive no compensation from the Fund. |
| 5 | The length of time served represents the year in which the officer was first elected in such capacity for one or more DWS funds. |
| 6 | Address: 345 Park Avenue, New York, NY 10154. |
| 7 | Address: 60 Wall Street, New York, NY 10005. |
| 8 | Address: One International Place, Boston, MA 02110. |
| 9 | Appointed President and Chief Executive Officer effective December 1, 2017. |
| 10 | Appointed Treasurer and Chief Financial Officer effective July 2, 2018. |
The Fund’s Statement of Additional Information (“SAI”) includes additional information about the Board Members. The SAI is available, without charge, upon request. If you would like to request a copy of the SAI, you may do so by calling the following toll-free number: (800) 728-3337.
| 84 | | | DWS Global Income Builder Fund |
Table of Contents
| For More Information | The automated telephone system allows you to access personalized account information and obtain information on other DWS funds using either your voice or your telephone keypad. Certain account types within Classes A, C and S also have the ability to purchase, exchange or redeem shares using this system.
For more information, contact your financial advisor. You may also access our automated telephone system or speak with a Shareholder Service representative by calling:
(800) 728-3337 | |
| Web Site | dws.com
View your account transactions and balances, trade shares, monitor your asset allocation, subscribe to fund and account updates by e-mail, and change your address, 24 hours a day.
Obtain prospectuses and applications, news about DWS funds, insight from DWS economists and investment specialists and access to DWS fund account information. | |
| Written Correspondence | DWS
PO Box 219151 Kansas City, MO 64121-9151 | |
| Proxy Voting | The Fund’s policies and procedures for voting proxies for portfolio securities and information about how the Fund voted proxies related to its portfolio securities during the most recent 12-month period ended June 30 are available on our Web site — dws.com/en-us/resources/proxy-voting — or on the SEC’s Web site — sec.gov. To obtain a written copy of the Fund’s policies and procedures without charge, upon request, call us toll free at (800) 728-3337. | |
| Portfolio Holdings | Following the Fund’s fiscal first and third quarter-end, a complete portfolio holdings listing is filed with the SEC on Form N-Q. This form will be available on the SEC’s Web site at sec.gov. The Fund’s portfolio holdings are also posted on dws.com from time to time. Please see the Fund’s current prospectus for more information. | |
| Principal Underwriter | If you have questions, comments or complaints, contact:
DWS Distributors, Inc.
222 South Riverside Plaza Chicago, IL 60606-5808 (800) 621-1148 |
| DWS Global Income Builder Fund | | | 85 |
Table of Contents
| Investment Management | DWS Investment Management Americas, Inc. (“DIMA” or the “Advisor”), which is part of the DWS Group GmbH & Co. KGaA (“DWS Group”), is the investment advisor for the Fund. DIMA and its predecessors have more than 90 years of experience managing mutual funds and DIMA provides a full range of investment advisory services to both institutional and retail clients. DIMA is an indirect, wholly owned subsidiary of DWS Group.
DWS Group is a global organization that offers a wide range of investing expertise and resources, including hundreds of portfolio managers and analysts and an office network that reaches the world’s major investment centers. This well-resourced global investment platform brings together a wide variety of experience and investment insight across industries, regions, asset classes and investing styles. | |||||||
| Class A | Class C | Class S | Institutional Class | |||||
| Nasdaq Symbol | KTRAX | KTRCX | KTRSX | KTRIX | ||||
| CUSIP Number | 25159K 820 | 25159K 796 | 25159K 788 | 25159K 770 | ||||
| Fund Number | 002 | 302 | 2033 | 1402 | ||||
| For shareholders of Class R6 | ||||||||
| Automated Information Line | DWS/Ascensus Plan Access (800) 728-3337
24-hour access to your retirement plan account. | |||||||
| Web Site | dws.com
Obtain prospectuses and applications, news about DWS funds, insight from DWS economists and investment specialists and access to DWS fund account information.
Log in/register to manage retirement account assets at https://www.mykplan.com/participantsecure_net/login.aspx. | |||||||
| For More Information | (800) 728-3337
To speak with a service representative. | |||||||
| Written Correspondence | DWS Service Company
222 South Riverside Plaza Chicago, IL 60606-5806 | |||||||
| Class R6 | ||||||||
| Nasdaq Symbol | KTRZX |
|
|
| ||||
| CUSIP Number | 25159K 721 |
|
|
| ||||
| Fund Number | 1633 |
|
|
| ||||
| 86 | | | DWS Global Income Builder Fund |
Table of Contents
Notes
Table of Contents
DGIBF-2
(R-024954-8 12/18)
| ITEM 2. | CODE OF ETHICS |
As of the end of the period covered by this report, the registrant has adopted a code of ethics, as defined in Item 2 of Form N-CSR that applies to its Principal Executive Officer and Principal Financial Officer.
There have been no amendments to, or waivers from, a provision of the code of ethics during the period covered by this report that would require disclosure under Item 2.
A copy of the code of ethics is filed as an exhibit to this Form N-CSR. | |
| ITEM 3. | AUDIT COMMITTEE FINANCIAL EXPERT |
| The fund’s audit committee is comprised solely of trustees who are "independent" (as such term has been defined by the Securities and Exchange Commission ("SEC") in regulations implementing Section 407 of the Sarbanes-Oxley Act (the "Regulations")). The fund’s Board of Trustees has determined that there are several "audit committee financial experts" (as such term has been defined by the Regulations) serving on the fund’s audit committee including Mr. William McClayton, the chair of the fund’s audit committee. An “audit committee financial expert” is not an “expert” for any purpose, including for purposes of Section 11 of the Securities Act of 1933 and the designation or identification of a person as an “audit committee financial expert” does not impose on such person any duties, obligations or liability that are greater than the duties, obligations and liability imposed on such person as a member of the audit committee and board of directors in the absence of such designation or identification. | |
| ITEM 4. | PRINCIPAL ACCOUNTANT FEES AND SERVICES |
DWS Global income Builder fund
form n-csr disclosure re: AUDIT FEES
The following table shows the amount of fees that Ernst & Young LLP (“EY”), the Fund’s Independent Registered Public Accounting Firm, billed to the Fund during the Fund’s last two fiscal years. The Audit Committee approved in advance all audit services and non-audit services that EY provided to the Fund.
Services that the Fund’s Independent Registered Public Accounting Firm Billed to the Fund
| Fiscal Year Ended October 31, | Audit Fees Billed to Fund | Audit-Related Fees Billed to Fund | Tax Fees Billed to Fund | All Other Fees Billed to Fund |
| 2018 | $90,047 | $0 | $7,657 | $0 |
| 2017 | $90,047 | $0 | $7,657 | $0 |
Services that the Fund’s Independent Registered Public Accounting Firm Billed to the Adviser and Affiliated Fund Service Providers
The following table shows the amount of fees billed by EY to DWS Investment Management Americas, Inc. (“DIMA” or the “Adviser”), and any entity controlling, controlled by or under common control with DIMA (“Control Affiliate”) that provides ongoing services to the Fund (“Affiliated Fund Service Provider”), for engagements directly related to the Fund’s operations and financial reporting, during the Fund’s last two fiscal years.
| Fiscal Year Ended October 31, | Audit-Related Fees Billed to Adviser and Affiliated Fund Service Providers | Tax Fees Billed to Adviser and Affiliated Fund Service Providers | All Other Fees Billed to Adviser and Affiliated Fund Service Providers |
| 2018 | $0 | $470,936 | $0 |
| 2017 | $0 | $502,238 | $0 |
The above “Tax Fees” were billed in connection with tax compliance services and agreed upon procedures.
Non-Audit Services
The following table shows the amount of fees that EY billed during the Fund’s last two fiscal years for non-audit services. The Audit Committee pre-approved all non-audit services that EY provided to the Adviser and any Affiliated Fund Service Provider that related directly to the Fund’s operations and financial reporting. The Audit Committee requested and received information from EY about any non-audit services that EY rendered during the Fund’s last fiscal year to the Adviser and any Affiliated Fund Service Provider. The Committee considered this information in evaluating EY’s independence.
| Fiscal Year Ended October 31, | Total (A) | Total Non-Audit Fees billed to Adviser and Affiliated Fund Service Providers (engagements related directly to the operations and financial reporting of the Fund) (B) | Total Non-Audit Fees billed to Adviser and Affiliated Fund Service Providers (all other engagements) (C) | Total of (A), (B) and (C) |
| 2018 | $7,657 | $470,936 | $513,130 | $991,723 |
| 2017 | $7,657 | $502,238 | $606,585 | $1,116,480 |
All other engagement fees were billed for services in connection with agreed upon procedures and tax compliance for DIMA and other related entities.
Audit Committee Pre-Approval Policies and Procedures. Generally, each Fund’s Audit Committee must pre approve (i) all services to be performed for a Fund by a Fund’s Independent Registered Public Accounting Firm and (ii) all non-audit services to be performed by a Fund’s Independent Registered Public Accounting Firm for the DIMA Entities with respect to operations and financial reporting of the Fund, except that the Chairperson or Vice Chairperson of each Fund’s Audit Committee may grant the pre-approval for non-audit services described in items (i) and (ii) above for non-prohibited services for engagements of less than $100,000. All such delegated pre approvals shall be presented to each Fund’s Audit Committee no later than the next Audit Committee meeting.
There were no amounts that were approved by the Audit Committee pursuant to the de minimis exception under Rule 2-01 of Regulation S-X.
According to the registrant’s principal Independent Registered Public Accounting Firm, substantially all of the principal Independent Registered Public Accounting Firm's hours spent on auditing the registrant's financial statements were attributed to work performed by full-time permanent employees of the principal Independent Registered Public Accounting Firm.
***
In connection with the audit of the 2017 and 2018 financial statements, the Fund entered into an engagement letter with EY. The terms of the engagement letter required by EY, and agreed to by the Audit Committee, include a provision mandating the use of mediation and arbitration to resolve any controversy or claim between the parties arising out of or relating to the engagement letter or services provided thereunder.
***
Pursuant to PCAOB Rule 3526, EY is required to describe in writing to the Fund’s Audit Committee, on at least an annual basis, all relationships between EY, or any of its affiliates, and the DWS Funds, including the Fund, or persons in financial reporting oversight roles at the DWS Funds that, as of the date of the communication, may reasonably be thought to bear on EY’s independence. Pursuant to PCAOB Rule 3526, EY has reported the matters set forth below that may reasonably be thought to bear on EY’s independence. With respect to each reported matter, individually and in the aggregate, EY advised the Audit Committee that, after careful consideration of the facts and circumstances and the applicable independence rules, it concluded that the matters do not and will not impair EY’s ability to exercise objective and impartial judgement in connection with the audits of the financial statements for the Fund and a reasonable investor with knowledge of all relevant facts and circumstances would conclude that EY has been and is capable of exercising objective and impartial judgment on all issues encompassed within EY’s audit engagements. EY also confirmed to the Audit Committee that it can continue act as the Independent Registered Public Accounting Firm for the Fund.
| · | EY advised the Fund’s Audit Committee that EY Stiftung e.V., an affiliate of the EY member firm in Germany, and various other covered persons within EY and its affiliates held investments in, or had other financial relationships with, entities within the DWS Funds “investment company complex” (as defined in Regulation S-X) (the “DWS Funds Complex”). EY informed the Audit Committee that these investments and financial relationships were inconsistent with Rule 2-01(c)(1) of Regulation S-X. EY reported that all breaches have been resolved and that none of the breaches involved any investments in the Fund or any professionals who were part of the audit engagement team for the Fund or in a position to influence the audit engagement team. In addition, EY noted that the independence breaches did not (i) create a mutual or conflicting interest with the Fund, (ii) place EY in the position of auditing its own work, (iii) result in EY acting as management or an employee of the Fund, or (iv) place EY in a position of being an advocate of the Fund. |
| · | EY advised the Fund’s Audit Committee of certain lending relationships of EY with owners of greater than 10% of the shares of certain investment companies within the DWS Funds Complex that EY had identified as inconsistent with Rule 2-01(c)(l)(ii)(A) of Regulation S-X (referred to as the “Loan Rule”). The Loan Rule specifically provides that an accounting firm would not be independent if it receives a loan from a lender that is a record or beneficial owner of more than ten percent of an audit client’s equity securities. For purposes of the Loan Rule, an audit client includes the Fund as well as all other investment companies in the DWS Funds Complex. EY’s lending relationships affect EY’s independence under the Loan Rule with respect to all investment companies in the DWS Funds Complex. |
EY stated its belief that, in each lending relationship, the lender is or was not able to impact the impartiality of EY or assert any influence over the investment companies in the DWS Funds Complex whose shares the lender owns or owned, or the applicable investment company’s investment adviser. In addition, on June 20, 2016, the SEC Staff issued a “no-action” letter to another mutual fund complex, Fidelity Management & Research Company et al., SEC Staff No-Action Letter (June 20, 2016) (the “Fidelity Letter”), related to similar Loan Rule issues as those described above. In the Fidelity Letter, the SEC Staff confirmed that it would not recommend enforcement action against an investment company that relied on the audit services performed by an audit firm that was not in compliance with the Loan Rule in certain specified circumstances. With respect to each lending relationship identified by EY, the circumstances described in the Fidelity Letter appear to be substantially similar to the circumstances that affected EY’s independence under the Loan Rule with respect to the Fund, and, in each case, EY confirmed to the Audit Committee that it meets the conditions of the Fidelity Letter.
| ITEM 5. | AUDIT COMMITTEE OF LISTED REGISTRANTS | |
| Not applicable8 | ||
| ITEM 6. | SCHEDULE OF INVESTMENTS | |
| Not applicable | ||
| ITEM 7. | DISCLOSURE OF PROXY VOTING POLICIES AND PROCEDURES FOR CLOSED-END MANAGEMENT INVESTMENT COMPANIES | |
| Not applicable | ||
| ITEM 8. | PORTFOLIO MANAGERS OF CLOSED-END MANAGEMENT INVESTMENT COMPANIES | |
| Not applicable | ||
| ITEM 9. | PURCHASES OF EQUITY SECURITIES BY CLOSED-END MANAGEMENT INVESTMENT COMPANY AND AFFILIATED PURCHASERS | |
| Not applicable | ||
| ITEM 10. | SUBMISSION OF MATTERS TO A VOTE OF SECURITY HOLDERS | |
| There were no material changes to the procedures by which shareholders may recommend nominees to the Fund’s Board. The primary function of the Nominating and Governance Committee is to identify and recommend individuals for membership on the Board and oversee the administration of the Board Governance Guidelines. Shareholders may recommend candidates for Board positions by forwarding their correspondence by U.S. mail or courier service to Keith R. Fox, DWS Funds Board Chair, c/o Thomas R. Hiller, Ropes & Gray LLP, Prudential Tower, 800 Boylston Street, Boston, MA 02199-3600. | ||
| ITEM 11. | CONTROLS AND PROCEDURES | |
| (a) | The Chief Executive and Financial Officers concluded that the Registrant’s Disclosure Controls and Procedures are effective based on the evaluation of the Disclosure Controls and Procedures as of a date within 90 days of the filing date of this report. | |
| (b) | There have been no changes in the registrant’s internal control over financial reporting that occurred during the second fiscal quarter of the period covered by this report that has materially affected, or is reasonably likely to materially affect, the registrant’s internal controls over financial reporting. | |
| ITEM 12. | Disclosure of Securities Lending Activities for Closed-End Management Investment Companies | |
| Not applicable | ||
| ITEM 13. | EXHIBITS | |
| (a)(1) | Code of Ethics pursuant to Item 2 of Form N-CSR is filed and attached hereto as EX-99.CODE ETH. | |
| (a)(2) | Certification pursuant to Rule 30a-2(a) under the Investment Company Act of 1940 (17 CFR 270.30a-2(a)) is filed and attached hereto as Exhibit 99.CERT. | |
| (b) | Certification pursuant to Rule 30a-2(b) under the Investment Company Act of 1940 (17 CFR 270.30a-2(b)) is furnished and attached hereto as Exhibit 99.906CERT. | |
SIGNATURES
Pursuant to the requirements of the Securities Exchange Act of 1934 and the Investment Company Act of 1940, the registrant has duly caused this report to be signed on its behalf by the undersigned, thereunto duly authorized.
| Registrant: | DWS Global Income Builder Fund, a series of Deutsche DWS Market Trust |
| By: | /s/Hepsen Uzcan Hepsen Uzcan President |
| Date: | 1/2/2019 |
Pursuant to the requirements of the Securities Exchange Act of 1934 and the Investment Company Act of 1940, this report has been signed below by the following persons on behalf of the registrant and in the capacities and on the dates indicated.
| By: | /s/Hepsen Uzcan Hepsen Uzcan President |
| Date: | 1/2/2019 |
| By: | /s/Diane Kenneally Diane Kenneally Chief Financial Officer and Treasurer |
| Date: | 1/2/2019 |