UNITED STATES
SECURITIES AND EXCHANGE COMMISSION
WASHINGTON, D. C. 20549
FORM N-CSRS
Investment Company Act file number: 811-01236
Deutsche DWS Market Trust
(Exact Name of Registrant as Specified in Charter)
345 Park Avenue
New York, NY 10154-0004
(Address of Principal Executive Offices) (Zip Code)
Registrant’s Telephone Number, including Area Code:(212) 250-2500
Diane Kenneally
One International Place
Boston, MA 02110
(Name and Address of Agent for Service)
| Date of fiscal year end: | 10/31 |
| Date of reporting period: | 4/30/2019 |
| ITEM 1. | REPORT TO STOCKHOLDERS |
Table of Contents

April 30, 2019
Semiannual Report
to Shareholders
DWS Global Income Builder Fund
Beginning on January 1, 2021, as permitted by regulations adopted by the Securities and Exchange Commission, paper copies of the Fund’s annual and semiannual shareholder reports will no longer be sent by mail, unless you specifically request paper copies of the reports. Instead, the reports will be made available on the Fund’s Web site (dws.com), and you will be notified by mail each time a report is posted and provided with a Web site link to access the report.
If you already elected to receive shareholder reports electronically, you will not be affected by this change and you need not take any action. You may elect to receive shareholder reports and other communications from the Fund electronically anytime by contacting your financial intermediary (such as a broker-dealer or bank), or if you are a direct investor, by calling (800) 728-3337 or sending an email request to service@dws.com.
You may elect to receive all future reports in paper free of charge. If you invest through a financial intermediary, you can contact your financial intermediary to request that you continue to receive paper copies of your shareholder reports. If you invest directly with the Fund, you can call (800) 728-3337 or send an email request to service@dws.com to continue receiving paper copies of your shareholder reports. Your election to receive reports in paper will apply to all funds held in your account if you invest through your financial intermediary or all funds held with DWS if you invest directly with the Fund.

Table of Contents
This report must be preceded or accompanied by a prospectus. To obtain a summary prospectus, if available, or prospectus for any of our funds, refer to the Account Management Resources information provided in the back of this booklet. We advise you to consider the Fund’s objectives, risks, charges and expenses carefully before investing. The summary prospectus and prospectus contain this and other important information about the Fund. Please read the prospectus carefully before you invest.
Although allocation among different asset categories generally limits risk, portfolio management may favor an asset category that underperforms other assets or markets as a whole. Bond investments are subject tointerest-rate, credit, liquidity and market risks to varying degrees. When interest rates rise, bond prices generally fall. Credit risk refers to the ability of an issuer to make timely payments of principal and interest. Investing in derivatives entails special risks relating to liquidity, leverage and credit that may reduce returns and/or increase volatility. Dividends are not guaranteed. If thedividend-paying stocks held by the Fund reduce or stop paying dividends, the Fund’s ability to generate income may be adversely affected. Preferred stocks, a type ofdividend-paying stock, present certain additional risks. Emerging markets tend to be more volatile and less liquid than the markets of more mature economies, and generally have less diverse and less mature economic structures and less stable political systems than those of developed countries. Because Exchange Traded Funds (ETFs) trade on a securities exchange, their shares may trade at a premium or discount to their net asset value. ETFs also incur fees and expenses so they may not fully match the performance of the indexes they are designed to track. Any fund that focuses in a particular segment of the market or region of the world will generally be more volatile than a fund that invests more broadly. Investing in foreign securities presents certain risks, such as currency fluctuations, political and economic changes, and market risks. The Fund may lend securities to approved institutions. Small company stocks tend to be more volatile thanmedium-sized or large company stocks. Stocks may decline in value. Please read the prospectus for details.
The brand DWS represents DWS Group GmbH & Co. KGaA and any of its subsidiaries such as DWS Distributors, Inc. which offers investment products or DWS Investment Management Americas, Inc. and RREEF America L.L.C. which offer advisory services.
NOT FDIC/NCUA INSURED NO BANK GUARANTEE MAY LOSE VALUE
NOT A DEPOSIT NOT INSURED BY ANY FEDERAL GOVERNMENT AGENCY
| 2 | | | DWS Global Income Builder Fund |
Table of Contents
Dear Shareholder:
Despite shifting political sands — most notably the trade negotiations between China and the United States (the “U.S.”) — the economy continues to be resilient. A robust labor market, strong home sales, consumer confidence and other key metrics indicate that the underpinnings of the economy remain intact.
Looking ahead, while our Americas Chief Investment Officer (“CIO”) believes the U.S.-China trade conflict mayde-escalate over the coming months, he notes that it is most likely to weigh on manufacturing activity. Since certain aspects of the conflict, such as intellectual property protection and other China reforms, will not happen quickly, the conflict could prolong into the second half of the year. In any event, uncertainty may well lead to continued market volatility. Against this backdrop, we see little near-term impetus for a resurgence in growth in the emerging markets beyond the stimulus efforts that are already underway in China.
Of course, these issues and their potential implications around the world bear close watching. Our CIO Office and global network of analysts diligently monitor these matters to determine when and what, if any, strategic or tactical adjustments are warranted. We invite you to access these views often to understand the changing landscape and, most important, what it may mean for you.
While our diverse expertise in Active, Passive and Alternatives asset management — as well as our deep environmental, social and governance focus — complement each other when creating targeted investment strategies for our clients, theon-the-ground-knowledge of our economists, research analysts and investment professionals are brought together in one consistent global CIO View, which guides our strategic investment approach. We are local while being one global team with approximately 3,600 employees in offices all over the world. As always, we urge you to visit the “Insights” section of our Web site, dws.com, to review our most current market and economic perspectives.
Best regards,
 |
Hepsen Uzcan
President, DWS Funds |

Assumptions, estimates and opinions contained in this document constitute our judgment as of the date of the document and are subject to change without notice. Any projections are based on a number of assumptions as to market conditions and there can be no guarantee that any projected results will be achieved. Past performance is not a guarantee of future results. There is no assurance provided that any investment objective will be achieved.
| DWS Global Income Builder Fund | | | 3 |
Table of Contents
| Performance Summary | April 30, 2019 (Unaudited) |
| Class A | 6-Month‡ | 1-Year | 5-Year | 10-Year | ||||||||||||
| Average Annual Total Returnsas of 4/30/19 |
| |||||||||||||||
| Unadjusted for Sales Charge | 7.54% | 5.48% | 4.19% | 8.05% | ||||||||||||
| Adjusted for the Maximum Sales Charge (max 5.75% load) | 1.35% | –0.58% | 2.97% | 7.41% | ||||||||||||
| S&P® Target Risk Moderate Index† | 7.08% | 5.39% | 4.57% | 6.89% | ||||||||||||
| Blended Index†† | 6.55% | 5.98% | 3.90% | 7.72% | ||||||||||||
| Average Annual Total Returnsas of 3/31/19 (most recent calendar quarter end) |
| |||||||||||||||
| Unadjusted for Sales Charge | 3.45% | 4.08% | 8.50% | |||||||||||||
| Adjusted for the Maximum Sales Charge (max 5.75% load) | –2.50% | 2.85% | 7.86% | |||||||||||||
| S&P® Target Risk Moderate Index† | 3.53% | 4.37% | 7.21% | |||||||||||||
| Blended Index†† | 5.10% | 4.09% | 8.42% | |||||||||||||
| Class C | 6-Month‡ | 1-Year | 5-Year | 10-Year | ||||||||||||
| Average Annual Total Returnsas of 4/30/19 |
| |||||||||||||||
| Unadjusted for Sales Charge | 7.01% | 4.66% | 3.36% | 7.18% | ||||||||||||
| Adjusted for the Maximum Sales Charge (max 1.00% CDSC) | 6.01% | 4.66% | 3.36% | 7.18% | ||||||||||||
| S&P® Target Risk Moderate Index† | 7.08% | 5.39% | 4.57% | 6.89% | ||||||||||||
| Blended Index†† | 6.55% | 5.98% | 3.90% | 7.72% | ||||||||||||
| Average Annual Total Returnsas of 3/31/19 (most recent calendar quarter end) |
| |||||||||||||||
| Unadjusted for Sales Charge | 2.54% | 3.25% | 7.63% | |||||||||||||
| Adjusted for the Maximum Sales Charge (max 1.00% CDSC) | 2.54% | 3.25% | 7.63% | |||||||||||||
| S&P® Target Risk Moderate Index† | 3.53% | 4.37% | 7.21% | |||||||||||||
| Blended Index†† | 5.10% | 4.09% | 8.42% | |||||||||||||
| Class R6 | 6-Month‡ | 1-Year | Life of Class* | |||||||||||||
| Average Annual Total Returnsas of 4/30/19 |
| |||||||||||||||
| No Sales Charges | 7.61% | 5.74% | 4.27% | |||||||||||||
| S&P® Target Risk Moderate Index† | 7.08% | 5.39% | 4.32% | |||||||||||||
| Blended Index†† | 6.55% | 5.98% | 3.85% | |||||||||||||
| Average Annual Total Returnsas of 3/31/19 (most recent calendar quarter end) |
| |||||||||||||||
| No Sales Charges | 3.81% | 3.86% | ||||||||||||||
| S&P® Target Risk Moderate Index† | 3.53% | 4.06% | ||||||||||||||
| Blended Index†† | 5.10% | 3.73% | ||||||||||||||
| 4 | | | DWS Global Income Builder Fund |
Table of Contents
| Class S | 6-Month‡ | 1-Year | 5-Year | 10-Year | ||||||||||||
| Average Annual Total Returnsas of 4/30/19 |
| |||||||||||||||
| No Sales Charges | 7.53% | 5.71% | 4.41% | 8.26% | ||||||||||||
| S&P® Target Risk Moderate Index† | 7.08% | 5.39% | 4.57% | 6.89% | ||||||||||||
| Blended Index†† | 6.55% | 5.98% | 3.90% | 7.72% | ||||||||||||
| Average Annual Total Returnsas of 3/31/19 (most recent calendar quarter end) |
| |||||||||||||||
| No Sales Charges | 3.56% | 4.27% | 8.72% | |||||||||||||
| S&P® Target Risk Moderate Index† | 3.53% | 4.37% | 7.21% | |||||||||||||
| Blended Index†† | 5.10% | 4.09% | 8.42% | |||||||||||||
| Institutional Class | 6-Month‡ | 1-Year | 5-Year | 10-Year | ||||||||||||
| Average Annual Total Returnsas of 4/30/19 |
| |||||||||||||||
| No Sales Charges | 7.56% | 5.62% | 4.43% | 8.32% | ||||||||||||
| S&P® Target Risk Moderate Index† | 7.08% | 5.39% | 4.57% | 6.89% | ||||||||||||
| Blended Index†† | 6.55% | 5.98% | 3.90% | 7.72% | ||||||||||||
| Average Annual Total Returnsas of 3/31/19 (most recent calendar quarter end) |
| |||||||||||||||
| No Sales Charges | 3.70% | 4.31% | 8.79% | |||||||||||||
| S&P® Target Risk Moderate Index† | 3.53% | 4.37% | 7.21% | |||||||||||||
| Blended Index†† | 5.10% | 4.09% | 8.42% | |||||||||||||
Performance in the Average Annual Total Returns table(s) above and the Growth of an Assumed $10,000 Investment line graph that follows is historical and does not guarantee future results. Investment return and principal fluctuate, so your shares may be worth more or less when redeemed. Current performance may differ from performance data shown. Please visit dws.com for the Fund’s most recentmonth-end performance. Fund performance includes reinvestment of all distributions. Unadjusted returns do not reflect sales charges and would have been lower if they had.
The gross expense ratios of the Fund, as stated in the fee table of the prospectus dated March 1, 2019 are 0.92%, 1.67%, 0.58%, 0.71% and 0.68% for Class A, Class C, Class R6, Class S and Institutional Class shares, respectively, and may differ from the expense ratios disclosed in the Financial Highlights tables in this report.
Index returns do not reflect any fees or expenses and it is not possible to invest directly into an index.
Performance figures do not reflect the deduction of taxes that a shareholder would pay on fund distributions or the redemption of fund shares.
Generally accepted accounting principles require adjustments to be made to the net assets of the Fund at period end for financial reporting purposes only, and as such, the total return based on the unadjusted net asset value per share may differ from the total return reported in the financial highlights.
| DWS Global Income Builder Fund | | | 5 |
Table of Contents
Growth of an Assumed $10,000 Investment (Adjusted for Maximum Sales Charge) |
The Fund’s growth of an assumed $10,000 investment is adjusted for the maximum sales charge of 5.75%. This results in a net initial investment of $9,425.
The growth of $10,000 is cumulative.
Performance of other share classes will vary based on the sales charges and the fee structure of those classes.
| * | Class R6 shares commenced operations on August 25, 2014. The performance shown for the Blended Index is for the time period of August 31, 2014 through October 31, 2018, which is based on the performance period of the life of Class R6. |
| † | The S&P Target Risk Moderate Index offers significant exposure to fixed income, while also increasing opportunities for higher returns through equities. |
| †† | The Blended Index consists of an equally weighted blend of 50% MSCI World High Dividend Yield Index and 50% Bloomberg Barclays U.S. Universal Index. |
MSCI World High Dividend Yield Index is based on the MSCI World Index, its parent index, and includes large and mid-capitalization stocks across 23 developed markets countries. The index is designed to reflect the performance of equities in the parent index (excluding REITs) with higher dividend income and quality characteristics than average dividend yields that are both sustainable and persistent. The index also applies quality screens and reviews12-month past performance to omit stocks with potentially deteriorating fundamentals that could force them to cut or reduce dividends. |
Bloomberg Barclays U.S. Universal Index measures the performance of U.S. dollar-denominated taxable bonds that are rated either investment grade or high yield. The index includes U.S. Treasury bonds, investment-grade and high yield U.S. corporate bonds, mortgage-backed securities, and Eurodollar bonds. |
| ‡ | Total returns shown for periods less than one year are not annualized. |
| 6 | | | DWS Global Income Builder Fund |
Table of Contents
| DWS Global Income Builder Fund | | | 7 |
Table of Contents
John D. Ryan, Managing Director
Portfolio Manager of the Fund through May 15, 2019. Began managing the Fund in 2012.
| – | Joined DWS in 2010 from Northern Trust where he served as a senior portfolio manager. Previously, he served as portfolio manager and head of credit trading for Deutsche Asset Management from 1998–2003. |
| – | Portfolio Manager for US and UK Unconstrained Funds: London. |
| – | Investment industry experience began in 1993. |
| – | BA in Economics, University of Chicago; MBA, University of Chicago. |
Darwei Kung, Managing Director
Portfolio Manager of the Fund. Began managing the Fund in 2015.
| – | Joined DWS in 2006; previously has worked as a Director, Engineering and Business Development at Calpoint LLC from 2001–2004. |
| – | Portfolio Manager: New York. |
| – | BS and MS, University of Washington, Seattle; MS and MBA, Carnegie Mellon University. |
Di Kumble, CFA, Managing Director
Portfolio Manager of the Fund. Began managing the Fund in 2017.
| – | Joined DWS in 2003 with seven years of industry experience. Prior to joining, she served as a Portfolio Manager at Graham Capital Management. Previously, she worked as a Quantitative Strategist at ITG Inc. and Morgan Stanley. |
| – | Senior Portfolio Manager, Head of Tax Managed Equities: New York. |
| – | BS, Beijing University; PhD in Chemistry, Princeton University. |
Thomas M. Farina, CFA, Managing Director
Portfolio Manager of the Fund. Began managing the Fund in 2019 (added to the team as of May 16, 2019).
| – | Joined DWS in 2006 with 12 years of industry experience. Head of Investment Grade Corporate Credit since 2013. Prior to joining, he held roles at Merrill Lynch Investment Management, Greenwich NatWest and at DnB Asset Management. He began his career as a Ratings Analyst at Standard & Poor’s. |
| – | Senior Portfolio Manager and Co-Head of US Credit: New York. |
| – | BA and MA in Economics, State University of New York at Albany. |
Dokyoung Lee, CFA, Director
Portfolio Manager of the Fund. Began managing the Fund in 2018.
| – | Joined DWS in 2018 with 24 years of industry experience; previously, worked as Head of Research and Portfolio Manager in the Global Multi-Asset Group at Oppenheimer Funds, and in research and portfolio management roles at AllianceBernstein. |
| – | BSE, Princeton University. |
Scott Agi, CFA, Director
Portfolio Manager of the Fund. Began managing the Fund in 2019 (added to the team as of May 16, 2019).
| – | Joined DWS in 2006 with eight years of industry experience. Prior to joining, he served as an MBS Analyst at Bear Stearns, in Portfolio Analytics at TimesSquare Capital Management and as a Quantitative Analyst in the Municipal Bond Division at The Vanguard Group. |
| – | Head of US Rates and Mortgage Backed Securities Sector Team: New York. |
| – | BS in Finance, Albright College. |
| 8 | | | DWS Global Income Builder Fund |
Table of Contents
| DWS Global Income Builder Fund | | | 9 |
Table of Contents
Five Largest Equity Holdings at April 30, 2019 (5.2% of Net Assets) | Percent | |||||
| 1 | Microsoft Corp. | 1.3% | ||||
| Develops, manufactures, licenses, sells and supports software products | ||||||
| 2 | Apple, Inc. | 1.3% | ||||
| Designs, manufactures and markets personal computing and mobile communication devices | ||||||
| 3 | Amazon.com, Inc. | 1.0% | ||||
| Online retailer offering a wide range of products | ||||||
| 4 | Alphabet, Inc. | 0.8% | ||||
| Holding company with subsidiaries that provide Web-based search, maps, hardware products and various software applications | ||||||
| 5 | JPMorgan Chase & Co. | 0.8% | ||||
| Operates as a financial services company worldwide | ||||||
| Five Largest Fixed-Income Long-Term Securities at April 30, 2019 (4.9% of Net Assets) | Percent | |||||
| 1 | Chase Issuance Trust, | 1.3% | ||||
| 2.673%, 4/17/2023 | ||||||
| 2 | Apidos CLO XXIX, | 1.1% | ||||
| 4.130%, 7/25/2030 | ||||||
| 3 | Dryden 55 CLO Ltd., | 1.1% | ||||
| 4.147%, 4/15/2031 | ||||||
| 4 | Citibank Credit Card Issuance Trust, | 0.8% | ||||
| 2.844%, 8/8/2024 | ||||||
| 5 | Cloverleaf Cold Storage Trust, | 0.6% | ||||
| 3.823%, 3/15/2036 | ||||||
Portfolio holdings and characteristics are subject to change.
For more complete details about the Fund’s investment portfolio, see page 11. A quarterly Fact Sheet is available on dws.com or upon request. Please see the Account Management Resources section on page 71 for contact information.
| 10 | | | DWS Global Income Builder Fund |
Table of Contents
| Investment Portfolio | as of April 30, 2019 (Unaudited) | |||
| Shares | Value ($) | |||||||
| Common Stocks 56.5% | ||||||||
| Communication Services 6.0% |
| |||||||
Diversified Telecommunication Services 2.5% |
| |||||||
AT&T, Inc. | 103,715 | 3,211,016 | ||||||
BCE, Inc. | 18,711 | 837,155 | ||||||
BT Group PLC | 347,082 | 1,038,789 | ||||||
Deutsche Telekom AG (Registered) | 52,009 | 872,229 | ||||||
Elisa Oyj | 21,044 | 893,379 | ||||||
Nippon Telegraph & Telephone Corp. | 21,600 | 898,549 | ||||||
Orange SA | 50,874 | 797,826 | ||||||
Proximus SA | 31,517 | 883,718 | ||||||
Singapore Telecommunications Ltd. | 374,100 | 864,152 | ||||||
Spark New Zealand Ltd. | 451,532 | 1,107,485 | ||||||
Swisscom AG (Registered) | 1,851 | 865,187 | ||||||
Telefonica SA | 101,099 | 845,462 | ||||||
Telenor ASA | 42,192 | 847,919 | ||||||
Telia Co. AB | 182,660 | 778,660 | ||||||
TELUS Corp. | 35,497 | 1,307,059 | ||||||
Verizon Communications, Inc. | 50,340 | 2,878,945 | ||||||
|
| |||||||
| 18,927,530 | ||||||||
Entertainment 0.6% |
| |||||||
NetEase, Inc. (ADR) | 5,154 | 1,466,468 | ||||||
Netflix, Inc.* | 2,900 | 1,074,566 | ||||||
Walt Disney Co. | 17,370 | 2,379,169 | ||||||
|
| |||||||
| 4,920,203 | ||||||||
Interactive Media & Services 1.8% |
| |||||||
Alphabet, Inc. “A”* | 2,533 | 3,036,966 | ||||||
Alphabet, Inc. “C”* | 2,679 | 3,183,938 | ||||||
Baidu, Inc. (ADR)* | 7,498 | 1,246,392 | ||||||
Facebook, Inc. “A”* | 23,318 | 4,509,701 | ||||||
Tencent Holdings Ltd. (ADR) | 27,804 | 1,369,069 | ||||||
|
| |||||||
| 13,346,066 | ||||||||
Media 0.8% |
| |||||||
Comcast Corp. “A” | 39,998 | 1,741,113 | ||||||
Interpublic Group of Companies, Inc. | 38,831 | 893,113 | ||||||
ITV PLC | 483,667 | 862,689 | ||||||
Omnicom Group, Inc. | 11,159 | 893,055 | ||||||
Shaw Communications, Inc. “B” | 41,333 | 837,027 | ||||||
WPP PLC | 75,061 | 940,604 | ||||||
|
| |||||||
| 6,167,601 | ||||||||
The accompanying notes are an integral part of the financial statements.
| DWS Global Income Builder Fund | | | 11 |
Table of Contents
| Shares | Value ($) | |||||||
Wireless Telecommunication Services 0.3% |
| |||||||
KDDI Corp. | 42,600 | 978,238 | ||||||
NTT DoCoMo, Inc. | 45,200 | 982,487 | ||||||
|
| |||||||
| 1,960,725 | ||||||||
| Consumer Discretionary 6.6% |
| |||||||
Auto Components 0.2% |
| |||||||
Bridgestone Corp. | 21,900 | 870,243 | ||||||
Nokian Renkaat Oyj | 30,419 | 1,019,147 | ||||||
|
| |||||||
| 1,889,390 | ||||||||
Automobiles 1.2% |
| |||||||
Bayerische Motoren Werke AG | 10,425 | 890,656 | ||||||
Daimler AG (Registered) | 19,180 | 1,260,036 | ||||||
General Motors Co. | 26,951 | 1,049,742 | ||||||
Honda Motor Co., Ltd. | 32,600 | 912,685 | ||||||
Nissan Motor Co., Ltd. | 144,300 | 1,160,117 | ||||||
Renault SA | 12,677 | 867,703 | ||||||
Subaru Corp. | 34,600 | 849,022 | ||||||
Toyota Motor Corp. | 31,900 | 1,983,185 | ||||||
|
| |||||||
| 8,973,146 | ||||||||
Diversified Consumer Services 0.3% |
| |||||||
H&R Block, Inc. | 34,500 | 938,745 | ||||||
Tal Education Group (ADR)* | 32,500 | 1,250,275 | ||||||
|
| |||||||
| 2,189,020 | ||||||||
Hotels, Restaurants & Leisure 1.0% |
| |||||||
Carnival Corp. | 18,560 | 1,018,202 | ||||||
Crown Resorts Ltd. | 92,110 | 862,700 | ||||||
Darden Restaurants, Inc. | 7,443 | 875,297 | ||||||
Las Vegas Sands Corp. | 13,700 | 918,585 | ||||||
McDonald’s Corp. | 10,218 | 2,018,770 | ||||||
Starbucks Corp. | 16,444 | 1,277,370 | ||||||
Yum! Brands, Inc. | 8,500 | 887,315 | ||||||
|
| |||||||
| 7,858,239 | ||||||||
Household Durables 0.7% |
| |||||||
Barratt Developments PLC | 166,426 | 1,310,147 | ||||||
Garmin Ltd. | 9,848 | 844,367 | ||||||
Leggett & Platt, Inc. | 20,180 | 794,285 | ||||||
Newell Brands, Inc. | 67,300 | 967,774 | ||||||
Sekisui House Ltd. | 63,200 | 1,020,585 | ||||||
|
| |||||||
| 4,937,158 | ||||||||
Internet & Direct Marketing Retail 1.4% |
| |||||||
Alibaba Group Holding Ltd. (ADR)* | 5,618 | 1,042,532 | ||||||
Amazon.com, Inc.* | 3,972 | 7,652,138 | ||||||
Ctrip.com International Ltd. (ADR)* | 20,302 | 894,303 | ||||||
The accompanying notes are an integral part of the financial statements.
| 12 | | | DWS Global Income Builder Fund |
Table of Contents
| Shares | Value ($) | |||||||
JD.com, Inc. (ADR)* | 29,600 | 895,992 | ||||||
|
| |||||||
| 10,484,965 | ||||||||
Leisure Products 0.1% |
| |||||||
Hasbro, Inc. | 11,377 | 1,158,861 | ||||||
Multiline Retail 0.5% |
| |||||||
Macy’s, Inc. | 35,500 | 835,670 | ||||||
Marks & Spencer Group PLC | 263,935 | 984,422 | ||||||
Target Corp. | 10,448 | 808,884 | ||||||
Wesfarmers Ltd. | 35,125 | 892,066 | ||||||
|
| |||||||
| 3,521,042 | ||||||||
Specialty Retail 0.6% |
| |||||||
Home Depot, Inc. | 12,113 | 2,467,418 | ||||||
Lowe’s Companies, Inc. | 7,700 | 871,178 | ||||||
TJX Companies, Inc. | 15,400 | 845,152 | ||||||
|
| |||||||
| 4,183,748 | ||||||||
Textiles, Apparel & Luxury Goods 0.6% |
| |||||||
Cie Financiere Richemont SA (Registered) | 11,949 | 875,053 | ||||||
LVMH Moet Hennessy Louis Vuitton SE | 3,065 | 1,206,923 | ||||||
NIKE, Inc. “B” | 11,865 | 1,042,103 | ||||||
Tapestry, Inc. | 26,409 | 852,219 | ||||||
VF Corp. | 9,670 | 912,945 | ||||||
|
| |||||||
| 4,889,243 | ||||||||
| Consumer Staples 4.2% |
| |||||||
Beverages 0.9% |
| |||||||
Ambev SA (ADR) | 186,522 | 878,519 | ||||||
Anheuser-Busch InBev SA | 9,635 | 861,242 | ||||||
Coca-Cola Co. | 41,003 | 2,011,607 | ||||||
Diageo PLC | 24,281 | 1,024,618 | ||||||
PepsiCo, Inc. | 16,906 | 2,164,813 | ||||||
|
| |||||||
| 6,940,799 | ||||||||
Food & Staples Retailing 0.5% |
| |||||||
Costco Wholesale Corp. | 3,900 | 957,567 | ||||||
Sysco Corp. | 12,605 | 887,014 | ||||||
Walgreens Boots Alliance, Inc. | 15,700 | 841,049 | ||||||
Walmart, Inc. | 12,084 | 1,242,718 | ||||||
|
| |||||||
| 3,928,348 | ||||||||
Food Products 1.3% |
| |||||||
Archer-Daniels-Midland Co. | 19,428 | 866,489 | ||||||
Bunge Ltd. | 15,900 | 833,319 | ||||||
General Mills, Inc. | 16,293 | 838,601 | ||||||
Kellogg Co. | 14,613 | 881,164 | ||||||
Mondelez International, Inc. “A” | 17,400 | 884,790 | ||||||
Mowi ASA | 38,414 | 833,937 | ||||||
The accompanying notes are an integral part of the financial statements.
| DWS Global Income Builder Fund | | | 13 |
Table of Contents
| Shares | Value ($) | |||||||
Nestle SA (Registered) | 30,730 | 2,963,543 | ||||||
The Hershey Co. | 7,238 | 903,664 | ||||||
The JM Smucker Co. | 7,100 | 870,673 | ||||||
|
| |||||||
| 9,876,180 | ||||||||
Household Products 0.6% |
| |||||||
Colgate-Palmolive Co. | 12,779 | 930,183 | ||||||
Kimberly-Clark Corp. | 7,213 | 926,005 | ||||||
Procter & Gamble Co. | 25,739 | 2,740,689 | ||||||
|
| |||||||
| 4,596,877 | ||||||||
Tobacco 0.9% |
| |||||||
Altria Group, Inc. | 29,231 | 1,588,120 | ||||||
British American Tobacco PLC | 30,068 | 1,175,877 | ||||||
Imperial Brands PLC | 31,513 | 1,003,094 | ||||||
Japan Tobacco, Inc. | 36,400 | 840,458 | ||||||
Philip Morris International, Inc. | 20,856 | 1,805,295 | ||||||
|
| |||||||
| 6,412,844 | ||||||||
| Energy 4.3% |
| |||||||
Oil, Gas & Consumable Fuels |
| |||||||
BP PLC | 237,472 | 1,732,987 | ||||||
Chevron Corp. | 19,964 | 2,396,878 | ||||||
Enagas SA | 28,902 | 824,344 | ||||||
Enbridge, Inc. | 24,564 | 907,421 | ||||||
Eni SpA | 48,977 | 837,194 | ||||||
Exxon Mobil Corp. | 43,958 | 3,528,948 | ||||||
Gazprom PJSC (ADR) | 599,375 | 3,008,863 | ||||||
JXTG Holdings, Inc. | 180,900 | 880,584 | ||||||
Kinder Morgan, Inc. | 52,328 | 1,039,757 | ||||||
LUKOIL PJSC (ADR) | 29,378 | 2,511,819 | ||||||
Occidental Petroleum Corp. | 14,859 | 874,898 | ||||||
ONEOK, Inc. | 13,568 | 921,674 | ||||||
Pembina Pipeline Corp. | 23,226 | 830,429 | ||||||
Phillips 66 | 8,707 | 820,809 | ||||||
Plains GP Holdings LP “A”* | 34,308 | 809,669 | ||||||
Repsol SA | 50,842 | 864,276 | ||||||
Royal Dutch Shell PLC “A” | 66,794 | 2,135,228 | ||||||
Royal Dutch Shell PLC “B” | 60,025 | 1,931,492 | ||||||
Snam SpA | 161,967 | 827,628 | ||||||
TOTAL SA | 29,311 | 1,635,091 | ||||||
TransCanada Corp. | 18,743 | 894,549 | ||||||
Valero Energy Corp. | 10,084 | 914,215 | ||||||
Williams Companies, Inc. | 34,835 | 986,876 | ||||||
|
| |||||||
| 32,115,629 | ||||||||
The accompanying notes are an integral part of the financial statements.
| 14 | | | DWS Global Income Builder Fund |
Table of Contents
| Shares | Value ($) | |||||||
| Financials 7.9% |
| |||||||
Banks 5.0% |
| |||||||
Australia & New Zealand Banking Group Ltd. | 48,852 | 935,670 | ||||||
Banco Bradesco SA (ADR) (Preferred) | 91,992 | 833,448 | ||||||
Banco Santander SA | 206,655 | 1,050,897 | ||||||
Bank of America Corp. | 84,234 | 2,575,876 | ||||||
Bank of Montreal | 11,240 | 887,823 | ||||||
Bank of Nova Scotia | 18,846 | 1,037,888 | ||||||
BB&T Corp. | 17,734 | 907,981 | ||||||
Bendigo & Adelaide Bank Ltd. | 123,249 | 895,410 | ||||||
BNP Paribas SA | 24,316 | 1,298,284 | ||||||
Canadian Imperial Bank of Commerce | 11,120 | 936,364 | ||||||
Citigroup, Inc. | 18,171 | 1,284,690 | ||||||
Commonwealth Bank of Australia | 23,512 | 1,235,656 | ||||||
HSBC Holdings PLC | 262,472 | 2,288,966 | ||||||
ICICI Bank Ltd. (ADR) | 84,400 | 966,380 | ||||||
Itau Unibanco Holding SA (ADR) (Preferred) | 137,200 | 1,186,780 | ||||||
Japan Post Bank Co., Ltd. | 76,000 | 836,695 | ||||||
JPMorgan Chase & Co. | 33,965 | 3,941,638 | ||||||
Lloyds Banking Group PLC | 1,231,904 | 1,009,049 | ||||||
Mitsubishi UFJ Financial Group, Inc. | 177,600 | 883,659 | ||||||
Mizuho Financial Group, Inc. | 576,800 | 902,045 | ||||||
People’s United Financial, Inc. | 50,016 | 864,777 | ||||||
Royal Bank of Canada | 12,350 | 984,257 | ||||||
Sberbank of Russia PJSC (ADR) | 159,882 | 2,310,295 | ||||||
Skandinaviska Enskilda Banken AB “A” | 94,641 | 905,245 | ||||||
Sumitomo Mitsui Financial Group, Inc. | 28,000 | 1,019,439 | ||||||
Toronto-Dominion Bank | 17,771 | 1,013,704 | ||||||
U.S. Bancorp. | 20,857 | 1,112,095 | ||||||
Wells Fargo & Co. | 41,403 | 2,004,319 | ||||||
Westpac Banking Corp. | 67,009 | 1,299,389 | ||||||
|
| |||||||
| 37,408,719 | ||||||||
Capital Markets 0.3% |
| |||||||
CME Group, Inc. | 5,704 | 1,020,446 | ||||||
UBS Group AG (Registered)* | 89,089 | 1,199,097 | ||||||
|
| |||||||
| 2,219,543 | ||||||||
Diversified Financial Services 0.2% |
| |||||||
Berkshire Hathaway, Inc. “B”* | 8,407 | 1,821,881 | ||||||
Insurance 2.4% |
| |||||||
Ageas | 16,618 | 877,981 | ||||||
Allianz SE (Registered) | 4,121 | 995,961 | ||||||
American Financial Group, Inc. | 8,850 | 916,241 | ||||||
Assicurazioni Generali SpA | 44,801 | 871,749 | ||||||
Aviva PLC | 200,732 | 1,125,444 | ||||||
The accompanying notes are an integral part of the financial statements.
| DWS Global Income Builder Fund | | | 15 |
Table of Contents
| Shares | Value ($) | |||||||
AXA SA (a) | 39,025 | 1,041,337 | ||||||
Baloise Holding AG (Registered) | 5,133 | 881,800 | ||||||
Chubb Ltd. | 6,515 | 945,978 | ||||||
Japan Post Holdings Co., Ltd. | 74,600 | 834,154 | ||||||
Legal & General Group PLC | 233,311 | 848,740 | ||||||
MetLife, Inc. | 19,276 | 889,202 | ||||||
Muenchener Rueckversicherungs-Gesellschaft AG (Registered) | 3,482 | 871,934 | ||||||
Poste Italiane SpA 144A | 83,519 | 893,040 | ||||||
Power Corp. of Canada | 35,800 | 821,447 | ||||||
Power Financial Corp. | 34,562 | 823,740 | ||||||
Sampo Oyj “A” | 28,047 | 1,286,133 | ||||||
Swiss Life Holding AG (Registered)* | 1,859 | 877,530 | ||||||
Swiss Re AG | 10,341 | 996,639 | ||||||
Zurich Insurance Group AG | 4,123 | 1,317,425 | ||||||
|
| |||||||
| 18,116,475 | ||||||||
| Health Care 4.9% |
| |||||||
Biotechnology 0.8% |
| |||||||
AbbVie, Inc. | 26,576 | 2,109,869 | ||||||
Amgen, Inc. | 9,122 | 1,635,757 | ||||||
Biogen., Inc.* | 3,500 | 802,340 | ||||||
Gilead Sciences, Inc. | 20,739 | 1,348,864 | ||||||
|
| |||||||
| 5,896,830 | ||||||||
Health Care Equipment & Supplies 0.3% |
| |||||||
Abbott Laboratories | 13,779 | 1,096,257 | ||||||
Medtronic PLC | 12,445 | 1,105,241 | ||||||
|
| |||||||
| 2,201,498 | ||||||||
Health Care Providers & Services 0.4% |
| |||||||
Anthem, Inc. | 2,900 | 762,787 | ||||||
CVS Health Corp. | 15,970 | 868,448 | ||||||
UnitedHealth Group, Inc. | 7,872 | 1,834,727 | ||||||
|
| |||||||
| 3,465,962 | ||||||||
Life Sciences Tools & Services 0.1% |
| |||||||
Thermo Fisher Scientific, Inc. | 3,200 | 887,840 | ||||||
Pharmaceuticals 3.3% |
| |||||||
Allergan PLC | 5,700 | 837,900 | ||||||
Astellas Pharma, Inc. | 57,700 | 787,897 | ||||||
AstraZeneca PLC | 14,907 | 1,111,148 | ||||||
Bayer AG (Registered) | 14,867 | 992,124 | ||||||
Bristol-Myers Squibb Co. | 21,538 | 1,000,009 | ||||||
Eli Lilly & Co. | 10,857 | 1,270,703 | ||||||
GlaxoSmithKline PLC | 66,150 | 1,359,569 | ||||||
Johnson & Johnson | 27,903 | 3,939,904 | ||||||
The accompanying notes are an integral part of the financial statements.
| 16 | | | DWS Global Income Builder Fund |
Table of Contents
| Shares | Value ($) | |||||||
Merck & Co., Inc. | 27,580 | 2,170,822 | ||||||
Novartis AG (Registered) | 26,874 | 2,200,565 | ||||||
Novo Nordisk AS “B” | 16,468 | 807,167 | ||||||
Orion Oyj “B” | 23,562 | 784,469 | ||||||
Pfizer, Inc. | 70,908 | 2,879,574 | ||||||
Roche Holding AG (Genusschein) | 9,086 | 2,401,591 | ||||||
Sanofi | 15,734 | 1,370,604 | ||||||
Takeda Pharmaceutical Co., Ltd. | 22,700 | 841,743 | ||||||
|
| |||||||
| 24,755,789 | ||||||||
| Industrials 6.1% |
| |||||||
Aerospace & Defense 1.1% |
| |||||||
BAE Systems PLC | 155,117 | 999,147 | ||||||
Boeing Co. | 5,552 | 2,096,935 | ||||||
General Dynamics Corp. | 5,700 | 1,018,704 | ||||||
Lockheed Martin Corp. | 3,487 | 1,162,322 | ||||||
Northrop Grumman Corp. | 3,483 | 1,009,756 | ||||||
Raytheon Co. | 5,148 | 914,233 | ||||||
United Technologies Corp. | 9,771 | 1,393,442 | ||||||
|
| |||||||
| 8,594,539 | ||||||||
Air Freight & Logistics 0.1% |
| |||||||
United Parcel Service, Inc. “B” | 8,140 | 864,631 | ||||||
Building Products 0.1% |
| |||||||
Johnson Controls International PLC | 24,252 | 909,450 | ||||||
Commercial Services & Supplies 0.4% |
| |||||||
Quad Graphics, Inc. | 10 | 122 | ||||||
Republic Services, Inc. | 10,816 | 895,781 | ||||||
Secom Co., Ltd. | 11,000 | 926,981 | ||||||
Waste Management, Inc. | 13,190 | 1,415,815 | ||||||
|
| |||||||
| 3,238,699 | ||||||||
Construction & Engineering 0.3% |
| |||||||
Kajima Corp. | 60,300 | 895,892 | ||||||
Obayashi Corp. | 86,200 | 847,581 | ||||||
Skanska AB “B” | 46,272 | 805,691 | ||||||
|
| |||||||
| 2,549,164 | ||||||||
Electrical Equipment 0.5% |
| |||||||
ABB Ltd. (Registered) | 62,379 | 1,292,784 | ||||||
Eaton Corp. PLC | 13,994 | 1,158,983 | ||||||
Emerson Electric Co. | 13,087 | 929,046 | ||||||
|
| |||||||
| 3,380,813 | ||||||||
Industrial Conglomerates 0.7% |
| |||||||
3M Co. | 8,594 | 1,628,649 | ||||||
Honeywell International, Inc. | 10,869 | 1,887,184 | ||||||
The accompanying notes are an integral part of the financial statements.
| DWS Global Income Builder Fund | | | 17 |
Table of Contents
| Shares | Value ($) | |||||||
Siemens AG (Registered) | 12,386 | 1,485,474 | ||||||
|
| |||||||
| 5,001,307 | ||||||||
Machinery 1.1% |
| |||||||
Caterpillar, Inc. | 8,237 | 1,148,403 | ||||||
Cummins, Inc. | 5,460 | 907,943 | ||||||
Illinois Tool Works, Inc. | 6,093 | 948,254 | ||||||
Ingersoll-Rand PLC | 7,843 | 961,630 | ||||||
Kone Oyj “B” | 23,678 | 1,301,004 | ||||||
Mitsubishi Heavy Industries Ltd. | 21,100 | 879,030 | ||||||
PACCAR, Inc. | 19,600 | 1,404,732 | ||||||
Wartsila Oyj | 53,915 | 861,178 | ||||||
|
| |||||||
| 8,412,174 | ||||||||
Marine 0.1% |
| |||||||
Kuehne + Nagel International AG (Registered) | 6,080 | 884,756 | ||||||
Professional Services 0.6% |
| |||||||
Adecco Group AG (Registered) | 17,273 | 996,800 | ||||||
Nielsen Holdings PLC | 46,474 | 1,186,481 | ||||||
RELX PLC | 52,493 | 1,205,381 | ||||||
SGS SA (Registered) | 329 | 869,975 | ||||||
|
| |||||||
| 4,258,637 | ||||||||
Road & Rail 0.3% |
| |||||||
Aurizon Holdings Ltd. | 257,981 | 866,173 | ||||||
Union Pacific Corp. | 6,081 | 1,076,580 | ||||||
|
| |||||||
| 1,942,753 | ||||||||
Trading Companies & Distributors 0.8% |
| |||||||
ITOCHU Corp. | 69,100 | 1,246,191 | ||||||
Marubeni Corp. | 146,300 | 1,050,320 | ||||||
Mitsubishi Corp. | 38,500 | 1,061,928 | ||||||
Mitsui & Co., Ltd. | 80,300 | 1,299,781 | ||||||
Sumitomo Corp. | 82,800 | 1,187,547 | ||||||
|
| |||||||
| 5,845,767 | ||||||||
| Information Technology 10.1% |
| |||||||
Communications Equipment 0.8% |
| |||||||
Cisco Systems, Inc. | 55,782 | 3,121,003 | ||||||
Juniper Networks, Inc. | 30,600 | 849,762 | ||||||
Motorola Solutions, Inc. | 6,075 | 880,328 | ||||||
Nokia Oyj | 234,830 | 1,235,279 | ||||||
|
| |||||||
| 6,086,372 | ||||||||
Electronic Equipment, Instruments & Components 0.2% |
| |||||||
Corning, Inc. | 25,069 | 798,448 | ||||||
TE Connectivity Ltd. | 9,974 | 954,013 | ||||||
|
| |||||||
| 1,752,461 | ||||||||
The accompanying notes are an integral part of the financial statements.
| 18 | | | DWS Global Income Builder Fund |
Table of Contents
| Shares | Value ($) | |||||||
IT Services 2.9% |
| |||||||
Accenture PLC “A” | 9,026 | 1,648,779 | ||||||
Automatic Data Processing, Inc. | 7,377 | 1,212,705 | ||||||
Broadridge Financial Solutions, Inc. | 8,372 | 988,984 | ||||||
Cognizant Technology Solutions Corp. “A” | 12,361 | 901,859 | ||||||
DXC Technology Co. | 13,500 | 887,490 | ||||||
Fidelity National Information Services, Inc. | 9,936 | 1,151,880 | ||||||
Fujitsu Ltd. | 13,000 | 951,875 | ||||||
Infosys Ltd. (ADR) | 162,166 | 1,744,906 | ||||||
International Business Machines Corp. | 16,359 | 2,294,677 | ||||||
Leidos Holdings, Inc. | 15,270 | 1,122,040 | ||||||
MasterCard, Inc. “A” | 9,878 | 2,511,383 | ||||||
Paychex, Inc. | 14,980 | 1,262,964 | ||||||
PayPal Holdings, Inc.* | 9,300 | 1,048,761 | ||||||
Visa, Inc. “A” | 18,057 | 2,969,113 | ||||||
Western Union Co. | 61,964 | 1,204,580 | ||||||
|
| |||||||
| 21,901,996 | ||||||||
Semiconductors & Semiconductor Equipment 2.0% |
| |||||||
Analog Devices, Inc. | 8,474 | 985,018 | ||||||
Broadcom, Inc. | 5,454 | 1,736,554 | ||||||
Intel Corp. | 57,752 | 2,947,662 | ||||||
KLA-Tencor Corp. | 7,282 | 928,309 | ||||||
Maxim Integrated Products, Inc. | 15,225 | 913,500 | ||||||
QUALCOMM., Inc. | 22,347 | 1,924,747 | ||||||
Taiwan Semiconductor Manufacturing Co., Ltd. (ADR) | 64,027 | 2,805,663 | ||||||
Texas Instruments, Inc. | 15,999 | 1,885,162 | ||||||
Tokyo Electron Ltd. | 6,900 | 1,099,885 | ||||||
|
| |||||||
| 15,226,500 | ||||||||
Software 2.3% |
| |||||||
Adobe, Inc.* | 3,636 | 1,051,713 | ||||||
Intuit, Inc. | 3,719 | 933,692 | ||||||
Micro Focus International PLC | 30,997 | 783,265 | ||||||
Microsoft Corp. | 74,819 | 9,771,362 | ||||||
Oracle Corp. | 32,107 | 1,776,480 | ||||||
salesforce.com, Inc.* | 6,200 | 1,025,170 | ||||||
SAP SE | 12,718 | 1,638,995 | ||||||
|
| |||||||
| 16,980,677 | ||||||||
Technology Hardware, Storage & Peripherals 1.9% |
| |||||||
Apple, Inc. | 48,461 | 9,724,669 | ||||||
Canon, Inc. | 30,600 | 852,022 | ||||||
HP, Inc. | 42,077 | 839,436 | ||||||
Samsung Electronics Co., Ltd. (GDR) | 847 | 835,142 | ||||||
Seagate Technology PLC | 17,627 | 851,737 | ||||||
Xerox Corp. | 24,801 | 827,361 | ||||||
|
| |||||||
| 13,930,367 | ||||||||
The accompanying notes are an integral part of the financial statements.
| DWS Global Income Builder Fund | | | 19 |
Table of Contents
| Shares | Value ($) | |||||||
| Materials 1.0% |
| |||||||
Chemicals 0.5% |
| |||||||
Air Products & Chemicals, Inc. | 4,314 | 887,778 | ||||||
DowDuPont, Inc. | 24,754 | 951,791 | ||||||
GEO Specialty Chemicals, Inc.* (b) | 433,490 | 119,210 | ||||||
Linde PLC | 4,800 | 865,248 | ||||||
LyondellBasell Industries NV “A” | 9,402 | 829,539 | ||||||
|
| |||||||
| 3,653,566 | ||||||||
Construction Materials 0.1% |
| |||||||
LafargeHolcim Ltd. (Registered)* | 17,017 | 877,843 | ||||||
Metals & Mining 0.2% |
| |||||||
JFE Holdings, Inc. | 47,700 | 820,952 | ||||||
Rio Tinto PLC | 14,569 | 851,428 | ||||||
|
| |||||||
| 1,672,380 | ||||||||
Paper & Forest Products 0.2% |
| |||||||
UPM-Kymmene Oyj | 34,659 | 979,817 | ||||||
| Real Estate 2.5% |
| |||||||
Equity Real Estate Investment Trusts (REITs) |
| |||||||
AvalonBay Communities, Inc. | 4,130 | 829,841 | ||||||
Brookfield Property REIT, Inc. “A” | 39,900 | 831,117 | ||||||
Crown Castle International Corp. | 6,459 | 812,413 | ||||||
H&R Real Estate Investment Trust | 47,700 | 814,998 | ||||||
HCP, Inc. | 27,149 | 808,497 | ||||||
Iron Mountain, Inc. | 24,400 | 792,512 | ||||||
Kimco Realty Corp. | 47,100 | 819,069 | ||||||
Land Securities Group PLC | 73,483 | 885,177 | ||||||
Liberty Property Trust | 17,884 | 887,762 | ||||||
Mid-America Apartment Communities, Inc. | 7,612 | 832,829 | ||||||
National Retail Properties, Inc. | 15,656 | 823,819 | ||||||
Prologis, Inc. | 11,434 | 876,645 | ||||||
Public Storage | 3,848 | 851,100 | ||||||
Realty Income Corp. | 12,077 | 845,511 | ||||||
RioCan Real Estate Investment Trust | 42,365 | 814,602 | ||||||
Simon Property Group, Inc. | 4,694 | 815,348 | ||||||
The Macerich Co. | 19,354 | 776,869 | ||||||
Ventas, Inc. | 15,738 | 961,749 | ||||||
VEREIT, Inc. | 124,000 | 1,024,240 | ||||||
Vicinity Centres | 470,493 | 843,891 | ||||||
Welltower, Inc. | 10,998 | 819,681 | ||||||
WP Carey, Inc. | 11,700 | 928,044 | ||||||
|
| |||||||
| 18,695,714 | ||||||||
The accompanying notes are an integral part of the financial statements.
| 20 | | | DWS Global Income Builder Fund |
Table of Contents
| Shares | Value ($) | |||||||
| Utilities 2.9% |
| |||||||
Electric Utilities 1.7% |
| |||||||
American Electric Power Co., Inc. | 11,720 | 1,002,646 | ||||||
Duke Energy Corp. | 11,059 | 1,007,696 | ||||||
Entergy Corp. | 8,907 | 863,088 | ||||||
Evergy, Inc. | 14,700 | 849,954 | ||||||
Exelon Corp. | 17,729 | 903,293 | ||||||
FirstEnergy Corp. | 21,100 | 886,833 | ||||||
Fortum Oyj | 44,710 | 946,155 | ||||||
NextEra Energy, Inc. | 5,193 | 1,009,727 | ||||||
OGE Energy Corp. | 20,600 | 872,204 | ||||||
Pinnacle West Capital Corp. | 9,100 | 866,957 | ||||||
Power Assets Holdings Ltd. | 126,000 | 879,844 | ||||||
PPL Corp. | 31,548 | 984,613 | ||||||
Southern Co. | 16,433 | 874,564 | ||||||
Xcel Energy, Inc. | 15,300 | 864,450 | ||||||
|
| |||||||
| 12,812,024 | ||||||||
Multi-Utilities 1.2% |
| |||||||
Ameren Corp. | 12,200 | 887,794 | ||||||
CenterPoint Energy, Inc. | 27,834 | 862,854 | ||||||
Consolidated Edison, Inc. | 10,912 | 940,178 | ||||||
Dominion Energy, Inc | 13,427 | 1,045,561 | ||||||
DTE Energy Co. | 7,100 | 892,541 | ||||||
Engie SA | 54,893 | 815,608 | ||||||
National Grid PLC | 77,323 | 844,379 | ||||||
Public Service Enterprise Group, Inc. | 14,600 | 870,890 | ||||||
Sempra Energy | 6,800 | 870,060 | ||||||
WEC Energy Group, Inc. | 10,922 | 856,612 | ||||||
|
| |||||||
| 8,886,477 | ||||||||
| Total Common Stocks(Cost $376,300,981) |
| 425,391,035 | ||||||
| Preferred Stocks 5.2% | ||||||||
| Communication Services 0.3% |
| |||||||
AT&T, Inc. 5.35% | 100,000 | 2,565,000 | ||||||
| Financials 4.7% |
| |||||||
AGNC Investment Corp. Series C, 7.0% | 64,439 | 1,668,970 | ||||||
AGNC Investment Corp. Series B, 7.75% | 80,000 | 2,038,400 | ||||||
Bank of America Corp. Series Y, 6.5% | 75,000 | 1,929,000 | ||||||
BB&T Corp. 5.625% | 75,000 | 1,952,250 | ||||||
Capital One Financial Corp. Series G, 5.2% | 100,000 | 2,491,000 | ||||||
Charles Schwab Corp. Series D, 5.95% | 75,000 | 1,959,000 | ||||||
Citigroup, Inc. Series S, 6.3% | 75,000 | 1,969,500 | ||||||
Fifth Third Bancorp. Series I, 6.625% | 75,000 | 2,154,750 | ||||||
The accompanying notes are an integral part of the financial statements.
| DWS Global Income Builder Fund | | | 21 |
Table of Contents
| Shares | Value ($) | |||||||
JPMorgan Chase & Co. Series AA, 6.1% | 75,000 | 1,967,250 | ||||||
KeyCorp Series E, 6.125% | 75,000 | 2,046,750 | ||||||
Kimco Realty Corp. Series L, 5.125% | 75,000 | 1,751,250 | ||||||
Morgan Stanley Series K, 5.85% | 75,000 | 1,969,500 | ||||||
PNC Financial Services Group, Inc. Series P, 6.125% | 75,000 | 1,995,750 | ||||||
Prologis, Inc. Series Q, 8.54% | 236 | 15,293 | ||||||
Regions Financial Corp. Series B, 6.375% | 80,000 | 2,222,400 | ||||||
Simon Property Group, Inc. Series J, 8.375% | 17,000 | 1,208,360 | ||||||
The Goldman Sachs Group, Inc. Series J, 5.5% | 73,000 | 1,898,000 | ||||||
VEREIT, Inc. Series F, 6.7% | 75,000 | 1,883,250 | ||||||
Wells Fargo & Co. Series Y, 5.625% | 75,000 | 1,921,500 | ||||||
|
| |||||||
| 35,042,173 | ||||||||
| Utilities 0.2% |
| |||||||
Dominion Energy, Inc. Series A, 5.25% | 60,000 | 1,515,000 | ||||||
| Total Preferred Stocks(Cost $40,399,472) |
| 39,122,173 | ||||||
| Warrants 0.0% | ||||||||
| Materials |
| |||||||
Hercules Trust II, Expiration Date 3/31/2029* (b) | 506 | 18,540 | ||||||
| Principal Amount ($)(c) | Value ($) | |||||||
| Corporate Bonds 7.8% |
| |||||||
| Communication Services 1.1% |
| |||||||
Altice Financing SA, 144A, 7.5%, 5/15/2026 | 450,000 | 456,750 | ||||||
CCO Holdings LLC, 144A, 5.875%, 5/1/2027 | 1,535,000 | 1,594,481 | ||||||
CenturyLink, Inc., Series Y, 7.5%, 4/1/2024 (a) | 370,000 | 397,288 | ||||||
Clear Channel Worldwide Holdings, Inc., Series B, 6.5%, 11/15/2022 | 595,000 | 607,644 | ||||||
CSC Holdings LLC: |
| |||||||
144A, 5.125%, 12/15/2021 | 1,390,000 | 1,393,475 | ||||||
144A, 5.5%, 4/15/2027 | 1,000,000 | 1,030,130 | ||||||
DISH DBS Corp., 5.0%, 3/15/2023 (a) | 845,000 | 774,231 | ||||||
Expedia Group, Inc., 3.8%, 2/15/2028 | 820,000 | 807,515 | ||||||
MDC Partners, Inc., 144A, 6.5%, 5/1/2024 | 50,000 | 42,250 | ||||||
Netflix, Inc., 4.375%, 11/15/2026 (a) | 1,000,000 | 988,750 | ||||||
Zayo Group LLC, 6.375%, 5/15/2025 | 265,000 | 269,638 | ||||||
|
| |||||||
| 8,362,152 | ||||||||
| Consumer Discretionary 0.6% |
| |||||||
1011778 B.C. Unlimited Liability Co., 144A, 5.0%, 10/15/2025 | 2,000,000 | 1,985,000 | ||||||
The accompanying notes are an integral part of the financial statements.
| 22 | | | DWS Global Income Builder Fund |
Table of Contents
| Principal Amount ($)(c) | Value ($) | |||||||
American Axle & Manufacturing, Inc., 6.25%, 4/1/2025 (a) | 1,750,000 | 1,758,942 | ||||||
Asbury Automotive Group, Inc., 6.0%, 12/15/2024 | 105,000 | 108,675 | ||||||
Dana, Inc., 5.5%, 12/15/2024 | 170,000 | 172,125 | ||||||
Panther BF Aggregator 2 LP, 144A, 6.25%, 5/15/2026 | 200,000 | 208,250 | ||||||
Penske Automotive Group, Inc., 5.5%, 5/15/2026 | 165,000 | 164,588 | ||||||
|
| |||||||
| 4,397,580 | ||||||||
| Consumer Staples 0.1% |
| |||||||
B&G Foods, Inc., 5.25%, 4/1/2025 (a) | 1,030,000 | 1,010,636 | ||||||
| Energy 2.6% |
| |||||||
Antero Resources Corp., 5.125%, 12/1/2022 | 440,000 | 441,650 | ||||||
Boardwalk Pipelines LP, 4.95%, 12/15/2024 | 1,000,000 | 1,047,015 | ||||||
Cheniere Corpus Christi Holdings LLC, 5.875%, 3/31/2025 | 1,000,000 | 1,077,500 | ||||||
Chesapeake Energy Corp., 8.0%, 1/15/2025 (a) | 630,000 | 637,875 | ||||||
Crestwood Midstream Partners LP, 6.25%, 4/1/2023 | 2,000,000 | 2,050,000 | ||||||
CrownRock LP, 144A, 5.625%, 10/15/2025 | 1,000,000 | 987,500 | ||||||
Energy Transfer Operating LP, 5.5%, 6/1/2027 | 1,000,000 | 1,086,522 | ||||||
Hilcorp Energy I LP, 144A, 5.75%, 10/1/2025 | 870,000 | 876,525 | ||||||
KazMunayGas National Co. JSC: |
| |||||||
144A, 4.4%, 4/30/2023 | 500,000 | 511,900 | ||||||
144A, 4.75%, 4/19/2027 | 2,000,000 | 2,069,688 | ||||||
Laredo Petroleum, Inc., 6.25%, 3/15/2023 (a) | 210,000 | 193,725 | ||||||
MEG Energy Corp., 144A, 6.5%, 1/15/2025 | 500,000 | 502,500 | ||||||
Oasis Petroleum, Inc., 6.875%, 3/15/2022 | 549,000 | 551,059 | ||||||
Petrobras Global Finance BV, 5.299%, 1/27/2025 | 500,000 | 513,500 | ||||||
Plains All American Pipeline LP, 2.85%, 1/31/2023 | 230,000 | 224,928 | ||||||
Range Resources Corp.: |
| |||||||
4.875%, 5/15/2025 | 140,000 | 128,975 | ||||||
5.0%, 8/15/2022 | 2,000,000 | 1,980,000 | ||||||
5.875%, 7/1/2022 | 175,000 | 176,969 | ||||||
Saudi Arabian Oil Co., 144A, 4.375%, 4/16/2049 | 721,000 | 700,494 | ||||||
Targa Resources Partners LP, 5.375%, 2/1/2027 | 2,000,000 | 2,030,000 | ||||||
WPX Energy, Inc., 5.25%, 9/15/2024 | 2,000,000 | 2,065,000 | ||||||
|
| |||||||
| 19,853,325 | ||||||||
| Financials 1.4% |
| |||||||
AerCap Ireland Capital DAC, 3.75%, 5/15/2019 | 70,000 | 70,019 | ||||||
Akbank Turk AS, 144A, 5.0%, 10/24/2022 | 250,000 | 230,500 | ||||||
BPCE SA, 144A, 4.875%, 4/1/2026 | 1,300,000 | 1,345,224 | ||||||
Credit Suisse Group AG, 144A, 7.5%, Perpetual (d) | 750,000 | 803,437 | ||||||
FS KKR Capital Corp., 4.75%, 5/15/2022 | 310,000 | 309,610 | ||||||
HSBC Holdings PLC, 6.0%, Perpetual (d) | 1,000,000 | 1,001,880 | ||||||
National Savings Bank, 144A, 5.15%, 9/10/2019 | 500,000 | 500,000 | ||||||
Royal Bank of Scotland Group PLC, 7.5%, Perpetual (d) | 2,500,000 | 2,571,875 | ||||||
Synchrony Financial, 4.375%, 3/19/2024 | 540,000 | 551,856 | ||||||
The accompanying notes are an integral part of the financial statements.
| DWS Global Income Builder Fund | | | 23 |
Table of Contents
| Principal Amount ($)(c) | Value ($) | |||||||
The Goldman Sachs Group, Inc., Series P, 5.0%, Perpetual (d) | 2,000,000 | 1,904,000 | ||||||
Westpac Banking Corp., 5.0%, Perpetual (d) | 1,105,000 | 1,014,428 | ||||||
|
| |||||||
| 10,302,829 | ||||||||
| Health Care 0.2% |
| |||||||
Endo Dac, 144A, 6.0%, 2/1/2025 | 160,000 | 122,200 | ||||||
HCA, Inc., 5.25%, 6/15/2026 | 1,000,000 | 1,068,046 | ||||||
|
| |||||||
| 1,190,246 | ||||||||
| Industrials 0.5% |
| |||||||
Bombardier, Inc., 144A, 5.75%, 3/15/2022 | 1,480,000 | 1,496,650 | ||||||
Masonite International Corp., 144A, 5.625%, 3/15/2023 | 116,000 | 118,610 | ||||||
Park Aerospace Holdings Ltd., 144A, 5.25%, 8/15/2022 | 850,000 | 884,850 | ||||||
Prime Security Services Borrower LLC, 144A, 5.25%, 4/15/2024 | 1,550,000 | 1,553,875 | ||||||
|
| |||||||
| 4,053,985 | ||||||||
| Information Technology 0.1% |
| |||||||
Tencent Holdings Ltd., 144A, 3.975%, 4/11/2029 | 650,000 | 654,878 | ||||||
| Materials 0.6% |
| |||||||
Ardagh Packaging Finance PLC, 144A, 7.25%, 5/15/2024 | 2,000,000 | 2,107,100 | ||||||
Cascades, Inc., 144A, 5.5%, 7/15/2022 | 36,000 | 36,270 | ||||||
CF Industries, Inc., 144A, 4.5%, 12/1/2026 | 95,000 | 96,679 | ||||||
Chemours Co., 6.625%, 5/15/2023 | 905,000 | 937,535 | ||||||
Constellium NV, 144A, 6.625%, 3/1/2025 | 1,000,000 | 1,040,000 | ||||||
Teck Resources Ltd., 144A, 8.5%, 6/1/2024 | 50,000 | 53,501 | ||||||
|
| |||||||
| 4,271,085 | ||||||||
| Real Estate 0.3% |
| |||||||
Hospitality Properties Trust, (REIT), 3.95%, 1/15/2028 | 400,000 | 372,697 | ||||||
Office Properties Income Trust: |
| |||||||
(REIT), 4.0%, 7/15/2022 | 555,000 | 555,724 | ||||||
(REIT), 4.15%, 2/1/2022 | 260,000 | 261,036 | ||||||
(REIT), 4.25%, 5/15/2024 | 210,000 | 202,932 | ||||||
Omega Healthcare Investors, Inc.: |
| |||||||
(REIT), 4.5%, 4/1/2027 | 230,000 | 233,112 | ||||||
(REIT), 4.75%, 1/15/2028 (a) | 260,000 | 266,949 | ||||||
|
| |||||||
| 1,892,450 | ||||||||
| Utilities 0.3% |
| |||||||
NRG Energy, Inc., 6.25%, 5/1/2024 | 870,000 | 898,014 | ||||||
Southern California Edison Co., Series E, 3.7%, 8/1/2025 | 1,650,000 | 1,674,123 | ||||||
|
| |||||||
| 2,572,137 | ||||||||
| Total Corporate Bonds(Cost $58,606,310) |
| 58,561,303 | ||||||
The accompanying notes are an integral part of the financial statements.
| 24 | | | DWS Global Income Builder Fund |
Table of Contents
| Principal Amount ($)(c) | Value ($) | |||||||
| Asset-Backed 7.6% |
| |||||||
| Automobile Receivables 0.5% |
| |||||||
Avis Budget Rental Car Funding AESOP LLC, “C”,Series 2019-1A, 144A, 4.53%, 3/20/2023 | 700,000 | 709,038 | ||||||
CPS Auto Receivables Trust, “E”, Series2015-C, 144A, 6.54%, 8/16/2021 | 1,500,000 | 1,545,803 | ||||||
Santander Drive Auto Receivables Trust, “C”, Series2019-1, 3.42%, 4/15/2025 | 1,500,000 | 1,513,664 | ||||||
|
| |||||||
| 3,768,505 | ||||||||
| Credit Card Receivables 2.0% | ||||||||
Chase Issuance Trust, “A1”, Series2018-A1, 2.673%**, 4/17/2023 | 9,700,000 | 9,700,758 | ||||||
Citibank Credit Card Issuance Trust, “A7”, Series2017-A7, 2.844%**, 8/8/2024 | 5,841,000 | 5,850,322 | ||||||
|
| |||||||
| 15,551,080 | ||||||||
| Miscellaneous 5.1% |
| |||||||
Apidos CLO XXIX, “A2”, Series2018-29A, 144A,3-monthUSD-LIBOR + 1.550%, 4.13%**, 7/25/2030 | 8,500,000 | 8,416,224 | ||||||
Dell Equipment Finance Trust, “D”, Series2017-1, 144A, 3.44%, 4/24/2023 | 980,000 | 979,833 | ||||||
Dryden 55 CLO Ltd.: |
| |||||||
“B”, Series2018-55A, 144A,3-monthUSD-LIBOR + 1.550%, 4.147%**, 4/15/2031 | 8,500,000 | 8,374,633 | ||||||
“D”, Series2018-55A, 144A,3-monthUSD-LIBOR + 2.850%, 5.447%**, 4/15/2031 | 2,000,000 | 1,937,088 | ||||||
Dryden Senior Loan Fund, “B”, Series2017-49A, 144A,3-monthUSD-LIBOR + 1.700%, 4.301%**, 7/18/2030 | 1,130,000 | 1,122,097 | ||||||
GoldenTree Loan Management CLO Ltd., “C1A”, Series 2X, REG S,3-month EURO-LIBOR + 2.450% floor, 2.45%**, 1/20/2032 | EUR | 2,370,000 | 2,665,089 | |||||
Hilton Grand Vacations Trust, “B”, Series2014-AA, 144A, 2.07%, 11/25/2026 | 363,472 | 359,018 | ||||||
Jubilee CLO BV, “C1”, Series2018-21A, 144A,3-month EURO-LIBOR + 2.500% floor, 2.5%**, 1/15/2032 | EUR | 2,500,000 | 2,748,353 | |||||
Madison Park Funding XIV Ltd., “DRR”, Series2014-14A, 144A,3-monthUSD-LIBOR + 2.950%, 5.542%**, 10/22/2030 | 2,500,000 | 2,439,345 | ||||||
Neuberger Berman CLO Ltd.: |
| |||||||
“B”, Series2018-28A, 144A,3-monthUSD-LIBOR + 1.600%, 4.192%**, 4/20/2030 | 4,250,000 | 4,190,955 | ||||||
“D”, Series2018-28A, 144A,3-monthUSD-LIBOR + 2.850%, 5.442%**, 4/20/2030 | 1,000,000 | 971,486 | ||||||
Venture XXVIII CLO Ltd., “A2”, Series2017-28A, 144A,3-monthUSD-LIBOR + 1.110%, 3.702%**, 7/20/2030 | 2,000,000 | 1,987,634 | ||||||
The accompanying notes are an integral part of the financial statements.
| DWS Global Income Builder Fund | | | 25 |
Table of Contents
| Principal Amount ($)(c) | Value ($) | |||||||
Voya CLO Ltd., “CR”, Series2016-3A, 144A,3-monthUSD-LIBOR + 3.250%, 5.851%**, 10/18/2031 | 2,000,000 | 1,955,350 | ||||||
|
| |||||||
| 38,147,105 | ||||||||
| Total Asset-Backed(Cost $58,032,128) |
| 57,466,690 | ||||||
| Mortgage-Backed Securities Pass-Throughs 3.7% |
| |||||||
Federal Home Loan Mortgage Corp., 6.0%, 11/1/2021 | 14,595 | 15,810 | ||||||
Federal National Mortgage Association: |
| |||||||
3.5%, with various maturities from 6/1/2048 until 5/1/2049 (e) | 17,393,848 | 17,561,827 | ||||||
4.0%, with various maturities from 12/1/2042 until 5/1/2049 (e) | 9,877,043 | 10,154,157 | ||||||
Government National Mortgage Association, 6.5%, 8/20/2034 | 41,352 | 47,757 | ||||||
| ||||||||
| Total Mortgage-Backed Securities Pass-Throughs(Cost $27,833,207) |
| 27,779,551 | ||||||
| Commercial Mortgage-Backed Securities 1.9% |
| |||||||
BX Commercial Mortgage Trust, “D”, Series2018-IND, 144A,1-monthUSD-LIBOR + 1.300%, 3.773%**, 11/15/2035 | 817,167 | 818,190 | ||||||
Cloverleaf Cold Storage Trust, “B”, Series 2019-CHL2, 144A,1-monthUSD-LIBOR + 1.350%, 3.823%**, 3/15/2036 | 4,500,000 | 4,508,426 | ||||||
DBWF Mortgage Trust, “C”, Series 2018-GLKS, 144A,1-monthUSD-LIBOR + 1.750%, 4.237%**, 11/19/2035 | 1,250,000 | 1,252,392 | ||||||
FHLMC Multifamily Structured Pass-Through Certificates, “X1”, Series K043, Interest Only, 0.668%**, 12/25/2024 | 7,360,037 | 195,685 | ||||||
GMAC Commercial Mortgage Securities, Inc., “G”,Series 2004-C1, 144A, 5.455%, 3/10/2038 | 1,991,994 | 1,869,569 | ||||||
GS Mortgage Securities Corp., “C”, Series 2018-FBLU, 144A,1-monthUSD-LIBOR + 1.600%, 4.073%**, 11/15/2035 | 2,750,000 | 2,744,808 | ||||||
MTRO Commercial Mortgage Trust, “C”, Series 2019-TECH, 144A,1-monthUSD-LIBOR + 1.300%, 3.773%**, 12/15/2033 | 1,255,000 | 1,256,572 | ||||||
NYT Mortgage Trust, “B”, Series2019-NYT, 144A,1-monthUSD-LIBOR + 1.400%, 3.873%**, 11/15/2035 | 2,000,000 | 2,006,268 | ||||||
| ||||||||
| Total Commercial Mortgage-Backed Securities(Cost $14,755,638) |
| 14,651,910 | ||||||
| Collateralized Mortgage Obligations 3.2% |
| |||||||
Connecticut Avenue Securities Trust: |
| |||||||
“1M2”, Series2019-R03, 144A,1-monthUSD-LIBOR + 2.150%, 4.627%**, 9/25/2031 | 980,000 | 991,002 | ||||||
The accompanying notes are an integral part of the financial statements.
| 26 | | | DWS Global Income Builder Fund |
Table of Contents
| Principal Amount ($)(c) | Value ($) | |||||||
“1M2”, Series2019-R02, 144A,1-monthUSD-LIBOR + 2.300%, 4.777%**, 8/25/2031 | 1,563,333 | 1,591,405 | ||||||
Fannie Mae Connecticut Avenue Securities: |
| |||||||
“1M2”, Series2018-C06,1-monthUSD-LIBOR + 2.000%, 4.477%**, 3/25/2031 | 1,041,667 | 1,047,527 | ||||||
“1M2”, Series2018-C03,1-monthUSD-LIBOR + 2.150%, 4.627%**, 10/25/2030 | 1,000,000 | 1,005,050 | ||||||
“1M2”, Series2018-C05,1-monthUSD-LIBOR + 2.350%, 4.827%**, 1/25/2031 | 2,400,000 | 2,430,219 | ||||||
Federal Home Loan Mortgage Corp.: |
| |||||||
“PI”, Series 3940, Interest Only, 4.0%, 2/15/2041 | 237,504 | 31,082 | ||||||
“C31”, Series 303, Interest Only, 4.5%, 12/15/2042 | 4,132,833 | 876,628 | ||||||
“PI”, Series 3843, Interest Only, 4.5%, 5/15/2038 | 936,855 | 45,645 | ||||||
Federal National Mortgage Association: |
| |||||||
“WO”, Series2013-27, Principal Only, Zero Coupon, 12/25/2042 | 1,200,000 | 785,618 | ||||||
“ZL”, Series2017-55, 3.0%, 10/25/2046 | 1,584,702 | 1,454,579 | ||||||
“4”, Series 406, Interest Only, 4.0%, 9/25/2040 | 1,074,191 | 213,884 | ||||||
“I”, Series2003-84, Interest Only, 6.0%, 9/25/2033 | 278,926 | 42,311 | ||||||
Freddie Mac Structured Agency Credit Risk Debt Notes: |
| |||||||
“M2”, Series 2019-DNA1, 144A,1-monthUSD-LIBOR + 2.650%, 5.127%**, 1/25/2049 | 360,000 | 371,036 | ||||||
“M2”, Series 2019-DNA2, 144A,1-monthUSD-LIBOR + 2.450%, 4.927%**, 3/25/2049 | 3,850,000 | 3,910,322 | ||||||
“M2”, Series 2017-DNA3,1-monthUSD-LIBOR + 2.500%, 4.977%**, 3/25/2030 | 1,000,000 | 1,030,792 | ||||||
“M2”, Series 2017-DNA2,1-monthUSD-LIBOR + 3.450%, 5.927%**, 10/25/2029 | 1,500,000 | 1,624,348 | ||||||
Government National Mortgage Association: |
| |||||||
“PI”, Series2015-40, Interest Only, 4.0%, 4/20/2044 | 881,402 | 96,178 | ||||||
“IP”, Series2014-11, Interest Only, 4.5%, 1/20/2043 | 1,090,996 | 135,778 | ||||||
“IP”, Series2014-115, Interest Only, 4.5%, 2/20/2044 | 97,163 | 15,065 | ||||||
“PI”, Series2014-108, Interest Only, 4.5%, 12/20/2039 | 132,874 | 21,656 | ||||||
“IN”, Series2009-69, Interest Only, 5.5%, 8/20/2039 | 651,067 | 119,183 | ||||||
“IV”, Series2009-69, Interest Only, 5.5%, 8/20/2039 | 631,830 | 115,477 | ||||||
“IJ”, Series2009-75, Interest Only, 6.0%, 8/16/2039 | 430,106 | 76,766 | ||||||
New Residential Mortgage Loan, “A1”, Series 2009-NQM2, 144A, 3.6%, 4/25/2049 | 979,952 | 986,681 | ||||||
STACR Trust, “M2”, Series 2018-DNA3, 144A,1-monthUSD-LIBOR + 2.100%, 4.577%**, 9/25/2048 | 1,945,946 | 1,940,180 | ||||||
Verus Securitization Trust, “A1”, Series 2019-INV1, 144A, 3.402%, 12/25/2059 | 3,076,637 | 3,103,067 | ||||||
| ||||||||
| Total Collateralized Mortgage Obligations(Cost $22,816,280) |
| 24,061,479 | ||||||
The accompanying notes are an integral part of the financial statements.
| DWS Global Income Builder Fund | | | 27 |
Table of Contents
| Principal Amount ($)(c) | Value ($) | |||||||
| Government & Agency Obligations 4.9% |
| |||||||
| Other Government Related (f) 0.5% |
| |||||||
Banque Centrale de Tunisie International Bond, 144A, 5.75%, 1/30/2025 (a) | 350,000 | 319,347 | ||||||
Gazprom OAO, 144A, 4.95%, 7/19/2022 | 750,000 | 776,913 | ||||||
Southern Gas Corridor CJSC, 144A, 6.875%, 3/24/2026 | 500,000 | 563,891 | ||||||
Vnesheconombank, 144A, 6.902%, 7/9/2020 | 2,000,000 | 2,060,060 | ||||||
|
|
|
| |||||
| 3,720,211 | ||||||||
| Sovereign Bonds 0.6% |
| |||||||
Islamic Republic of Pakistan, 144A, 6.875%, 12/5/2027 | 450,000 | 445,847 | ||||||
Republic of Angola, 144A, 9.5%, 11/12/2025 | 350,000 | 392,347 | ||||||
Republic of Ecuador, 144A, 8.75%, 6/2/2023 | 400,000 | 424,000 | ||||||
Republic of Hungary, Series 19/A, 6.5%, 6/24/2019 | HUF | 90,600,000 | 316,582 | |||||
Republic of Indonesia, 4.45%, 2/11/2024 | 680,000 | 712,204 | ||||||
Republic of Namibia, 144A, 5.25%, 10/29/2025 | 500,000 | 484,700 | ||||||
Republic of Senegal, 144A, 6.25%, 7/30/2024 (a) | 600,000 | 626,280 | ||||||
State of Qatar, 144A, 3.25%, 6/2/2026 | 1,200,000 | 1,195,819 | ||||||
|
|
|
| |||||
| 4,597,779 | ||||||||
| U.S. Treasury Obligations 3.8% |
| |||||||
U.S. Treasury Bonds, 3.0%, 2/15/2048 | 75,000 | 75,844 | ||||||
U.S. Treasury Inflation Indexed Note, 0.625%, 4/15/2023 | 7,631,325 | 7,691,699 | ||||||
U.S. Treasury Notes: |
| |||||||
1.625%, 8/31/2022 | 1,000,000 | 979,922 | ||||||
2.375%, 5/15/2027 | 30,000 | 29,843 | ||||||
2.625%, 2/15/2029 | 20,000,000 | 20,203,906 | ||||||
|
| |||||||
| 28,981,214 | ||||||||
| Total Government & Agency Obligations(Cost $36,964,497) |
| 37,299,204 | ||||||
| Convertible Bond 0.1% |
| |||||||
| Materials |
| |||||||
GEO Specialty Chemicals, Inc.,3-monthUSD-LIBOR + 14.0%, 16.615%** PIK, 10/18/2025 (b) (Cost $797,609) | 792,801 | 851,865 | ||||||
| Loan Participations and Assignments 1.1% |
| |||||||
| Senior Loans** |
| |||||||
Berry Global, Inc., Term Loan S,1-month USD LIBOR + 1.750%, 4.231%, 2/8/2020 | 984 | 985 | ||||||
DaVita, Inc., Term Loan B,1-month USD LIBOR + 2.750%, 5.233%, 6/24/2021 | 2,271,411 | 2,279,077 | ||||||
The accompanying notes are an integral part of the financial statements.
| 28 | | | DWS Global Income Builder Fund |
Table of Contents
| Principal Amount ($)(c) | Value ($) | |||||||
Hilton Worldwide Finance LLC, Term Loan B2,1-month USD LIBOR + 1.750%, 4.227%, 10/25/2023 | 1,389,236 | 1,395,244 | ||||||
NRG Energy, Inc., Term Loan B,1-month USD LIBOR + 1.750%, 4.233%, 6/30/2023 | 1,080,389 | 1,081,291 | ||||||
Outfront Media Capital LLC, Term Loan B,1-month USD LIBOR + 2.000%, 4.479%, 3/18/2024 | 1,237,500 | 1,240,210 | ||||||
SBA Senior Finance II LLC, Term Loan B,1-month USD LIBOR + 2.000%, 4.49%, 4/11/2025 | 707,392 | 704,297 | ||||||
TransDigm, Inc., Term Loan F,1-month USD LIBOR + 2.500%, 4.983%, 6/9/2023 | 1,274,518 | 1,272,129 | ||||||
| Total Loan Participations and Assignments(Cost $7,965,097) |
| 7,973,233 | ||||||
| Shares | Value ($) | |||||||
| Commercial Paper 0.7% |
| |||||||
Crown Castle (Cost $4,994,303) | 5,000,000 | 4,993,896 | ||||||
| Exchange-Traded Funds 2.7% |
| |||||||
SPDR Bloomberg Barclays Convertible Securities ETF | 377,000 | 20,169,500 | ||||||
| Principal Amount ($)(c) | Value ($) | |||||||
| Short-Term U.S. Treasury Obligations 2.2% |
| |||||||
U.S. Treasury Bills: |
| |||||||
2.362%***, 8/15/2019 (g) | 8,300,000 | 8,241,774 | ||||||
2.573%***, 10/10/2019 (h) | 8,297,000 | 8,208,326 | ||||||
| ||||||||
| Total Short-Term U.S. Treasury Obligations(Cost $16,443,209) |
| 16,450,100 | ||||||
| Shares | Value ($) | |||||||
| Securities Lending Collateral 1.0% |
| |||||||
DWS Government & Agency Securities Portfolio “DWS Government Cash Institutional Shares”, 2.35% (i) (j) (Cost $7,690,348) | 7,690,348 | 7,690,348 | ||||||
The accompanying notes are an integral part of the financial statements.
| DWS Global Income Builder Fund | | | 29 |
Table of Contents
| Shares | Value ($) | |||||||
| Cash Equivalents 4.2% |
| |||||||
DWS Central Cash Management Government Fund, 2.46% (i) (Cost $31,352,237) | 31,352,237 | 31,352,237 | ||||||
| % of Net Assets | Value ($) | |||||||
| Total Investment Portfolio(Cost $725,026,296) | 102.8 | 773,833,064 | ||||||
| Other Assets and Liabilities, Net | (2.8 | ) | (21,061,976 | ) | ||||
| ||||||||
| Net Assets | 100.0 | 752,771,088 | ||||||
A summary of the Fund’s transactions with affiliated investments during the period ended April 30, 2019 are as follows:
| Value ($) at 10/31/2018 | Pur- chases Cost ($) | Sales Proceeds ($) | Net Real- ized Gain/ (Loss) ($) | Net Change in Unreal- ized Appreci- ation (Depreci- ation) ($) | Income ($) | Capital Gain Distri- butions ($) | Number of Shares at 4/30/2019 | Value ($) at 4/30/2019 | ||||||||||||||||||||||||||
| Securities Lending Collateral 1.0% | ||||||||||||||||||||||||||||||||||
| | DWS Government & Agency Securities Portfolio “DWS Government Cash Institutional Shares”, 2.35% (i) (j) | | ||||||||||||||||||||||||||||||||
| 16,553,728 | — | 8,863,380 | (k) | — | — | 103,019 | — | 7,690,348 | 7,690,348 | |||||||||||||||||||||||||
| Cash Equivalents 4.2% | ||||||||||||||||||||||||||||||||||
| DWS Central Cash Management Government Fund, 2.46% (i) | ||||||||||||||||||||||||||||||||||
| 32,523,513 | 179,056,531 | 180,227,807 | — | — | 250,988 | — | 31,352,237 | 31,352,237 | ||||||||||||||||||||||||||
| 49,077,241 | 179,056,531 | 189,091,187 | — | — | 354,007 | — | 39,042,585 | 39,042,585 | ||||||||||||||||||||||||||
| * | Non-income producing security. |
| ** | Variable or floating rate security. These securities are shown at their current rate as of April 30, 2019. For securities based on a published reference rate and spread, the reference rate and spread are indicated within the description above. Certain variable rate securities are not based on a published reference rate and spread but adjust periodically based on current market conditions, prepayment of underlying positions and/or other variables. |
| *** | Annualized yield at time of purchase; not a coupon rate. |
| (a) | All or a portion of these securities were on loan. In addition, “Other Assets and Liabilities, Net” may include pending sales that are also on loan. The value of securities loaned at April 30, 2019 amounted to $7,433,165, which is 1.0% of net assets. |
| (b) | Investment was valued using significant unobservable inputs. |
| (c) | Principal amount stated in U.S. dollars unless otherwise noted. |
| (d) | Perpetual, callable security with no stated maturity date. |
| (e) | When-issued, delayed delivery or forward commitment securities included. |
| (f) | Government-backed debt issued by financial companies or government sponsored enterprises. |
| (g) | At April 30, 2019, this security has been pledged, in whole or in part, to cover initial margin requirements for open futures contracts. |
The accompanying notes are an integral part of the financial statements.
| 30 | | | DWS Global Income Builder Fund |
Table of Contents
| (h) | At April 30, 2019, this security has been pledged, in whole or in part, to cover initial margin requirements for open centrally cleared swap contracts. |
| (i) | Affiliated fund managed by DWS Investment Management Americas, Inc. The rate shown is the annualizedseven-day yield at period end. |
| (j) | Represents collateral held in connection with securities lending. Income earned by the Fund is net of borrower rebates. |
| (k) | Represents the net increase (purchase cost) or decrease (sales proceeds) in the amount invested for the period ended April 30, 2019. |
144A: Security exempt from registration under Rule 144A of the Securities Act of 1933. These securities may be resold in transactions exempt from registration, normally to qualified institutional buyers.
ADR: American Depositary Receipt
ASX: Australian Securities Exchange
CJSC: Closed Joint Stock Company
CLO: Collateralized Loan Obligation
GDR: Global Depositary Receipt
Interest Only: Interest Only (IO) bonds represent the “interest only” portion of payments on a pool of underlying mortgages or mortgage-backed securities. IO securities are subject to prepayment risk of the pool of underlying mortgages.
JSC: Joint Stock Company
LIBOR: London Interbank Offered Rate
MSCI: Morgan Stanley Capital International
PIK: Denotes that all or a portion of the income is paidin-kind in the form of additional principal.
PJSC: Public Joint Stock Company
Principal Only: Principal Only (PO) bonds represent the “principal only” portion of payments on a pool of underlying mortgages or mortgage-backed securities.
REG S: Securities sold under Regulation S may not be offered, sold or delivered within the United States or to, or for the account or benefit of, U.S. persons, except pursuant to an exemption from, or in a transaction not subject to, the registration requirements of the Securities Act of 1933.
REIT: Real Estate Investment Trust
SPDR: Standard & Poor’s Depositary Receipt
Included in the portfolio are investments in mortgage or asset-backed securities which are interests in separate pools of mortgages or assets. Effective maturities of these investments may be shorter than stated maturities due to prepayments. Some separate investments in the Federal National Mortgage Association issues which have similar coupon rates have been aggregated for presentation purposes in this investment portfolio.
The accompanying notes are an integral part of the financial statements.
| DWS Global Income Builder Fund | | | 31 |
Table of Contents
At April 30, 2019, open futures contracts purchased were as follows:
| Futures | Currency | Expiration Date | Contracts | Notional Amount ($) | Notional Value ($) | Unrealized Appreciation (Depreciation) ($) | ||||||||||||||||||
| 10 Year U.S. Treasury Note | USD | 6/19/2019 | 329 | 40,397,805 | 40,688,049 | 290,244 | ||||||||||||||||||
| 2 Year U.S. Treasury Note | USD | 6/28/2019 | 235 | 49,852,950 | 50,056,836 | 203,886 | ||||||||||||||||||
| 3 Month Euro Euribor Interest Rate | EUR | 3/16/2020 | 11 | 3,091,066 | 3,093,501 | 2,435 | ||||||||||||||||||
| 3 Month Euro Swiss Franc (Euroswiss) Interest Rate | CHF | 3/16/2020 | 12 | 2,963,368 | 2,965,700 | 2,332 | ||||||||||||||||||
| 3 Month Euroyen Futures | JPY | 3/16/2020 | 14 | 3,141,393 | 3,141,030 | (363 | ) | |||||||||||||||||
| 3 Month Sterling (Short Sterling) Interest Rate | GBP | 3/18/2020 | 19 | 3,064,360 | 3,067,115 | 2,755 | ||||||||||||||||||
| 90 Day Eurodollar Time Deposit | USD | 3/16/2020 | 13 | 3,166,027 | 3,174,275 | 8,248 | ||||||||||||||||||
| ASX 90 Day Bank Accepted Bills | AUD | 3/12/2020 | 18 | 12,636,124 | 12,648,558 | 12,434 | ||||||||||||||||||
| MSCI Mini Emerging Market Index | USD | 6/21/2019 | 425 | 22,224,156 | 22,954,250 | 730,094 | ||||||||||||||||||
| S&P 500E-Mini Index | USD | 6/21/2019 | 50 | 6,880,129 | 7,371,250 | 491,121 | ||||||||||||||||||
| TOPIX Index | JPY | 6/13/2019 | 1 | 143,817 | 144,980 | 1,163 | ||||||||||||||||||
| Ultra 10 Year U.S. Treasury Note | USD | 6/19/2019 | 113 | 14,630,346 | 14,891,281 | 260,935 | ||||||||||||||||||
| Ultra Long U.S. Treasury Bond | USD | 6/19/2019 | 135 | 22,131,923 | 22,177,969 | 46,046 | ||||||||||||||||||
| Total net unrealized appreciation |
| 2,051,330 | ||||||||||||||||||||||
The accompanying notes are an integral part of the financial statements.
| 32 | | | DWS Global Income Builder Fund |
Table of Contents
At April 30, 2019, open futures contracts sold were as follows:
| Futures | Currency | Expiration Date | Contracts | Notional Amount ($) | Notional Value ($) | Unrealized Depreciation ($) | ||||||||||||||||||
| Euro Stoxx 50 Index | EUR | 6/21/2019 | 184 | 6,654,113 | 7,124,048 | (469,935 | ) | |||||||||||||||||
| Euro-Schatz | EUR | 6/6/2019 | 413 | 51,782,812 | 51,843,698 | (60,886 | ) | |||||||||||||||||
| U.S. Treasury Long Bond | USD | 6/19/2019 | 30 | 4,352,733 | 4,424,063 | (71,330 | ) | |||||||||||||||||
| Total unrealized depreciation |
| (602,151 | ) | |||||||||||||||||||||
At April 30, 2019, open credit default swap contracts purchased were as follows:
Centrally Cleared Swaps
| ||||||||||||||||||||||||
| Underlying Reference Obligation | Fixed Cash Flows Paid/ Frequency | Expiration Date | Notional Amount ($) | Currency | Value ($) | Upfront Payments Paid ($) | Unrealized Depreciation ($) | |||||||||||||||||
| Markit CDX North America Investment Grade Index | 1.0%/ Quarterly | 6/20/2023 | 18,000,000 | USD | (409,711 | ) | (268,591 | ) | (141,120 | ) | ||||||||||||||
At April 30, 2019, open interest rate swap contracts were as follows:
Centrally Cleared Swaps
| ||||||||||||||||||||||||||
| Cash Flows Paid by the Fund/ Frequency | Cash Flows Received by the Fund/ Frequency | Effective/ Expiration Date | Notional Amount ($) | Currency | Value ($) | Upfront Payments Paid/ (Received) ($) | Unrealized Depreciation ($) | |||||||||||||||||||
| Fixed — 2.636%Semi-Annually | Floating —3-Month LIBOR Quarterly | | 1/21/2020 1/21/2025 | | 10,900,000 | USD | (166,720 | ) | — | (166,720 | ) | |||||||||||||||
| Fixed — 2.729%Semi-Annually | Floating —3-Month LIBOR Quarterly | | 3/4/2019 3/5/2029 | | 2,200,000 | USD | (47,679 | ) | — | (47,679 | ) | |||||||||||||||
Total unrealized depreciation |
| (214,399 | ) | |||||||||||||||||||||||
LIBOR: London Interbank Offered Rate;3-month LIBOR rate as of April 30, 2019 is 2.576%.
At April 30, 2019, the Fund had the following open forward foreign currency contracts:
| Contracts to Deliver | In Exchange For | Settlement Date | Unrealized Appreciation ($) | Counterparty | ||||||||||||||||
| EUR | 4,875,496 | USD | 5,597,089 | 5/31/2019 | 115,471 | JPMorgan Chase Securities, Inc. | ||||||||||||||
| EUR | 25,646,000 | USD | 29,182,353 | 6/25/2019 | 285,148 | Bank of America | ||||||||||||||
| EUR | 6,000,000 | USD | 6,825,654 | 6/26/2019 | 64,429 | Credit Agricole | ||||||||||||||
| Total unrealized appreciation | 465,048 | |||||||||||||||||||
The accompanying notes are an integral part of the financial statements.
| DWS Global Income Builder Fund | | | 33 |
Table of Contents
| Contracts to Deliver | In Exchange For | Settlement Date | Unrealized Depreciation ($) | Counterparty | ||||||||||||||||
| EUR | 6,000,000 | JPY | 749,559,000 | 5/8/2019 | (370 | ) | Credit Agricole | |||||||||||||
| Currency Abbreviations | ||||
| AUD Australian Dollar | HUF Hungarian Forint | |||
| CHF Swiss Franc | JPY Japanese Yen | |||
| EUR Euro | USD United States Dollar | |||
| GBP British Pound | ||||
For information on the Fund’s policy and additional disclosures regarding futures contracts, credit default swap contracts, interest rate swap contracts and forward foreign currency contracts, please refer to the Derivatives section of Note A in the accompanying Notes to Financial Statements.
Fair Value Measurements
Various inputs are used in determining the value of the Fund’s investments. These inputs are summarized in three broad levels. Level 1 includes quoted prices in active markets for identical securities. Level 2 includes other significant observable inputs (including quoted prices for similar securities, interest rates, prepayment speeds and credit risk). Level 3 includes significant unobservable inputs (including the Fund’s own assumptions in determining the fair value of investments). The level assigned to the securities valuations may not be an indication of the risk or liquidity associated with investing in those securities.
The following is a summary of the inputs used as of April 30, 2019 in valuing the Fund’s investments. For information on the Fund’s policy regarding the valuation of investments, please refer to the Security Valuation section of Note A in the accompanying Notes to Financial Statements.
| Assets | Level 1 | Level 2 | Level 3 | Total | ||||||||||||
| Common Stocks | ||||||||||||||||
Communication Services | $ | 30,864,752 | $ | 14,457,373 | $ | — | $ | 45,322,125 | ||||||||
Consumer Discretionary | 33,120,122 | 16,964,690 | — | 50,084,812 | ||||||||||||
Consumer Staples | 23,052,279 | 8,702,769 | — | 31,755,048 | ||||||||||||
Energy | 20,446,805 | 11,668,824 | — | 32,115,629 | ||||||||||||
Financials | 30,087,250 | 29,479,368 | — | 59,566,618 | ||||||||||||
Health Care | 24,551,042 | 12,656,877 | — | 37,207,919 | ||||||||||||
Industrials | 24,919,076 | 20,963,614 | — | 45,882,690 | ||||||||||||
Information Technology | 70,100,317 | 5,778,056 | — | 75,878,373 | ||||||||||||
Materials | 3,534,356 | 3,530,040 | 119,210 | 7,183,606 | ||||||||||||
Real Estate | 16,966,646 | 1,729,068 | — | 18,695,714 | ||||||||||||
Utilities | 18,212,515 | 3,485,986 | — | 21,698,501 | ||||||||||||
The accompanying notes are an integral part of the financial statements.
| 34 | | | DWS Global Income Builder Fund |
Table of Contents
| Assets | Level 1 | Level 2 | Level 3 | Total | ||||||||||||
| Preferred Stocks (l) | $ | 39,122,173 | $ | — | $ | — | $ | 39,122,173 | ||||||||
| Warrants | — | — | 18,540 | 18,540 | ||||||||||||
| Fixed Income Investments (l) | ||||||||||||||||
Corporate Bonds | — | 58,561,303 | — | 58,561,303 | ||||||||||||
Asset-Backed | — | 57,466,690 | — | 57,466,690 | ||||||||||||
Mortgage-Backed Securities Pass-Throughs | — | 27,779,551 | — | 27,779,551 | ||||||||||||
Commercial Mortgage-Backed Securities | — | 14,651,910 | — | 14,651,910 | ||||||||||||
Collateralized Mortgage Obligations | — | 24,061,479 | — | 24,061,479 | ||||||||||||
Government & Agency Obligations | — | 37,299,204 | — | 37,299,204 | ||||||||||||
Convertible Bonds | — | — | 851,865 | 851,865 | ||||||||||||
Loan Participations and Assignments | — | 7,973,233 | — | 7,973,233 | ||||||||||||
Commercial Paper | — | 4,993,896 | — | 4,993,896 | ||||||||||||
Short-Term U.S. Treasury Obligations | — | 16,450,100 | — | 16,450,100 | ||||||||||||
| Exchange-Traded Funds | 20,169,500 | — | — | 20,169,500 | ||||||||||||
| Short-Term Investments (l) | 39,042,585 | — | — | 39,042,585 | ||||||||||||
| Derivatives (m) | ||||||||||||||||
Futures Contracts | 2,051,693 | — | — | 2,051,693 | ||||||||||||
Forward Foreign Currency Contracts | — | 465,048 | — | 465,048 | ||||||||||||
| Total | $ | 396,241,111 | $ | 379,119,079 | $ | 989,615 | $ | 776,349,805 | ||||||||
| Liabilities | Level 1 | Level 2 | Level 3 | Total | ||||||||||||
| Derivatives (m) | ||||||||||||||||
Futures Contracts | $ | (602,514 | ) | $ | — | $ | — | $ | (602,514 | ) | ||||||
Credit Default Swap Contracts | — | (141,120 | ) | — | (141,120 | ) | ||||||||||
Interest Rate Swap Contracts | — | (214,399 | ) | — | (214,399 | ) | ||||||||||
Forward Foreign Currency Contracts | — | (370 | ) | — | (370 | ) | ||||||||||
| Total | $ | (602,514 | ) | $ | (355,889 | ) | $ | — | $ | (958,403 | ) | |||||
| (l) | See Investment Portfolio for additional detailed categorizations. |
| (m) | Derivatives include unrealized appreciation (depreciation) on open futures contracts, credit default swap contracts, interest rate swap contracts, forward foreign currency contracts. |
The accompanying notes are an integral part of the financial statements.
| DWS Global Income Builder Fund | | | 35 |
Table of Contents
Statement of Assets and Liabilities
| as of April 30, 2019 (Unaudited) | ||||
| Assets | ||||
Investments innon-affiliated securities, at value (cost $685,983,711) — including $7,433,165 of securities loaned | $ | 734,790,479 | ||
| Investment in DWS Government & Agency Securities Portfolio (cost $7,690,348)* | 7,690,348 | |||
| Investment in DWS Central Cash Management Government Fund (cost $31,352,237) | 31,352,237 | |||
| Cash | 1,322,904 | |||
| Foreign currency, at value (cost $343,014) | 322,639 | |||
| Receivable for investments sold | 12,351 | |||
| Receivable for Fund shares sold | 21,819 | |||
| Dividends receivable | 1,382,910 | |||
| Interest receivable | 1,394,133 | |||
| Receivable for variation margin on futures contracts | 171,174 | |||
| Unrealized appreciation on forward foreign currency contracts | 465,048 | |||
| Foreign taxes recoverable | 321,085 | |||
| Other assets | 58,354 | |||
| Total assets | 779,305,481 | |||
| Liabilities | ||||
| Payable upon return of securities loaned | 7,690,348 | |||
| Payable for investments purchased — when-issued/delayed delivery securities | 15,809,899 | |||
| Payable for Fund shares redeemed | 2,153,670 | |||
| Payable for variation margin on centrally cleared swaps | 6,142 | |||
| Unrealized depreciation on forward foreign currency contracts | 370 | |||
| Accrued management fee | 228,864 | |||
| Accrued Trustees’ fees | 9,128 | |||
| Other accrued expenses and payables | 635,972 | |||
| Total liabilities | 26,534,393 | |||
| Net assets, at value | $ | 752,771,088 | ||
| * | Represents collateral on securities loaned. |
The accompanying notes are an integral part of the financial statements.
| 36 | | | DWS Global Income Builder Fund |
Table of Contents
| Statement of Assets and Liabilitiesas of April 30, 2019 (Unaudited) (continued) |
| Net Assets Consist of | ||||
| Distributable earnings (loss) | $ | 47,649,073 | ||
| Paid-in capital | 705,122,015 | |||
| Net assets, at value | $ | 752,771,088 | ||
| Net Asset Value | ||||
Class A | ||||
| Net Asset Value and redemption price per share ($543,490,161 ÷ 58,095,320 outstanding shares of beneficial interest, no par value, unlimited number of shares authorized) | $ | 9.36 | ||
| Maximum offering price per share (100 ÷ 94.25 of $9.36) | $ | 9.93 | ||
Class C | ||||
| Net Asset Value, offering and redemption price (subject to contingent deferred sales charge) per share ($10,227,913 ÷ 1,094,206 outstanding shares of beneficial interest, no par value, unlimited number of shares authorized) | $ | 9.35 | ||
Class R6 | ||||
| Net Asset Value, offering and redemption price per share ($5,730,626 ÷ 613,572 outstanding shares of beneficial interest, no par value, unlimited number of shares authorized) | $ | 9.34 | ||
Class S | ||||
| Net Asset Value, offering and redemption price per share ($185,870,968 ÷ 19,867,705 outstanding shares of beneficial interest, no par value, unlimited number of shares authorized) | $ | 9.36 | ||
Institutional Class | ||||
| Net Asset Value, offering and redemption price per share ($7,451,420 ÷ 797,705 outstanding shares of beneficial interest, no par value, unlimited number of shares authorized) | $ | 9.34 | ||
The accompanying notes are an integral part of the financial statements.
| DWS Global Income Builder Fund | | | 37 |
Table of Contents
| for the six months ended April 30, 2019 (Unaudited) |
| |||
| Investment Income | ||||
| Income: | ||||
| Dividends (net of foreign taxes withheld of $378,285) | $ | 9,112,784 | ||
| Interest | 6,113,711 | |||
| Income distributions — DWS Central Cash Management Government Fund | 250,988 | |||
| Securities lending income, net of borrower rebates | 103,019 | |||
| Total income | 15,580,502 | |||
| Expenses: | ||||
| Management fee | 1,343,263 | |||
| Administration fee | 363,044 | |||
| Services to shareholders | 501,985 | |||
| Distribution and service fees | 656,486 | |||
| Custodian fee | 36,365 | |||
| Professional fees | 62,391 | |||
| Reports to shareholders | 55,050 | |||
| Registration fees | 33,275 | |||
| Trustees’ fees and expenses | 18,074 | |||
| Other | 54,085 | |||
| Total expenses | 3,124,018 | |||
| Net investment income | 12,456,484 | |||
The accompanying notes are an integral part of the financial statements.
| 38 | | | DWS Global Income Builder Fund |
Table of Contents
| Statement of Operationsfor the six months ended April 30, 2019 (Unaudited) (continued) |
| Realized and Unrealized Gain (Loss) | ||||
| Net realized gain (loss) from: | ||||
| Investments | $ | (12,433,284 | ) | |
| Swap contracts | 1,278,808 | |||
| Futures | (4,483,914 | ) | ||
| Forward foreign currency contracts | (1,112,779 | ) | ||
| Foreign currency | 179,040 | |||
| (16,572,129 | ) | |||
| Change in net unrealized appreciation (depreciation) on: | ||||
| Investments | 51,480,102 | |||
| Swap contracts | (317,592 | ) | ||
| Futures | 6,013,028 | |||
| Forward foreign currency contracts | 503,733 | |||
| Foreign currency | (16,771 | ) | ||
| 57,662,500 | ||||
| Net gain (loss) | 41,090,371 | |||
| Net increase (decrease) in net assets resulting from operations | $ | 53,546,855 | ||
The accompanying notes are an integral part of the financial statements.
| DWS Global Income Builder Fund | | | 39 |
Table of Contents
Statements of Changes in Net Assets
| Increase (Decrease) in Net Assets | Six Months Ended April 30, 2019 (Unaudited) | Year Ended 2018 | ||||||
| Operations: | ||||||||
| Net investment income (loss) | $ | 12,456,484 | $ | 23,687,092 | ||||
| Net realized gain (loss) | (16,572,129 | ) | 17,417,628 | |||||
| Change in net unrealized appreciation (depreciation) | 57,662,500 | (47,815,715 | ) | |||||
| Net increase (decrease) in net assets resulting from operations | 53,546,855 | (6,710,995 | ) | |||||
| Distributions to shareholders : | ||||||||
Class A | (15,468,771 | ) | (59,770,503 | ) | ||||
Class C | (253,303 | ) | (1,802,962 | ) | ||||
Class R6 | (64,452 | ) | (292,492 | ) | ||||
Class S | (5,451,156 | ) | (19,898,219 | ) | ||||
Institutional Class | (321,913 | ) | (1,111,125 | ) | ||||
| Total distributions | (21,559,595 | ) | (82,875,301 | ) | ||||
| Fund share transactions: | ||||||||
| Proceeds from shares sold | 17,360,199 | 43,798,469 | ||||||
| Reinvestment of distributions | 20,697,456 | 79,673,426 | ||||||
| Payments for shares redeemed | (56,383,448 | ) | (125,907,591 | ) | ||||
| Net increase (decrease) in net assets from Fund share transactions | (18,325,793 | ) | (2,435,696 | ) | ||||
| Increase (decrease) in net assets | 13,661,467 | (92,021,992 | ) | |||||
| Net assets at beginning of period | 739,109,621 | 831,131,613 | ||||||
| Net assets at end of period | $ | 752,771,088 | $ | 739,109,621 | ||||
The accompanying notes are an integral part of the financial statements.
| 40 | | | DWS Global Income Builder Fund |
Table of Contents
| Six Months Ended 4/30/19 | Years Ended October 31, | |||||||||||||||||||||||||
| Class A | (Unaudited) | 2018 | 2017 | 2016 | 2015 | 2014 | ||||||||||||||||||||
| Selected Per Share Data |
| |||||||||||||||||||||||||
| Net asset value, beginning of period | $ | 8.97 | $ | 10.06 | $ | 8.89 | $ | 8.91 | $ | 10.36 | $ | 10.31 | ||||||||||||||
| Income (loss) from investment operations: | ||||||||||||||||||||||||||
Net investment incomea | .15 | .28 | .26 | .21 | .29 | .32 | ||||||||||||||||||||
Net realized and unrealized gain (loss) | .51 | (.36 | ) | 1.18 | .03 | (.64 | ) | .23 | ||||||||||||||||||
Total from investment operations | .66 | (.08 | ) | 1.44 | .24 | (.35 | ) | .55 | ||||||||||||||||||
| Less distributions from: | ||||||||||||||||||||||||||
Net investment income | (.20 | ) | (.34 | ) | (.27 | ) | (.26 | ) | (.37 | ) | (.34 | ) | ||||||||||||||
Net realized gains | (.07 | ) | (.67 | ) | — | — | (.73 | ) | (.16 | ) | ||||||||||||||||
Total distributions | (.27 | ) | (1.01 | ) | (.27 | ) | (.26 | ) | (1.10 | ) | (.50 | ) | ||||||||||||||
| Net asset value, end of period | $ | 9.36 | $ | 8.97 | $ | 10.06 | $ | 8.89 | $ | 8.91 | $ | 10.36 | ||||||||||||||
| Total Return (%)b | 7.54 | ** | (1.11 | ) | 16.39 | 2.82 | (3.32 | ) | 5.49 | |||||||||||||||||
| Ratios to Average Net Assets and Supplemental Data |
| |||||||||||||||||||||||||
| Net assets, end of period ($ millions) | 543 | 534 | 603 | 582 | 639 | 751 | ||||||||||||||||||||
| Ratio of expenses (%) | .90 | * | .90 | .91 | .92 | .91 | .90 | |||||||||||||||||||
| Ratio of net investment income (%) | 3.39 | * | 2.93 | 2.71 | 2.39 | 3.09 | 3.10 | |||||||||||||||||||
| Portfolio turnover rate (%) | 58 | ** | 67 | 137 | 123 | 115 | 100 | |||||||||||||||||||
| a | Based on average shares outstanding during the period. |
| b | Total return does not reflect the effect of any sales charges. |
| * | Annualized |
| ** | Not annualized |
The accompanying notes are an integral part of the financial statements.
| DWS Global Income Builder Fund | | | 41 |
Table of Contents
| Six Months Ended 4/30/19 | Years Ended October 31, | |||||||||||||||||||||||||
| Class C | (Unaudited) | 2018 | 2017 | 2016 | 2015 | 2014 | ||||||||||||||||||||
| Selected Per Share Data |
| |||||||||||||||||||||||||
| Net asset value, beginning of period | $ | 8.96 | $ | 10.05 | $ | 8.88 | $ | 8.90 | $ | 10.35 | $ | 10.29 | ||||||||||||||
| Income (loss) from investment operations: | ||||||||||||||||||||||||||
Net investment incomea | .11 | .21 | .18 | .14 | .22 | .24 | ||||||||||||||||||||
Net realized and unrealized gain (loss) | .51 | (.37 | ) | 1.18 | .03 | (.64 | ) | .24 | ||||||||||||||||||
Total from investment operations | .62 | (.16 | ) | 1.36 | .17 | (.42 | ) | .48 | ||||||||||||||||||
| Less distributions from: |
| |||||||||||||||||||||||||
Net investment income | (.16 | ) | (.26 | ) | (.19 | ) | (.19 | ) | (.30 | ) | (.26 | ) | ||||||||||||||
Net realized gains | (.07 | ) | (.67 | ) | — | — | (.73 | ) | (.16 | ) | ||||||||||||||||
Total distributions | (.23 | ) | (.93 | ) | (.19 | ) | (.19 | ) | (1.03 | ) | (.42 | ) | ||||||||||||||
| Net asset value, end of period | $ | 9.35 | $ | 8.96 | $ | 10.05 | $ | 8.88 | $ | 8.90 | $ | 10.35 | ||||||||||||||
| Total Return (%)b | 7.01 | ** | (1.91 | ) | 15.47 | c | 2.00 | (3.99 | ) | 4.74 | ||||||||||||||||
| Ratios to Average Net Assets and Supplemental Data |
| |||||||||||||||||||||||||
| Net assets, end of period ($ millions) | 10 | 10 | 20 | 20 | 22 | 27 | ||||||||||||||||||||
| Ratio of expenses before expense reductions (%) | 1.73 | * | 1.65 | 1.74 | 1.72 | 1.70 | 1.69 | |||||||||||||||||||
| Ratio of expenses after expense reductions (%) | 1.73 | * | 1.65 | 1.72 | 1.72 | 1.70 | 1.69 | |||||||||||||||||||
| Ratio of net investment income (%) | 2.57 | * | 2.18 | 1.90 | 1.59 | 2.30 | 2.31 | |||||||||||||||||||
| Portfolio turnover rate (%) | 58 | ** | 67 | 137 | 123 | 115 | 100 | |||||||||||||||||||
| a | Based on average shares outstanding during the period. |
| b | Total return does not reflect the effect of any sales charges. |
| c | Total return would have been lower had certain expenses not been reduced. |
| * | Annualized |
| ** | Not annualized |
The accompanying notes are an integral part of the financial statements.
| 42 | | | DWS Global Income Builder Fund |
Table of Contents
| Six Months Ended 4/30/19 | Years Ended October 31, | Period Ended | ||||||||||||||||||||||||
| Class R6 | (Unaudited) | 2018 | 2017 | 2016 | 2015 | 10/31/14a | ||||||||||||||||||||
| Selected Per Share Data |
| |||||||||||||||||||||||||
| Net asset value, beginning of period | $ | 8.95 | $ | 10.04 | $ | 8.87 | $ | 8.88 | $ | 10.35 | $ | 10.70 | ||||||||||||||
| Income (loss) from investment operations: | ||||||||||||||||||||||||||
Net investment incomeb | .15 | .31 | .32 | .22 | .29 | .05 | ||||||||||||||||||||
Net realized and unrealized gain (loss) | .52 | (.36 | ) | 1.14 | .04 | (.63 | ) | (.29 | ) | |||||||||||||||||
Total from investment operations | .67 | (.05 | ) | 1.46 | .26 | (.34 | ) | (.24 | ) | |||||||||||||||||
| Less distributions from: | ||||||||||||||||||||||||||
Net investment income | (.21 | ) | (.37 | ) | (.29 | ) | (.27 | ) | (.40 | ) | (.11 | ) | ||||||||||||||
Net realized gains | (.07 | ) | (.67 | ) | — | — | (.73 | ) | — | |||||||||||||||||
Total distributions | (.28 | ) | (1.04 | ) | (.29 | ) | (.27 | ) | (1.13 | ) | (.11 | ) | ||||||||||||||
| Net asset value, end of period | $ | 9.34 | $ | 8.95 | $ | 10.04 | $ | 8.87 | $8.88 | $ | 10.35 | |||||||||||||||
| Total Return (%) | 7.61 | ** | (.78 | ) | 16.74 | 3.08 | (3.15 | ) | (2.26 | )** | ||||||||||||||||
| Ratios to Average Net Assets and Supplemental Data |
| |||||||||||||||||||||||||
| Net assets, end of period ($ millions) | 6 | 1 | 4 | .05 | .01 | .01 | ||||||||||||||||||||
| Ratio of expenses (%) | .57 | * | .56 | .57 | .67 | .83 | .56 | * | ||||||||||||||||||
| Ratio of net investment income (%) | 3.44 | * | 3.19 | 3.28 | 2.58 | 3.15 | 2.83 | * | ||||||||||||||||||
| Portfolio turnover rate (%) | 58 | ** | 67 | 137 | 123 | 115 | 100 | c | ||||||||||||||||||
| a | For the period from August 25, 2014 (commencement of operations) to October 31, 2014. |
| b | Based on average shares outstanding during the period. |
| c | Represents the Fund’s portfolio turnover rate for the year ended October 31, 2014. |
| * | Annualized |
| ** | Not annualized |
The accompanying notes are an integral part of the financial statements.
| DWS Global Income Builder Fund | | | 43 |
Table of Contents
| Six Months Ended 4/30/19 | Years Ended October 31, | |||||||||||||||||||||||||
| Class S | (Unaudited) | 2018 | 2017 | 2016 | 2015 | 2014 | ||||||||||||||||||||
| Selected Per Share Data | ||||||||||||||||||||||||||
| Net asset value, beginning of period | $ | 8.97 | $ | 10.06 | $ | 8.89 | $ | 8.91 | $ | 10.36 | $ | 10.31 | ||||||||||||||
| Income (loss) from investment operations: | ||||||||||||||||||||||||||
Net investment incomea | .16 | .30 | .28 | .23 | .31 | .34 | ||||||||||||||||||||
Net realized and unrealized gain (loss) | .51 | (.36 | ) | 1.18 | .03 | (.64 | ) | .23 | ||||||||||||||||||
Total from investment operations | .67 | (.06 | ) | 1.46 | .26 | (.33 | ) | .57 | ||||||||||||||||||
| Less distributions from: |
| |||||||||||||||||||||||||
Net investment income | (.21 | ) | (.36 | ) | (.29 | ) | (.28 | ) | (.39 | ) | (.36 | ) | ||||||||||||||
Net realized gains | (.07 | ) | (.67 | ) | — | — | (.73 | ) | (.16 | ) | ||||||||||||||||
Total distributions | (.28 | ) | (1.03 | ) | (.29 | ) | (.28 | ) | (1.12 | ) | (.52 | ) | ||||||||||||||
| Net asset value, end of period | $ | 9.36 | $ | 8.97 | $ | 10.06 | $ | 8.89 | $ | 8.91 | $ | 10.36 | ||||||||||||||
| Total Return (%) | 7.53 | ** | (.90 | ) | 16.62 | 3.02 | (3.01 | ) | 5.70 | |||||||||||||||||
| Ratios to Average Net Assets and Supplemental Data |
| |||||||||||||||||||||||||
| Net assets, end of period ($ millions) | 186 | 182 | 195 | 186 | 205 | 249 | ||||||||||||||||||||
| Ratio of expenses (%) | .70 | * | .69 | .70 | .71 | .71 | .69 | |||||||||||||||||||
| Ratio of net investment income (%) | 3.59 | * | 3.15 | 2.92 | 2.60 | 3.30 | 3.30 | |||||||||||||||||||
| Portfolio turnover rate (%) | 58 | ** | 67 | 137 | 123 | 115 | 100 | |||||||||||||||||||
| a | Based on average shares outstanding during the period. |
| * | Annualized |
| ** | Not annualized |
The accompanying notes are an integral part of the financial statements.
| 44 | | | DWS Global Income Builder Fund |
Table of Contents
| Six Months Ended 4/30/19 | Years Ended October 31, | |||||||||||||||||||||||||
| Institutional Class | (Unaudited) | 2018 | 2017 | 2016 | 2015 | 2014 | ||||||||||||||||||||
| Selected Per Share Data | ||||||||||||||||||||||||||
| Net asset value, beginning of period | $ | 8.95 | $ | 10.05 | $ | 8.88 | $ | 8.90 | $ | 10.35 | $ | 10.30 | ||||||||||||||
| Income (loss) from investment operations: | ||||||||||||||||||||||||||
Net investment incomea | .17 | .30 | .28 | .23 | .29 | .35 | ||||||||||||||||||||
Net realized and unrealized gain (loss) | .50 | (.37 | ) | 1.18 | .03 | (.61 | ) | .23 | ||||||||||||||||||
Total from investment operations | .67 | (.07 | ) | 1.46 | .26 | (.32 | ) | .58 | ||||||||||||||||||
| Less distributions from: |
| |||||||||||||||||||||||||
Net investment income | (.21 | ) | (.36 | ) | (.29 | ) | (.28 | ) | (.40 | ) | (.37 | ) | ||||||||||||||
Net realized gains | (.07 | ) | (.67 | ) | — | — | (.73 | ) | (.16 | ) | ||||||||||||||||
Total distributions | (.28 | ) | (1.03 | ) | (.29 | ) | (.28 | ) | (1.13 | ) | (.53 | ) | ||||||||||||||
| Net asset value, end of period | $ | 9.34 | $ | 8.95 | $ | 10.05 | $ | 8.88 | $ | 8.90 | $ | 10.35 | ||||||||||||||
| Total Return (%) | 7.56 | ** | (.99 | ) | 16.55 | 3.06 | (3.07 | ) | 5.77 | |||||||||||||||||
| Ratios to Average Net Assets and Supplemental Data |
| |||||||||||||||||||||||||
| Net assets, end of period ($ millions) | 7 | 12 | 10 | 8 | 8 | 3 | ||||||||||||||||||||
| Ratio of expenses (%) | .68 | * | .66 | .69 | .69 | .68 | .64 | |||||||||||||||||||
| Ratio of net investment income (%) | 3.75 | * | 3.18 | 2.94 | 2.63 | 3.15 | 3.34 | |||||||||||||||||||
| Portfolio turnover rate (%) | 58 | ** | 67 | 137 | 123 | 115 | 100 | |||||||||||||||||||
| a | Based on average shares outstanding during the period. |
| * | Annualized |
| ** | Not annualized |
The accompanying notes are an integral part of the financial statements.
| DWS Global Income Builder Fund | | | 45 |
Table of Contents
| Notes to Financial Statements | (Unaudited) |
A. Organization and Significant Accounting Policies
DWS Global Income Builder Fund (the “Fund”) is a diversified series of Deutsche DWS Market Trust (the “Trust”), which is registered under the Investment Company Act of 1940, as amended (the “1940 Act”), as anopen-end management investment company organized as a Massachusetts business trust.
The Fund offers multiple classes of shares which provide investors with different purchase options. Class A shares are subject to an initial sales charge. Class C shares are not subject to an initial sales charge but are subject to higher ongoing expenses than Class A shares and a contingent deferred sales charge payable upon certain redemptions within one year of purchase. Class C shares automatically convert to Class A shares in the same fund after 10 years, provided that the fund or the financial intermediary through which the shareholder purchased the Class C shares has records verifying that the Class C shares have been held for at least 10 years. Class R6 shares are not subject to initial or contingent deferred sales charges and are generally available only to certain retirement plans. Class S shares are not subject to initial or contingent deferred sales charges and are only available to a limited group of investors. Institutional Class shares are not subject to initial or contingent deferred sales charges and are generally available only to qualified institutions.
Investment income, realized and unrealized gains and losses, and certainfund-level expenses and expense reductions, if any, are borne pro rata on the basis of relative net assets by the holders of all classes of shares, except that each class bears certain expenses unique to that class such as distribution and service fees, services to shareholders and certain otherclass-specific expenses. Differences inclass-level expenses may result in payment of different per share dividends by class. All shares of the Fund have equal rights with respect to voting subject toclass-specific arrangements.
The Fund’s financial statements are prepared in accordance with accounting principles generally accepted in the United States of America (“U.S. GAAP”) which require the use of management estimates. Actual results could differ from those estimates. The Fund qualifies as an investment company under Topic 946 of Accounting Standards Codification of U.S. GAAP. The policies described below are followed consistently by the Fund in the preparation of its financial statements.
Security Valuation. Investments are stated at value determined as of the close of regular trading on the New York Stock Exchange on each day the exchange is open for trading.
| 46 | | | DWS Global Income Builder Fund |
Table of Contents
Various inputs are used in determining the value of the Fund’s investments. These inputs are summarized in three broad levels. Level 1 includes quoted prices in active markets for identical securities. Level 2 includes other significant observable inputs (including quoted prices for similar securities, interest rates, prepayment speeds and credit risk). Level 3 includes significant unobservable inputs (including the Fund’s own assumptions in determining the fair value of investments). The level assigned to the securities valuations may not be an indication of the risk or liquidity associated with investing in those securities.
Equity securities andexchange-traded funds (“ETFs”) are valued at the most recent sale price or official closing price reported on the exchange (U.S. or foreign) orover-the-counter market on which they trade. Equity securities or ETFs for which no sales are reported are valued at the calculated mean between the most recent bid and asked quotations on the relevant market or, if a mean cannot be determined, at the most recent bid quotation. Equity securities or ETFs are generally categorized as Level 1 securities. For certain international equity securities, in order to adjust for events which may occur between the close of the foreign exchanges and the close of the New York Stock Exchange, a fair valuation model may be used. This fair valuation model takes into account comparisons to the valuation of American Depository Receipts (ADRs),exchange-traded funds, futures contracts and certain indices and these securities are categorized as Level 2.
Debt securities and loan participations and assignments are valued at prices supplied by independent pricing services approved by the Fund’s Board. Such services may use various pricing techniques which take into account appropriate factors such as yield, quality, coupon rate, maturity, type of issue, trading characteristics, prepayment speeds and other data, as well as broker quotes. If the pricing services are unable to provide valuations, debt securities are valued at the average of the most recent reliable bid quotations or evaluated prices, as applicable, obtained frombroker-dealers, and loan participations and assignments are valued at the mean of the most recent bid and ask quotations or evaluated prices, as applicable, obtained frombroker-dealers. These securities are generally categorized as Level 2. Certain securities may be valued on the basis of a price provided by a single source orbroker-dealer. No active trading market may exist for some senior loans and they may be subject to restrictions on resale. The inability to dispose of senior loans in a timely fashion could result in losses. These securities are generally categorized as Level 3.
Investments inopen-end investment companies are valued at their net asset value each business day and are categorized as Level 1.
| DWS Global Income Builder Fund | | | 47 |
Table of Contents
Futures contracts are generally valued at the settlement prices established each day on the exchange on which they are traded and are categorized as Level 1.
Forward currency contracts are valued at the prevailing forward exchange rate of the underlying currencies and are categorized as Level 2.
Swap contracts are valued daily based upon prices supplied by a Board approved pricing vendor, if available, and otherwise are valued at the price provided by thebroker-dealer. Swap contracts are generally categorized as Level 2.
Securities and other assets for which market quotations are not readily available or for which the above valuation procedures are deemed not to reflect fair value are valued in a manner that is intended to reflect their fair value as determined in accordance with procedures approved by the Board and are generally categorized as Level 3. In accordance with the Fund’s valuation procedures, factors considered in determining value may include, but are not limited to, the type of the security; the size of the holding; the initial cost of the security; the existence of any contractual restrictions on the security’s disposition; the price and extent of public trading in similar securities of the issuer or of comparable companies; quotations or evaluated prices frombroker-dealers and/or pricing services; information obtained from the issuer, analysts, and/or the appropriate stock exchange (forexchange-traded securities); an analysis of the company’s or issuer’s financial statements; an evaluation of the forces that influence the issuer and the market(s) in which the security is purchased and sold; and with respect to debt securities, the maturity, coupon, creditworthiness, currency denomination and the movement of the market in which the security is normally traded. The value determined under these procedures may differ from published values for the same securities.
Disclosure about the classification of fair value measurements is included in a table following the Fund’s Investment Portfolio.
Foreign Currency Translations. The books and records of the Fund are maintained in U.S. dollars. Investment securities and other assets and liabilities denominated in a foreign currency are translated into U.S. dollars at the prevailing exchange rates at period end. Purchases and sales of investment securities, income and expenses are translated into U.S. dollars at the prevailing exchange rates on the respective dates of the transactions.
Net realized and unrealized gains and losses on foreign currency transactions represent net gains and losses between trade and settlement dates on securities transactions, the acquisition and disposition of foreign currencies, and the difference between the amount
| 48 | | | DWS Global Income Builder Fund |
Table of Contents
of net investment income accrued and the U.S. dollar amount actually received. The portion of both realized and unrealized gains and losses on investments that results from fluctuations in foreign currency exchange rates is not separately disclosed but is included with net realized and unrealized gain/appreciation and loss/depreciation on investments.
Securities Lending. Deutsche Bank AG, as lending agent, lends securities of the Fund to certain financial institutions under the terms of its securities lending agreement. During the term of the loans, the Fund continues to receive interest and dividends generated by the securities and to participate in any changes in their market value. The Fund requires the borrowers of the securities to maintain collateral with the Fund consisting of either cash or liquid, unencumbered assets having a value at least equal to the value of the securities loaned. When the collateral falls below specified amounts, the lending agent will use its best effort to obtain additional collateral on the next business day to meet required amounts under the securities lending agreement. As of period end, any securities on loan were collateralized by cash. During the six months ended April 30, 2019, the Fund invested the cash collateral into a joint trading account in DWS Government & Agency Securities Portfolio, an affiliated money market fund managed by DWS Investment Management Americas, Inc. DWS Investment Management Americas, Inc. receives a management/administration fee (0.12% annualized effective rate as of April 30, 2019) on the cash collateral invested in DWS Government & Agency Securities Portfolio. The Fund receives compensation for lending its securities either in the form of fees or by earning interest on invested cash collateral net of borrower rebates and fees paid to a lending agent. Either the Fund or the borrower may terminate the loan at any time, and the borrower, after notice, is required to return borrowed securities within a standard time period. There may be risks of delay and costs in recovery of securities or even loss of rights in the collateral should the borrower of the securities fail financially. If the Fund is not able to recover securities lent, the Fund may sell the collateral and purchase a replacement investment in the market, incurring the risk that the value of the replacement security is greater than the value of the collateral. The Fund is also subject to all investment risks associated with the reinvestment of any cash collateral received, including, but not limited to, interest rate, credit and liquidity risk associated with such investments.
As of April 30, 2019, the Fund had securities on loan, which were classified as common stocks, corporate bonds and government & agency obligations in the Investment Portfolio. The value of the related collateral exceeded the value of the securities loaned at period end.
| DWS Global Income Builder Fund | | | 49 |
Table of Contents
Remaining Contractual Maturity of the Agreementsas of April 30, 2019
| Overnight and Continuous | <30 days | Between 30 & 90 days | >90 days | Total | ||||||||||||||||
Securities Lending Transactions |
| |||||||||||||||||||
| Common Stocks | $ | 1,086,818 | $ | — | $ | — | $ | — | $ | 1,086,818 | ||||||||||
| Corporate Bonds | 5,619,530 | — | — | — | 5,619,530 | |||||||||||||||
| Government & Agency Obligations | 984,000 | — | — | — | 984,000 | |||||||||||||||
| Total Borrowings | $ | 7,690,348 | $ | — | $ | — | $ | — | $ | 7,690,348 | ||||||||||
| Gross amount of recognized liabilities for securities lending transactions |
| $ | 7,690,348 | |||||||||||||||||
Loan Participations and Assignments. Loan Participations and Assignments are portions of loans originated by banks and sold in pieces to investors. Thesefloating-rate loans (“Loans”) in which the Fund invests are arranged between the borrower and one or more financial institutions (“Lenders”). These Loans may take the form of Senior Loans, which are corporate obligations often issued in connection with recapitalizations, acquisitions, leveraged buyouts and refinancing. The Fund invests in such Loans in the form of participations in Loans (“Participations”) or assignments of all or a portion of Loans from third parties (“Assignments”). Participations typically result in the Fund having a contractual relationship with only the Lender, not with the borrower. The Fund has the right to receive payments of principal, interest and any fees to which it is entitled from the Lender selling the Participation and only upon receipt by the Lender of the payments from the borrower. In connection with purchasing Participations, the Fund generally has no right to enforce compliance by the borrower with the terms of the loan agreement relating to the Loan, or any rights of set off against the borrower, and the Fund will not benefit directly from any collateral supporting the Loan in which it has purchased the Participation. As a result, the Fund assumes the credit risk of both the borrower and the Lender that is selling the Participation. Assignments typically result in the Fund having a direct contractual relationship with the borrower, and the Fund may enforce compliance by the borrower with the terms of the loan agreement. Loans held by the Fund are generally in the form of Assignments, but the Fund may also invest in Participations. If affiliates of the Advisor participate in the primary and secondary market for senior loans, legal limitations may restrict the Fund’s ability to participate in restructuring or acquiring some senior loans. All Loans involve interest rate risk, liquidity risk and credit risk, including the potential default or insolvency of the borrower.
When-Issued/Delayed Delivery Securities. The Fund may purchase or sell securities with delivery or payment to occur at a later date beyond the normal settlement period. At the time the Fund enters into a commitment
| 50 | | | DWS Global Income Builder Fund |
Table of Contents
to purchase or sell a security, the transaction is recorded and the value of the transaction is reflected in the net asset value. The price of such security and the date when the security will be delivered and paid for are fixed at the time the transaction is negotiated. The value of the security may vary with market fluctuations. At the time the Fund enters into a purchase transaction it is required to segregate cash or other liquid assets at least equal to the amount of the commitment. Additionally, the Fund may be required to post securities and/or cash collateral in accordance with the terms of the commitment.
Certain risks may arise upon entering intowhen-issued or delayed delivery transactions from the potential inability of counterparties to meet the terms of their contracts or if the issuer does not issue the securities due to political, economic, or other factors. Additionally, losses may arise due to changes in the value of the underlying securities.
Federal Income Taxes. The Fund’s policy is to comply with the requirements of the Internal Revenue Code, as amended, which are applicable to regulated investment companies, and to distribute all of its taxable income to its shareholders.
At April 30, 2019, the aggregate cost of investments for federal income tax purposes was $727,062,749. The net unrealized appreciation for all investments based on tax cost was $46,770,315, consisting of aggregate gross unrealized appreciation for all investments which there was an excess of value over tax cost of $62,638,719, and aggregate gross unrealized depreciation for all investments in which there was an excess of tax cost over value of $15,868,404.
The Fund has reviewed the tax positions for the open tax years as of October 31, 2018 and has determined that no provision for income tax and/or uncertain tax positions is required in the Fund’s financial statements. The Fund’s federal tax returns for the prior three fiscal years remain open subject to examination by the Internal Revenue Service.
Distribution of Income and Gains. Distributions from net investment income of the Fund are declared and distributed to shareholders quarterly. Net realized gains from investment transactions, in excess of available capital loss carryforwards, would be taxable to the Fund if not distributed, and, therefore, will be distributed to shareholders at least annually. The Fund may also make additional distributions for tax purposes if necessary.
The timing and characterization of certain income and capital gain distributions are determined annually in accordance with federal tax regulations which may differ from accounting principles generally accepted in the United States of America. These differences primarily relate to paydown losses onmortgage-backed securities, premium amortization on debt securities, investments in futures, swap contracts,
| DWS Global Income Builder Fund | | | 51 |
Table of Contents
forward foreign currency exchange contracts, recognition of certain foreign currency gains (losses) as ordinary income (loss) and certain securities sold at a loss. As a result, net investment income (loss) and net realized gain (loss) on investment transactions for a reporting period may differ significantly from distributions during such period. Accordingly, the Fund may periodically make reclassifications among certain of its capital accounts without impacting the net asset value of the Fund.
The tax character of current year distributions will be determined at the end of the current fiscal year.
Expenses. Expenses of the Trust arising in connection with a specific fund are allocated to that fund. Other Trust expenses which cannot be directly attributed to a fund are apportioned among the funds in the Trust based upon the relative net assets or other appropriate measures.
Contingencies. In the normal course of business, the Fund may enter into contracts with service providers that contain general indemnification clauses. The Fund’s maximum exposure under these arrangements is unknown, as this would involve future claims that may be made against the Fund that have not yet been made. However, based on experience, the Fund expects the risk of loss to be remote.
Other. Investment transactions are accounted for on a trade date plus one basis for daily net asset value calculations. However, for financial reporting purposes, investment transactions are reported on trade date. Interest income is recorded on the accrual basis. Dividend income is recorded on theex-dividend date net of foreign withholding taxes. Certain dividends from foreign securities may be recorded subsequent to theex-dividend date as soon as the Fund is informed of such dividends. Realized gains and losses from investment transactions are recorded on an identified cost basis. Proceeds from litigation payments, if any, are included in net realized gain (loss) from investments. All premiums and discounts are amortized/accreted for financial reporting purposes, with the exception of securities in default of principal.
B. Derivative Instruments
Swaps. A swap is a contract between two parties to exchange future cash flows at periodic intervals based on the notional amount of the swap. A bilateral swap is a transaction between the fund and a counterparty where cash flows are exchanged between the two parties. A centrally cleared swap is a transaction executed between the fund and a counterparty, then cleared by a clearing member through a central clearinghouse. The central clearinghouse serves as the counterparty, with whom the fund exchanges cash flows.
| 52 | | | DWS Global Income Builder Fund |
Table of Contents
The value of a swap is adjusted daily, and the change in value, if any, is recorded as unrealized appreciation or depreciation in the Statement of Assets and Liabilities. Gains or losses are realized when the swap expires or is closed. Certain risks may arise when entering into swap transactions including counterparty default; liquidity; or unfavorable changes in interest rates or the value of the underlying reference security, commodity or index. In connection with bilateral swaps, securities and/or cash may be identified as collateral in accordance with the terms of the swap agreement to provide assets of value and recourse in the event of default. The maximum counterparty credit risk is the net present value of the cash flows to be received from or paid to the counterparty over the term of the swap, to the extent that this amount is beneficial to the Fund, in addition to any related collateral posted to the counterparty by the Fund. This risk may be partially reduced by a master netting arrangement between the Fund and the counterparty. Upon entering into a centrally cleared swap, the Fund is required to deposit with a financial intermediary cash or securities (“initial margin”) in an amount equal to a certain percentage of the notional amount of the swap. Subsequent payments (“variation margin”) are made or received by the Fund dependent upon the daily fluctuations in the value of the swap. In a cleared swap transaction, counterparty risk is minimized as the central clearinghouse acts as the counterparty.
An upfront payment, if any, made by the Fund is recorded as an asset in the Statement of Assets and Liabilities. An upfront payment, if any, received by the Fund is recorded as a liability in the Statement of Assets and Liabilities. Payments received or made at the end of the measurement period are recorded as realized gain or loss in the Statement of Operations.
Interest Rate Swaps. Interest rate swaps are agreements in which the Fund agrees to pay to the counterparty a fixed rate payment in exchange for the counterparty agreeing to pay to the Fund a variable rate payment, or the Fund agrees to receive from the counterparty a fixed rate payment in exchange for the counterparty agreeing to receive from the Fund a variable rate payment. The payment obligations are based on the notional amount of the swap. For the six months ended April 30, 2019, the Fund entered into interest rate swap agreements to gain exposure to different parts of the yield curve while managing overall duration.
A summary of the open interest rate swap contracts as of April 30, 2019 is included in a table following the Fund’s Investment Portfolio. For the six months ended April 30, 2019, the investment in interest rate swap contracts had a total notional amount generally indicative of a range from $10,900,000 to $70,550,000.
Credit Default Swaps. Credit default swaps are agreements between a buyer and a seller of protection against predefined credit events for the
| DWS Global Income Builder Fund | | | 53 |
Table of Contents
reference entity. The Fund may enter into credit default swaps to gain exposure to an underlying issuer’s credit quality characteristics without directly investing in that issuer or to hedge against the risk of a credit event on debt securities. As a seller of a credit default swap, the Fund is required to pay the par (or otheragreed-upon) value of the referenced entity to the counterparty with the occurrence of a credit event by a third party, such as a U.S. or foreign corporate issuer, on the reference entity, which would likely result in a loss to the Fund. In return, the Fund receives from the counterparty a periodic stream of payments over the term of the swap provided that no credit event has occurred. If no credit event occurs, the Fund keeps the stream of payments with no payment obligations. The Fund may also buy credit default swaps, in which case the Fund functions as the counterparty referenced above. This involves the risk that the swap may expire worthless. It also involves counterparty risk that the seller may fail to satisfy its payment obligations to the Fund with the occurrence of a credit event. When the Fund sells a credit default swap, it will cover its commitment. This may be achieved by, among other methods, maintaining cash or liquid assets equal to the aggregate notional value of the reference entities for all outstanding credit default swaps sold by the Fund. For the six months ended April 30, 2019, the Fund entered into credit default swap agreements to gain exposure to the underlying issuer’s credit quality characteristics and to hedge the risk of default or other specified credit events on portfolio assets.
Under the terms of a credit default swap, the Fund receives or makes periodic payments based on a specified interest rate on a fixed notional amount. These payments are recorded as a realized gain or loss in the Statement of Operations. Payments received or made as a result of a credit event or termination of the swap are recognized, net of a proportional amount of the upfront payment, as realized gains or losses in the Statement of Operations.
A summary of the open credit default swap contracts as of April 30, 2019 is included in a table following the Fund’s Investment Portfolio. For the six months ended April 30, 2019, the investment in credit default swap contracts purchased had a total notional amount generally indicative of a range from $18,000,000 to $36,000,000. The investment in credit default swap contracts sold had a total notional amount generally indicative of a range from $0 to $41,800,000.
Futures Contracts. A futures contract is an agreement between a buyer or seller and an established futures exchange or its clearinghouse in which the buyer or seller agrees to take or make a delivery of a specific amount of a financial instrument at a specified price on a specific date (settlement date). For the six months ended April 30, 2019, the Fund entered into interest rate futures to gain exposure to different parts of the yield curve while managing overall duration. The Fund also entered into
| 54 | | | DWS Global Income Builder Fund |
Table of Contents
interest rate futures contracts fornon-hedging purposes to seek to enhance potential gains and entered into equity index futures in order to reduce the Fund’s exposure to, or as a substitute for direct investment in, the equity asset class.
Upon entering into a futures contract, the Fund is required to depositwith a financial intermediary cash or securities (“initial margin”) in an amount equal to acertain percentage of the face value indicated in the futures contract.Subsequent payments (“variation margin”) are made or received by theFund dependent upon the daily fluctuations in the value and are recorded for financial reporting purposes asunrealized gains or losses by the Fund. Gains or losses are realized when the contract expires or is closed. Since all futures contracts areexchange traded, counterparty risk is minimized as the exchange’sclearinghouse acts as the counterparty and guarantees the futures against default.
Certain risks may arise upon entering into futures contracts, including the risk that an illiquid market will limit the Fund’s ability to close out a futures contract prior to the settlement date and the risk that the futures contract is not well correlated with the security, index or currency to which it relates. Risk of loss may exceed amounts disclosed in the Statement of Assets and Liabilities.
A summary of the open futures contracts as of April 30, 2019, is included in a table following the Fund’s Investment Portfolio. For the six months ended April 30, 2019, the investment in futures contracts purchased had a total notional value generally indicative of a range from approximately $128,041,000 to $186,375,000, and the investment in futures contracts sold had a total notional value generally indicative of a range from approximately $63,392,000 to $107,383,000.
Forward Foreign Currency Exchange Contracts. A forward foreign currency exchange contract (“forward currency contract”) is a commitment to purchase or sell a foreign currency at the settlement date at a negotiated rate. For the six months ended April 30, 2019, the Fund entered into forward currency contracts in order to hedge its exposure to changes in foreign currency exchange rates on its foreign currency denominated portfolio holdings, to facilitate transactions in foreign currency denominated securities and fornon-hedging purposes to seek to enhance potential gains.
Forward currency contracts are valued at the prevailing forward exchange rate of the underlying currencies and unrealized gain (loss) is recorded daily. On the settlement date of the forward currency contract, the Fund records a realized gain or loss equal to the difference between the value of the contract at the time it was opened and the value of the contract at the time it was closed. Certain risks may arise upon entering into forward currency contracts from the potential inability of counterparties to meet
| DWS Global Income Builder Fund | | | 55 |
Table of Contents
the terms of their contracts. The maximum counterparty credit risk to the Fund is measured by the unrealized gain on appreciated contracts. Additionally, when utilizing forward currency contracts to hedge, the Fund gives up the opportunity to profit from favorable exchange rate movements during the term of the contract.
A summary of the open forward currency contracts as of April 30, 2019 is included in a table following the Fund’s Investment Portfolio. For the six months ended April 30, 2019, the investment in forward currency contracts short vs. U.S. dollars had a total contract value generally indicative of a range from approximately $11,022,000 to $163,128,000, and the investment in forward currency contracts long vs. U.S. dollars had a total contract value generally indicative of a range from $0 to approximately $106,503,000. The investment in forward currency contracts long vs. other foreign currencies sold had a total contract value generally indicative of a range from $0 to approximately $6,817,000.
The following tables summarize the value of the Fund’s derivative instruments held as of April 30, 2019 and the related location in the accompanying Statement of Assets and Liabilities, presented by primary underlying risk exposure:
| Asset Derivatives | Forward Contracts | Futures Contracts | Total | |||||||||
| Equity Contracts (a) | $ | — | $ | 1,222,378 | $ | 1,222,378 | ||||||
| Interest Rate Contracts (a) | — | 829,315 | 829,315 | |||||||||
| Foreign Exchange Contracts (b) | 465,048 | — | 465,048 | |||||||||
| $ | 465,048 | $ | 2,051,693 | $ | 2,516,741 | |||||||
Each of the above derivatives is located in the following Statement of Assets and Liabilities
accounts:
| (a) | Includes cumulative appreciation of futures contracts as disclosed in the Investment Portfolio. Unsettled variation margin is disclosed separately within the Statement of Assets and Liabilities. |
| (b) | Unrealized appreciation on forward foreign currency contracts |
| 56 | | | DWS Global Income Builder Fund |
Table of Contents
| Liability Derivatives | Forward Contracts | Swap Contracts | Futures Contracts | Total | ||||||||||||
| Equity Contracts (c) | $ | — | $ | — | $ | (469,935 | ) | $ | (469,935 | ) | ||||||
| Interest Rate Contracts (c) | — | (214,399 | ) | (132,579 | ) | (346,978 | ) | |||||||||
| Credit Contracts (c) | — | (141,120 | ) | — | (141,120 | ) | ||||||||||
| Foreign Exchange Contracts (d) | (370 | ) | — | — | (370 | ) | ||||||||||
| $ | (370 | ) | $ | (355,519 | ) | $ | (602,514 | ) | $ | (958,403 | ) | |||||
| (c) | Includes cumulative depreciation of futures and centrally cleared swap contracts as disclosed in the Investment Portfolio. Unsettled variation margin is disclosed separately within the Statement of Assets and Liabilities. |
| (d) | Unrealized depreciation on forward foreign currency contracts |
Additionally, the amount of unrealized and realized gains and losses on derivative instruments recognized in Fund earnings during the six months ended April 30, 2019 and the related location in the accompanying Statement of Operations is summarized in the following tables by primary underlying risk exposure:
| Realized Gain (Loss) | Forward Contracts | Swap Contracts | Futures Contracts | Total | ||||||||||||
| Equity Contracts (e) | $ | — | $ | — | $ | (3,795,807 | ) | $ | (3,795,807 | ) | ||||||
| Interest Rate Contracts (e) | — | 1,642,543 | (688,107 | ) | 954,436 | |||||||||||
| Credit Contracts (e) | — | (363,735 | ) | — | (363,735 | ) | ||||||||||
| Foreign Exchange Contracts (e) | (1,112,779 | ) | — | — | (1,112,779 | ) | ||||||||||
| $ | (1,112,779 | ) | $ | 1,278,808 | $ | (4,483,914 | ) | $ | (4,317,885 | ) | ||||||
Each of the above derivatives is located in the following Statement of Operations accounts:
| (e) | Net realized gain (loss) from forward foreign currency contracts, swap contracts and futures, respectively |
| Change in Appreciation (Depreciation) | Forward Contracts | Swap Contracts | Futures Contracts | Total | ||||||||||||
| Equity Contracts (f) | $ | — | $ | — | $ | 5,095,755 | $ | 5,095,755 | ||||||||
| Interest Rate Contracts (f) | — | (337,750 | ) | 917,273 | 579,523 | |||||||||||
| Credit Contracts (f) | — | 20,158 | — | 20,158 | ||||||||||||
| Foreign Exchange Contracts (f) | 503,733 | — | — | 503,733 | ||||||||||||
| $ | 503,733 | $ | (317,592 | ) | $ | 6,013,028 | $ | 6,199,169 | ||||||||
Each of the above derivatives is located in the following Statement of Operations accounts:
| (f) | Change in net unrealized appreciation (depreciation) on forward foreign currency contracts, swap contracts and futures, respectively |
As of April 30, 2019, the Fund has transactions subject to enforceable master netting agreements which govern the terms of certain
| DWS Global Income Builder Fund | | | 57 |
Table of Contents
transactions, and reduce the counterparty risk associated with such transactions. Master netting agreements allow a Fund to close out and net total exposure to a counterparty in the event of a deterioration in the credit quality or contractual default with respect to all of the transactions with a counterparty. As defined by the master netting agreement, the Fund may have collateral agreements with certain counterparties to mitigate risk. For financial reporting purposes the Statement of Assets and Liabilities generally shows derivatives assets and liabilities on a gross basis, which reflects the full risks and exposures prior to netting. A reconciliation of the gross amounts on the Statement of Assets and Liabilities to the net amounts by counterparty, including any collateral exposure, is included in the following tables:
| Counterparty | Gross Amounts of Assets Presented in the Statement of Assets and Liabilities | Financial Instruments and Derivatives Available for Offset | Non-Cash Collateral Received | Cash Collateral Received | Net Amount of Derivative Assets | |||||||||||||||
| Bank of America | $ | 285,148 | $ | — | $ | — | $ | — | $ | 285,148 | ||||||||||
| Credit Agricole | 64,429 | (370 | ) | — | — | 64,059 | ||||||||||||||
| JPMorgan Chase Securities, Inc. | 115,471 | — | — | — | 115,471 | |||||||||||||||
| $ | 465,048 | $ | (370 | ) | $ | — | $ | — | $ | 464,678 | ||||||||||
| Counterparty | Gross Amounts of Liabilities Presented in the Statement of Assets and Liabilities | Financial Instruments and Derivatives Available for Offset | Non-Cash Collateral Pledged | Cash Collateral Pledged | Net Amount of Derivative Liabilities | |||||||||||||||
| Credit Agricole | $ | 370 | $ | (370 | ) | $ | — | $ | — | $ | — | |||||||||
C. Purchases and Sales of Securities
During the six months ended April 30, 2019, purchases and sales of investment securities, excluding short-term investments, were as follows:
| Purchases | Sales | |||||||
| Non-U.S. Treasury Obligations | $ | 388,222,257 | $ | 409,666,943 | ||||
| U.S. Treasury Obligations | $ | 20,221,174 | $ | 12,558,681 | ||||
D. Related Parties
Management Agreement. Under the Investment Management Agreement with DWS Investment Management Americas, Inc. (“DIMA” or the “Advisor”), an indirect, wholly owned subsidiary of DWS Group GmbH & Co. KGaA (“DWS Group”), the Advisor directs the investments
| 58 | | | DWS Global Income Builder Fund |
Table of Contents
of the Fund in accordance with its investment objectives, policies and restrictions. The Advisor determines the securities, instruments and other contracts relating to investments to be purchased, sold or entered into by the Fund or delegates such responsibility to the Fund’s subadvisor.
DWS Alternatives Global Limited (formerly Deutsche Alternative Asset Management (Global) Limited) a direct, wholly owned subsidiary of Deutsche Bank AG, serves as subadvisor for the Fund and, as such, provides portfolio manager services to the Fund. Pursuant to asub-advisory agreement between DIMA and DWS Alternatives Global Limited, DIMA, not the Fund, compensates DWS Alternatives Global Limited for the services it provides to the Fund. Effective May 16, 2019 DWS Alternatives Global Limited no longer serves as a subadvisor to the Fund.
Under the Management Agreement, the Fund pays a monthly management fee based on the Fund’s average daily net assets, computed and accrued daily and payable monthly at the following rates:
| First $1.5 billion of the Fund’s average daily net assets | .370% | |||
| Next $500 million of such net assets | .345% | |||
| Next $1.5 billion of such net assets | .310% | |||
| Next $2.0 billion of such net assets | .300% | |||
| Next $2.0 billion of such net assets | .290% | |||
| Next $2.5 billion of such net assets | .280% | |||
| Next $2.5 billion of such net assets | .270% | |||
| Over $12.5 billion of such net assets | .260% |
Accordingly, for the six months ended April 30, 2019, the fee pursuant to the Investment Management Agreement was equivalent to an annualized rate (exclusive of any applicable waivers/reimbursements) of 0.370% of the Fund’s average daily net assets.
For the period from November 1, 2018 through September 30, 2019, the Advisor had contractually agreed to waive its fees and/or reimburse certain operating expenses of the Fund to the extent necessary to maintain the total annual operating expenses (excluding certain expenses such as extraordinary expenses, taxes, brokerage and interest) of each class as follows:
| Class A | 1.25% | |||
| Class C | 2.00% | |||
| Class R6 | 1.00% | |||
| Class S | 1.00% | |||
| Institutional Class | 1.00% |
| DWS Global Income Builder Fund | | | 59 |
Table of Contents
Administration Fee. Pursuant to an Administrative Services Agreement, DIMA provides most administrative services to the Fund. For all services provided under the Administrative Services Agreement, the Fund pays the Advisor an annual fee (“Administration Fee”) of 0.10% of the Fund’s average daily net assets, computed and accrued daily and payable monthly. For the six months ended April 30, 2019, the Administration Fee was $363,044, of which $61,855 is unpaid.
Service Provider Fees. DWS Service Company (“DSC”), an affiliate of the Advisor, is the transfer agent,dividend-paying agent and shareholder service agent for the Fund. Pursuant to asub-transfer agency agreement among DSC and DST Systems, Inc. (“DST”), DSC has delegated certain transfer agent,dividend-paying agent and shareholder service agent functions to DST. DSC compensates DST out of the shareholder servicing fee it receives from the Fund. For the six months ended April 30, 2019, the amounts charged to the Fund by DSC were as follows:
| Services to Shareholders | Total Aggregated | Unpaid at April 30, 2019 | ||||||
| Class A | $ | 154,763 | $ | 53,049 | ||||
| Class C | 3,051 | 2,784 | ||||||
| Class R6 | 106 | 40 | ||||||
| Class S | 88,419 | 31,392 | ||||||
| Institutional Class | 313 | 105 | ||||||
| $ | 246,652 | $ | 87,370 | |||||
In addition, for the six months ended April 30, 2019, the amounts charged to the Fund for recordkeeping and other administrative services provided by unaffiliated third parties, included in the Statement of Operations under “Services to shareholders,” were as follows:
| Sub-Recordkeeping | Total Aggregated | |||
| Class A | $ | 129,511 | ||
| Class C | 5,694 | |||
| Class S | 35,124 | |||
| Institutional Class | 4,910 | |||
| $ | 175,239 | |||
Distribution and Service Fees. Under the Fund’s Class C12b-1 Plan, DWS Distributors, Inc. (“DDI”), an affiliate of the Advisor, receives a fee (“Distribution Fee”) of 0.75% of average daily net assets of Class C shares. In accordance with the Fund’s Underwriting and Distribution Services Agreement, DDI enters into related selling group agreements
| 60 | | | DWS Global Income Builder Fund |
Table of Contents
with various firms at various rates for sales of Class C shares. For the six months ended April 30, 2019, the Distribution Fee was as follows:
| Distribution Fee | Total Aggregated | Unpaid at April 30, 2019 | ||||||
| Class C | $ | 36,777 | $ | 6,316 | ||||
In addition, DDI provides information and administrative services for a fee (“Service Fee”) to Class A and C shareholders at an annual rate of up to 0.25% of average daily net assets for each such class. DDI in turn has various agreements with financial services firms that provide these services and pays these fees based upon the assets of shareholder accounts the firms service. For the six months ended April 30, 2019, the Service Fee was as follows:
| Service Fee | Total Aggregated | Unpaid at April 30, 2019 | Annualized Rate | |||||||||
| Class A | $ | 608,024 | $ | 222,410 | .23 | % | ||||||
| Class C | 11,685 | 4,493 | .24 | % | ||||||||
| $ | 619,709 | $ | 226,903 | |||||||||
Underwriting and Contingent Deferred Sales Charge. DDI is the principal underwriter for the Fund. Underwriting commissions paid in connection with the distribution of Class A shares for the six months ended April 30, 2019 aggregated $5,925.
In addition, DDI receives any contingent deferred sales charge (“CDSC”) from Class C share redemptions occurring within one year of purchase. There is no such charge upon redemption of any share appreciation or reinvested dividends. The CDSC is 1% of the value of the shares redeemed for Class C. For the six months ended April 30, 2019, the CDSC for Class C shares aggregated $1,128. A deferred sales charge of up to 1% is assessed on certain redemptions for Class A shares.
Typesetting and Filing Service Fees. Under an agreement with the Fund, DIMA is compensated for providing certainpre-press and regulatory filing services to the Fund. For the six months ended April 30, 2019, the amount charged to the Fund by DIMA included in the Statement of Operations under “Reports to shareholders” aggregated $14,172, of which $12,960 is unpaid.
Trustees’ Fees and Expenses. The Fund paid retainer fees to each Trustee not affiliated with the Advisor, plus specified amounts to the Board Chairperson and to each committee Chairperson.
Affiliated Cash Management Vehicles. The Fund may invest uninvested cash balances in DWS Central Cash Management Government Fund and DWS ESG Liquidity Fund, affiliated money market funds which are managed by the Advisor. Each affiliated money market fund is managed
| DWS Global Income Builder Fund | | | 61 |
Table of Contents
in accordance with Rule2a-7 under the 1940 Act, which governs the quality, maturity, diversity and liquidity of instruments in which a money market fund may invest. DWS Central Cash Management Government Fund seeks to maintain a stable net asset value, and DWS ESG Liquidity Fund maintains a floating net asset value. The Fund indirectly bears its proportionate share of the expenses of each affiliated money market fund in which it invests. DWS Central Cash Management Government Fund does not pay the Advisor an investment management fee. To the extent that DWS ESG Liquidity Fund pays an investment management fee to the Advisor, the Advisor will waive an amount of the investment management fee payable to the Advisor by the Fund equal to the amount of the investment management fee payable on the Fund’s assets invested in DWS ESG Liquidity Fund.
Security Lending Fees. Deutsche Bank AG serves as lending agent for the Fund. For the six months ended April 30, 2019, the Fund incurred lending agent fees to Deutsche Bank AG for the amount of $7,388.
E. Line of Credit
The Fund and other affiliated funds (the “Participants”) share in a $400 million revolving credit facility provided by a syndication of banks. The Fund may borrow for temporary or emergency purposes, including the meeting of redemption requests that otherwise might require the untimely disposition of securities. The Participants are charged an annual commitment fee which is allocated based on net assets, among each of the Participants. Interest is calculated at a rate per annum equal to the sum of the Federal Funds Rate plus 1.25 percent plus if theone-month LIBOR exceeds the Federal Funds Rate, the amount of such excess. The Fund may borrow up to a maximum of 33 percent of its net assets under the agreement. The Fund had no outstanding loans at April 30, 2019.
| 62 | | | DWS Global Income Builder Fund |
Table of Contents
F. Fund Share Transactions
The following table summarizes share and dollar activity in the Fund:
Six Months Ended April 30, 2019 | Year Ended October 31, 2018 | |||||||||||||||
| Shares | Dollars | Shares | Dollars | |||||||||||||
| Shares sold |
| |||||||||||||||
| Class A | 658,871 | $ | 5,833,572 | 2,052,643 | $ | 19,471,375 | ||||||||||
| Class C | 191,100 | 1,687,764 | 226,823 | 2,181,745 | ||||||||||||
| Class R6 | 616,768 | 5,185,624 | 117,606 | 1,157,370 | ||||||||||||
| Class S | 339,942 | 3,031,056 | 1,718,089 | 15,948,905 | ||||||||||||
| Institutional Class | 182,014 | 1,622,183 | 533,190 | 5,039,074 | ||||||||||||
| $ | 17,360,199 | $ | 43,798,469 | |||||||||||||
| Shares issued to shareholders in reinvestment of distributions |
| |||||||||||||||
| Class A | 1,721,055 | $ | 14,942,071 | 6,112,892 | $ | 57,859,550 | ||||||||||
| Class C | 28,727 | 248,785 | 187,993 | 1,781,112 | ||||||||||||
| Class R6 | 7,181 | 64,452 | 30,941 | 292,492 | ||||||||||||
| Class S | 590,245 | 5,127,087 | 1,968,919 | 18,631,607 | ||||||||||||
| Institutional Class | 36,586 | 315,061 | 117,392 | 1,108,665 | ||||||||||||
| $ | 20,697,456 | $ | 79,673,426 | |||||||||||||
| Shares redeemed |
| |||||||||||||||
| Class A | (3,881,264 | ) | $ | (34,808,177 | ) | (8,458,369 | ) | $ | (80,579,761 | ) | ||||||
| Class C | (232,672 | ) | (2,040,429 | ) | (1,295,599 | ) | (12,195,418 | ) | ||||||||
| Class R6 | (72,914 | ) | (637,885 | ) | (476,320 | ) | (4,504,044 | ) | ||||||||
| Class S | (1,378,441 | ) | (12,305,327 | ) | (2,703,608 | ) | (25,642,028 | ) | ||||||||
| Institutional Class | (774,709 | ) | (6,591,630 | ) | (313,309 | ) | (2,986,340 | ) | ||||||||
| $ | (56,383,448 | ) | $ | (125,907,591 | ) | |||||||||||
| Net increase (decrease) |
| |||||||||||||||
| Class A | (1,501,338 | ) | $ | (14,032,534 | ) | (292,834 | ) | $ | (3,248,836 | ) | ||||||
| Class C | (12,845 | ) | (103,880 | ) | (880,783 | ) | (8,232,561 | ) | ||||||||
| Class R6 | 551,035 | 4,612,191 | (327,773 | ) | (3,054,182 | ) | ||||||||||
| Class S | (448,254 | ) | (4,147,184 | ) | 983,400 | 8,938,484 | ||||||||||
| Institutional Class | (556,109 | ) | (4,654,386 | ) | 337,273 | 3,161,399 | ||||||||||
| $ | (18,325,793 | ) | $ | (2,435,696 | ) | |||||||||||
| DWS Global Income Builder Fund | | | 63 |
Table of Contents
Information About Your Fund’s Expenses
As an investor of the Fund, you incur two types of costs: ongoing expenses and transaction costs. Ongoing expenses include management fees, distribution and service(12b-1) fees and other Fund expenses. Examples of transaction costs include sales charges (loads) and account maintenance fees, which are not shown in this section. The following tables are intended to help you understand your ongoing expenses (in dollars) of investing in the Fund and to help you compare these expenses with the ongoing expenses of investing in other mutual funds. The example in the table is based on an investment of $1,000 invested at the beginning of thesix-month period and held for the entire period (November 1, 2018 to April 30, 2019).
The tables illustrate your Fund’s expenses in two ways:
| – | Actual Fund Return. This helps you estimate the actual dollar amount of ongoing expenses (but not transaction costs) paid on a $1,000 investment in the Fund using the Fund’s actual return during the period. To estimate the expenses you paid over the period, simply divide your account value by $1,000 (for example, an $8,600 account value divided by $1,000 = 8.6), then multiply the result by the number in the “Expenses Paid per $1,000” line under the share class you hold. |
| – | Hypothetical 5% Fund Return. This helps you to compare your Fund’s ongoing expenses (but not transaction costs) with those of other mutual funds using the Fund’s actual expense ratio and a hypothetical rate of return of 5% per year before expenses. Examples using a 5% hypothetical fund return may be found in the shareholder reports of other mutual funds. The hypothetical account values and expenses may not be used to estimate the actual ending account balance or expenses you paid for the period. |
Please note that the expenses shown in these tables are meant to highlight your ongoing expenses only and do not reflect any transaction costs. The “Expenses Paid per $1,000” line of the tables is useful in comparing ongoing expenses only and will not help you determine the relative total expense of owning different funds. Subject to certain exceptions, an account maintenance fee of $20.00 assessed once per calendar year for Classes A, C and S shares may apply for accounts with balances less than $10,000. This fee is not included in these tables. If it was, the estimate of expenses paid for Classes A, C and S shares during the period would be higher, and account value during the period would be lower, by this amount.
| 64 | | | DWS Global Income Builder Fund |
Table of Contents
| Expenses and Value of a $1,000 Investment for the six months ended April 30, 2019 | ||||||||||||||||||||
| Actual Fund Return | Class A | Class C | Class R6 | Class S | Institutional Class | |||||||||||||||
| Beginning Account Value 11/1/18 | $ | 1,000.00 | $ | 1,000.00 | $ | 1,000.00 | $ | 1,000.00 | $ | 1,000.00 | ||||||||||
| Ending Account Value 4/30/19 | $ | 1,075.40 | $ | 1,070.10 | $ | 1,076.10 | $ | 1,075.30 | $ | 1,075.60 | ||||||||||
| Expenses Paid per $1,000* | $ | 4.63 | $ | 8.88 | $ | 2.93 | $ | 3.60 | $ | 3.50 | ||||||||||
| Hypothetical 5% Fund Return | Class A | Class C | Class R6 | Class S | Institutional Class | |||||||||||||||
| Beginning Account Value 11/1/18 | $ | 1,000.00 | $ | 1,000.00 | $ | 1,000.00 | $ | 1,000.00 | $ | 1,000.00 | ||||||||||
| Ending Account Value 4/30/19 | $ | 1,020.33 | $ | 1,016.22 | $ | 1,021.97 | $ | 1,021.32 | $ | 1,021.42 | ||||||||||
| Expenses Paid per $1,000* | $ | 4.51 | $ | 8.65 | $ | 2.86 | $ | 3.51 | $ | 3.41 | ||||||||||
| * | Expenses are equal to the Fund’s annualized expense ratio for each share class, multiplied by the average account value over the period, multiplied by 181 (the number of days in the most recentsix-month period), then divided by 365. |
| Annualized Expense Ratios | Class A | Class C | Class R6 | Class S | Institutional Class | |||||||||||||||
| DWS Global Income Builder Fund | .90 | % | 1.73 | % | .57 | % | .70 | % | .68 | % | ||||||||||
For more information, please refer to the Fund’s prospectus.
For an analysis of the fees associated with an investment in the Fund or
similar funds, please refer to tools.finra.org/fund_analyzer/.
| DWS Global Income Builder Fund | | | 65 |
Table of Contents
Advisory Agreement Board Considerations and Fee Evaluation
The Board of Trustees (hereinafter referred to as the “Board” or “Trustees”) approved the renewal of DWS Global Income Builder Fund’s (the “Fund”) investment management agreement (the “Agreement”) with DWS Investment Management Americas, Inc. (“DIMA”) and sub-advisory agreement (the “Sub-Advisory Agreement” and together with the Agreement, the “Agreements”) between DIMA and Deutsche Alternative Asset Management (Global) Limited (now known as DWS Alternatives Global Limited) (“DAAM Global”), an affiliate of DIMA, in September 2018 (effective May 16, 2019, DAAM Global no longer serves as sub-advisor to the Fund).
In terms of the process that the Board followed prior to approving the Agreements, shareholders should know that:
| – | During the entire process, all of the Fund’s Trustees were independent of DIMA and its affiliates (the “Independent Trustees”). |
| – | The Board met frequently during the past year to discuss fund matters and dedicated a substantial amount of time to contract review matters. Over the course of several months, the Board’s Contract Committee reviewed extensive materials received from DIMA, independent third parties and independent counsel. These materials included an analysis of the Fund’s performance, fees and expenses, and profitability from a fee consultant retained by the Fund’s Independent Trustees (the “Fee Consultant”). Based on its evaluation of the information provided, the Contract Committee presented its findings and recommendations to the Board. The Board then reviewed the Contract Committee’s findings and recommendations. |
| – | The Board also received extensive information throughout the year regarding performance of the Fund. |
| – | The Independent Trustees regularly met privately with counsel to discuss contract review and other matters. In addition, the Independent Trustees were advised by the Fee Consultant in the course of their review of the Fund’s contractual arrangements and considered a comprehensive report prepared by the Fee Consultant in connection with their deliberations. |
| – | In connection with reviewing the Agreements, the Board also reviewed the terms of the Fund’s Rule 12b-1 plan, distribution agreement, administrative services agreement, transfer agency agreement and other material service agreements. |
In connection with the contract review process, the Contract Committee and the Board considered the factors discussed below, among others.
| 66 | | | DWS Global Income Builder Fund |
Table of Contents
The Board also considered that DIMA and its predecessors have managed the Fund since its inception, and the Board believes that a long-term relationship with a capable, conscientious advisor is in the best interests of the Fund. The Board considered, generally, that shareholders chose to invest or remain invested in the Fund knowing that DIMA managed the Fund. DIMA and DAAM Global are part of DWS Group GmbH & Co. KGaA (“DWS Group”). DWS Group is a global asset management business that offers a wide range of investing expertise and resources, including research capabilities in many countries throughout the world. In 2018, approximately 20% of DWS Group’s shares were sold in an initial public offering, with Deutsche Bank AG owning the remaining shares.
As part of the contract review process, the Board carefully considered the fees and expenses of each DWS fund overseen by the Board in light of the fund’s performance. In many cases, this led to the negotiation and implementation of expense caps. As part of these negotiations, the Board indicated that it would consider relaxing these caps in future years following sustained improvements in performance, among other considerations.
While shareholders may focus primarily on fund performance and fees, the Fund’s Board considers these and many other factors, including the quality and integrity of DIMA’s and DAAM Global’s personnel and administrative support services provided by DIMA, such as back-office operations, fund valuations, and compliance policies and procedures.
Nature, Quality and Extent of Services. The Board considered the terms of the Agreements, including the scope of advisory services provided under the Agreements. The Board noted that, under the Agreements, DIMA and DAAM Global provide portfolio management services to the Fund and that, pursuant to a separate administrative services agreement, DIMA provides administrative services to the Fund. The Board considered the experience and skills of senior management and investment personnel and the resources made available to such personnel. Throughout the course of the year, the Board also received information regarding DIMA’s oversight of Fund sub-advisers, including DAAM Global. The Board reviewed the Fund’s performance over short-term and long-term periods and compared those returns to various agreed-upon performance measures, including market index(es) and a peer universe compiled using information supplied by Morningstar Direct (“Morningstar”), an independent fund data service. The Board also noted that it has put into place a process of identifying “Funds in Review” (e.g., funds performing poorly relative to a peer universe), and receives additional reporting from DIMA regarding such funds and, where appropriate, DIMA’s plans to address underperformance. The Board believes this process is an effective manner of identifying and addressing underperforming funds. Based on the information provided, the Board
| DWS Global Income Builder Fund | | | 67 |
Table of Contents
noted that, for the one-, three- and five-year periods ended December 31, 2017, the Fund’s performance (Class A shares) was in the 2nd quartile, 1st quartile and 2nd quartile, respectively, of the applicable Morningstar universe (the 1st quartile being the best performers and the 4th quartile being the worst performers). The Board also observed that the Fund has outperformed its benchmark in the one-, three- and five-year periods ended December 31, 2017.
Fees and Expenses. The Board considered the Fund’s investment management fee schedule, sub-advisory fee schedule, operating expenses and total expense ratios, and comparative information provided by Broadridge Financial Solutions, Inc. (“Broadridge”) and the Fee Consultant regarding investment management fee rates paid to other investment advisors by similar funds (1st quartile being the most favorable and 4th quartile being the least favorable). With respect to management fees paid to other investment advisors by similar funds, the Board noted that the contractual fee rates paid by the Fund, which include a 0.10% fee paid to DIMA under the Fund’s administrative services agreement, were lower than the median (1st quartile) of the applicable Broadridge peer group (based on Broadridge data provided as of December 31, 2017). With respect to the sub-advisory fee paid to DAAM Global, the Board noted that the fee is paid by DIMA out of its fee and not directly by the Fund. The Board noted that the Fund’s Class A shares total (net) operating expenses (excluding 12b-1 fees) were expected to be lower than the median (1st quartile) of the applicable Broadridge expense universe (based on Broadridge data provided as of December 31, 2017, and analyzing Broadridge expense universe Class A (net) expenses less any applicable 12b-1 fees) (“Broadridge Universe Expenses”). The Board also reviewed data comparing each share class’s total (net) operating expenses to the applicable Broadridge Universe Expenses. The Board noted that the expense limitations agreed to by DIMA were expected to help the Fund’s total (net) operating expenses remain competitive. The Board considered the Fund’s management fee rate as compared to fees charged by DIMA to a comparable DWS U.S. registered fund (“DWS Funds”) and considered differences between the Fund and the comparable DWS Fund. The information requested by the Board as part of its review of fees and expenses also included information about institutional accounts (including any sub-advised funds and accounts) and funds offered primarily to European investors (“DWS Europe Funds”) managed by DWS Group. The Board noted that DIMA indicated that DWS Group does not manage any institutional accounts or DWS Europe Funds comparable to the Fund.
On the basis of the information provided, the Board concluded that management fees were reasonable and appropriate in light of the nature, quality and extent of services provided by DIMA and DAAM Global.
| 68 | | | DWS Global Income Builder Fund |
Table of Contents
Profitability. The Board reviewed detailed information regarding revenues received by DIMA under the Agreement. The Board considered the estimated costs to DIMA, and pre-tax profits realized by DIMA, from advising the DWS Funds, as well as estimates of the pre-tax profits attributable to managing the Fund in particular. The Board also received information regarding the estimated enterprise-wide profitability of DIMA and its affiliates with respect to all fund services in totality and by fund. The Board and the Fee Consultant reviewed DIMA’s methodology in allocating its costs to the management of the Fund. Based on the information provided, the Board concluded that the pre-tax profits realized by DIMA in connection with the management of the Fund were not unreasonable. The Board also reviewed certain publicly available information regarding the profitability of certain similar investment management firms. The Board noted that, while information regarding the profitability of such firms is limited (and in some cases is not necessarily prepared on a comparable basis), DIMA and its affiliates’ overall profitability with respect to the DWS Funds (after taking into account distribution and other services provided to the funds by DIMA and its affiliates) was lower than the overall profitability levels of most comparable firms for which such data was available.
Economies of Scale. The Board considered whether there are economies of scale with respect to the management of the Fund and whether the Fund benefits from any economies of scale. The Board noted that the Fund’s investment management fee schedule includes fee breakpoints. The Board concluded that the Fund’s fee schedule represents an appropriate sharing between the Fund and DIMA of such economies of scale as may exist in the management of the Fund at current asset levels.
Other Benefits to DIMA and Its Affiliates. The Board also considered the character and amount of other incidental or “fall-out” benefits received by DIMA and its affiliates, including any fees received by DIMA for administrative services provided to the Fund, any fees received by an affiliate of DIMA for transfer agency services provided to the Fund and any fees received by an affiliate of DIMA for distribution services. The Board also considered benefits to DIMA related to brokerage and soft-dollar allocations, including allocating brokerage to pay for research generated by parties other than the executing broker dealers, which pertain primarily to funds investing in equity securities. In addition, the Board considered the incidental public relations benefits to DIMA related to DWS Funds advertising and cross-selling opportunities among DIMA products and services. The Board considered these benefits in reaching its conclusion that the Fund’s management fees were reasonable.
Compliance. The Board considered the significant attention and resources dedicated by DIMA to its compliance processes in recent years. The Board noted in particular (i) the experience, seniority and time
| DWS Global Income Builder Fund | | | 69 |
Table of Contents
commitment of the individuals serving as DIMA’s and the Fund’s chief compliance officers and (ii) the substantial commitment of resources by DIMA and its affiliates to compliance matters, including the retention of compliance personnel.
Based on all of the information considered and the conclusions reached, the Board unanimously determined that the continuation of the Agreements is in the best interests of the Fund. In making this determination, the Board did not give particular weight to any single factor identified above. The Board considered these factors over the course of numerous meetings, certain of which were in executive session with only the Independent Trustees and counsel present. It is possible that individual Independent Trustees may have weighed these factors differently in reaching their individual decisions to approve the continuation of the Agreements.
| 70 | | | DWS Global Income Builder Fund |
Table of Contents
| For More Information | The automated telephone system allows you to access personalized account information and obtain information on other DWS funds using either your voice or your telephone keypad. Certain account types within Classes A, C and S also have the ability to purchase, exchange or redeem shares using this system.
For more information, contact your financial representative. You may also access our automated telephone system or speak with a Shareholder Service representative by calling:
(800)728-3337 | |
| Web Site | dws.com
View your account transactions and balances, trade shares, monitor your asset allocation, subscribe to fund and account updates bye-mail, and change your address, 24 hours a day.
Obtain prospectuses and applications,news about DWS funds, insight from DWS economists and investment specialists and access to DWS fund account information. | |
| Written Correspondence | DWS
PO Box 219151 Kansas City, MO64121-9151 | |
| Proxy Voting | The Fund’s policies and procedures for voting proxies for portfolio securities and information about how the Fund voted proxies related to its portfolio securities during the most recent12-month period ended June 30 are available on our Web site —dws.com/en-us/resources/proxy-voting — or on the SEC’s Web site — sec.gov. To obtain a written copy of the Fund’s policies and procedures without charge, upon request, call us toll free at(800) 728-3337. | |
| Portfolio Holdings | Following the Fund’s fiscal first and thirdquarter-end, a complete portfolio holdings listing is filed with the SEC on FormN-Q or Form N-PORT (available for filings after March 31, 2019). The Fund’s Form N-Q or Form N-PORT will be available on the SEC’s Web site at sec.gov. The Fund’s portfolio holdings are also posted on dws.com from time to time. Please see the Fund’s current prospectus for more information. | |
| Principal Underwriter | If you have questions, comments or complaints, contact:
DWS Distributors, Inc.
222 South Riverside Plaza Chicago, IL60606-5808 (800)621-1148 |
| DWS Global Income Builder Fund | | | 71 |
Table of Contents
| Investment Management | DWS Investment Management Americas, Inc. (“DIMA” or the “Advisor”), which is part of the DWS Group GmbH & Co. KGaA (“DWS Group”), is the investment advisor for the Fund. DIMA and its predecessors have more than 90 years of experience managing mutual funds and DIMA provides a full range of investment advisory services to both institutional and retail clients. DIMA is an indirect, wholly owned subsidiary of DWS Group.
DWS Group is a global organization that offers a wide range of investing expertise and resources, including hundreds of portfolio managers and analysts and an office network that reaches the world’s major investment centers. This well-resourced global investment platform brings together a wide variety of experience and investment insight across industries, regions, asset classes and investing styles. | |||||||
| Class A | Class C | Class S | Institutional Class | |||||
| Nasdaq Symbol | KTRAX | KTRCX | KTRSX | KTRIX | ||||
| CUSIP Number | 25159K 820 | 25159K 796 | 25159K 788 | 25159K 770 | ||||
| Fund Number | 002 | 302 | 2033 | 1402 | ||||
| For shareholders of Class R6 | ||||||||
| Automated Information Line | DWS/Ascensus Plan Access (800)728-3337
24-hour access to your retirement plan account. | |||||||
| Web Site | dws.com
Obtain prospectuses and applications,news about DWS funds, insight from DWS economists and investment specialists and access to DWS fund account information.
Log in/register to manage retirement account assets at https://www.mykplan.com/participantsecure_net/login.aspx. | |||||||
| For More Information | (800)728-3337
To speak with a service representative. | |||||||
| Written Correspondence | DWS Service Company
222 South Riverside Plaza Chicago, IL60606-5806 | |||||||
| Class R6 | ||||||||
| Nasdaq Symbol | KTRZX |
|
|
| ||||
| CUSIP Number | 25159K 721 |
|
|
| ||||
| Fund Number | 1633 |
|
|
| ||||
| 72 | | | DWS Global Income Builder Fund |
Table of Contents
| FACTS | What Does DWS Do With Your Personal Information? | |
| Why? | Financial companies choose how they share your personal information. Federal law gives consumers the right to limit some but not all sharing. Federal law also requires us to tell you how we collect, share and protect your personal information. Please read this notice carefully to understand what we do. | |
| What? | The types of personal information we collect and share can include:
– Social Security number
– Account balances
– Purchase and transaction history
– Bank account information
– Contact information such as mailing address,e-mail address and telephone number | |
| How? | All financial companies need to share customers’ personal information to run their everyday business. In the section below, we list the reasons financial companies can share their customers’ personal information, the reasons DWS chooses to share and whether you can limit this sharing. | |
| Reasons we can share your personal information | Does DWS share? | Can you limit this sharing? | ||
| For our everyday business purposes — such as to process your transactions, maintain your account(s), respond to court orders or legal investigations | Yes | No | ||
| For our marketing purposes —to offer our products and services to you | Yes | No | ||
| For joint marketing with other financial companies | No | We do not share | ||
| For our affiliates’ everyday businesspurposes —information about your transactions and experiences | No | We do not share | ||
| For our affiliates’ everyday businesspurposes —information about your creditworthiness | No | We do not share | ||
| Fornon-affiliates to market to you | No | We do not share | ||
| Questions? | Call (800)728-3337 ore-mail us at service@dws.com |
| DWS Global Income Builder Fund | | | 73 |
Table of Contents
| ||
| Who we are | ||
| Who is providing this notice? | DWS Distributors, Inc; DWS Investment Management Americas, Inc.; DWS Trust Company; the DWS Funds | |
| What we do | ||
| How does DWS protect my personal information? | To protect your personal information from unauthorized access and use, we use security measures that comply with federal law. These measures include computer safeguards and secured files and buildings. | |
| How does DWS collect my personal information? | We collect your personal information, for example, when you:
– open an account
– give us your contact information
– provide bank account information for ACH or wire transactions
– tell us where to send money
– seek advice about your investments | |
| Why can’t I limit all sharing? | Federal law gives you the right to limit only
– sharing for affiliates’ everyday business purposes
– information about your creditworthiness
– affiliates from using your information to market to you
– sharing fornon-affiliates to market to you
State laws and individual companies may give you additional rights to limit sharing. | |
| Definitions | ||
| Affiliates | Companies related by common ownership or control. They can be financial ornon-financial companies. Our affiliates include financial companies with the DWS or Deutsche Bank (“DB”) name, such as DB AG Frankfurt. | |
| Non-affiliates | Companies not related by common ownership or control. They can be financial andnon-financial companies.
Non-affiliates we share with include account service providers, service quality monitoring services, mailing service providers and verification services to help in the fight against money laundering and fraud. | |
| Joint marketing | A formal agreement betweennon-affiliated financial companies that together market financial products or services to you. DWS does not jointly market. | |
Rev. 3/2019
| 74 | | | DWS Global Income Builder Fund |
Table of Contents
Notes
Table of Contents
Notes
Table of Contents
Notes
Table of Contents
Notes
Table of Contents
Notes
Table of Contents
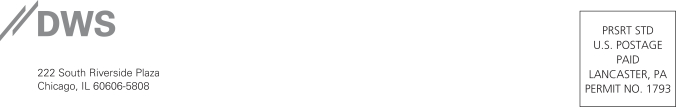
DGIBF-3
(R-027564-8 6/19)
| ITEM 2. | CODE OF ETHICS | |
| Not applicable. | ||
| ITEM 3. | AUDIT COMMITTEE FINANCIAL EXPERT | |
| Not applicable | ||
| ITEM 4. | PRINCIPAL ACCOUNTANT FEES AND SERVICES | |
| Not applicable | ||
| ITEM 5. | AUDIT COMMITTEE OF LISTED REGISTRANTS | |
| Not applicable | ||
| ITEM 6. | SCHEDULE OF INVESTMENTS | |
| Not applicable | ||
| ITEM 7. | DISCLOSURE OF PROXY VOTING POLICIES AND PROCEDURES FOR CLOSED-END MANAGEMENT INVESTMENT COMPANIES | |
| Not applicable | ||
| ITEM 8. | PORTFOLIO MANAGERS OF CLOSED-END MANAGEMENT INVESTMENT COMPANIES | |
| Not applicable | ||
| ITEM 9. | PURCHASES OF EQUITY SECURITIES BY CLOSED-END MANAGEMENT INVESTMENT COMPANY AND AFFILIATED PURCHASERS | |
| Not applicable | ||
| ITEM 10. | SUBMISSION OF MATTERS TO A VOTE OF SECURITY HOLDERS | |
| There were no material changes to the procedures by which shareholders may recommend nominees to the Fund’s Board. The primary function of the Nominating and Governance Committee is to identify and recommend individuals for membership on the Board and oversee the administration of the Board Governance Guidelines. Shareholders may recommend candidates for Board positions by forwarding their correspondence by U.S. mail or courier service to Keith R. Fox, DWS Funds Board Chair, c/o Thomas R. Hiller, Ropes & Gray LLP, Prudential Tower, 800 Boylston Street, Boston, MA 02199-3600. | ||
| ITEM 11. | CONTROLS AND PROCEDURES | |
| (a) | The Chief Executive and Financial Officers concluded that the Registrant’s Disclosure Controls and Procedures are effective based on the evaluation of the Disclosure Controls and Procedures as of a date within 90 days of the filing date of this report. | |
| (b) | There have been no changes in the registrant’s internal control over financial reporting that occurred during the second fiscal quarter of the period covered by this report that has materially affected, or is reasonably likely to materially affect, the registrant’s internal controls over financial reporting. | |
| ITEM 12. | Disclosure of Securities Lending Activities for Closed-End Management Investment Companies. | |
| Not applicable | ||
| ITEM 13. | EXHIBITS | |
| (a)(1) | Not applicable | |
| (a)(2) | Certification pursuant to Rule 30a-2(a) under the Investment Company Act of 1940 (17 CFR 270.30a-2(a)) is filed and attached hereto as Exhibit 99.CERT. | |
| (b) | Certification pursuant to Rule 30a-2(b) under the Investment Company Act of 1940 (17 CFR 270.30a-2(b)) is furnished and attached hereto as Exhibit 99.906CERT. | |
SIGNATURES
Pursuant to the requirements of the Securities Exchange Act of 1934 and the Investment Company Act of 1940, the registrant has duly caused this report to be signed on its behalf by the undersigned, thereunto duly authorized.
| Registrant: | DWS Global Income Builder Fund, a series of Deutsche DWS Market Trust |
| By: | /s/Hepsen Uzcan Hepsen Uzcan President |
| Date: | 7/2/2019 |
Pursuant to the requirements of the Securities Exchange Act of 1934 and the Investment Company Act of 1940, this report has been signed below by the following persons on behalf of the registrant and in the capacities and on the dates indicated.
| By: | /s/Hepsen Uzcan Hepsen Uzcan President |
| Date: | 7/2/2019 |
| By: | /s/Diane Kenneally Diane Kenneally Chief Financial Officer and Treasurer |
| Date: | 7/2/2019 |