UNITED STATES
SECURITIES AND EXCHANGE COMMISSION
WASHINGTON, D. C. 20549
FORM N-CSR
Investment Company Act file number: 811-01236
Deutsche DWS Market Trust
(Exact Name of Registrant as Specified in Charter)
875 Third Avenue
New York, NY 10022-6225
(Address of Principal Executive Offices) (Zip Code)
Registrant’s Telephone Number, including Area Code: (212) 454-4500
Diane Kenneally
100 Summer Street
Boston, MA 02110
(Name and Address of Agent for Service)
| Date of fiscal year end: | 10/31 |
| Date of reporting period: | 10/31/2020 |
| ITEM 1. | REPORT TO STOCKHOLDERS |

October 31, 2020
Annual Report
to Shareholders
DWS Global Income Builder Fund
Beginning on January 1, 2021, as permitted by regulations adopted by the Securities and Exchange Commission, paper copies of the Fund’s annual and semiannual shareholder reports will no longer be sent by mail, unless you specifically request paper copies of the reports. Instead, the reports will be made available on the Fund’s Web site (dws.com), and you will be notified by mail each time a report is posted and provided with a Web site link to access the report.
If you already elected to receive shareholder reports electronically, you will not be affected by this change and you need not take any action. You may elect to receive shareholder reports and other communications from the Fund electronically anytime by contacting your financial intermediary (such as a broker-dealer or bank), or if you are a direct investor, by calling (800) 728-3337 or sending an email request to service@dws.com.
You may elect to receive all future reports in paper free of charge. If you invest through a financial intermediary, you can contact your financial intermediary to request that you continue to receive paper copies of your shareholder reports. If you invest directly with the Fund, you can call (800) 728-3337 or send an email request to service@dws.com to continue receiving paper copies of your shareholder reports. Your election to receive reports in paper will apply to all funds held in your account if you invest through your financial intermediary or all funds held with DWS if you invest directly with the Fund.

This report must be preceded or accompanied by a prospectus. To obtain a summary prospectus, if available, or prospectus for any of our funds, refer to the Account Management Resources information provided in the back of this booklet. We advise you to consider the Fund’s objectives, risks, charges and expenses carefully before investing. The summary prospectus and prospectus contain this and other important information about the Fund. Please read the prospectus carefully before you invest.
Although allocation among different asset categories generally limits risk, portfolio management may favor an asset category that underperforms other assets or markets as a whole. Stocks may decline in value. Bond investments are subject to interest-rate, credit, liquidity and market risks to varying degrees. When interest rates rise, bond prices generally fall. Credit risk refers to the ability of an issuer to make timely payments of principal and interest. Investing in foreign securities presents certain risks, such as currency fluctuations, political and economic changes, and market risks. Emerging markets tend to be more volatile and less liquid than the markets of more mature economies, and generally have less diverse and less mature economic structures and less stable political systems than those of developed countries. Investing in derivatives entails special risks relating to liquidity, leverage and credit that may reduce returns and/or increased volatility. The Fund may lend securities to approved institutions. Please read the prospectus for details.
War, terrorism, economic uncertainty, trade disputes, public health crises (including the recent pandemic spread of the novel coronavirus) and related geopolitical events could lead to increased market volatility, disruption to U.S. and world economies and markets and may have significant adverse effects on the Fund and its investments.
The brand DWS represents DWS Group GmbH & Co. KGaA and any of its subsidiaries such as DWS Distributors, Inc. which offers investment products or DWS Investment Management Americas, Inc. and RREEF America L.L.C. which offer advisory services.
NOT FDIC/NCUA INSURED NO BANK GUARANTEE MAY LOSE VALUE
NOT A DEPOSIT NOT INSURED BY ANY FEDERAL GOVERNMENT AGENCY
| 2 | | | DWS Global Income Builder Fund |
Dear Shareholder:
The economic recovery from the COVID-19 pandemic proceeds, but the pace is moderating.
The most dynamic part of the recovery — the bounce back from lockdown — is likely to be behind us. Now a more arduous phase is beginning, in which incremental improvements will most probably be smaller. Some repercussions of the pandemic might only become apparent now, such as bankruptcies among smaller companies. While setbacks can be expected, we believe the overall direction of the economy should remain upward — provided there is no second, large-scale lockdown.
Along with an unprecedented slump in economic activity, we have seen unprecedented rescue packages through monetary and fiscal policy. DWS’s CIO Office believes accommodative monetary policy and very low interest rates could be with us for much longer. With little upside potential for wages, weak demand and a drastic under-utilization of capacities, we still see very low inflation rates.
In the coming months, we expect limited market upside taking into consideration that risks that are already on the horizon could provoke markets corrections. Increased market volatility could be fueled by a variety of events: the potential escalation in the U.S.-Chinese technology dispute; setbacks in the fight against COVID-19; failure to reach an agreement on the U.S. stimulus package; or events in the aftermath of the November elections.
While companies and societies improve their coexistence with the virus, not all sectors will benefit equally. For this reason, we believe that active management, with its close monitoring of developments, is critical. We believe that the close interaction between our portfolio managers and our CIO Office — which synthesizes the views of more than 900 DWS economists, analysts and investment professionals around the world — positions us to make strategic and tactical decisions.
We appreciate your trust and welcome the opportunity to help you navigate these unusual times. For ongoing updates to our market and economic outlook, please visit the ‘Insights’ section of dws.com.
Best regards,
 |
Hepsen Uzcan
President, DWS Funds |

Assumptions, estimates and opinions contained in this document constitute our judgment as of the date of the document and are subject to change without notice. Any projections are based on a number of assumptions as to market conditions and there can be no guarantee that any projected results will be achieved. Past performance is not a guarantee of future results.
| DWS Global Income Builder Fund | | | 3 |
| Portfolio Management Review | (Unaudited) |
Market Overview and Fund Performance
All performance information below is historical and does not guarantee future results. Returns shown are for Class A shares, unadjusted for sales charges. Investment return and principal fluctuate, so your shares may be worth more or less when redeemed. Current performance may differ from performance data shown. Please visit dws.com for the most recent month-end performance of all share classes. Fund performance includes reinvestment of all distributions. Unadjusted returns do not reflect sales charges and would have been lower if they had. Please refer to pages 10 through 13 for more complete performance information.
Investment Strategy
Portfolio management seeks to maximize risk adjusted returns by allocating the Fund’s assets among various asset categories. Portfolio management periodically reviews the fund’s allocations and may adjust them based on current or anticipated market conditions or to manage risk consistent with the Fund’s overall investment strategy.
Within each asset category, portfolio management uses one or more investment strategies for selecting equity and debt securities. Each investment strategy is managed by a team that specializes in a particular asset category, and that may use a variety of quantitative and qualitative techniques. The portfolio management teams utilize in-house research and resources to determine suitability of specific securities and use sector specialists to determine relative value within each relevant sector.
Examples of the Fund’s asset categories are U.S. and foreign equity of any size and style (including emerging-market equity), U.S. and foreign fixed income of any credit quality (including emerging-market bonds and inflation-indexed bonds), and alternative assets. Some asset categories may be represented by exchange-traded funds (ETFs).
Fund Performance
DWS Global Income Builder Fund gained 0.07% during the 12-month period that ended on October 31, 2020. The Fund underperformed the 6.30% return of its benchmark, the Blended Index 60/40. The index consists of a blend of 60% MSCI All Country World Index and 40% Bloomberg Barclays U.S. Universal Index. The two indexes returned 4.89% and 5.96%, respectively.
The Fund outperformed the -2.08% average return of its Morningstar peer group, World Allocation Funds, in the 12-month period. In addition, it outpaced its peers in the five- and 10-year intervals ended October 31, 2020. We believe the Fund’s favorable showing versus the peer group
| 4 | | | DWS Global Income Builder Fund |
helps illustrate the value of our active strategy. Rather than simply using a static approach, we actively adjust the Fund’s allocations in order to capitalize on values as they emerge. We believe this multifaceted strategy, which seeks to take advantage of opportunities across the full spectrum of the world financial markets, can help the Fund achieve its goals of positive relative performance and above-average income.
“We believe our multifaceted strategy can help the Fund continue to capitalize on opportunities across the global financial markets, while also guarding against the possibility of ongoing volatility.”
Market Overview
The past year brought shifting fundamentals and unusually high volatility across the global financial markets. The reporting period began on a positive note, thanks to the combination of steady economic growth, robust corporate profits, supportive U.S. Federal Reserve (Fed) policy, and progress in the U.S.-China trade dispute. Together, these factors led to healthy performance for higher-risk assets. The investment backdrop changed considerably in mid-February, however, once it became apparent that COVID-19 was spreading across the globe and was likely to have a sizable impact on the economy. Investors responded to these unprecedented circumstances by moving out of riskier asset classes toward relative “safe havens” such as U.S. Treasuries.
The investment backdrop took another dramatic turn in late March once it became clear that the Fed and other world central banks would take any steps necessary to support the economy and financial markets. In the United States, the Fed cut short-term interest rates to near zero and instituted a number of other measures to promote growth and improve market liquidity. The U.S. government augmented the Fed’s actions by passing an economic stimulus package worth over $3 trillion. These factors helped restore investor confidence and touched off a lengthy rally in stocks and the higher-risk segments of the bond market.
The markets started to lose steam in early September, when a resurgence in COVID-19 cases in the United States and Europe began to raise doubts that the nascent economic recovery would continue. Worries about the U.S. elections further weighed on sentiment throughout the
| DWS Global Income Builder Fund | | | 5 |
autumn. These factors led to modest weakness for stocks in this time, but the credit-sensitive segments of the fixed-income market were largely unaffected.
Global equities registered a positive return for the full, 12-month period. The United States outpaced the developed international markets, and the growth style strongly outperformed value. Bonds also delivered gains, led by strength in U.S. Treasuries and other higher-quality market segments.
Contributors and Detractors
The Fund’s underperformance in relation to the benchmark was largely the result of our emphasis on dividend-paying, value-oriented stocks within the equity portfolio. The universe of higher-yielding stocks lagged the equity benchmark by a wide margin, reflecting the category’s lower weighting in mega-cap technology stocks and larger allocations to defensive sectors that underperformed. While this aspect of our strategy detracted in the past 12 months, we believe it is consistent with the Fund’s objective of delivering income over the long term.
The shortfall from the Fund’s income orientation was offset to some extent by our decisions with respect to geographic positioning. Specifically, an overweight in the emerging markets and an underweight in Europe contributed to relative performance.
An allocation to alternative investments — a group that includes convertible securities, preferred stocks and real estate investment trusts — also contributed positively, largely as a result of the strong showing for convertibles. We believe these categories offer diversification and a source of yield with lower interest-rate sensitivity than bonds.
The Fund’s high-level allocation between equities and bonds, which is typically a key driver of performance, did not have a meaningful effect on 12-month results given the relatively close returns of the two categories.
The fixed-income portfolio outpaced the Bloomberg Barclays U.S. Universal Index and made a positive contribution to relative performance. Here, we added value through security selection in both investment-grade corporates and high yield. In addition, we used derivatives (specifically, credit default swaps) to hedge a portion of the Fund’s exposure to credit risk in early 2020. This strategy contributed by cushioning some of the effect of the sharp downturn in the credit sectors in February and March. Conversely,
| 6 | | | DWS Global Income Builder Fund |
the Fund lost some relative performance through underweight positions in U.S. Treasuries and investment-grade corporate bonds.
The Fund used derivatives during the past 12 months. On the equity side, we used futures on equity indexes to achieve our desired weightings in a more efficient manner than buying and selling individual securities. In the bond portfolio, we used credit default swaps, as noted previously, as well as derivatives to manage the currency exposure of certain positions in foreign bonds. We also used interest-rate futures and swaps to manage the Fund’s duration. In the aggregate, our use of derivatives was a net contributor. Derivatives are used to achieve the fund’s risk and return objectives and should be evaluated within the context of the entire portfolio rather than as a standalone strategy.
Outlook and Positioning
We actively adjusted the Fund’s risk profile in response to the shifting environment. We established a defensive posture in late 2019, as we believed expectations for both economic growth and corporate earnings were too high. Although we didn’t anticipate the emergence of COVID-19, the defensive approach proved helpful once the markets turned lower in the first quarter of 2020. We continued to reduce risk during the downturn, and then we gradually increased it over the span from early April through the end of the period. Nevertheless, the Fund finished October with an equity allocation of 53.6% — an underweight position relative to the 60/40 benchmark. The combination of depressed earnings estimates and rising stock prices from late March onward resulted in a meaningful increase in valuations. Part of this disconnect stemmed from investors’ increased willingness to “look across the valley” toward the time when the effects of the pandemic have eased and earnings have returned to normalized levels. Still, it may also indicate higher potential risk for equities — a factor that forms the underpinning for our somewhat cautious approach.
On the fixed income side, we continue to see the best opportunities in the credit sectors. However, we believe an intense focus on individual security selection remains paramount given the disruptions in the economy.
Overall, we believe our multifaceted strategy can help the Fund capitalize on opportunities across the global financial markets, while also guarding against the possibility of ongoing volatility.
| DWS Global Income Builder Fund | | | 7 |
Portfolio Management Team
Dokyoung Lee, CFA, Director
Portfolio Manager of the Fund. Began managing the Fund in 2018.
| – | Joined DWS in 2018 with 24 years of industry experience; previously, worked as Head of Research and Portfolio Manager in the Global Multi-Asset Group at Oppenheimer Funds, and in research and portfolio management roles at AllianceBernstein. |
| – | Americas Multi-Asset Head: New York. |
| – | BSE, Princeton University. |
Di Kumble, CFA, Managing Director
Portfolio Manager of the Fund. Began managing the Fund in 2017.
| – | Joined DWS in 2003 with seven years of industry experience. Prior to joining, she served as a Portfolio Manager at Graham Capital Management. Previously, she worked as a Quantitative Strategist at ITG Inc. and Morgan Stanley. |
| – | Senior Portfolio Manager, Head of Tax Managed Equities: New York. |
| – | BS, Beijing University; PhD in Chemistry, Princeton University. |
Thomas M. Farina, CFA, Managing Director
Portfolio Manager of the Fund. Began managing the Fund in 2019.
| – | Joined DWS in 2006 with 12 years of industry experience. Head of Investment Grade Corporate Credit since 2013. Prior to joining, he held roles at Merrill Lynch Investment Management, Greenwich NatWest and at DnB Asset Management. He began his career as a Ratings Analyst at Standard & Poor’s. |
| – | Senior Portfolio Manager and Co-Head of US Credit: New York. |
| – | BA and MA in Economics, State University of New York at Albany. |
Scott Agi, CFA, Director
Portfolio Manager of the Fund. Began managing the Fund in 2019.
| – | Joined DWS in 2006 with eight years of industry experience. Prior to his current role, he served as a Sector head for US Rates and Mortgage Backed Securities. Before joining DWS, he served as an MBS Analyst at Bear Stearns, in Portfolio Analytics at TimesSquare Capital Management and as a Quantitative Analyst in the Municipal Bond Division at The Vanguard Group. |
| – | Co-Head of US Rates and Structured Finance: New York. |
| – | BS in Finance, Albright College. |
Darwei Kung, Managing Director
Portfolio Manager of the Fund. Began managing the Fund in 2015.
| – | Joined DWS in 2006; previously has worked as a Director, Engineering and Business Development at Calpoint LLC from 2001–2004. |
| – | Portfolio Manager: New York. |
| – | BS and MS, University of Washington, Seattle; MS and MBA, Carnegie Mellon University. |
The views expressed reflect those of the portfolio management team only through the end of the period of the report as stated on the cover. The management team's views are subject to change at any time based on market and other conditions and should not be construed as a recommendation. Past performance is no guarantee of future results. Current and future portfolio holdings are subject to risk.
| 8 | | | DWS Global Income Builder Fund |
Terms to Know
Blended Index 60/40 consists of a blend of 60% MSCI All Country World Index and 40% Bloomberg Barclays U.S. Universal Index.
MSCI All Country World Index is an unmanaged equity index which captures large and mid-capitalization representation across 23 developed markets and 26 emerging markets countries. It covers approximately 85% of the global investable equity opportunity set.
Bloomberg Barclays U.S. Universal Index measures the performance of U.S. dollar-denominated taxable bonds that are rated either investment grade or high yield. The index includes U.S. Treasury bonds, investment-grade and high yield U.S. corporate bonds, mortgage-backed securities, and Eurodollar bonds.
Morningstar World Allocation portfolios seek to provide both capital appreciation and income by investing in three major areas: stocks, bonds, and cash. The average category returns for the one-, five- and 10-year periods ending October 31, 2020 were -2.08%, 3.97%, and 4.61%, respectively.
Index returns do not reflect any fees or expenses and it is not possible to invest directly into an index.
Contribution and detraction incorporate both a stock’s total return and its weighting in the Fund.
Overweight means the fund holds a higher weighting in a given sector or security than the benchmark. Underweight means the fund holds a lower weighting.
Convertible securities are bonds that can be exchanged for equity at a pre-stated price. Convertibles generally offer higher income than is available from a common stock, but more appreciation potential than bonds.
Derivatives are contracts whose values can be based on a variety of instruments including indices, currencies or securities. They can be utilized for a variety of reasons including for hedging purposes; for risk management; for non-hedging purposes to seek to enhance potential gains; or as a substitute for direct investment in a particular asset class or to keep cash on hand to meet shareholder redemptions. Derivatives involve leverage and can therefore enhance returns or provide portfolio protection, but they can also experience significant losses if the underlying security moves contrary to the investor’s expectations.
Futures contracts are contractual agreements to buy or sell a particular commodity or financial instrument at a pre-determined price in the future.
Duration measures the sensitivity of the price of a bond or bond fund to a change in interest rates.
A swap is a derivative in which two counterparties exchange cash flows of one party’s financial instrument for those of the other party’s financial instrument for a set period of time. The prices of credit default swaps, which are designed to offset credit risk, typically move in the opposite direction of the index or security they track.
| DWS Global Income Builder Fund | | | 9 |
| Performance Summary | October 31, 2020 (Unaudited) |
| Class A | 1-Year | 5-Year | 10-Year | |||||||||
| Average Annual Total Returns as of 10/31/20 |
| |||||||||||
| Unadjusted for Sales Charge | 0.07% | 5.73% | 5.59% | |||||||||
| Adjusted for the Maximum Sales Charge (max 5.75% load) | –5.68% | 4.49% | 4.97% | |||||||||
| MSCI All Country World Index† | 4.89% | 8.11% | 7.90% | |||||||||
| Blended Index 60/40†† | 6.30% | 6.93% | 6.56% | |||||||||
| Bloomberg Barclays U.S. Universal Index††† | 5.96% | 4.35% | 3.83% | |||||||||
| S&P® Target Risk Moderate Index†††† | 4.95% | 5.94% | 5.71% | |||||||||
| Blended Index 50/50††††† | –1.60% | 4.53% | 5.17% | |||||||||
| Class C | 1-Year | 5-Year | 10-Year | |||||||||
| Average Annual Total Returns as of 10/31/20 |
| |||||||||||
| Unadjusted for Sales Charge | –0.82% | 4.87% | 4.74% | |||||||||
| Adjusted for the Maximum Sales Charge (max 1.00% CDSC) | –0.82% | 4.87% | 4.74% | |||||||||
| MSCI All Country World Index† | 4.89% | 8.11% | 7.90% | |||||||||
| Blended Index 60/40†† | 6.30% | 6.93% | 6.56% | |||||||||
| Bloomberg Barclays U.S. Universal Index††† | 5.96% | 4.35% | 3.83% | |||||||||
| S&P® Target Risk Moderate Index†††† | 4.95% | 5.94% | 5.71% | |||||||||
| Blended Index 50/50††††† | –1.60% | 4.53% | 5.17% | |||||||||
| Class R6 | 1-Year | 5-Year | Life of Class* | |||||||||
| Average Annual Total Returns as of 10/31/20 |
| |||||||||||
| No Sales Charges | 0.30% | 6.04% | 3.93% | |||||||||
| MSCI All Country World Index† | 4.89% | 8.11% | 6.18% | |||||||||
| Blended Index 60/40†† | 6.30% | 6.93% | 5.48% | |||||||||
| Bloomberg Barclays U.S. Universal Index††† | 5.96% | 4.35% | 3.86% | |||||||||
| S&P® Target Risk Moderate Index†††† | 4.95% | 5.94% | 4.80% | |||||||||
| Blended Index 50/50††††† | –1.60% | 4.53% | 3.42% | |||||||||
| Class S | 1-Year | 5-Year | 10-Year | |||||||||
| Average Annual Total Returns as of 10/31/20 |
| |||||||||||
| No Sales Charges | 0.17% | 5.90% | 5.78% | |||||||||
| MSCI All Country World Index† | 4.89% | 8.11% | 7.90% | |||||||||
| Blended Index 60/40†† | 6.30% | 6.93% | 6.56% | |||||||||
| Bloomberg Barclays U.S. Universal Index††† | 5.96% | 4.35% | 3.83% | |||||||||
| S&P® Target Risk Moderate Index†††† | 4.95% | 5.94% | 5.71% | |||||||||
| Blended Index 50/50††††† | –1.60% | 4.53% | 5.17% | |||||||||
| 10 | | | DWS Global Income Builder Fund |
| Institutional Class | 1-Year | 5-Year | 10-Year | |||||||||
| Average Annual Total Returns as of 10/31/20 |
| |||||||||||
| No Sales Charges | 0.20% | 5.96% | 5.84% | |||||||||
| MSCI All Country World Index† | 4.89% | 8.11% | 7.90% | |||||||||
| Blended Index 60/40†† | 6.30% | 6.93% | 6.56% | |||||||||
| Bloomberg Barclays U.S. Universal Index††† | 5.96% | 4.35% | 3.83% | |||||||||
| S&P® Target Risk Moderate Index†††† | 4.95% | 5.94% | 5.71% | |||||||||
| Blended Index 50/50††††† | –1.60% | 4.53% | 5.17% | |||||||||
Performance in the Average Annual Total Returns table(s) above and the Growth of an Assumed $10,000 Investment line graph that follows is historical and does not guarantee future results. Investment return and principal fluctuate, so your shares may be worth more or less when redeemed. Current performance may differ from performance data shown. Please visit dws.com for the Fund’s most recent month-end performance. Fund performance includes reinvestment of all distributions. Unadjusted returns do not reflect sales charges and would have been lower if they had.
The gross expense ratios of the Fund, as stated in the fee table of the prospectus dated March 1, 2020 are 0.92%, 1.69%, 0.59%, 0.72% and 0.69% for Class A, Class C, Class R6, Class S and Institutional Class shares, respectively, and may differ from the expense ratios disclosed in the Financial Highlights tables in this report.
Index returns do not reflect any fees or expenses and it is not possible to invest directly into an index.
Performance figures do not reflect the deduction of taxes that a shareholder would pay on fund distributions or the redemption of fund shares.
Generally accepted accounting principles require adjustments to be made to the net assets of the Fund at period end for financial reporting purposes only, and as such, the total return based on the unadjusted net asset value per share may differ from the total return reported in the financial highlights.
| DWS Global Income Builder Fund | | | 11 |
Growth of an Assumed $10,000 Investment (Adjusted for Maximum Sales Charge) |
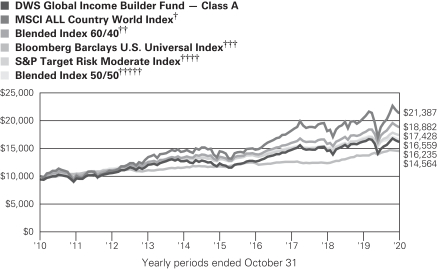
The Fund’s growth of an assumed $10,000 investment is adjusted for the maximum sales charge of 5.75%. This results in a net initial investment of $9,425.
The growth of $10,000 is cumulative.
Performance of other share classes will vary based on the sales charges and the fee structure of those classes.
| * | Class R6 shares commenced operations on August 25, 2014. The performance shown for the Blended Index is for the time period of August 31, 2014 through October 31, 2018, which is based on the performance period of the life of Class R6. |
| † | MSCI All Country World Index is an unmanaged equity index which captures large and mid-capitalization representation across 23 developed markets and 26 emerging markets countries. It covers approximately 85% of the global investable equity opportunity set. |
| †† | The Blended Index 60/40 consists of an equally weighted blend of 60% MSCI All Country World Index and 40% Bloomberg Barclays U.S. Universal Index. |
| ††† | Bloomberg Barclays U.S. Universal Index measures the performance of U.S. dollar-denominated taxable bonds that are rated either investment grade or high yield. The index includes U.S. Treasury bonds, investment-grade and high yield U.S. corporate bonds, mortgage-backed securities, and Eurodollar bonds. |
| ††† † | The S&P Target Risk Moderate Index offers significant exposure to fixed income, while also increasing opportunities for higher returns through equities. |
| †††† † | The Blended Index 50/50 consists of an equally weighted blend of 50% MSCI World High Dividend Yield Index and 50% Bloomberg Barclays U.S. Universal Index. |
On December 1, 2019, the MSCI All Country World Index has replaced the S&P Target Risk Moderate Index as the fund’s primary comparative broad-based securities market index. The Blended Index 60/40 and the Bloomberg Barclays U.S. Universal Index have replaced the Blended Index 50/50 as the additional secondary and tertiary comparative indexes, respectively. The Blended Index consists of an equally weighted blend of |
| 12 | | | DWS Global Income Builder Fund |
| 60% MSCI All Country World Index and 40% Bloomberg Barclays U.S. Universal index. The Advisor believes that the new indexes collectively better represent the fund’s investment strategy and overall strategic asset allocations and are therefore more suitable for performance comparison. |
| Class A | Class C | Class R6 | Class S | Institutional Class | ||||||||||||||||
| Net Asset Value | ||||||||||||||||||||
| 10/31/20 | $ | 9.26 | $ | 9.25 | $ | 9.24 | $ | 9.25 | $ | 9.24 | ||||||||||
| 10/31/19 | $ | 9.55 | $ | 9.55 | $ | 9.54 | $ | 9.55 | $ | 9.54 | ||||||||||
| Distribution Information as of 10/31/20 |
| |||||||||||||||||||
| Income Dividends, Twelve Months | $ | .28 | $ | .21 | $ | .31 | $ | .30 | $ | .30 | ||||||||||
| DWS Global Income Builder Fund | | | 13 |
| 14 | | | DWS Global Income Builder Fund |
Five Largest Equity Holdings at October 31, 2020 (6.4% of Net Assets) | Percent | |||||
| 1 | Apple, Inc. | 2.1% | ||||
Manufacturer of personal computers and communication solutions | ||||||
| 2 | Microsoft Corp. | 1.6% | ||||
Develops, manufactures, licenses, sells and supports software products | ||||||
| 3 | Amazon.com, Inc. | 1.4% | ||||
Online retailer offering a wide range of products | ||||||
| 4 | AT&T, Inc. | 0.8% | ||||
An integrated telecommunications company | ||||||
| 5 | Regions Financial Corp. | 0.5% | ||||
Operator of regional multi-bank holding company | ||||||
| Five Largest Fixed-Income Long-Term Securities at October 31, 2020 (8.6% of Net Assets) | Percent | |||||
| 1 | Federal National Mortgage Association | 4.9% | ||||
1.500%, 11/12/2050 | ||||||
| 2 | Benchmark Mortgage Trust | 1.2% | ||||
2.952%, 8/15/2057 | ||||||
| 3 | Flagship Credit Auto Trust | 0.9% | ||||
2.770%, 12/15/2025 | ||||||
| 4 | JPMorgan Mortgage Trust | 0.8% | ||||
3.500%, 5/25/2050 | ||||||
| 5 | Freddie Mac Structured Agency Credit Risk Debt Note | 0.8% | ||||
| 1.999%, 2/25/2050 | ||||||
Portfolio holdings and characteristics are subject to change.
For more complete details about the Fund’s investment portfolio, see page 16. A quarterly Fact Sheet is available on dws.com or upon request. Please see the Account Management Resources section on page 85 for contact information.
| DWS Global Income Builder Fund | | | 15 |
| Investment Portfolio | as of October 31, 2020 | |||
| Shares | Value ($) | |||||||
| Common Stocks 54.6% | ||||||||
| Communication Services 5.4% | ||||||||
Diversified Telecommunication Services 2.2% | ||||||||
AT&T, Inc. | 106,123 | 2,867,443 | ||||||
BCE, Inc. | 37,323 | 1,499,867 | ||||||
Deutsche Telekom AG (Registered) | 61,981 | 944,746 | ||||||
Koninklijke KPN NV | 299,720 | 809,539 | ||||||
Nippon Telegraph & Telephone Corp. | 52,500 | 1,101,724 | ||||||
Orange SA | 75,332 | 844,751 | ||||||
Singapore Telecommunications Ltd. | 341,200 | 509,985 | ||||||
Swisscom AG (Registered) | 1,689 | 859,325 | ||||||
Telefonica Brasil SA (ADR) (Preferred) | 89,300 | 657,248 | ||||||
Telenor ASA (a) | 65,753 | 1,013,889 | ||||||
Telia Co. AB | 272,650 | 1,045,069 | ||||||
TELUS Corp. | 59,562 | 1,018,406 | ||||||
Verizon Communications, Inc. | 36,533 | 2,082,016 | ||||||
|
| |||||||
| 15,254,008 | ||||||||
Entertainment 0.6% |
| |||||||
Activision Blizzard, Inc. | 6,700 | 507,391 | ||||||
NetEase, Inc. (ADR) | 17,245 | 1,496,693 | ||||||
Netflix, Inc.* | 2,500 | 1,189,350 | ||||||
Nintendo Co., Ltd. | 2,100 | 1,141,982 | ||||||
|
| |||||||
| 4,335,416 | ||||||||
Interactive Media & Services 0.9% |
| |||||||
Alphabet, Inc. “A”* | 400 | 646,444 | ||||||
Alphabet, Inc. “C”* | 460 | 745,665 | ||||||
Facebook, Inc. “A”* | 8,402 | 2,210,650 | ||||||
Tencent Holdings Ltd. (ADR) | 27,735 | 2,117,290 | ||||||
|
| |||||||
| 5,720,049 | ||||||||
Media 0.5% |
| |||||||
Charter Communications, Inc. “A”* | 1,797 | 1,085,064 | ||||||
Comcast Corp. “A” | 31,486 | 1,329,969 | ||||||
Interpublic Group of Companies, Inc. | 37,702 | 682,029 | ||||||
Omnicom Group, Inc. | 11,956 | 564,323 | ||||||
|
| |||||||
| 3,661,385 | ||||||||
Wireless Telecommunication Services 1.2% |
| |||||||
China Mobile Ltd. (ADR) | 60,603 | 1,862,330 | ||||||
KDDI Corp. | 37,400 | 1,001,911 | ||||||
Mobile TeleSystems PJSC (ADR) | 104,200 | 814,844 | ||||||
NTT DoCoMo, Inc. | 22,700 | 844,361 | ||||||
SoftBank Corp. | 153,800 | 1,783,823 | ||||||
The accompanying notes are an integral part of the financial statements.
| 16 | | | DWS Global Income Builder Fund |
| �� | Shares | Value ($) | ||||||
Vodafone Group PLC | 1,345,141 | 1,794,067 | ||||||
|
| |||||||
| 8,101,336 | ||||||||
| Consumer Discretionary 5.7% |
| |||||||
Auto Components 0.2% |
| |||||||
Bridgestone Corp. | 19,600 | 637,588 | ||||||
Denso Corp. | 18,000 | 836,508 | ||||||
|
| |||||||
| 1,474,096 | ||||||||
Automobiles 1.1% |
| |||||||
Bayerische Motoren Werke AG | 11,895 | 812,476 | ||||||
Honda Motor Co., Ltd. | 23,100 | 539,580 | ||||||
NIO, Inc. (ADR)* | 44,900 | 1,373,042 | ||||||
Porsche Automobil Holding SE (Preference) | 20,059 | 1,076,719 | ||||||
Subaru Corp. | 30,000 | 549,635 | ||||||
Tesla, Inc.* | 4,800 | 1,862,592 | ||||||
Toyota Motor Corp. | 19,100 | 1,244,827 | ||||||
|
| |||||||
| 7,458,871 | ||||||||
Diversified Consumer Services 0.2% |
| |||||||
GSX Techedu, Inc. (ADR)* (a) | 5,800 | 385,236 | ||||||
TAL Education Group (ADR)* | 11,749 | 780,839 | ||||||
|
| |||||||
| 1,166,075 | ||||||||
Hotels, Restaurants & Leisure 0.7% |
| |||||||
Evolution Gaming Group AB 144A | 7,785 | 578,332 | ||||||
Genting Singapore Ltd. | 1,404,400 | 664,007 | ||||||
McDonald’s Corp. | 3,600 | 766,800 | ||||||
Restaurant Brands International, Inc. | 10,100 | 524,824 | ||||||
Starbucks Corp. | 13,500 | 1,173,960 | ||||||
Yum! Brands, Inc. | 6,200 | 578,646 | ||||||
|
| |||||||
| 4,286,569 | ||||||||
Household Durables 0.5% |
| |||||||
Electrolux AB “B” | 39,056 | 881,447 | ||||||
Garmin Ltd. | 8,507 | 884,898 | ||||||
Newell Brands, Inc. | 61,500 | 1,086,090 | ||||||
Sekisui House Ltd. | 37,900 | 627,199 | ||||||
|
| |||||||
| 3,479,634 | ||||||||
Internet & Direct Marketing Retail 2.1% |
| |||||||
Alibaba Group Holding Ltd. (ADR)* | 6,093 | 1,856,476 | ||||||
Amazon.com, Inc.* | 3,117 | 9,463,680 | ||||||
JD.com, Inc. (ADR)* | 23,000 | 1,874,960 | ||||||
Pinduoduo, Inc. (ADR)* | 6,100 | 548,878 | ||||||
Wayfair, Inc. “A”* (a) | 2,200 | 545,666 | ||||||
|
| |||||||
| 14,289,660 | ||||||||
The accompanying notes are an integral part of the financial statements.
| DWS Global Income Builder Fund | | | 17 |
| Shares | Value ($) | |||||||
Multiline Retail 0.3% |
| |||||||
Target Corp. | 7,907 | 1,203,604 | ||||||
Wesfarmers Ltd. | 32,041 | 1,035,517 | ||||||
|
| |||||||
| 2,239,121 | ||||||||
Specialty Retail 0.6% |
| |||||||
Best Buy Co., Inc. | 8,700 | 970,485 | ||||||
Home Depot, Inc. | 7,150 | 1,906,976 | ||||||
Lowe’s Companies, Inc. | 7,900 | 1,248,990 | ||||||
|
| |||||||
| 4,126,451 | ||||||||
| Consumer Staples 3.5% |
| |||||||
Beverages 0.5% |
| |||||||
Coca-Cola Co. | 38,229 | 1,837,286 | ||||||
PepsiCo, Inc. | 13,598 | 1,812,477 | ||||||
|
| |||||||
| 3,649,763 | ||||||||
Food & Staples Retailing 0.9% |
| |||||||
Coles Group Ltd. | 59,670 | 745,950 | ||||||
Colruyt SA | 9,715 | 574,558 | ||||||
Koninklijke Ahold Delhaize NV | 33,921 | 931,471 | ||||||
Walgreens Boots Alliance, Inc. | 25,398 | 864,548 | ||||||
Walmart, Inc. | 9,100 | 1,262,625 | ||||||
Wm Morrison Supermarkets PLC | 352,540 | 744,064 | ||||||
Woolworths Group Ltd. | 29,394 | 787,235 | ||||||
|
| |||||||
| 5,910,451 | ||||||||
Food Products 1.0% |
| |||||||
Bunge Ltd. | 12,900 | 731,817 | ||||||
General Mills, Inc. | 15,703 | 928,362 | ||||||
Hormel Foods Corp. | 11,200 | 545,328 | ||||||
J M Smucker Co. | 6,763 | 758,809 | ||||||
Kellogg Co. | 12,799 | 804,929 | ||||||
Kraft Heinz Co. | 28,880 | 883,439 | ||||||
Nestle SA (Registered) | 15,582 | 1,752,956 | ||||||
WH Group Ltd. 144A | 948,000 | 748,400 | ||||||
|
| |||||||
| 7,154,040 | ||||||||
Household Products 0.5% |
| |||||||
Colgate-Palmolive Co. | 7,400 | 583,786 | ||||||
Kimberly-Clark Corp. | 6,222 | 824,975 | ||||||
Procter & Gamble Co. | 14,979 | 2,053,621 | ||||||
|
| |||||||
| 3,462,382 | ||||||||
Personal Products 0.3% |
| |||||||
Unilever NV (CVA) | 15,047 | 848,977 | ||||||
Unilever PLC | 15,868 | 903,566 | ||||||
|
| |||||||
| 1,752,543 | ||||||||
Tobacco 0.3% |
| |||||||
Philip Morris International, Inc. | 31,365 | 2,227,543 | ||||||
The accompanying notes are an integral part of the financial statements.
| 18 | | | DWS Global Income Builder Fund |
| Shares | Value ($) | |||||||
| Energy 0.8% |
| |||||||
Energy Equipment & Services 0.1% |
| |||||||
Baker Hughes Co. | 36,300 | 536,151 | ||||||
Oil, Gas & Consumable Fuels 0.7% |
| |||||||
BP PLC | 474,240 | 1,212,298 | ||||||
Chevron Corp. | 27,944 | 1,942,108 | ||||||
Phillips 66 | 17,700 | 825,882 | ||||||
TC Energy Corp. | 26,800 | 1,054,862 | ||||||
|
| |||||||
| 5,035,150 | ||||||||
| Financials 6.9% |
| |||||||
Banks 3.7% |
| |||||||
Bank of America Corp. | 30,000 | 711,000 | ||||||
Bank of Montreal | 17,600 | 1,047,968 | ||||||
Bank of Nova Scotia | 17,191 | 714,195 | ||||||
BOC Hong Kong Holdings Ltd. | 642,000 | 1,789,978 | ||||||
Canadian Imperial Bank of Commerce | 10,143 | 756,595 | ||||||
Citizens Financial Group, Inc. | 25,600 | 697,600 | ||||||
Commonwealth Bank of Australia | 26,180 | 1,267,788 | ||||||
DBS Group Holdings Ltd. | 97,200 | 1,452,434 | ||||||
DNB ASA* | 55,157 | 742,964 | ||||||
Fifth Third Bancorp. | 28,900 | 671,058 | ||||||
Hang Seng Bank Ltd. | 64,700 | 999,013 | ||||||
Huntington Bancshares, Inc. | 61,200 | 638,928 | ||||||
JPMorgan Chase & Co. | 11,470 | 1,124,519 | ||||||
Mitsubishi UFJ Financial Group, Inc. | 200,700 | 788,190 | ||||||
Mizuho Financial Group, Inc. | 92,560 | 1,138,964 | ||||||
Nordea Bank Abp* | 131,740 | 989,308 | ||||||
Oversea-Chinese Banking Corp., Ltd. | 161,700 | 997,095 | ||||||
PNC Financial Services Group, Inc. | 5,300 | 592,964 | ||||||
Regions Financial Corp. | 67,200 | 893,760 | ||||||
Royal Bank of Canada | 21,057 | 1,472,394 | ||||||
Sumitomo Mitsui Financial Group, Inc. | 43,500 | 1,202,651 | ||||||
Toronto-Dominion Bank | 27,480 | 1,212,395 | ||||||
Truist Financial Corp. | 16,086 | 677,542 | ||||||
U.S. Bancorp. | 24,300 | 946,485 | ||||||
United Overseas Bank Ltd. | 63,900 | 889,885 | ||||||
Westpac Banking Corp. | 59,805 | 754,753 | ||||||
|
| |||||||
| 25,170,426 | ||||||||
Capital Markets 0.9% |
| |||||||
3i Group PLC | 47,729 | 595,046 | ||||||
Apollo Global Management, Inc. | 11,400 | 420,204 | ||||||
BlackRock, Inc. | 1,400 | 838,894 | ||||||
Blackstone Group, Inc. “A” | 11,400 | 574,788 | ||||||
CME Group, Inc. | 4,022 | 606,196 | ||||||
The accompanying notes are an integral part of the financial statements.
| DWS Global Income Builder Fund | | | 19 |
| Shares | Value ($) | |||||||
Hong Kong Exchanges & Clearing Ltd. | 11,800 | 566,853 | ||||||
Magellan Financial Group Ltd. | 22,369 | 863,316 | ||||||
Partners Group Holding AG | 1,176 | 1,063,444 | ||||||
T. Rowe Price Group, Inc. | 7,400 | 937,284 | ||||||
|
| |||||||
| 6,466,025 | ||||||||
Insurance 2.3% |
| |||||||
Admiral Group PLC | 19,796 | 705,050 | ||||||
Allianz SE (Registered) | 7,140 | 1,256,402 | ||||||
Assicurazioni Generali SpA | 56,749 | 761,152 | ||||||
Baloise Holding AG (Registered) | 4,366 | 596,441 | ||||||
Chubb Ltd. | 4,507 | 585,504 | ||||||
Fidelity National Financial, Inc. | 17,515 | 548,044 | ||||||
Manulife Financial Corp. | 100,900 | 1,367,751 | ||||||
Medibank Private Ltd. | 380,074 | 713,204 | ||||||
MetLife, Inc. | 17,674 | 668,961 | ||||||
MS&AD Insurance Group Holdings, Inc. | 22,400 | 611,115 | ||||||
Muenchener Rueckversicherungs-Gesellschaft AG (Registered) | 2,911 | 680,552 | ||||||
NN Group NV | 28,288 | 986,999 | ||||||
Poste Italiane SpA 144A | 75,767 | 618,457 | ||||||
Prudential Financial, Inc. | 22,200 | 1,421,244 | ||||||
QBE Insurance Group Ltd. | 107,882 | 623,660 | ||||||
Sampo Oyj “A” | 34,055 | 1,286,259 | ||||||
Sompo Holdings, Inc. | 17,000 | 634,319 | ||||||
Zurich Insurance Group AG | 4,799 | 1,592,983 | ||||||
|
| |||||||
| 15,658,097 | ||||||||
| Health Care 6.1% |
| |||||||
Biotechnology 1.2% |
| |||||||
AbbVie, Inc. | 32,201 | 2,740,305 | ||||||
Amgen, Inc. | 7,621 | 1,653,300 | ||||||
BeiGene Ltd. (ADR)* | 3,100 | 919,212 | ||||||
Gilead Sciences, Inc. | 27,285 | 1,586,623 | ||||||
Regeneron Pharmaceuticals, Inc.* | 2,100 | 1,141,476 | ||||||
Vertex Pharmaceuticals, Inc.* | 2,100 | 437,556 | ||||||
|
| |||||||
| 8,478,472 | ||||||||
Health Care Equipment & Supplies 0.6% |
| |||||||
Abbott Laboratories | 15,088 | 1,585,899 | ||||||
Coloplast AS “B” | 3,518 | 513,624 | ||||||
DexCom, Inc.* | 1,300 | 415,454 | ||||||
Medtronic PLC | 14,089 | 1,416,931 | ||||||
|
| |||||||
| 3,931,908 | ||||||||
Health Care Providers & Services 0.5% |
| |||||||
Cardinal Health, Inc. | 17,241 | 789,466 | ||||||
The accompanying notes are an integral part of the financial statements.
| 20 | | | DWS Global Income Builder Fund |
| Shares | Value ($) | |||||||
CVS Health Corp. | 18,100 | 1,015,229 | ||||||
UnitedHealth Group, Inc. | 4,681 | 1,428,360 | ||||||
|
| |||||||
| 3,233,055 | ||||||||
Health Care Technology 0.1% |
| |||||||
Veeva Systems, Inc. “A”* | 2,100 | 567,105 | ||||||
Pharmaceuticals 3.7% |
| |||||||
Astellas Pharma, Inc. | 49,600 | 681,880 | ||||||
AstraZeneca PLC | 13,598 | 1,365,556 | ||||||
Bayer AG (Registered) | 30,234 | 1,419,883 | ||||||
Bristol-Myers Squibb Co. | 27,948 | 1,633,561 | ||||||
Chugai Pharmaceutical Co., Ltd. | 30,100 | 1,159,438 | ||||||
Eli Lilly & Co. | 9,904 | 1,292,076 | ||||||
GlaxoSmithKline PLC | 78,774 | 1,314,641 | ||||||
Hikma Pharmaceuticals PLC | 46,894 | 1,524,470 | ||||||
Johnson & Johnson | 15,076 | 2,067,070 | ||||||
Merck & Co., Inc. | 27,049 | 2,034,355 | ||||||
Novartis AG (Registered) | 24,515 | 1,911,065 | ||||||
Novo Nordisk AS ‘‘B” | 17,031 | 1,092,999 | ||||||
Orion Oyj “B” | 17,645 | 755,493 | ||||||
Pfizer, Inc. | 64,681 | 2,294,882 | ||||||
Roche Holding AG (Genusschein) | 6,719 | 2,162,055 | ||||||
Sanofi | 14,353 | 1,295,499 | ||||||
Takeda Pharmaceutical Co., Ltd. | 31,100 | 962,808 | ||||||
|
| |||||||
| 24,967,731 | ||||||||
| Industrials 4.1% |
| |||||||
Aerospace & Defense 0.5% |
| |||||||
BAE Systems PLC | 116,667 | 599,172 | ||||||
General Dynamics Corp. | 4,667 | 612,917 | ||||||
Lockheed Martin Corp. | 2,360 | 826,307 | ||||||
Raytheon Technologies Corp. | 15,684 | 851,955 | ||||||
Singapore Technologies Engineering Ltd. | 244,700 | 627,309 | ||||||
|
| |||||||
| 3,517,660 | ||||||||
Air Freight & Logistics 0.5% |
| |||||||
Deutsche Post AG (Registered) | 26,457 | 1,171,519 | ||||||
FedEx Corp. | 4,300 | 1,115,721 | ||||||
United Parcel Service, Inc. “B” | 7,790 | 1,223,887 | ||||||
|
| |||||||
| 3,511,127 | ||||||||
Building Products 0.1% |
| |||||||
Johnson Controls International PLC | 19,864 | 838,459 | ||||||
Commercial Services & Supplies 0.1% |
| |||||||
Quad Graphics, Inc. | 10 | 23 | ||||||
Waste Management, Inc. | 6,786 | 732,277 | ||||||
|
| |||||||
| 732,300 | ||||||||
The accompanying notes are an integral part of the financial statements.
| DWS Global Income Builder Fund | | | 21 |
| Shares | Value ($) | |||||||
Construction & Engineering 0.2% |
| |||||||
Bouygues SA | 22,423 | 735,371 | ||||||
Kajima Corp. | 65,700 | 702,110 | ||||||
|
| |||||||
| 1,437,481 | ||||||||
Electrical Equipment 0.4% |
| |||||||
ABB Ltd. (Registered) | 37,400 | 907,136 | ||||||
Eaton Corp. PLC | 10,120 | 1,050,355 | ||||||
Emerson Electric Co. | 10,181 | 659,627 | ||||||
|
| |||||||
| 2,617,118 | ||||||||
Industrial Conglomerates 0.7% |
| |||||||
3M Co. | 5,110 | 817,396 | ||||||
CK Hutchison Holdings Ltd. | 188,500 | 1,139,708 | ||||||
Honeywell International, Inc. | 5,301 | 874,400 | ||||||
Jardine Matheson Holdings Ltd. | 14,900 | 661,155 | ||||||
Siemens AG (Registered) | 7,905 | 927,800 | ||||||
|
| |||||||
| 4,420,459 | ||||||||
Machinery 0.3% |
| |||||||
Cummins, Inc. | 3,413 | 750,485 | ||||||
Kone Oyj “B” | 7,333 | 582,672 | ||||||
Wartsila Oyj Abp | 114,759 | 912,464 | ||||||
|
| |||||||
| 2,245,621 | ||||||||
Professional Services 0.2% |
| |||||||
Adecco Group AG (Registered) | 14,649 | 717,303 | ||||||
Thomson Reuters Corp. | 8,100 | 629,737 | ||||||
|
| |||||||
| 1,347,040 | ||||||||
Road & Rail 0.3% |
| |||||||
MTR Corp., Ltd. | 113,500 | 562,570 | ||||||
Uber Technologies, Inc.* | 20,800 | 694,928 | ||||||
Union Pacific Corp. | 5,547 | 982,873 | ||||||
|
| |||||||
| 2,240,371 | ||||||||
Trading Companies & Distributors 0.8% |
| |||||||
Fastenal Co. | 11,900 | 514,437 | ||||||
ITOCHU Corp. | 47,600 | 1,141,243 | ||||||
Marubeni Corp. | 125,500 | 655,621 | ||||||
Mitsubishi Corp. | 72,600 | 1,617,895 | ||||||
Mitsui & Co., Ltd. | 49,300 | 770,132 | ||||||
Sumitomo Corp. | 53,600 | 588,330 | ||||||
|
| |||||||
| 5,287,658 | ||||||||
| Information Technology 14.5% |
| |||||||
Communications Equipment 0.7% |
| |||||||
Arista Networks, Inc.* | 2,400 | 501,360 | ||||||
Cisco Systems, Inc. | 50,883 | 1,826,700 | ||||||
The accompanying notes are an integral part of the financial statements.
| 22 | | | DWS Global Income Builder Fund |
| Shares | Value ($) | |||||||
Juniper Networks, Inc. | 35,856 | 707,080 | ||||||
Motorola Solutions, Inc. | 5,099 | 805,948 | ||||||
Telefonaktiebolaget LM Ericsson “B” | 82,789 | 922,007 | ||||||
|
| |||||||
| 4,763,095 | ||||||||
Electronic Equipment, Instruments & Components 1.1% |
| |||||||
Amphenol Corp. “A” | 5,300 | 598,052 | ||||||
CDW Corp. | 4,800 | 588,480 | ||||||
Cognex Corp. | 8,900 | 586,510 | ||||||
Corning, Inc. | 28,341 | 906,062 | ||||||
IPG Photonics Corp.* | 3,100 | 576,476 | ||||||
Keyence Corp. | 1,500 | 680,115 | ||||||
Keysight Technologies, Inc.* | 5,600 | 587,272 | ||||||
Kyocera Corp. | 10,900 | 599,927 | ||||||
Murata Manufacturing Co., Ltd. | 14,300 | 997,371 | ||||||
TE Connectivity Ltd. | 8,838 | 856,225 | ||||||
Venture Corp., Ltd. | 67,200 | 949,277 | ||||||
|
| |||||||
| 7,925,767 | ||||||||
IT Services 2.8% |
| |||||||
Accenture PLC “A” | 7,139 | 1,548,520 | ||||||
Afterpay Ltd.* | 12,005 | 811,646 | ||||||
Automatic Data Processing, Inc. | 6,729 | 1,062,913 | ||||||
Broadridge Financial Solutions, Inc. | 4,114 | 566,086 | ||||||
Fujitsu Ltd. | 7,900 | 926,553 | ||||||
GDS Holdings Ltd. (ADR)* | 7,000 | 588,280 | ||||||
Infosys Ltd. (ADR) | 43,900 | 626,453 | ||||||
International Business Machines Corp. | 19,073 | 2,129,691 | ||||||
MasterCard, Inc. “A” | 3,398 | 980,799 | ||||||
NEC Corp. | 16,100 | 810,943 | ||||||
Okta, Inc.* | 3,500 | 734,405 | ||||||
Paychex, Inc. | 15,307 | 1,259,001 | ||||||
PayPal Holdings, Inc.* | 8,048 | 1,497,974 | ||||||
Shopify, Inc. “A”* | 2,076 | 1,913,837 | ||||||
Square, Inc. “A”* | 11,549 | 1,788,709 | ||||||
Twilio, Inc. “A”* (a) | 2,400 | 669,528 | ||||||
Visa, Inc. “A” | 2,942 | 534,591 | ||||||
Western Union Co. | 23,382 | 454,546 | ||||||
|
| |||||||
| 18,904,475 | ||||||||
Semiconductors & Semiconductor Equipment 2.8% |
| |||||||
Advanced Micro Devices, Inc.* | 12,600 | 948,654 | ||||||
Analog Devices, Inc. | 6,748 | 799,840 | ||||||
Applied Materials, Inc. | 8,900 | 527,147 | ||||||
Broadcom, Inc. | 6,779 | 2,370,142 | ||||||
Intel Corp. | 26,370 | 1,167,664 | ||||||
KLA Corp. | 5,183 | 1,021,984 | ||||||
The accompanying notes are an integral part of the financial statements.
| DWS Global Income Builder Fund | | | 23 |
| Shares | Value ($) | |||||||
Lam Research Corp. | 2,689 | 919,853 | ||||||
Marvell Technology Group Ltd. | 15,200 | 570,152 | ||||||
Maxim Integrated Products, Inc. | 8,181 | 569,807 | ||||||
NVIDIA Corp. | 4,200 | 2,105,712 | ||||||
QUALCOMM., Inc. | 17,600 | 2,171,136 | ||||||
Skyworks Solutions, Inc. | 4,200 | 593,418 | ||||||
Taiwan Semiconductor Manufacturing Co., Ltd. (ADR) | 30,815 | 2,584,454 | ||||||
Texas Instruments, Inc. | 13,135 | 1,899,190 | ||||||
Tokyo Electron Ltd. | 2,300 | 614,066 | ||||||
|
| |||||||
| 18,863,219 | ||||||||
Software 3.8% |
| |||||||
Adobe, Inc.* | 4,047 | 1,809,414 | ||||||
Autodesk, Inc.* | 2,500 | 588,850 | ||||||
DocuSign, Inc.* | 4,400 | 889,900 | ||||||
Intuit, Inc. | 3,128 | 984,319 | ||||||
Microsoft Corp. | 53,873 | 10,907,666 | ||||||
Oracle Corp. | 26,734 | 1,500,045 | ||||||
Paycom Software, Inc.* | 2,400 | 873,816 | ||||||
salesforce.com, Inc.* | 5,473 | 1,271,214 | ||||||
SAP SE | 6,013 | 640,742 | ||||||
ServiceNow, Inc.* | 3,288 | 1,636,010 | ||||||
Splunk, Inc.* | 3,100 | 613,924 | ||||||
Trade Desk, Inc. “A”* | 1,300 | 736,385 | ||||||
Workday, Inc. “A”* | 3,100 | 651,372 | ||||||
Zoom Video Communications, Inc. “A”* | 3,500 | 1,613,185 | ||||||
Zscaler, Inc.* | 7,900 | 1,072,425 | ||||||
|
| |||||||
| 25,789,267 | ||||||||
Technology Hardware, Storage & Peripherals 3.3% |
| |||||||
Apple, Inc. | 129,872 | 14,137,866 | ||||||
Canon, Inc. | 82,700 | 1,430,251 | ||||||
Hewlett Packard Enterprise Co. | 66,960 | 578,534 | ||||||
HP, Inc. | 45,043 | 808,972 | ||||||
Logitech International SA (Registered) | 9,080 | 767,397 | ||||||
NetApp, Inc. | 21,823 | 957,811 | ||||||
Samsung Electronics Co., Ltd. (GDR) (Registered) | 1,105 | 1,395,615 | ||||||
Seagate Technology PLC | 33,557 | 1,604,696 | ||||||
Seiko Epson Corp. | 93,200 | 1,077,850 | ||||||
|
| |||||||
| 22,758,992 | ||||||||
| Materials 2.5% |
| |||||||
Chemicals 1.1% |
| |||||||
Air Products & Chemicals, Inc. | 3,477 | 960,486 | ||||||
BASF SE | 27,035 | 1,482,013 | ||||||
Dow, Inc. | 35,000 | 1,592,150 | ||||||
Linde PLC | 2,396 | 527,935 | ||||||
The accompanying notes are an integral part of the financial statements.
| 24 | | | DWS Global Income Builder Fund |
| Shares | Value ($) | |||||||
LyondellBasell Industries NV “A” | 9,100 | 622,895 | ||||||
Mitsubishi Chemical Holdings Corp. | 113,100 | 636,693 | ||||||
Nutrien Ltd. | 29,900 | 1,215,480 | ||||||
Sociedad Quimica y Minera de Chile SA (ADR) | 18,700 | 692,087 | ||||||
|
| |||||||
| 7,729,739 | ||||||||
Construction Materials 0.2% |
| |||||||
LafargeHolcim Ltd. (Registered)* | 28,619 | 1,226,544 | ||||||
Containers & Packaging 0.3% |
| |||||||
Amcor PLC | 87,841 | 916,182 | ||||||
International Paper Co. | 20,823 | 911,006 | ||||||
|
| |||||||
| 1,827,188 | ||||||||
Metals & Mining 0.8% |
| |||||||
Anglo American PLC | 22,773 | 534,730 | ||||||
B2Gold Corp. | 145,500 | 935,927 | ||||||
BHP Group Ltd. | 64,347 | 1,528,371 | ||||||
BHP Group PLC | 36,529 | 707,093 | ||||||
Polyus PJSC (GDR) | 5,794 | 569,550 | ||||||
Rio Tinto PLC | 23,456 | 1,323,957 | ||||||
|
| |||||||
| 5,599,628 | ||||||||
Paper & Forest Products 0.1% |
| |||||||
UPM-Kymmene Oyj | 20,901 | 590,251 | ||||||
| Real Estate 1.6% |
| |||||||
Equity Real Estate Investment Trusts (REITs) 1.2% |
| |||||||
Ascendas Real Estate Investment Trust | 226,276 | 478,153 | ||||||
CapitaLand Mall Trust | 886,068 | 1,124,071 | ||||||
Crown Castle International Corp. | 5,146 | 803,805 | ||||||
Medical Properties Trust, Inc. | 41,900 | 746,658 | ||||||
National Retail Properties, Inc. | 16,463 | 526,981 | ||||||
Prologis, Inc. | 5,412 | 536,870 | ||||||
Public Storage | 2,884 | 660,638 | ||||||
Realty Income Corp. | 9,564 | 553,373 | ||||||
Suntec Real Estate Investment Trust | 595,900 | 586,208 | ||||||
VICI Properties, Inc. | 61,117 | 1,402,635 | ||||||
WP Carey, Inc. | 10,597 | 663,478 | ||||||
|
| |||||||
| 8,082,870 | ||||||||
Real Estate Management & Development 0.4% |
| |||||||
Henderson Land Development Co., Ltd. | 216,000 | 767,756 | ||||||
New World Development Co., Ltd. | 206,000 | 985,752 | ||||||
Sun Hung Kai Properties Ltd. | 60,000 | 770,911 | ||||||
|
| |||||||
| 2,524,419 | ||||||||
The accompanying notes are an integral part of the financial statements.
| DWS Global Income Builder Fund | | | 25 |
| Shares | Value ($) | |||||||
| Utilities 3.5% |
| |||||||
Electric Utilities 2.5% |
| |||||||
American Electric Power Co., Inc. | 9,242 | 831,133 | ||||||
CK Infrastructure Holdings Ltd. | 128,500 | 605,439 | ||||||
CLP Holdings Ltd. | 59,500 | 548,413 | ||||||
Duke Energy Corp. | 12,277 | 1,130,835 | ||||||
EDP — Energias de Portugal SA | 207,460 | 1,024,599 | ||||||
Endesa SA | 46,841 | 1,254,515 | ||||||
Enel SpA | 121,171 | 965,621 | ||||||
Entergy Corp. | 7,578 | 767,045 | ||||||
Evergy, Inc. | 12,972 | 716,054 | ||||||
Exelon Corp. | 18,489 | 737,526 | ||||||
Fortum Oyj | 77,148 | 1,452,450 | ||||||
Iberdrola SA | 61,987 | 729,261 | ||||||
NextEra Energy, Inc. | 15,088 | 1,104,593 | ||||||
OGE Energy Corp. | 17,857 | 549,460 | ||||||
Power Assets Holdings Ltd. | 157,500 | 812,848 | ||||||
PPL Corp. | 42,675 | 1,173,563 | ||||||
Red Electrica Corp. SA | 49,703 | 876,619 | ||||||
Southern Co. | 20,463 | 1,175,599 | ||||||
SSE PLC | 48,315 | 785,820 | ||||||
|
| |||||||
| 17,241,393 | ||||||||
Gas Utilities 0.2% |
| |||||||
Naturgy Energy Group SA | 38,035 | 707,120 | ||||||
Snam SpA | 163,284 | 799,142 | ||||||
|
| |||||||
| 1,506,262 | ||||||||
Multi-Utilities 0.8% |
| |||||||
Consolidated Edison, Inc. | 9,512 | 746,597 | ||||||
Dominion Energy, Inc | 16,535 | 1,328,422 | ||||||
DTE Energy Co. | 6,766 | 835,060 | ||||||
National Grid PLC | 78,361 | 930,090 | ||||||
Public Service Enterprise Group, Inc. | 13,972 | 812,472 | ||||||
Sempra Energy | 5,655 | 708,911 | ||||||
|
| |||||||
| 5,361,552 | ||||||||
Total Common Stocks (Cost $333,572,918) | 372,683,468 | |||||||
| Preferred Stocks 5.1% | ||||||||
Communication Services 0.4% |
| |||||||
AT&T, Inc. 5.35% | 100,000 | 2,627,000 | ||||||
Consumer Discretionary 0.1% |
| |||||||
Volkswagen AG | 5,940 | 865,969 | ||||||
Financials 4.4% |
| |||||||
AGNC Investment Corp. Series C, 7.0% | 64,439 | 1,472,431 | ||||||
Capital One Financial Corp. Series G, 5.2% | 100,000 | 2,556,000 | ||||||
Charles Schwab Corp. Series D, 5.95% | 75,000 | 1,942,500 | ||||||
The accompanying notes are an integral part of the financial statements.
| 26 | | | DWS Global Income Builder Fund |
| Shares | Value ($) | |||||||
Citigroup, Inc. Series S, 6.3% | 75,000 | 1,908,750 | ||||||
Fifth Third Bancorp. Series I, 6.625% | 75,000 | 2,121,000 | ||||||
JPMorgan Chase & Co. Series AA, 6.1% | 75,000 | 1,896,750 | ||||||
KeyCorp. Series E, 6.125% | 75,000 | 2,120,250 | ||||||
Kimco Realty Corp. Series L, 5.125% | 75,000 | 1,948,500 | ||||||
Morgan Stanley Series K, 5.85% | 75,000 | 2,113,500 | ||||||
PNC Financial Services Group, Inc. Series P, 6.125% | 75,000 | 2,003,250 | ||||||
Prologis, Inc. Series Q, 8.54% | 236 | 18,880 | ||||||
Regions Financial Corp. Sereis B, 6.375% | 80,000 | 2,272,000 | ||||||
Simon Property Group, Inc. Series J, 8.375% | 17,000 | 1,079,499 | ||||||
The Goldman Sachs Group, Inc. Series J, 5.5% | 73,000 | 1,913,330 | ||||||
Truist Financial Corp. Series H, 5.625% | 75,000 | 1,962,750 | ||||||
VEREIT, Inc. Series F, 6.7% | �� | 33,014 | 830,302 | |||||
Wells Fargo & Co. Series Y, 5.625% | 75,000 | 1,943,250 | ||||||
|
| |||||||
| 30,102,942 | ||||||||
| Utilities 0.2% |
| |||||||
Dominion Energy, Inc. Series A, 5.25% | 60,000 | 1,539,600 | ||||||
Total Preferred Stocks (Cost $36,161,476) |
| 35,135,511 | ||||||
| Warrants 0.0% |
| |||||||
| Materials |
| |||||||
Hercules Trust II, Expiration Date 3/31/2029* (b) (Cost $90,209) | 506 | 16,712 | ||||||
| Principal Amount ($) (c) | Value ($) | |||||||
| Corporate Bonds 14.9% |
| |||||||
| Communication Services 2.9% |
| |||||||
Amazon.com, Inc., 2.5%, 6/3/2050 | 115,000 | 113,972 | ||||||
AT&T, Inc.: |
| |||||||
1.65%, 2/1/2028 | 290,000 | 287,470 | ||||||
2.25%, 2/1/2032 | 510,000 | 499,938 | ||||||
2.75%, 6/1/2031 | 755,000 | 783,656 | ||||||
3.65%, 6/1/2051 | 560,000 | 546,513 | ||||||
CCO Holdings LLC: |
| |||||||
144A, 4.75%, 3/1/2030 | 590,000 | 620,592 | ||||||
144A, 5.875%, 5/1/2027 | 1,535,000 | 1,601,588 | ||||||
Charter Communications Operating LLC: |
| |||||||
3.7%, 4/1/2051 | 180,000 | 175,204 | ||||||
5.05%, 3/30/2029 | 450,000 | 536,786 | ||||||
Comcast Corp., 2.8%, 1/15/2051 | 260,000 | 257,142 | ||||||
CSC Holdings LLC: |
| |||||||
144A, 3.375%, 2/15/2031 | 890,000 | 855,966 | ||||||
144A, 4.125%, 12/1/2030 | 783,000 | 796,139 | ||||||
The accompanying notes are an integral part of the financial statements.
| DWS Global Income Builder Fund | | | 27 |
| Principal Amount ($) (c) | Value ($) | |||||||
Meituan, 144A, 2.125%, 10/28/2025 | 505,000 | 505,494 | ||||||
Netflix, Inc.: |
| |||||||
4.375%, 11/15/2026 | 1,000,000 | 1,085,481 | ||||||
5.5%, 2/15/2022 | 1,100,000 | 1,155,688 | ||||||
5.875%, 11/15/2028 | 812,000 | 970,174 | ||||||
NortonLifeLock, Inc., 3.95%, 6/15/2022 | 1,475,000 | 1,510,031 | ||||||
T-Mobile U.S.A., Inc.: |
| |||||||
144A, 2.05%, 2/15/2028 | 160,000 | 162,400 | ||||||
144A, 2.25%, 11/15/2031 | 195,000 | 192,607 | ||||||
144A, 3.3%, 2/15/2051 | 300,000 | 289,032 | ||||||
144A, 3.6%, 11/15/2060 | 145,000 | 142,481 | ||||||
144A, 3.875%, 4/15/2030 | 460,000 | 516,746 | ||||||
144A, 4.375%, 4/15/2040 | 335,000 | 387,441 | ||||||
144A, 4.5%, 4/15/2050 | 350,000 | 406,992 | ||||||
Tencent Music Entertainment Group, 2.0%, 9/3/2030 | 602,000 | 590,714 | ||||||
VeriSign, Inc.: |
| |||||||
4.625%, 5/1/2023 | 1,650,000 | 1,667,110 | ||||||
5.25%, 4/1/2025 | 1,650,000 | 1,848,701 | ||||||
ViacomCBS, Inc., 4.2%, 5/19/2032 | 310,000 | 356,660 | ||||||
Walt Disney Co.: |
| |||||||
2.65%, 1/13/2031 | 275,000 | 295,677 | ||||||
3.6%, 1/13/2051 | 280,000 | 312,402 | ||||||
|
| |||||||
| 19,470,797 | ||||||||
| Consumer Discretionary 1.7% |
| |||||||
1011778 BC Unlimited Liability Co., 144A, 4.375%, 1/15/2028 | 1,300,000 | 1,316,250 | ||||||
Cummins, Inc., 2.6%, 9/1/2050 | 215,000 | 205,468 | ||||||
Dollar General Corp., 4.125%, 4/3/2050 | 110,000 | 131,907 | ||||||
Ford Motor Credit Co. LLC, 3.37%, 11/17/2023 | 2,200,000 | 2,180,750 | ||||||
General Motors Co., 5.4%, 10/2/2023 | 200,000 | 221,194 | ||||||
General Motors Financial Co., Inc.: |
| |||||||
3.95%, 4/13/2024 | 1,095,000 | 1,169,585 | ||||||
5.2%, 3/20/2023 | 250,000 | 271,280 | ||||||
Genuine Parts Co., 1.875%, 11/1/2030 | 165,000 | 161,546 | ||||||
Home Depot, Inc.: |
| |||||||
3.125%, 12/15/2049 | 414,000 | 452,661 | ||||||
3.35%, 4/15/2050 | 270,000 | 305,100 | ||||||
Hyundai Capital America, 144A, 1.25%, 9/18/2023 | 870,000 | 872,038 | ||||||
Lowe’s Cos, Inc., 3.0%, 10/15/2050 | 230,000 | 235,575 | ||||||
McDonald’s Corp.: |
| |||||||
2.125%, 3/1/2030 | 220,000 | 228,237 | ||||||
4.2%, 4/1/2050 | 270,000 | 327,097 | ||||||
Nissan Motor Co., Ltd., 144A, 4.345%, 9/17/2027 | 2,350,000 | 2,357,309 | ||||||
The accompanying notes are an integral part of the financial statements.
| 28 | | | DWS Global Income Builder Fund |
| Principal Amount ($) (c) | Value ($) | |||||||
QVC, Inc., 4.75%, 2/15/2027 | 1,140,000 | 1,163,159 | ||||||
Tractor Supply Co., 1.75%, 11/1/2030 | 80,000 | 78,634 | ||||||
|
| |||||||
| 11,677,790 | ||||||||
| Consumer Staples 0.4% |
| |||||||
Albertsons Companies, Inc., 144A, 3.25%, 3/15/2026 | 590,000 | 578,760 | ||||||
Anheuser-Busch InBev Worldwide, Inc.: |
| |||||||
4.35%, 6/1/2040 | 270,000 | 317,972 | ||||||
5.55%, 1/23/2049 | 699,000 | 942,630 | ||||||
BAT Capital Corp., 2.726%, 3/25/2031 | 335,000 | 330,790 | ||||||
Conagra Brands, Inc., 1.375%, 11/1/2027 | 175,000 | 173,536 | ||||||
Constellation Brands, Inc., 2.875%, 5/1/2030 | 255,000 | 274,656 | ||||||
Keurig Dr Pepper, Inc., 3.8%, 5/1/2050 | 185,000 | 210,843 | ||||||
Smithfield Foods, Inc., 144A, 3.0%, 10/15/2030 | 250,000 | 254,708 | ||||||
|
| |||||||
| 3,083,895 | ||||||||
| Energy 1.1% |
| |||||||
BP Capital Markets America, Inc., 1.749%, 8/10/2030 | 240,000 | 234,075 | ||||||
Cheniere Corpus Christi Holdings LLC, 5.875%, 3/31/2025 | 1,000,000 | 1,131,724 | ||||||
Devon Energy Corp., 5.0%, 6/15/2045 | 330,000 | 319,050 | ||||||
Energy Transfer Operating LP, 5.5%, 6/1/2027 | 1,000,000 | 1,109,070 | ||||||
Enterprise Products Operating LLC, 4.2%, 1/31/2050 | 905,000 | 978,549 | ||||||
Exxon Mobil Corp., 3.482%, 3/19/2030 | 600,000 | 678,202 | ||||||
Hess Corp., 5.8%, 4/1/2047 | 400,000 | 446,022 | ||||||
Marathon Petroleum Corp.: |
| |||||||
4.5%, 5/1/2023 | 730,000 | 785,596 | ||||||
4.7%, 5/1/2025 | 635,000 | 702,561 | ||||||
MPLX LP, 2.65%, 8/15/2030 | 210,000 | 202,095 | ||||||
Plains All American Pipeline LP, 3.8%, 9/15/2030 (a) | 300,000 | 289,998 | ||||||
Total Capital International SA, 3.127%, 5/29/2050 | 340,000 | 340,928 | ||||||
|
| |||||||
| 7,217,870 | ||||||||
| Financials 2.9% |
| |||||||
AerCap Ireland Capital DAC: |
| |||||||
3.15%, 2/15/2024 | 1,750,000 | 1,734,797 | ||||||
4.625%, 10/15/2027 | 1,750,000 | 1,734,451 | ||||||
Air Lease Corp., 3.0%, 2/1/2030 | 750,000 | 697,878 | ||||||
Banco Nacional de Panama, 144A, 2.5%, 8/11/2030 | 600,000 | 596,124 | ||||||
Bank of America Corp.: |
| |||||||
2.676%, 6/19/2041 | 330,000 | 333,181 | ||||||
4.3%, Perpetual (d) | 612,000 | 597,086 | ||||||
Barclays PLC: |
| |||||||
2.645%, 6/24/2031 | 600,000 | 602,182 | ||||||
2.852%, 5/7/2026 | 950,000 | 996,291 | ||||||
BBVA Bancomer SA, 144A, 1.875%, 9/18/2025 | 536,000 | 531,342 | ||||||
Berkshire Hathaway Finance Corp., 2.85%, 10/15/2050 | 240,000 | 244,495 | ||||||
BNP Paribas SA, 144A, 2.219%, 6/9/2026 | 500,000 | 517,043 | ||||||
The accompanying notes are an integral part of the financial statements.
| DWS Global Income Builder Fund | | | 29 |
| Principal Amount ($) (c) | Value ($) | |||||||
BPCE SA, 144A, 4.875%, 4/1/2026 | 1,300,000 | 1,494,973 | ||||||
Canadian Imperial Bank of Commerce, 0.95%, 10/23/2025 | 310,000 | 309,943 | ||||||
Citigroup, Inc., 2.572%, 6/3/2031 | 770,000 | 802,411 | ||||||
Credit Suisse Group AG, 144A, 2.193%, 6/5/2026 | 350,000 | 361,731 | ||||||
Empower Finance LP: |
| |||||||
144A, 1.776%, 3/17/2031 | 142,000 | 140,483 | ||||||
144A, 3.075%, 9/17/2051 | 199,000 | 205,811 | ||||||
GE Capital Funding LLC, 144A, 4.4%, 5/15/2030 | 260,000 | 284,192 | ||||||
GE Capital International Funding Co., Unlimited Co., 4.418%, 11/15/2035 | 550,000 | 594,733 | ||||||
Hartford Financial Services Group, Inc., 2.8%, 8/19/2029 | 240,000 | 261,052 | ||||||
HSBC Holdings PLC, 2.357%, 8/18/2031 | 200,000 | 198,611 | ||||||
Intercontinental Exchange, Inc., 3.0%, 6/15/2050 | 173,000 | 179,844 | ||||||
JPMorgan Chase & Co., 2.956%, 5/13/2031 | 305,000 | 324,809 | ||||||
MDGH — GMTN BV, REG S, 3.7%, 11/7/2049 | 245,000 | 268,674 | ||||||
Nielsen Finance LLC, 144A, 5.625%, 10/1/2028 | 680,000 | 701,250 | ||||||
Park Aerospace Holdings Ltd., 144A, 5.25%, 8/15/2022 | 850,000 | 875,338 | ||||||
REC Ltd.: |
| |||||||
144A, 4.75%, 5/19/2023 | 426,000 | 449,751 | ||||||
144A, 5.25%, 11/13/2023 | 570,000 | 617,053 | ||||||
Synchrony Financial, 4.375%, 3/19/2024 | 540,000 | 590,804 | ||||||
The Allstate Corp., 3.85%, 8/10/2049 | 190,000 | 228,258 | ||||||
The Goldman Sachs Group, Inc., 4.4%, Perpetual (a) (d) | 186,000 | 178,327 | ||||||
Truist Financial Corp., 4.8%, Perpetual (d) | 2,000,000 | 2,016,300 | ||||||
|
| |||||||
| 19,669,218 | ||||||||
| Health Care 1.2% |
| |||||||
AbbVie, Inc., 4.875%, 11/14/2048 | 450,000 | 570,418 | ||||||
Anthem, Inc., 2.25%, 5/15/2030 | 515,000 | 529,244 | ||||||
Biogen, Inc., 3.15%, 5/1/2050 | 250,000 | 241,928 | ||||||
Cigna Corp.: |
| |||||||
2.4%, 3/15/2030 | 180,000 | 186,729 | ||||||
3.2%, 3/15/2040 | 90,000 | 95,031 | ||||||
CVS Health Corp.: |
| |||||||
1.75%, 8/21/2030 | 760,000 | 739,819 | ||||||
2.7%, 8/21/2040 | 160,000 | 152,752 | ||||||
4.25%, 4/1/2050 | 120,000 | 140,210 | ||||||
5.05%, 3/25/2048 | 1,000,000 | 1,268,282 | ||||||
Fresenius Medical Care U.S. Finance III, Inc., 144A, 2.375%, 2/16/2031 | 345,000 | 339,304 | ||||||
Gilead Sciences, Inc.: |
| |||||||
1.65%, 10/1/2030 | 220,000 | 216,814 | ||||||
2.8%, 10/1/2050 | 260,000 | 253,281 | ||||||
HCA, Inc.: |
| |||||||
4.125%, 6/15/2029 | 600,000 | 680,889 | ||||||
5.25%, 6/15/2026 | 1,000,000 | 1,164,737 | ||||||
The accompanying notes are an integral part of the financial statements.
| 30 | | | DWS Global Income Builder Fund |
| Principal Amount ($) (c) | Value ($) | |||||||
Hologic, Inc., 144A, 3.25%, 2/15/2029 | 370,000 | 371,850 | ||||||
Stryker Corp., 2.9%, 6/15/2050 | 340,000 | 342,213 | ||||||
Takeda Pharmaceutical Co., Ltd.: |
| |||||||
2.05%, 3/31/2030 | 200,000 | 201,300 | ||||||
3.175%, 7/9/2050 | 380,000 | 385,939 | ||||||
UnitedHealth Group, Inc., 2.9%, 5/15/2050 | 280,000 | 292,794 | ||||||
Universal Health Services, Inc., 144A, 2.65%, 10/15/2030 | 375,000 | 373,811 | ||||||
|
| |||||||
| 8,547,345 | ||||||||
| Industrials 1.5% |
| |||||||
Adani Ports & Special Economic Zone Ltd., 144A, 4.2%, 8/4/2027 | 865,000 | 870,478 | ||||||
Agilent Technologies, Inc., 2.1%, 6/4/2030 | 265,000 | 271,342 | ||||||
BAE Systems PLC, 144A, 3.0%, 9/15/2050 | 200,000 | 201,542 | ||||||
Boeing Co.: |
| |||||||
1.95%, 2/1/2024 (e) | 600,000 | 597,708 | ||||||
2.7%, 5/1/2022 | 790,000 | 803,638 | ||||||
2.75%, 2/1/2026 (e) | 820,000 | 819,690 | ||||||
4.508%, 5/1/2023 | 900,000 | 953,420 | ||||||
4.875%, 5/1/2025 | 546,000 | 593,742 | ||||||
5.04%, 5/1/2027 | 350,000 | 384,598 | ||||||
Delta Air Lines, Inc., 144A, 4.5%, 10/20/2025 | 190,000 | 192,840 | ||||||
Empresa de los Ferrocarriles del Estado, 144A, 3.068%, 8/18/2050 (a) | 239,000 | 222,270 | ||||||
Gartner, Inc., 144A, 3.75%, 10/1/2030 | 350,000 | 357,910 | ||||||
General Electric Co.: |
| |||||||
3.45%, 5/1/2027 | 265,000 | 281,034 | ||||||
3.625%, 5/1/2030 | 195,000 | 205,928 | ||||||
GFL Environmental, Inc., 144A, 3.75%, 8/1/2025 | 630,000 | 630,000 | ||||||
Otis Worldwide Corp., 3.112%, 2/15/2040 | 400,000 | 425,477 | ||||||
Penske Truck Leasing Co. LP, 144A, 1.2%, 11/15/2025 | 450,000 | 449,107 | ||||||
Prime Security Services Borrower LLC: |
| |||||||
144A, 5.25%, 4/15/2024 | 1,550,000 | 1,621,408 | ||||||
144A, 6.25%, 1/15/2028 | 405,000 | 409,244 | ||||||
|
| |||||||
| 10,291,376 | ||||||||
| Information Technology 0.5% |
| |||||||
Booz Allen Hamilton, Inc., 144A, 3.875%, 9/1/2028 | 250,000 | 253,750 | ||||||
Broadcom, Inc., 5.0%, 4/15/2030 | 410,000 | 482,279 | ||||||
KLA Corp., 3.3%, 3/1/2050 | 183,000 | 192,215 | ||||||
Lam Research Corp., 2.875%, 6/15/2050 | 136,000 | 139,795 | ||||||
Microchip Technology, Inc., 144A, 2.67%, 9/1/2023 | 325,000 | 337,245 | ||||||
NVIDIA Corp.: |
| |||||||
3.5%, 4/1/2040 | 78,000 | 90,393 | ||||||
3.5%, 4/1/2050 | 117,000 | 135,867 | ||||||
NXP BV, 144A, 2.7%, 5/1/2025 | 80,000 | 85,011 | ||||||
The accompanying notes are an integral part of the financial statements.
| DWS Global Income Builder Fund | | | 31 |
| Principal Amount ($) (c) | Value ($) | |||||||
Open Text Corp., 144A, 3.875%, 2/15/2028 | 1,100,000 | 1,117,358 | ||||||
Oracle Corp., 3.6%, 4/1/2050 | 150,000 | 164,683 | ||||||
Qorvo, Inc., 144A, 3.375%, 4/1/2031 | 300,000 | 303,750 | ||||||
|
| |||||||
| 3,302,346 | ||||||||
| Materials 0.7% |
| |||||||
Glencore Funding LLC, 144A, 1.625%, 9/1/2025 | 1,645,000 | 1,634,997 | ||||||
LYB International Finance III LLC, 3.625%, 4/1/2051 | 160,000 | 159,787 | ||||||
MEGlobal Canada ULC, 144A, 5.0%, 5/18/2025 | 1,511,000 | 1,644,648 | ||||||
Newmont Corp., 2.25%, 10/1/2030 | 240,000 | 247,548 | ||||||
Nutrition & Biosciences, Inc., 144A, 3.468%, 12/1/2050 | 342,000 | 350,087 | ||||||
Reynolds Group Issuer, Inc, 144A, 4.0%, 10/15/2027 | 240,000 | 243,000 | ||||||
WRKCo., Inc., 3.0%, 6/15/2033 | 185,000 | 197,050 | ||||||
|
| |||||||
| 4,477,117 | ||||||||
| Real Estate 0.5% |
| |||||||
American Tower Corp.: |
| |||||||
(REIT), 2.1%, 6/15/2030 | 310,000 | 311,387 | ||||||
(REIT), 3.8%, 8/15/2029 | 900,000 | 1,024,139 | ||||||
Equinix, Inc., (REIT), 2.15%, 7/15/2030 | 193,000 | 193,932 | ||||||
Iron Mountain, Inc.: |
| |||||||
144A, (REIT), 5.0%, 7/15/2028 | 325,000 | 331,770 | ||||||
144A, (REIT), 5.25%, 7/15/2030 | 620,000 | 636,275 | ||||||
Office Properties Income Trust, (REIT), 4.15%, 2/1/2022 | 260,000 | 262,463 | ||||||
Omega Healthcare Investors, Inc.: |
| |||||||
(REIT), 4.5%, 4/1/2027 | 230,000 | 249,200 | ||||||
(REIT), 4.75%, 1/15/2028 | 260,000 | 282,714 | ||||||
Welltower, Inc., (REIT), 2.75%, 1/15/2031 | 210,000 | 214,709 | ||||||
|
| |||||||
| 3,506,589 | ||||||||
| Utilities 1.5% |
| |||||||
AES Panama Generation Holdings SRL, 144A, 4.375%, 5/31/2030 | 622,000 | 659,127 | ||||||
Calpine Corp., 144A, 4.5%, 2/15/2028 | 1,250,000 | 1,271,875 | ||||||
Consolidated Edison Co., 3.95%, 4/1/2050 | 30,000 | 35,421 | ||||||
Edison International, 5.75%, 6/15/2027 | 1,650,000 | 1,873,258 | ||||||
ENN Energy Holdings, Ltd., 144A, 2.625%, 9/17/2030 | 854,000 | 860,084 | ||||||
Eskom Holdings SOC Ltd., REG S, 6.35%, 8/10/2028 | 625,000 | 645,350 | ||||||
NextEra Energy Operating Partners LP: |
| |||||||
144A, 3.875%, 10/15/2026 | 1,035,000 | 1,071,582 | ||||||
144A, 4.25%, 7/15/2024 | 1,570,000 | 1,640,650 | ||||||
Pacific Gas and Electric Co.: |
| |||||||
2.5%, 2/1/2031 | 130,000 | 122,910 | ||||||
3.3%, 8/1/2040 (a) | 370,000 | 336,819 | ||||||
3.5%, 8/1/2050 | 150,000 | 135,568 | ||||||
Perusahaan Listrik Negara PT, 144A, 2.875%, 10/25/2025 | EUR 1,505,000 | 1,865,630 | ||||||
|
| |||||||
| 10,518,274 | ||||||||
Total Corporate Bonds (Cost $97,754,666) |
| 101,762,617 | ||||||
The accompanying notes are an integral part of the financial statements.
| 32 | | | DWS Global Income Builder Fund |
| Principal Amount ($) (c) | Value ($) | |||||||
| Asset-Backed 5.6% |
| |||||||
| Automobile Receivables 2.8% | ||||||||
AmeriCredit Automobile Receivables Trust, “C”, Series 2019-2, 2.74%, 4/18/2025 | 4,080,000 | 4,240,576 | ||||||
Avis Budget Rental Car Funding AESOP LLC, “C”, Series 2019-1A, 144A, 4.53%, 3/20/2023 | 700,000 | 710,508 | ||||||
CPS Auto Receivables Trust, “E”, Series 2015-C, 144A, 6.54%, 8/16/2021 | 1,500,000 | 1,509,962 | ||||||
Flagship Credit Auto Trust, “C”, Series 2019-4, 144A, 2.77%, 12/15/2025 | 6,230,000 | 6,463,079 | ||||||
GMF Floorplan Owner Revolving Trust, “C”, Series 2019-1, 144A, 3.06%, 4/15/2024 | 1,540,000 | 1,576,953 | ||||||
Hertz Vehicle Financing II LP, “B”, Series 2017-2A, 144A, 4.2%, 10/25/2023 | 605,000 | 603,599 | ||||||
Hyundai Auto Receivables Trust, “C”, Series 2019-B, 2.4%, 6/15/2026 | 3,500,000 | 3,642,333 | ||||||
|
| |||||||
| 18,747,010 | ||||||||
| Credit Card Receivables 0.7% |
| |||||||
Fair Square Issuance Trust, “A”, Series 2020-AA, 144A, 2.9%, 9/20/2024 | 4,670,000 | 4,670,080 | ||||||
| Miscellaneous 2.1% |
| |||||||
Ares XXXIV CLO Ltd., “AR2”, Series 2015-2A, 144A, 3-month USD-LIBOR + 1.250%, 1.468%**, 4/17/2033 | 3,790,000 | 3,742,796 | ||||||
CF Hippolyta LLC, “B1”, Series 2020-1, 144A, 2.28%, 7/15/2060 | 2,418,513 | 2,429,672 | ||||||
MVW Owner Trust, “A”, Series 2019-1A, 144A, 2.89%, 11/20/2036 | 2,083,218 | 2,138,581 | ||||||
RR 8 Ltd., “A1B”, Series 2020-8A, 144A, 3-month USD-LIBOR + 1.450%, 1.687%**, 4/15/2033 | 2,830,000 | 2,828,033 | ||||||
Sierra Timeshare Receivables Funding LLC, “A”, Series 2020-2A, 144A, 1.33%, 7/20/2037 | 3,325,553 | 3,339,478 | ||||||
|
| |||||||
| 14,478,560 | ||||||||
Total Asset-Backed (Cost $37,346,038) |
| 37,895,650 | ||||||
| Mortgage-Backed Securities Pass-Throughs 4.9% |
| |||||||
Federal Home Loan Mortgage Corp., 6.0%, 11/1/2021 | 3,157 | 3,170 | ||||||
Federal National Mortgage Association, 1.5%, 11/1/2050 (e) | 33,000,000 | 33,225,390 | ||||||
Government National Mortgage Association, 6.5%, 8/20/2034 | 29,376 | 35,719 | ||||||
Total Mortgage-Backed Securities Pass-Throughs (Cost $33,272,662) |
| 33,264,279 | ||||||
The accompanying notes are an integral part of the financial statements.
| DWS Global Income Builder Fund | | | 33 |
| Principal Amount ($) (c) | Value ($) | |||||||
| Commercial Mortgage-Backed Securities 5.0% |
| |||||||
Benchmark Mortgage Trust, “A4” Series 2019-B13, 2.952%, 8/15/2057 | 7,600,000 | 8,310,984 | ||||||
BX Commercial Mortgage Trust, “D”, Series 2018-IND, 144A, 1-month USD-LIBOR + 1.300%, 1.448%**, 11/15/2035 | 700,000 | 691,211 | ||||||
CFK Trust, “A”, Series 2020-MF2, 144A, 2.387%, 3/15/2039 | 4,250,000 | 4,278,040 | ||||||
Citigroup Commercial Mortgage Trust: |
| |||||||
“A”, Series 2020-555, 144A, 2.647%, 12/10/2041 | 4,300,000 | 4,516,885 | ||||||
“C”, Series 2019-PRM, 144A, 3.896%, 5/10/2036 | 2,516,145 | 2,605,700 | ||||||
“D”, Series 2019-PRM, 144A, 4.35%, 5/10/2036 | 2,625,000 | 2,683,339 | ||||||
FHLMC Multifamily Structured Pass-Through Certificates: |
| |||||||
“X1”, Series K043, Interest Only, 0.53%**, 12/25/2024 | 7,216,065 | 140,149 | ||||||
“X1P”, Series KL05, Interest Only, 0.892%**, 6/25/2029 | 28,700,000 | 1,946,090 | ||||||
“X1”, Series K110, Interest Only, 1.698%**, 4/25/2030 | 20,690,919 | 2,752,964 | ||||||
GMAC Commercial Mortgage Securities, Inc., “G”, Series 2004-C1, 144A, 5.455%, 3/10/2038 | 1,962,211 | 1,236,040 | ||||||
MTRO Commercial Mortgage Trust, “C”, Series 2019-TECH, 144A, 1-month USD-LIBOR + 1.300%, 1.448%**, 12/15/2033 | 1,255,000 | 1,224,027 | ||||||
Multifamily Connecticut Avenue Securities Trust, “M7”, Series 2019-01, 144A, 1-month USD-LIBOR + 1.700%, 1.849%**, 10/15/2049 | 1,927,670 | 1,841,541 | ||||||
NYT Mortgage Trust, “B”, Series 2019-NYT, 144A, 1-month USD-LIBOR + 1.400%, 1.548%**, 12/15/2035 | 2,000,000 | 1,990,548 | ||||||
Total Commercial Mortgage-Backed Securities (Cost $34,470,046) |
| 34,217,518 | ||||||
| Collateralized Mortgage Obligations 5.3% |
| |||||||
Connecticut Avenue Securities Trust: |
| |||||||
“1M2”, Series 2020-R01, 144A, 1-month USD-LIBOR + 2.050%, 2.199%**, 1/25/2040 | 1,500,000 | 1,469,290 | ||||||
“1M2”, Series 2019-R03, 144A, 1-month USD-LIBOR + 2.150%, 2.299%**, 9/25/2031 | 572,881 | 569,058 | ||||||
“1M2”, Series 2019-R02, 144A, 1-month USD-LIBOR + 2.300%, 2.449%**, 8/25/2031 | 843,296 | 838,000 | ||||||
Fannie Mae Connecticut Avenue Securities: |
| |||||||
“1M2”, Series 2018-C06, 1-month USD-LIBOR + 2.000%, 2.149%**, 3/25/2031 | 590,550 | 572,765 | ||||||
“1M2”, Series 2018-C03, 1-month USD-LIBOR + 2.150%, 2.299%**, 10/25/2030 | 743,607 | 725,846 | ||||||
“1M2”, Series 2018-C01, 1-month USD-LIBOR + 2.250%, 2.399%**, 7/25/2030 | 1,173,029 | 1,155,430 | ||||||
“1M2”, Series 2018-C05, 1-month USD-LIBOR + 2.350%, 2.499%**, 1/25/2031 | 1,899,135 | 1,853,880 | ||||||
The accompanying notes are an integral part of the financial statements.
| 34 | | | DWS Global Income Builder Fund |
| Principal Amount ($) (c) | Value ($) | |||||||
Federal National Mortgage Association: |
| |||||||
“4”, Series 406, Interest Only, 4.0%, 9/25/2040 | 2,267,840 | 285,448 | ||||||
“I”, Series 2003-84, Interest Only, 6.0%, 9/25/2033 | 230,048 | 46,217 | ||||||
Freddie Mac Structured Agency Credit Risk Debt Notes: |
| |||||||
“M2”, Series 2020-DNA2, 144A, 1-month USD-LIBOR + 1.850%, 1.999%**, 2/25/2050 | 5,400,000 | 5,282,983 | ||||||
“M2”, Series 2019-DNA3, 144A, 1-month USD-LIBOR + 2.050%, 2.199%**, 7/25/2049 | 1,366,332 | 1,338,826 | ||||||
“M2”, Series 2019-DNA2, 144A, 1-month USD-LIBOR + 2.450%, 2.599%**, 3/25/2049 | 2,145,822 | 2,111,678 | ||||||
“M2”, Series 2017-DNA3, 1-month USD-LIBOR + 2.500%, 2.649%**, 3/25/2030 | 1,000,000 | 1,010,626 | ||||||
“M2”, Series 2019-DNA1, 144A, 1-month USD-LIBOR + 2.650%, 2.799%**, 1/25/2049 | 319,210 | 316,064 | ||||||
Government National Mortgage Association: |
| |||||||
“PI”, Series 2015-40, Interest Only, 4.0%, 4/20/2044 | 508,950 | 25,666 | ||||||
“IN”, Series 2009-69, Interest Only, 5.5%, 8/20/2039 | 464,981 | 72,142 | ||||||
“IV”, Series 2009-69, Interest Only, 5.5%, 8/20/2039 | 440,035 | 66,720 | ||||||
“IJ”, Series 2009-75, Interest Only, 6.0%, 8/16/2039 | 305,766 | 48,171 | ||||||
JPMorgan Mortgage Trust: |
| |||||||
“A11”, Series 2020-2, 144A, 1-month USD-LIBOR + 0.800%, 0.948%**, 7/25/2050 | 2,210,678 | 2,206,551 | ||||||
“A11”, Series 2019-9, 144A, 1-month USD-LIBOR + 0.900%, 1.048%**, 5/25/2050 | 1,322,060 | 1,322,032 | ||||||
“AM”, Series 2016-3, 144A, 3.361%**, 10/25/2046 | 3,085,586 | 3,134,635 | ||||||
“A3”, Series 2019-INV3, 144A, 3.5%, 5/25/2050 | 5,207,842 | 5,375,676 | ||||||
“A3”, Series 2020-INV1, 144A, 3.5%, 8/25/2050 | 2,014,720 | 2,080,063 | ||||||
New Residential Mortgage Loan Trust: |
| |||||||
“A1”, Series 2019-NQM3, 144A, 2.802%, 7/25/2049 | 2,023,754 | 2,041,424 | ||||||
“A1”, Series 2019-NQM2, 144A, 3.6%, 4/25/2049 | 586,355 | 592,986 | ||||||
STACR Trust, “M2”, Series 2018-DNA3, 144A, 1-month USD-LIBOR + 2.100%, 2.249%**, 9/25/2048 | 1,945,946 | 1,899,077 | ||||||
| ||||||||
Total Collateralized Mortgage Obligations (Cost $36,411,316) |
| 36,441,254 | ||||||
| Government & Agency Obligations 0.8% |
| |||||||
| Sovereign Bonds |
| |||||||
Abu Dhabi Government International Bond, 144A, 3.125%, 4/16/2030 | 1,228,000 | 1,367,096 | ||||||
Bermuda Government International Bond, 144A, 2.375%, 8/20/2030 | 471,000 | 483,364 | ||||||
Colombia Government International Bond, 3.125%, 4/15/2031 | 525,000 | 538,912 | ||||||
Perusahaan Penerbit SBSN Indonesia III, 144A, 2.875%, 6/23/2030 | 883,000 | 908,404 | ||||||
Republic of Kazakhstan, 144A, 1.55%, 11/9/2023 | EUR 1,555,000 | 1,855,763 | ||||||
Total Government & Agency Obligations (Cost $5,031,967) |
| 5,153,539 | ||||||
The accompanying notes are an integral part of the financial statements.
| DWS Global Income Builder Fund | | | 35 |
| Principal Amount ($) (c) | Value ($) | |||||||
| Loan Participations and Assignments 0.4% |
| |||||||
| Senior Loans ** |
| |||||||
Hilton Worldwide Finance LLC, Term Loan B2, 1-month USD-LIBOR + 1.750%, 1.899%, 6/22/2026 | 1,389,235 | 1,321,107 | ||||||
TransDigm, Inc., Term Loan F, 1-month USD-LIBOR + 2.250%, 2.398%, 12/9/2025 | 1,255,377 | 1,184,373 | ||||||
Total Loan Participations and Assignments (Cost $2,646,572) |
| 2,505,480 | ||||||
| Shares | Value ($) | |||||||
| Exchange-Traded Funds 3.9% |
| |||||||
SPDR Bloomberg Barclays Convertible Securities ETF (a) (Cost $20,378,747) | 382,040 | 26,327,146 | ||||||
| Principal Amount ($) (c) | Value ($) | |||||||
| Short-Term U.S. Treasury Obligations 1.6% |
| |||||||
U.S. Treasury Bills: |
| |||||||
0.101%***, 8/12/2021 | 1,100,000 | 1,099,092 | ||||||
0.125%***, 8/12/2021 (f) | 600,000 | 599,505 | ||||||
0.142%***, 6/17/2021 (g) | 9,300,000 | 9,293,989 | ||||||
Total Short-Term U.S. Treasury Obligations (Cost $10,990,175) |
| 10,992,586 | ||||||
| Shares | Value ($) | |||||||
| Securities Lending Collateral 4.5% |
| |||||||
DWS Government & Agency Securities Portfolio “DWS Government Cash Institutional Shares”, 0.04% (h) (i) (Cost $30,951,654) | 30,951,654 | 30,951,654 | ||||||
| Cash Equivalents 2.2% |
| |||||||
DWS Central Cash Management Government Fund, 0.10% (h) (Cost $14,672,645) | 14,672,645 | 14,672,645 | ||||||
| % of Net Assets | Value ($) | |||||||
| Total Investment Portfolio (Cost $693,751,091) | 108.8 | 742,020,059 | ||||||
| Other Assets and Liabilities, Net | (8.8 | ) | (59,943,928 | ) | ||||
| ||||||||
| Net Assets | 100.0 | 682,076,131 | ||||||
The accompanying notes are an integral part of the financial statements.
| 36 | | | DWS Global Income Builder Fund |
A summary of the Fund’s transactions with affiliated investments during the year ended October 31, 2020 are as follows:
Value ($) at 10/31/2019 | Pur- chases ($) | Sales Proceeds ($) | Net ized | Net in ized ation) | Income ($) | Capital butions ($) | Number of Shares at 10/31/2020 | Value ($) at | ||||||||||||||||||||||||
| Securities Lending Collateral 4.5% | ||||||||||||||||||||||||||||||||
| DWS Government & Agency Securities Portfolio “DWS Government Cash Institutional Shares”, 0.04% (h) (i) | ||||||||||||||||||||||||||||||||
| 250,800 | 30,700,854 | (j) | — | — | — | 124,519 | — | 30,951,654 | 30,951,654 | |||||||||||||||||||||||
| Cash Equivalents 2.2% | ||||||||||||||||||||||||||||||||
| DWS Central Cash Management Government Fund, 0.10% (h) | ||||||||||||||||||||||||||||||||
| 6,452,810 | 365,606,824 | 357,386,989 | — | — | 166,965 | — | 14,672,645 | 14,672,645 | ||||||||||||||||||||||||
| 6,703,610 | 396,307,678 | 357,386,989 | — | — | 291,484 | — | 45,624,299 | 45,624,299 | ||||||||||||||||||||||||
| * | Non-income producing security. |
| ** | Variable or floating rate security. These securities are shown at their current rate as of October 31, 2020. For securities based on a published reference rate and spread, the reference rate and spread are indicated within the description above. Certain variable rate securities are not based on a published reference rate and spread but adjust periodically based on current market conditions, prepayment of underlying positions and/or other variables. |
| *** | Annualized yield at time of purchase; not a coupon rate. |
| (a) | All or a portion of these securities were on loan. In addition, “Other Assets and Liabilities, Net” may include pending sales that are also on loan. The value of securities loaned at October 31, 2020 amounted to $29,783,886, which is 4.4% of net assets. |
| (b) | Investment was valued using significant unobservable inputs. |
| (c) | Principal amount stated in U.S. dollars unless otherwise noted. |
| (d) | Perpetual, callable security with no stated maturity date. |
| (e) | When-issued, delayed delivery or forward commitment securities included. |
| (f) | At October 31, 2020, this security has been pledged, in whole or in part, to cover initial margin requirements for open centrally cleared swap contracts. |
| (g) | At October 31, 2020, this security has been pledged, in whole or in part, to cover initial margin requirements for open futures contracts. |
| (h) | Affiliated fund managed by DWS Investment Management Americas, Inc. The rate shown is the annualized seven-day yield at period end. |
| (i) | Represents cash collateral held in connection with securities lending. Income earned by the Fund is net of borrower rebates. |
| (j) | Represents the net increase (purchase cost) or decrease (sales proceeds) in the amount invested in cash collateral for the year ended October 31, 2020. |
144A: Security exempt from registration under Rule 144A of the Securities Act of 1933. These securities may be resold in transactions exempt from registration, normally to qualified institutional buyers.
ADR: American Depositary Receipt
ASX: Australian Securities Exchange
CLO: Collateralized Loan Obligation
CVA: Certificaten Van Aandelen (Certificate of Stock)
EURIBOR: Euro Interbank Offered Rate
The accompanying notes are an integral part of the financial statements.
| DWS Global Income Builder Fund | | | 37 |
GDR: Global Depositary Receipt
Interest Only: Interest Only (IO) bonds represent the “interest only” portion of payments on a pool of underlying mortgages or mortgage-backed securities. IO securities are subject to prepayment risk of the pool of underlying mortgages.
LIBOR: London Interbank Offered Rate
MSCI: Morgan Stanley Capital International
PJSC: Public Joint Stock Company
REG S: Securities sold under Regulation S may not be offered, sold or delivered within the United States or to, or for the account or benefit of, U.S. persons, except pursuant to an exemption from, or in a transaction not subject to, the registration requirements of the Securities Act of 1933.
REIT: Real Estate Investment Trust
SBSN: Surat Berharga Syariah Negara (Islamic Based Government Securities)
SOC: State Owned Company
S&P: Standard & Poor’s
SPDR: Standard & Poor’s Depositary Receipt
Included in the portfolio are investments in mortgage or asset-backed securities which are interests in separate pools of mortgages or assets. Effective maturities of these investments may be shorter than stated maturities due to prepayments. Some separate investments in the Federal National Mortgage Association issues which have similar coupon rates have been aggregated for presentation purposes in this investment portfolio.
At October 31, 2020, open futures contracts purchased were as follows:
| Futures | Currency | Expiration Date | Contracts | Notional Amount ($) | Notional Value ($) | Unrealized Appreciation (Depreciation) ($) | ||||||||||||||||||
| 3 Month Euro Euribor Interest Rate | EUR | 9/13/2021 | 10 | 2,925,764 | 2,928,221 | 2,457 | ||||||||||||||||||
| 3 Month Euro Swiss Franc (Euroswiss) Interest Rate | CHF | 9/13/2021 | 11 | 3,020,090 | 3,023,665 | 3,575 | ||||||||||||||||||
| 3 Month Euroyen Futures | JPY | 9/13/2021 | 13 | 3,105,235 | 3,105,342 | 107 | ||||||||||||||||||
| 3 Month Sterling (Short Sterling) Interest Rate | GBP | 9/15/2021 | 18 | 2,914,175 | 2,915,748 | 1,573 | ||||||||||||||||||
| 90 Day Eurodollar Time Deposit | USD | 9/13/2021 | 12 | 2,994,476 | 2,994,000 | (476 | ) | |||||||||||||||||
| ASX 90 Day Bank Accepted Bills | AUD | 9/9/2021 | 16 | 11,242,282 | 11,245,295 | 3,013 | ||||||||||||||||||
| Euro Stoxx 50 Index | EUR | 12/18/2020 | 5 | 192,934 | 172,310 | (20,624 | ) | |||||||||||||||||
The accompanying notes are an integral part of the financial statements.
| 38 | | | DWS Global Income Builder Fund |
| Futures | Currency | Expiration Date | Contracts | Notional Amount ($) | Notional Value ($) | Unrealized Appreciation (Depreciation) ($) | ||||||||||||||||||
| MSCI Mini Emerging Market Index | USD | 12/18/2020 | 480 | 26,363,075 | 26,445,600 | 82,525 | ||||||||||||||||||
| U.S. Treasury Long Bond | USD | 12/21/2020 | 29 | 5,106,795 | 5,001,594 | (105,201 | ) | |||||||||||||||||
| Ultra 10 Year U.S. Treasury Note | USD | 12/21/2020 | 10 | 1,586,643 | 1,572,813 | (13,830 | ) | |||||||||||||||||
| Ultra Long U.S. Treasury Bond | USD | 12/21/2020 | 62 | 13,683,735 | 13,330,000 | (353,735 | ) | |||||||||||||||||
| Total net unrealized depreciation |
| (400,616 | ) | |||||||||||||||||||||
At October 31, 2020, open futures contracts sold were as follows:
| Futures | Currency | Expiration Date | Contracts | Notional Amount ($) | Notional Value ($) | Unrealized Appreciation ($) | ||||||||||||||||||
| 5 Year U.S. Treasury Note | USD | 12/31/2020 | 114 | 14,336,109 | 14,318,578 | 17,531 | ||||||||||||||||||
| S&P 500 E-Mini Index | USD | 12/18/2020 | 95 | 16,209,301 | 15,507,325 | 701,976 | ||||||||||||||||||
| TOPIX Index | JPY | 12/10/2020 | 126 | 19,413,614 | 18,930,990 | 482,624 | ||||||||||||||||||
| Total unrealized appreciation |
| 1,202,131 | ||||||||||||||||||||||
At October 31, 2020, open interest rate swap contracts were as follows:
Centrally Cleared Swaps
| Cash Flows Paid by the Fund/ Frequency | Cash Flows Received by the Fund/ Frequency | Effective/ Expiration Date | Notional Amount ($) | Currency | Value ($) | Upfront Payments Paid/ (Received) ($) | Unrealized Depreciation ($) | |||||||||||||||||||
| Fixed — 2% Semi-Annually | Floating — 3-Month LIBOR Quarterly | | 1/21/2020 1/21/2030 | | 10,200,000 | USD | (1,144,575 | ) | (233,350 | ) | (911,225 | ) | ||||||||||||||
LIBOR: London Interbank Offered Rate; 3-month LIBOR rate as of October 31, 2020 is 0.216%.
At October 31, 2020, the Fund had the following open forward foreign currency contracts:
| Contracts to Deliver | In Exchange For | Settlement Date | Unrealized Appreciation ($) | Counterparty | ||||||||||||||||
| EUR | 3,300,000 | USD | 3,908,816 | 11/5/2020 | 65,301 | BNP Paribas SA | ||||||||||||||
The accompanying notes are an integral part of the financial statements.
| DWS Global Income Builder Fund | | | 39 |
| Currency Abbreviations | ||||||
| AUD Australian Dollar | GBP British Pound | |||||
| CHF Swiss Franc | JPY Japanese Yen | |||||
| EUR Euro | USD United States Dollar | |||||
For information on the Fund’s policy and additional disclosures regarding futures contracts, interest rate swap contracts and forward foreign currency contracts, please refer to the Derivatives section of Note B in the accompanying Notes to Financial Statements.
Fair Value Measurements
Various inputs are used in determining the value of the Fund’s investments. These inputs are summarized in three broad levels. Level 1 includes quoted prices in active markets for identical securities. Level 2 includes other significant observable inputs (including quoted prices for similar securities, interest rates, prepayment speeds and credit risk). Level 3 includes significant unobservable inputs (including the Fund’s own assumptions in determining the fair value of investments). The level assigned to the securities valuations may not be an indication of the risk or liquidity associated with investing in those securities.
The accompanying notes are an integral part of the financial statements.
| 40 | | | DWS Global Income Builder Fund |
The following is a summary of the inputs used as of October 31, 2020 in valuing the Fund’s investments. For information on the Fund’s policy regarding the valuation of investments, please refer to the Security Valuation section of Note A in the accompanying Notes to Financial Statements.
| Assets | Level 1 | Level 2 | Level 3 | Total | ||||||||||||
| Common Stocks | ||||||||||||||||
Communication Services | $ | 23,377,022 | $ | 13,695,172 | $ | — | $ | 37,072,194 | ||||||||
Consumer Discretionary | 29,036,642 | 9,483,835 | — | 38,520,477 | ||||||||||||
Consumer Staples | 16,119,545 | 8,037,177 | — | 24,156,722 | ||||||||||||
Energy | 4,359,003 | 1,212,298 | — | 5,571,301 | ||||||||||||
Financials | 20,126,273 | 27,168,275 | — | 47,294,548 | ||||||||||||
Health Care | 25,018,860 | 16,159,411 | — | 41,178,271 | ||||||||||||
Industrials | 13,175,784 | 15,019,510 | — | 28,195,294 | ||||||||||||
Information Technology | 87,776,670 | 11,228,145 | — | 99,004,815 | ||||||||||||
Materials | 8,943,698 | 8,029,652 | — | 16,973,350 | ||||||||||||
Real Estate | 5,894,438 | 4,712,851 | — | 10,607,289 | ||||||||||||
Utilities | 12,617,270 | 11,491,937 | — | 24,109,207 | ||||||||||||
| Preferred Stocks (k) | 34,269,542 | 865,969 | — | 35,135,511 | ||||||||||||
| Warrants | — | — | 16,712 | 16,712 | ||||||||||||
| Fixed Income Investments (k) | ||||||||||||||||
Corporate Bonds | — | 101,762,617 | — | 101,762,617 | ||||||||||||
Asset-Backed | — | 37,895,650 | — | 37,895,650 | ||||||||||||
Mortgage-Backed Securities Pass-Throughs | — | 33,264,279 | — | 33,264,279 | ||||||||||||
Commercial Mortgage-Backed Securities | — | 34,217,518 | — | 34,217,518 | ||||||||||||
Collateralized Mortgage Obligations | — | 36,441,254 | — | 36,441,254 | ||||||||||||
Government & Agency Obligations | — | 5,153,539 | — | 5,153,539 | ||||||||||||
Loan Participations and Assignments | — | 2,505,480 | — | 2,505,480 | ||||||||||||
Short-Term U.S. Treasury Obligations | — | 10,992,586 | — | 10,992,586 | ||||||||||||
| Exchange-Traded Funds | 26,327,146 | — | — | 26,327,146 | ||||||||||||
| Short-Term Investments (k) | 45,624,299 | — | — | 45,624,299 | ||||||||||||
| Derivatives (l) | ||||||||||||||||
Futures Contracts | 1,295,381 | — | — | 1,295,381 | ||||||||||||
Forward Foreign Currency Contracts | — | 65,301 | — | 65,301 | ||||||||||||
| Total | $ | 353,961,573 | $ | 389,402,456 | $ | 16,712 | $ | 743,380,741 | ||||||||
| Liabilities | Level 1 | Level 2 | Level 3 | Total | ||||||||||||
| Derivatives (l) | ||||||||||||||||
Futures Contracts | $ | (493,866 | ) | $ | — | $ | — | $ | (493,866 | ) | ||||||
Interest Rate Swap Contracts | — | (911,225 | ) | — | (911,225 | ) | ||||||||||
| Total | $ | (493,866 | ) | $ | (911,225 | ) | $ | — | $ | (1,405,091 | ) | |||||
| (k) | See Investment Portfolio for additional detailed categorizations. |
| (l) | Derivatives include unrealized appreciation (depreciation) on open futures contracts, interest rate swap contracts and forward foreign currency contracts. |
The accompanying notes are an integral part of the financial statements.
| DWS Global Income Builder Fund | | | 41 |
Statement of Assets and Liabilities
| as of October 31, 2020 | ||||
| Assets | ||||
Investments in non-affiliated securities, at value (cost $648,126,792) — including $29,783,886 of securities loaned | $ | 696,395,760 | ||
| Investment in DWS Government & Agency Securities Portfolio (cost $30,951,654)* | 30,951,654 | |||
| Investment in DWS Central Cash Management Government Fund (cost $14,672,645) | 14,672,645 | |||
| Cash | | 32,866 | | |
| Foreign currency, at value (cost $3,193,207) | 3,056,653 | |||
| Receivable for investments sold | 514,467 | |||
| Receivable for investments sold — when-issued/delayed delivery securities | 32,977,056 | |||
| Receivable for Fund shares sold | 118,753 | |||
| Dividends receivable | 1,034,584 | |||
| Interest receivable | 1,266,985 | |||
| Receivable for variation margin on futures contracts | 257,785 | |||
| Receivable for variation margin on centrally cleared swaps | 28,721 | |||
| Unrealized appreciation on forward foreign currency contracts | 65,301 | |||
| Foreign taxes recoverable | 477,317 | |||
| Other assets | 32,263 | |||
| Total assets | 781,882,810 | |||
| Liabilities | ||||
| Payable upon return of securities loaned | 30,951,654 | |||
| Payable for investments purchased — when-issued/delayed delivery securities | 67,685,435 | |||
| Payable for Fund shares redeemed | 183,281 | |||
| Accrued management fee | 220,733 | |||
| Accrued Trustees’ fees | 8,639 | |||
| Other accrued expenses and payables | 756,937 | |||
| Total liabilities | 99,806,679 | |||
| Net assets, at value | $ | 682,076,131 | ||
| * | Represents collateral on securities loaned. |
The accompanying notes are an integral part of the financial statements.
| 42 | | | DWS Global Income Builder Fund |
| Statement of Assets and Liabilities as of October 31, 2020 (continued) |
| Net Assets Consist of | ||||
| Distributable earnings (loss) | $ | 40,818,350 | ||
| Paid-in capital | 641,257,781 | |||
| Net assets, at value | $ | 682,076,131 | ||
| Net Asset Value | ||||
Class A | ||||
| Net Asset Value and redemption price per share ($487,105,913 ÷ 52,629,244 outstanding shares of beneficial interest, no par value, unlimited number of shares authorized) | $ | 9.26 | ||
| Maximum offering price per share (100 ÷ 94.25 of $9.26) | $ | 9.82 | ||
Class C | ||||
| Net Asset Value, offering and redemption price (subject to contingent deferred sales charge) per share ($8,194,793 ÷ 885,871 outstanding shares of beneficial interest, no par value, unlimited number of shares authorized) | $ | 9.25 | ||
Class R6 | ||||
| Net Asset Value, offering and redemption price per share ($6,806,957 ÷ 736,785 outstanding shares of beneficial interest, no par value, unlimited number of shares authorized) | $ | 9.24 | ||
Class S | ||||
| Net Asset Value, offering and redemption price per share ($163,215,375 ÷ 17,635,664 outstanding shares of beneficial interest, no par value, unlimited number of shares authorized) | $ | 9.25 | ||
Institutional Class | ||||
| Net Asset Value, offering and redemption price per share ($16,753,093 ÷ 1,812,288 outstanding shares of beneficial interest, no par value, unlimited number of shares authorized) | $ | 9.24 | ||
The accompanying notes are an integral part of the financial statements.
| DWS Global Income Builder Fund | | | 43 |
| for the year ended October 31, 2020 |
| |||
| Investment Income | ||||
| Income: | ||||
| Dividends (net of foreign taxes withheld of $718,174) | $ | 15,355,359 | ||
| Interest (net of foreign taxes withheld of $498) | 7,373,901 | |||
| Income distributions — DWS Central Cash Management Government Fund | 166,965 | |||
| Securities lending income, net of borrower rebates | 124,519 | |||
| Total income | 23,020,744 | |||
| Expenses: | ||||
| Management fee | 2,608,305 | |||
| Administration fee | 691,277 | |||
| Services to shareholders | 928,059 | |||
| Distribution and service fees | 1,255,401 | |||
| Custodian fee | 66,658 | |||
| Professional fees | 128,388 | |||
| Reports to shareholders | 86,370 | |||
| Registration fees | 76,512 | |||
| Trustees’ fees and expenses | 26,508 | |||
| Other | 71,804 | |||
| Total expenses | 5,939,282 | |||
| Net investment income | 17,081,462 | |||
The accompanying notes are an integral part of the financial statements.
| 44 | | | DWS Global Income Builder Fund |
| Statement of Operations for the year ended October 31, 2020 (continued) |
| Realized and Unrealized Gain (Loss) | ||||
| Net realized gain (loss) from: | ||||
| Investments | $ | (9,565,999 | ) | |
| Swap contracts | 2,409,833 | |||
| Futures | 3,886,843 | |||
| Forward foreign currency contracts | (316,137 | ) | ||
| Foreign currency | 348,600 | |||
| Payments by affiliates (see Note G) | 8,242 | |||
| (3,228,618 | ) | |||
| Change in net unrealized appreciation (depreciation) on: | ||||
| Investments | (17,395,809 | ) | ||
| Swap contracts | (49,357 | ) | ||
| Futures | 2,901,959 | |||
| Forward foreign currency contracts | 171,464 | |||
| Foreign currency | (203,305 | ) | ||
| (14,575,048 | ) | |||
| Net gain (loss) | (17,803,666 | ) | ||
| Net increase (decrease) in net assets resulting from operations | $ | (722,204 | ) | |
The accompanying notes are an integral part of the financial statements.
| DWS Global Income Builder Fund | | | 45 |
Statements of Changes in Net Assets
| Years Ended October 31, | ||||||||
| Increase (Decrease) in Net Assets | 2020 | 2019 | ||||||
| Operations: | ||||||||
| Net investment income (loss) | $ | 17,081,462 | $ | 22,554,978 | ||||
| Net realized gain (loss) | (3,228,618 | ) | (10,826,138 | ) | ||||
| Change in net unrealized appreciation (depreciation) | (14,575,048 | ) | 70,027,293 | |||||
| Net increase (decrease) in net assets resulting from operations | (722,204 | ) | 81,756,133 | |||||
| Distributions to shareholders : | ||||||||
Class A | (15,253,014 | ) | (24,462,136 | ) | ||||
Class C | (201,614 | ) | (379,056 | ) | ||||
Class R6 | (217,829 | ) | (171,135 | ) | ||||
Class S | (5,463,828 | ) | (8,751,345 | ) | ||||
Institutional Class | (508,321 | ) | (469,114 | ) | ||||
| Total distributions | (21,644,606 | ) | (34,232,786 | ) | ||||
| Fund share transactions: | ||||||||
| Proceeds from shares sold | 31,584,585 | 30,243,414 | ||||||
| Reinvestment of distributions | 20,799,431 | 32,855,005 | ||||||
| Payments for shares redeemed | (96,980,341 | ) | (100,692,121 | ) | ||||
| Net increase (decrease) in net assets from Fund share transactions | (44,596,325 | ) | (37,593,702 | ) | ||||
| Increase (decrease) in net assets | (66,963,135 | ) | 9,929,645 | |||||
| Net assets at beginning of period | 749,039,266 | 739,109,621 | ||||||
| Net assets at end of period | $ | 682,076,131 | $ | 749,039,266 | ||||
The accompanying notes are an integral part of the financial statements.
| 46 | | | DWS Global Income Builder Fund |
DWS Global Income Builder Fund — Class A
| Years Ended October 31, | ||||||||||||||||||||
| 2020 | 2019 | 2018 | 2017 | 2016 | ||||||||||||||||
| Selected Per Share Data | ||||||||||||||||||||
| Net asset value, beginning of period | $9.55 | $8.97 | $10.06 | $8.89 | $8.91 | |||||||||||||||
| Income (loss) from investment operations: | ||||||||||||||||||||
Net investment incomea | .22 | .28 | .28 | .26 | .21 | |||||||||||||||
Net realized and unrealized gain (loss) | (.23 | ) | .73 | (.36 | ) | 1.18 | .03 | |||||||||||||
Total from investment operations | (.01 | ) | 1.01 | (.08 | ) | 1.44 | .24 | |||||||||||||
| Less distributions from: | ||||||||||||||||||||
Net investment income | (.28 | ) | (.36 | ) | (.34 | ) | (.27 | ) | (.26 | ) | ||||||||||
Net realized gains | — | (.07 | ) | (.67 | ) | — | — | |||||||||||||
Total distributions | (.28 | ) | (.43 | ) | (1.01 | ) | (.27 | ) | (.26 | ) | ||||||||||
| Net asset value, end of period | $9.26 | $9.55 | $8.97 | $10.06 | $8.89 | |||||||||||||||
| Total Return (%)b | .07 | 11.57 | (1.11 | ) | 16.39 | 2.82 | ||||||||||||||
| Ratios to Average Net Assets and Supplemental Data |
| |||||||||||||||||||
| Net assets, end of period ($ millions) | 487 | 538 | 534 | 603 | 582 | |||||||||||||||
| Ratio of expenses (%) | .89 | .91 | .90 | .91 | .92 | |||||||||||||||
| Ratio of net investment income (%) | 2.38 | 3.02 | 2.93 | 2.71 | 2.39 | |||||||||||||||
| Portfolio turnover rate (%) | 131 | 161 | 67 | 137 | 123 | |||||||||||||||
| a | Based on average shares outstanding during the period. |
| b | Total return does not reflect the effect of any sales charges. |
The accompanying notes are an integral part of the financial statements.
| DWS Global Income Builder Fund | | | 47 |
DWS Global Income Builder Fund — Class C
| Years Ended October 31, | ||||||||||||||||||||||
| 2020 | 2019 | 2018 | 2017 | 2016 | ||||||||||||||||||
| Selected Per Share Data | ||||||||||||||||||||||
| Net asset value, beginning of period | $9.55 | $8.96 | $10.05 | $8.88 | $8.90 | |||||||||||||||||
| Income (loss) from investment operations: | ||||||||||||||||||||||
Net investment incomea | .15 | .21 | .21 | .18 | .14 | |||||||||||||||||
Net realized and unrealized gain (loss) | (.24 | ) | .73 | (.37 | ) | 1.18 | .03 | |||||||||||||||
Total from investment operations | (.09 | ) | .94 | (.16 | ) | 1.36 | .17 | |||||||||||||||
| Less distributions from: | ||||||||||||||||||||||
Net investment income | (.21 | ) | (.28 | ) | (.26 | ) | (.19 | ) | (.19 | ) | ||||||||||||
Net realized gains | — | (.07 | ) | (.67 | ) | — | — | |||||||||||||||
Total distributions | (.21 | ) | (.35 | ) | (.93 | ) | (.19 | ) | (.19 | ) | ||||||||||||
| Net asset value, end of period | $9.25 | $9.55 | $8.96 | $10.05 | $8.88 | |||||||||||||||||
| Total Return (%)b | (.82 | ) | 10.83 | (1.91 | ) | 15.47 | c | 2.00 | ||||||||||||||
| Ratios to Average Net Assets and Supplemental Data |
| |||||||||||||||||||||
| Net assets, end of period ($ millions) | 8 | 9 | 10 | 20 | 20 | |||||||||||||||||
| Ratio of expenses before expense reductions (%) | 1.69 | 1.68 | 1.65 | 1.74 | 1.72 | |||||||||||||||||
| Ratio of expenses after expense reductions (%) | 1.69 | 1.68 | 1.65 | 1.72 | 1.72 | |||||||||||||||||
| Ratio of net investment income (%) | 1.58 | 2.26 | 2.18 | 1.90 | 1.59 | |||||||||||||||||
| Portfolio turnover rate (%) | 131 | 161 | 67 | 137 | 123 | |||||||||||||||||
| a | Based on average shares outstanding during the period. |
| b | Total return does not reflect the effect of any sales charges. |
| c | Total return would have been lower had certain expenses not been reduced. |
The accompanying notes are an integral part of the financial statements.
| 48 | | | DWS Global Income Builder Fund |
DWS Global Income Builder Fund — Class R6
| Years Ended October 31, | ||||||||||||||||||||
| 2020 | 2019 | 2018 | 2017 | 2016 | ||||||||||||||||
| Selected Per Share Data | ||||||||||||||||||||
| Net asset value, beginning of period | $9.54 | $8.95 | $10.04 | $8.87 | $8.88 | |||||||||||||||
| Income (loss) from investment operations: | ||||||||||||||||||||
Net investment incomea | .25 | .29 | .31 | .32 | .22 | |||||||||||||||
Net realized and unrealized gain (loss) | (.24 | ) | .76 | (.36 | ) | 1.14 | .04 | |||||||||||||
Total from investment operations | .01 | 1.05 | (.05 | ) | 1.46 | .26 | ||||||||||||||
| Less distributions from: | ||||||||||||||||||||
Net investment income | (.31 | ) | (.39 | ) | (.37 | ) | (.29 | ) | (.27 | ) | ||||||||||
Net realized gains | — | (.07 | ) | (.67 | ) | — | — | |||||||||||||
Total distributions | (.31 | ) | (.46 | ) | (1.04 | ) | (.29 | ) | (.27 | ) | ||||||||||
| Net asset value, end of period | $9.24 | $9.54 | $8.95 | $10.04 | $8.87 | |||||||||||||||
| Total Return (%) | .30 | 12.09 | (.78 | ) | 16.74 | 3.08 | ||||||||||||||
| Ratios to Average Net Assets and Supplemental Data |
| |||||||||||||||||||
| Net assets, end of period ($ millions) | 7 | 7 | 1 | 4 | .05 | |||||||||||||||
| Ratio of expenses (%) | .56 | .58 | .56 | .57 | .67 | |||||||||||||||
| Ratio of net investment income (%) | 2.70 | 3.15 | 3.19 | 3.28 | 2.58 | |||||||||||||||
| Portfolio turnover rate (%) | 131 | 161 | 67 | 137 | 123 | |||||||||||||||
| a | Based on average shares outstanding during the period. |
The accompanying notes are an integral part of the financial statements.
| DWS Global Income Builder Fund | | | 49 |
DWS Global Income Builder Fund — Class S
| Years Ended October 31, | ||||||||||||||||||||||
| 2020 | 2019 | 2018 | 2017 | 2016 | ||||||||||||||||||
| Selected Per Share Data | ||||||||||||||||||||||
| Net asset value, beginning of period | $9.55 | $8.97 | $10.06 | $8.89 | $8.91 | |||||||||||||||||
| Income (loss) from investment operations: | ||||||||||||||||||||||
Net investment incomea | .24 | .29 | .30 | .28 | .23 | |||||||||||||||||
Net realized and unrealized gain (loss) | (.24 | ) | .74 | (.36 | ) | 1.18 | .03 | |||||||||||||||
Total from investment operations | (.00 | )* | 1.03 | (.06 | ) | 1.46 | .26 | |||||||||||||||
| Less distributions from: | ||||||||||||||||||||||
Net investment income | (.30 | ) | (.38 | ) | (.36 | ) | (.29 | ) | (.28 | ) | ||||||||||||
Net realized gains | — | (.07 | ) | (.67 | ) | — | — | |||||||||||||||
Total distributions | (.30 | ) | (.45 | ) | (1.03 | ) | (.29 | ) | (.28 | ) | ||||||||||||
| Net asset value, end of period | $9.25 | $9.55 | $8.97 | $10.06 | $8.89 | |||||||||||||||||
| Total Return (%) | .17 | 11.81 | (.90 | ) | 16.62 | 3.02 | ||||||||||||||||
| Ratios to Average Net Assets and Supplemental Data |
| |||||||||||||||||||||
| Net assets, end of period ($ millions) | 163 | 186 | 182 | 195 | 186 | |||||||||||||||||
| Ratio of expenses (%) | .69 | .71 | .69 | .70 | .71 | |||||||||||||||||
| Ratio of net investment income (%) | 2.58 | 3.21 | 3.15 | 2.92 | 2.60 | |||||||||||||||||
| Portfolio turnover rate (%) | 131 | 161 | 67 | 137 | 123 | |||||||||||||||||
| a | Based on average shares outstanding during the period. |
| * | Amount is less than $.005. |
The accompanying notes are an integral part of the financial statements.
| 50 | | | DWS Global Income Builder Fund |
DWS Global Income Builder Fund — Institutional Class
Years Ended October 31, | ||||||||||||||||||||
| 2020 | 2019 | 2018 | 2017 | 2016 | ||||||||||||||||
| Selected Per Share Data | ||||||||||||||||||||
| Net asset value, beginning of period | $9.54 | $8.95 | $10.05 | $8.88 | $8.90 | |||||||||||||||
| Income (loss) from investment operations: | ||||||||||||||||||||
Net investment incomea | .24 | .30 | .30 | .28 | .23 | |||||||||||||||
Net realized and unrealized gain (loss) | (.24 | ) | .74 | (.37 | ) | 1.18 | .03 | |||||||||||||
Total from investment operations | (.00 | )* | 1.04 | (.07 | ) | 1.46 | .26 | |||||||||||||
| Less distributions from: | ||||||||||||||||||||
Net investment income | (.30 | ) | (.38 | ) | (.36 | ) | (.29 | ) | (.28 | ) | ||||||||||
Net realized gains | — | (.07 | ) | (.67 | ) | — | — | |||||||||||||
Total distributions | (.30 | ) | (.45 | ) | (1.03 | ) | (.29 | ) | (.28 | ) | ||||||||||
| Net asset value, end of period | $9.24 | $9.54 | $8.95 | $10.05 | $8.88 | |||||||||||||||
| Total Return (%) | .20 | 11.97 | (.99 | ) | 16.55 | 3.06 | ||||||||||||||
| Ratios to Average Net Assets and Supplemental Data |
| |||||||||||||||||||
| Net assets, end of period ($ millions) | 17 | 9 | 12 | 10 | 8 | |||||||||||||||
| Ratio of expenses (%) | .66 | .68 | .66 | .69 | .69 | |||||||||||||||
| Ratio of net investment income (%) | 2.59 | 3.32 | 3.18 | 2.94 | 2.63 | |||||||||||||||
| Portfolio turnover rate (%) | 131 | 161 | 67 | 137 | 123 | |||||||||||||||
| a | Based on average shares outstanding during the period. |
| * | Amount is less than $.005. |
The accompanying notes are an integral part of the financial statements.
| DWS Global Income Builder Fund | | | 51 |
| Notes to Financial Statements |
A. Organization and Significant Accounting Policies
DWS Global Income Builder Fund (the “Fund”) is a diversified series of Deutsche DWS Market Trust (the “Trust”), which is registered under the Investment Company Act of 1940, as amended (the “1940 Act”), as an open-end management investment company organized as a Massachusetts business trust.
The Fund offers multiple classes of shares which provide investors with different purchase options. Class A shares are subject to an initial sales charge. Class C shares are not subject to an initial sales charge but are subject to higher ongoing expenses than Class A shares and a contingent deferred sales charge payable upon certain redemptions within one year of purchase. Class C shares automatically convert to Class A shares in the same fund after 10 years, provided that the fund or the financial intermediary through which the shareholder purchased the Class C shares has records verifying that the Class C shares have been held for at least 10 years. Class R6 shares are not subject to initial or contingent deferred sales charges and are generally available only to certain retirement plans. Class S shares are not subject to initial or contingent deferred sales charges and are available through certain intermediary relationships with financial services firms, or can be purchased by establishing an account directly with the Fund’s transfer agent. Institutional Class shares are not subject to initial or contingent deferred sales charges and are generally available only to qualified institutions.
Investment income, realized and unrealized gains and losses, and certain fund-level expenses and expense reductions, if any, are borne pro rata on the basis of relative net assets by the holders of all classes of shares, except that each class bears certain expenses unique to that class such as distribution and service fees, services to shareholders and certain other class-specific expenses. Differences in class-level expenses may result in payment of different per share dividends by class. All shares of the Fund have equal rights with respect to voting subject to class-specific arrangements.
The Fund’s financial statements are prepared in accordance with accounting principles generally accepted in the United States of America (“U.S. GAAP”) which require the use of management estimates. Actual results could differ from those estimates. The Fund qualifies as an investment company under Topic 946 of Accounting Standards Codification of U.S. GAAP. The policies described below are followed consistently by the Fund in the preparation of its financial statements.
Security Valuation. Investments are stated at value determined as of the close of regular trading on the New York Stock Exchange on each day the exchange is open for trading.
| 52 | | | DWS Global Income Builder Fund |
Various inputs are used in determining the value of the Fund’s investments. These inputs are summarized in three broad levels. Level 1 includes quoted prices in active markets for identical securities. Level 2 includes other significant observable inputs (including quoted prices for similar securities, interest rates, prepayment speeds and credit risk). Level 3 includes significant unobservable inputs (including the Fund’s own assumptions in determining the fair value of investments). The level assigned to the securities valuations may not be an indication of the risk or liquidity associated with investing in those securities.
Equity securities and exchange-traded funds (“ETFs”) are valued at the most recent sale price or official closing price reported on the exchange (U.S. or foreign) or over-the-counter market on which they trade. Equity securities or ETFs for which no sales are reported are valued at the calculated mean between the most recent bid and asked quotations on the relevant market or, if a mean cannot be determined, at the most recent bid quotation. Equity securities or ETFs are generally categorized as Level 1 securities. For certain international equity securities, in order to adjust for events which may occur between the close of the foreign exchanges and the close of the New York Stock Exchange, a fair valuation model may be used. This fair valuation model takes into account comparisons to the valuation of American Depository Receipts (ADRs), exchange-traded funds, futures contracts and certain indices and these securities are categorized as Level 2.
Debt securities and loan participations and assignments are valued at prices supplied by independent pricing services approved by the Fund’s Board. Such services may use various pricing techniques which take into account appropriate factors such as yield, quality, coupon rate, maturity, type of issue, trading characteristics, prepayment speeds and other data, as well as broker quotes. If the pricing services are unable to provide valuations, debt securities are valued at the average of the most recent reliable bid quotations or evaluated prices, as applicable, obtained from broker-dealers, and loan participations and assignments are valued at the mean of the most recent bid and ask quotations or evaluated prices, as applicable, obtained from broker-dealers. These securities are generally categorized as Level 2. Certain securities may be valued on the basis of a price provided by a single source or broker-dealer. No active trading market may exist for some senior loans and they may be subject to restrictions on resale. The inability to dispose of senior loans in a timely fashion could result in losses. These securities are generally categorized as Level 3.
Investments in open-end investment companies are valued at their net asset value each business day and are categorized as Level 1.
| DWS Global Income Builder Fund | | | 53 |
Futures contracts are generally valued at the settlement prices established each day on the exchange on which they are traded and are categorized as Level 1.
Forward currency contracts are valued at the prevailing forward exchange rate of the underlying currencies and are categorized as Level 2.
Swap contracts are valued daily based upon prices supplied by a Board approved pricing vendor, if available, and otherwise are valued at the price provided by the broker-dealer. Swap contracts are generally categorized as Level 2.
Securities and other assets for which market quotations are not readily available or for which the above valuation procedures are deemed not to reflect fair value are valued in a manner that is intended to reflect their fair value as determined in accordance with procedures approved by the Board and are generally categorized as Level 3. In accordance with the Fund’s valuation procedures, factors considered in determining value may include, but are not limited to, the type of the security; the size of the holding; the initial cost of the security; the existence of any contractual restrictions on the security’s disposition; the price and extent of public trading in similar securities of the issuer or of comparable companies; quotations or evaluated prices from broker-dealers and/or pricing services; information obtained from the issuer, analysts, and/or the appropriate stock exchange (for exchange-traded securities); an analysis of the company’s or issuer’s financial statements; an evaluation of the forces that influence the issuer and the market(s) in which the security is purchased and sold; and with respect to debt securities, the maturity, coupon, creditworthiness, currency denomination and the movement of the market in which the security is normally traded. The value determined under these procedures may differ from published values for the same securities.
Disclosure about the classification of fair value measurements is included in a table following the Fund’s Investment Portfolio.
Foreign Currency Translations. The books and records of the Fund are maintained in U.S. dollars. Investment securities and other assets and liabilities denominated in a foreign currency are translated into U.S. dollars at the prevailing exchange rates at period end. Purchases and sales of investment securities, income and expenses are translated into U.S. dollars at the prevailing exchange rates on the respective dates of the transactions.
Net realized and unrealized gains and losses on foreign currency transactions represent net gains and losses between trade and settlement dates on securities transactions, the acquisition and disposition of foreign currencies, and the difference between the amount
| 54 | | | DWS Global Income Builder Fund |
of net investment income accrued and the U.S. dollar amount actually received. The portion of both realized and unrealized gains and losses on investments that results from fluctuations in foreign currency exchange rates is not separately disclosed but is included with net realized and unrealized gain/appreciation and loss/depreciation on investments.
Securities Lending. Deutsche Bank AG, as lending agent, lends securities of the Fund to certain financial institutions under the terms of its securities lending agreement. During the term of the loans, the Fund continues to receive interest and dividends generated by the securities and to participate in any changes in their market value. The Fund requires the borrowers of the securities to maintain collateral with the Fund consisting of either cash or liquid, unencumbered assets having a value at least equal to the value of the securities loaned. When the collateral falls below specified amounts, the lending agent will use its best effort to obtain additional collateral on the next business day to meet required amounts under the securities lending agreement. As of period end, any securities on loan were collateralized by cash. During the year ended October 31, 2020, the Fund invested the cash collateral into a joint trading account in DWS Government & Agency Securities Portfolio, an affiliated money market fund managed by DWS Investment Management Americas, Inc. DWS Investment Management Americas, Inc. receives a management/administration fee (0.06% annualized effective rate as of October 31, 2020) on the cash collateral invested in DWS Government & Agency Securities Portfolio. The Fund receives compensation for lending its securities either in the form of fees or by earning interest on invested cash collateral net of borrower rebates and fees paid to a lending agent. Either the Fund or the borrower may terminate the loan at any time, and the borrower, after notice, is required to return borrowed securities within a standard time period. There may be risks of delay and costs in recovery of securities or even loss of rights in the collateral should the borrower of the securities fail financially. If the Fund is not able to recover securities lent, the Fund may sell the collateral and purchase a replacement investment in the market, incurring the risk that the value of the replacement security is greater than the value of the collateral. The Fund is also subject to all investment risks associated with the reinvestment of any cash collateral received, including, but not limited to, interest rate, credit and liquidity risk associated with such investments.
As of October 31, 2020, the Fund had securities on loan. The value of the related collateral exceeded the value of the securities loaned at period end.
| DWS Global Income Builder Fund | | | 55 |
Remaining Contractual Maturity of the Agreements as of October 31, 2020
| Overnight and Continuous | <30 Days | Between 30 & 90 Days | >90 Days | Total | ||||||||||||||||
Securities Lending Transactions |
| |||||||||||||||||||
| Common Stocks | $ | 2,579,994 | $ | — | $ | — | $ | — | $ | 2,579,994 | ||||||||||
| Corporate Bonds | 1,058,660 | — | — | — | 1,058,660 | |||||||||||||||
| Exchange-Traded Funds | 27,313,000 | — | — | — | 27,313,000 | |||||||||||||||
| Total Borrowings | $ | 30,951,654 | $ | — | $ | — | $ | — | $ | 30,951,654 | ||||||||||
| Gross amount of recognized liabilities for securities lending transactions |
| $ | 30,951,654 | |||||||||||||||||
Loan Participations and Assignments. Loan Participations and Assignments are portions of loans originated by banks and sold in pieces to investors. These floating-rate loans (“Loans”) in which the Fund invests are arranged between the borrower and one or more financial institutions (“Lenders”). These Loans may take the form of Senior Loans, which are corporate obligations often issued in connection with recapitalizations, acquisitions, leveraged buyouts and refinancing. The Fund invests in such Loans in the form of participations in Loans (“Participations”) or assignments of all or a portion of Loans from third parties (“Assignments”). Participations typically result in the Fund having a contractual relationship with only the Lender, not with the borrower. The Fund has the right to receive payments of principal, interest and any fees to which it is entitled from the Lender selling the Participation and only upon receipt by the Lender of the payments from the borrower. In connection with purchasing Participations, the Fund generally has no right to enforce compliance by the borrower with the terms of the loan agreement relating to the Loan, or any rights of set off against the borrower, and the Fund will not benefit directly from any collateral supporting the Loan in which it has purchased the Participation. As a result, the Fund assumes the credit risk of both the borrower and the Lender that is selling the Participation. Assignments typically result in the Fund having a direct contractual relationship with the borrower, and the Fund may enforce compliance by the borrower with the terms of the loan agreement. Loans held by the Fund are generally in the form of Assignments, but the Fund may also invest in Participations. If affiliates of the Advisor participate in the primary and secondary market for senior loans, legal limitations may restrict the Fund’s ability to participate in restructuring or acquiring some senior loans. All Loans involve interest rate risk, liquidity risk and credit risk, including the potential default or insolvency of the borrower.
| 56 | | | DWS Global Income Builder Fund |
When-Issued/Delayed Delivery Securities. The Fund may purchase or sell securities with delivery or payment to occur at a later date beyond the normal settlement period. At the time the Fund enters into a commitment to purchase or sell a security, the transaction is recorded and the value of the transaction is reflected in the net asset value. The price of such security and the date when the security will be delivered and paid for are fixed at the time the transaction is negotiated. The value of the security may vary with market fluctuations. At the time the Fund enters into a purchase transaction it is required to segregate cash or other liquid assets at least equal to the amount of the commitment. Additionally, the Fund may be required to post securities and/or cash collateral in accordance with the terms of the commitment.
Certain risks may arise upon entering into when-issued or delayed delivery transactions from the potential inability of counterparties to meet the terms of their contracts or if the issuer does not issue the securities due to political, economic, or other factors. Additionally, losses may arise due to changes in the value of the underlying securities.
Federal Income Taxes. The Fund’s policy is to comply with the requirements of the Internal Revenue Code, as amended, which are applicable to regulated investment companies, and to distribute all of its taxable income to its shareholders.
At October 31, 2020, the Fund had a net tax basis capital loss carryforward of approximately $7,898,000 of short-term losses, which may be applied against realized net taxable capital gains indefinitely.
The Fund has reviewed the tax positions for the open tax years as of October 31, 2020 and has determined that no provision for income tax and/or uncertain tax positions is required in the Fund’s financial statements. The Fund’s federal tax returns for the prior three fiscal years remain open subject to examination by the Internal Revenue Service.
Distribution of Income and Gains. Distributions from net investment income of the Fund are declared and distributed to shareholders quarterly. Net realized gains from investment transactions, in excess of available capital loss carryforwards, would be taxable to the Fund if not distributed, and, therefore, will be distributed to shareholders at least annually. The Fund may also make additional distributions for tax purposes if necessary.
The timing and characterization of certain income and capital gain distributions are determined annually in accordance with federal tax regulations which may differ from accounting principles generally accepted in the United States of America. These differences primarily relate to paydown losses on mortgage-backed securities, premium amortization on debt securities, investments in futures, swap contracts, forward foreign currency exchange contracts, recognition of certain
| DWS Global Income Builder Fund | | | 57 |
foreign currency gains (losses) as ordinary income (loss) and certain securities sold at a loss. As a result, net investment income (loss) and net realized gain (loss) on investment transactions for a reporting period may differ significantly from distributions during such period. Accordingly, the Fund may periodically make reclassifications among certain of its capital accounts without impacting the net asset value of the Fund.
At October 31, 2020, the Fund’s components of distributable earnings (accumulated losses) on a tax basis were as follows:
| Undistributed ordinary income* | $ | 2,961,963 | ||
| Capital loss carryforwards | $ | (7,898,000 | ) | |
| Net unrealized appreciation (depreciation) on investments | $ | 45,862,088 |
At October 31, 2020, the aggregate cost of investments for federal income tax purposes was $695,679,401. The net unrealized appreciation for all investments based on tax cost was $45,862,088, consisting of aggregate gross unrealized appreciation for all investments for which there was an excess of value over tax cost of $72,318,386, and aggregate gross unrealized depreciation for all investments for which there was an excess of tax cost over value of $26,456,298.
In addition, the tax character of distributions paid to shareholders by the Fund is summarized as follows:
| Years Ended October 31, | ||||||||
| 2020 | 2019 | |||||||
| Distributions from ordinary income* | $ | 21,644,606 | $ | 34,232,786 | ||||
| * | For tax purposes, short-term capital gain distributions are considered ordinary income distributions. |
Expenses. Expenses of the Trust arising in connection with a specific fund are allocated to that fund. Other Trust expenses which cannot be directly attributed to a fund are apportioned among the funds in the Trust based upon the relative net assets or other appropriate measures.
Contingencies. In the normal course of business, the Fund may enter into contracts with service providers that contain general indemnification clauses. The Fund’s maximum exposure under these arrangements is unknown, as this would involve future claims that may be made against the Fund that have not yet been made. However, based on experience, the Fund expects the risk of loss to be remote.
Other. Investment transactions are accounted for on a trade date plus one basis for daily net asset value calculations. However, for financial reporting purposes, investment transactions are reported on trade date. Interest income is recorded on the accrual basis. Dividend income is recorded on the ex-dividend date net of foreign withholding taxes. Certain
| 58 | | | DWS Global Income Builder Fund |
dividends from foreign securities may be recorded subsequent to the ex-dividend date as soon as the Fund is informed of such dividends. Realized gains and losses from investment transactions are recorded on an identified cost basis. Proceeds from litigation payments, if any, are included in net realized gain (loss) from investments. All premiums and discounts are amortized/accreted for financial reporting purposes, with the exception of securities in default of principal.
B. Derivative Instruments
Swaps. A swap is a contract between two parties to exchange future cash flows at periodic intervals based on the notional amount of the swap. A bilateral swap is a transaction between the fund and a counterparty where cash flows are exchanged between the two parties. A centrally cleared swap is a transaction executed between the fund and a counterparty, then cleared by a clearing member through a central clearinghouse. The central clearinghouse serves as the counterparty, with whom the fund exchanges cash flows.
The value of a swap is adjusted daily, and the change in value, if any, is recorded as unrealized appreciation or depreciation in the Statement of Assets and Liabilities. Gains or losses are realized when the swap expires or is closed. Certain risks may arise when entering into swap transactions including counterparty default; liquidity; or unfavorable changes in interest rates or the value of the underlying reference security, commodity or index. In connection with bilateral swaps, securities and/or cash may be identified as collateral in accordance with the terms of the swap agreement to provide assets of value and recourse in the event of default. The maximum counterparty credit risk is the net present value of the cash flows to be received from or paid to the counterparty over the term of the swap, to the extent that this amount is beneficial to the Fund, in addition to any related collateral posted to the counterparty by the Fund. This risk may be partially reduced by a master netting arrangement between the Fund and the counterparty. Upon entering into a centrally cleared swap, the Fund is required to deposit with a financial intermediary cash or securities (“initial margin”) in an amount equal to a certain percentage of the notional amount of the swap. Subsequent payments (“variation margin”) are made or received by the Fund dependent upon the daily fluctuations in the value of the swap. In a cleared swap transaction, counterparty risk is minimized as the central clearinghouse acts as the counterparty.
An upfront payment, if any, made by the Fund is recorded as an asset in the Statement of Assets and Liabilities. An upfront payment, if any, received by the Fund is recorded as a liability in the Statement of Assets and Liabilities. Payments received or made at the end of the measurement period are recorded as realized gain or loss in the Statement of Operations.
| DWS Global Income Builder Fund | | | 59 |
Interest Rate Swaps. Interest rate swaps are agreements in which the Fund agrees to pay to the counterparty a fixed rate payment in exchange for the counterparty agreeing to pay to the Fund a variable rate payment, or the Fund agrees to receive from the counterparty a fixed rate payment in exchange for the counterparty agreeing to receive from the Fund a variable rate payment. The payment obligations are based on the notional amount of the swap. For the year ended October 31, 2020, the Fund entered into interest rate swap agreements to gain exposure to different parts of the yield curve while managing overall duration.
A summary of the open interest rate swap contracts as of October 31, 2020 is included in a table following the Fund’s Investment Portfolio. For the year ended October 31, 2020, the investment in interest rate swap contracts had a total notional amount generally indicative of a range from $10,200,000 to $38,700,000.
Credit Default Swaps. Credit default swaps are agreements between a buyer and a seller of protection against predefined credit events for the reference entity. The Fund may enter into credit default swaps to gain exposure to an underlying issuer’s credit quality characteristics without directly investing in that issuer or to hedge against the risk of a credit event on debt securities. As a seller of a credit default swap, the Fund is required to pay the par (or other agreed-upon) value of the referenced entity to the counterparty with the occurrence of a credit event by a third party, such as a U.S. or foreign corporate issuer, on the reference entity, which would likely result in a loss to the Fund. In return, the Fund receives from the counterparty a periodic stream of payments over the term of the swap provided that no credit event has occurred. If no credit event occurs, the Fund keeps the stream of payments with no payment obligations. The Fund may also buy credit default swaps, in which case the Fund functions as the counterparty referenced above. This involves the risk that the swap may expire worthless. It also involves counterparty risk that the seller may fail to satisfy its payment obligations to the Fund with the occurrence of a credit event. When the Fund sells a credit default swap, it will cover its commitment. This may be achieved by, among other methods, maintaining cash or liquid assets equal to the aggregate notional value of the reference entities for all outstanding credit default swaps sold by the Fund. For the year ended October 31, 2020, the Fund entered into credit default swap agreements to gain exposure to the underlying issuer’s credit quality characteristics and to hedge the risk of default or other specified credit events on portfolio assets.
Under the terms of a credit default swap, the Fund receives or makes periodic payments based on a specified interest rate on a fixed notional amount. These payments are recorded as a realized gain or loss in the Statement of Operations. Payments received or made as a result of a
| 60 | | | DWS Global Income Builder Fund |
credit event or termination of the swap are recognized, net of a proportional amount of the upfront payment, as realized gains or losses in the Statement of Operations.
There were no open credit default swap contracts as of October 31, 2020. For the year ended October 31, 2020, the investment in credit default swap contracts sold had a total notional amount generally indicative of a range from $0 to $18,300,000.
Futures Contracts. A futures contract is an agreement between a buyer or seller and an established futures exchange or its clearinghouse in which the buyer or seller agrees to take or make a delivery of a specific amount of a financial instrument at a specified price on a specific date (settlement date). For the year ended October 31, 2020, the Fund entered into interest rate futures to gain exposure to different parts of the yield curve while managing overall duration. The Fund also entered into interest rate futures contracts for non-hedging purposes to seek to enhance potential gains and entered into equity index futures in order to reduce the Fund’s exposure to, or as a substitute for direct investment in, the equity asset class.
Upon entering into a futures contract, the Fund is required to deposit with a financial intermediary cash or securities (“initial margin”) in an amount equal to a certain percentage of the face value indicated in the futures contract. Subsequent payments (“variation margin”) are made or received by the Fund dependent upon the daily fluctuations in the value and are recorded for financial reporting purposes as unrealized gains or losses by the Fund. Gains or losses are realized when the contract expires or is closed. Since all futures contracts are exchange traded, counterparty risk is minimized as the exchange’s clearinghouse acts as the counterparty and guarantees the futures against default.
Certain risks may arise upon entering into futures contracts, including the risk that an illiquid market will limit the Fund’s ability to close out a futures contract prior to the settlement date and the risk that the futures contract is not well correlated with the security, index or currency to which it relates. Risk of loss may exceed amounts disclosed in the Statement of Assets and Liabilities.
A summary of the open futures contracts as of October 31, 2020, is included in a table following the Fund’s Investment Portfolio. For the year ended October 31, 2020, the investment in futures contracts purchased had a total notional value generally indicative of a range from approximately $72,735,000 to $278,573,000, and the investment in futures contracts sold had a total notional value generally indicative of a range from approximately $42,443,000 to $59,724,000.
Forward Foreign Currency Exchange Contracts. A forward foreign currency exchange contract (“forward currency contract”) is a
| DWS Global Income Builder Fund | | | 61 |
commitment to purchase or sell a foreign currency at the settlement date at a negotiated rate. For the year ended October 31, 2020, the Fund entered into forward currency contracts in order to hedge its exposure to changes in foreign currency exchange rates on its foreign currency denominated portfolio holdings, to facilitate transactions in foreign currency denominated securities and for non-hedging purposes to seek to enhance potential gains.
Forward currency contracts are valued at the prevailing forward exchange rate of the underlying currencies and unrealized gain (loss) is recorded daily. On the settlement date of the forward currency contract, the Fund records a realized gain or loss equal to the difference between the value of the contract at the time it was opened and the value of the contract at the time it was closed. Certain risks may arise upon entering into forward currency contracts from the potential inability of counterparties to meet the terms of their contracts. The maximum counterparty credit risk to the Fund is measured by the unrealized gain on appreciated contracts. Additionally, when utilizing forward currency contracts to hedge, the Fund gives up the opportunity to profit from favorable exchange rate movements during the term of the contract.
A summary of the open forward currency contracts as of October 31, 2020 is included in a table following the Fund’s Investment Portfolio. For the year ended October 31, 2020, the investment in forward currency contracts short vs. U.S. dollars had a total contract value generally indicative of a range from approximately $3,573,000 to $10,278,000, and the investment in forward currency contracts long vs. U.S. dollars had a total contract value generally indicative of a range from $0 to approximately $3,308,000.
The following tables summarize the value of the Fund’s derivative instruments held as of October 31, 2020 and the related location in the accompanying Statement of Assets and Liabilities, presented by primary underlying risk exposure:
| Asset Derivatives | Forward Contracts | Futures Contracts | Total | |||||||||
| Equity Contracts (a) | $ | — | $ | 1,267,125 | $ | 1,267,125 | ||||||
| Interest Rate Contracts (a) | — | 28,256 | 28,256 | |||||||||
| Foreign Exchange Contracts (b) | 65,301 | — | 65,301 | |||||||||
| $ | 65,301 | $ | 1,295,381 | $ | 1,360,682 | |||||||
Each of the above derivatives is located in the following Statement of Assets and Liabilities
accounts:
| (a) | Includes cumulative appreciation of futures contracts as disclosed in the Investment Portfolio. Unsettled variation margin is disclosed separately within the Statement of Assets and Liabilities. |
| (b) | Unrealized appreciation on forward foreign currency contracts |
| 62 | | | DWS Global Income Builder Fund |
| Liability Derivatives | Swap Contracts | Futures Contracts | Total | |||||||||
| Equity Contracts (c) | $ | — | $ | (20,624 | ) | $ | (20,624 | ) | ||||
| Interest Rate Contracts (c) | (911,225 | ) | (473,242 | ) | (1,384,467 | ) | ||||||
| $ | (911,225 | ) | $ | (493,866 | ) | $ | (1,405,091 | ) | ||||
Each of the above derivatives is located in the following Statement of Assets and Liabilities accounts:
| (c) | Includes cumulative depreciation of futures and centrally cleared swap contracts as disclosed in the Investment Portfolio. Unsettled variation margin is disclosed separately within the Statement of Assets and Liabilities. |
Additionally, the amount of unrealized and realized gains and losses on derivative instruments recognized in Fund earnings during the year ended October 31, 2020 and the related location in the accompanying Statement of Operations is summarized in the following tables by primary underlying risk exposure:
| Realized Gain (Loss) | Forward Contracts | Swap Contracts | Futures Contracts | Total | ||||||||||||
| Equity Contracts (d) | $ | — | $ | — | $ | (1,787,694 | ) | $ | (1,787,694 | ) | ||||||
| Interest Rate Contracts (d) | — | (3,460,559 | ) | 5,674,537 | 2,213,978 | |||||||||||
| Credit Contracts (d) | — | 5,870,392 | — | 5,870,392 | ||||||||||||
| Foreign Exchange Contracts (d) | (316,137 | ) | — | — | (316,137 | ) | ||||||||||
| $ | (316,137 | ) | $ | 2,409,833 | $ | 3,886,843 | $ | 5,980,539 | ||||||||
Each of the above derivatives is located in the following Statement of Operations accounts:
| (d) | Net realized gain (loss) from forward foreign currency contracts, swap contracts and futures, respectively |
| Change in Appreciation (Depreciation) | Forward Contracts | Swap Contracts | Futures Contracts | Total | ||||||||||||
| Equity Contracts (e) | $ | — | $ | — | $ | 2,236,698 | $ | 2,236,698 | ||||||||
| Interest Rate Contracts (e) | — | 12,113 | 665,261 | 677,374 | ||||||||||||
| Credit Contracts (e) | — | (61,470 | ) | — | (61,470 | ) | ||||||||||
| Foreign Exchange Contracts (e) | 171,464 | — | — | 171,464 | ||||||||||||
| $ | 171,464 | $ | (49,357 | ) | $ | 2,901,959 | $ | 3,024,066 | ||||||||
Each of the above derivatives is located in the following Statement of Operations accounts:
| (e) | Change in net unrealized appreciation (depreciation) on forward foreign currency contracts, swap contracts and futures, respectively |
As of October 31, 2020, the Fund has transactions subject to enforceable master netting agreements which govern the terms of certain transactions, and reduce the counterparty risk associated with such transactions. Master netting agreements allow a Fund to close out and net total exposure to a counterparty in the event of a deterioration in the credit quality or contractual default with respect to all of the transactions
| DWS Global Income Builder Fund | | | 63 |
with a counterparty. As defined by the master netting agreement, the Fund may have collateral agreements with certain counterparties to mitigate risk. For financial reporting purposes the Statement of Assets and Liabilities generally shows derivatives assets and liabilities on a gross basis, which reflects the full risks and exposures prior to netting. A reconciliation of the gross amounts on the Statement of Assets and Liabilities to the net amounts by counterparty, including any collateral exposure, is included in the following tables:
| Counterparty | Gross Amounts of Assets Presented in the Statement of Assets and | Financial Instruments and Available | Non-Cash Collateral | Cash Collateral Received | Net Amount of Derivative | |||||||||||||||
| BNP Paribas SA | $ | 65,301 | $ | — | $ | — | — | $ | 65,301 | |||||||||||
C. Purchases and Sales of Securities
During the year ended October 31, 2020, purchases and sales of investment securities, excluding short-term investments, were as follows:
| Purchases | Sales | |||||||
| Non-U.S. Treasury Obligations | $ | 879,770,461 | $ | 846,268,962 | ||||
| U.S. Treasury Obligations | $ | 46,127,149 | $ | 46,657,319 | ||||
D. Related Parties
Management Agreement. Under the Investment Management Agreement with DWS Investment Management Americas, Inc. (“DIMA” or the “Advisor”), an indirect, wholly owned subsidiary of DWS Group GmbH & Co. KGaA (“DWS Group”), the Advisor directs the investments of the Fund in accordance with its investment objectives, policies and restrictions. The Advisor determines the securities, instruments and other contracts relating to investments to be purchased, sold or entered into by the Fund or delegates such responsibility to the Fund’s subadvisor.
Under the Management Agreement, the Fund pays a monthly management fee based on the Fund’s average daily net assets, computed and accrued daily and payable monthly at the following rates:
| First $1.5 billion of the Fund’s average daily net assets | .370% | |||
| Next $500 million of such net assets | .345% | |||
| Next $1.5 billion of such net assets | .310% | |||
| Next $2.0 billion of such net assets | .300% | |||
| Next $2.0 billion of such net assets | .290% | |||
| Next $2.5 billion of such net assets | .280% | |||
| Next $2.5 billion of such net assets | .270% | |||
| Over $12.5 billion of such net assets | .260% |
| 64 | | | DWS Global Income Builder Fund |
Accordingly, for the year ended October 31, 2020, the fee pursuant to the Investment Management Agreement was equivalent to an annual rate (exclusive of any applicable waivers/reimbursements) of 0.370% of the Fund’s average daily net assets.
For the period from November 1, 2019 through September 30, 2020, the Advisor had contractually agreed to waive its fees and/or reimburse certain operating expenses of the Fund to the extent necessary to maintain the total annual operating expenses (excluding certain expenses such as extraordinary expenses, taxes, brokerage and interest) of each class as follows:
| Class A | 1.27% | |||
| Class C | 2.02% | |||
| Class R6 | 1.02% | |||
| Class S | 1.02% | |||
| Institutional Class | 1.02% |
Effective October 1, 2020 through September 30, 2021, the Advisor has contractually agreed to waive its fees and/or reimburse certain operating expenses of the Fund to the extent necessary to maintain the total annual operating expenses (excluding certain expenses such as extraordinary expenses, taxes, brokerage and interest) of each class as follows:
| Class A | 1.20% | |||
| Class C | 1.95% | |||
| Class R6 | .95% | |||
| Class S | .95% | |||
| Institutional Class | .95% |
Administration Fee. Pursuant to an Administrative Services Agreement, DIMA provides most administrative services to the Fund. Prior to March 1, 2020, for all services provided under the Administrative Services Agreement, the Fund paid the Advisor an annual fee (“Administration Fee”) of 0.10% of the Fund’s average daily net assets, computed and accrued daily and payable monthly. Effective March 1, 2020, for all services provided under the Administrative Services Agreement, the Fund pays the Advisor an annual Administration Fee of 0.097% of the Fund’s average daily net assets, computed and accrued daily and payable monthly. For the year ended October 31, 2020, the Administration Fee was $691,277, of which $57,868 is unpaid.
Service Provider Fees. DWS Service Company (“DSC”), an affiliate of the Advisor, is the transfer agent, dividend-paying agent and shareholder service agent for the Fund. Pursuant to a sub-transfer agency agreement among DSC and DST Systems, Inc. (“DST”), DSC has delegated certain
| DWS Global Income Builder Fund | | | 65 |
transfer agent, dividend-paying agent and shareholder service agent functions to DST. DSC compensates DST out of the shareholder servicing fee it receives from the Fund. For the year ended October 31, 2020, the amounts charged to the Fund by DSC were as follows:
| Services to Shareholders | Total Aggregated | Unpaid at October 31, 2020 | ||||||
| Class A | $ | 274,020 | $ | 37,794 | ||||
| Class C | 3,147 | 468 | ||||||
| Class R6 | 583 | 101 | ||||||
| Class S | 155,213 | 21,112 | ||||||
| Institutional Class | 710 | 179 | ||||||
| $ | 433,673 | $ | 59,654 | |||||
In addition, for the year ended October 31, 2020, the amounts charged to the Fund for recordkeeping and other administrative services provided by unaffiliated third parties, included in the Statement of Operations under “Services to shareholders,” were as follows:
| Sub-Recordkeeping | Total Aggregated | |||
| Class A | $ | 240,783 | ||
| Class C | 9,097 | |||
| Class S | 76,461 | |||
| Institutional Class | 15,327 | |||
| $ | 341,668 | |||
Distribution and Service Fees. Under the Fund’s Class C 12b-1 Plan, DWS Distributors, Inc. (“DDI”), an affiliate of the Advisor, receives a fee (“Distribution Fee”) of 0.75% of the average daily net assets of Class C shares. In accordance with the Fund’s Underwriting and Distribution Services Agreement, DDI enters into related selling group agreements with various firms at various rates for sales of Class C shares. For the year ended October 31, 2020, the Distribution Fee was as follows:
| Distribution Fee | Total Aggregated | Unpaid at October 31, 2020 | ||||||
| Class C | $ | 66,488 | $ | 5,435 | ||||
In addition, DDI provides information and administrative services for a fee (“Service Fee”) to Class A and C shareholders at an annual rate of up to 0.25% of the average daily net assets for each such class. DDI in turn has various agreements with financial services firms that provide these services and pays these fees based upon the assets of shareholder
| 66 | | | DWS Global Income Builder Fund |
accounts the firms service. For the year ended October 31, 2020, the Service Fee was as follows:
| Service Fee | Total Aggregated | Unpaid at October 31, 2020 | Annual Rate | |||||||||
| Class A | $ | 1,166,871 | $ | 208,390 | .23 | % | ||||||
| Class C | 22,042 | 3,766 | .25 | % | ||||||||
| $ | 1,188,913 | $ | 212,156 | |||||||||
Underwriting and Contingent Deferred Sales Charge. DDI is the principal underwriter for the Fund. Underwriting commissions paid in connection with the distribution of Class A shares for the year ended October 31, 2020 aggregated $23,738.
In addition, DDI receives any contingent deferred sales charge (“CDSC”) from Class C share redemptions occurring within one year of purchase. There is no such charge upon redemption of any share appreciation or reinvested dividends. The CDSC is 1% of the value of the shares redeemed for Class C. For the year ended October 31, 2020, the CDSC for Class C shares aggregated $510. A deferred sales charge of up to 1% is assessed on certain redemptions for Class A shares.
Typesetting and Filing Service Fees. Under an agreement with the Fund, DIMA is compensated for providing certain pre-press and regulatory filing services to the Fund. For the year ended October 31, 2020, the amount charged to the Fund by DIMA included in the Statement of Operations under “Reports to shareholders” aggregated $23,049, of which $11,164 is unpaid.
Trustees’ Fees and Expenses. The Fund paid retainer fees to each Trustee not affiliated with the Advisor, plus specified amounts to the Board Chairperson and to each committee Chairperson.
Affiliated Cash Management Vehicles. The Fund may invest uninvested cash balances in DWS Central Cash Management Government Fund and DWS ESG Liquidity Fund, affiliated money market funds which are managed by the Advisor. Each affiliated money market fund is managed in accordance with Rule 2a-7 under the 1940 Act, which governs the quality, maturity, diversity and liquidity of instruments in which a money market fund may invest. DWS Central Cash Management Government Fund seeks to maintain a stable net asset value, and DWS ESG Liquidity Fund maintains a floating net asset value. The Fund indirectly bears its proportionate share of the expenses of each affiliated money market fund in which it invests. DWS Central Cash Management Government Fund does not pay the Advisor an investment management fee. To the extent that DWS ESG Liquidity Fund pays an investment management fee to the Advisor, the Advisor will waive an amount of the investment management fee payable to the Advisor by the Fund equal to the amount of the
| DWS Global Income Builder Fund | | | 67 |
investment management fee payable on the Fund’s assets invested in DWS ESG Liquidity Fund.
Security Lending Fees. Deutsche Bank AG serves as lending agent for the Fund. For the year ended October 31, 2020, the Fund incurred lending agent fees to Deutsche Bank AG for the amount of $9,160.
E. Line of Credit
The Fund and other affiliated funds (the “Participants”) share in a $350 million revolving credit facility provided by a syndication of banks. The Fund may borrow for temporary or emergency purposes, including the meeting of redemption requests that otherwise might require the untimely disposition of securities. The Participants are charged an annual commitment fee, which is allocated based on net assets, among each of the Participants. Interest is calculated at a rate per annum equal to the sum of the Federal Funds Rate plus 1.25 percent plus if the one-month LIBOR exceeds the Federal Funds Rate, the amount of such excess. The Fund may borrow up to a maximum of 33 percent of its net assets under the agreement. The Fund had no outstanding loans at October 31, 2020.
F. Fund Share Transactions
The following table summarizes share and dollar activity in the Fund:
| Year Ended October 31, 2020 | Year Ended October 31, 2019 | |||||||||||||||
| Shares | Dollars | Shares | Dollars | |||||||||||||
| Shares sold |
| |||||||||||||||
| Class A | 1,222,008 | $ | 11,213,184 | 1,099,405 | $ | 10,000,437 | ||||||||||
| Class C | 189,053 | 1,723,191 | 269,649 | 2,423,489 | ||||||||||||
| Class R6 | 117,107 | 1,075,473 | 712,683 | 6,084,862 | ||||||||||||
| Class S | 492,182 | 4,528,122 | 834,919 | 7,691,231 | ||||||||||||
| Institutional Class | 1,413,800 | 13,044,615 | 439,840 | 4,043,395 | ||||||||||||
| $ | 31,584,585 | $ | 30,243,414 | |||||||||||||
| Shares issued to shareholders in reinvestment of distributions |
| |||||||||||||||
| Class A | 1,662,332 | $ | 14,740,096 | 2,643,086 | $ | 23,622,744 | ||||||||||
| Class C | 22,552 | 198,967 | 41,859 | 372,477 | ||||||||||||
| Class R6 | 24,588 | 217,829 | 18,536 | 171,135 | ||||||||||||
| Class S | 579,712 | 5,141,581 | 920,044 | 8,230,447 | ||||||||||||
| Institutional Class | 56,619 | 500,958 | 51,813 | 458,202 | ||||||||||||
| $ | 20,799,431 | $ | 32,855,005 | |||||||||||||
| 68 | | | DWS Global Income Builder Fund |
| Year Ended October 31, 2020 | Year Ended October 31, 2019 | |||||||||||||||
| Shares | Dollars | Shares | Dollars | |||||||||||||
| Shares redeemed |
| |||||||||||||||
| Class A | (6,512,481 | ) | $ | (60,163,544 | ) | (7,081,764 | ) | $ | (64,766,774 | ) | ||||||
| Class C | (317,627 | ) | (2,950,645 | ) | (426,666 | ) | (3,856,573 | ) | ||||||||
| Class R6 | (89,136 | ) | (828,603 | ) | (109,530 | ) | (979,772 | ) | ||||||||
| Class S | (2,924,426 | ) | (27,173,393 | ) | (2,582,726 | ) | (23,602,830 | ) | ||||||||
| Institutional Class | (633,442 | ) | (5,864,156 | ) | (870,156 | ) | (7,486,172 | ) | ||||||||
| $ | (96,980,341 | ) | $ | (100,692,121 | ) | |||||||||||
| Net increase (decrease) |
| |||||||||||||||
| Class A | (3,628,141 | ) | $ | (34,210,264 | ) | (3,339,273 | ) | $ | (31,143,593 | ) | ||||||
| Class C | (106,022 | ) | (1,028,487 | ) | (115,158 | ) | (1,060,607 | ) | ||||||||
| Class R6 | 52,559 | 464,699 | 621,689 | 5,276,225 | ||||||||||||
| Class S | (1,852,532 | ) | (17,503,690 | ) | (827,763 | ) | (7,681,152 | ) | ||||||||
| Institutional Class | 836,977 | 7,681,417 | (378,503 | ) | (2,984,575 | ) | ||||||||||
| $ | (44,596,325 | ) | $ | (37,593,702 | ) | |||||||||||
G. Payments by Affiliates
During the year ended October 31, 2020, the Advisor agreed to reimburse the Fund $8,242 for losses incurred on trades executed incorrectly. The amount reimbursed was less than 0.01% of the Fund’s average net assets, thus having no impact on the Fund’s total return.
H. Other — COVID-19 Pandemic
A novel coronavirus known as COVID-19, declared a pandemic by the World Health Organization, has caused significant uncertainty, market volatility, decreased economic and other activity and increased government activity. Specifically, COVID-19 has led to significant death and morbidity, and concerns about its further spread have resulted in the closing of schools and non-essential businesses, cancellations, shelter-in place orders, lower consumer spending in certain sectors, social distancing, bans on large social gatherings and travel, quarantines, government economic stimulus measures, reduced productivity, rapid increases in unemployment, increased demand for and strain on government and medical resources, border closings and global trade and supply chain interruptions, among others. The full effects, duration and costs of the COVID-19 pandemic are impossible to predict, and the circumstances surrounding the COVID-19 pandemic will continue to evolve. The pandemic may affect certain countries, industries, economic
| DWS Global Income Builder Fund | | | 69 |
sectors, companies and investment products more than others, may exacerbate existing economic, political, or social tensions and may increase the probability of an economic recession or depression. The Fund and its investments may be adversely affected by the effects of the COVID-19 pandemic, and a prolonged pandemic may result in the Fund and its service providers experiencing operational difficulties in coordinating a remote workforce and implementing their business continuity plans, among others. Management will continue to monitor the impact COVID-19 has on the Fund and reflect the consequences as appropriate in the Fund’s accounting and financial reporting.
| 70 | | | DWS Global Income Builder Fund |
Report of Independent Registered Public Accounting Firm
To the Board of Trustees of Deutsche DWS Market Trust and Shareholders of DWS Global Income Builder Fund:
Opinion on the Financial Statements
We have audited the accompanying statement of assets and liabilities of DWS Global Income Builder Fund (the “Fund”) (one of the funds constituting Deutsche DWS Market Trust) (the “Trust”), including the investment portfolio, as of October 31, 2020, and the related statement of operations for the year then ended, the statements of changes in net assets for each of the two years in the period then ended, the financial highlights for each of the five years in the period then ended and the related notes (collectively referred to as the “financial statements”). In our opinion, the financial statements present fairly, in all material respects, the financial position of the Fund (one of the funds constituting Deutsche DWS Market Trust) at October 31, 2020, the results of its operations for the year then ended, the changes in its net assets for each of the two years in the period then ended and its financial highlights for each of the five years in the period then ended, in conformity with U.S. generally accepted accounting principles.
Basis for Opinion
These financial statements are the responsibility of the Trust’s management. Our responsibility is to express an opinion on the Fund’s financial statements based on our audits. We are a public accounting firm registered with the Public Company Accounting Oversight Board (United States) (“PCAOB”) and are required to be independent with respect to the Trust in accordance with the U.S. federal securities laws and the applicable rules and regulations of the Securities and Exchange Commission and the PCAOB.
We conducted our audits in accordance with the standards of the PCAOB. Those standards require that we plan and perform the audit to obtain reasonable assurance about whether the financial statements are free of material misstatement, whether due to error or fraud. The Trust is not required to have, nor were we engaged to perform, an audit of the Trust’s internal control over financial reporting. As part of our audits, we are required to obtain an understanding of internal control over financial
| DWS Global Income Builder Fund | | | 71 |
reporting, but not for the purpose of expressing an opinion on the effectiveness of the Trust’s internal control over financial reporting. Accordingly, we express no such opinion.
Our audits included performing procedures to assess the risks of material misstatement of the financial statements, whether due to error or fraud, and performing procedures that respond to those risks. Such procedures included examining, on a test basis, evidence regarding the amounts and disclosures in the financial statements. Our procedures included confirmation of securities owned as of October 31, 2020, by correspondence with the custodian and others or by other appropriate auditing procedures where replies from others were not received. Our audits also included evaluating the accounting principles used and significant estimates made by management, as well as evaluating the overall presentation of the financial statements. We believe that our audits provide a reasonable basis for our opinion.

We have served as the auditor of one or more investment companies in the DWS family of funds since at least 1979, but we are unable to determine the specific year.
Boston, Massachusetts
December 23, 2020
| 72 | | | DWS Global Income Builder Fund |
Information About Your Fund’s Expenses
As an investor of the Fund, you incur two types of costs: ongoing expenses and transaction costs. Ongoing expenses include management fees, distribution and service (12b-1) fees and other Fund expenses. Examples of transaction costs include sales charges (loads) and account maintenance fees, which are not shown in this section. The following tables are intended to help you understand your ongoing expenses (in dollars) of investing in the Fund and to help you compare these expenses with the ongoing expenses of investing in other mutual funds. The example in the table is based on an investment of $1,000 invested at the beginning of the six-month period and held for the entire period (May 1, 2020 to October 31, 2020).
The tables illustrate your Fund’s expenses in two ways:
| – | Actual Fund Return. This helps you estimate the actual dollar amount of ongoing expenses (but not transaction costs) paid on a $1,000 investment in the Fund using the Fund’s actual return during the period. To estimate the expenses you paid over the period, simply divide your account value by $1,000 (for example, an $8,600 account value divided by $1,000 = 8.6), then multiply the result by the number in the “Expenses Paid per $1,000” line under the share class you hold. |
| – | Hypothetical 5% Fund Return. This helps you to compare your Fund’s ongoing expenses (but not transaction costs) with those of other mutual funds using the Fund’s actual expense ratio and a hypothetical rate of return of 5% per year before expenses. Examples using a 5% hypothetical fund return may be found in the shareholder reports of other mutual funds. The hypothetical account values and expenses may not be used to estimate the actual ending account balance or expenses you paid for the period. |
Please note that the expenses shown in these tables are meant to highlight your ongoing expenses only and do not reflect any transaction costs. The “Expenses Paid per $1,000” line of the tables is useful in comparing ongoing expenses only and will not help you determine the relative total expense of owning different funds. Subject to certain exceptions, an account maintenance fee of $20.00 assessed once per calendar year for Classes A, C and S shares may apply for accounts with balances less than $10,000. This fee is not included in these tables. If it was, the estimate of expenses paid for Classes A, C and S shares during the period would be higher, and account value during the period would be lower, by this amount.
| DWS Global Income Builder Fund | | | 73 |
| Expenses and Value of a $1,000 Investment for the six months ended October 31, 2020 (Unaudited) | ||||||||||||||||||||
| Actual Fund Return | Class A | Class C | Class R6 | Class S | Institutional Class | |||||||||||||||
| Beginning Account Value 5/1/20 | $ | 1,000.00 | $ | 1,000.00 | $ | 1,000.00 | $ | 1,000.00 | $ | 1,000.00 | ||||||||||
| Ending Account Value 10/31/20 | $ | 1,089.00 | $ | 1,083.50 | $ | 1,089.70 | $ | 1,088.90 | $ | 1,089.20 | ||||||||||
| Expenses Paid per $1,000* | $ | 4.57 | $ | 8.75 | $ | 2.94 | $ | 3.52 | $ | 3.52 | ||||||||||
| Hypothetical 5% Fund Return | Class A | Class C | Class R6 | Class S | Institutional Class | |||||||||||||||
| Beginning Account Value 5/1/20 | $ | 1,000.00 | $ | 1,000.00 | $ | 1,000.00 | $ | 1,000.00 | $ | 1,000.00 | ||||||||||
| Ending Account Value 10/31/20 | $ | 1,020.76 | $ | 1,016.74 | $ | 1,022.32 | $ | 1,021.77 | $ | 1,021.77 | ||||||||||
| Expenses Paid per $1,000* | $ | 4.42 | $ | 8.47 | $ | 2.85 | $ | 3.40 | $ | 3.40 | ||||||||||
| * | Expenses are equal to the Fund’s annualized expense ratio for each share class, multiplied by the average account value over the period, multiplied by 184 (the number of days in the most recent six-month period), then divided by 366. |
| Annualized Expense Ratios | Class A | Class C | Class R6 | Class S | Institutional Class | |||||||||||||||
| DWS Global Income Builder Fund | .87 | % | 1.67 | % | .56 | % | .67 | % | .67 | % | ||||||||||
For more information, please refer to the Fund’s prospectus.
For an analysis of the fees associated with an investment in the Fund or
similar funds, please refer to tools.finra.org/fund_analyzer/.
| Tax Information | (Unaudited) |
For corporate shareholders, 31% of the ordinary dividends (i.e., income dividends plus short-term capital gains) paid during the Fund’s fiscal year ended October 31, 2020, qualified for the dividends received deduction.
For federal income tax purposes, the Fund designates approximately $17,900,000, or the maximum amount allowable under tax law, as qualified dividend income.
A total of 2% of the dividends distributed during the fiscal year was derived from interest on U.S. government securities, which is generally exempt from state income tax.
Please consult a tax advisor if you have questions about federal or state income tax laws, or on how to prepare your tax returns. If you have specific questions about your account, please call (800) 728-3337.
| 74 | | | DWS Global Income Builder Fund |
Advisory Agreement Board Considerations and Fee Evaluation
The Board of Trustees (hereinafter referred to as the “Board” or “Trustees”) approved the renewal of DWS Global Income Builder Fund’s (the “Fund”) investment management agreement (the “Agreement”) with DWS Investment Management Americas, Inc. (“DIMA”) in September 2020.
In terms of the process that the Board followed prior to approving the Agreement, shareholders should know that:
| – | During the entire process, all of the Fund’s Trustees were independent of DIMA and its affiliates (the “Independent Trustees”). |
| – | The Board met frequently during the past year to discuss fund matters and dedicated a substantial amount of time to contract review matters. Over the course of several months, the Board reviewed extensive materials received from DIMA, independent third parties and independent counsel. These materials included an analysis of the Fund’s performance, fees and expenses, and profitability from a fee consultant retained by the Fund’s Independent Trustees (the “Fee Consultant”). |
| – | The Board also received extensive information throughout the year regarding performance of the Fund. |
| – | The Independent Trustees regularly met privately with counsel to discuss contract review and other matters. In addition, the Independent Trustees were advised by the Fee Consultant in the course of their review of the Fund’s contractual arrangements and considered a comprehensive report prepared by the Fee Consultant in connection with their deliberations. |
| – | In connection with reviewing the Agreement, the Board also reviewed the terms of the Fund’s Rule 12b-1 plan, distribution agreement, administrative services agreement, transfer agency agreement and other material service agreements. |
In connection with the contract review process, the Board considered the factors discussed below, among others. The Board also considered that DIMA and its predecessors have managed the Fund since its inception, and the Board believes that a long-term relationship with a capable, conscientious advisor is in the best interests of the Fund. The Board considered, generally, that shareholders chose to invest or remain invested in the Fund knowing that DIMA managed the Fund. DIMA is part of DWS Group GmbH & Co. KGaA (“DWS Group”). DWS Group is a global asset management business that offers a wide range of investing
| DWS Global Income Builder Fund | | | 75 |
expertise and resources, including research capabilities in many countries throughout the world. In 2018, approximately 20% of DWS Group’s shares were sold in an initial public offering, with Deutsche Bank AG owning the remaining shares.
As part of the contract review process, the Board carefully considered the fees and expenses of each DWS fund overseen by the Board in light of the fund’s performance. In many cases, this led to the negotiation and implementation of expense caps.
While shareholders may focus primarily on fund performance and fees, the Fund’s Board considers these and many other factors, including the quality and integrity of DIMA’s personnel and administrative support services provided by DIMA, such as back-office operations, fund valuations, and compliance policies and procedures.
Nature, Quality and Extent of Services. The Board considered the terms of the Agreement, including the scope of advisory services provided under the Agreement. The Board noted that, under the Agreement, DIMA provides portfolio management services to the Fund and that, pursuant to a separate administrative services agreement, DIMA provides administrative services to the Fund. The Board considered the experience and skills of senior management and investment personnel and the resources made available to such personnel. The Board also considered the risks to DIMA in sponsoring or managing the Fund, including financial, operational and reputational risks, the potential economic impact to DIMA from such risks and DIMA’s approach to addressing such risks. The Board reviewed the Fund’s performance over short-term and long-term periods and compared those returns to various agreed-upon performance measures, including market index(es) and a peer universe compiled using information supplied by Morningstar Direct (“Morningstar”), an independent fund data service. The Board also noted that it has put into place a process of identifying “Funds in Review” (e.g., funds performing poorly relative to a peer universe), and receives additional reporting from DIMA regarding such funds and, where appropriate, DIMA’s plans to address underperformance. The Board believes this process is an effective manner of identifying and addressing underperforming funds. Based on the information provided, the Board noted that, for the one-, three- and five-year periods ended December 31, 2019, the Fund’s performance (Class A shares) was in the 1st quartile of the applicable Morningstar universe (the 1st quartile being the best performers and the 4th quartile being the worst performers). The Board also observed that the Fund has underperformed its benchmark in the one-, three- and five-year periods ended December 31, 2019.
Fees and Expenses. The Board considered the Fund’s investment management fee schedule, operating expenses and total expense ratios,
| 76 | | | DWS Global Income Builder Fund |
and comparative information provided by Broadridge Financial Solutions, Inc. (“Broadridge”) and the Fee Consultant regarding investment management fee rates paid to other investment advisors by similar funds (1st quartile being the most favorable and 4th quartile being the least favorable). With respect to management fees paid to other investment advisors by similar funds, the Board noted that the contractual fee rates paid by the Fund, which include a 0.10% fee paid to DIMA under the Fund’s administrative services agreement, were lower than the median (1st quartile) of the applicable Broadridge peer group (based on Broadridge data provided as of December 31, 2019). The Board noted that, effective March 1, 2020, the fee paid to DIMA under the Fund’s administrative services agreement was reduced to 0.097%. The Board noted that the Fund’s Class A shares total (net) operating expenses (excluding 12b-1 fees) were expected to be lower than the median (1st quartile) of the applicable Broadridge expense universe (based on Broadridge data provided as of December 31, 2019, and analyzing Broadridge expense universe Class A (net) expenses less any applicable 12b-1 fees) (“Broadridge Universe Expenses”). The Board also reviewed data comparing each other operational share class’s total (net) operating expenses to the applicable Broadridge Universe Expenses. The Board noted that the expense limitations agreed to by DIMA were expected to help the Fund’s total (net) operating expenses remain competitive. The Board considered the Fund’s management fee rate as compared to fees charged by DIMA to a comparable DWS U.S. registered fund (“DWS Funds”) and considered differences between the Fund and the comparable DWS Fund. The information requested by the Board as part of its review of fees and expenses also included information about institutional accounts (including any sub-advised funds and accounts) and funds offered primarily to European investors (“DWS Europe Funds”) managed by DWS Group. The Board noted that DIMA indicated that DWS Group does not manage any institutional accounts or DWS Europe Funds comparable to the Fund.
On the basis of the information provided, the Board concluded that management fees were reasonable and appropriate in light of the nature, quality and extent of services provided by DIMA.
Profitability. The Board reviewed detailed information regarding revenues received by DIMA under the Agreement. The Board considered the estimated costs to DIMA, and pre-tax profits realized by DIMA, from advising the DWS Funds, as well as estimates of the pre-tax profits attributable to managing the Fund in particular. The Board also received information regarding the estimated enterprise-wide profitability of DIMA and its affiliates with respect to all fund services in totality and by fund. The Board and the Fee Consultant reviewed DIMA’s methodology in allocating its costs to the management of the Fund. Based on the
| DWS Global Income Builder Fund | | | 77 |
information provided, the Board concluded that the pre-tax profits realized by DIMA in connection with the management of the Fund were not unreasonable. The Board also reviewed certain publicly available information regarding the profitability of certain similar investment management firms. The Board noted that, while information regarding the profitability of such firms is limited (and in some cases is not necessarily prepared on a comparable basis), DIMA and its affiliates’ overall profitability with respect to the DWS Funds (after taking into account distribution and other services provided to the funds by DIMA and its affiliates) was lower than the overall profitability levels of most comparable firms for which such data was available.
Economies of Scale. The Board considered whether there are economies of scale with respect to the management of the Fund and whether the Fund benefits from any economies of scale. The Board noted that the Fund’s investment management fee schedule includes fee breakpoints. The Board concluded that the Fund’s fee schedule represents an appropriate sharing between the Fund and DIMA of such economies of scale as may exist in the management of the Fund at current asset levels.
Other Benefits to DIMA and Its Affiliates. The Board also considered the character and amount of other incidental or “fall-out” benefits received by DIMA and its affiliates, including any fees received by DIMA for administrative services provided to the Fund, any fees received by an affiliate of DIMA for transfer agency services provided to the Fund and any fees received by an affiliate of DIMA for distribution services. The Board also considered benefits to DIMA related to brokerage and soft-dollar allocations, including allocating brokerage to pay for research generated by parties other than the executing broker dealers, which pertain primarily to funds investing in equity securities. In addition, the Board considered the incidental public relations benefits to DIMA related to DWS Funds advertising and cross-selling opportunities among DIMA products and services. The Board considered these benefits in reaching its conclusion that the Fund’s management fees were reasonable.
Compliance. The Board considered the significant attention and resources dedicated by DIMA to its compliance processes in recent years. The Board noted in particular (i) the experience, seniority and time commitment of the individuals serving as DIMA’s and the Fund’s chief compliance officers and (ii) the substantial commitment of resources by DIMA and its affiliates to compliance matters, including the retention of compliance personnel.
The Board also considered that on September 24, 2020, the SEC granted a temporary order permitting DIMA and its affiliates to continue providing investment advisory and underwriting services to the DWS Funds notwithstanding a consent order entered into by Deutsche Bank AG on
| 78 | | | DWS Global Income Builder Fund |
June 17, 2020 (the “Consent Order”). The Board noted that the temporary order was granted effective as of the date of the Consent Order. The Board also noted various representations by DIMA to the Board relating to the Consent Order, including that the conduct giving rise to the Consent Order (unintentional conduct that resulted from a system outage that prevented Deutsche Bank AG from reporting data in accordance with applicable CFTC requirements for five days in April 2016) did not involve any DWS Fund or services DIMA and its affiliates provide to the DWS Funds, that DIMA and its personnel had no involvement in the alleged conduct giving rise to the Consent Order, and that the DWS Funds would not bear any financial impact or costs relating to the Consent Order.
Based on all of the information considered and the conclusions reached, the Board determined that the continuation of the Agreement is in the best interests of the Fund. In making this determination, the Board did not give particular weight to any single factor identified above. The Board considered these factors over the course of numerous meetings, certain of which were in executive session with only the Independent Trustees and counsel present. It is possible that individual Independent Trustees may have weighed these factors differently in reaching their individual decisions to approve the continuation of the Agreement.
| DWS Global Income Builder Fund | | | 79 |
The following table presents certain information regarding the Board Members and Officers of the Trust/Corporation. Each Board Member’s year of birth is set forth in parentheses after his or her name. Unless otherwise noted, (i) each Board Member has engaged in the principal occupation(s) noted in the table for at least the most recent five years, although not necessarily in the same capacity; and (ii) the address of each Independent Board Member is Keith R. Fox, DWS Funds Board Chair, c/o Thomas R. Hiller, Ropes & Gray LLP, Prudential Tower, 800 Boylston Street, Boston, MA 02199-3600. Except as otherwise noted below, the term of office for each Board Member is until the election and qualification of a successor, or until such Board Member sooner dies, resigns, is removed or as otherwise provided in the governing documents of the Trust/Corporation. Because the Fund does not hold an annual meeting of shareholders, each Board Member will hold office for an indeterminate period.
The Board Members may also serve in similar capacities with other funds in the fund complex. The number of funds in the DWS fund complex shown in the table below includes all registered open- and closed-end funds (including all of their portfolios) advised by the Advisor and any registered funds that have an investment advisor that is an affiliated person of the Advisor.
| Independent Board Members |
| |||||||
| Name, Year of Birth, Position with the Trust/ Corporation and Length of Time Served1 | Business Experience and Directorships During the Past Five Years | Number of Funds in DWS Fund Complex Overseen | Other Directorships Held by Board Member | |||||
Keith R. Fox, CFA (1954)
Chairperson since 2017, and Board Member since 1996 | Managing General Partner, Exeter Capital Partners (a series of private investment funds) (since 1986). Directorships: Progressive International Corporation (kitchen goods importer and distributor); former Chairman, National Association of Small Business Investment Companies; former Directorships: ICI Mutual Insurance Company; BoxTop Media Inc. (advertising); Sun Capital Advisers Trust (mutual funds) (2011–2012) | 73 | — | |||||
| 80 | | | DWS Global Income Builder Fund |
| Name, Year of Birth, Position with the Trust/ Corporation and Length of Time Served1 | Business Experience and Directorships During the Past Five Years | Number of Funds in DWS Fund Complex Overseen | Other Directorships Held by Board Member | |||||
John W. Ballantine (1946)
Board Member since 1999 | Retired; formerly, Executive Vice President and Chief Risk Management Officer, First Chicago NBD Corporation/The First National Bank of Chicago (1996–1998); Executive Vice President and Head of International Banking (1995–1996); former Directorships: Director and Chairman of the Board, Healthways, Inc.2 (population well-being and wellness services) (2003–2014); Stockwell Capital Investments PLC (private equity); Enron Corporation; FNB Corporation; Tokheim Corporation; First Oak Brook Bancshares, Inc.; Oak Brook Bank; and Prisma Energy International. Not-for-Profit Director/Trustee: Palm Beach Civic Association; Window to the World Communications (public media); Life Director of Harris Theater for Music and Dance (Chicago); Life Director of Hubbard Street Dance Chicago; former Not-for-Profit Directorships: Public Radio International | 73 | Portland General Electric2 (utility company) (2003– present) | |||||
Dawn-Marie Driscoll (1946)
Board Member since 1987 | Emeritus Executive Fellow, Center for Business Ethics, Bentley University; formerly: Partner, Palmer & Dodge (law firm) (1988–1990); Vice President of Corporate Affairs and General Counsel, Filene’s (retail) (1978–1988). Directorships: Advisory Board, Center for Business Ethics, Bentley University; Trustee and former Chairman of the Board, Southwest Florida Community Foundation (charitable organization); former Directorships: ICI Mutual Insurance Company (2007–2015); Sun Capital Advisers Trust (mutual funds) (2007–2012), Investment Company Institute (audit, executive, nominating committees) and Independent Directors Council (governance, executive committees) | 73 | — | |||||
Richard J. Herring (1946)
Board Member since 1990 | Jacob Safra Professor of International Banking and Professor of Finance, The Wharton School, University of Pennsylvania (since July 1972); Director, The Wharton Financial Institutions Center (since 1994); formerly: Vice Dean and Director, Wharton Undergraduate Division (1995–2000) and Director, The Lauder Institute of International Management Studies (2000–2006); Member FDIC Systemic Risk Advisory Committee since 2011, member Systemic Risk Council since 2012 and member of the Advisory Board at the Yale Program on Financial Stability since 2013; Formerly Co-Chair of the Shadow Financial Regulatory Committee (2003–2015), Executive Director of The Financial Economists Roundtable (2008–2015), Director of The Thai Capital Fund (2007–2013), Director of The Aberdeen Singapore Fund (2007–2018), and Nonexecutive Director of Barclays Bank DE (2010–2018) | 73 | Director, Aberdeen Japan Fund (since 2007) | |||||
| DWS Global Income Builder Fund | | | 81 |
| Name, Year of Birth, Position with the Trust/ Corporation and Length of Time Served1 | Business Experience and Directorships During the Past Five Years | Number of Funds in DWS Fund Complex Overseen | Other Directorships Held by Board Member | |||||
William McClayton (1944)
Board Member since 2004 | Private equity investor (since October 2009); previously, Managing Director, Diamond Management & Technology Consultants, Inc. (global consulting firm) (2001–2009); Directorship: Board of Managers, YMCA of Metropolitan Chicago; formerly: Senior Partner, Arthur Andersen LLP (accounting) (1966–2001); Trustee, Ravinia Festival | 73 | — | |||||
Rebecca W. Rimel (1951)
Board Member since 1995 | Senior Advisor, The Pew Charitable Trusts (charitable organization) (since July 2020); formerly: Executive Vice President, The Glenmede Trust Company (investment trust and wealth management) (1983–2004); Board Member, Investor Education (charitable organization) (2004–2005); Trustee, Executive Committee, Philadelphia Chamber of Commerce (2001–2007); Director, Viasys Health Care2 (January 2007–June 2007); Trustee, Thomas Jefferson Foundation (charitable organization) (1994–2012); President, Chief Executive Officer and Director, The Pew Charitable Trusts (charitable organization) (1994–2020) | 73 | Director, Becton Dickinson and Company2 (medical technology company) (2012– present); Director, BioTelemetry Inc.2 (health care) (2009– present) | |||||
William N. Searcy, Jr. (1946)
Board Member since 1993 | Private investor since October 2003; formerly: Pension & Savings Trust Officer, Sprint Corporation2 (telecommunications) (November 1989–September 2003); Trustee, Sun Capital Advisers Trust (mutual funds) (1998–2012) | 73 | — | |||||
| 82 | | | DWS Global Income Builder Fund |
| Officers4 | ||
| Name, Year of Birth, Position with the Trust/Corporation and Length of Time Served5 | Business Experience and Directorships During the Past Five Years | |
Hepsen Uzcan6 (1974)
President and Chief Executive Officer, 2017–present | Managing Director3, DWS; Secretary, DWS USA Corporation (2018-present); Assistant Secretary, DWS Distributors, Inc. (2018-present); Director and Vice President, DWS Service Company (2018-present); Assistant Secretary, DWS Investment Management Americas, Inc. (2018-present); Director and President, DB Investment Managers, Inc. (2018-present); President and Chief Executive Officer, The European Equity Fund, Inc., The New Germany Fund, Inc. and The Central and Eastern Europe Fund, Inc. (2017-present); formerly: Vice President for the Deutsche funds (2016-2017); Assistant Secretary for the DWS funds (2013-2019); Assistant Secretary, The European Equity Fund, Inc., The New Germany Fund, Inc. and The Central and Eastern Europe Fund, Inc. (2013-2020); Directorships: Interested Director, The European Equity Fund, Inc., The New Germany Fund, Inc. and The Central and Eastern Europe Fund, Inc. (since June 25, 2020); ICI Mutual Insurance Company (Since October 16, 2020); and Episcopalian Charities of New York (2018-present) | |
John Millette7 (1962)
Vice President and Secretary, 1999–present | Director,3 DWS; Chief Legal Officer, DWS Investment Management Americas, Inc. (2015–present); Director and Vice President, DWS Trust Company (2016–present); Secretary, DBX ETF Trust (2020–present); Secretary, The European Equity Fund, Inc., The New Germany Fund, Inc. and The Central and Eastern Europe Fund, Inc. (2011–present); formerly: Secretary, Deutsche Investment Management Americas Inc. (2015–2017); Assistant Secretary, DBX ETF Trust (2019–2020); Assistant Secretary (July 14, 2006–December 31, 2010) and Secretary (January 31, 2006–July 13, 2006), The European Equity Fund, Inc., The New Germany Fund, Inc. and The Central and Eastern Europe Fund, Inc. | |
Ciara Crawford8 (1984)
Assistant Secretary, (2019–present) | Associate, DWS (since 2015); previously, Legal Assistant at Accelerated Tax Solutions. | |
Diane Kenneally7 (1966)
Chief Financial Officer and Treasurer, 2018–present | Director,3 DWS; Treasurer, Chief Financial Officer and Controller, DBX ETF Trust (2019–present); Treasurer and Chief Financial Officer, The European Equity Fund, Inc., The New Germany Fund, Inc. and The Central and Eastern Europe Fund, Inc. (2018–present); formerly: Assistant Treasurer for the DWS funds (2007–2018) | |
Paul Antosca7 (1957)
Assistant Treasurer, 2007–present | Director,3 DWS; and Assistant Treasurer, DBX ETF Trust (2019–present) | |
Sheila Cadogan7 (1966)
Assistant Treasurer, 2017–present | Director,3 DWS; Director and Vice President, DWS Trust Company (2018–present); Assistant Treasurer, DBX ETF Trust (2019–present); Assistant Treasurer, The European Equity Fund, Inc., The New Germany Fund, Inc. and The Central and Eastern Europe Fund, Inc. (2018–present) |
| DWS Global Income Builder Fund | | | 83 |
| Name, Year of Birth, Position with the Trust/Corporation and Length of Time Served5 | Business Experience and Directorships During the Past Five Years | |
Scott D. Hogan7 (1970)
Chief Compliance Officer, 2016–present | Director,3 DWS; Chief Compliance Officer, The European Equity Fund, Inc., The New Germany Fund, Inc. and The Central and Eastern Europe Fund, Inc. (2016–present) | |
Caroline Pearson7 (1962)
Chief Legal Officer, 2010–present | Managing Director3, DWS; Assistant Secretary, DBX ETF Trust (2020–present); Chief Legal Officer, DBX Advisors LLC and DBX Strategic Advisors LLC (2020–present); Chief Legal Officer, The European Equity Fund, Inc., The New Germany Fund, Inc. and The Central and Eastern Europe Fund, Inc. (2012–present); formerly: Secretary, Deutsche AM Distributors, Inc. (2002–2017); and Secretary, Deutsche AM Service Company (2010–2017) | |
Michelle Goveia-Pine6 (1970)
Interim Anti-Money Laundering Compliance Officer, since July 10, 2020 | Director,3 DWS; Interim AML Officer, DWS Trust Company (since July 28, 2020); Interim AML Officer, DBX ETF Trust (since July 9, 2020); Interim AML Officer, The European Equity Fund, Inc., The New Germany Fund, Inc. and The Central and Eastern Europe Fund, Inc. (since July 24, 2020) |
| 1 | The length of time served represents the year in which the Board Member joined the board of one or more DWS funds currently overseen by the Board. |
| 2 | A publicly held company with securities registered pursuant to Section 12 of the Securities Exchange Act of 1934. |
| 3 | Executive title, not a board directorship. |
| 4 | As a result of their respective positions held with the Advisor or its affiliates, these individuals are considered “interested persons” of the Advisor within the meaning of the 1940 Act. Interested persons receive no compensation from the Fund. |
| 5 | The length of time served represents the year in which the officer was first elected in such capacity for one or more DWS funds. |
| 6 | Address: 875 Third Avenue, New York, NY 10022. |
| 7 | Address: 100 Summer Street, Boston, MA 02110. |
| 8 | Address: 5022 Gate Parkway, Suite 400, Jacksonville, FL 32256. |
The Fund’s Statement of Additional Information (“SAI”) includes additional information about the Board Members. The SAI is available, without charge, upon request. If you would like to request a copy of the SAI, you may do so by calling the following toll-free number: (800) 728-3337.
| 84 | | | DWS Global Income Builder Fund |
| For More Information | The automated telephone system allows you to access personalized account information and obtain information on other DWS funds using either your voice or your telephone keypad. Certain account types within Classes A, C and S also have the ability to purchase, exchange or redeem shares using this system.
For more information, contact your financial representative. You may also access our automated telephone system or speak with a Shareholder Service representative by calling:
(800) 728-3337 | |
| Web Site | dws.com
View your account transactions and balances, trade shares, monitor your asset allocation, subscribe to fund and account updates by e-mail, and change your address, 24 hours a day.
Obtain prospectuses and applications, news about DWS funds, insight from DWS economists and investment specialists and access to DWS fund account information. | |
| Written Correspondence | DWS
PO Box 219151 Kansas City, MO 64121-9151 | |
| Proxy Voting | The Fund’s policies and procedures for voting proxies for portfolio securities and information about how the Fund voted proxies related to its portfolio securities during the most recent 12-month period ended June 30 are available on our Web site — dws.com/en-us/resources/proxy-voting — or on the SEC’s Web site — sec.gov. To obtain a written copy of the Fund’s policies and procedures without charge, upon request, call us toll free at (800) 728-3337. | |
| Portfolio Holdings | Following the Fund’s fiscal first and third quarter-end, a complete portfolio holdings listing is filed with the SEC on Form N-PORT. The Fund’s Form N-PORT will be available on the SEC’s Web site at sec.gov. The Fund’s portfolio holdings are also posted on dws.com from time to time. Please see the Fund’s current prospectus for more information. | |
| Principal Underwriter | If you have questions, comments or complaints, contact:
DWS Distributors, Inc.
222 South Riverside Plaza Chicago, IL 60606-5808 (800) 621-1148 |
| DWS Global Income Builder Fund | | | 85 |
| Investment Management | DWS Investment Management Americas, Inc. (“DIMA” or the “Advisor”), which is part of the DWS Group GmbH & Co. KGaA (“DWS Group”), is the investment advisor for the Fund. DIMA and its predecessors have more than 90 years of experience managing mutual funds and DIMA provides a full range of investment advisory services to both institutional and retail clients. DIMA is an indirect, wholly owned subsidiary of DWS Group.
DWS Group is a global organization that offers a wide range of investing expertise and resources, including hundreds of portfolio managers and analysts and an office network that reaches the world’s major investment centers. This well-resourced global investment platform brings together a wide variety of experience and investment insight across industries, regions, asset classes and investing styles. | |||||||
| Class A | Class C | Class S | Institutional Class | |||||
| Nasdaq Symbol | KTRAX | KTRCX | KTRSX | KTRIX | ||||
| CUSIP Number | 25159K 820 | 25159K 796 | 25159K 788 | 25159K 770 | ||||
| Fund Number | 002 | 302 | 2033 | 1402 | ||||
| For shareholders of Class R6 | ||||||||
| Automated Information Line | DWS/Ascensus Plan Access (800) 728-3337
24-hour access to your retirement plan account. | |||||||
| Web Site | dws.com
Obtain prospectuses and applications, news about DWS funds, insight from DWS economists and investment specialists and access to DWS fund account information.
Log in/register to manage retirement account assets at https://www.mykplan.com/participantsecure_net/login.aspx. | |||||||
| For More Information | (800) 728-3337
To speak with a service representative. | |||||||
| Written Correspondence | DWS Service Company
222 South Riverside Plaza Chicago, IL 60606-5806 | |||||||
| Class R6 | ||||||||
| Nasdaq Symbol | KTRZX |
|
|
| ||||
| CUSIP Number | 25159K 721 |
|
|
| ||||
| Fund Number | 1633 |
|
|
| ||||
| 86 | | | DWS Global Income Builder Fund |
Notes
DGIBF-2
(R-024954-10 12/20)
| ITEM 2. | CODE OF ETHICS |
As of the end of the period covered by this report, the registrant has adopted a code of ethics, as defined in Item 2 of Form N-CSR that applies to its Principal Executive Officer and Principal Financial Officer.
There have been no amendments to, or waivers from, a provision of the code of ethics during the period covered by this report that would require disclosure under Item 2.
A copy of the code of ethics is filed as an exhibit to this Form N-CSR. | |
| ITEM 3. | AUDIT COMMITTEE FINANCIAL EXPERT |
| The fund’s audit committee is comprised solely of trustees who are "independent" (as such term has been defined by the Securities and Exchange Commission ("SEC") in regulations implementing Section 407 of the Sarbanes-Oxley Act (the "Regulations")). The fund’s Board of Trustees has determined that there are several "audit committee financial experts" (as such term has been defined by the Regulations) serving on the fund’s audit committee including Mr. William McClayton, the chair of the fund’s audit committee. An “audit committee financial expert” is not an “expert” for any purpose, including for purposes of Section 11 of the Securities Act of 1933 and the designation or identification of a person as an “audit committee financial expert” does not impose on such person any duties, obligations or liability that are greater than the duties, obligations and liability imposed on such person as a member of the audit committee and board of directors in the absence of such designation or identification. | |
| ITEM 4. | PRINCIPAL ACCOUNTANT FEES AND SERVICES |
DWS Global Income Builder Fund
form n-csr disclosure re: AUDIT FEES
The following table shows the amount of fees that Ernst & Young LLP (“EY”), the Fund’s Independent Registered Public Accounting Firm, billed to the Fund during the Fund’s last two fiscal years. The Audit Committee approved in advance all audit services and non-audit services that EY provided to the Fund.
Services that the Fund’s Independent Registered Public Accounting Firm Billed to the Fund
| Fiscal Year Ended October 31, | Audit Fees Billed to Fund | Audit-Related Fees Billed to Fund | Tax Fees Billed to Fund | All Other Fees Billed to Fund |
| 2020 | $90,047 | $0 | $10,365 | $0 |
| 2019 | $90,047 | $0 | $11,266 | $0 |
The above “Tax Fees” were billed for professional services rendered for tax preparation.
Services that the Fund’s Independent Registered Public Accounting Firm Billed to the Adviser and Affiliated Fund Service Providers
The following table shows the amount of fees billed by EY to DWS Investment Management Americas, Inc. (“DIMA” or the “Adviser”), and any entity controlling, controlled by or under common control with DIMA (“Control Affiliate”) that provides ongoing services to the Fund (“Affiliated Fund Service Provider”), for engagements directly related to the Fund’s operations and financial reporting, during the Fund’s last two fiscal years.
| Fiscal Year Ended October 31, | Audit-Related Fees Billed to Adviser and Affiliated Fund Service Providers | Tax Fees Billed to Adviser and Affiliated Fund Service Providers | All Other Fees Billed to Adviser and Affiliated Fund Service Providers |
| 2020 | $0 | $650,763 | $0 |
| 2019 | $0 | $740,482 | $0 |
The above “Tax Fees” were billed in connection with tax compliance services and agreed upon procedures.
Non-Audit Services
The following table shows the amount of fees that EY billed during the Fund’s last two fiscal years for non-audit services. The Audit Committee pre-approved all non-audit services that EY provided to the Adviser and any Affiliated Fund Service Provider that related directly to the Fund’s operations and financial reporting. The Audit Committee requested and received information from EY about any non-audit services that EY rendered during the Fund’s last fiscal year to the Adviser and any Affiliated Fund Service Provider. The Committee considered this information in evaluating EY’s independence.
| Fiscal Year Ended October 31, | Total Non-Audit Fees Billed to Fund (A) | Total Non-Audit Fees billed to Adviser and Affiliated Fund Service Providers (engagements related directly to the operations and financial reporting of the Fund) (B) | Total Non-Audit Fees billed to Adviser and Affiliated Fund Service Providers (all other engagements) (C) | Total of (A), (B) and (C) |
| 2020 | $10,365 | $650,763 | $0 | $661,128 |
| 2019 | $11,266 | $740,482 | $0 | $751,748 |
All other engagement fees were billed for services in connection with agreed upon procedures and tax compliance for DIMA and other related entities.
Audit Committee Pre-Approval Policies and Procedures. Generally, each Fund’s Audit Committee must pre approve (i) all services to be performed for a Fund by a Fund’s Independent Registered Public Accounting Firm and (ii) all non-audit services to be performed by a Fund’s Independent Registered Public Accounting Firm for the DIMA Entities with respect to operations and financial reporting of the Fund, except that the Chairperson or Vice Chairperson of each Fund’s Audit Committee may grant the pre-approval for non-audit services described in items (i) and (ii) above for non-prohibited services for engagements of less than $100,000. All such delegated pre approvals shall be presented to each Fund’s Audit Committee no later than the next Audit Committee meeting.
There were no amounts that were approved by the Audit Committee pursuant to the de minimis exception under Rule 2-01 of Regulation S-X.
According to the registrant’s principal Independent Registered Public Accounting Firm, substantially all of the principal Independent Registered Public Accounting Firm's hours spent on auditing the registrant's financial statements were attributed to work performed by full-time permanent employees of the principal Independent Registered Public Accounting Firm.
***
In connection with the audit of the 2019 and 2020 financial statements, the Fund entered into an engagement letter with EY. The terms of the engagement letter required by EY, and agreed to by the Audit Committee, include a provision mandating the use of mediation and arbitration to resolve any controversy or claim between the parties arising out of or relating to the engagement letter or services provided thereunder.
***
Pursuant to PCAOB Rule 3526, EY is required to describe in writing to the Fund’s Audit Committee, on at least an annual basis, all relationships between EY, or any of its affiliates, and the DWS Funds, including the Fund, or persons in financial reporting oversight roles at the DWS Funds that, as of the date of the communication, may reasonably be thought to bear on EY’s independence. Pursuant to PCAOB Rule 3526, EY has reported the matters set forth below that may reasonably be thought to bear on EY’s independence. With respect to each reported matter, individually and in the aggregate, EY advised the Audit Committee that, after careful consideration of the facts and circumstances and the applicable independence rules, it concluded that the matters do not and will not impair EY’s ability to exercise objective and impartial judgement in connection with the audits of the financial statements for the Fund and a reasonable investor with knowledge of all relevant facts and circumstances would conclude that EY has been and is capable of exercising objective and impartial judgment on all issues encompassed within EY’s audit engagements. EY also confirmed to the Audit Committee that it can continue act as the Independent Registered Public Accounting Firm for the Fund.
| · | EY advised the Fund’s Audit Committee that various covered persons within EY’s affiliates held investments in, or had other financial relationships with, entities within the DWS Funds “investment company complex” (as defined in Regulation S-X) (the “DWS Funds Complex”). EY informed the Audit Committee that these investments and financial relationships were inconsistent with Rule 2-01(c)(1) of Regulation S-X. EY reported that all breaches have been resolved and that none of the breaches involved any investments in the Fund or any professionals who were part of the audit engagement team for the Fund. In addition, EY noted that the independence breaches did not (i) create a mutual or conflicting interest with the Fund, (ii) place EY in the position of auditing its own work, (iii) result in EY acting as management or an employee of the Fund, or (iv) place EY in a position of being an advocate of the Fund. |
| ITEM 5. | AUDIT COMMITTEE OF LISTED REGISTRANTS | |
| Not applicable | ||
| ITEM 6. | SCHEDULE OF INVESTMENTS | |
| Not applicable | ||
| ITEM 7. | DISCLOSURE OF PROXY VOTING POLICIES AND PROCEDURES FOR CLOSED-END MANAGEMENT INVESTMENT COMPANIES | |
| Not applicable | ||
| ITEM 8. | PORTFOLIO MANAGERS OF CLOSED-END MANAGEMENT INVESTMENT COMPANIES | |
| Not applicable | ||
| ITEM 9. | PURCHASES OF EQUITY SECURITIES BY CLOSED-END MANAGEMENT INVESTMENT COMPANY AND AFFILIATED PURCHASERS | |
| Not applicable | ||
| ITEM 10. | SUBMISSION OF MATTERS TO A VOTE OF SECURITY HOLDERS | |
| There were no material changes to the procedures by which shareholders may recommend nominees to the Fund’s Board. The primary function of the Nominating and Governance Committee is to identify and recommend individuals for membership on the Board and oversee the administration of the Board Governance Guidelines. Shareholders may recommend candidates for Board positions by forwarding their correspondence by U.S. mail or courier service to Keith R. Fox, DWS Funds Board Chair, c/o Thomas R. Hiller, Ropes & Gray LLP, Prudential Tower, 800 Boylston Street, Boston, MA 02199-3600. | ||
| ITEM 11. | CONTROLS AND PROCEDURES | |
| (a) | The Chief Executive and Financial Officers concluded that the Registrant’s Disclosure Controls and Procedures are effective based on the evaluation of the Disclosure Controls and Procedures as of a date within 90 days of the filing date of this report. | |
| (b) | There have been no changes in the registrant’s internal control over financial reporting that occurred during the period covered by this report that has materially affected, or is reasonably likely to materially affect, the registrant’s internal controls over financial reporting. | |
| ITEM 12. | Disclosure of Securities Lending Activities for Closed-End Management Investment Companies | |
| Not applicable | ||
| ITEM 13. | EXHIBITS | |
| (a)(1) | Code of Ethics pursuant to Item 2 of Form N-CSR is filed and attached hereto as EX-99.CODE ETH. | |
| (a)(2) | Certification pursuant to Rule 30a-2(a) under the Investment Company Act of 1940 (17 CFR 270.30a-2(a)) is filed and attached hereto as Exhibit 99.CERT. | |
| (b) | Certification pursuant to Rule 30a-2(b) under the Investment Company Act of 1940 (17 CFR 270.30a-2(b)) is furnished and attached hereto as Exhibit 99.906CERT. | |
SIGNATURES
Pursuant to the requirements of the Securities Exchange Act of 1934 and the Investment Company Act of 1940, the registrant has duly caused this report to be signed on its behalf by the undersigned, thereunto duly authorized.
| Registrant: | DWS Global Income Builder Fund, a series of Deutsche DWS Market Trust |
| By: | /s/Hepsen Uzcan Hepsen Uzcan President |
| Date: | 12/30/2020 |
Pursuant to the requirements of the Securities Exchange Act of 1934 and the Investment Company Act of 1940, this report has been signed below by the following persons on behalf of the registrant and in the capacities and on the dates indicated.
| By: | /s/Hepsen Uzcan Hepsen Uzcan President |
| Date: | 12/30/2020 |
| By: | /s/Diane Kenneally Diane Kenneally Chief Financial Officer and Treasurer |
| Date: | 12/30/2020 |