Table of Contents
AS FILED WITH THE SECURITIES AND EXCHANGE COMMISSION ON NOVEMBER 15, 2004
SECURITIES ACT FILE NO. 333-
SECURITIES AND EXCHANGE COMMISSION
WASHINGTON, D.C. 20549
FORM N-14
REGISTRATION STATEMENT
UNDER
THE SECURITIES ACT OF 1933 x
PRE-EFFECTIVE AMENDMENT NO. ¨
POST-EFFECTIVE AMENDMENT NO. ¨
SCUDDER TOTAL RETURN FUND
(Exact Name of Registrant as Specified in Charter)
222 South Riverside Plaza Chicago, IL 60606
(Address of Principal Executive Offices) (Zip Code)
617-295-2572
(Registrant’s Area Code and Telephone Number)
John Millette, Secretary
Scudder Total Return Fund
Two International Place Boston, MA 02110
(NAME AND ADDRESS OF AGENT FOR SERVICE)
WITH COPIES TO:
Cathy G. O’Kelly, Esq. | John W. Gerstmayr, Esq. | |
David A. Sturms, Esq. | Ropes & Gray LLP | |
Vedder, Price, Kaufman & Kammholz, P.C. | One International Place | |
222 North LaSalle Street | Boston, Massachusetts 02110-2624 | |
Chicago, Illinois 60601 |
APPROXIMATE DATE OF PROPOSED PUBLIC OFFERING: As soon as practicable after the effective date of this Registration Statement.
No filing fee is required because an indefinite number of shares have previously been registered pursuant to Rule 24f-2 under the Investment Company Act of 1940.
The Registrant hereby amends this Registration Statement on such date or dates as may be necessary to delay its effective date until the Registrant shall file a further amendment that specifically states that this Registration Statement shall thereafter become effective in accordance with Section 8(a) of the Securities Act of 1933 or until the Registration Statement shall become effective on such date as the Commission, acting pursuant to said Section 8(a), may determine.
Table of Contents

Questions & Answers
Scudder Portfolio Trust
Scudder Balanced Fund
Q&A
Q What is happening?
A Deutsche Asset Management (“DeAM”), the investment manager for the Scudder funds, has initiated a program to reorganize and combine selected funds within the Scudder fund family.
Q What issue am I being asked to vote on?
A You are being asked to vote on a proposal to merge Scudder Balanced Fund into Scudder Total Return Fund. Both funds are managed by substantially the same portfolio management team and seek to achieve similar investment objectives through similar types of investments.
After carefully reviewing the proposal, your fund’s Board has determined that this action is in the best interest of the fund. The Board unanimously recommends that you vote for this proposal.
Q Why has this proposal been made for my fund?
A The combined fund will pay a lower management fee than Scudder Balanced Fund. In addition, combining the two funds means that the costs of operating the fund are anticipated to be spread across a larger asset base. Finally, DeAM has agreed to cap the expenses of the combined fund at levels lower than the expenses currently paid by Scudder Balanced Fund for approximately three years following the merger. Consequently, the combined fund will have lower total operating expenses than Scudder Balanced Fund.

Table of Contents
Q&A continued
Q Will I have to pay taxes as a result of the merger?
A The merger is expected to be a tax-free transaction, and will not take place unless special tax counsel provides an opinion to that effect. As a result of the merger, however, your fund may lose the benefit of certain tax losses that could have been used to offset or defer future gains. If you choose to redeem or exchange your shares before or after the merger, the redemption or exchange will generate taxable gain or loss; therefore, you may wish to consult a tax advisor before doing so. Of course, you may also be subject to capital gains as a result of the normal operations of your fund whether or not the transaction occurs.
Q Upon merger, will I own the same number of shares?
A The aggregate value of your shares will not change as a result of the merger. It is likely, however, that the number of shares you own will change as a result of the merger because your shares will be exchanged at the net asset value per share of Scudder Total Return Fund, which will probably be different from the net asset value per share of Scudder Balanced Fund.
Q Will any fund pay for the proxy solicitation and legal costs associated with this solicitation?
A No. DeAM will bear these costs.
Q When would the merger take place?
A If approved, the merger would occur on or about [March 14], 2005 or as soon as reasonably practicable after shareholder approval is obtained. Shortly after completion of the merger, shareholders whose accounts are affected by the merger will receive a confirmation statement reflecting their new account number and number of shares owned.
Table of Contents
Q&A continued
Q How can I vote?
A You can vote in any one of four ways:
| • | Through the Internet by going to the website listed on your proxy card; |
| • | By telephone, with a toll-free call to the number listed on your proxy card; |
| • | By mail, by sending the enclosed proxy card, signed and dated, to us in the enclosed envelope; or |
| • | In person, by attending the special meeting. |
We encourage you to vote over the Internet or by telephone, following the instructions that appear on your proxy card. Whichever method you choose, please take the time to read the full text of the proxy statement before you vote.
Q If I send my proxy in now as requested, can I change my vote later?
A You may revoke your proxy at any time before it is voted by: (1) sending a written revocation to the Secretary of the fund as explained in the proxy statement; or (2) forwarding a later-dated proxy that is received by the fund at or prior to the special meeting; or (3) attending the special meeting and voting in person. Even if you plan to attend the special meeting, we ask that you return the enclosed proxy. This will help us ensure that an adequate number of shares are present for the special meeting to be held.
Q Will I be able to continue to track my fund’s performance in the newspaper, on the Internet or through the voice response system (Easy-Access Line or SAIL, as applicable)?
A Yes. You will be able to continue to track your fund’s performance through all these means.
Q Whom should I call for additional information about this proxy statement?
A Please call Georgeson Shareholder, your fund’s proxy solicitor, at 1-888-288-5518.
Table of Contents
SCUDDER BALANCED FUND
A Message from the Fund’s Chief Executive Officer
[December ], 2004
Dear Shareholder:
I am writing to you to ask for your vote on an important matter that affects your investment in Scudder Balanced Fund (“Balanced Fund”). While you are, of course, welcome to join us at the Balanced Fund shareholders’ meeting, most shareholders cast their vote by filling out and signing the enclosed proxy card, or by voting by telephone or through the Internet.
We are asking for your vote on the following matter:
| Proposal: | Approval of a proposed merger of Balanced Fund into Scudder Total Return Fund (“Total Return Fund”). In this merger, your shares of Balanced Fund would, in effect, be exchanged, on a tax-free basis, for shares of Total Return Fund with an equal aggregate net asset value. |
The proposed merger is part of a program initiated by Deutsche Asset Management (“DeAM”), the investment manager of the Scudder funds. This program is intended to provide a more streamlined selection of investment options that is consistent with the changing needs of investors. If approved by fund boards and fund shareholders, this program will enable DeAM to:
| • | Eliminate redundancies within the Scudder fund family by reorganizing and combining certain funds; and |
| • | Focus its investment resources on a core set of mutual funds that best meet investor needs. |
The Trustees of Balanced Fund recommend approval of the merger because they believe it offers fund shareholders the following benefits, among others:
| • | A similar investment opportunity in a larger fund with a lower management fee; and |
| • | A lower expense ratio. |
The investment objective and policies of Balanced Fund are similar to those of Total Return Fund. If the merger is approved, the Board expects that the proposed changes will take effect during the first calendar quarter of 2005.
Included in this booklet is information about the upcoming shareholders’ meeting:
| • | A Notice of a Special Meeting of Shareholders, which summarizes the issue for which you are being asked to provide voting instructions; and |
| • | A Prospectus/Proxy Statement, which provides detailed information on Total Return Fund, the specific proposal being considered at the shareholders’ meeting, and why the proposal is being made. |
Table of Contents
Although we would like very much to have each shareholder attend the meeting, we realize this may not be possible. Whether or not you plan to be present, we need your vote. We urge you to review the enclosed materials thoroughly. Once you’ve determined how you would like your interests to be represented, please promptly complete, sign, date and return the enclosed proxy card, vote by telephone or record your voting instructions on the Internet. A postage-paid envelope is enclosed for mailing, and telephone and Internet voting instructions are listed at the top of your proxy card. You may receive more than one proxy card. If so, please vote each one.
I’m sure that you, like most people, lead a busy life and are tempted to put this proxy aside for another day. Please don’t. Your prompt return of the enclosed proxy card (or your voting by telephone or through the Internet) may save the necessity and expense of further solicitations.
Your vote is important to us. We appreciate the time and consideration I am sure you will give to this important matter. If you have questions about the proposal, please call Georgeson Shareholder, Balanced Fund’s proxy solicitor, at 1-888-288-5518 or contact your financial advisor. Thank you for your continued support of Scudder Investments.
Sincerely yours,

Julian F. Sluyters
Chief Executive Officer
Scudder Balanced Fund
Table of Contents
SCUDDER BALANCED FUND
NOTICE OF A SPECIAL MEETING OF SHAREHOLDERS
This is the formal agenda for your Fund’s shareholder meeting. It tells you what matter will be voted on and the time and place of the meeting, in the event you choose to attend in person.
To the Shareholders of Scudder Balanced Fund:
A Special Meeting of Shareholders of Scudder Balanced Fund (“Balanced Fund”) will be held [February 24], 2005 at [9:00 a.m.] Eastern time, at the offices of Deutsche Investment Management Americas Inc., 345 Park Avenue, 27th Floor, New York, New York 10154 (the “Meeting”), to consider the following (the “Proposal”):
| Proposal: | Approving an Agreement and Plan of Reorganization and the transactions it contemplates, including the transfer of all of the assets of Balanced Fund to Scudder Total Return Fund (“Total Return Fund”), in exchange for shares of Total Return Fund and the assumption by Total Return Fund of all liabilities of Balanced Fund, and the distribution of such shares, on a tax-free basis, to the shareholders of Balanced Fund in complete liquidation of Balanced Fund. |
The persons named as proxies will vote in their discretion on any other business that may properly come before the Meeting or any adjournments or postponements thereof.
Holders of record of shares of Balanced Fund at the close of business on [December 2], 2004 are entitled to vote at the Meeting and at any adjournments or postponements thereof.
In the event that the necessary quorum to transact business or the vote required to approve the merger is not obtained at the Meeting, the persons named as proxies may propose one or more adjournments of the Meeting in accordance with applicable law to permit such further solicitation of proxies as may be deemed necessary or advisable. Any adjournment will require the affirmative vote of a majority of the votes cast on the question in person or by proxy at the session of the Meeting to be adjourned. The persons named as proxies will vote FOR any such adjournment those proxies that they are entitled to vote in favor of the Proposal and will vote AGAINST any such adjournment those proxies to be voted against the Proposal.
By order of the Trustees

Dawn-Marie Driscoll (Chair)
Henry P. Becton, Jr.
Keith R. Fox
Louis E. Levy
Jean Gleason Stromberg
Jean C. Tempel
Carl W. Vogt
[December ], 2004
WE URGE YOU TO MARK, SIGN, DATE AND MAIL THE ENCLOSED PROXY IN THE POSTAGE-PAID ENVELOPE PROVIDED OR RECORD YOUR VOTING INSTRUCTIONS BY TELEPHONE OR THROUGH THE INTERNET SO THAT YOU WILL BE REPRESENTED AT THE MEETING.
Table of Contents
INSTRUCTIONS FOR SIGNING PROXY CARDS
The following general rules for signing proxy cards may be of assistance to you and avoid the time and expense involved in validating your vote if you fail to sign your proxy card properly.
1. Individual Accounts: Sign your name exactly as it appears in the registration on the proxy card.
2. Joint Accounts: Either party may sign, but the name of the party signing should conform exactly to the name shown in the registration on the proxy card.
3. All Other Accounts: The capacity of the individual signing the proxy card should be indicated unless it is reflected in the form of registration. For example:
Registration | Valid Signature | |
Corporate Accounts: | ||
(1) ABC Corp. | ABC Corp. John Doe, Treasurer | |
(2) ABC Corp. | John Doe, Treasurer | |
(3) ABC Corp. c/o John Doe, Treasurer | John Doe | |
(4) ABC Corp. Profit Sharing Plan | John Doe, Trustee | |
Partnership Accounts | ||
(1) The XYZ Partnership | Jane B. Smith, Partner | |
(2) Smith and Jones, Limited Partnership | Jane B. Smith, General Partner | |
Trust Accounts | ||
(1) ABC Trust Account | Jane B. Doe, Trustee | |
(2) Jane B. Doe, Trustee u/t/d 12/28/78 | Jane B. Doe | |
Custodial or Estate Accounts | ||
(1) John B. Smith, Cust. f/b/o John B. Smith Jr. | John B. Smith | |
(2) Estate of John B. Smith | John B. Smith, Jr., Executor | |
Table of Contents
IMPORTANT INFORMATION
FOR SHAREHOLDERS OF
SCUDDER BALANCED FUND
This document contains a combined prospectus/proxy statement and a proxy card. A proxy card is, in essence, a ballot. When you vote your proxy, it tells us how to vote on your behalf on an important issue relating to your Fund. If you complete and sign the proxy (or tell us how you want to vote by voting by telephone or through the Internet), we’ll vote it exactly as you tell us. If you simply sign the proxy, we’ll vote it in accordance with the Trustees’ recommendation on page [ ].
We urge you to review the prospectus/proxy statement carefully, and either fill out your proxy card and return it to us by mail, vote by telephone or record your voting instructions through the Internet. You may receive more than one proxy card since several shareholder meetings are being held as part of the broader restructuring program of the Scudder fund family. If so, please vote each one. Your prompt return of the enclosed proxy card (or your voting by telephone or through the Internet) may save the necessity and expense of further solicitations.
We want to know how you would like to vote and welcome your comments. Please take a few minutes to read these materials and return your proxy to us.
If you have any questions, please call Georgeson Shareholder, Balanced Fund’s proxy solicitor, at the special toll-free number we have set up for you (1-888-288-5518) or contact your financial advisor.
Table of Contents
PROSPECTUS/PROXY STATEMENT
, 2004
Acquisition of the assets of: | By and in exchange for shares of: | |
Scudder Balanced Fund a series of Scudder Portfolio Trust | Scudder Total Return Fund a series of Scudder Total Return Fund | |
Two International Place Boston, MA 02110 (617) 295-2572 | 222 S. Riverside Plaza Chicago, IL 60606 (617) 295-2572 | |
This Prospectus/Proxy Statement is being furnished in connection with the proposed merger of Scudder Balanced Fund (“Balanced Fund”) into Scudder Total Return Fund (“Total Return Fund”). Total Return Fund and Balanced Fund are referred to herein collectively as the “Funds,” and each is referred to herein individually as a “Fund.” As a result of the proposed merger, each shareholder of Balanced Fund will receive a number of full and fractional shares of the corresponding class of Total Return Fund equal in value as of the date of the exchange to the total value of such shareholder’s Balanced Fund shares.
This Prospectus/Proxy Statement is being mailed on or about [December ], 2004. It explains concisely what you should know before voting on the matter described herein or investing in Total Return Fund, a diversified series of an open-end management investment company. Please read it carefully and keep it for future reference.
The securities offered by this Prospectus/Proxy Statement have not been approved or disapproved by the Securities and Exchange Commission (the “SEC”), nor has the SEC passed upon the accuracy or adequacy of this Prospectus/Proxy Statement. Any representation to the contrary is a criminal offense.
The following documents have been filed with SEC and are incorporated into this Prospectus/Proxy Statement by reference:
| (i) | the prospectus of Total Return Fund dated , 2004, as supplemented from time to time, for Class S and Class AARP shares (the “Total Return Fund Prospectus”), a copy of which is included with this Prospectus/Proxy Statement; |
| (ii) | the prospectus of Balanced Fund dated May 1, 2004, as supplemented from time to time, for Class S and Class AARP shares (the “Balanced Fund Prospectus” and, together with the Total Return Fund Prospectus, the “Prospectuses”); |
| (iii) | the statement of additional information of Balanced Fund dated May 1, 2004, as supplemented from time to time, for Class S and Class AARP shares (the “Balanced Fund SAI”); |
| (iv) | the statement of additional information relating to the proposed merger, dated , 2004 (the “Merger SAI” and, together with the Balanced Fund SAI, the “SAIs”); and |
1
Table of Contents
| (v) | the audited financial statements and related independent accountant’s report for Balanced Fund contained in the Annual Report for the fiscal year ended December 31, 2003, and the unaudited financial statements contained in the Semi-annual Report for the six-month period ended June 30, 2004. |
No other parts of the Prospectuses, SAIs, Annual Report or Semi-annual Report are incorporated by reference herein.
The updated financial highlights for Total Return Fund contained in the Semi-annual Report for the six-month period ended April 30, 2004 are attached to this Prospectus/Proxy Statement. See Exhibit B.
Shareholders may get free copies of the Annual Report, Semi-annual Report, prospectus and/or statement of additional information for a Fund, request other information about a Fund, or make shareholder inquiries, by contacting their financial advisor or by calling the corresponding Fund at 1-800-253-2277 for Class AARP shares and 1-800-SCUDDER for Class S shares.
Like shares of Balanced Fund, shares of Total Return Fund are not deposits or obligations of, or guaranteed or endorsed by, any financial institution, are not insured by the Federal Deposit Insurance Corporation, the Federal Reserve Board or any other agency, and involve risk, including the possible loss of the principal amount invested.
This document is designed to give you the information you need to vote on the proposal. Much of the information is required disclosure under rules of the SEC; some of it is technical. If there is anything you don’t understand, please contact Georgeson Shareholder, Balanced Fund’s proxy solicitor, at 1-888-288-5518, or contact your financial advisor.
Total Return Fund is subject to the informational requirements of the Securities Exchange Act of 1934, as amended, and in accordance therewith files reports and other information with the SEC. You may review and copy information about the Funds, including the SAIs, at the SEC’s public reference room at 450 Fifth Street, NW, Washington, D.C. You may call the SEC at 1-202-942-8090 for information about the operation of the public reference room. You may obtain copies of this information, with payment of a duplication fee, by electronic request at the following e-mail address: publicinfo@sec.gov, or by writing the Public Reference Branch, Office of Consumer Affairs and Information Services, Securities and Exchange Commission, Washington, D.C. 20549-0102. You may also access reports and other information about the Funds on the EDGAR database on the SEC’s Internet site at http://www.sec.gov.
2
Table of Contents
The responses to the questions that follow provide an overview of key points typically of concern to shareholders considering a proposed merger between mutual funds. These responses are qualified in their entirety by the remainder of this Prospectus/Proxy Statement, which you should read carefully because it contains additional information and further details regarding the proposed merger.
1. What is being proposed?
The Trustees of Scudder Portfolio Trust (the “Trust”), of which Balanced Fund is a series, are recommending that shareholders approve the transactions contemplated by the Agreement and Plan of Reorganization (as described below in Part IV and the form of which is attached hereto as Exhibit A), which we refer to as a merger of Balanced Fund into Total Return Fund. If approved by shareholders, all of the assets of Balanced Fund will be transferred to Total Return Fund solely in exchange for the issuance and delivery to Balanced Fund of shares of Total Return Fund (“Merger Shares”) with a value equal to the value of Balanced Fund’s assets net of liabilities and for the assumption by Total Return Fund of all liabilities of Balanced Fund. Immediately following the transfer, the appropriate class of Merger Shares received by Balanced Fund will be distributed pro rata, on a tax-free basis, to its shareholders of record.
2. What will happen to my shares of Balanced Fund as a result of the merger?
Your shares of Balanced Fund will, in effect, be exchanged on a tax-free basis for shares of the same class of Total Return Fund with an equal aggregate net asset value on the date of the merger.
3. Why have the Trustees of the Trust recommended that I approve the merger?
The Trustees believe that the merger may provide shareholders of Balanced Fund with the following benefits:
| • | Lower Expense Ratio. If the merger is approved, Balanced Fund shareholders are expected to benefit from a lower total fund operating expense ratio. |
| • | Compatible Investment Opportunity. The merger offers shareholders of Balanced Fund the opportunity to invest in a substantially larger combined fund with similar investment policies. Deutsche Investment Management Americas Inc. (“DeIM” or the “Advisor”), the investment advisor for the Funds, has advised the Trustees that Balanced Fund and Total Return Fund have compatible investment objectives and policies. In addition, the Advisor has advised the Trustees that both Funds have substantially the same portfolio management team and follow substantially similar investment processes. |
The Trustees of the Trust have concluded that: (1) the merger is in the best interests of Balanced Fund and (2) the interests of the existing shareholders of Balanced Fund will not be diluted as a result of the merger. Accordingly, the Trustees of the Trust unanimously recommend that shareholders approve the Agreement and Plan of Reorganization (as defined below) effecting the merger.
3
Table of Contents
4. How do the investment goals, policies and restrictions of the two Funds compare?
Total Return Fund seeks the highest total return, a combination of income and capital appreciation, consistent with reasonable risk. Balanced Fund seeks a balance of growth and income from a diversified portfolio of equity and fixed-income securities. Total Return Fund can buy many types of securities, among them common stocks, convertible securities, corporate bonds, U.S. government bonds and mortgage- and asset-backed securities. Balanced Fund normally invests approximately 60% of its net assets in common stocks and other equity securities and approximately 40% of its net assets in investment-grade bonds and other fixed income securities. Balanced Fund may, however, invest up to 75% of its net assets in equity securities and up to 50% in fixed income securities, based on the portfolio managers’ evaluation of the relative attractiveness of equity securities as compared to fixed income securities. At all times, Balanced Fund invests at least 25% of net assets in fixed income senior securities.
Both Funds’ bond investments consist mainly of investment-grade bonds (those in the top four grades of credit quality). However, Total Return Fund could invest up to 35% of total assets in junk bonds, while Balanced Fund could invest up to 10% of total assets, though no more than 20% of its bond assets, in junk bonds. Both Funds may also invest in foreign securities (in the case of Total Return Fund, up to 25% of total assets). Although not one of either Fund’s principal investment strategies, each Fund is permitted, but not required, to use various types of derivatives (contracts whose value is based on, for example, indices, currencies or securities). Each Fund may use derivatives in circumstances where the managers believe they offer an economical means of gaining exposure to a particular asset class or to keep cash on hand to meet shareholder redemptions or other needs while maintaining exposure to the market. Please also see Part II—Investment Strategies and Risk Factors—below for a more detailed comparison of the Funds’ investment policies and restrictions.
The following table sets forth a summary of the composition of the investment portfolio of each Fund as of April 30, 2004, and of Total Return Fund on a pro forma combined basis, giving effect to the proposed merger.
Portfolio Composition (as a % of Fund)
| Balanced Fund | Total Return Fund | Pro Forma (Combined)(1) | |||||||
Common and Preferred Stocks | 58 | % | 63 | % | 62 | % | |||
Fixed Income Holdings | 40 | % | 36 | % | 37 | % | |||
Cash and Cash Equivalents | 2 | % | 1 | % | 1 | % | |||
| 100 | % | 100 | % | 100 | % |
| (1) | Reflects the blended characteristics of Balanced Fund and Total Return Fund as of April 30, 2004. The portfolio composition and characteristics of the merged Fund will change consistent with its stated investment objective and policies. |
4
Table of Contents
5. How do the management fees and expense ratios of the two Funds compare, and what are they estimated to be following the merger?
The following tables summarize the fees and expenses you may pay when investing in the Funds, the expenses that each of the Funds incurred for the year ended April 30, 2004 and the pro forma estimated expense ratios of Total Return Fund assuming consummation of the merger, which reflects the lower management fee schedule to be adopted by Total Return Fund as of that date.
Shareholder Fees (fees paid directly from your investment)
| Class S1 | Class AARP1 | |||
Maximum Sales Charge (Load) | ||||
Balanced Fund | None | None | ||
Total Return Fund | None | None | ||
Maximum Contingent Deferred Sales Charge (Load) | ||||
Balanced Fund | None | None | ||
Total Return Fund | None | None | ||
Redemption/Exchange Fee | ||||
Balanced Fund2 | None | None | ||
Total Return Fund2 | None | None |
| (1) | Class S and Class AARP for Total Return Fund have not yet commenced operations as of the date of this Prospectus/Proxy Statement. |
| (2) | Effective February 1, 2005, each Fund will impose a redemption fee of 2% of the total redemption amount on all Fund shares redeemed or exchanged within 15 days of buying them (either by purchase or exchange). |
The table below compares the annual management fee schedules of the Funds, expressed as a percentage of net assets. The management fee schedule for Total Return Fund reflects reductions that will be effective upon the consummation of the merger. As of April 30, 2004, Total Return Fund and Balanced Fund had net assets of $1,974,345,900 and $725,903,647, respectively.
Balanced Fund | Total Return Fund | |||||
Average Daily Net Assets | Management Fee | Average Daily Net Assets | Management Fee | |||
$0 - $1.5 billion | .470% | $0 - $1.5 billion | .470% | |||
$1.5 billion - $2 billion | .445% | $1.5 billion - $2 billion | .445% | |||
$2 billion - $6.25 billion | .410% | $2 billion - $3.5 billion | .410% | |||
$6.25 billion - $8.5 billion | .400% | $3.5 billion - $5.5 billion | .400% | |||
$8.5 billion - $12.5 billion | .385% | $5.5 billion - $7.5 billion | .390% | |||
Over $12.5 billion | .375% | $7.5 billion - $10.0 billion | .380% | |||
| $10.0 billion - $12.5 billion | .370% | |||||
| Over $12.5 billion | .360% | |||||
5
Table of Contents
As shown below, the merger is expected to result in a lower management fee ratio and total expense ratio for shareholders of Balanced Fund. However, there can be no assurance that the merger will result in expense savings.
Annual Fund Operating Expenses (expenses that are deducted from Fund assets)
| Management Fees | Distribution/ Service Fee | Other Expenses | Total Annual Fund Operating Expenses | Less Expense Waiver/ Reimbursements | Net Annual Fund Operating Expenses | ||||||||||||
Balanced Fund | |||||||||||||||||
Class S | 0.47 | % | None | 0.29 | %2 | 0.76 | % | —3 | 0.76 | % | |||||||
Class AARP | 0.47 | % | None | 0.32 | %2 | 0.79 | % | —3 | 0.79 | % | |||||||
Total Return Fund | |||||||||||||||||
Class S4 | 0.54 | % | None | 0.28 | % | 0.82 | % | — | 0.82 | % | |||||||
Class AARP4 | 0.54 | % | None | 0.31 | % | 0.85 | % | — | 0.85 | % | |||||||
Total Return Fund (Pro forma combined) | |||||||||||||||||
Class S4 | 0.45 | %1 | None | 0.28 | %6 | 0.73 | % | —5 | 0.73 | % | |||||||
Class AARP4 | 0.45 | %1 | None | 0.31 | %6 | 0.76 | % | 0.01 | %5 | 0.75 | % | ||||||
| (1) | Restated to reflect the management fee schedule for Total Return Fund that is effective upon consummation of the merger and estimated other expenses expected upon consummation of the merger. |
| (2) | Restated to reflect estimated costs due to the termination of the fixed rate administrative fee for Balanced Fund. |
| (3) | Through September 30, 2005, the Advisor has contractually agreed to waive all or a portion of its management fee and/or reimburse or pay operating expenses of the Fund to the extent necessary to maintain Balanced Fund’s total annual operating expenses at 0.915% for Class S and Class AARP shares, excluding certain expenses such as extraordinary expenses, taxes, brokerage, interest, Rule 12b-1 distribution and/or service fees, trustee and trustee counsel fees and organizational and offering expenses. |
| (4) | Estimated since no Class S or Class AARP shares were issued as of April 30, 2004. |
| (5) | Through [February 28], 2008, DeIM has contractually agreed to waive all or a portion of its management fee and/or reimburse or pay operating expenses of the combined fund to the extent necessary to maintain the combined fund’s total operating expenses at 0.73% and 0.75% for Class S and Class AARP shares, respectively, excluding certain expenses such as extraordinary expenses, taxes, brokerage, interest, Rule 12b-1 and/or service fees, trustee and trustee counsel fees, and organizational and offering expenses. |
| (6) | Other expenses are estimated, accounting for the effect of the merger. |
The tables are provided to help you understand the expenses of investing in the Funds and your share of the operating expenses that each Fund incurs and that Deutsche Asset Management (“DeAM”), the investment manager for the Scudder funds, expects the combined Fund to incur in the first year following the merger.
6
Table of Contents
Examples
These examples translate the expenses shown in the preceding table into dollar amounts. By doing this, you can more easily compare the costs of investing in the Funds. The examples make certain assumptions. They assume that you invest $10,000 in a Fund for the time periods shown and reinvest all dividends and distributions. They also assume a 5% return on your investment each year and that a Fund’s operating expenses remain the same. The examples are hypothetical; your actual costs and returns may be higher or lower.
| 1 Year | 3 Years | 5 Years | 10 Years | |||||||||
Balanced Fund | ||||||||||||
Class S | $ | 78 | $ | 243 | $ | 422 | $ | 942 | ||||
Class AARP | $ | 81 | $ | 252 | $ | 439 | $ | 978 | ||||
Total Return Fund | ||||||||||||
Class S | $ | 84 | $ | 262 | $ | 455 | $ | 1,014 | ||||
Class AARP | $ | 87 | $ | 271 | $ | 471 | $ | 1,049 | ||||
Total Return Fund (Pro forma combined) | ||||||||||||
Class S | $ | 75 | $ | 233 | $ | 406 | $ | 906 | ||||
Class AARP1 | $ | 77 | $ | 240 | $ | 419 | $ | 939 | ||||
| (1) | Includes three years of capped expenses in each period. |
6. What are the federal income tax consequences of the proposed merger?
For federal income tax purposes, no gain or loss is expected to be recognized by Balanced Fund or its shareholders as a direct result of the merger. For a discussion of taxes that you may incur indirectly as a result of the merger (e.g., due to differences in the Funds’ portfolio turnover rates and net investment income), please see “Information about the Proposed Merger—Federal Income Tax Consequences,” below.
7. Will my dividends be affected by the merger?
The merger will not result in a change in dividend policy.
8. Do the procedures for purchasing, redeeming and exchanging shares of the two Funds differ?
No. The procedures for purchasing and redeeming shares of a particular class for each Fund, and for exchanging shares of each Fund for shares of other Scudder funds, are identical.
Orders for the purchase or redemption of Class S and Class AARP shares of the Funds may be made either directly with the Funds or through a “third party provider”—for example, a workplace retirement plan, financial supermarket or financial advisor—which may have its own policies or instructions.
Each Fund reserves the right to honor any request for redemption or repurchase by “redeeming in kind,” that is, by making payment in readily marketable securities (which typically involve brokerage costs when liquidating the securities to cash).
7
Table of Contents
Orders received by the Funds are effected only on days when the New York Stock Exchange (“NYSE”) is open for trading. Purchases and redemptions of shares of each Fund are made at the Fund’s net asset value (“NAV”) per share calculated as of the close of the NYSE (normally, 4:00 p.m. Eastern time). You can place an order to buy or sell shares at any time. The NAV per each class of each Fund is calculated by dividing the value of total assets of the class, minus all liabilities, by the total number of the class outstanding shares.
9. How will I be notified of the outcome of the merger?
If the proposed merger is approved by shareholders, you will receive confirmation after the reorganization is completed, indicating your new account number and the number of Merger Shares you are receiving. Otherwise, you will be notified in the next annual report of Balanced Fund.
10. Will the number of shares I own change?
Yes, the number of shares you own will most likely change, but the total value of the shares of Total Return Fund you receive will equal the total value of the shares of Balanced Fund that you hold at the time of the merger. Even though the net asset value per share of each Fund is likely to be different, the total value of each shareholder’s holdings will not change as a result of the merger.
11. What percentage of shareholders’ votes is required to approve the merger?
Approval of the merger will require the “yes” vote of the holders of a majority of the shares of Balanced Fund.
The Trustees of Balanced Fund believe that the proposed merger is in the best interests of Balanced Fund. Accordingly, the Trustees unanimously recommend that shareholders vote FOR approval of the proposed merger.
II. Investment Strategies and Risk Factors
What are the main investment strategies and related risks of Total Return Fund, and how do they compare with those of Balanced Fund?
Investment Objectives and Strategies. As noted above, Total Return Fund and Balanced Fund have similar investment objectives. Total Return Fund’s investment objective is to seek the highest total return, a combination of income and capital appreciation, consistent with reasonable risk. Balanced Fund’s investment objective is to seek a balance of growth and income from a diversified portfolio of equity and fixed-income securities. The portfolio managers for the two Funds are substantially the same.
Total Return Fund. Total Return Fund follows a flexible investment program, investing in a mix of growth stocks and bonds.
8
Table of Contents
Total Return Fund can buy many types of securities, among them common stocks, convertible securities, corporate bonds, U.S. government bonds and mortgage- and asset-backed securities. In deciding which type of securities to buy, the managers consider the relative attractiveness of growth stocks and bonds and determine allocations for each. Their decisions are generally based on a number of factors, including interest rates and general market conditions. Generally, most securities are from U.S. issuers, but the fund may invest up to 25% of total assets in foreign securities.
Normally, Total Return Fund’s bond component consists mainly of investment-grade bonds (those in the top four grades of credit quality). However, Total Return Fund could invest up to 35% of total assets in junk bonds (i.e., grade BB and below). Compared to investment-grade bonds, junk bonds may pay higher yields and have higher volatility and risk of default on payments.
Although not one of its principal investment strategies, Total Return Fund is permitted, but not required, to use various types of derivatives (contracts whose value is based on, for example, indices, currencies or securities). In particular, Total Return Fund may use futures, currency options and forward currency transactions. Total Return Fund may use derivatives in circumstances where the managers believe they offer an economical means of gaining exposure to a particular asset class or to keep cash on hand to meet shareholder redemptions or other needs while maintaining exposure to the market.
In choosing stocks, the portfolio managers for Total Return Fund favor large companies with a history of above-average growth, attractive prices relative to potential growth, sound financial strength and effective management, among other factors.
The portfolio managers for Total Return Fund may shift the proportion of Total Return Fund’s holdings, at different times favoring stocks or bonds (and within those asset classes, different types of securities), while still maintaining variety in terms of the securities, issuers and economic sectors represented.
Total Return Fund will normally sell a stock when the managers believe its price is unlikely to go much higher, its fundamental qualities have deteriorated or other investments offer better opportunities.
In deciding what types of bonds to buy and sell, the managers of Total Return Fund consider their relative potential for stability and attractive income, and other factors such as credit quality and market conditions. Total Return Fund may invest in bonds of any duration.
Balanced Fund. Balanced Fund normally invests approximately 60% of its net assets in common stocks and other equity securities and approximately 40% of its net assets in investment-grade bonds and other fixed income securities. Balanced Fund may, however, invest up to 75% of its net assets in equity securities and up to 50% in fixed income securities, based on the portfolio managers’ evaluation of the relative attractiveness of equity securities as compared to fixed income securities. At all times, Balanced Fund invests at least 25% of net assets in fixed-income senior securities.
Balanced Fund’s bond investments are normally in the top four grades of credit quality. Balanced Fund could put up to 10% of total assets—though no more than 20%
9
Table of Contents
of its bond assets—in junk bonds (i.e., grade BB/Ba and below). Compared to investment-grade bonds, junk bonds may pay higher yields but have higher volatility and risk of default. Balanced Fund may also invest in foreign securities.
Although not one of its principal investment strategies, Balanced Fund is permitted, but not required, to use various types of derivatives (contracts whose value is based on, for example, indices, currencies or securities). Balanced Fund may use derivatives in circumstances where the managers believe they offer an economical means of gaining exposure to a particular asset class or to keep cash on hand to meet shareholder redemptions or other needs while maintaining exposure to the market.
In choosing stocks, the managers of Balanced Fund primarily invest in U.S. companies that they believe offer the potential for sustainable growth of revenue or earnings and whose market values appear reasonable in light of their business prospects. The managers of Balanced Fund focus on high-quality growth companies that are leaders or potential leaders in their respective industries. The managers of Balanced Fund conduct in-depth company research, examining, among other factors, relative growth rates, innovation, regional and global exposure and management.
In choosing individual bonds, the managers review each bond’s fundamentals, consider how it is structured and use independent analysis of an issuer’s creditworthiness. Balanced Fund can buy many types of bonds of any maturity, including mortgage- and asset-backed securities, corporate bonds and government securities.
The managers of Balanced Fund will normally sell a security when they believe its fundamental factors have changed, other investments offer better opportunities, or in the course of adjusting their emphasis on or within a given industry.
The managers of Balanced Fund may favor different types of securities at different times.
Balanced Fund may lend its fixed income investment securities up to 33 1/3% of its total assets to approved institutional borrowers who need to borrow securities in order to complete certain transactions.
In addition, for temporary defensive purposes, each Fund may invest, without limit, in cash and cash equivalents, U.S. government securities, money market instruments and high quality debt securities without equity features. In such a case, each Fund would not be pursuing, and may not achieve, its investment objective.
General. The Funds have identical fundamental investment policies, which may not be changed without a shareholder vote.
DeAM believes that Total Return Fund should provide a comparable investment opportunity for shareholders of Balanced Fund.
For a more detailed description of the investment techniques used by Total Return Fund and Balanced Fund, please see the applicable Fund’s Prospectus and SAI.
10
Table of Contents
Primary Risks. As with any stock fund, you may lose money by investing in Total Return Fund. Certain risks associated with an investment in Total Return Fund are summarized below. Subject to limited exceptions, the risks of an investment in Total Return Fund are substantially similar to the risks of an investment in Balanced Fund. More detailed descriptions of the risks associated with an investment in Total Return Fund can be found in the Total Return Fund Prospectus and Total Return Fund SAI.
The value of your investment in Total Return Fund will change with changes in the values of the investments held by Total Return Fund. A wide array of factors can affect those values. In this summary we describe the principal risks that may affect Total Return Fund’s investments as a whole. Total Return Fund could be subject to additional principal risks because the types of investments it makes can change over time.
Stock Market Risk. As with most stock funds, an important factor with Total Return Fund is how stock markets perform—in this case, the large company portion of the U.S. stock market. When large company stock prices fall, you should expect the value of your investment to fall as well. At times, large company stocks may not perform as well as stocks of smaller or mid-sized companies. Because a stock represents ownership in its issuer, stock prices can be hurt by poor management, shrinking product demand and other business risks. These may affect single companies as well as groups of companies. In addition, movements in financial markets may adversely affect a stock’s price, regardless of how well the company performs. The market as a whole may not favor the types of investments each Fund makes and each Fund may not be able to get attractive prices for them. An investment in Balanced Fund is also subject to this risk.
Industry Risk. While Total Return Fund does not concentrate in any industry, to the extent that Total Return Fund has exposure to a given industry or sector, any factors affecting that industry or sector could affect the value of portfolio securities. For example, manufacturers of consumer goods could be hurt by a rise in unemployment, or technology companies could be hurt by such factors as market saturation, price competition and rapid obsolescence. An investment in Balanced Fund is also subject to this risk.
Securities Lending Risk. Any loss in the market price of securities loaned by Total Return Fund that occurs during the term of the loan would be borne by Total Return Fund and would adversely affect Total Return Fund’s performance. Also, there may be delays in recovery of securities loaned or even a loss of rights in the collateral should the borrower of the securities fail financially while the loan is outstanding. However, loans will be made only to borrowers selected by Total Return Fund’s delegate after a review of relevant facts and circumstances, including the creditworthiness of the borrower. An investment in Balanced Fund is also subject to this risk.
Credit Risk. A fund purchasing bonds faces the risk that the creditworthiness of the issuer may decline, causing the value of its bonds to decline. In addition, an issuer may not be able to make timely payments on the interest and principal on the bonds it has issued. Because the issuers of junk bonds (rated below the fourth highest category) may be in uncertain financial health, the prices of their bonds can be more vulnerable to bad economic news or even the expectation of bad news, than investment-grade bonds. In some cases, bonds may decline in credit quality or go into default. Because Total Return Fund may invest in securities not paying current interest or in securities already in default, these risks may be more pronounced. An investment in Balanced Fund is also subject to this risk.
11
Table of Contents
Interest Rate Risk. Generally, fixed income securities will decrease in value when interest rates rise, and increase in value when interest rates decline. The longer the effective maturity of Total Return Fund’s securities, the more sensitive it will be to interest rate changes. (As a general rule, a 1% rise in interest rates means a 1% fall in value for every year of duration.) As interest rates decline, the issuers of securities held by Total Return Fund may prepay principal earlier than scheduled, forcing Total Return Fund to reinvest in lower yielding securities. This prepayment may reduce Total Return Fund’s income. As interest rates increase, slower than expected principal payments may extend the average life of fixed income securities. This will have the effect of locking in a below-market interest rate, increasing Total Return Fund’s duration and reducing the value of such a security. Because Total Return Fund may invest in mortgage-related securities, it is more vulnerable to both of these risks. An investment in Balanced Fund is also subject to this risk.
Other factors that could affect performance include:
| • | the managers could be incorrect in their analysis of industries, companies, economic trends, the relative attractiveness of different sizes of stocks or other matters; |
| • | at times, market conditions might make it hard to value some investments. As a result, if Total Return Fund has valued its securities too highly, you may end up paying too much for Total Return Fund shares when you buy into Total Return Fund. If Total Return Fund underestimates the price of its securities, you may not receive the full market value for your Total Return Fund shares when you sell; |
| • | foreign securities tend to be more volatile than their U.S. counterparts, for reasons such as currency fluctuations and political and economic uncertainty; |
| • | the Advisor measures credit quality at the time it buys securities, using independent rating agencies or, for unrated securities, judged by the Advisor to be of equivalent quality. In addition, the Advisor applies its own credit quality standards to evaluate securities. If a security’s credit quality declines, the Advisor will decide what to do with the security, based on the circumstances and its assessment of what would benefit shareholders most; and |
| • | derivatives could produce disproportionate losses due to a variety of factors, including the unwillingness or inability of the counterparty to meet its obligations or unexpected price or interest rate movements (see “Secondary Risks” in each Fund’s Prospectus for more information). |
An investment in Balanced Fund is also subject to these other risk factors.
Performance Information. The following information provides some indication of the risks of investing in each Fund. The bar charts show year-to-year changes in the performance of Total Return Fund’s Class A shares and Balanced Fund’s Class S shares.
The table following the charts compares the Funds’ performance to each other’s and to that of broad measures of market performance (which, unlike a Fund, do not have any fees or expenses). Of course, a Fund’s past performance is not an indication of future performance.
12
Table of Contents
Because Class S and Class AARP shares of Total Return Fund have not yet begun operations as of the date of this Prospectus/Proxy Statement, no performance information for these classes is available.
For Balanced Fund, the inception date for Class AARP shares was August 28, 2000. In the bar chart, the performance figures for Class S are shown, since this was the Fund’s original share class. In the table, the performance figures for Class AARP prior to its inception are based on the historical performance of Class S.
Calendar Year Total Returns (%)
Total Return Fund—Class A Shares
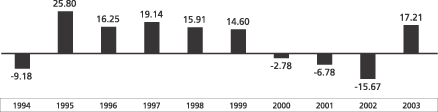
For the periods included in the bar chart:
Best Quarter: 13.07%, Q2 1997 Worst Quarter: -10.01%, Q2 2002
Balanced Fund—Class S Shares*
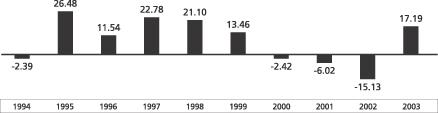
For the periods included in the bar chart:
Best Quarter: 14.71%, Q4 1998 Worst Quarter: -9.72%, Q2 2002
| * | In the bar chart, total returns for 1995 through 1998 would have been lower if operating expenses had not been reduced. |
Performance figures for the bar chart for Class A shares of Total Return Fund do not reflect the impact of sales charges. If they did, performance for Class A shares of Total Return Fund would be lower than as shown. Year-to-date performance through September 30, 2004 was 0.81% for Total Return Fund and 1.14% for Balanced Fund. During the periods shown in the bar chart, the highest returns for a quarter were 13.07% (quarter ended 6/30/97) for Total Return Fund and 14.71% (quarter ended 12/31/98) for Balanced Fund, and the lowest returns for a quarter were -10.01% (quarter ended 6/30/02) for Total Return Fund and -9.72% (quarter ended 6/30/02) for Balanced Fund.
13
Table of Contents
Average Annual Total Returns (for periods ended December 31, 2003)
| Past 1 year | Past 5 years | Past 10 years | |||||||
Total Return Fund | |||||||||
Class A (Return before Taxes)(5) | 10.47 | % | -0.66 | % | 5.90 | % | |||
(Return after Taxes on distributions) | 10.01 | % | -2.00 | % | 3.52 | % | |||
(Return after Taxes on distributions and Sale of Fund Shares) | 6.94 | % | -1.15 | % | 3.87 | % | |||
S&P 500 Index1 (Reflects no deductions for fees, expenses or taxes) | 28.68 | % | -0.57 | % | 11.07 | % | |||
Lehman Brothers Government/Corporate Bond Index2 (Reflects no deductions for fees, expenses or taxes) | 4.67 | % | 6.66 | % | 6.98 | % | |||
Russell 1000 Growth Index3 (Reflects no deductions for fees, expenses or taxes) | 29.75 | % | -5.11 | % | 9.21 | % | |||
Lehman Brothers Aggregate Bond Index4 (Reflects no deductions for fees, expenses or taxes) | 4.10 | % | 6.62 | % | 6.95 | % | |||
Balanced Fund* | |||||||||
Class S (Return before Taxes) | 17.19 | % | 0.69 | % | 7.80 | % | |||
(Return after Taxes on distributions) | 15.37 | % | -2.46 | % | 3.19 | % | |||
(Return after Taxes on distributions and Sale of Fund Shares) | 9.99 | % | -2.07 | % | 2.76 | % | |||
Class AARP (Return before Taxes) | 17.26 | % | 0.70 | % | 7.80 | % | |||
S&P 500 Index1 (Reflects no deductions for fees, expenses or taxes) | 28.68 | % | -0.57 | % | 11.07 | % | |||
Russell 1000 Growth Index3 (Reflects no deductions for fees, expenses or taxes) | 29.75 | % | -5.11 | % | 9.21 | % | |||
Lehman Brothers Aggregate Bond Index4 (Reflects no deductions for fees, expenses or taxes) | 4.10 | % | 6.62 | % | 6.95 | % | |||
| (1) | The Standard & Poor’s 500 Composite Index is a capitalization-weighted index of 500 stocks. The index is designed to measure performance of the broad domestic economy through changes in the aggregate market value of 500 stocks representing all major industries. |
| (2) | The Lehman Brothers Government/Corporate Bond Index is an unmanaged index comprising intermediate and long-term government and investment-grade corporate debt securities. |
| (3) | The Russell 1000 Growth is an unmanaged capitalization-weighted index containing those securities in the Russell 1000 Index with higher book-to-price ratios and higher forecasted growth values. |
| (4) | The Lehman Brothers Aggregate Bond Index is an unmanaged, market value-weighted measure of treasury issues, corporate bond issues and mortgage securities. The Lehman Brothers Aggregate Bond Index will replace the Lehman Brothers Government/Corporate Bond Index as one of Total Return Fund’s primary benchmarks, as the Lehman Brothers Aggregate Bond Index is believed to be more reflective of the investment strategy pursued by Total Return Fund’s Advisor. |
14
Table of Contents
| (5) | Class S and Class AARP shares of Total Return Fund would have substantially similar annual returns as Class A shares, as the shares are invested in the same portfolio of securities, and would differ only to the extent that Class S and Class AARP shares do not have the same expenses as Class A shares. |
| * | In the table, total returns for 1995 through 1998 would have been lower if operating expenses had not been reduced. |
Current performance may be higher or lower than the performance data quoted above. For more recent performance information for Class S shares, call 1-800-SCUDDER or visit the website at www.myScudder.com or for Class AARP shares, call 1-800-253-2277 or visit the website at www.aarp.scudder.com.
Unlike the bar charts, the performance information for Class A shares of Total Return Fund in the table reflects the impact of maximum sales charges (5.75%). After-tax returns are estimates based on the historical highest individual federal income tax rates and do not reflect state and local taxes. Actual after-tax returns will depend on an investor’s tax situation and are likely to differ from those shown. After-tax returns for Total Return Fund are shown for Class A shares only and will vary for Class S and Class AARP. After-tax returns for Balanced Fund are shown for Class S shares only and will vary for Class AARP. After-tax returns are not relevant to those investing through 401(k) plans, IRAs or other tax-deferred arrangements.
III. Other Comparisons Between the Funds
Advisor and Portfolio Managers. Deutsche Investment Management Americas Inc. (“DeIM” or the “Advisor”) is the investment advisor for each Fund. Under the supervision of the Board of Trustees of each Fund, DeIM, with headquarters at 345 Park Avenue, New York, New York 10154, makes each Fund’s investment decisions, buys and sells securities for each Fund and conducts research that leads to these purchase and sale decisions. The Advisor is also responsible for selecting brokers and dealers and for negotiating brokerage commissions and dealer charges. DeIM is part of DeAM and an indirect wholly-owned subsidiary of Deutsche Bank AG. Deutsche Bank AG is a major global banking institution that is engaged in a wide range of financial services, including investment management, mutual fund, retail, private and commercial banking, investment banking and insurance.
Equity Team
Julie M. Van Cleave, CFA, is the Managing Director of DeAM and Lead Manager of the equity portion of each Fund. Ms. Van Cleave joined DeAM and each Fund in 2002 and is the Head of Large Cap Growth Portfolio Selection Team. Ms. Van Cleave’s previous experience includes 18 years’ investment industry experience at Mason Street Advisors, most recently serving as Managing Director and team leader for the large cap investment team. Ms. Van Cleave holds an MBA from the University of Wisconsin—Madison.
Jack A. Zehner is Director of DeAM and Portfolio Manager of each Fund. Mr. Zehner joined DeAM and each Fund in 2002. Mr. Zehner’s previous experience includes nine years’ investment industry experience at Mason Street Advisors where he served most recently as Director—Common Stock. Mr. Zehner holds an MBA from Marquette University.
15
Table of Contents
Thomas J. Schmid, CFA, is Director of DeAM and Portfolio Manager of each Fund. Mr. Schmid joined DeAM and each Fund in 2002. Mr. Schmid’s previous experience includes 15 years’ investment industry experience, most recently serving as Director—Common Stock at Mason Street Advisors. Mr. Schmid holds an MBA from the University of Chicago.
Fixed Income Team
J. Christopher Gagnier is Managing Director of DeAM and Portfolio Manager of each Fund. Mr. Gagnier joined DeAM in 1997 and each Fund in 2002. Prior to that, Mr. Gagnier was portfolio manager at Paine Webber from 1984 to 1997. An analyst specializing in asset-backed securities and government investments, Mr. Gagnier has over 25 years of investment industry experience and holds an MBA from the University of Chicago.
Gary W. Bartlett, CFA, is Managing Director of DeAM and Portfolio Manager of each Fund. Mr. Bartlett joined DeAM in 1992 and each Fund in 2002. An analyst specializing in taxable municipal and government investments, Mr. Bartlett has over 23 years of investment industry experience and holds an MBA from Drexel University.
Warren S. Davis is Managing Director of DeAM and Portfolio Manager of each Fund. Mr. Davis joined DeAM in 1995 and each Fund in 2002. An analyst specializing in mortgage- and asset-backed securities, Mr. Davis has over 19 years of investment industry experience and holds an MBA from Drexel University.
Daniel R. Taylor, CFA, is Managing Director of DeAM and Portfolio Manager of each Fund. Mr. Taylor joined DeAM in 1998 and each Fund in 2002. Prior to that, Mr. Taylor was fixed income portfolio manager, asset-backed securities analyst and senior credit analyst with CoreStates Investment Advisors from 1992 to 1998. An analyst specializing in asset-backed securities and government securities, Mr. Taylor has over 12 years of investment industry experience.
Thomas J. Flaherty is Managing Director of DeAM and Portfolio Manager of each Fund. Mr. Flaherty joined DeAM in 1995 and each Fund in 2002. An analyst specializing in corporate bonds and mortgages, Mr. Flaherty has over 19 years of investment industry experience.
Andrew P. Cestone is Managing Director of DeAM and Portfolio Manager of each Fund. Mr. Cestone joined DeAM in 1998 and each Fund in 2002. Prior to that, Mr. Cestone was an investment analyst with Phoenix Investment Partners from 1997 to 1998, and credit officer, asset based lending group with Fleet Bank from 1995 to 1997.
William T. Lissenden is Director of DeAM and Portfolio Manager of each Fund. Mr. Lissenden joined DeAM in 2002 and each Fund in 2003. Prior to that, Mr. Lissenden had 31 years of experience as a fixed income strategist and director of research at Conseco Capital Management, director of fixed income research and product management at Prudential Securities, national sales manager for fixed income securities at Prudential Securities and institutional sales professional at several firms including Prudential, Goldman Sachs and Merrill Lynch. Mr. Lissenden holds an MBA from Baruch College.
16
Table of Contents
Timothy C. Vile, CFA, is Managing Director of DeAM and Portfolio Manager of each Fund. Mr. Vile joined DeAM in 1991 and each Fund in 2003. Prior to that, Mr. Vile was a portfolio manager for fixed income portfolios at Equitable Capital Management. Mr. Vile has over 20 years of investment industry experience.
Brett Diment is Managing Director of DeAM and Consultant to Total Return Fund. Mr. Diment joined DeAM in 1991 and Total Return Fund in 2002. Mr. Diment is the Head of Emerging Market Debt for London Fixed Income and is responsible for coordinating research into Continental European markets and managing global fixed income, balanced and cash based portfolios: London. Mr. Diment began his investment career in 1991.
Asset Allocation Team
Janet Campagna is Managing Director of DeAM and Portfolio Manager of each Fund. Ms. Campagna joined DeAM in 1999 and each Fund in 2002. The head of global and tactical asset allocation, Ms. Campagna was an investment strategist and manager of the asset allocation strategies group for Barclays Global Investors from 1994 to 1999. Ms. Campagna has over 16 years of investment industry experience. She holds a Master’s degree in Social Science from California Institute of Technology and has a Ph.D. in Political Science from University of California at Irvine.
Distribution and Service Fees. Pursuant to separate Underwriting and Distribution Services Agreements, Scudder Distributors, Inc. (“SDI”), 222 South Riverside Plaza, Chicago, Illinois 60606, an affiliate of DeIM, is the principal underwriter, distributor and administrator for the Class A, Class B, Class C, Class R, Institutional Class, Class S and Class AARP shares of Total Return Fund, and acts as agent of each Fund in the continuing offer of such shares. Pursuant to an underwriting agreement, SDI is the principal underwriter for the Class S and Class AARP shares of Balanced Fund. Rule 12b-1 distribution plans have not been adopted for Class S shares or Class AARP shares of either Fund.
Trustees and Officers. The Trustees of Scudder Portfolio Trust (of which Balanced Fund is a series) are different from those of Scudder Total Return Fund. The following individuals comprise the Board of Trustees of the Trust: Dawn-Marie Driscoll (Chair), Henry P. Becton, Jr., Keith R. Fox, Louis E. Levy, Jean Gleason Stromberg, Jean C. Tempel and Carl W. Vogt. The following individuals comprise the Board of Trustees of Scudder Total Return Fund: John W. Ballantine, Lewis A. Burnham, Donald L. Dunaway, James R. Edgar, Paul K. Freeman, Robert B. Hoffman, Shirley D. Peterson (Chair), Fred B. Renwick (who will retire at the end of the year), William N. Shiebler and John G. Weithers. The officers of the Trust are the same as those of Scudder Total Return Fund, except that Philip J. Collora, Vice President and Assistant Secretary of Scudder Total Return Fund, is not an officer of Scudder Portfolio Trust, and John Millette, Secretary of Scudder Total Return Fund, is Vice President and Secretary of Scudder Portfolio Trust.
Independent Registered Public Accounting Firms (“Auditors”). Total Return Fund’s Auditors are Ernst & Young LLP. Balanced Fund’s Auditors are PricewaterhouseCoopers LLP.
17
Table of Contents
Charter Documents.
Scudder Portfolio Trust
General. The Trust is an open-end management investment company, which was established as a Massachusetts business trust pursuant to an Agreement and Declaration of Trust dated September 20, 1984, as amended (“Declaration of Trust”). Scudder Balanced Fund is a diversified series of the Trust. The Trust is also governed by its bylaws and applicable state law.
Shares. The Trust is authorized to issue an unlimited number of shares of beneficial interest, of par value $0.01 per share, from an unlimited number of series of shares. All shares are fully paid and non-assessable, transferable, have no pre-emptive or conversion rights and are redeemable as described in the Balanced Fund Prospectus and the Balanced Fund SAI.
Voting Rights. The shareholders shall have power to vote only (i) for the election or removal of Trustees; (ii) with respect to any investment advisory or management contract entered into; (iii) with respect to termination of the Trust; (iv) with respect to any amendment of the Declaration of Trust; (v) with respect to any merger, consolidation or sale of assets; (vi) with respect to incorporation of the Trust, or any series; (vii) to the same extent as the stockholders of Massachusetts business corporation as to whether or not a court action, proceeding or claim should or should not be brought or maintained derivatively or as a class action on behalf of the Trust or the Shareholders; (viii) with respect to any plan adopted pursuant to Rule 12b-1 (or any successor rule) under the 1940 Act; and (ix) with respect to such additional matters relating to the Trust as may be required by the Declaration of Trust, the By-laws or any registration of the Trust as an investment company under the 1940 Act with the SEC (or any successor agency) or as the Trustees may consider necessary or desirable. Each whole share shall be entitled to one vote as to any matter on which it is entitled to vote and each fractional share shall be entitled to a proportionate fractional vote, except that the Trustees may, in conjunction with the establishment of any series of shares, establish or reserve the right to establish conditions under which the several series shall have separate voting rights or, if a series would not, in the sole judgment of the Trustees, be materially affected by a proposal, no voting rights. There shall be no cumulative voting in the election of Trustees.
Shareholder Meetings. The Trust is generally not required to hold meetings of its shareholders. Meetings of shareholders may be called at any time by the President, and shall be called by the President and Secretary at the request in writing or by resolution of a majority of Trustees, or at the written request of the holder or holders of ten percent or more of the total number of shares then issued and outstanding of the Trust entitled to vote at such meeting.
Election and Term of Trustees. The Trustees shall be elected by the shareholders owning of record a plurality of the shares voting at a meeting of shareholders. Except in the event of resignation or removal pursuant to the Declaration of Trust, or death, bankruptcy, adjudicated incompetence or other incapacity, each Trustee shall hold office until such time as less than a majority of the Trustees holding office have been elected by shareholders. In such event, the Trustees then in office will call a shareholders’ meeting for the election of Trustees.
18
Table of Contents
Shareholder Liability. Under Massachusetts law, shareholders of a series could, under certain circumstances, be held liable for the obligations of their series. However, the Trust’s Declaration of Trust disclaims shareholder liability for acts or obligations of the Trust and permits notice of such disclaimer to be given in each agreement, obligation, or instrument entered into or executed by a Fund or the Trust’s Trustees. Moreover, the Declaration of Trust of the Trust provides indemnification for all losses and expenses of any shareholder held liable for the obligations of their series. The indemnification and reimbursement required by the preceding sentence shall be made only out of the assets of the one or more series of which the shareholder who is entitled to indemnification or reimbursement was a shareholder at the time the act or event occurred which gave rise to the claim or liability, and the Fund may be covered by insurance. Thus the risk of a shareholder liability is considered by DeAM to be remote and not material, since it is limited to circumstances in which a disclaimer is inoperative and such Fund itself is unable to meet its obligations.
Trustee Liability. The Trustees of the Trust generally are not liable for any obligation of the Trust. The Trust will indemnify its Trustees against all liabilities and expenses, except for those arising from the Trustee’s willful misfeasance, bad faith, gross negligence or reckless disregard of such Trustee’s duties.
Scudder Total Return Fund
General. Scudder Total Return Fund (for purposes of this section only, the “Trust”) is an open-end management investment company, which was established as a Massachusetts business trust pursuant to a Declaration of Trust dated October 24, 1985, and effective January 31, 1986. Total Return Fund, pursuant to a reorganization, succeeded to the assets and liabilities of Kemper Total Return Fund, Inc., a Maryland corporation organized in 1963. Total Return Fund was known as Balanced Income Fund until 1972 and as Supervised Investors Income Fund, Inc. until 1977. Total Return Fund is classified as a diversified series of the Trust. The Trust is also governed by its bylaws and applicable state law.
Shares. The Trust is authorized to issue an unlimited number of shares of beneficial interest, without a par value, from an unlimited number of series of shares. All shares issued and outstanding are fully paid and non-assessable, transferable, have no pre-emptive or conversion rights and are redeemable as described in the Total Return Fund Prospectus and Total Return Fund SAI. Each share has equal rights with each other share of the same class of Total Return Fund as to voting, dividends, exchanges, conversion features and liquidation.
Voting Rights. On each matter submitted to a vote of shareholders of Scudder Total Return Fund, each full share is entitled to one vote, and each fractional share is entitled to a fractional vote. The Shareholders shall have power to vote only: (a) for the election or removal of Trustees; (b) with respect to any investment advisor or manager; (c) with respect to any termination or reorganization of the Trust or any series or class thereof; (d) with respect to any amendment of the Declaration of Trust; and (e) with respect to such additional matters relating to the Trust as may be required by law, the 1940 Act, the Declaration of Trust, the By-Laws or any registration of the Trust with the SEC (or any successor agency) or any state, or as the Trustees may consider necessary or desirable.
19
Table of Contents
Notwithstanding any other provision of the Declaration of Trust, on any matter submitted to a vote of shareholders all shares of the Trust then entitled to vote shall, except to the extent otherwise required or permitted by the preferences and special or relative rights or privileges of any class of shares, be voted by individual series and not in the aggregate or by class, except (a) when required by the 1940 Act, shares shall be voted in the aggregate and not by individual series; and (b) when the Trustees have more series or classes, then only shareholders of such series or class shall be entitled to vote thereon. There shall be no cumulative voting in the election of Trustees. Shares may be voted in person or by proxy. Until shares of any series or class are issued, the Trustees may exercise all rights of shareholders and may take any action required by law, the Declaration of Trust or the By-Laws to be taken by shareholders of such series or class.
Shareholder Meetings. The Trust generally is not required to hold annual meetings of shareholders unless required by the 1940 Act. Meetings of the shareholders may be called at any time by the Trustees, by the President or, if the Trustees and the President shall fail to call any meeting of shareholders for a period of 30 days after written application of one or more shareholders who hold at least 25% of all shares issued and outstanding and entitle to vote at the meeting (or 10% if the purpose of the meeting is to determine if a trustee shall be removed from office), then such shareholders may call such meeting. Each call of a meeting shall state the place, date, hour and purposes of the meeting.
Election and Term of Trustees. The Trustees shall be elected by the shareholders owning of record a plurality of the shares voting at a meeting of shareholders. Each Trustee serves until the next meeting of shareholders, if any, called for the purpose of electing Trustees and until the election and qualification of a successor or until such Trustee sooner dies, retires, resigns or is removed.
Shareholder Liability. Under Massachusetts law, shareholders of a series could, under certain circumstances, be held liable for the obligations of their series. However, the Trust’s Declaration of Trust disclaims shareholder liability for acts or obligations of the Trust and provides indemnification for all losses and expenses of any shareholder held liable for the obligations of this series. The indemnification and reimbursement required by the preceding sentence shall be made only out of the assets of the one or more series of which the shareholder who is entitled to indemnification or reimbursement was a shareholder at the time the act or event occurred which gave rise to the claim or liability.
Trustee Liability. The Trustees of the Trust generally are not liable for any obligation of the Trust. The Trust will indemnify its Trustees against all liabilities and expenses, except for those arising from the Trustee’s willful misfeasance, bad faith, gross negligence or reckless disregard of such Trustee’s duties.
The foregoing is only a summary of the charter documents of Scudder Total Return Fund and Scudder Portfolio Trust and is not a complete description of provisions contained in those sources. Shareholders should refer to the provisions of those documents and state law directly for a more thorough description.
Fund Accounting Fees. Scudder Fund Accounting Corporation (“SFAC”), Two International Place, Boston, Massachusetts 02110, a subsidiary of DeIM, is responsible
20
Table of Contents
for determining the net asset value per share of each Fund and maintaining the portfolio and general accounting records for each Fund. Balanced Fund pays a fee directly to SFAC. Total Return Fund does not pay a fee directly to SFAC, but indirectly pays for the services through its management fee.
IV. Information About the Proposed Merger
General. The shareholders of Balanced Fund are being asked to approve a merger between Balanced Fund and Total Return Fund pursuant to an Agreement and Plan of Reorganization between the Funds (the “Agreement”), the form of which is attached to this Prospectus/Proxy Statement as Exhibit A.
The merger is structured as a transfer of all of the assets of Balanced Fund to Total Return Fund in exchange for the assumption by Total Return Fund of all liabilities of Balanced Fund and for the issuance and delivery to Balanced Fund of Merger Shares of Total Return Fund equal in aggregate value to the net value of the assets transferred to Total Return Fund.
After receipt of the Merger Shares, Balanced Fund will distribute the Merger Shares to its shareholders, in proportion to their existing shareholdings, in complete liquidation of Balanced Fund, and the legal existence of Balanced Fund as a series of Scudder Portfolio Trust will be terminated. Each shareholder of Balanced Fund will receive a number of full and fractional Merger Shares of the same class(es) as, and equal in value at the date of the exchange to, the aggregate value of the shareholder’s Balanced Fund shares.
Prior to the date of the merger, Balanced Fund will sell all investments that are not consistent with the current investment objective, policies and restrictions of Total Return Fund, if any, and declare a taxable distribution which, together with all previous distributions, will have the effect of distributing to shareholders all of its net investment income and net realized capital gains, if any, through the date of the merger. The sale of such investments may increase the taxable distribution to shareholders of Balanced Fund occurring prior to the merger above that which they would have received absent the merger. [DeIM has represented that, as of , 2004, Balanced Fund did not have any investments that were not consistent with the current investment objective, policies and restrictions of Total Return Fund.]
The Trustees of the Trust have voted unanimously to approve the Agreement and the proposed merger and to recommend that shareholders also approve the merger. The actions contemplated by the Agreement and the related matters described therein will be consummated only if approved by the affirmative vote of the holders of a majority of the shares of Balanced Fund.
In the event that the merger does not receive the required shareholder approval, each Fund will continue to be managed as a separate Fund in accordance with its current investment objectives and policies, and the Trustees of the Trust and the Trustees of Scudder Total Return Fund may consider such alternatives as may be in the best interests of each Fund’s respective shareholders.
21
Table of Contents
Background and Trustees’ Considerations Relating to the Proposed Merger. DeAM first proposed the merger to the Trustees of Balanced Fund at a meeting held in 2004. The merger was presented to the Trustees and considered by them as part of a broader program initiated by DeAM to consolidate its mutual fund lineup. DeAM advised the Trustees that this initiative was intended to:
| • | Eliminate redundancies within the Scudder family by reorganizing and combining certain funds; and |
| • | Focus DeAM’s investment resources on a core set of mutual funds that best meet investor needs. |
The Trustees of Balanced Fund, including all Trustees who are not “interested persons” of Balanced Fund (as defined by the 1940 Act), conducted a thorough review of the potential implications of the merger on Balanced Fund’s shareholders. They were assisted in this review by their independent legal counsel. Following the 2004 meeting, the Trustees met on several occasions to review and discuss the merger, both among themselves and with representatives of DeAM. In the course of their review, the Trustees requested and received substantial additional information and negotiated changes to DeAM’s initial proposal.
On , 2004, the Trustees of Balanced Fund, including all Trustees who are not “interested persons” of the Fund (as defined by the 1940 Act), approved the terms of the merger. The Trustees have also unanimously agreed to recommend that the merger be approved by the Fund’s shareholders.
In determining to recommend that the shareholders of Balanced Fund approve the merger, the Trustees considered, among others, the factors described below:
| • | The fees and expense ratios of the Funds, including comparisons between the expenses of Balanced Fund and the estimated operating expenses of the combined fund, and between the estimated operating expenses of the combined fund and other mutual funds with similar investment objectives. The Trustees noted that the estimated operating expenses of each class of the combined fund are lower than the corresponding class of Balanced Fund. The Trustees also considered DeAM’s commitment to cap the combined fund’s operating expenses for approximately a three year period at levels below Balanced Fund’s current operating expenses. The Trustees also gave extensive consideration to possible economies of scale that might be realized by DeAM in connection with the merger, as well as the other fund combinations included in DeAM’s restructuring proposal. The Trustees concluded that these economies were appropriately reflected in the fee and expense arrangements of Total Return Fund, as proposed to be revised upon completion of the merger. The Trustees also concluded that fees and expenses were fair and reasonable based on the anticipated quality of the services to be provided, the current expense ratios of Balanced Fund and the operating expenses of other mutual funds with similar investment objectives. |
| • | The terms and conditions of the merger. The Trustees concluded that the merger would not result in the dilution of shareholder interests and that the terms and conditions were fair and reasonable and consistent with industry practice. |
| • | The compatibility of Balanced Fund’s and Total Return Fund’s investment objectives, policies, restrictions and portfolios. Based on information provided by |
22
Table of Contents
DeAM, the Trustees concluded that the investment objectives, policies and restrictions of Balanced Fund and Total Return Fund were similar and that the securities in Balanced Fund’s portfolio were compatible with the securities in Total Return Fund’s portfolio. The Trustees also considered that the merger would permit the shareholders of Balanced Fund to pursue similar investment goals in a larger fund. |
| • | The service features available to shareholders of Total Return Fund. The Trustees concluded that the services available to shareholders of each class of Total Return Fund were substantially similar to those available to shareholders of the corresponding class of Balanced Fund. |
| • | The costs to be borne by Balanced Fund, Total Return Fund and DeAM as a result of the merger. Based on representations by DeAM and the terms of the Agreement and Plan of Reorganization, the Trustees noted that DeAM would bear all expenses associated with the merger, including transaction costs associated with any related repositioning of the Funds’ portfolios. |
| • | Prospects for the combined fund to attract additional assets. Based on, among other factors, the size of the combined fund and the estimated expense ratio of the combined fund, the Trustees concluded that the combined fund would be more likely to attract additional assets than Balanced Fund and enjoy any related economies of scale. |
| • | The tax consequences of the merger on Balanced Fund, Total Return Fund and their respective shareholders, including, in particular, the historical and pro forma tax attributes of Balanced Fund and Total Return Fund and the effect of the merger on certain tax losses of the Funds (see “Federal Income Tax Consequences” below). The Trustees concluded that lower fund operating expenses and other benefits to shareholders resulting from the merger outweighed the potentially less favorable tax attributes of the combined fund. |
| • | The investment performance of Balanced Fund and Total Return Fund. The Trustees noted that both Funds had substantially similar returns over the one, three and ten year periods and that Balanced Fund had superior returns over the five year period. |
| • | That DeIM has agreed to indemnify Total Return Fund against certain liabilities Total Return Fund may incur in connection with any litigation or regulatory action related to possible improper market timing or possible improper marketing and sales activity in Total Return Fund (see Section VI) so that the likelihood that the combined Fund would suffer any loss is considered by Fund management to be remote. |
| • | That, in conjunction with the merger, DeIM has agreed to indemnify the Independent Trustees of the Trust against certain liabilities that such Independent Trustees may incur by reason of having served as a Trustee of the Trust. |
Based on all of the foregoing, the Trustees concluded that Balanced Fund’s participation in the merger would be in the best interests of Balanced Fund and would not dilute the interests of Balanced Fund’s existing shareholders. The Trustees of Balanced Fund, including all Trustees who are not “interested persons” of the Fund (as defined in the 1940 Act), unanimously recommend that shareholders of the Fund approve the merger.
23
Table of Contents
Agreement and Plan of Reorganization. The proposed merger will be governed by the Agreement, the form of which is attached as Exhibit A. The Agreement provides that Total Return Fund will acquire all of the assets of Balanced Fund solely in exchange for the assumption by Total Return Fund of all liabilities of Balanced Fund and for the issuance of Merger Shares equal in value to the value of the transferred assets net of assumed liabilities. The shares will be issued on the next full business day (the “Exchange Date”) following the time as of which the Funds’ shares are valued for determining net asset value for the merger (4:00 p.m. Eastern time, on [March 11], 2005, or such other date and time as may be agreed upon by the parties (the “Valuation Time”)). The following discussion of the Agreement is qualified in its entirety by the full text of the Agreement.
Balanced Fund will transfer all of its assets to Total Return Fund, and in exchange, Total Return Fund will assume all liabilities of Balanced Fund and deliver to Balanced Fund a number of full and fractional Merger Shares of each class having an aggregate net asset value equal to the value of the assets of Balanced Fund attributable to shares of the corresponding class of Balanced Fund, less the value of the liabilities of Balanced Fund assumed by Total Return Fund attributable to shares of such class of Balanced Fund. Immediately following the transfer of assets on the Exchange Date, Balanced Fund will distribute pro rata to its shareholders of record as of the Valuation Time the full and fractional Merger Shares received by Balanced Fund, with Merger Shares of each class being distributed to holders of shares of the corresponding class of Balanced Fund. As a result of the proposed transaction, each shareholder of Balanced Fund will receive a number of Merger Shares of each class equal in aggregate value at the Valuation Time to the value of Balanced Fund shares of the corresponding class surrendered by the shareholder. This distribution will be accomplished by the establishment of accounts on the share records of Total Return Fund in the name of such Balanced Fund shareholders, each account representing the respective number of full and fractional Merger Shares of each class due the respective shareholder. New certificates for Merger Shares will not be issued.
The Trustees of the Trust and the Trustees of Total Return Fund have determined that the interests of their respective Fund’s shareholders will not be diluted as a result of the transactions contemplated by the Agreement, and the Trustees of the Trust and the Trustees of Total Return Fund have determined that the proposed merger is in the best interests of their respective Fund.
The consummation of the merger is subject to the conditions set forth in the Agreement. The Agreement may be terminated and the merger abandoned (i) by mutual consent of Total Return Fund and Balanced Fund, (ii) by either party if the merger shall not be consummated by , 2005 or (iii) if any condition set forth in the Agreement has not been fulfilled and has not been waived by the party entitled to its benefits, by such party.
If shareholders of Balanced Fund approve the merger, both Funds agree to coordinate their respective portfolios from the date of the Agreement up to and including the Exchange Date in order that, when the assets of Balanced Fund are added to the portfolio of Total Return Fund, the resulting portfolio will meet the investment objective, policies and restrictions of Total Return Fund.
Except for the trading costs associated with the coordination described above, the fees and expenses for the merger and related transactions are estimated to be $ .
24
Table of Contents
All fees and expenses, including legal and accounting expenses, portfolio transfer taxes (if any), the trading costs described above and any other expenses incurred in connection with the consummation of the merger and related transactions contemplated by the Agreement, will be borne by DeAM.
Description of the Merger Shares. Merger Shares will be issued to Balanced Fund’s shareholders in accordance with the Agreement as described above. The Merger Shares are Class S and Class AARP shares of Total Return Fund. Prior to the merger, Total Return Fund did not offer Class S and Class AARP shares. These classes are now offered by Total Return Fund to accommodate the existing holders of Class S and Class AARP shares of Balanced Fund. Balanced Fund shareholders receiving Merger Shares will not pay an initial sales charge on such shares. Each class of Merger Shares has the same characteristics as shares of the corresponding class of Balanced Fund. In other words, your Merger Shares will be treated as having been purchased on the date you purchased your Balanced Fund shares and for the price you originally paid. For more information on the characteristics of each class of Merger Shares, please see the Total Return Fund Prospectus, a copy of which was mailed with this Prospectus/Proxy Statement.
Under Massachusetts law, shareholders of Total Return Fund could, under certain circumstances, be held personally liable for the obligations of a Total Return Fund. However, the Total Return Fund’s Declaration of Trust disclaims shareholder liability for acts or obligations of Total Return Fund and indemnification for all losses and expenses of any shareholder held liable for the obligations of Total Return Fund. The indemnification and reimbursement required by the preceding sentence shall be made only out of the assets of Total Return Fund.
Federal Income Tax Consequences. As a condition to each Fund’s obligation to consummate the reorganization, each Fund will receive a tax opinion from Willkie Farr & Gallagher LLP (which opinion would be based on certain factual representations and certain customary assumptions), to the effect that, on the basis of the existing provisions of the U.S. Internal Revenue Code of 1986, as amended (the “Code”), current administrative rules and court decisions, for federal income tax purposes:
| • | The acquisition by Total Return Fund of all of the assets of Balanced Fund solely in exchange for Merger Shares and the assumption by Total Return Fund of all of the liabilities of Balanced Fund, followed by the distribution by Balanced Fund to its shareholders of Merger Shares in complete liquidation of Balanced Fund, all pursuant to the Agreement, constitutes a reorganization within the meaning of Section 368(a) of the Code, and Balanced Fund and Total Return Fund will each be a “party to a reorganization” within the meaning of Section 368(b) of the Code. |
| • | Under Section 361 of the Code, Balanced Fund will not recognize gain or loss upon the transfer of its assets to Total Return Fund in exchange for Merger Shares and the assumption of the Balanced Fund liabilities by Total Return Fund, and Balanced Fund will not recognize gain or loss upon the distribution to its shareholders of the Merger Shares in liquidation of Balanced Fund. |
| • | Under Section 354 of the Code, shareholders of Balanced Fund will not recognize gain or loss on the receipt of Merger Shares solely in exchange for Balanced Fund shares. |
| • | Under Section 358 of the Code, the aggregate basis of the Merger Shares received by each shareholder of Balanced Fund will be the same as the aggregate basis of Balanced Fund shares exchanged therefor. |
25
Table of Contents
| • | Under Section 1223(1) of the Code, the holding period of the Merger Shares received by each Balanced Fund shareholder will include the holding period of Balanced Fund shares exchanged therefor, provided that the Balanced Fund shareholder held the Balanced Fund shares at the time of the reorganization as a capital asset. |
| • | Under Section 1032 of the Code, Total Return Fund will not recognize gain or loss upon the receipt of assets of Balanced Fund in exchange for Merger Shares and the assumption by Total Return Fund of all of the liabilities of Balanced Fund. |
| • | Under Section 362(b) of the Code, the basis of the assets of Balanced Fund transferred to Total Return Fund in the reorganization will be the same in the hands of Total Return Fund as the basis of such assets in the hands of Balanced Fund immediately prior to the transfer. |
| • | Under Section 1223(2) of the Code, the holding periods of the assets of Balanced Fund transferred to Total Return Fund in the reorganization in the hands of Total Return Fund will include the periods during which such assets were held by Balanced Fund. |
Total Return Fund’s ability to carry forward its pre-merger losses as well as those of Balanced Fund will be limited as a result of the merger. The effect of this limitation, however, will depend on the amount of losses in each fund at the time of the merger. For example, if the merger were to have occurred on June 30, 2004, such limitation would have had little impact due to the fact that Total Return Fund and Balanced Fund had similar amounts of capital loss carry-forwards (15% and 17% of each Fund’s net asset value, respectively) and similar gain/loss positions at that time (each had net unrealized gains of 15% and 13%, respectively).
This description of the federal income tax consequences of the merger is made without regard to the particular facts and circumstances of any shareholder. Shareholders are urged to consult their own tax advisors as to the specific consequences to them of the merger, including the applicability and effect of state, local, non-U.S. and other tax laws.
The portfolio turnover rate for Total Return Fund, i.e., the ratio of the lesser of annual sales or purchases to the monthly average value of the portfolio (excluding from both the numerator and the denominator securities with maturities at the time of acquisition of one year or less), for the fiscal year ended October 31, 2003 was 108%. The portfolio turnover rate for Balanced Fund for the fiscal year ended December 31, 2003 was 103%. A higher portfolio turnover rate involves greater brokerage and transaction expenses to a fund and may result in the realization of net capital gains, which would be taxable to shareholders when distributed (and in the case of net short-term capital gains, would be taxed as ordinary income).
Each Fund intends to distribute dividends from its investment company taxable income (computed without regard to any deduction for dividends paid) and net realized capital gains after utilization of capital loss carryforwards, if any, quarterly. An additional distribution may be made if necessary. Shareholders of each Fund can have their dividends and distributions automatically invested in additional shares of the same class of that Fund, or a different fund in the same family of funds, at net asset value and credited to the shareholder’s account on the payment date or, at the shareholder’s election, sent to the shareholder by check. If an investment is in the form of a retirement
26
Table of Contents
plan, all dividends and capital gains distributions must be reinvested in the shareholder’s account. If the Agreement is approved by Balanced Fund’s shareholders, such Fund will pay its shareholders a distribution of all undistributed net investment company taxable income (computed without regard to any deduction for dividends paid) and undistributed realized net capital gains (after reduction by any capital loss carry-forwards) immediately prior to the Closing (as defined in the Agreement).
While as noted above, shareholders are not expected to recognize any gain or loss upon the exchange of their shares in the merger, differences in the Funds’ portfolio turnover rates, and net investment income and net realized capital gains, may result in future taxable distributions to shareholders arising indirectly from the merger.
Capitalization. The following table sets forth the capitalization of each Fund as of April 30, 2004, and of Total Return Fund on a pro forma combined basis, giving effect to the proposed acquisition of assets at net asset value as of that date.(1)
| Balanced Fund | Total Return Fund | Pro Forma Adjustments | Pro Forma Combined | ||||||||
Net assets | |||||||||||
Class A Shares | — | $ | 1,705,828,913 | — | $ | 1,705,828,913 | |||||
Class B Shares | — | $ | 213,725,565 | — | $ | 213,725,565 | |||||
Class C Shares | — | $ | 54,068,959 | — | $ | 54,068,959 | |||||
Class I Shares(2) | — | $ | 278,990 | — | $ | 278,990 | |||||
Class AARP Shares | $ | 331,366,928 | — | — | $ | 331,366,928 | |||||
Class S Shares | $ | 394,536,719 | — | — | $ | 394,536,719 | |||||
Class R Shares | — | $ | 443,473 | — | $ | 443,473 | |||||
Total Net Assets | 725,903,647 | 1,974,345,900 | — | 2,700,249,547 | |||||||
Shares outstanding | |||||||||||
Class A Shares | — | 197,125,803 | — | 197,125,803 | |||||||
Class B Shares | — | 24,697,054 | — | 24,697,054 | |||||||
Class C Shares | — | 6,264,023 | — | 6,264,023 | |||||||
Class I Shares(2) | — | 32,180 | — | 32,180 | |||||||
Class AARP Shares | 19,730,442 | — | 18,577,873 | 38,308,315 | |||||||
Class S Shares | 23,545,948 | — | 22,065,233 | 45,611,181 | |||||||
Class R Shares | — | 51,213 | — | 51,213 | |||||||
Net asset value per share | |||||||||||
Class A Shares | — | $ | 8.65 | — | $ | 8.65 | |||||
Class B Shares | — | $ | 8.65 | — | $ | 8.65 | |||||
Class C Shares | — | $ | 8.63 | — | $ | 8.63 | |||||
Class I Shares(2) | — | $ | 8.67 | — | $ | 8.67 | |||||
Class AARP Shares | $ | 16.79 | — | — | $ | 8.65 | |||||
Class S Shares | $ | 16.76 | — | — | $ | 8.65 | |||||
Class R Shares | — | $ | 8.66 | — | $ | 8.66 | |||||
| (1) | Assumes the merger had been consummated on April 30, 2004, and is for information purposes only. No assurance can be given as to how many shares of Total Return Fund will be received by the shareholders of Balanced Fund on the date the merger takes place, and the foregoing should not be relied upon to reflect the number of shares of Total Return Fund that actually will be received on or after such date. |
| (2) | Class I shares have been renamed Institutional Class shares. |
27
Table of Contents
Unaudited pro forma combined financial statements of the Funds as of April 30, 2004, and for the twelve-month period then ended, are included in the Merger SAI. Because the Agreement provides that Total Return Fund will be the surviving Fund following the merger and because Total Return Fund’s investment objective, policies and processes will remain unchanged, the pro forma combined financial statements reflect the transfer of the assets and liabilities of Balanced Fund to Total Return Fund as contemplated by the Agreement.
The Trustees of the Trust, including the independent Trustees, unanimously recommend approval of the merger.
V. Information About Voting and the Shareholder Meeting
General. This Prospectus/Proxy Statement is furnished in connection with the proposed merger of Balanced Fund into Total Return Fund and the solicitation of proxies by and on behalf of the Trustees of the Trust for use at the Special Meeting of Balanced Fund Shareholders (the “Meeting”). The Meeting is to be held on [February 24], 2005, at [9:00 a.m.] Eastern time at the offices of DeIM, 345 Park Avenue, 27th Floor, New York, New York 10154, or at such later time as is made necessary by adjournment. The Notice of the Special Meeting, the combined Prospectus/Proxy Statement and the enclosed form of proxy are being mailed to shareholders on or about [December ], 2004.
As of [December 2], 2004, Balanced Fund had the following shares outstanding:
Share Class | Number of Shares | |
Class S | [Number of Shares] | |
Class AARP | [Number of Shares] |
Only shareholders of record on [December 2], 2004 will be entitled to notice of and to vote at the Meeting. Each share is entitled to one vote, with fractional shares voting proportionally.
The Trustees of Balanced Fund know of no matters other than those set forth herein to be brought before the Meeting. If, however, any other matters properly come before the Meeting, it is the Trustees’ intention that proxies will be voted on such matters in accordance with the judgment of the persons named in the enclosed form of proxy.
Required Vote. Proxies are being solicited from Balanced Fund’s shareholders by the Trust’s Trustees for the Meeting. Unless revoked, all valid proxies will be voted in accordance with the specification thereon or, in the absence of specification, FOR approval of the Agreement. The transactions contemplated by the Agreement will be consummated only if approved by the affirmative vote of the holders of a majority of the shares of Balanced Fund.
Record Date, Quorum and Method of Tabulation. Shareholders of record of Balanced Fund at the close of business on [December 2], 2004 (the “Record Date”) will be entitled to vote at the Meeting or any adjournment thereof. The holders of one-third
28
Table of Contents
of the shares of Balanced Fund outstanding at the close of business on the Record Date present in person or represented by proxy will constitute a quorum for the Meeting.
Votes cast by proxy or in person at the Meeting will be counted by persons appointed by Balanced Fund as tellers for the Meeting. The tellers will count the total number of votes cast “for” approval of the proposal for purposes of determining whether sufficient affirmative votes have been cast. The tellers will count shares represented by proxies that reflect abstentions and “broker non-votes” (i.e., shares held by brokers or nominees as to which (i) instructions have not been received from the beneficial owners or the persons entitled to vote, and (ii) the broker or nominee does not have the discretionary voting power on a particular matter) as shares that are present and entitled to vote on the matter for purposes of determining the presence of a quorum. Abstentions and broker non-votes will therefore have the effect of a negative vote on the proposal.
Share Ownership. [As of [December 2], 2004, the officers and Trustees of each Fund as a group beneficially owned less than 1% of the outstanding shares of each Fund]. To the best of the knowledge of Balanced Fund, the following shareholders owned of record or beneficially 5% or more of the outstanding shares of any class of Balanced Fund as of such date:
Class | Shareholder Name and Address | Percentage Owned | ||
To the best of the knowledge of Total Return Fund, the following shareholders owned of record or beneficially 5% or more of the outstanding shares of any class of Total Return Fund as of [December 2, 2004]:
Class | Shareholder Name and Address | Percentage Owned | ||
Solicitation of Proxies. In addition to soliciting proxies by mail, certain officers and representatives of the Trust, officers and employees of the Advisor and certain financial services firms and their representatives, who will receive no extra compensation for their services, may solicit proxies by telephone, telegram or personally.
All properly executed proxies received in time for the Meeting will be voted as specified in the proxy or, if no specification is made, in favor of the proposal.
The presence at any shareholders’ meeting, in person or by proxy, of the holders of at least one-third of the outstanding shares of Balanced Fund shall be necessary and sufficient to constitute a quorum for the transaction of business. In the event that the necessary quorum to transact business or the vote required to approve the proposal is not obtained at the Meeting, the persons named as proxies may propose one or more adjournments of the Meeting in accordance with applicable law to permit further solicitation of proxies. Any adjournment will require the affirmative vote of a majority of the votes cast on the question in person or by proxy at the session of the Meeting to be adjourned. The persons named as proxies will vote in favor of any such adjournment
29
Table of Contents
those proxies which they are entitled to vote in favor of the proposal and will vote against any such adjournment those proxies to be voted against the proposal. For purposes of determining the presence of a quorum for transacting business at the meeting, abstentions and broker “non-votes” will be treated as shares that are present but which have not been voted, and thus will have the effect of a “no” vote. Broker non-votes are proxies received by Balanced Fund from brokers or nominees when the broker or nominee has neither received instructions from the beneficial owner or other persons entitled to vote nor has discretionary power to vote on a particular matter. Accordingly, shareholders are urged to forward their voting instructions promptly.
Georgeson Shareholder (“Georgeson”) has been engaged to assist in the solicitation of proxies, at an estimated cost of $ . As the Meeting date approaches, certain shareholders of Balanced Fund may receive a telephone call from a representative of Georgeson if their votes have not yet been received. Authorization to permit Georgeson to execute proxies may be obtained by telephonic or electronically transmitted instructions from shareholders of Balanced Fund. Proxies that are obtained telephonically or through the Internet will be recorded in accordance with the procedures described below. The Trustees believe that these procedures are reasonably designed to ensure that both the identity of the shareholder casting the vote and the voting instructions of the shareholder are accurately determined.
In all cases where a telephonic proxy is solicited, the Georgeson representative is required to ask for each shareholder’s full name and address, or the zip code, or both, and to confirm that the shareholder has received the proxy materials in the mail. If the shareholder is a corporation or other entity, the Georgeson representative is required to ask for the person’s title and confirmation that the person is authorized to direct the voting of the shares. If the information solicited agrees with the information provided to Georgeson, then the Georgeson representative has the responsibility to explain the process, read the proposal on the proxy card, and ask for the shareholder’s instructions on the proposal. Although the Georgeson representative is permitted to answer questions about the process, he or she is not permitted to recommend to the shareholder how to vote, other than to read any recommendation set forth in the Prospectus/Proxy Statement. Georgeson will record the shareholder’s instructions on the card. Within 72 hours, the shareholder will be sent a letter or mailgram to confirm his or her vote and asking the shareholder to call Georgeson immediately if his or her instructions are not correctly reflected in the confirmation.
Please see the instructions on your proxy card for telephone touch-tone voting and Internet voting. Shareholders will have an opportunity to review their voting instructions and make any necessary changes before submitting their voting instructions and terminating their telephone call or Internet link. Shareholders who vote via the Internet, in addition to confirming their voting instructions prior to submission, will also receive an e-mail confirming their instructions upon request.
If a shareholder wishes to participate in the Meeting, but does not wish to give a proxy by telephone or electronically, the shareholder may still submit the proxy card originally sent with the Prospectus/Proxy Statement or attend in person. Should shareholders require additional information regarding the proxy or replacement proxy card, they may contact Georgeson toll-free at 1-888-288-5518. Any proxy given by a shareholder is revocable until voted at the Meeting.
30
Table of Contents
Persons holding shares as nominees will, upon request, be reimbursed for their reasonable expenses in soliciting instructions from their principals. The cost of preparing, printing and mailing the enclosed proxy card and Prospectus/Proxy Statement, and all other costs incurred in connection with the solicitation of proxies for Balanced Fund, including any additional solicitation made by letter, telephone or telegraph, will be paid by DeAM.
Revocation of Proxies. Proxies, including proxies given by telephone or over the Internet, may be revoked at any time before they are voted either (i) by a written revocation received by the Secretary of Balanced Fund at Two International Place, Boston, MA 02110, (ii) by properly submitting a later-dated proxy that is received by the Fund at or prior to the Meeting or (iii) by attending the Meeting and voting in person. Merely attending the Meeting without voting, however, will not revoke a previously submitted proxy.
Adjournment. If sufficient votes in favor of the proposal set forth in the Notice of the Special Meeting are not received by the time scheduled for the Meeting, the persons named as proxies may propose adjournments of the Meeting for a reasonable period of time to permit further solicitation of proxies. Any adjournment will require the affirmative vote of a majority of the votes cast on the question in person or by proxy at the session of the Meeting to be adjourned. The persons named as proxies will vote in favor of such adjournment those proxies which they are entitled to vote in favor of the proposal. They will vote against any such adjournment those proxies required to be voted against the proposal.
VI. Regulatory and Litigation Matters
Since at least July 2003, federal, state and industry regulators have been conducting ongoing inquiries and investigations (“inquiries”) into the mutual fund industry, and have requested information from numerous mutual fund companies, including Scudder Investments. It is not possible to determine what the outcome of these inquiries will be or what the effect, if any, would be on the funds or their advisors. Publicity about mutual fund practices arising from these industry-wide inquiries serves as the general basis of a number of private lawsuits against the Scudder funds. These lawsuits, which previously have been reported in the press, involve purported class action and derivative lawsuits, making various allegations and naming as defendants various persons, including certain Scudder funds, the funds’ investment advisors and their affiliates, certain individuals, including in some cases fund Trustees/Directors, officers, and other parties. Each Scudder fund’s investment advisor has agreed to indemnify the applicable Scudder funds in connection with these lawsuits, or other lawsuits or regulatory actions that may be filed making allegations similar to these lawsuits regarding market timing, revenue sharing, fund valuation or other subjects arising from or related to the pending inquiries. Based on currently available information, the funds’ investment advisors believe the likelihood that the pending lawsuits will have a material adverse financial impact on a Scudder fund is remote and such actions are not likely to materially affect their ability to perform under their investment management agreements with the Scudder funds.
31
Table of Contents
FORM OF AGREEMENT AND PLAN OF REORGANIZATION
THIS AGREEMENT AND PLAN OF REORGANIZATION (the “Agreement”) is made as of this [ ] day of , 2004, by and among Scudder Total Return Fund (the “Acquiring Trust”), a Massachusetts business trust, on behalf of Scudder Total Return Fund (the “Acquiring Fund”), a separate series of the Acquiring Trust; Scudder Portfolio Trust (the “Acquired Trust” and, together with the Acquiring Trust, each a “Trust” and collectively the “Trusts”), a Massachusetts business trust, on behalf of Scudder Balanced Fund (the “Acquired Fund” and, together with the Acquiring Fund, each a “Fund” and collectively the “Funds”); and Deutsche Investment Management Americas Inc. (“DeIM”), investment adviser to the Funds (for purposes of section 10.2 of the Agreement only). The principal place of business of the Acquiring Trust is 222 South Riverside Plaza, Chicago, Illinois 60606. The principal place of business of the Acquired Trust is Two International Place, Boston, Massachusetts 02110-4103.
This Agreement is intended to be and is adopted as a plan of reorganization and liquidation within the meaning of Section 368(a) of the Internal Revenue Code of 1986, as amended (the “Code”). The reorganization (the “Reorganization”) will consist of the transfer of all or substantially all of the assets of the Acquired Fund to the Acquiring Fund in exchange solely for Class S and Class AARP voting shares of beneficial interest (without par value) of the Acquiring Fund (the “Acquiring Fund Shares”), the assumption by the Acquiring Fund of all of the liabilities of the Acquired Fund and the distribution of the Acquiring Fund Shares to the Class S and Class AARP shareholders of the Acquired Fund in complete liquidation of the Acquired Fund as provided herein, all upon the terms and conditions hereinafter set forth in this Agreement.
NOW, THEREFORE, in consideration of the premises and of the covenants and agreements hereinafter set forth, the parties hereto covenant and agree as follows:
| 1. | Transfer of Assets of the Acquired Fund to the Acquiring Fund in Consideration For Acquiring Fund Shares, the Assumption of All Acquired Fund Liabilities and the Liquidation of the Acquired Fund |
1.1 Subject to the terms and conditions herein set forth and on the basis of the representations and warranties contained herein, the Acquired Fund agrees to transfer to the Acquiring Fund all or substantially all of the Acquired Fund’s assets as set forth in section 1.2, and the Acquiring Fund agrees in consideration therefor (i) to deliver to the Acquired Fund that number of full and fractional Class S and Class AARP Acquiring Fund Shares determined by dividing the value of the Acquired Fund’s assets net of any liabilities of the Acquired Fund with respect to the Class S and Class AARP shares of the Acquired Fund, computed in the manner and as of the time and date set forth in section 2.1, by the net asset value of one Acquiring Fund Share of the corresponding class, computed in the manner and as of the time and date set forth in section 2.2; and (ii) to assume all of the liabilities of the Acquired Fund, including, but not limited to, any deferred compensation to the Acquired Fund Board members. All Acquiring Fund Shares delivered to the Acquired Fund shall be delivered at net asset value without a sales load, commission or other similar fee being imposed. Such transactions shall take place at the closing provided for in section 3.1 (the “Closing”).
A-1
Table of Contents
1.2 The assets of the Acquired Fund to be acquired by the Acquiring Fund (the “Assets”) shall consist of all assets, including, without limitation, all cash, cash equivalents, securities, commodities and futures interests and dividends or interest or other receivables that are owned by the Acquired Fund and any deferred or prepaid expenses shown on the unaudited statement of assets and liabilities of the Acquired Fund prepared as of the effective time of the Closing in accordance with generally accepted accounting principles (“GAAP”) applied consistently with those of the Acquired Fund’s most recent audited balance sheet. The Assets shall constitute at least 90% of the fair market value of the net assets, and at least 70% of the fair market value of the gross assets, held by the Acquired Fund immediately before the Closing (excluding for these purposes assets used to pay the dividends and other distributions paid pursuant to section 1.4).
1.3 The Acquired Fund will endeavor, to the extent practicable, to discharge all of its liabilities and obligations that are accrued prior to the Closing Date as defined in section 3.1.
1.4 On or as soon as practicable prior to the Closing Date as defined in section 3.1, the Acquired Fund will declare and pay to its shareholders of record one or more dividends and/or other distributions so that it will have distributed substantially all of its investment company taxable income (computed without regard to any deduction for dividends paid) and realized net capital gain, if any, for the current taxable year through the Closing Date.
1.5 Immediately after the transfer of Assets provided for in section 1.1, the Acquired Fund will distribute to the Acquired Fund’s shareholders of record with respect to each class of its shares (the “Acquired Fund Shareholders”), determined as of the Valuation Time (as defined in section 2.1), on a pro rata basis within that class, the Acquiring Fund Shares of the same class received by the Acquired Fund pursuant to section 1.1 and will completely liquidate. Such distribution and liquidation will be accomplished with respect to each class of the Acquired Fund by the transfer of the Acquiring Fund Shares then credited to the account of the Acquired Fund on the books of the Acquiring Fund to open accounts on the share records of the Acquiring Fund in the names of the Acquired Fund Shareholders. The Acquiring Fund shall have no obligation to inquire as to the validity, propriety or correctness of such records, but shall assume that such transaction is valid, proper and correct. The aggregate net asset value of Class S and Class AARP Acquiring Fund Shares to be so credited to the Class S and Class AARP Acquired Fund Shareholders shall, with respect to each class, be equal to the aggregate net asset value of the Acquired Fund shares of the same class owned by such shareholders as of the Valuation Time. All issued and outstanding shares of the Acquired Fund will simultaneously be cancelled on the books of the Acquired Fund, although share certificates representing interests in Class S and Class AARP shares of the Acquired Fund will represent a number of Acquiring Fund Shares after the Closing Date as determined in accordance with section 2.3. The Acquiring Fund will not issue certificates representing Acquiring Fund Shares.
1.6 Ownership of Acquiring Fund Shares will be shown on the books of the Acquiring Fund. Shares of the Acquiring Fund will be issued in the manner described in the Acquiring Fund’s then-current prospectus and statement of additional information.
1.7 Any reporting responsibility of the Acquired Fund including, without limitation, the responsibility for filing of regulatory reports, tax returns, or other
A-2
Table of Contents
documents with the Securities and Exchange Commission (the “Commission”), any state securities commission, and any federal, state or local tax authorities or any other relevant regulatory authority, is and shall remain the responsibility of the Acquired Fund.
1.8 All books and records of the Acquired Fund, including all books and records required to be maintained under the Investment Company Act of 1940, as amended (the “1940 Act”), and the rules and regulations thereunder, shall be available to the Acquiring Fund from and after the Closing Date and shall be turned over to the Acquiring Fund as soon as practicable following the Closing Date.
| 2. | Valuation |
2.1 The value of the Assets shall be computed as of the close of regular trading on The New York Stock Exchange, Inc. (the “NYSE”) on the business day immediately preceding the Closing Date, as defined in section 3.1 (the “Valuation Time”) after the declaration and payment of any dividends and/or other distributions on that date, using the valuation procedures set forth in the Acquiring Trust’s Declaration of Trust, as amended, and the Acquiring Fund’s then-current prospectus or statement of additional information, copies of which have been delivered to the Acquired Fund.
2.2 The net asset value of a Class S and Class AARP Acquiring Fund Share shall be the net asset value per share computed with respect to that class as of the Valuation Time using the valuation procedures referred to in section 2.1. Notwithstanding anything to the contrary contained in this Agreement, in the event that, as of the Valuation Time, there are no Class AARP and/or Class S Acquiring Fund Shares issued and outstanding, then, for purposes of this Agreement, the per share net asset value of Class S and/or Class AARP, as applicable, shall be equal to the net asset value of one Institutional Class share of the Acquiring Fund.
2.3 The number of Class S and Class AARP Acquiring Fund Shares to be issued (including fractional shares, if any) in consideration for the Assets shall be determined with respect to each such class by dividing the value of the Assets with respect to Class S and Class AARP shares of the Acquired Fund, as the case may be, determined in accordance with section 2.1 by the net asset value of an Acquiring Fund Share of the same class determined in accordance with section 2.2.
2.4 All computations of value hereunder shall be made by or under the direction of each Fund’s respective accounting agent, if applicable, in accordance with its regular practice and the requirements of the 1940 Act and shall be subject to confirmation by each Fund’s respective Independent Registered Public Accounting Firm upon the reasonable request of the other Fund.
| 3. | Closing and Closing Date |
3.1 The Closing of the transactions contemplated by this Agreement shall be [March 14], 2005, or such later date as the parties may agree in writing (the “Closing Date”). All acts taking place at the Closing shall be deemed to take place simultaneously as of 9:00 a.m., Eastern time, on the Closing Date, unless otherwise agreed to by the parties. The Closing shall be held at the offices of counsel to the Acquiring Fund, or at such other place and time as the parties may agree.
A-3
Table of Contents
3.2 The Acquired Fund shall deliver to the Acquiring Fund on the Closing Date a schedule of Assets.
3.3 State Street Bank and Trust Company (“State Street”), custodian for the Acquired Fund, shall deliver at the Closing a certificate of an authorized officer stating that (a) the Assets shall have been delivered in proper form to State Street, custodian for the Acquiring Fund, prior to or on the Closing Date and (b) all necessary taxes in connection with the delivery of the Assets, including all applicable federal and state stock transfer stamps, if any, have been paid or provision for payment has been made. The Acquired Fund’s portfolio securities represented by a certificate or other written instrument shall be presented by the custodian for the Acquired Fund to the custodian for the Acquiring Fund for examination no later than five business days preceding the Closing Date and transferred and delivered by the Acquired Fund as of the Closing Date by the Acquired Fund for the account of Acquiring Fund duly endorsed in proper form for transfer in such condition as to constitute good delivery thereof. The Acquired Fund’s portfolio securities and instruments deposited with a securities depository, as defined in Rule 17f-4 under the 1940 Act, shall be delivered as of the Closing Date by book entry in accordance with the customary practices of such depositories and the custodian for the Acquiring Fund. The cash to be transferred by the Acquired Fund shall be delivered by wire transfer of federal funds on the Closing Date.
3.4 Scudder Service Corporation (“SSC”), as transfer agent for the Acquired Fund, on behalf of the Acquired Fund, shall deliver at the Closing a certificate of an authorized officer stating that its records contain the names and addresses of the Acquired Fund Shareholders and the number and percentage ownership (to three decimal places) of outstanding Class S and Class AARP Acquired Fund shares owned by each such shareholder immediately prior to the Closing. The Acquiring Fund shall issue and deliver a confirmation evidencing the Acquiring Fund Shares to be credited on the Closing Date to the Acquired Fund or provide evidence satisfactory to the Acquired Fund that such Acquiring Fund Shares have been credited to the Acquired Fund’s account on the books of the Acquiring Fund. At the Closing, each party shall deliver to the other such bills of sale, checks, assignments, share certificates, if any, receipts or other documents as such other party or its counsel may reasonably request to effect the transactions contemplated by this Agreement.
3.5 In the event that immediately prior to the Valuation Time (a) the NYSE or another primary trading market for portfolio securities of the Acquiring Fund or the Acquired Fund shall be closed to trading or trading thereupon shall be restricted, or (b) trading or the reporting of trading on such Exchange or elsewhere shall be disrupted so that, in the judgment of the Board members of either party to this Agreement, accurate appraisal of the value of the net assets with respect to the Class S and Class AARP shares of the Acquiring Fund or the Acquired Fund is impracticable, the Closing Date shall be postponed until the first business day after the day when trading shall have been fully resumed and reporting shall have been restored.
3.6 The liabilities of the Acquired Fund shall include all of the Acquired Fund’s liabilities, debts, obligations, and duties of whatever kind or nature, whether absolute, accrued, contingent, or otherwise, whether or not arising in the ordinary course of business, whether or not determinable at the Closing Date, and whether or not specifically referred to in this Agreement, including but not limited to, any deferred compensation to the Acquired Fund’s Board members.
A-4
Table of Contents
| 4. | Representations and Warranties |
4.1 The Acquired Trust, on behalf of the Acquired Fund, represents and warrants to the Acquiring Fund as follows:
(a) The Acquired Trust is a voluntary association with transferable shares commonly referred to as a Massachusetts business trust duly organized and validly existing under the laws of The Commonwealth of Massachusetts with power under the Acquired Trust’s Declaration of Trust, as amended, to own all of its properties and assets and to carry on its business as it is now being conducted and, subject to approval of shareholders of the Acquired Fund, to carry out the Agreement. The Acquired Fund is a separate series of the Acquired Trust duly designated in accordance with the applicable provisions of the Acquired Trust’s Declaration of Trust. The Acquired Trust and Acquired Fund are qualified to do business in all jurisdictions in which they are required to be so qualified, except jurisdictions in which the failure to so qualify would not have a material adverse effect on the Acquired Trust or Acquired Fund. The Acquired Fund has all material federal, state and local authorizations necessary to own all of the properties and assets and to carry on its business as now being conducted, except authorizations which the failure to so obtain would not have a material adverse effect on the Acquired Fund;
(b) The Acquired Trust is registered with the Commission as an open-end management investment company under the 1940 Act, and such registration is in full force and effect and the Acquired Fund is in compliance in all material respects with the 1940 Act and the rules and regulations thereunder;
(c) No consent, approval, authorization, or order of any court or governmental authority is required for the consummation by the Acquired Fund of the transactions contemplated herein, except such as have been obtained under the Securities Act of 1933, as amended (the “1933 Act”), the Securities Exchange Act of 1934, as amended (the “1934 Act”), and the 1940 Act and such as may be required by state securities laws;
(d) The Acquired Trust is not, and the execution, delivery and performance of this Agreement by the Acquired Trust will not result (i) in violation of Massachusetts law or of the Acquired Trust’s Declaration of Trust, as amended, or By-Laws, (ii) in a violation or breach of, or constitute a default under, any material agreement, indenture, instrument, contract, lease or other undertaking to which the Acquired Fund is a party or by which it is bound, and the execution, delivery and performance of this Agreement by the Acquired Fund will not result in the acceleration of any obligation, or the imposition of any penalty, under any agreement, indenture, instrument, contract, lease, judgment or decree to which the Acquired Fund is a party or by which it is bound, or (iii) in the creation or imposition of any lien, charge or encumbrance on any property or assets of the Acquired Fund;
(e) Other than as disclosed on a schedule provided by the Acquired Fund, no material litigation or administrative proceeding or investigation of or before any court or governmental body is presently pending or to its knowledge threatened against the Acquired Fund or any properties or assets held by it. The Acquired Fund knows of no facts which might form the basis for the institution of such proceedings which would materially and adversely affect its business, other than as disclosed in the foregoing schedule, and is not a party to or subject to the provisions of any order, decree or judgment of any court or governmental body which materially and adversely affects its business or its ability to consummate the transactions herein contemplated;
A-5
Table of Contents
(f) The Statements of Assets and Liabilities, Operations, and Changes in Net Assets, the Financial Highlights, and the Investment Portfolio of the Acquired Fund at and for the fiscal year ended December 31, 2003, have been audited by PricewaterhouseCoopers LLP, Independent Registered Public Accounting Firm, and are in accordance with GAAP consistently applied, and such statements (a copy of each of which has been furnished to the Acquiring Fund) present fairly, in all material respects, the financial position of the Acquired Fund as of such date in accordance with GAAP and there are no known contingent liabilities of the Acquired Fund required to be reflected on a balance sheet (including the notes thereto) in accordance with GAAP as of such date not disclosed therein;
(g) Since December 31, 2003, there has not been any material adverse change in the Acquired Fund’s financial condition, assets, liabilities or business other than changes occurring in the ordinary course of business, or any incurrence by the Acquired Fund of indebtedness maturing more than one year from the date such indebtedness was incurred except as otherwise disclosed to and accepted in writing by the Acquiring Fund. For purposes of this subsection (g), a decline in net asset value per share of the Acquired Fund due to declines in market values of securities in the Acquired Fund’s portfolio, the discharge of Acquired Fund liabilities, or the redemption of Acquired Fund shares by Acquired Fund Shareholders shall not constitute a material adverse change;
(h) At the date hereof and at the Closing Date, all federal and other tax returns and reports of the Acquired Fund required by law to have been filed by such dates (including any extensions) shall have been filed and are or will be correct in all material respects, and all federal and other taxes shown as due or required to be shown as due on said returns and reports shall have been paid or provision shall have been made for the payment thereof, and, to the best of the Acquired Fund’s knowledge, no such return is currently under audit and no assessment has been asserted with respect to such returns;
(i) For each taxable year of its operation (including the taxable year ending on the Closing Date), the Acquired Fund has met the requirements of Subchapter M of the Code for qualification as a regulated investment company and has elected to be treated as such, has been eligible to and has computed its federal income tax under Section 852 of the Code, and will have distributed all of its investment company taxable income and net capital gain (as defined in the Code) that has accrued through the Closing Date;
(j) All issued and outstanding shares of the Acquired Fund (i) have been offered and sold in every state and the District of Columbia in compliance in all material respects with applicable registration requirements of the 1933 Act and state securities laws, (ii) are, and on the Closing Date will be, duly and validly issued and outstanding, fully paid and non-assessable and not subject to preemptive or dissenter’s rights (recognizing that, under Massachusetts law, Acquired Fund Shareholders, under certain circumstances, could be held personally liable for obligations of the Acquired Fund), and (iii) will be held at the time of the Closing by the persons and in the amounts set forth in the records of SSC, as provided in section 3.4. The Acquired Fund does not have outstanding any options, warrants or other rights to subscribe for or purchase any of the Acquired Fund shares, nor is there outstanding any security convertible into any of the Acquired Fund shares;
A-6
Table of Contents
(k) At the Closing Date, the Acquired Fund will have good and marketable title to the Acquired Fund’s assets to be transferred to the Acquiring Fund pursuant to section 1.2 and full right, power, and authority to sell, assign, transfer and deliver such assets hereunder free of any liens or other encumbrances, except those liens or encumbrances as to which the Acquiring Fund has received notice at or prior to the Closing, and upon delivery and payment for such assets, the Acquiring Fund will acquire good and marketable title thereto, subject to no restrictions on the full transfer thereof, including such restrictions as might arise under the 1933 Act and the 1940 Act, except those restrictions as to which the Acquiring Fund has received notice and necessary documentation at or prior to the Closing;
(l) The execution, delivery and performance of this Agreement will have been duly authorized prior to the Closing Date by all necessary action on the part of the Board members of the Acquired Trust (including the determinations required by Rule 17a-8(a) under the 1940 Act), and, subject to the approval of the Acquired Fund Shareholders, this Agreement constitutes a valid and binding obligation of the Acquired Trust, on behalf of the Acquired Fund, enforceable in accordance with its terms, subject, as to enforcement, to bankruptcy, insolvency, fraudulent transfer, reorganization, moratorium and other laws relating to or affecting creditors’ rights and to general equity principles;
(m) The information to be furnished by the Acquired Fund for use in applications for orders, registration statements or proxy materials or for use in any other document filed or to be filed with any federal, state or local regulatory authority (including the National Association of Securities Dealers, Inc. (the “NASD”)), which may be necessary in connection with the transactions contemplated hereby, shall be accurate and complete in all material respects and shall comply in all material respects with federal securities and other laws and regulations applicable thereto;
(n) The current prospectus and statement of additional information of the Acquired Fund conform in all material respects to the applicable requirements of the 1933 Act and the 1940 Act and the rules and regulations of the Commission thereunder and do not include any untrue statement of a material fact or omit to state any material fact required to be stated therein or necessary to make the statements therein, in light of the circumstances under which they were made, not materially misleading; and
(o) The Registration Statement referred to in section 5.7, insofar as it relates to the Acquired Fund, will, on the effective date of the Registration Statement and on the Closing Date, (i) comply in all material respects with the provisions and regulations of the 1933 Act, the 1934 Act and the 1940 Act, as applicable, and (ii) not contain any untrue statement of a material fact or omit to state a material fact required to be stated therein or necessary to make the statements therein, in light of the circumstances under which such statements are made, not materially misleading; provided, however, that the representations and warranties in this section shall not apply to statements in or omissions from the Registration Statement made in reliance upon and in conformity with information that was furnished or should have been furnished by the Acquiring Fund for use therein.
4.2 The Acquiring Trust, on behalf of the Acquiring Fund, represents and warrants to the Acquired Fund as follows:
(a) The Acquiring Trust is a voluntary association with transferable shares commonly referred to as a Massachusetts business trust duly organized and validly
A-7
Table of Contents
existing under the laws of The Commonwealth of Massachusetts with power under the Acquiring Trust’s Declaration of Trust, as amended, to own all of its properties and assets and to carry on its business as it is now being conducted and to carry out the Agreement. The Acquiring Fund is a separate series of the Acquiring Trust duly designated in accordance with the applicable provisions of the Acquiring Trust’s Declaration of Trust. The Acquiring Trust and Acquiring Fund are qualified to do business in all jurisdictions in which they are required to be so qualified, except jurisdictions in which the failure to so qualify would not have a material adverse effect on the Acquiring Trust or Acquiring Fund. The Acquiring Fund has all material federal, state and local authorizations necessary to own all of the properties and assets and to carry on its business as now being conducted, except authorizations which the failure to so obtain would not have a material adverse effect on the Acquiring Fund;
(b) The Acquiring Trust is registered with the Commission as an open-end management investment company under the 1940 Act, and such registration is in full force and effect and the Acquiring Fund is in compliance in all material respects with the 1940 Act and the rules and regulations thereunder;
(c) No consent, approval, authorization, or order of any court or governmental authority is required for the consummation by the Acquiring Fund of the transactions contemplated herein, except such as have been obtained under the 1933 Act, the 1934 Act and the 1940 Act and such as may be required by state securities laws;
(d) The Acquiring Trust is not, and the execution, delivery and performance of this Agreement by the Acquiring Trust will not result (i) in violation of Massachusetts law or of the Acquiring Trust’s Declaration of Trust, as amended, or By-Laws, (ii) in a violation or breach of, or constitute a default under, any material agreement, indenture, instrument, contract, lease or other undertaking known to counsel to which the Acquiring Fund is a party or by which it is bound, and the execution, delivery and performance of this Agreement by the Acquiring Fund will not result in the acceleration of any obligation, or the imposition of any penalty, under any agreement, indenture, instrument, contract, lease, judgment or decree to which the Acquiring Fund is a party or by which it is bound, or (iii) in the creation or imposition of any lien, charge or encumbrance on any property or assets of the Acquiring Fund;
(e) Other than as disclosed on a schedule provided by the Acquiring Fund, no material litigation or administrative proceeding or investigation of or before any court or governmental body is presently pending or to its knowledge threatened against the Acquiring Fund or any properties or assets held by it. The Acquiring Fund knows of no facts which might form the basis for the institution of such proceedings which would materially and adversely affect its business, other than as disclosed in the foregoing schedule, and is not a party to or subject to the provisions of any order, decree or judgment of any court or governmental body which materially and adversely affects its business or its ability to consummate the transactions herein contemplated;
(f) The Statements of Assets and Liabilities, Operations, and Changes in Net Assets, the Financial Highlights, and the Investment Portfolio of the Acquiring Fund at and for the fiscal year ended October 31, 2003, have been audited by Ernst & Young LLP, Independent Registered Public Accounting Firm, and are in accordance
A-8
Table of Contents
with GAAP consistently applied, and such statements (a copy of each of which has been furnished to the Acquired Fund) present fairly, in all material respects, the financial position of the Acquiring Fund as of such date in accordance with GAAP, and there are no known contingent liabilities of the Acquiring Fund required to be reflected on a balance sheet (including the notes thereto) in accordance with GAAP as of such date not disclosed therein;
(g) Since October 31, 2003, there has not been any material adverse change in the Acquiring Fund’s financial condition, assets, liabilities or business other than changes occurring in the ordinary course of business, or any incurrence by the Acquiring Fund of indebtedness maturing more than one year from the date such indebtedness was incurred except as otherwise disclosed to and accepted in writing by the Acquired Fund. For purposes of this subsection (g), a decline in net asset value per share of the Acquiring Fund due to declines in market values of securities in the Acquiring Fund’s portfolio, the discharge of Acquiring Fund liabilities, or the redemption of Acquiring Fund shares by Acquiring Fund shareholders shall not constitute a material adverse change;
(h) At the date hereof and at the Closing Date, all federal and other tax returns and reports of the Acquiring Fund required by law to have been filed by such dates (including any extensions) shall have been filed and are or will be correct in all material respects, and all federal and other taxes shown as due or required to be shown as due on said returns and reports shall have been paid or provision shall have been made for the payment thereof, and, to the best of the Acquiring Fund’s knowledge, no such return is currently under audit and no assessment has been asserted with respect to such returns;
(i) For each taxable year of its operation, the Acquiring Fund has met the requirements of Subchapter M of the Code for qualification as a regulated investment company and has elected to be treated as such, has been eligible to and has computed its federal income tax under Section 852 of the Code, and will do so for the taxable year including the Closing Date;
(j) All issued and outstanding shares of the Acquiring Fund (i) have been offered and sold in every state and the District of Columbia in compliance in all material respects with applicable registration requirements of the 1933 Act and state securities laws and (ii) are, and on the Closing Date will be, duly and validly issued and outstanding, fully paid and non-assessable, and not subject to preemptive or dissenter’s rights (recognizing that, under Massachusetts law, Acquiring Fund shareholders, under certain circumstances, could be held personally liable for the obligations of the Acquiring Fund). The Acquiring Fund does not have outstanding any options, warrants or other rights to subscribe for or purchase any of the Acquiring Fund shares, nor is there outstanding any security convertible into any of the Acquiring Fund Shares;
(k) The Acquiring Fund Shares to be issued and delivered to the Acquired Fund, for the account of the Acquired Fund Shareholders, pursuant to the terms of this Agreement, will at the Closing Date have been duly authorized and, when so issued and delivered, will be duly and validly issued and outstanding Acquiring Fund Shares, and will be fully paid and non-assessable (recognizing that, under Massachusetts law, Acquiring Fund shareholders, under certain circumstances, could be held personally liable for the obligations of the Acquiring Fund);
A-9
Table of Contents
(l) At the Closing Date, the Acquiring Fund will have good and marketable title to the Acquiring Fund’s assets, free of any liens or other encumbrances, except those liens or encumbrances as to which the Acquired Fund has received notice at or prior to the Closing;
(m) The execution, delivery and performance of this Agreement will have been duly authorized prior to the Closing Date by all necessary action on the part of the Board members of the Acquiring Trust (including the determinations required by Rule 17a-8(a) under the 1940 Act) and this Agreement will constitute a valid and binding obligation of the Acquiring Trust, on behalf of the Acquiring Fund, enforceable in accordance with its terms, subject, as to enforcement, to bankruptcy, insolvency, fraudulent transfer, reorganization, moratorium and other laws relating to or affecting creditors’ rights and to general equity principles;
(n) The information to be furnished by the Acquiring Fund for use in applications for orders, registration statements or proxy materials or for use in any other document filed or to be filed with any federal, state or local regulatory authority (including the NASD), which may be necessary in connection with the transactions contemplated hereby, shall be accurate and complete in all material respects and shall comply in all material respects with federal securities and other laws and regulations applicable thereto;
(o) The current prospectus and statement of additional information of the Acquiring Fund conform in all material respects to the applicable requirements of the 1933 Act and the 1940 Act and the rules and regulations of the Commission thereunder and do not include any untrue statement of a material fact or omit to state any material fact required to be stated therein or necessary to make the statements therein, in light of the circumstances under which they were made, not materially misleading;
(p) The Registration Statement, only insofar as it relates to the Acquiring Fund, will, on the effective date of the Registration Statement and on the Closing Date, (i) comply in all material respects with the provisions and regulations of the 1933 Act, the 1934 Act, and the 1940 Act and (ii) not contain any untrue statement of a material fact or omit to state a material fact required to be stated therein or necessary to make the statements therein, in light of the circumstances under which such statements were made, not materially misleading; provided, however, that the representations and warranties in this section shall not apply to statements in or omissions from the Registration Statement made in reliance upon and in conformity with information that was furnished or should have been furnished by the Acquired Fund for use therein; and
(q) The Acquiring Fund agrees to use all reasonable efforts to obtain the approvals and authorizations required by the 1933 Act, the 1940 Act and such of the state securities laws as may be necessary in order to continue its operations after the Closing Date.
| 5. | Covenants of the Acquiring Fund and the Acquired Fund |
5.1 The Acquiring Fund and the Acquired Fund each covenants to operate its business in the ordinary course between the date hereof and the Closing Date, it being understood that (a) such ordinary course of business will include (i) the declaration and payment of customary dividends and other distributions and (ii) such changes as are contemplated by the Funds’ normal operations; and (b) each Fund shall retain exclusive
A-10
Table of Contents
control of the composition of its portfolio until the Closing Date. No party shall take any action that would, or reasonably would be expected to, result in any of its representations and warranties set forth in this Agreement being or becoming untrue in any material respect. The Acquired Fund and Acquiring Fund covenant and agree to coordinate the respective portfolios of the Acquired Fund and Acquiring Fund from the date of the Agreement up to and including the Closing Date in order that at Closing, when the Assets are added to the Acquiring Fund’s portfolio, the resulting portfolio will meet the Acquiring Fund’s investment objective, policies and restrictions, as set forth in the Acquiring Fund’s prospectus, a copy of which has been delivered to the Acquired Fund.
5.2 Upon reasonable notice, the Acquiring Trust’s officers and agents shall have reasonable access to the Acquired Fund’s books and records necessary to maintain current knowledge of the Acquired Fund and to ensure that the representations and warranties made by the Acquired Fund are accurate.
5.3 The Acquired Fund covenants to call a meeting of the Acquired Fund Shareholders entitled to vote thereon to consider and act upon this Agreement and to take all other reasonable action necessary to obtain approval of the transactions contemplated herein. Such meeting shall be scheduled for no later than , 2005.
5.4 The Acquired Fund covenants that the Acquiring Fund Shares to be issued hereunder are not being acquired for the purpose of making any distribution thereof other than in accordance with the terms of this Agreement.
5.5 The Acquired Fund covenants that it will assist the Acquiring Fund in obtaining such information as the Acquiring Fund reasonably requests concerning the beneficial ownership of the Acquired Fund shares.
5.6 Subject to the provisions of this Agreement, the Acquiring Fund and the Acquired Fund will each take, or cause to be taken, all actions, and do or cause to be done, all things reasonably necessary, proper, and/or advisable to consummate and make effective the transactions contemplated by this Agreement.
5.7 Each Fund covenants to prepare in compliance with the 1933 Act, the 1934 Act and the 1940 Act the Registration Statement on Form N-14 (the “Registration Statement”) in connection with the meeting of the Acquired Fund Shareholders to consider approval of this Agreement and the transactions contemplated herein. The Acquiring Trust will file the Registration Statement, including a proxy statement, with the Commission. The Acquired Fund will provide the Acquiring Fund with information reasonably necessary for the preparation of a prospectus, which will include a proxy statement, all to be included in the Registration Statement, in compliance in all material respects with the 1933 Act, the 1934 Act and the 1940 Act.
5.8 The Acquired Fund covenants that it will, from time to time, as and when reasonably requested by the Acquiring Fund, execute and deliver or cause to be executed and delivered all such assignments and other instruments, and will take or cause to be taken such further action as the Acquiring Fund may reasonably deem necessary or desirable in order to vest in and confirm the Acquiring Fund’s title to and possession of all the assets and otherwise to carry out the intent and purpose of this Agreement.
A-11
Table of Contents
5.9 The Acquiring Fund covenants to use all reasonable efforts to obtain the approvals and authorizations required by the 1933 Act and 1940 Act, and such of the state securities laws as it deems appropriate in order to continue its operations after the Closing Date and to consummate the transactions contemplated herein; provided, however, that the Acquiring Fund may take such actions it reasonably deems advisable after the Closing Date as circumstances change.
5.10 The Acquiring Fund covenants that it will, from time to time, as and when reasonably requested by the Acquired Fund, execute and deliver or cause to be executed and delivered all such assignments, assumption agreements, releases, and other instruments, and will take or cause to be taken such further action, as the Acquired Fund may reasonably deem necessary or desirable in order to (i) vest and confirm to the Acquired Fund title to and possession of all Acquiring Fund shares to be transferred to the Acquired Fund pursuant to this Agreement and (ii) assume the liabilities from the Acquired Fund.
5.11 As soon as reasonably practicable after the Closing, the Acquired Fund shall make a liquidating distribution to its shareholders consisting of the Acquiring Fund Shares received at the Closing.
5.12 The Acquiring Fund and the Acquired Fund shall each use its reasonable best efforts to fulfill or obtain the fulfillment of the conditions precedent to effect the transactions contemplated by this Agreement as promptly as practicable.
5.13 The intention of the parties is that the transaction will qualify as a reorganization within the meaning of Section 368(a) of the Code. Neither the Trusts, the Acquiring Fund nor the Acquired Fund shall take any action, or cause any action to be taken (including, without limitation, the filing of any tax return) that is inconsistent with such treatment or results in the failure of the transaction to qualify as a reorganization within the meaning of Section 368(a) of the Code. At or prior to the Closing Date, the Trusts, the Acquiring Fund and the Acquired Fund will take such action, or cause such action to be taken, as is reasonably necessary to enable Willkie Farr & Gallagher LLP to render the tax opinion contemplated herein in section 8.5.
5.14 At or immediately prior to the Closing, the Acquired Fund will declare and pay to its shareholders a dividend or other distribution in an amount large enough so that it will have distributed substantially all (and in any event not less than 98%) of its investment company taxable income (computed without regard to any deduction for dividends paid) and realized net capital gain, if any, for the current taxable year through the Closing Date.
5.15 The Acquiring Fund agrees to identify in writing prior to the Closing Date any assets of the Acquired Fund that it does not wish to acquire because they are not consistent with the current investment strategy of the Acquiring Fund, and the Acquired Fund agrees to dispose of such assets prior to the Closing Date.
| 6. | Conditions Precedent to Obligations of the Acquired Fund |
The obligations of the Acquired Fund to consummate the transactions provided for herein shall be subject, at its election, to the performance by the Acquiring Fund of all
A-12
Table of Contents
the obligations to be performed by it hereunder on or before the Closing Date, and, in addition thereto, the following further conditions:
6.1 All representations and warranties of the Acquiring Trust, on behalf of the Acquiring Fund, contained in this Agreement shall be true and correct in all material respects as of the date hereof and, except as they may be affected by the transactions contemplated by this Agreement, as of the Closing Date, with the same force and effect as if made on and as of the Closing Date; and there shall be (i) no pending or threatened litigation brought by any person (other than the Acquired Fund, its adviser or any of their affiliates) against the Acquiring Fund or its investment adviser(s), Board members or officers arising out of this Agreement and (ii) no facts known to the Acquiring Fund which the Acquiring Fund reasonably believes might result in such litigation.
6.2 The Acquiring Fund shall have delivered to the Acquired Fund on the Closing Date a certificate executed in its name by the Acquiring Trust’s President or a Vice President, in a form reasonably satisfactory to the Acquired Trust, on behalf of the Acquired Fund, and dated as of the Closing Date, to the effect that the representations and warranties of the Acquiring Fund made in this Agreement are true and correct on and as of the Closing Date, except as they may be affected by the transactions contemplated by this Agreement, and as to such other matters as the Acquired Fund shall reasonably request.
6.3 The Acquired Fund shall have received on the Closing Date an opinion of Vedder, Price, Kaufman & Kammholz, P.C., in a form reasonably satisfactory to the Acquired Fund, and dated as of the Closing Date, to the effect that:
(a) the Acquiring Trust has been formed and is legally existing as a business trust;
(b) the Acquiring Fund has the power to carry on its business as presently conducted in accordance with the description thereof in the Acquiring Fund’s registration statement under the 1940 Act;
(c) the Agreement has been duly authorized, executed and delivered by the Acquiring Trust, on behalf of the Acquiring Fund, and constitutes a valid and legally binding obligation of the Acquiring Trust, on behalf of the Acquiring Fund, enforceable in accordance with its terms, subject to bankruptcy, insolvency, fraudulent transfer, reorganization, moratorium and laws of general applicability relating to or affecting creditors’ rights and to general equity principles;
(d) the execution and delivery of the Agreement did not, and the issuance of Acquiring Fund Shares pursuant to the Agreement will not, violate the Acquiring Trust’s Declaration of Trust, as amended, or By-laws; and
(e) to the knowledge of such counsel, and without any independent investigation, (i) other than as disclosed on the schedule provided by the Acquiring Fund pursuant to section 4.2 of the Agreement, the Acquiring Trust is not subject to any litigation or other proceedings that might have a materially adverse effect on the operations of the Acquiring Trust, (ii) the Acquiring Trust is duly registered as an investment company with the Commission and is not subject to any stop order, and (iii) all regulatory consents, authorizations, approvals or filings required to be obtained or made by the Acquiring Fund under the federal laws of the United States or the laws of The Commonwealth of Massachusetts for the issuance of Acquiring Fund Shares, pursuant to the Agreement have been obtained or made.
A-13
Table of Contents
The delivery of such opinion is conditioned upon receipt by Vedder, Price, Kaufman & Kammholz, P.C. of customary representations it shall reasonably request of each of the Acquiring Trust and the Acquired Trust.
6.4 The Acquiring Fund shall have performed all of the covenants and complied with all of the provisions required by this Agreement to be performed or complied with by the Acquiring Fund on or before the Closing Date.
6.5 The Acquiring Fund shall have entered into an expense cap agreement with DeIM limiting the expenses of the Class S and Class AARP shares of the Acquiring Fund to 0.73% and 0.75%, respectively, excluding 12b-1 plans and certain other expenses, for the period commencing March 14, 2005 and ending [February 28], 2008, in a form reasonably satisfactory to the Acquired Fund.
| 7. | Conditions Precedent to Obligations of the Acquiring Fund |
The obligations of the Acquiring Fund to consummate the transactions provided for herein shall be subject, at its election, to the performance by the Acquired Fund of all of the obligations to be performed by it hereunder on or before the Closing Date and, in addition thereto, the following further conditions:
7.1 All representations and warranties of the Acquired Trust, on behalf of the Acquired Fund, contained in this Agreement shall be true and correct in all material respects as of the date hereof and, except as they may be affected by the transactions contemplated by this Agreement, as of the Closing Date, with the same force and effect as if made on and as of the Closing Date; and there shall be (i) no pending or threatened litigation brought by any person (other than the Acquiring Fund, its adviser or any of their affiliates) against the Acquired Fund or its investment adviser(s), Board members or officers arising out of this Agreement and (ii) no facts known to the Acquired Fund which the Acquired Fund reasonably believes might result in such litigation.
7.2 The Acquired Fund shall have delivered to the Acquiring Fund a statement of the Acquired Fund’s assets and liabilities as of the Closing Date, certified by the Treasurer of the Acquired Trust.
7.3 The Acquired Fund shall have delivered to the Acquiring Fund on the Closing Date a certificate executed in its name by the Acquired Trust’s President or a Vice President, in a form reasonably satisfactory to the Acquiring Trust, on behalf of the Acquiring Fund, and dated as of the Closing Date, to the effect that the representations and warranties of the Acquired Trust with respect to the Acquired Fund made in this Agreement are true and correct on and as of the Closing Date, except as they may be affected by the transactions contemplated by this Agreement, and as to such other matters as the Acquiring Fund shall reasonably request.
7.4 The Acquiring Fund shall have received on the Closing Date an opinion of Ropes & Gray LLP, in a form reasonably satisfactory to the Acquiring Fund, and dated as of the Closing Date, to the effect that:
(a) the Acquired Trust has been duly formed and is an existing business trust;
(b) the Acquired Fund has the power to carry on its business as presently conducted in accordance with the description thereof in the Acquired Trust’s registration statement under the 1940 Act;
A-14
Table of Contents
(c) the Agreement has been duly authorized, executed and delivered by the Acquired Trust, on behalf of the Acquired Fund, and constitutes a valid and legally binding obligation of the Acquired Trust, on behalf of the Acquired Fund, enforceable in accordance with its terms, subject to bankruptcy, insolvency, fraudulent transfer, reorganization, moratorium and laws of general applicability relating to or affecting creditors’ rights and to general equity principles;
(d) the execution and delivery of the Agreement did not, and the exchange of the Acquired Fund’s assets for Acquiring Fund Shares pursuant to the Agreement will not, violate the Acquired Trust’s Declaration of Trust, as amended, or By-laws; and
(e) to the knowledge of such counsel, and without any independent investigation, (i) other than as disclosed on the schedule provided by the Acquired Fund pursuant to section 3.2 of the Agreement, the Acquired Trust is not subject to any litigation or other proceedings that might have a materially adverse effect on the operations of the Acquired Trust, (ii) the Acquired Trust is duly registered as an investment company with the Commission and is not subject to any stop order, and (iii) all regulatory consents, authorizations, approvals or filings required to be obtained or made by the Acquired Fund under the federal laws of the United States or the laws of The Commonwealth of Massachusetts for the exchange of the Acquired Fund’s assets for Acquiring Fund Shares, pursuant to the Agreement have been obtained or made.
The delivery of such opinion is conditioned upon receipt by Ropes & Gray LLP of customary representations it shall reasonably request of each of the Acquiring Trust and the Acquired Trust.
7.5 The Acquired Fund shall have performed all of the covenants and complied with all of the provisions required by this Agreement to be performed or complied with by the Acquired Fund on or before the Closing Date.
| 8. | Further Conditions Precedent to Obligations of the Acquiring Fund and the Acquired Fund |
If any of the conditions set forth below have not been met on or before the Closing Date with respect to the Acquired Fund or the Acquiring Fund, the other party to this Agreement shall, at its option, not be required to consummate the transactions contemplated by this Agreement:
8.1 This Agreement and the transactions contemplated herein shall have been approved by the requisite vote of the holders of the outstanding shares of the Acquired Fund in accordance with the provisions of the Acquired Trust’s Declaration of Trust, as amended, and By-Laws, applicable Massachusetts law and the 1940 Act, and certified copies of the resolutions evidencing such approval shall have been delivered to the Acquiring Fund. Notwithstanding anything herein to the contrary, neither the Acquiring Fund nor the Acquired Fund may waive the conditions set forth in this section 8.1.
8.2 On the Closing Date, no action, suit or other proceeding shall be pending or to its knowledge threatened before any court or governmental agency in which it is sought to restrain or prohibit, or obtain material damages or other relief in connection with, this Agreement or the transactions contemplated herein.
A-15
Table of Contents
8.3 All consents of other parties and all other consents, orders and permits of federal, state and local regulatory authorities deemed necessary by the Acquiring Fund or the Acquired Fund to permit consummation, in all material respects, of the transactions contemplated hereby shall have been obtained, except where failure to obtain any such consent, order or permit would not involve a risk of a material adverse effect on the assets or properties of the Acquiring Fund or the Acquired Fund, provided that either party hereto may for itself waive any of such conditions.
8.4 The Registration Statement shall have become effective under the 1933 Act and no stop orders suspending the effectiveness thereof shall have been issued and, to the best knowledge of the parties hereto, no investigation or proceeding for that purpose shall have been instituted or be pending, threatened or contemplated under the 1933 Act.
8.5 The parties shall have received an opinion of Willkie Farr & Gallagher LLP addressed to each of the Acquiring Fund and the Acquired Fund, in a form reasonably satisfactory to each such party to this Agreement, substantially to the effect that, based upon certain facts, assumptions and representations of the parties, for federal income tax purposes: (i) the acquisition by Acquiring Fund of all of the assets of Acquired Fund solely in exchange for Acquiring Fund Shares and the assumption by Acquiring Fund of all of the liabilities of Acquired Fund, followed by the distribution by Acquired Fund to its shareholders of Acquiring Fund Shares in complete liquidation of Acquired Fund, all pursuant to the Agreement, constitutes a reorganization within the meaning of Section 368(a) of the Code, and Acquiring Fund and Acquired Fund will each be a “party to a reorganization” within the meaning of Section 368(b) of the Code; (ii) under Section 361 of the Code, Acquired Fund will not recognize gain or loss upon the transfer of its assets to Acquiring Fund in exchange for Acquiring Fund Shares and the assumption of the Acquired Fund liabilities by Acquiring Fund, and Acquired Fund will not recognize gain or loss upon the distribution to its shareholders of the Acquiring Fund Shares in liquidation of Acquired Fund; (iii) under Section 354 of the Code, shareholders of Acquired Fund will not recognize gain or loss on the receipt of Acquiring Fund Shares solely in exchange for Acquired Fund shares; (iv) under Section 358 of the Code, the aggregate basis of the Acquiring Fund Shares received by each shareholder of Acquired Fund will be the same as the aggregate basis of Acquired Fund shares exchanged therefor; (v) under Section 1223(1) of the Code, the holding period of the Acquiring Fund Shares received by each Acquired Fund shareholder will include the holding period of Acquired Fund shares exchanged therefor, provided that the Acquired Fund shareholder held the Acquired Fund shares at the time of the reorganization as a capital asset; (vi) under Section 1032 of the Code, Acquiring Fund will not recognize gain or loss upon the receipt of assets of Acquired Fund in exchange for Acquiring Fund Shares and the assumption by Acquiring Fund of all of the liabilities of Acquired Fund; (vii) under Section 362(b) of the Code, the basis of the assets of Acquired Fund transferred to Acquiring Fund in the reorganization will be the same in the hands of Acquiring Fund as the basis of such assets in the hands of Acquired Fund immediately prior to the transfer; and (viii) under Section 1223(2) of the Code, the holding periods of the assets of Acquired Fund transferred to Acquiring Fund in the reorganization in the hands of Acquiring Fund will include the periods during which such assets were held by Acquired Fund. The delivery of such opinion is conditioned upon receipt by Willkie Farr & Gallagher of representations it shall request of each of the Acquiring Trust and Acquired Trust. Notwithstanding anything herein to the contrary, neither the Acquiring Fund nor the Acquired Fund may waive the condition set forth in this Section 8.5.
A-16
Table of Contents
| 9. | Indemnification |
9.1 The Acquiring Fund agrees to indemnify and hold harmless the Acquired Fund and each of the Acquired Trust’s Board members and officers from and against any and all losses, claims, damages, liabilities or expenses (including, without limitation, the payment of reasonable legal fees and reasonable costs of investigation) to which jointly and severally, the Acquired Trust or any of its Board members or officers may become subject, insofar as any such loss, claim, damage, liability or expense (or actions with respect thereto) arises out of or is based on any breach by the Acquiring Fund of any of its representations, warranties, covenants or agreements set forth in this Agreement.
9.2 The Acquired Fund agrees to indemnify and hold harmless the Acquiring Fund and each of the Acquiring Trust’s Board members and officers from and against any and all losses, claims, damages, liabilities or expenses (including, without limitation, the payment of reasonable legal fees and reasonable costs of investigation) to which jointly and severally, the Acquiring Trust or any of its Board members or officers may become subject, insofar as any such loss, claim, damage, liability or expense (or actions with respect thereto) arises out of or is based on any breach by the Acquired Fund of any of its representations, warranties, covenants or agreements set forth in this Agreement.
| 10. | Fees and Expenses |
10.1 Each of the Acquiring Trust, on behalf of the Acquiring Fund, and the Acquired Trust, on behalf of the Acquired Fund, represents and warrants to the other that it has no obligations to pay any brokers or finders fees in connection with the transactions provided for herein.
10.2 DeIM will bear all the expenses associated with the Reorganization, including any transaction costs payable by the Acquired Fund in connection with sales of certain of its assets, as designated by the Acquiring Fund, in anticipation of the Reorganization.
| 11. | Entire Agreement |
The Acquiring Fund and the Acquired Fund agree that neither party has made any representation, warranty or covenant not set forth herein and that this Agreement constitutes the entire agreement between the parties.
| 12. | Termination |
This Agreement may be terminated and the transactions contemplated hereby may be abandoned (i) by mutual agreement of the parties, or (ii) by either party if the Closing shall not have occurred on or before , 2005, unless such date is extended by mutual agreement of the parties, or (iii) by either party if the other party shall have materially breached its obligations under this Agreement or made a material and intentional misrepresentation herein or in connection herewith. In the event of any such termination, this Agreement shall become void and there shall be no liability hereunder on the part of any party or their respective Board members or officers, except for any such material breach or intentional misrepresentation, as to each of which all remedies at law or in equity of the party adversely affected shall survive.
A-17
Table of Contents
| 13. | Amendments |
This Agreement may be amended, modified or supplemented in such manner as may be mutually agreed upon in writing by any authorized officer of the Acquired Fund and any authorized officer of the Acquiring Fund; provided, however, that following the meeting of the Acquired Fund Shareholders called by the Acquired Fund pursuant to section 5.3 of this Agreement, no such amendment may have the effect of changing the provisions for determining the number of the Acquiring Fund Shares to be issued to the Acquired Fund Shareholders under this Agreement to the detriment of such shareholders without their further approval.
| 14. | Notices |
Any notice, report, statement or demand required or permitted by any provisions of this Agreement shall be in writing and shall be deemed duly given if delivered by hand (including by Federal Express or similar express courier) or transmitted by facsimile or three days after being mailed by prepaid registered or certified mail, return receipt requested, addressed to the Acquired Fund, Two International Place, Boston, Massachusetts 02110-4103, with a copy to Ropes & Gray LLP, One International Place, Boston, Massachusetts 02110-2624, Attention: John W. Gerstmayr, Esq., or to the Acquiring Fund, 222 South Riverside Plaza, Chicago, Illinois 60606, with a copy to Vedder, Price, Kaufman & Kammholz, P.C., 222 North LaSalle Street, Chicago, Illinois 60601, Attention: David A. Sturms, Esq., and Cathy G. O’Kelly, Esq. or to any other address that the Acquired Fund or the Acquiring Fund shall have last designated by notice to the other party.
| 15. | Headings; Counterparts; Assignment; Limitation of Liability |
15.1 The Article and section headings contained in this Agreement are for reference purposes only and shall not affect in any way the meaning or interpretation of this Agreement.
15.2 This Agreement may be executed in any number of counterparts, each of which shall be deemed an original.
15.3 This Agreement shall bind and inure to the benefit of the parties hereto and their respective successors and assigns, but no assignment or transfer hereof or of any rights or obligations hereunder shall be made by any party without the written consent of the other party. Nothing herein expressed or implied is intended or shall be construed to confer upon or give any person, firm or corporation, other than the parties hereto and the shareholders of the Acquiring Fund and the Acquired Fund and their respective successors and assigns, any rights or remedies under or by reason of this Agreement.
15.4 References in this Agreement to each Trust mean and refer to the Board members of each Trust from time to time serving under its Declaration of Trust on file with the Secretary of State of The Commonwealth of Massachusetts, as the same may be amended from time to time, pursuant to which each Trust conducts its business. It is expressly agreed that the obligations of each Trust hereunder shall not be binding upon any of the Board members, shareholders, nominees, officers, agents, or employees of the Trusts or the Funds personally, but bind only the respective property of the Funds, as
A-18
Table of Contents
provided in each Trust’s Declaration of Trust. Moreover, no series of either Trust other than the Funds shall be responsible for the obligations of the Trusts hereunder, and all persons shall look only to the assets of the Funds to satisfy the obligations of the Trusts hereunder. The execution and the delivery of this Agreement have been authorized by each Trust’s Board members, on behalf of the applicable Fund, and this Agreement has been signed by authorized officers of each Fund acting as such, and neither such authorization by such Board members, nor such execution and delivery by such officers, shall be deemed to have been made by any of them individually or to impose any liability on any of them personally, but shall bind only the respective property of the Funds, as provided in each Trust’s Declaration of Trust.
Notwithstanding anything to the contrary contained in this Agreement, the obligations, agreements, representations and warranties with respect to each Fund shall constitute the obligations, agreements, representations and warranties of that Fund only (the “Obligated Fund”), and in no event shall any other series of the Trusts or the assets of any such series be held liable with respect to the breach or other default by the Obligated Fund of its obligations, agreements, representations and warranties as set forth herein.
15.5 This Agreement shall be governed by, and construed and enforced in accordance with, the laws of The Commonwealth of Massachusetts, without regard to its principles of conflicts of laws.
A-19
Table of Contents
IN WITNESS WHEREOF, each of the parties hereto has caused this Agreement to be executed by an authorized officer and its seal to be affixed thereto and attested by its Secretary or Assistant Secretary.
Attest: | SCUDDER TOTAL RETURN FUND, on behalf of Scudder Total Return Fund | |
Secretary | By: Its: | |
Attest: | SCUDDER PORTFOLIO TRUST, on behalf of Scudder Balanced Fund | |
John Millette, Secretary | By: Its: | |
AGREED TO AND ACKNOWLEDGED ONLY WITH RESPECT TO SECTION 10.2 HERETO
DEUTSCHE INVESTMENT MANAGEMENT AMERICAS INC. | ||
By:
Its: | ||
A-20
Table of Contents
Financial Highlights for Total Return Fund (as contained in the Semi-annual Report for the six-month period ended April 30, 2004). Because Class S and Class AARP shares of Total Return Fund have not yet begun operations as of the date of this Prospectus/Proxy Statement, no financial information for these shares is available. However, included below is the financial information for Class A, Class B, Class C, Class I and Class R shares of Total Return Fund.
Class A
Years Ended October 31, | 2004a | 2003 | 2002b | 2001 | 2000 | 1999 | ||||||||||||||||||
Selected Per Share Data | ||||||||||||||||||||||||
Net asset value, beginning of | $ | 8.44 | $ | 7.62 | $ | 8.80 | $ | 11.34 | $ | 11.35 | $ | 10.54 | ||||||||||||
Income (loss) from investment operations: | ||||||||||||||||||||||||
Net investment income (loss)c | .06 | .13 | .17 | .24 | .26 | .30 | ||||||||||||||||||
Net realized and unrealized gain (loss) on investment transactions | .23 | .83 | (1.15 | ) | (1.69 | ) | .47 | 1.50 | ||||||||||||||||
Total from investment operations | .29 | .96 | (.98 | ) | (1.45 | ) | .73 | 1.80 | ||||||||||||||||
Less distributions from: Net investment income | (.08 | ) | (.14 | ) | (.20 | ) | (.24 | ) | (.28 | ) | (.31 | ) | ||||||||||||
Net realized gains on investment transactions | — | — | — | (.85 | ) | (.46 | ) | (.68 | ) | |||||||||||||||
Total distributions | (.08 | ) | (.14 | ) | (.20 | ) | (1.09 | ) | (.74 | ) | (.99 | ) | ||||||||||||
Net asset value, end of period | $ | 8.65 | $ | 8.44 | $ | 7.62 | $ | 8.80 | $ | 11.34 | $ | 11.35 | ||||||||||||
Total Return (%)d | 3.39 | ** | 12.69 | (11.32 | ) | (13.50 | ) | 6.52 | 17.91 | |||||||||||||||
Ratios to Average Net Assets and Supplemental Data | ||||||||||||||||||||||||
Net assets, end of period ($ millions) | 1,706 | 1,764 | 1,774 | 2,328 | 2,862 | 2,885 | ||||||||||||||||||
Ratio of expenses before expense reductions (%) | 1.02 | * | 1.06 | 1.00 | 1.01e | 1.02 | 1.02 | |||||||||||||||||
Ratio of expenses after expense reductions (%) | 1.02 | * | 1.06 | 1.00 | .99e | 1.01 | 1.02 | |||||||||||||||||
Ratio of net investment income (loss) (%) | 1.56 | * | 1.64 | 2.01 | 2.48 | 2.29 | 2.71 | |||||||||||||||||
Portfolio turnover rate (%) | 99 | * | 108 | 130 | 105 | 95 | 64 | |||||||||||||||||
| a | For the six months ended April 30, 2004 (Unaudited). |
| b | As required, effective November 1, 2001, the Fund has adopted the provisions of the AICPA Audit and Accounting Guide for Investment Companies and began amortizing premium on debt securities. In addition, paydowns on mortgage backed securities which were included in realized gain/loss on investment transactions prior to November 1, 2001 are included as interest income. The effect of these changes for the year ended October 31, 2002 was to decrease net investment income by $.02, increase net realized and unrealized gain (loss) per share by $.02, and decrease the ratio of net investment income to average net assets from 2.20% to 2.01%. Per share data and ratios for periods prior to November 1, 2001 have not been restated to reflect this change in presentation. |
| c | Based on average shares outstanding during the period. |
| d | Total return does not reflect the effect of any sales charges. |
| e | The ratios of operating expenses excluding costs incurred in connection with the reorganization before and after expense reductions were .99% and .99%, respectively. |
| * | Annualized |
| ** | Not annualized |
B-1
Table of Contents
Class B
Years Ended October 31, | 2004a | 2003 | 2002b | 2001 | 2000 | 1999 | ||||||||||||||||||
Selected Per Share Data | ||||||||||||||||||||||||
Net asset value, beginning of period | $ | 8.44 | $ | 7.62 | $ | 8.79 | $ | 11.34 | $ | 11.34 | $ | 10.52 | ||||||||||||
Income (loss) from investment operations: | ||||||||||||||||||||||||
Net investment income (loss)c | .02 | .06 | .09 | .14 | .16 | .19 | ||||||||||||||||||
Net realized and unrealized gain (loss) on investment transactions | .22 | .82 | (1.14 | ) | (1.69 | ) | .46 | 1.50 | ||||||||||||||||
Total from investment operations | .24 | .88 | (1.05 | ) | (1.55 | ) | .62 | 1.69 | ||||||||||||||||
Less distributions from: | ||||||||||||||||||||||||
Net investment income | (.03 | ) | (.06 | ) | (.12 | ) | (.15 | ) | (.16 | ) | (.19 | ) | ||||||||||||
Net realized gains on investment transactions | — | — | — | (.85 | ) | (.46 | ) | (.68 | ) | |||||||||||||||
Total distributions | (.03 | ) | (.06 | ) | (.12 | ) | (1.00 | ) | (.62 | ) | (.87 | ) | ||||||||||||
Net asset value, end of period | $ | 8.65 | $ | 8.44 | $ | 7.62 | $ | 8.79 | $ | 11.34 | $ | 11.34 | ||||||||||||
Total Return (%)d | 2.90 | ** | 11.67 | (12.09 | ) | (14.38 | ) | 5.58 | 16.76 | |||||||||||||||
Ratios to Average Net Assets and Supplemental Data | ||||||||||||||||||||||||
Net assets, end of period ($ millions) | 214 | 248 | 298 | 464 | 556 | 744 | ||||||||||||||||||
Ratio of expenses before expense reductions (%) | 1.97 | * | 1.97 | 1.89 | 1.99e | 1.91 | 2.03 | |||||||||||||||||
Ratio of expenses after expense reductions (%) | 1.97 | * | 1.97 | 1.89 | 1.99e | 1.90 | 2.03 | |||||||||||||||||
Ratio of net investment income (loss) (%) | .61 | * | .73 | 1.11 | 1.48 | 1.40 | 1.70 | |||||||||||||||||
Portfolio turnover rate (%) | 99 | * | 108 | 130 | 105 | 95 | 64 | |||||||||||||||||
| a | For the six months ended April 30, 2004 (Unaudited). |
| b | As required, effective November 1, 2001, the Fund has adopted the provisions of the AICPA Audit and Accounting Guide for Investment Companies and began amortizing premium on debt securities. In addition, paydowns on mortgage backed securities which were included in realized gain/loss on investment transactions prior to November 1, 2001 are included as interest income. The effect of these changes for the year ended October 31, 2002 was to decrease net investment income by $.02, increase net realized and unrealized gain (loss) per share by $.02, and decrease the ratio of net investment income to average net assets from 1.31% to 1.11%. Per share data and ratios for periods prior to November 1, 2001 have not been restated to reflect this change in presentation. |
| c | Based on average shares outstanding during the period. |
| d | Total return does not reflect the effect of any sales charges. |
| e | The ratios of operating expenses excluding costs incurred in connection with the reorganization before and after expense reductions were 1.95% and 1.95%, respectively. |
| * | Annualized |
| ** | Not annualized |
B-2
Table of Contents
Class C
Years Ended October 31, | 2004a | 2003 | 2002b | 2001 | 2000 | 1999 | ||||||||||||||||||
Selected Per Share Data | ||||||||||||||||||||||||
Net asset value, beginning of period | $ | 8.42 | $ | 7.60 | $ | 8.78 | $ | 11.31 | $ | 11.32 | $ | 10.54 | ||||||||||||
Income (loss) from investment operations: | ||||||||||||||||||||||||
Net investment income (loss)c | .02 | .06 | .10 | .15 | .16 | .20 | ||||||||||||||||||
Net realized and unrealized gain (loss) on investment transactions | .23 | .83 | (1.15 | ) | (1.67 | ) | .47 | 1.48 | ||||||||||||||||
Total from investment operations | .25 | .89 | (1.05 | ) | (1.52 | ) | .63 | 1.68 | ||||||||||||||||
Less distributions from: | ||||||||||||||||||||||||
Net investment income | (.04 | ) | (.07 | ) | (.13 | ) | (.16 | ) | (.18 | ) | (.22 | ) | ||||||||||||
Net realized gains on investment transactions | — | — | — | (.85 | ) | (.46 | ) | (.68 | ) | |||||||||||||||
Total distributions | (.04 | ) | (.07 | ) | (.13 | ) | (1.01 | ) | (.64 | ) | (.90 | ) | ||||||||||||
Net asset value, end of period | $ | 8.63 | $ | 8.42 | $ | 7.60 | $ | 8.78 | $ | 11.31 | $ | 11.32 | ||||||||||||
Total Return (%)d | 2.93 | ** | 11.81 | (12.13 | ) | (14.18 | ) | 5.63 | 16.64 | |||||||||||||||
Ratios to Average Net Assets and Supplemental Data | ||||||||||||||||||||||||
Net assets, end of period ($ millions) | 54 | 57 | 57 | 72 | 61 | 43 | ||||||||||||||||||
Ratio of expenses before expense reductions (%) | 1.89 | * | 1.93 | 1.80 | 1.89e | 1.87 | 1.89 | |||||||||||||||||
Ratio of expenses after expense reductions (%) | 1.89 | * | 1.93 | 1.80 | 1.87e | 1.86 | 1.89 | |||||||||||||||||
Ratio of net investment income (loss) (%) | .69 | * | .77 | 1.21 | 1.59 | 1.44 | 1.84 | |||||||||||||||||
Portfolio turnover rate (%) | 99 | * | 108 | 130 | 105 | 95 | 64 | |||||||||||||||||
| a | For the six months ended April 30, 2004 (Unaudited). |
| b | As required, effective November 1, 2001, the Fund has adopted the provisions of the AICPA Audit and Accounting Guide for Investment Companies and began amortizing premium on debt securities. In addition, paydowns on mortgage backed securities which were included in realized gain/loss on investment transactions prior to November 1, 2001 are included as interest income. The effect of these changes for the year ended October 31, 2002 was to decrease net investment income by $.02, increase net realized and unrealized gain (loss) per share by $.02, and decrease the ratio of net investment income to average net assets from 1.40% to 1.21%. Per share data and ratios for periods prior to November 1, 2001 have not been restated to reflect this change in presentation. |
| c | Based on average shares outstanding during the period. d Total return does not reflect the effect of any sales charges. |
| e | The ratios of operating expenses excluding costs incurred in connection with the reorganization before and after expense reductions were 1.87% and 1.87%, respectively. |
| * | Annualized |
| ** | Not annualized |
B-3
Table of Contents
Class I
Years Ended October 31, | 2004a | 2003 | 2002b | 2001 | 2000 | 1999 | ||||||||||||||||||
Selected Per Share Data | ||||||||||||||||||||||||
Net asset value, beginning of period | $ | 8.45 | $ | 7.63 | $ | 8.82 | $ | 11.36 | $ | 11.38 | $ | 10.54 | ||||||||||||
Income (loss) from investment operations: | ||||||||||||||||||||||||
Net investment income (loss)c | .08 | .16 | .20 | .27 | .29 | .34 | ||||||||||||||||||
Net realized and unrealized gain (loss) on investment transactions | .23 | .83 | (1.16 | ) | (1.69 | ) | .47 | 1.53 | ||||||||||||||||
Total from investment operations | .31 | .99 | (.96 | ) | (1.42 | ) | .76 | 1.87 | ||||||||||||||||
Less distributions from: | ||||||||||||||||||||||||
Net investment income | (.09 | ) | (.17 | ) | (.23 | ) | (.27 | ) | (.32 | ) | (.35 | ) | ||||||||||||
Net realized gains on investment transactions | — | — | — | (.85 | ) | (.46 | ) | (.68 | ) | |||||||||||||||
Total distributions | (.09 | ) | (.17 | ) | (.23 | ) | (1.12 | ) | (.78 | ) | (1.03 | ) | ||||||||||||
Net asset value, end of period | $ | 8.67 | $ | 8.45 | $ | 7.63 | $ | 8.82 | $ | 11.36 | $ | 11.38 | ||||||||||||
Total Return (%) | 3.67 | ** | 13.09 | (11.09 | ) | (13.14 | ) | 6.80 | 18.65 | |||||||||||||||
Ratios to Average Net Assets and Supplemental Data | ||||||||||||||||||||||||
Net assets, end of period ($ millions) | .28 | .41 | 6 | 9 | 11 | 10 | ||||||||||||||||||
Ratio of expenses before expense reductions (%) | .70 | * | .67 | .64 | .66d | .63 | .67 | |||||||||||||||||
Ratio of expenses after expense reductions (%) | .70 | * | .67 | .64 | .65d | .62 | .67 | |||||||||||||||||
Ratio of net investment income (loss) (%) | 1.88 | * | 2.03 | 2.37 | 2.82 | 2.68 | 3.06 | |||||||||||||||||
Portfolio turnover rate (%) | 99 | * | 108 | 130 | 105 | 95 | 64 | |||||||||||||||||
| a | For the six months ended April 30, 2004 (Unaudited). |
| b | As required, effective November 1, 2001, the Fund has adopted the provisions of the AICPA Audit and Accounting Guide for Investment Companies and began amortizing premium on debt securities. In addition, paydowns on mortgage backed securities which were included in realized gain/loss on investment transactions prior to November 1, 2001 are included as interest income. The effect of these changes for the year ended October 31, 2002 was to decrease net investment income by $.02, increase net realized and unrealized gain (loss) per share by $.02, and decrease the ratio of net investment income to average net assets from 2.56% to 2.37%. Per share data and ratios for periods prior to November 1, 2001 have not been restated to reflect this change in presentation. |
| c | Based on average shares outstanding during the period. |
| d | The ratios of operating expenses excluding costs incurred in connection with the reorganization before and after expense reductions were .64% and .64%, respectively. |
| * | Annualized |
| ** | Not annualized |
B-4
Table of Contents
Class R
| 2004a | 2003b | |||||||
Selected Per Share Data | ||||||||
Net asset value, beginning of period | $ | 8.44 | $ | 8.33 | ||||
Income (loss) from investment operations: | ||||||||
Net investment income (loss)c | .06 | .20 | ||||||
Net realized and unrealized gain (loss) on investment transactions | .22 | (.09 | ) | |||||
Total from investment operations | .28 | .11 | ||||||
Less distributions from: Net investment income | (.06 | ) | — | |||||
Total distributions | (.06 | ) | — | |||||
Net asset value, end of period | $ | 8.66 | $ | 8.44 | ||||
Total Return (%) | 2.98 | ** | 1.32 | ** | ||||
Ratios to Average Net Assets and Supplemental Data | ||||||||
Net assets, end of period ($ millions) | .44 | .01 | ||||||
Ratio of expenses | 1.11 | * | 1.33 | * | ||||
Ratio of net investment income (loss) (%) | 1.47 | * | 1.37 | * | ||||
Portfolio turnover rate (%) | 99 | * | 108 | * | ||||
| a | For the six months ended April 30, 2004 (Unaudited). |
| b | For the period from October 1, 2003 (commencement of sales of Class R shares) to October 31, 2003. |
| c | Based on average shares outstanding during the period. |
| * | Annualized |
| ** | Not annualized |
B-5
Table of Contents
| Page | |||
I. | Synopsis | 3 | ||
II. | Investment Strategies and Risk Factors | 8 | ||
III. | Other Comparisons Between the Funds | 15 | ||
IV. | Information About the Proposed Merger | 21 | ||
V. | Information About Voting and the Shareholder Meeting | 28 | ||
VI. | Regulatory and Litigation Matters | 31 | ||
| A-1 | ||||
| B-1 | ||||
Proxy card enclosed.
For more information, please call your Fund’s proxy solicitor,
Georgeson Shareholder, at 1-888-288-5518.
Table of Contents
YOUR VOTE IS IMPORTANT!
UNLESS VOTING BY TELEPHONE OR INTERNET,
PLEASE SIGN, DATE AND MAIL THIS PROXY CARD
PROMPTLY USING THE ENCLOSED ENVELOPE.
| Your Proxy Vote is important! | ||
| And now you can Vote your Proxy on the PHONE or the INTERNET. | ||
| It saves Money! Telephone and Internet voting saves postage costs. Savings which can help minimize expenses. | ||
| It saves Time! Telephone and Internet voting is instantaneous – 24 hours a day. | ||
| It’s Easy! Just follow these simple steps: | ||
| 1. Read your proxy statement and have it and this proxy card at hand. | ||
| 2. Call toll-free 1-866-241-6192, or go to website: https://vote.proxy-direct.com. | ||
| 3. Follow the recorded or on-screen directions. | ||
| 4. Do not mail your Proxy Card when you vote by phone or Internet. | ||
Please detach at perforation before mailing.
| SCUDDER PORTFOLIO TRUST | PROXY CARD | ||
| SCUDDER BALANCED FUND | ||||
| PO Box 18011 | PROXY FOR THE SPECIAL MEETING OF SHAREHOLDERS | |||
| Hauppauge, NY 11788-8811 | 345 Park Avenue, 27th Floor, New York, New York 10154 | |||
| [9:00 a.m., Eastern time, on February 24, 2005] |
The undersigned hereby appoints Daniel O. Hirsch, John Millette and Caroline Pearson, and each of them, with full power of substitution, as proxy or proxies of the undersigned to vote all shares of the Fund that the undersigned is entitled in any capacity to vote at the above-stated special meeting, and at any and all adjournments or postponements thereof (the ‘Special Meeting’), on the matter set forth in the Notice of Special Meeting of Shareholders and on this Proxy Card, and, in their discretion, upon all matters incident to the conduct of the Special Meeting and upon such other matters as may properly be brought before the Special Meeting. This proxy revokes all prior proxies given by the undersigned.
All properly executed proxies will be voted as directed. If no instructions are indicated on a properly executed proxy, the proxy will be voted FOR approval of the Proposal. All ABSTAIN votes will be counted in determining the existence of a quorum at the Special Meeting.
Receipt of the Notice of Special Meeting and the related Prospectus/Proxy Statement is hereby acknowledged.
| VOTE VIA THE INTERNET: https://vote.proxy-direct.com | ||
| VOTE VIA THE TELEPHONE: 1-866-241-6192 | ||
| Note: Joint owners should EACH sign. Please sign EXACTLY as your name(s) appears on this card. When signing as attorney, trustee, executor, administrator, guardian or corporate officer, please give your FULL title as such. | ||
| Signature(s) (Title(s), if applicable) | ||
| Date | ||
UNLESS VOTING BY TELEPHONE OR INTERNET, PLEASE SIGN, DATE AND MAIL THIS PROXY CARD PROMPTLY USING THE ENCLOSED ENVELOPE.
NO POSTAGE REQUIRED.
Table of Contents
YOUR VOTE IS IMPORTANT!
UNLESS VOTING BY TELEPHONE OR INTERNET,
PLEASE SIGN, DATE AND MAIL THIS PROXY CARD
PROMPTLY USING THE ENCLOSED ENVELOPE.
Please detach at perforation before mailing.
THIS PROXY IS SOLICITED ON BEHALF OF THE BOARD OF TRUSTEES WITH RESPECT TO YOUR FUND. THE FOLLOWING MATTER IS PROPOSED BY YOUR FUND. THE BOARD OF TRUSTEES RECOMMENDS A VOTE FOR THE PROPOSAL.
TO VOTE, MARK A BLOCK BELOW IN BLUE OR BLACK INK. Example: n
VOTE ON PROPOSAL 1:
| FOR | AGAINST | ABSTAIN | ||||||
| 1. | Approve an Agreement and Plan of Reorganization and the transactions it contemplates, including the transfer of all of the assets of Scudder Balanced Fund to Scudder Total Return Fund, in exchange for shares of Scudder Total Return Fund and the assumption by Scudder Total Return Fund of all of the liabilities of Scudder Balanced Fund, and the distribution of such shares, on a tax-free basis, to the shareholders of Scudder Balanced Fund, in complete termination and liquidation of Scudder Balanced Fund. | ¨ | ¨ | ¨ | ||||
The appointed proxies will vote on any other business as may properly come before the Special Meeting.
THIS PROXY CARD IS VALID ONLY WHEN SIGNED AND DATED ON REVERSE SIDE.
Table of Contents
STATEMENT OF ADDITIONAL INFORMATION
SCUDDER TOTAL RETURN FUND
222 S. Riverside Plaza
Chicago, Illinois 60606
This statement of additional information is not a prospectus, but should be read in conjunction with the Prospectus /Proxy Statement dated , 2005 for the Special Meeting of Shareholders of Scudder Balanced Fund (“Balanced Fund”), a series of Scudder Portfolio Trust, to be held on [February 24], 2005, into which this statement of additional information is hereby incorporated by reference. Copies of the Prospectus /Proxy Statement may be obtained at no charge by contacting Scudder Distributors, Inc., 222 South Riverside Plaza, Chicago, Illinois 60606, (800) 621-1048, or from the firm from which this statement of additional information was obtained and are available along with other materials on the Securities and Exchange Commission’s Internet website (http://www.sec.gov). Unless otherwise indicated, capitalized terms used herein and not otherwise defined have the same meanings as are given to them in the Prospectus/Proxy Statement.
Further information about Total Return Fund, a series of Scudder Total Return Fund is contained in Total Return Fund’s statement of additional information (“SAI”) dated , 2004 for Class S and AARP shares, which is attached to this statement of additional information. The audited financial statements and related independent accountant’s report for the Total Return Fund contained in the Annual Report for the fiscal year ended October 31, 2003 and the unaudited financial statements contained in the Semi-annual Report are incorporated herein by reference insofar as they relate to the fund’s participation in the merger. No other parts of the Annual or Semi-annual Reports are incorporated by reference herein.
The unaudited pro forma financial statements, attached hereto, are intended to present the financial condition and related results of operations of the Total Return Fund and Balanced Fund as if the merger had been consummated on April 30, 2003, unless otherwise indicated.
Further information about the Balanced Fund is contained in its statement of additional information dated May 1, 2004, as supplemented from time to time, for Class S and Class AARP shares.
The date of this statement of additional information is December , 2004.
S-1
Table of Contents
Pro Forma
Portfolio of Investments
as of April 30, 2004
(Unaudited)
| Balanced Par/Share Amount | Total Return Par/Share Amount | Combined Pro Forma Par/Share Amount | Balanced Market Value ($) | Total Return Market Value ($) | Combined Pro Forma Market Value ($) | |||||||
Common Stocks 62.7% | ||||||||||||
Consumer Discretionary 8.4% | ||||||||||||
Automobiles 1.0% | ||||||||||||
Harley-Davidson, Inc. | 126,900 | 334,600 | 461,500 | 7,147,008 | 18,844,672 | 25,991,680 | ||||||
Hotels Restaurants & Leisure 1.7% | ||||||||||||
International Game Technology | 221,800 | 592,800 | 814,600 | 8,370,732 | 22,372,272 | 30,743,004 | ||||||
YUM! Brands, Inc. | 115,700 | 314,100 | 429,800 | 4,488,003 | 12,183,939 | 16,671,942 | ||||||
| 12,858,735 | 34,556,211 | 47,414,946 | ||||||||||
Media 2.9% | ||||||||||||
Comcast Corp. “A” | 133,300 | 350,700 | 484,000 | 3,864,367 | 10,166,793 | 14,031,160 | ||||||
McGraw-Hill, Inc. | 71,700 | 192,900 | 264,600 | 5,654,262 | 15,212,094 | 20,866,356 | ||||||
Omnicom Group, Inc. | 84,100 | 226,000 | 310,100 | 6,686,791 | 17,969,260 | 24,656,051 | ||||||
Time Warner, Inc. | 155,700 | 155,700 | 2,618,874 | 2,618,874 | ||||||||
Viacom, Inc., “B” | 121,262 | 325,704 | 446,966 | 4,686,776 | 12,588,460 | 17,275,236 | ||||||
| 23,511,070 | 55,936,607 | 79,447,677 | ||||||||||
Multiline Retail 1.6% | ||||||||||||
Kohl’s Corp. | 58,200 | 153,200 | 211,400 | 2,432,178 | 6,402,228 | 8,834,406 | ||||||
Target Corp. | 217,900 | 572,900 | 790,800 | 9,450,323 | 24,846,673 | 34,296,996 | ||||||
| 11,882,501 | 31,248,901 | 43,131,402 | ||||||||||
Specialty Retail 1.2% | ||||||||||||
Home Depot, Inc. | 78,300 | 210,550 | 288,850 | 2,755,377 | 7,409,254 | 10,164,631 | ||||||
Lowe’s Companies, Inc. | 71,500 | 192,600 | 264,100 | 3,722,290 | 10,026,756 | 13,749,046 | ||||||
Staples, Inc. | 105,100 | 281,100 | 386,200 | 2,707,376 | 7,241,136 | 9,948,512 | ||||||
| 9,185,043 | 24,677,146 | 33,862,189 | ||||||||||
Consumer Staples 7.9% | ||||||||||||
Beverages 2.2% | ||||||||||||
Coca-Cola Co. | 94,200 | 253,600 | 347,800 | 4,763,694 | 12,824,552 | 17,588,246 | ||||||
PepsiCo, Inc. | 203,150 | 568,200 | 771,350 | 11,069,644 | 30,961,218 | 42,030,862 | ||||||
| 15,833,338 | 43,785,770 | 59,619,108 | ||||||||||
Food & Drug Retailing 2.6% | ||||||||||||
Wal-Mart Stores, Inc. | 243,600 | 654,300 | 897,900 | 13,885,200 | 37,295,100 | 51,180,300 | ||||||
Walgreen Co. | 145,300 | 390,600 | 535,900 | 5,009,944 | 13,467,888 | 18,477,832 | ||||||
| 18,895,144 | 50,762,988 | 69,658,132 | ||||||||||
Food Products 0.5% | ||||||||||||
Dean Foods Co. | 26,900 | 76,000 | 102,900 | 903,302 | 2,552,080 | 3,455,382 | ||||||
Hershey Foods Corp. | 31,800 | 83,900 | 115,700 | 2,826,702 | 7,457,871 | 10,284,573 | ||||||
| 3,730,004 | 10,009,951 | 13,739,955 | ||||||||||
Household Products 2.6% | ||||||||||||
Colgate-Palmolive Co. | 162,300 | 427,700 | 590,000 | 9,393,924 | 24,755,276 | 34,149,200 | ||||||
Procter & Gamble Co. | 97,900 | 252,800 | 350,700 | 10,352,925 | 26,733,600 | 37,086,525 | ||||||
| 19,746,849 | 51,488,876 | 71,235,725 | ||||||||||
Energy 4.2% | ||||||||||||
Energy Equipment & Services 2.6% | ||||||||||||
Baker Hughes, Inc. | 130,400 | 353,700 | 484,100 | 4,783,072 | 12,973,716 | 17,756,788 | ||||||
Nabors Industries Ltd. | 199,900 | 507,100 | 707,000 | 8,867,564 | 22,494,956 | 31,362,520 | ||||||
Schlumberger Ltd. | 105,300 | 261,400 | 366,700 | 6,163,209 | 15,299,742 | 21,462,951 | ||||||
| 19,813,845 | 50,768,414 | 70,582,259 | ||||||||||
Oil & Gas 1.6% | ||||||||||||
Burlington Resources, Inc. | 85,000 | 218,500 | 303,500 | 5,717,950 | 14,698,495 | 20,416,445 | ||||||
ConocoPhillips | 85,200 | 229,100 | 314,300 | 6,074,760 | 16,334,830 | 22,409,590 | ||||||
| 11,792,710 | 31,033,325 | 42,826,035 | ||||||||||
Financials 7.3% | ||||||||||||
Banks 0.8% | ||||||||||||
Bank of America Corp. | 76,700 | 188,700 | 265,400 | 6,173,583 | 15,188,463 | 21,362,046 | ||||||
Capital Markets 1.8% | ||||||||||||
Goldman Sachs Group, Inc. | 23,800 | 63,800 | 87,600 | 2,296,700 | 6,172,650 | 8,469,350 | ||||||
Lehman Brothers Holdings, Inc. | 30,800 | 82,900 | 113,700 | 2,260,720 | 6,084,860 | 8,345,580 | ||||||
Morgan Stanley | 102,200 | 274,800 | 377,000 | 5,252,058 | 14,121,972 | 19,374,030 | ||||||
State Street Corp. | 74,400 | 170,800 | 245,200 | 3,630,720 | 8,335,040 | 11,965,760 | ||||||
| 13,440,198 | 34,714,522 | 48,154,720 | ||||||||||
Consumer Finance 1.2% | ||||||||||||
American Express Co. | 186,100 | 507,900 | 694,000 | 9,109,595 | 24,861,705 | 33,971,300 | ||||||
S-2
Table of Contents
| Balanced Par/Share Amount | Total Return Par/Share Amount | Combined Pro Forma Par/Share Amount | Balanced Market Value ($) | Total Return Value ($) | Combined Pro Forma Value ($) | |||||||
Diversified Financial Services 2.2% | ||||||||||||
Citigroup, Inc. | 203,566 | 547,029 | 750,595 | 9,789,489 | 26,306,625 | 36,096,114 | ||||||
Fannie Mae | 93,500 | 248,000 | 341,500 | 6,425,320 | 17,042,560 | 23,467,880 | ||||||
| 16,214,809 | 43,349,185 | 59,563,994 | ||||||||||
Insurance 1.3% | ||||||||||||
AFLAC, Inc. | 61,000 | 160,700 | 221,700 | 2,576,030 | 6,786,361 | 9,362,391 | ||||||
American International Group, Inc. | 98,774 | 262,200 | 360,974 | 7,077,157 | 18,786,630 | 25,863,787 | ||||||
| 9,653,187 | 25,572,991 | 35,226,178 | ||||||||||
Health Care 14.3% | ||||||||||||
Biotechnology 3.1% | ||||||||||||
Amgen, Inc. | 22,000 | 55,600 | 77,600 | 1,237,940 | 3,128,612 | 4,366,552 | ||||||
Genentech, Inc. | 131,100 | 343,700 | 474,800 | 16,099,080 | 42,206,360 | 58,305,440 | ||||||
Gilead Sciences, Inc. | 98,300 | 246,900 | 345,200 | 5,979,589 | 15,018,927 | 20,998,516 | ||||||
| 23,316,609 | 60,353,899 | 83,670,508 | ||||||||||
Health Care Equipment & Supplies 3.1% | ||||||||||||
Baxter International, Inc. | 118,900 | 312,500 | 431,400 | 3,763,185 | 9,890,625 | 13,653,810 | ||||||
Boston Scientific Corp. | 104,500 | 274,800 | 379,300 | 4,304,355 | 11,319,012 | 15,623,367 | ||||||
C.R. Bard, Inc. | 25,700 | 69,400 | 95,100 | 2,731,139 | 7,375,138 | 10,106,277 | ||||||
Medtronic, Inc. | 129,700 | 342,100 | 471,800 | 6,544,662 | 17,262,366 | 23,807,028 | ||||||
Zimmer Holdings, Inc. | 76,200 | 206,600 | 282,800 | 6,084,570 | 16,497,010 | 22,581,580 | ||||||
| 23,427,911 | 62,344,151 | 85,772,062 | ||||||||||
Health Care Providers & Services 1.1% | ||||||||||||
UnitedHealth Group, Inc. | 136,200 | 369,800 | 506,000 | 8,373,576 | 22,735,304 | 31,108,880 | ||||||
Pharmaceuticals 7.0% | ||||||||||||
Abbott Laboratories | 188,200 | 496,500 | 684,700 | 8,284,564 | 21,855,930 | 30,140,494 | ||||||
Eli Lilly & Co. | 122,200 | 329,100 | 451,300 | 9,019,582 | 24,290,871 | 33,310,453 | ||||||
Johnson & Johnson | 250,454 | 658,562 | 909,016 | 13,532,030 | 35,582,105 | 49,114,135 | ||||||
Merck & Co., Inc. | 89,600 | 239,400 | 329,000 | 4,211,200 | 11,251,800 | 15,463,000 | ||||||
Pfizer, Inc. | 467,900 | 1,269,675 | 1,737,575 | 16,732,104 | 45,403,578 | 62,135,682 | ||||||
| 51,779,480 | 138,384,284 | 190,163,764 | ||||||||||
Industrials 4.3% | ||||||||||||
Aerospace & Defense 1.1% | ||||||||||||
United Technologies Corp. | 99,500 | 261,100 | 360,600 | 8,582,870 | 22,522,486 | 31,105,356 | ||||||
Air Freight & Logistics 0.6% | ||||||||||||
FedEx Corp. | 66,500 | 176,900 | 243,400 | 4,782,015 | 12,720,879 | 17,502,894 | ||||||
Industrial Conglomerates 2.6% | ||||||||||||
3M Co. | 52,100 | 140,100 | 192,200 | 4,505,608 | 12,115,848 | 16,621,456 | ||||||
General Electric Co. | 491,100 | 1,320,100 | 1,811,200 | 14,708,445 | 39,536,995 | 54,245,440 | ||||||
| 19,214,053 | 51,652,843 | 70,866,896 | ||||||||||
Information Technology 15.0% | ||||||||||||
Communications Equipment 1.6% | ||||||||||||
Cisco Systems, Inc. | 585,300 | 1,538,000 | 2,123,300 | 12,215,211 | 32,098,060 | 44,313,271 | ||||||
Computers & Peripherals 2.6% | ||||||||||||
Dell, Inc. | 75,500 | 203,300 | 278,800 | 2,620,605 | 7,056,543 | 9,677,148 | ||||||
EMC Corp. | 601,600 | 1,606,500 | 2,208,100 | 6,713,856 | 17,928,540 | 24,642,396 | ||||||
International Business Machines Corp. | 114,300 | 300,500 | 414,800 | 10,077,831 | 26,495,085 | 36,572,916 | ||||||
| 19,412,292 | 51,480,168 | 70,892,460 | ||||||||||
IT Consulting & Services 1.1% | ||||||||||||
Accenture Ltd., “A” | 70,000 | 181,800 | 251,800 | 1,663,900 | 4,321,386 | 5,985,286 | ||||||
Fiserv, Inc. | 130,600 | 351,000 | 481,600 | 4,774,736 | 12,832,560 | 17,607,296 | ||||||
Paychex, Inc. | 38,800 | 103,800 | 142,600 | 1,446,464 | 3,869,664 | 5,316,128 | ||||||
| 7,885,100 | 21,023,610 | 28,908,710 | ||||||||||
Semiconductors & Semiconductor Equipment 4.5% | ||||||||||||
Applied Materials, Inc. | 270,900 | 713,700 | 984,600 | 4,938,507 | 13,010,751 | 17,949,258 | ||||||
Intel Corp. | 595,700 | 1,572,700 | 2,168,400 | 15,327,361 | 40,465,571 | 55,792,932 | ||||||
Linear Technology Corp. | 141,700 | 381,600 | 523,300 | 5,048,771 | 13,596,408 | 18,645,179 | ||||||
Texas Instruments, Inc. | 331,700 | 867,400 | 1,199,100 | 8,325,670 | 21,771,740 | 30,097,410 | ||||||
| 33,640,309 | 88,844,470 | 122,484,779 | ||||||||||
Software 5.2% | ||||||||||||
Adobe Systems, Inc. | 24,100 | 63,500 | 87,600 | 996,294 | 2,625,090 | 3,621,384 | ||||||
BEA Systems, Inc. | 84,400 | 231,100 | 315,500 | 963,004 | 2,636,851 | 3,599,855 | ||||||
Electronic Arts, Inc. | 128,700 | 347,000 | 475,700 | 6,514,794 | 17,565,140 | 24,079,934 | ||||||
Intuit, Inc. | 52,700 | 138,900 | 191,600 | 2,238,169 | 5,899,083 | 8,137,252 | ||||||
Microsoft Corp. | 713,100 | 1,895,500 | 2,608,600 | 18,519,207 | 49,226,135 | 67,745,342 | ||||||
MicroStrategy, Inc. | 24 | 24 | 1,153 | 1,153 | ||||||||
Oracle Corp. | 299,300 | 806,100 | 1,105,400 | 3,358,146 | 9,044,442 | 12,402,588 | ||||||
Symantec Corp. | 84,200 | 221,100 | 305,300 | 3,793,210 | 9,960,555 | 13,753,765 | ||||||
VERITAS Software Corp. | 87,600 | 223,100 | 310,700 | 2,336,292 | 5,950,077 | 8,286,369 | ||||||
S-3
Table of Contents
| Balanced Par/Share Amount | Total Return Par/Share Amount | Combined Pro Forma Par/Share Amount | Balanced Market Value ($) | Total Return Value ($) | Combined Pro Forma Value ($) | |||||||
| 38,719,116 | 102,908,526 | 141,627,642 | ||||||||||
Materials 0.5% | ||||||||||||
Chemicals 0.5% | ||||||||||||
Ecolab, Inc. | 132,900 | 359,700 | 492,600 | 3,960,420 | 10,719,060 | 14,679,480 | ||||||
Telecommunication Services 0.8% | ||||||||||||
Diversified Telecommunication Services 0.3% | ||||||||||||
Verizon Communications, Inc. | 83,800 | 112,700 | 196,500 | 3,162,612 | 4,253,298 | 7,415,910 | ||||||
Wireless Telecommunication Services 0.5% | ||||||||||||
AT&T Wireless Services, Inc. | 326,200 | 573,600 | 899,800 | 4,504,822 | 7,921,416 | 12,426,238 | ||||||
Total Common Stocks (Cost $387,350,143, $955,517,551 and $1,342,867,694, respectively) | 471,964,015 | 1,236,762,181 | 1,708,726,196 | |||||||||
Corporate Bonds 9.1% | ||||||||||||
Consumer Discretionary 0.7% | ||||||||||||
Amscan Holdings, Inc., 144A, 8.75%, 5/1/2014 | 40,000 | 40,000 | 40,600 | 40,600 | ||||||||
Bally Total Fitness Holdings Corp., 10.5%, 7/15/2011 | 130,000 | 130,000 | 120,900 | 120,900 | ||||||||
Boca Resorts, Inc., 9.875%, 4/15/2009 | 210,000 | 210,000 | 221,025 | 221,025 | ||||||||
Buffets, Inc., 11.25%, 7/15/2010 | 70,000 | 70,000 | 76,825 | 76,825 | ||||||||
Cablevision Systems Corp.: | ||||||||||||
144A, 5.67%, 4/1/2009 | 155,000 | 155,000 | 159,650 | 159,650 | ||||||||
144A, 8.0%, 4/15/2012 | 65,000 | 65,000 | 65,162 | 65,162 | ||||||||
Carrols Corp., 9.5%, 12/1/2008 | 125,000 | 125,000 | 129,375 | 129,375 | ||||||||
Choctaw Resort Development Enterprises, 9.25%, 4/1/2009 | 215,000 | 215,000 | 232,737 | 232,737 | ||||||||
Circus & Eldorado, 10.125%, 3/1/2012 | 155,000 | 155,000 | 157,325 | 157,325 | ||||||||
Comcast Cable Communications: | ||||||||||||
6.2%, 11/15/2008 | 475,000 | 475,000 | 510,272 | 510,272 | ||||||||
8.375%, 5/1/2007 | 1,290,000 | 1,290,000 | 1,462,402 | 1,462,402 | ||||||||
8.375%, 3/15/2013 | 2,809,000 | 1,056,000 | 3,865,000 | 3,289,099 | 1,259,943 | 4,549,042 | ||||||
CSC Holdings, Inc., 7.875%, 12/15/2007 | 210,000 | 210,000 | 223,650 | 223,650 | ||||||||
Dex Media East LLC, 12.125%, 11/15/2012 | 670,000 | 670,000 | 777,200 | 777,200 | ||||||||
DIMON, Inc., Series B, 9.625%, 10/15/2011 | 505,000 | 505,000 | 540,350 | 540,350 | ||||||||
EchoStar DBS Corp., 144A, 6.375%, 10/1/2011 | 95,000 | 95,000 | 96,069 | 96,069 | ||||||||
Eldorado Resorts LLC, 10.5%, 8/15/2006 | 176,000 | 176,000 | 179,080 | 179,080 | ||||||||
Finlay Fine Jewelry Corp., 8.375%, 5/1/2008 | 150,000 | 150,000 | 154,313 | 154,313 | ||||||||
General Motors Corp.: | ||||||||||||
8.25%, 7/15/2023 | 245,000 | 245,000 | 262,194 | 262,194 | ||||||||
8.375%, 7/15/2033 | 130,000 | 130,000 | 140,597 | 140,597 | ||||||||
Herbst Gaming, Inc., Series B, 10.75%, 9/1/2008 | 290,000 | 290,000 | 326,250 | 326,250 | ||||||||
International Game Technology, 8.375%, 5/15/2009 | 235,000 | 235,000 | 275,172 | 275,172 | ||||||||
Jacobs Entertainment Co., 11.875%, 2/1/2009 | 190,000 | 190,000 | 209,000 | 209,000 | ||||||||
Kellwood Co., 7.625%, 10/15/2017 | 80,000 | 80,000 | 85,227 | 85,227 | ||||||||
Krystal, Inc., 10.25%, 10/1/2007 | 125,000 | 125,000 | 126,719 | 126,719 | ||||||||
Laidlaw International, Inc., 144A, 10.75%, 6/15/2011 | 145,000 | 145,000 | 162,762 | 162,762 | ||||||||
Lin Television Corp., 6.5%, 5/15/2013 | 85,000 | 85,000 | 83,725 | 83,725 | ||||||||
Liberty Media Corp., Series A, 3.5%, 9/25/2006 | 850,000 | 850,000 | 851,641 | 851,641 | ||||||||
Mail-Well I Corp., 144A, 7.875%, 12/1/2013 | 80,000 | 80,000 | 75,600 | 75,600 | ||||||||
Mediacom LLC, 9.5%, 1/15/2013 | 155,000 | 155,000 | 154,225 | 154,225 | ||||||||
PEI Holding, Inc., 11.0%, 3/15/2010 | 100,000 | 100,000 | 116,250 | 116,250 | ||||||||
Petro Stopping Centers, 144A, 9.0%, 2/15/2012 | 315,000 | 315,000 | 329,175 | 329,175 | ||||||||
Premier Entertainment Biloxi LLC\Finance, 144A, 10.75%, 2/1/2012 | 70,000 | 70,000 | 75,600 | 75,600 | ||||||||
PRIMEDIA, Inc., 7.625%, 4/1/2008 | 245,000 | 245,000 | 246,837 | 246,837 | ||||||||
Rent-Way Inc., 11.875%, 6/15/2010 | 60,000 | 60,000 | 66,900 | 66,900 | ||||||||
River Rock Entertainment, 144A, 9.75%, 11/1/2011 | 75,000 | 75,000 | 79,875 | 79,875 | ||||||||
Schuler Homes, Inc., 10.5%, 7/15/2011 | 265,000 | 265,000 | 304,750 | 304,750 | ||||||||
Scientific Games Corp., 12.5%, 8/15/2010 | 132,000 | 132,000 | 153,780 | 153,780 | ||||||||
Sealy Mattress Co., Series B, 9.875%, 12/15/2007 | 50,000 | 50,000 | 51,646 | 51,646 | ||||||||
Seneca Gaming Corp., 144A, 7.25%, 5/1/2012 | 60,000 | 60,000 | 61,065 | 61,065 | ||||||||
Sinclair Broadcast Group, Inc.: | ||||||||||||
8.0%, 3/15/2012 | 290,000 | 290,000 | 308,125 | 308,125 | ||||||||
8.75%, 12/15/2011 | 290,000 | 290,000 | 319,000 | 319,000 | ||||||||
Six Flags, Inc., 8.875%, 2/1/2010 | 15,000 | 15,000 | 15,263 | 15,263 |
S-4
Table of Contents
| Balanced Par/Share Amount | Total Return Par/Share Amount | Combined Pro Forma Par/Share Amount | Balanced Market Value ($) | Total Return Market Value ($) | Combined Pro Forma Market Value ($) | |||||||
Sonic Automotive, Inc., 8.625%, 8/15/2013 | 195,000 | 195,000 | 210,112 | 210,112 | ||||||||
The Reader’s Digest Association, Inc., 144A, 6.5%, 3/1/2011 | 70,000 | 70,000 | 70,700 | 70,700 | ||||||||
Time Warner, Inc., 8.11%, 8/15/2006 | 2,860,000 | 2,860,000 | 3,156,796 | 3,156,796 | ||||||||
Toys “R” Us, Inc.: | ||||||||||||
7.375%, 10/15/2018 | 330,000 | 330,000 | 315,975 | 315,975 | ||||||||
7.875%, 4/15/2013 | 120,000 | 120,000 | 123,600 | 123,600 | ||||||||
United Auto Group, Inc., 9.625%, 3/15/2012 | 115,000 | 115,000 | 128,513 | 128,513 | ||||||||
United Rentals North America, Inc., 144A, 6.5%, 2/15/2012 | 215,000 | 215,000 | 207,475 | 207,475 | ||||||||
Venetian Casino Resort LLC, 11.0%, 6/15/2010 | 90,000 | 90,000 | 105,300 | 105,300 | ||||||||
VICORP Restaurants, Inc., 144A, 10.5%, 4/15/2011 | 110,000 | 110,000 | 108,900 | 108,900 | ||||||||
Wheeling Island Gaming, Inc., 10.125%, 12/15/2009 | 130,000 | 130,000 | 140,400 | 140,400 | ||||||||
Williams Scotsman, Inc., 9.875%, 6/1/2007 | 130,000 | 130,000 | 129,350 | 129,350 | ||||||||
Worldspan LP\WS Finance Corp., 9.625%, 6/15/2011 | 200,000 | 200,000 | 214,500 | 214,500 | ||||||||
| 4,140,740 | 15,348,236 | 19,488,976 | ||||||||||
Consumer Staples 0.0% | ||||||||||||
Agrilink Foods, Inc., 11.875%, 11/1/2008 | 46,000 | 46,000 | 48,760 | 48,760 | ||||||||
Gold Kist, Inc., 144A, 10.25%, 3/15/2014 | 125,000 | 125,000 | 131,250 | 131,250 | ||||||||
North Atlantic Trading Co., 144A, 9.25%, 3/1/2012 | 155,000 | 155,000 | 156,938 | 156,938 | ||||||||
Pilgrim’s Pride Corp., 9.625%, 9/15/2011 | 80,000 | 80,000 | 87,200 | 87,200 | ||||||||
Standard Commercial Corp., 144A, 8.0%, 4/15/2012 | 40,000 | 40,000 | 41,300 | 41,300 | ||||||||
Swift & Co.: | ||||||||||||
10.125%, 10/1/2009 | 135,000 | 135,000 | 144,281 | 144,281 | ||||||||
12.5%, 1/1/2010 | 70,000 | 70,000 | 74,200 | 74,200 | ||||||||
United Agri Products, 144A, 8.25%, 12/15/2011 | 80,000 | 80,000 | 90,600 | 90,600 | ||||||||
| — | 774,529 | 774,529 | ||||||||||
Energy 1.2% | ||||||||||||
Avista Corp., 9.75%, 6/1/2008 | 430,000 | 430,000 | 516,000 | 516,000 | ||||||||
Citgo Petroleum Corp., 11.375%, 2/1/2011 | 475,000 | 475,000 | 548,625 | 548,625 | ||||||||
Duke Capital Corp., 4.302%, 5/18/2006 | 3,667,000 | 3,667,000 | 3,751,084 | 3,751,084 | ||||||||
FirstEnergy Corp., Series B, 6.45%, 11/15/2011 | 750,000 | 195,000 | 945,000 | 789,599 | 205,296 | 994,895 | ||||||
MAPCO, Inc., 7.25%, 3/1/2009 | 90,000 | 90,000 | 90,675 | 90,675 | ||||||||
Newpark Resources, Inc., Series B, 8.625%, 12/15/2007 | 220,000 | 220,000 | 226,050 | 226,050 | ||||||||
Pedernales Electric Cooperative, Series 02-A, 144A, 6.202%, 11/15/2032 | 2,255,000 | 7,330,000 | 9,585,000 | 2,261,179 | 7,350,084 | 9,611,263 | ||||||
Pemex Project Funding Master Trust: | ||||||||||||
6.125%, 8/15/2008 | 287,000 | 287,000 | 298,480 | 298,480 | ||||||||
8.5%, 2/15/2008 | 1,145,000 | 1,145,000 | 1,282,400 | 1,282,400 | ||||||||
Pioneer Natural Resources Co., 9.625%, 4/1/2010 | 145,000 | 145,000 | 179,658 | 179,658 | ||||||||
Southern Natural Gas, 8.875%, 3/15/2010 | 220,000 | 220,000 | 243,100 | 243,100 | ||||||||
Stone Energy Corp., 8.25%, 12/15/2011 | 195,000 | 195,000 | 210,600 | 210,600 | ||||||||
Tristate Generation & Trans Association: | ||||||||||||
144A, 6.04%, 1/31/2018 | 4,000,000 | 4,000,000 | 4,040,120 | 4,040,120 | ||||||||
144A, 7.144%, 7/31/2033 | 3,740,000 | 3,740,000 | 3,894,948 | 3,894,948 | ||||||||
Westport Resources Corp., 8.25%, 11/1/2011 | 125,000 | 125,000 | 140,313 | 140,313 | ||||||||
Williams Cos., Inc.: | ||||||||||||
144A, 6.75%, 4/15/2009 | 55,000 | 55,000 | 54,450 | 54,450 | ||||||||
8.75%, 3/15/2032 | 200,000 | 200,000 | 204,000 | 204,000 | ||||||||
XTO Energy, Inc., 4.9%, 2/1/2014 | 1,652,000 | 3,874,000 | 5,526,000 | 1,587,496 | 3,722,736 | 5,310,232 | ||||||
| 6,219,154 | 25,377,739 | 31,596,893 | ||||||||||
Financials 3.2% | ||||||||||||
Ahold Finance USA, Inc., 6.25%, 5/1/2009 | 330,000 | 330,000 | 333,712 | 333,712 | ||||||||
American General, 144A, 8.125%, 3/15/2046 | 1,235,000 | 1,235,000 | 1,532,636 | 1,532,636 | ||||||||
American General Finance Corp., 4.0%, 3/15/2011 | 2,060,000 | 6,320,000 | 8,380,000 | 1,965,977 | 6,031,543 | 7,997,520 | ||||||
AmeriCredit Corp., 9.25%, 5/1/2009 | 290,000 | 290,000 | 308,850 | 308,850 | ||||||||
ASIF Global Finance, 144A, 4.9%, 1/17/2013 | 1,250,000 | 1,250,000 | 1,231,956 | 1,231,956 | ||||||||
BF Saul REIT, 144A, 7.5%, 3/1/2014 | 205,000 | 205,000 | 205,512 | 205,512 | ||||||||
Capital One Bank, 5.125%, 2/15/2014 | 650,000 | 1,795,000 | 2,445,000 | 621,762 | 1,717,020 | 2,338,782 | ||||||
CB Richard Ellis Services, Inc., 9.75%, 5/15/2010 | 120,000 | 120,000 | 133,800 | 133,800 |
S-5
Table of Contents
| Balanced Par/Share Amount | Total Return Par/Share Amount | Combined Pro Forma Par/Share Amount | Balanced Market Value ($) | Total Return Market Value ($) | Combined Pro Forma Market Value ($) | |||||||
Consolidated Communications Holdings, 144A, 9.75%, 4/1/2012 | 100,000 | 100,000 | 103,000 | 103,000 | ||||||||
Dollar Financial Group, Inc., 9.75%, 11/15/2011 | 105,000 | 105,000 | 112,875 | 112,875 | ||||||||
Farmers Insurance Exchange, 144A, 8.625%, 5/1/2024 | 305,000 | 305,000 | 344,986 | 344,986 | ||||||||
Ford Motor Credit Co.: | ||||||||||||
5.8%, 1/12/2009 | 1,145,000 | 2,585,000 | 3,730,000 | 1,166,200 | 2,632,861 | 3,799,061 | ||||||
6.875%, 2/1/2006 | 2,501,000 | 8,379,000 | 10,880,000 | 2,647,248 | 8,868,971 | 11,516,219 | ||||||
General Motors Acceptance Corp.: | ||||||||||||
4.5%, 7/15/2006 | 3,035,000 | 5,720,000 | 8,755,000 | 3,100,753 | 5,843,924 | 8,944,677 | ||||||
6.125%, 9/15/2006 | 1,510,000 | 1,510,000 | 1,593,526 | 1,593,526 | ||||||||
6.75%, 1/15/2006 | 2,409,000 | 4,460,000 | 6,869,000 | 2,550,902 | 4,722,716 | 7,273,618 | ||||||
6.875%, 9/15/2011 | 740,000 | 4,145,000 | 4,885,000 | 776,712 | 4,350,638 | 5,127,350 | ||||||
Goldman Sachs Group, Inc.: | ||||||||||||
5.15%, 1/15/2014 | 1,740,000 | 3,100,000 | 4,840,000 | 1,693,342 | 3,016,873 | 4,710,215 | ||||||
6.345%, 2/15/2034 | 725,000 | 2,075,000 | 2,800,000 | 692,983 | 1,983,364 | 2,676,347 | ||||||
HSBC Bank USA, 4.625%, 4/1/2014 | 1,430,000 | 4,635,000 | 6,065,000 | 1,351,745 | 4,381,354 | 5,733,099 | ||||||
IOS Capital LLC, 7.25%, 6/30/2008 | 18,000 | 18,000 | 19,193 | 19,193 | ||||||||
iStar Financial, Inc., 6.0%, 12/15/2010 | 90,000 | 90,000 | 90,383 | 90,383 | ||||||||
OneAmerica Financial Partners, 144A, 7.0%, 10/15/2033 | 1,050,000 | 2,925,000 | 3,975,000 | 1,046,043 | 2,913,976 | 3,960,019 | ||||||
PLC Trust, 144A, 2.709%, 3/31/2006 | 1,802,372 | 1,802,372 | 1,811,510 | 1,811,510 | ||||||||
Poster Financial Group, 144A, 8.75%, 12/1/2011 | 205,000 | 205,000 | 215,250 | 215,250 | ||||||||
Protective Life Secured Trs Secured, 4.0%, 4/1/2011 | 1,510,000 | 1,510,000 | 1,456,149 | 1,456,149 | ||||||||
PXRE Capital Trust I, 8.85%, 2/1/2027 | 125,000 | 125,000 | 126,563 | 126,563 | ||||||||
R.H. Donnelly Finance Corp., 10.875%, 12/15/2012 | 245,000 | 245,000 | 291,550 | 291,550 | ||||||||
RAM Holdings Ltd., 144A, 6.875%, 4/1/2024 | 1,495,000 | 1,500,000 | 2,995,000 | 1,390,030 | 1,394,679 | 2,784,709 | ||||||
Republic New York Corp., 5.875%, 10/15/2008 | 3,125,000 | 3,125,000 | 3,328,109 | 3,328,109 | ||||||||
Thornburg Mortgage, Inc., 8.0%, 5/15/2013 | 165,000 | 165,000 | 169,537 | 169,537 | ||||||||
Universal City Development, 11.75%, 4/1/2010 | 245,000 | 245,000 | 282,975 | 282,975 | ||||||||
Verizon Global Funding Corp., 7.25%, 12/1/2010 | 1,800,000 | 5,395,000 | 7,195,000 | 2,034,936 | 6,099,155 | 8,134,091 | ||||||
WMC Finance Co., 144A, 11.75%, 12/15/2008 | 135,000 | 135,000 | 166,725 | 166,725 | ||||||||
| 27,432,454 | 61,422,050 | 88,854,504 | ||||||||||
Health Care 0.1% | ||||||||||||
AmerisourceBergen Corp., 7.25%, 11/15/2012 | 210,000 | 210,000 | 223,650 | 223,650 | ||||||||
Biovail Corp., 7.875%, 4/1/2010 | 285,000 | 285,000 | 280,012 | 280,012 | ||||||||
Curative Health Services, Inc., 144A, 10.75%, 5/1/2011 | 70,000 | 70,000 | 70,263 | 70,263 | ||||||||
Health Care Service Corp., 144A, 7.75%, 6/15/2011 | 2,000,000 | 2,000,000 | 2,304,498 | 2,304,498 | ||||||||
Interactive Health LLC, 144A, 7.25%, 4/1/2011 | 95,000 | 95,000 | �� | 82,650 | 82,650 | |||||||
Team Health, Inc., 144A, 9.0%, 4/1/2012 | 60,000 | 60,000 | 57,600 | 57,600 | ||||||||
Tenet Healthcare Corp., 6.375%, 12/1/2011 | 755,000 | 755,000 | 658,737 | 658,737 | ||||||||
| — | 3,677,410 | 3,677,410 | ||||||||||
Industrials 0.7% | ||||||||||||
Aearo Co. I, 144A, 8.25%, 4/15/2012 | 90,000 | 90,000 | 92,250 | 92,250 | ||||||||
Allied Waste North America, Inc.: | ||||||||||||
144A, 5.75%, 2/15/2011 | 400,000 | 400,000 | 384,000 | 384,000 | ||||||||
Series B, 8.875%, 4/1/2008 | 100,000 | 100,000 | 111,000 | 111,000 | ||||||||
AMI Semiconductor, Inc., 10.75%, 2/1/2013 | 122,000 | 122,000 | 143,045 | 143,045 | ||||||||
Amsted Industries, Inc., 144A, 10.25%, 10/15/2011 | 50,000 | 50,000 | 56,500 | 56,500 | ||||||||
BAE System 2001 Asset Trust, “B”, Series B 2001, 144A, 7.156%, 12/15/2011 | 1,004,921 | 1,945,601 | 2,950,522 | 1,085,234 | 2,101,093 | 3,186,327 | ||||||
Browning-Ferris Industries: | ||||||||||||
7.4%, 9/15/2035 | 275,000 | 275,000 | 254,375 | 254,375 | ||||||||
9.25%, 5/1/202 | 65,000 | 65,000 | 71,825 | 71,825 | ||||||||
CHC Helicopter Corp., 144A, 7.375%, 5/1/2014 | 105,000 | 105,000 | 106,312 | 106,312 | ||||||||
Collins & Aikman Floor Cover, Series B, 9.75%, 2/15/2010 | 280,000 | 280,000 | 296,800 | 296,800 | ||||||||
Collins & Aikman Products, 10.75%, 12/31/2011 | 225,000 | 225,000 | 232,875 | 232,875 | ||||||||
Corrections Corp. of America, 9.875%, 5/1/2009 | 210,000 | 210,000 | 236,775 | 236,775 |
S-6
Table of Contents
| Balanced Par/Share Amount | Total Return Par/Share Amount | Combined Pro Forma Par/Share Amount | Balanced Market Value ($) | Total Return Market Value ($) | Combined Pro Forma Market Value ($) | |||||||
CP Ships Ltd., 10.375%, 7/15/2012 | 210,000 | 210,000 | 243,600 | 243,600 | ||||||||
Dana Corp.: | ||||||||||||
7.0%, 3/1/2029 | 330,000 | 330,000 | 316,800 | 316,800 | ||||||||
9.0%, 8/15/2011 | 150,000 | 150,000 | 177,000 | 177,000 | ||||||||
Delta Air Lines, Inc., Series 02-1, 6.417%, 7/2/2012 | 5,620,000 | 5,620,000 | 5,802,635 | 5,802,635 | ||||||||
Eagle-Pitcher, Inc., 9.75%, 9/1/2013 | 160,000 | 160,000 | 175,200 | 175,200 | ||||||||
Erico International Corp., 144A, 8.875%, 3/1/2012 | 100,000 | 100,000 | 103,500 | 103,500 | ||||||||
Golden State Petroleum Transportation, 8.04%, 2/1/2019 | 120,000 | 120,000 | 118,991 | 118,991 | ||||||||
Hercules, Inc.: | ||||||||||||
144A, 6.75%, 10/15/2029 | 20,000 | 20,000 | 19,800 | 19,800 | ||||||||
11.125%, 11/15/2007 | 335,000 | 335,000 | 402,000 | 402,000 | ||||||||
Hornbeck Offshore Services, Inc., 10.625%, 8/1/2008 | 220,000 | 220,000 | 241,450 | 241,450 | ||||||||
ISP Chemco, Inc., Series B, 10.25%, 7/1/2011 | 185,000 | 185,000 | 209,050 | 209,050 | ||||||||
ISP Holdings, Inc., Series B, 10.625%, 12/15/2009 | 85,000 | 85,000 | 94,350 | 94,350 | ||||||||
Kansas City Southern: | ||||||||||||
7.5%, 6/15/2009 | 50,000 | 50,000 | 51,500 | 51,500 | ||||||||
9.5%, 10/1/2008 | 330,000 | 330,000 | 365,475 | 365,475 | ||||||||
MemberWorks, Inc., 144A, 9.25%, 4/1/2014 | 40,000 | 40,000 | 39,900 | 39,900 | ||||||||
Meritage Corp., 144A, 7.0%, 5/1/2014 | 150,000 | 150,000 | 145,500 | 145,500 | ||||||||
Millennium America, Inc.: | ||||||||||||
7.625%, 11/15/2026 | 170,000 | 170,000 | 153,000 | 153,000 | ||||||||
9.25%, 6/15/2008 | 390,000 | 390,000 | 425,100 | 425,100 | ||||||||
144A, 9.25%, 6/15/2008 | 140,000 | 140,000 | 152,600 | 152,600 | ||||||||
Mobile Mini, Inc., 9.5%, 7/1/2013 | 170,000 | 170,000 | 190,400 | 190,400 | ||||||||
Plainwell, Inc., Series B, 11.0%, 3/1/2008 | 4,230,000 | 4,230,000 | 253,800 | 253,800 | ||||||||
Ply Gem Industries, Inc., 144A, 9.0%, 2/15/2012 | 95,000 | 95,000 | 97,375 | 97,375 | ||||||||
Sea Containers Ltd., 10.5%, 5/15/2012 | 105,000 | 105,000 | 103,163 | 103,163 | ||||||||
Seabulk International, Inc., 9.5%, 8/15/2013 | 165,000 | 165,000 | 171,600 | 171,600 | ||||||||
Ship Finance International Ltd., 144A, 8.5%, 12/15/2013 | 240,000 | 240,000 | 231,600 | 231,600 | ||||||||
Systems 2001 Asset Trust LLC, “G”, Series 2001, 144A, 6.664%, 9/15/2013 | 1,494,840 | 1,494,840 | 1,630,826 | 1,630,826 | ||||||||
Tech Olympic USA, Inc.: | ||||||||||||
144A, 7.5%, 3/15/2011 | 150,000 | 150,000 | 144,000 | 144,000 | ||||||||
10.375%, 7/1/2012 | 100,000 | 100,000 | 110,000 | 110,000 | ||||||||
The Brickman Group, Ltd., Series B, 11.75%, 12/15/2009 | 120,000 | 120,000 | 138,600 | 138,600 | ||||||||
Westlake Chemical Corp., 8.75%, 7/15/2011 | 125,000 | 125,000 | 137,187 | 137,187 | ||||||||
| 1,085,234 | 16,532,852 | 17,618,086 | ||||||||||
Information Technology 0.0% | ||||||||||||
Activant Solutions, Inc., 10.5%, 6/15/2011 | 135,000 | 135,000 | 140,062 | 140,062 | ||||||||
Communications & Powers Industry, Inc., 144A, 8.0%, 2/1/2012 | 105,000 | 105,000 | 107,100 | 107,100 | ||||||||
DigitalNet, Inc., 9.0%, 7/15/2010 | 132,000 | 132,000 | 141,900 | 141,900 | ||||||||
Mediacom Broadband LLC, 11.0%, 7/15/2013 | 50,000 | 50,000 | 53,500 | 53,500 | ||||||||
Telex Communications, Inc., 144A, 11.5%, 10/15/2008 | 60,000 | 60,000 | 64,200 | 64,200 | ||||||||
| — | 506,762 | 506,762 | ||||||||||
Materials 0.5% | ||||||||||||
American Rock Salt Co. LLC, 144A, 9.5%, 3/15/2014 | 95,000 | 95,000 | 98,563 | 98,563 | ||||||||
ARCO Chemical Co., 9.8%, 2/1/2020 | 525,000 | 525,000 | 522,375 | 522,375 | ||||||||
Caraustar Industries, Inc., 9.875%, 4/1/2011 | 145,000 | 145,000 | 147,900 | 147,900 | ||||||||
Dayton Superior Corp., 10.75%, 9/15/2008 | 115,000 | 115,000 | 115,000 | 115,000 | ||||||||
Dow Chemical Co., 7.0%, 8/15/2005 | 6,450,000 | 6,450,000 | 6,825,667 | 6,825,667 | ||||||||
Equistar Chemicals LP: | ||||||||||||
8.75%, 2/15/2009 | 385,000 | 385,000 | 405,212 | 405,212 | ||||||||
10.625%, 5/1/2011 | 30,000 | 30,000 | 33,600 | 33,600 | ||||||||
Euramax International, Inc., 8.5%, 8/15/2011 | 170,000 | 170,000 | 180,200 | 180,200 | ||||||||
Georgia-Pacific Corp.: | ||||||||||||
144A, 8.0%, 1/15/2024 | 895,000 | 895,000 | 939,750 | 939,750 | ||||||||
9.375%, 2/1/2013 | 280,000 | 280,000 | 325,500 | 325,500 | ||||||||
Huntsman Advanced Materials LLC, 144A, 11.0%, 7/15/2010 | 155,000 | 155,000 | 175,925 | 175,925 |
S-7
Table of Contents
| Balanced Par/Share Amount | Total Return Par/Share Amount | Combined Pro Forma Par/Share Amount | Balanced Market Value ($) | Total Return Market Value ($) | Combined Pro Forma Market Value ($) | |||||||
Huntsman International LLC, 11.625%, 10/15/2010 | 125,000 | 125,000 | 137,500 | 137,500 | ||||||||
IMC Global, Inc., 10.875%, 8/1/2013 | 205,000 | 205,000 | 251,638 | 251,638 | ||||||||
International Steel Group, Inc., 144A, 6.5%, 4/15/2014 | 300,000 | 300,000 | 288,000 | 288,000 | ||||||||
Mueller Group Inc., 144A, 5.919%, 11/1/2011 | 60,000 | 60,000 | 61,650 | 61,650 | ||||||||
Omnova Solutions, Inc., 11.25%, 6/1/2010 | 60,000 | 60,000 | 66,000 | 66,000 | ||||||||
Owens-Brockway Glass Container, 8.25%, 5/15/2013 | 300,000 | 300,000 | 309,750 | 309,750 | ||||||||
Pliant Corp.: | ||||||||||||
144A, 11.125%, 6/15/2009 | 95,000 | 95,000 | 79,325 | 79,325 | ||||||||
11.125%, 9/1/2009 | 95,000 | 95,000 | 101,175 | 101,175 | ||||||||
TriMas Corp., 9.875%, 6/15/2012 | 285,000 | 285,000 | 307,800 | 307,800 | ||||||||
United States Steel LLC, 9.75%, 5/15/2010 | 154,000 | 154,000 | 174,405 | 174,405 | ||||||||
Valmont Industries, Inc., 144A, 6.875%, 5/1/2014 | 65,000 | 65,000 | 65,055 | 65,055 | ||||||||
Weyerhaeuser Co., 7.375%, 3/15/2032 | 2,690,000 | 2,690,000 | 2,946,946 | 2,946,946 | ||||||||
| — | 14,558,936 | 14,558,936 | ||||||||||
Telecommunication Services 0.3% | ||||||||||||
American Cellular Corp., Series B, 10.0%, 8/1/2011 | 395,000 | 395,000 | 381,175 | 381,175 | ||||||||
Bell Atlantic New Jersey, Inc., 7.85%, 11/15/2029 | 259,000 | 877,000 | 1,136,000 | 299,334 | 1,013,575 | 1,312,909 | ||||||
Cincinnati Bell, Inc., 8.375%, 1/15/2014 | 455,000 | 455,000 | 429,975 | 429,975 | ||||||||
GCI, Inc., 144A, 7.25%, 2/15/2014 | 145,000 | 145,000 | 140,650 | 140,650 | ||||||||
Insight Midwest LP: | ||||||||||||
9.75%, 10/1/2009 | 35,000 | 35,000 | 36,925 | 36,925 | ||||||||
10.5%, 11/1/201 | 55,000 | 55,000 | 59,950 | 59,950 | ||||||||
144A, 10.5%, 11/1/2010 | 155,000 | 155,000 | 168,950 | 168,950 | ||||||||
MCI, Inc.: | ||||||||||||
6.688%, 5/1/2009 | 145,000 | 145,000 | 137,750 | 137,750 | ||||||||
7.735%, 5/1/2014 | 750,000 | 750,000 | 695,625 | 695,625 | ||||||||
Nextel Communications, Inc., 5.95%, 3/15/2014 | 90,000 | 90,000 | 84,600 | 84,600 | ||||||||
Nortel Networks Corp., 7.4%, 6/15/2006 | 135,000 | 135,000 | 135,675 | 135,675 | ||||||||
Northern Telecom Capital, 7.875%, 6/15/2026 | 405,000 | 405,000 | 384,750 | 384,750 | ||||||||
Qwest Corp.: | ||||||||||||
5.625%, 11/15/2008 | 1,085,000 | 1,085,000 | 1,052,450 | 1,052,450 | ||||||||
7.25%, 9/15/2025 | 35,000 | 35,000 | �� | 30,450 | 30,450 | |||||||
Telecomunicaciones de Puerto Rico, Inc., 6.65%, 5/15/2006 | 2,965,000 | 2,965,000 | 3,158,843 | 3,158,843 | ||||||||
Triton PCS, Inc., 8.5%, 6/1/2013 | 75,000 | 75,000 | 78,000 | 78,000 | ||||||||
| 299,334 | 7,989,343 | 8,288,677 | ||||||||||
Utilities 2.4% | ||||||||||||
Alabama Power Co., 7.125%, 8/15/2004 | 3,200,000 | 3,500,000 | 6,700,000 | 3,251,334 | 3,556,147 | 6,807,481 | ||||||
Appalachian Power Co., 4.8%, 6/15/2005 | 8,730,000 | 8,730,000 | 8,964,470 | 8,964,470 | ||||||||
Centerior Energy Corp., Series B, 7.13%, 7/1/2007 | 1,985,000 | 1,985,000 | 2,188,818 | 2,188,818 | ||||||||
Cleveland Electric Illuminating Co., 144A, 5.65%, 12/15/2013 | 1,080,000 | 3,655,000 | 4,735,000 | 1,065,695 | 3,606,590 | 4,672,285 | ||||||
CMS Energy Corp.: | ||||||||||||
7.5%, 1/15/2009 | 290,000 | 290,000 | 292,175 | 292,175 | ||||||||
144A, 7.75%, 8/1/2010 | 90,000 | 90,000 | 90,900 | 90,900 | ||||||||
8.5%, 4/15/2011 | 75,000 | 75,000 | 78,563 | 78,563 | ||||||||
Consumers Energy Co., 6.0%, 3/15/2005 | 3,925,000 | 3,925,000 | 4,034,362 | 4,034,362 | ||||||||
Consumers Energy Co., Series F, 4.0%, 5/15/2010 | 1,820,000 | 1,820,000 | 1,727,897 | 1,727,897 | ||||||||
DPL, Inc.: | ||||||||||||
6.875%, 9/1/2011 | 300,000 | 300,000 | 295,500 | 295,500 | ||||||||
8.125%, 9/1/2031 | 125,000 | 125,000 | 115,625 | 115,625 | ||||||||
Illinova Corp., 11.5%, 12/15/2010 | 330,000 | �� | 330,000 | 391,050 | 391,050 | |||||||
Indiana Michigan Power, 6.375%, 11/1/2012 | 5,040,000 | 5,040,000 | 5,423,982 | 5,423,982 | ||||||||
Metropolitan Edison Co., 144A, 4.875%, 4/1/2014 | 4,975,000 | 4,975,000 | 4,692,146 | 4,692,146 | ||||||||
NRG Energy, Inc., 144A, 8.0%, 12/15/2013 | 585,000 | 585,000 | 589,388 | 589,388 | ||||||||
Pacific Gas & Electric Co., 6.05%, 3/1/2034 | 1,958,000 | 5,467,000 | 7,425,000 | 1,851,683 | 5,170,147 | 7,021,830 | ||||||
PG&E Corp., 144A, 6.875%, 7/15/2008 | 235,000 | 235,000 | 250,275 | 250,275 | ||||||||
Progress Energy, Inc., 6.75%, 3/1/2006 | 8,975,000 | 8,975,000 | 9,588,468 | 9,588,468 | ||||||||
Public Service Co. of Oklahoma, Series C, 4.85%, 9/15/2010 | 1,230,000 | 1,230,000 | 1,236,481 | 1,236,481 |
S-8
Table of Contents
| Balanced Par/Share Amount | Total Return Par/Share Amount | Combined Pro Forma Par/Share Amount | Balanced Market Value ($) | Total Return Market Value ($) | Combined Pro Forma Market Value ($) | |||||||
TNP Enterprises, Inc., Series B, 10.25%, 4/1/2010 | 185,000 | 185,000 | 202,113 | 202,113 | ||||||||
Xcel Energy, Inc., 7.0%, 12/1/2010 | 1,345,000 | 3,685,000 | 5,030,000 | 1,507,153 | 4,129,264 | 5,636,417 | ||||||
| 12,829,061 | 51,471,165 | 64,300,226 | ||||||||||
Total Corporate Bonds (Cost $52,614,936, $199,020,954 and $251,635,890, respectively) | 52,005,977 | 197,659,022 | 249,664,999 | |||||||||
Foreign Bonds-US$ Denominated 3.3% | ||||||||||||
Alcan, Inc., 6.125%, 12/15/2033 | 991,000 | 5,095,000 | 6,086,000 | 972,984 | 5,002,373 | 5,975,357 | ||||||
Alestra SA de RL de CV, 8.0%, 6/30/2010 | 260,000 | 260,000 | 223,600 | 223,600 | ||||||||
Antenna TV SA, 9.0%, 8/1/2007 | 85,000 | 85,000 | 85,956 | 85,956 | ||||||||
Arcel Finance Ltd., 144A, 7.048%, 9/1/2011 | 870,000 | 2,505,000 | 3,375,000 | 878,700 | 2,530,050 | 3,408,750 | ||||||
Autopista Del Maipo, 144A, 7.373%, 6/15/2022 | 6,805,000 | 6,805,000 | 7,564,234 | 7,564,234 | ||||||||
Axtel SA, 144A, 11.0%, 12/15/2013 | 225,000 | 225,000 | 223,875 | 223,875 | ||||||||
Brazilian Merchant Voucher, 144A, 5.911%, 6/15/2011 | 1,000,000 | 1,000,000 | 967,500 | 967,500 | ||||||||
Cascades, Inc., 7.25%, 2/15/2013 | 240,000 | 240,000 | 250,200 | 250,200 | ||||||||
Citigroup (JSC Severstal), 144A, 9.25%, 4/19/2014 | 175,000 | 175,000 | 161,000 | 161,000 | ||||||||
Conproca SA de CV, 144A, 12.0%, 6/16/2010 | 240,000 | 240,000 | 302,400 | 302,400 | ||||||||
Crown Euro Holdings SA, 10.875%, 3/1/2013 | 180,000 | 180,000 | 209,700 | 209,700 | ||||||||
Deutsche Telekom International Finance BV: | ||||||||||||
8.0%, 6/15/2010 | 245,000 | 245,000 | 289,486 | 289,486 | ||||||||
8.25%, 6/15/2030 | 1,034,000 | 3,683,000 | 4,717,000 | 1,284,315 | 4,574,595 | 5,858,910 | ||||||
Eircom Funding, 8.25%, 8/15/2013 | 190,000 | 190,000 | 205,200 | 205,200 | ||||||||
Empresa Brasileira de Telecom SA, 144A, 11.0%, 12/15/2008 | 190,000 | 190,000 | 201,400 | 201,400 | ||||||||
Esprit Telecom Group PLC, 11.5%, 12/15/2007 | 2,370,000 | 2,370,000 | 237 | 237 | ||||||||
Fage Dairy Industry SA, 9.0%, 2/1/2007 | 685,000 | 685,000 | 695,275 | 695,275 | ||||||||
Federative Republic of Brazil: | ||||||||||||
C Bond, 8.0%, 4/15/2014 | 67,728 | 67,728 | 62,174 | 62,174 | ||||||||
8.875%, 4/15/2024 | 325,000 | 325,000 | 260,975 | 260,975 | ||||||||
Gazprom OAO, 144A, 9.625%, 3/1/2013 | 290,000 | 290,000 | 297,975 | 297,975 | ||||||||
HSBC Capital Funding LP, 4.61%, 12/29/2049 | 1,840,000 | 1,840,000 | 1,696,005 | 1,696,005 | ||||||||
Hutchison Whampoa International Ltd., 144A, 5.45%, 11/24/2010 | 820,000 | 820,000 | 808,627 | 808,627 | ||||||||
Inmarsat Finance PLC, 144A, 7.625%, 6/30/2012 | 235,000 | 235,000 | 239,700 | 239,700 | ||||||||
Innova S. de R.L., 9.375%, 9/19/2013 | 255,000 | 255,000 | 276,994 | 276,994 | ||||||||
Inversiones CMPC SA, 144A, 4.875%, 6/18/2013 | 1,785,000 | 4,820,000 | 6,605,000 | 1,669,220 | 4,507,360 | 6,176,580 | ||||||
Jefra Cosmetics International, Inc., 10.75%, 5/15/2011 | 195,000 | 195,000 | 220,838 | 220,838 | ||||||||
LeGrand SA, 8.5%, 2/15/2025 | 180,000 | 180,000 | 189,675 | 189,675 | ||||||||
Luscar Coal Ltd., 9.75%, 10/15/2011 | 195,000 | 195,000 | 221,325 | 221,325 | ||||||||
Mantis Reef Ltd., 144A, 4.692%, 11/14/2008 | 3,135,000 | 8,580,000 | 11,715,000 | 3,119,573 | 8,537,778 | 11,657,351 | ||||||
Millicom International Cellular SA, 144A, 10.0%, 12/1/2013 | 225,000 | 225,000 | 230,625 | 230,625 | ||||||||
Mizuho Financial Group, 8.375%, 12/29/2049 | 820,000 | 2,865,000 | 3,685,000 | 864,280 | 3,019,710 | 3,883,990 | ||||||
Mizuho Financial Group Ltd., 144A, 5.79%, 4/15/2014 | 919,000 | 919,000 | 911,299 | 911,299 | ||||||||
Mobile Telesystems Financial, 144A, 8.375%, 10/14/2010 | 200,000 | 200,000 | 193,000 | 193,000 | ||||||||
New ASAT (Finance) Ltd., 144A, 9.25%, 2/1/2011 | 180,000 | 180,000 | 189,900 | 189,900 | ||||||||
Nortel Networks Corp., 6.875%, 9/1/2023 | 20,000 | 20,000 | 17,900 | 17,900 | ||||||||
Nortel Networks Ltd., 6.125%, 2/15/2006 | 220,000 | 220,000 | 217,525 | 217,525 | ||||||||
PacifiCorp Australia LLC, 144A, 6.15%, 1/15/2008 | 525,000 | 525,000 | 559,399 | 559,399 | ||||||||
Petroleos Mexicanos S.A., 8.85%, 9/15/2007 | 1,295,000 | 1,295,000 | 1,463,350 | 1,463,350 | ||||||||
Petroleos Mexicanos, 9.5%, 9/15/2027 | 4,510,000 | 4,510,000 | 5,276,700 | 5,276,700 | ||||||||
Petroleum Geo-Services ASA: | ||||||||||||
8.0%, 11/5/2006 | 25,000 | 25,000 | 25,563 | 25,563 | ||||||||
10.0%, 11/5/2010 | 437,005 | 437,005 | 476,335 | 476,335 | ||||||||
QBE Insurance Group Ltd., 144A, 5.647%, 7/1/2023 | 1,255,000 | 3,600,000 | 4,855,000 | 1,202,640 | 3,449,804 | 4,652,444 | ||||||
Republic of Turkey, 11.0%, 1/14/2013 | 80,000 | 80,000 | 92,800 | 92,800 | ||||||||
Rogers Wireless Communications, Inc., 144A, 6.375%, 3/1/2014 | 130,000 | 130,000 | 122,200 | 122,200 | ||||||||
Royal Bank of Scotland Group PLC, Series 3, 7.816%, 11/29/2049 | 2,675,000 | 2,675,000 | 2,890,255 | 2,890,255 |
S-9
Table of Contents
| Balanced Par/Share Amount | Total Return Par/Share Amount | Combined Pro Forma Par/Share Amount | Balanced Market Value ($) | Total Return Market Value ($) | Combined Pro Forma Market Value ($) | |||||||
Sappi Papier Holding AG, 144A, 6.75%, 6/15/2012 | 2,445,000 | 2,445,000 | 2,642,473 | 2,642,473 | ||||||||
Shaw Communications, Inc.: | ||||||||||||
Series B, 7.25%, 4/6/2011 | 190,000 | 190,000 | 203,375 | 203,375 | ||||||||
8.25%, 4/11/2010 | 145,000 | 145,000 | 162,835 | 162,835 | ||||||||
Sistema Capital SA, 144A, 8.875%, 1/28/2011 | 150,000 | 150,000 | 147,000 | 147,000 | ||||||||
Sociedad Concesionaria Autopista Contral, 144A, 6.223%, 12/15/2026 | 2,250,000 | 2,250,000 | 2,200,388 | 2,200,388 | ||||||||
Stena AB, 9.625%, 12/1/2012 | 50,000 | 50,000 | 56,250 | 56,250 | ||||||||
Tembec Industries, Inc., 8.5%, 2/1/2011 | 485,000 | 485,000 | 494,700 | 494,700 | ||||||||
TFM SA de CV: | ||||||||||||
Step-up Coupon, 11.75%, 6/15/2009 | 110,000 | 110,000 | 109,175 | 109,175 | ||||||||
10.25%, 6/15/2007 | 395,000 | 395,000 | 410,800 | 410,800 | ||||||||
12.5%, 6/15/2012 | 165,000 | 165,000 | 183,975 | 183,975 | ||||||||
Tyco International Group SA: | ||||||||||||
5.8%, 8/1/2006 | 1,520,000 | 5,025,000 | 6,545,000 | 1,594,675 | 5,271,868 | 6,866,543 | ||||||
144A, 6.0%, 11/15/2013 | 69,000 | 37,000 | 106,000 | 69,947 | 37,508 | 107,455 | ||||||
6.375%, 2/15/2006 | 1,395,000 | 3,810,000 | 5,205,000 | 1,469,695 | 4,014,006 | 5,483,701 | ||||||
6.75%, 2/15/2011 | 324,000 | 178,000 | 502,000 | 349,414 | 191,962 | 541,376 | ||||||
United Mexican States, 5.875%, 1/15/2014 | 40,000 | 40,000 | 38,720 | 38,720 | ||||||||
Vicap SA, 11.375%, 5/15/2007 | 105,000 | 105,000 | 106,050 | 106,050 | ||||||||
Vitro SA de CV, Series A, 144A, 11.75%, 11/1/2013 | 215,000 | 215,000 | 203,175 | 203,175 | ||||||||
Vivendi Universal SA, Series B, 9.25%, 4/15/2010 | 365,000 | 365,000 | 426,138 | 426,138 | ||||||||
Total Foreign Bonds - US$ Denominated (Cost $25,357,657, $68,041,449 and $93,399,106, respectively) | 25,013,970 | 65,304,743 | 90,318,713 | |||||||||
Asset Backed 2.4% | ||||||||||||
Automobile Receivables 0.9% | ||||||||||||
Chase Manhattan Auto Owner Trust, “A4”, Series 2003-B, 2.57%, 2/16/2010 | 2,490,000 | 2,490,000 | 2,452,825 | 2,452,825 | ||||||||
MMCA Automobile Trust: | ||||||||||||
A4, Series 2002-3, 3.57%, 8/17/2009 | 690,000 | 6,595,000 | 7,285,000 | 697,169 | 6,663,523 | 7,360,692 | ||||||
B, Series 2002-2, 4.67%, 3/15/2010 | 872,580 | 9,457,956 | 10,330,536 | 873,072 | 9,367,089 | 10,240,161 | ||||||
C, Series 2002-2, 5.55%, 3/15/2010 | 2,595,562 | 3,165,228 | 5,760,790 | 2,170,679 | 2,647,093 | 4,817,772 | ||||||
| 6,193,745 | 18,677,705 | 24,871,450 | ||||||||||
Credit Card Receivables 0.2% | ||||||||||||
MBNA Credit Card Master Note Trust: | ||||||||||||
A2, Series 2004-A2, 1.24%, 7/15/2013 | 610,000 | 1,745,000 | 2,355,000 | 609,999 | 1,744,998 | 2,354,997 | ||||||
2.7%, 9/15/2009 | 3,070,000 | 3,070,000 | 3,023,843 | 3,023,843 | ||||||||
| 3,633,842 | 1,744,998 | 5,378,840 | ||||||||||
Home Equity Loans 1.3% | ||||||||||||
Advanta Mortgage Loan Trust, “A6”, Series 2000-2, 7.72%, 3/25/2015 | 1,421,111 | 1,421,111 | 1,524,914 | 1,524,914 | ||||||||
Centex Home Equity: | ||||||||||||
A6, Series 2000-B, 7.97%, 7/25/2031 | 2,120,663 | 2,120,663 | 2,248,460 | 2,248,460 | ||||||||
AF6, Series 2002-D, 4.66%, 12/25/2032 | 6,430,000 | 6,430,000 | 6,555,318 | 6,555,318 | ||||||||
AF6, Series 2002-A, 5.54%, 1/25/2032 | 6,090,000 | 6,090,000 | 6,366,566 | 6,366,566 | ||||||||
Chase Funding Mortgage Loan Trust, “IA5”, Series 1999-2, 7.333%, 11/25/2011 | 4,022,597 | 4,022,597 | 4,169,668 | 4,169,668 | ||||||||
Equity One ABS, Inc., “AF3”, Series 2004-1, 3.054%, 4/25/2034 | 1,280,000 | 3,740,000 | 5,020,000 | 1,273,938 | 3,722,288 | 4,996,226 | ||||||
Long Beach Mortgage Loan Trust: | ||||||||||||
A3, Series 2004-1, 1.4%, 2/25/2034 | 1,840,326 | 5,281,974 | 7,122,300 | 1,843,285 | 5,290,469 | 7,133,754 | ||||||
M3, Series 2001-4, 3.85%, 3/25/2032 | 350,000 | 350,000 | 353,699 | 353,699 | ||||||||
Novastar NIM Trust, “NOTE”, Series 2004-N1, 144A, 4.458%, 2/26/2034 | 483,666 | 483,666 | 483,666 | 483,666 | ||||||||
| 7,727,962 | 26,104,309 | 33,832,271 | ||||||||||
Total Asset Backed (Cost $18,140,444, $47,240,459 and $65,380,903, respectively) | 17,555,549 | 46,527,012 | 64,082,561 | |||||||||
Convertible Bonds 0.0% | ||||||||||||
Consumer Discretionary 0.0% | ||||||||||||
Textiles, Apparel & Luxury Goods 0.1% | ||||||||||||
DIMON, Inc., 6.25%, 3/31/2007 | 140,000 | 140,000 | 130,760 | 130,760 | ||||||||
Telecommunication Services 0.0% | ||||||||||||
Diversified Telecommunication Services 0.0% | ||||||||||||
Nortel Networks Corp., 4.25%, 9/1/2008 | 95,000 | 95,000 | 89,656 | 89,656 | ||||||||
S-10
Table of Contents
| Balanced Par/Share Amount | Total Return Par/Share Amount | Combined Pro Forma Par/Share Amount | Balanced Market Value ($) | Total Return Market Value ($) | Combined Pro Forma Market Value ($) | |||||||
Total Convertible Bonds (Cost $218,796) | — | 220,416 | 220,416 | |||||||||
Warrants 0.0% | ||||||||||||
Information Technology 0.0% | ||||||||||||
Software 0.0% | 106 | 106 | 24 | 24 | ||||||||
MircoStrategy, Inc. (Cost $0) | ||||||||||||
Preferred Stock 0.4% | ||||||||||||
Industrials 0.4% | ||||||||||||
Aerospace & Defense 0.4% | ||||||||||||
Raytheon Co. | 54,600 | 156,600 | 211,200 | 2,953,521 | 8,471,089 | 11,424,610 | ||||||
Utilities 0.0% | ||||||||||||
Electric Utilities 0.0% | ||||||||||||
TNP Enterprises, Inc., “D” | 633 | 633 | 73,071 | 73,071 | ||||||||
Total Preferred Stock (Cost $2,922,981, $8,429,235 and 11,352,216, respectively) | 2,953,521 | 8,544,160 | 11,497,681 | |||||||||
Convertible Preferred Stocks 0.0% | ||||||||||||
Materials 0.0% | ||||||||||||
Chemicals 0.0% | ||||||||||||
Hercules Trust II (Cost $237,204) | 380 | 380 | 304,000 | 304,000 | ||||||||
US Government Sponsored Agencies 0.1% | ||||||||||||
Federal Home Loan Mortgage Corp.: | ||||||||||||
4.0%, 2/15/2023 | 910,000 | 910,000 | 913,019 | 913,019 | ||||||||
5.0%, 7/15/2032 | 1,783,000 | 1,783,000 | 1,722,289 | 1,722,289 | ||||||||
Total US Government Sponsored Agencies (Cost $2,672,249) | 2,635,308 | 2,635,308 | ||||||||||
US Government Agency Sponsored Pass-Throughs 3.2% | ||||||||||||
Federal Home Loan Mortgage Corp.: | ||||||||||||
2.875%, 12/15/2006 | 2,845,000 | 2,845,000 | 2,845,612 | 2,845,612 | ||||||||
4.5%, 12/1/2018 | 785,000 | 785,000 | 772,489 | 772,489 | ||||||||
5.0% with various maturities from 12/1/2017 until 12/31/2033 | 2,880,000 | 14,219,547 | 17,099,547 | 2,791,800 | 14,053,693 | 16,845,493 | ||||||
Federal National Mortgage Association: | ||||||||||||
4.0%, 5/25/2016 | 2,092,875 | 2,092,875 | 2,118,561 | 2,118,561 | ||||||||
4.5%, 12/1/2018 | 710,197 | 1,356,252 | 2,066,449 | 699,582 | 1,336,687 | 2,036,269 | ||||||
4.96%, 1/1/2015 | 3,340,665 | 3,340,665 | 3,357,129 | 3,357,129 | ||||||||
5.0% with various maturities from 1/1/2017 until 6/1/2032 | 7,867,570 | 3,536,993 | 11,404,563 | 7,716,216 | 3,561,909 | 11,278,125 | ||||||
5.5% with various maturities from 3/1/2018 until 8/1/2033 | 2,180,770 | 11,175,762 | 13,356,532 | 2,189,617 | 11,374,797 | 13,564,414 | ||||||
6.0% with various maturities from 11/1/2017 until 12/1/2033 | 2,364,079 | 6,947,492 | 9,311,571 | 2,443,091 | 7,183,783 | 9,626,874 | ||||||
6.25%, 3/1/2011 | 8,040,000 | 8,040,000 | 8,849,212 | 8,849,212 | ||||||||
6.31%, 6/1/2008 | 3,570,000 | 3,570,000 | 3,862,465 | 3,862,465 | ||||||||
6.5% with various maturities from 4/1/2017 until 11/1/2033 | 1,734,299 | 6,926,390 | 8,660,689 | 1,825,544 | 7,257,194 | 9,082,738 | ||||||
8.0%, 9/1/2015 | 484,548 | 1,542,280 | 2,026,828 | 520,871 | 1,657,893 | 2,178,764 | ||||||
Total US Government Agency Sponsored Pass-Throughs (Cost $26,993,292, $59,852,789 and $86,846,081, respectively) | 27,013,359 | 59,404,786 | 86,418,145 | |||||||||
Collateralized Mortgage Obligations and Commercial and Non-Agency Mortgage-Backed Securities 10.2% | ||||||||||||
ABN AMRO Mortgage Corp., Series 2002-3, 6.0%, 4/25/2017 | 274,295 | 274,295 | 279,011 | 279,011 | ||||||||
Bank of America Alternative Loan Trust, “2A1”, Series 2004-4, 6.0%, 5/25/2034 | 3,497,000 | 3,497,000 | 3,570,765 | 3,570,765 | ||||||||
Bank of America Mortgage Securities, “3A1”, Series 2002-1, 6.25%, 1/25/2017 | 4,450,155 | 4,450,155 | 4,478,566 | 4,478,566 | ||||||||
Chase Commercial Mortgage Securities Corp., “A1”, Series 2000-1, 7.656%, 4/15/2032 | 1,232,951 | 3,442,497 | 4,675,448 | 1,300,355 | 3,630,694 | 4,931,049 | ||||||
Countrywide Alternative Loan Trust, “1A1”, Series 2004-J1, 6.0%, 2/25/2034 | 995,419 | 2,812,801 | 3,808,220 | 1,016,534 | 2,872,466 | 3,889,000 | ||||||
CountryWide Home Loans, “A5”, Series 2002-27, 5.5%, 12/25/2032 | 5,436,431 | 5,436,431 | 5,480,048 | 5,480,048 |
S-11
Table of Contents
| Balanced Par/Share Amount | Total Return Par/Share Amount | Combined Pro Forma Par/Share Amount | Balanced Market Value ($) | Total Return Market Value ($) | Combined Pro Forma Market Value ($) | |||||||
Fannie Mae Grantor Trust, “1A3”, Series 2004-T2, 7.0%, 11/25/2043 | 1,150,000 | 3,270,000 | 4,420,000 | 1,223,810 | 3,479,878 | 4,703,688 | ||||||
Fannie Mae Whole Loan, “5A”, Series 2004-W2, 7.5%, 3/25/2044 | 2,302,526 | 6,106,358 | 8,408,884 | 2,478,094 | 6,571,967 | 9,050,061 | ||||||
Federal Home Loan Mortgage Corp.: | ||||||||||||
AU, Series 2759, 3.5%, 5/15/2019 | 1,275,000 | 3,621,000 | 4,896,000 | 1,282,672 | 3,642,788 | 4,925,460 | ||||||
MA, Series 2663, 3.5%, 8/1/2033 | 970,000 | 970,000 | 982,589 | 982,589 | ||||||||
NB, Series 2750, 4.0%, 12/15/2022 | 390,000 | 3,074,000 | 3,464,000 | 391,002 | 3,081,898 | 3,472,900 | ||||||
PB, Series 2727, 4.25%, 4/15/2023 | 7,087,500 | 7,087,500 | 7,169,341 | 7,169,341 | ||||||||
ME, Series 2691, 4.5%, 4/15/2032 | 2,661,000 | 2,661,000 | 2,490,008 | 2,490,008 | ||||||||
LC, Series 2682, 4.5%, 7/15/2032 | 5,470,000 | 5,470,000 | 5,104,423 | 5,104,423 | ||||||||
PE, Series 2727, 4.5%, 7/15/2032 | 1,345,000 | 3,720,000 | 5,065,000 | 1,255,703 | 3,473,022 | 4,728,725 | ||||||
TG, Series 2690, 4.5%, 4/15/2032 | 3,750,000 | 3,750,000 | 3,496,402 | 3,496,402 | ||||||||
HG, Series 2543, 4.75%, 9/15/2028 | 1,785,171 | 5,125,345 | 6,910,516 | 1,832,324 | 5,260,725 | 7,093,049 | ||||||
5.0%, 1/15/2033 | 9,590,000 | 9,590,000 | 9,452,144 | 9,452,144 | ||||||||
EU, Series 2494, 5.0%, 4/15/2026 | 410,126 | 410,126 | 410,153 | 410,153 | ||||||||
PE, Series 2721, 5.0%, 1/15/2023 | 940,000 | 6,928,000 | 7,868,000 | 900,495 | 6,636,840 | 7,537,335 | ||||||
QK, Series 2513, 5.0%, 8/15/2028 | 1,292,893 | 1,292,893 | 1,304,350 | 1,304,350 | ||||||||
PE, Series 2512, 5.5%, 2/15/2022 | 935,000 | 585,000 | 1,520,000 | 956,380 | 598,377 | 1,554,757 | ||||||
BD, Series 2453, 6.0%, 5/15/2017 | 360,000 | 440,000 | 800,000 | 379,321 | 463,615 | 842,936 | ||||||
PX, Series 2097, 6.0%, 10/15/2027 | 3,328,227 | 3,328,227 | 3,406,244 | 3,406,244 | ||||||||
GA, Series 2450, 6.25%, 10/15/2022 | 446,644 | 446,644 | 447,751 | 447,751 | ||||||||
DA, Series 2444, 6.5%, 2/15/2030 | 32,975 | 32,975 | 33,008 | 33,008 | ||||||||
3A, Series T-41, 7.5%, 7/25/2032 | 940,757 | 2,767,574 | 3,708,331 | 1,012,489 | 2,978,602 | 3,991,091 | ||||||
Federal National Mortgage Association: | ||||||||||||
3A2B, Series 2003-W10, 3.056%, 7/25/2037 | 1,390,000 | 1,390,000 | 1,388,047 | 1,388,047 | ||||||||
NA, Series 2003-128, 4.0%, 8/25/2009 | 2,716,000 | 9,722,000 | 12,438,000 | 2,763,250 | 9,891,132 | 12,654,382 | ||||||
PU, Series 2003-33, 4.5%, 5/25/2033 | 1,942,796 | 397,006 | 2,339,802 | 1,988,843 | 406,416 | 2,395,259 | ||||||
WB, Series 2003-106, 4.5%, 10/25/2015 | 2,020,000 | 6,085,000 | 8,105,000 | 2,069,401 | 6,233,815 | 8,303,216 | ||||||
A2, Series 2002-W10, 4.7%, 8/25/2042 | 610,319 | 1,802,404 | 2,412,723 | 616,997 | 1,822,126 | 2,439,123 | ||||||
A2, Series 2002-W9, 4.7%, 8/25/2042 | 447,143 | 1,320,510 | 1,767,653 | 451,373 | 1,333,003 | 1,784,376 | ||||||
1A5, Series 2003-W14, 4.71%, 9/25/2043 | 7,858,932 | 7,858,932 | 8,051,574 | 8,051,574 | ||||||||
2A3, Series 2003-W15, 4.71%, 8/25/2043 | 2,630,000 | 530,000 | 3,160,000 | 2,691,321 | 542,357 | 3,233,678 | ||||||
1A3, Series 2003-W18, 4.732%, 8/25/2033 | 1,350,000 | 1,350,000 | 1,378,916 | 1,378,916 | ||||||||
KY, Series 2002-55, 4.75%, 4/25/2028 | 2,543,742 | 2,543,742 | 2,555,788 | 2,555,788 | ||||||||
LA, Series 2002-50, 5.0%, 12/25/2029 | 4,697,040 | 4,697,040 | 4,783,694 | 4,783,694 | ||||||||
KH, Series 2003-92, 5.0%, 3/25/2032 | 1,420,000 | 1,420,000 | 1,373,479 | 1,373,479 | ||||||||
A2, Series 2002-W3, 5.5%, 10/25/2021 | 2,572,849 | 2,572,849 | 2,593,896 | 2,593,896 | ||||||||
MC, Series 2002-56, 5.5%, 9/25/2017 | 1,180,000 | 935,000 | 2,115,000 | 1,222,453 | 968,639 | 2,191,092 | ||||||
PE, Series 2002-3, 5.5%, 8/25/2015 | 5,050,000 | 16,234,500 | 21,284,500 | 5,250,524 | 16,879,136 | 22,129,660 | ||||||
PD, Series 2002-31, 6.0%, 11/25/2021 | 7,000,000 | 15,200,000 | 22,200,000 | 7,351,138 | 15,962,470 | 23,313,608 | ||||||
QE, Series 2001-64, 6.0%, 4/25/2027 | 1,355,116 | 1,355,116 | 1,356,032 | 1,356,032 | ||||||||
Z, Series 2001-14, 6.0%, 5/25/2031 | 1,374,371 | 1,374,371 | 1,416,412 | 1,416,412 | ||||||||
HM, Series 2002-36, 6.5%, 12/25/2029 | 227,081 | 227,081 | 233,131 | 233,131 | ||||||||
2A, Series 2003-W8, 7.0%, 10/25/2042 | 6,053,106 | 6,053,106 | 6,428,667 | 6,428,667 | ||||||||
ZQ, Series G92-9, 7.0%, 12/25/2021 | 2,461,328 | 2,461,328 | 2,580,954 | 2,580,954 | ||||||||
1A2, Series 2003-W3, 7.0%, 8/25/2042 | 977,046 | 977,046 | 1,037,403 | 1,037,403 | ||||||||
FHLMC Structured Pass Through Securities: | ||||||||||||
A2B, Series T-56, 4.29%, 7/25/2036 | 2,660,000 | 7,440,000 | 10,100,000 | 2,704,361 | 7,564,078 | 10,268,439 | ||||||
3A, Series T-58, 7.0%, 9/25/2043 | 1,219,131 | 3,521,933 | 4,741,064 | 1,288,254 | 3,721,622 | 5,009,876 | ||||||
GMAC Commercial Mortgage Securities, Inc., “A3”, Series 1997-C1, 6.869%, 7/15/2029 | 3,115,233 | 3,115,233 | 3,379,784 | 3,379,784 | ||||||||
Master Alternative Loan Trust: | ||||||||||||
7A1, Series 2004-4, 6.0%, 5/25/2034 | 355,000 | 1,065,000 | 1,420,000 | 362,322 | 1,086,966 | 1,449,288 | ||||||
2A1, Series 2004-3, 6.25%, 4/25/2034 | 7,265,000 | 7,265,000 | 7,493,628 | 7,493,628 | ||||||||
3A1, Series 2004-5, 6.5%, 5/25/2034 | 430,000 | 1,310,000 | 1,740,000 | 448,208 | 1,365,470 | 1,813,678 | ||||||
8A1, Series 2004-3, 7.0%, 4/25/2034 | 1,190,999 | 3,987,055 | 5,178,054 | 1,248,913 | 4,180,931 | 5,429,844 | ||||||
Master Asset Securitization Trust: | ||||||||||||
3A2, Series 2003-2, 4.25%, 4/25/2033 | 2,206,956 | 2,206,956 | 2,211,398 | 2,211,398 | ||||||||
8A1, Series 2003-6, 5.5%, 7/25/2033 | 1,933,159 | 1,933,159 | 1,967,958 | 1,967,958 | ||||||||
Master Seasoned Securities Trust, “2A1”, Series 2003-1, 6.0%, 2/25/2033 | 1,287,383 | 1,287,383 | 1,305,406 | 1,305,406 | ||||||||
NYC Mortgage Loan Trust, “A3”, Series 1996, 144A, 6.75%, 9/25/2019 | 4,100,000 | 4,100,000 | 4,420,169 | 4,420,169 | ||||||||
Prudential Securities Secured Financing Corp., “A1”, Series 1999-C2, 6.955%, 6/16/2031 | 861,246 | 861,246 | 918,884 | 918,884 | ||||||||
Residential Accredit Loans, Inc., “A5”, Series 2002-QS14, 5.125%, 9/25/2032 | 1,438,110 | 1,438,110 | 1,452,685 | 1,452,685 | ||||||||
Residential Funding Mortgage Securities I: | ||||||||||||
A1, Series 2003-S2, 5.0%, 2/25/2033 | 900,329 | 1,300,282 | 2,200,611 | 908,105 | 1,311,513 | 2,219,618 |
S-12
Table of Contents
| Balanced Par/Share Amount | Total Return Par/Share Amount | Combined Pro Forma Par/Share Amount | Balanced Market Value ($) | Total Return Market Value ($) | Combined Pro Forma Market Value ($) | |||||||
A5, Series 2002-S6, 6.0%, 4/25/2017 | 2,319,409 | 2,319,409 | 2,340,819 | 2,340,819 | ||||||||
Structured Asset Securities Corp., “2A1”, Series 2003-1, 6.0%, 2/25/2018 | 910,068 | 2,470,186 | 3,380,254 | 938,720 | 2,547,955 | 3,486,675 | ||||||
WAMU Mortgage Pass Through Certificates, “4A1”, Series 2004-CB1, 6.0%, 5/25/2034 | 800,000 | 800,000 | 819,875 | 819,875 | ||||||||
Washington Mutual MSC Mortgage Pass-Through, Series, “1A1”, Series 2003-MS, 5.75%, 3/25/2033 | 1,939,070 | 1,939,070 | 1,952,108 | 1,952,108 | ||||||||
Wells Fargo Mortgage Backed Securities Trust, “1A1”, Series 2003-6, 5.0%, 6/25/2018 | 2,335,658 | 2,335,658 | 2,351,830 | 2,351,830 | ||||||||
Total Collateralized Mortgage Obligations and Commercial and Non-Agency Mortgage-Backed Securities (Cost $65,635,280, $212,587,151 and $278,222,431, respectively) | 65,984,554 | 212,754,649 | 278,739,203 | |||||||||
Municipal Investments 1.6% | ||||||||||||
Bergen County, Core City Go, Improvement Authority Governmental Loan Revenue : | ||||||||||||
4.75%, 3/15/2015 | 2,105,000 | 2,105,000 | 2,018,506 | 2,018,506 | ||||||||
4.8%, 3/15/2016 | 2,315,000 | 2,315,000 | 2,213,811 | 2,213,811 | ||||||||
Charlotte-Meckelberg, NC, Hospital Authority Health Care System Revenue, ETM, 5.0%, 8/1/2015 | 3,880,000 | 3,880,000 | 3,822,615 | 3,822,615 | ||||||||
Dallas, TX, Airport Revenue, Industrial Airport Facilities, 6.6%, 11/1/2012 | 1,635,000 | 1,635,000 | 1,784,668 | 1,784,668 | ||||||||
Denver, CO, School District (REV) Lease, School District Number 01, 6.82%, 12/15/2009 | 1,600,000 | 1,600,000 | 1,801,152 | 1,801,152 | ||||||||
Hoboken, NJ, GO: | ||||||||||||
Series B, 3.57%, 2/1/2008 | 1,725,000 | 1,725,000 | 1,717,738 | 1,717,738 | ||||||||
Series B, 3.97%, 2/1/2009 | 2,860,000 | 2,860,000 | 2,835,547 | 2,835,547 | ||||||||
Hoboken, NJ, Core City GO, Series B, 3.8%, 1/1/2008 | 1,895,000 | 1,895,000 | 1,920,260 | 1,920,260 | ||||||||
Illinois, State GO, 4.95%, 6/1/2023 | 4,665,000 | 4,665,000 | 4,286,062 | 4,286,062 | ||||||||
Indian Wells, CA, Industrial Development Revenue, Redevelopment Agency, Series T, 4.48%, 9/1/2013 | 2,325,000 | 2,325,000 | 2,257,296 | 2,257,296 | ||||||||
Indiana, State GO, Series 3, 5.15%, 7/15/2013 | 2,005,000 | 2,005,000 | 2,011,396 | 2,011,396 | ||||||||
Jicarilla, NM, Sales & Special Tax Revenue, Apache Nation Revenue, 5.2%, 12/1/2013 | 2,990,000 | 2,990,000 | 2,937,675 | 2,937,675 | ||||||||
New Jersey, Water & Sewer Revenue, District Water Supply, 5.19%, 7/1/2019 | 1,000,000 | 1,000,000 | 979,670 | 979,670 | ||||||||
New York, Environmental Facilities Corp., Series B, 4.7%, 3/15/2011 | 5,350,000 | 5,350,000 | 5,330,472 | 5,330,472 | ||||||||
Oregon, School District GO,Series A, Zero Coupon, 6/30/2014 | 6,855,000 | 6,855,000 | 3,978,436 | 3,978,436 | ||||||||
Wisconsin, State (REV) Lease, Series A, 5.7%, 5/1/2026 | 1,180,000 | 3,200,000 | 4,380,000 | 1,175,835 | 3,188,704 | 4,364,539 | ||||||
Total Municipal Investments (Cost $12,785,014, $32,128,575 and $44,913,589, respectively) | 12,671,747 | 31,588,096 | 44,259,843 | |||||||||
Government National Mortgage Association 0.5% | ||||||||||||
Government National Mortgage Association: | ||||||||||||
3.75%, 6/20/2026 | 1,452,000 | 1,452,000 | 1,457,444 | 1,457,444 | ||||||||
5.0%, 9/20/2033 | 1,287,998 | 3,689,677 | 4,977,675 | 1,251,679 | 3,585,638 | 4,837,317 | ||||||
6.0%, 3/20/2034 | 7,081,523 | 7,081,523 | 7,255,402 | 7,255,402 | ||||||||
Total Government National Mortgage Association (Cost $2,743,924, $11,087,115 and $13,831,039, respectively) | 2,709,123 | 10,841,040 | 13,550,163 | |||||||||
US Government Backed 4.0% | ||||||||||||
US Treasury Bond: | ||||||||||||
5.375%, 2/15/2031 | 135,000 | 135,000 | 136,772 | 136,772 | ||||||||
6.0%, 2/15/2026 | 8,878,000 | 28,847,000 | 37,725,000 | 9,600,722 | 31,195,319 | 40,796,041 | ||||||
US Treasury Note: | ||||||||||||
3.125%, 4/15/2009 | 725,000 | 725,000 | 709,141 | 709,141 | ||||||||
5.0%, 8/15/2011 | 16,234,000 | 45,410,000 | 61,644,000 | 17,068,525 | 47,744,346 | 64,812,871 | ||||||
6.125%, 8/15/2007 | 2,761,000 | 2,761,000 | 3,029,226 | 3,029,226 | ||||||||
Total US Government Backed (Cost $30,340,898, $81,230,011 and $111,570,909, respectively) | 29,698,473 | 79,785,578 | 109,484,051 | |||||||||
S-13
Table of Contents
| Balanced Par/Share Amount | Total Return Par/Share Amount | Combined Pro Forma Par/Share Amount | Balanced Market Value ($) | Total Return Market Value ($) | Combined Pro Forma Market Value ($) | |||||||
Cash Equivalents 2.5% | ||||||||||||
Scudder Cash Management QP Trust, 1.08% | ||||||||||||
(Cost $19,929,973, $47,479,185 and $67,409,157, respectively) | 19,929,973 | 47,479,185 | 67,409,158 | 19,929,973 | 47,479,185 | 67,409,158 | ||||||
Total Investment Portfolio (Cost $647,486,791, $1,723,070,474 and $2,370,557,265, respectively) | 730,135,569 | 1,997,174,892 | 2,727,310,461 | |||||||||
S-14
Table of Contents
CAPITALIZATION (UNAUDITED)
The following table sets forth the capitalization of each Fund as of April 30, 2004, and of the Total Return Fund on a pro forma combined basis, giving effect to the proposed acquisition of assets at net asset value as of that date.(1)
| Balanced Fund | Total Return Fund | Pro Forma Adjustments | Pro Forma Combined | |||||||||
Net Assets | ||||||||||||
Class A Shares | $ | — | $ | 1,705,828,913 | $ | — | $ | 1,705,828,913 | ||||
Class B Shares | $ | — | $ | 213,725,565 | — | $ | 213,725,565 | |||||
Class C Shares | $ | — | $ | 54,068,959 | — | $ | 54,068,959 | |||||
Class I Shares (2) | $ | — | $ | 278,990 | — | $ | 278,990 | |||||
Class AARP Shares | $ | 331,366,928 | $ | — | — | $ | 331,366,928 | |||||
Class S Shares | $ | 394,536,719 | $ | — | — | $ | 394,536,719 | |||||
Class R Shares | $ | — | $ | 443,473 | — | $ | 443,473 | |||||
Total Net assets | $ | 725,903,647 | $ | 1,974,345,900 | $ | — | $ | 2,700,249,547 | ||||
Shares outstanding | ||||||||||||
Class A Shares | — | 197,125,803 | — | 197,125,803 | ||||||||
Class B Shares | — | 24,697,054 | — | 24,697,054 | ||||||||
Class C Shares | — | 6,264,023 | — | 6,264,023 | ||||||||
Class I Shares (2) | — | 32,180 | — | 32,180 | ||||||||
Class AARP Shares | 19,730,442 | — | 18,577,873 | 38,308,315 | ||||||||
Class S Shares | 23,545,948 | — | 22,065,233 | 45,611,181 | ||||||||
Class R Shares | — | 51,213 | — | 51,213 | ||||||||
Net Asset Value per Share | ||||||||||||
Class A Shares | $ | — | $ | 8.65 | — | $ | 8.65 | |||||
Class B Shares | $ | — | $ | 8.65 | — | $ | 8.65 | |||||
Class C Shares | $ | — | $ | 8.63 | — | $ | 8.63 | |||||
Class I Shares (2) | $ | — | $ | 8.67 | — | $ | 8.67 | |||||
Class AARP Shares | $ | 16.79 | $ | — | — | $ | 8.65 | |||||
Class S Shares | $ | 16.76 | $ | — | — | $ | 8.65 | |||||
Class R Shares | $ | — | $ | 8.66 | — | $ | 8.66 | |||||
| (1) | Assumes the merger had been consummated on April 30, 2004, and is for information purposes only. No assurance can be given as to how many shares of Total Return Fund will be received by the shareholders of Balanced Fund on the date the merger takes place, and the foregoing should not be relied upon to reflect the number of shares of Total Return Fund that actually will be received on or after such date. |
| (2) | Class I shares have been renamed Institutional Class shares. |
S-15
Table of Contents
PRO FORMA COMBINING CONDENSED STATEMENT OF ASSETS AND
LIABILITIES AS OF APRIL 30, 2004 (UNAUDITED)
| Balanced Fund | Total Return Fund | Pro Forma Adjustments | Pro Forma Combined | ||||||||||||
Investments, At Value | $ | 730,135,569 | $ | 1,997,174,892 | $ | — | $ | 2,727,310,461 | |||||||
Other Assets Less Liabilities | (4,231,922 | ) | (22,828,992 | ) | $ | — | (27,060,914 | ) | |||||||
Total Net Assets | $ | 725,903,647 | $ | 1,974,345,900 | $ | — | $ | 2,700,249,547 | |||||||
Net Assets | |||||||||||||||
Class A Shares | $ | — | $ | 1,705,828,913 | $ | — | $ | 1,705,828,913 | |||||||
Class B Shares | $ | — | $ | 213,725,565 | $ | — | $ | 213,725,565 | |||||||
Class C Shares | $ | — | $ | 54,068,959 | $ | — | $ | 54,068,959 | |||||||
Class I Shares(6) | $ | — | $ | 278,990 | $ | — | $ | 278,990 | |||||||
Class AARP Class | $ | 331,366,928 | $ | — | $ | — | $ | 331,366,928 | |||||||
Class S Shares | $ | 394,536,719 | $ | — | $ | — | $ | 394,536,719 | |||||||
Class R Shares | $ | — | $ | 443,473 | $ | — | $ | 443,473 | |||||||
Total Net Assets | $ | 725,903,647 | $ | 1,974,345,900 | $ | — | $ | 2,700,249,547 | |||||||
Share Outstanding | |||||||||||||||
Class A Shares | — | 197,125,803 | — | 197,125,803 | |||||||||||
Class B Shares | — | 24,697,054 | — | 24,697,054 | |||||||||||
Class C Shares | — | 6,264,023 | — | 6,264,023 | |||||||||||
Class I Shares(6) | — | 32,180 | — | 32,180 | |||||||||||
Class AARP Class | 19,730,442 | — | 18,577,873 | 38,308,315 | |||||||||||
Class S Shares | 23,545,948 | — | 22,065,233 | 45,611,181 | |||||||||||
Class R Shares | — | 51,213 | — | 51,213 | |||||||||||
Net Asset Value per Share | |||||||||||||||
Class A Shares | $ | — | $ | — | — | $ | 8.65 | ||||||||
Class B Shares | $ | — | $ | 8.65 | — | $ | 8.65 | ||||||||
Class C Shares | $ | — | $ | 8.63 | — | $ | 8.63 | ||||||||
Class I Shares(6) | $ | — | $ | 8.67 | — | $ | 8.67 | ||||||||
Class AARP Class | $ | 16.79 | $ | — | — | $ | 8.65 | ||||||||
Class S Shares | $ | 16.76 | $ | — | — | $ | 8.65 | ||||||||
Class R Shares | $ | — | $ | 8.66 | — | $ | 8.66 | ||||||||
S-16
Table of Contents
PRO FORMA COMBINING CONDENSED STATEMENT OF OPERATIONS
FOR THE TWELVE MONTH PERIOD ENDED APRIL 30, 2004 (UNAUDITED)
| Balanced Fund | Total Return Fund | ProForma Adjustments | ProForma Combined | |||||||||||||
Investment Income: | ||||||||||||||||
Interest and Dividend Income | $ | 15,774,085 | $ | 55,266,097 | $ | — | $ | 71,040,182 | ||||||||
Total Investment Income | 15,774,085 | 55,266,097 | 71,040,182 | |||||||||||||
Expenses | ||||||||||||||||
Management Fees | 3,386,999 | 11,309,040 | (2,221,078 | )(2) | 12,474,959 | |||||||||||
Administrative Fee | 2,937,045 | 2,754,697 | (5,691,742 | )(3) | (3 | ) | ||||||||||
Services to Shareholders | 170,220 | 2,623,800 | 3,450,036 | (4) | 6,244,052 | |||||||||||
Custodian and Accounting Fees | 14,130 | 41,246 | 262,879 | (4) | 318,251 | |||||||||||
Distribution Service Fees | — | 7,488,575 | — | 7,488,575 | ||||||||||||
Auditing | 4,680 | 23,977 | 35,156 | (4) | 63,809 | |||||||||||
Legal | 1,530 | 14,452 | 27,298 | (4) | 43,276 | |||||||||||
Trustees Fees | 22,757 | 77,770 | (5,389 | ) | 95,138 | |||||||||||
Reports to Shareholders | 6,780 | 23,007 | 254,833 | (4) | 284,616 | |||||||||||
Registration Fees | 2,430 | 27,695 | 64,944 | (4) | 95,065 | |||||||||||
All Other Expenses | 14,613 | 76,889 | (40,553 | )(4) | 50,945 | |||||||||||
Total Expenses Before Reductions | 6,561,184 | 24,461,148 | (3,863,616 | )(5) | 27,158,716 | |||||||||||
Expense Reductions | (718 | ) | (676 | ) | — | (1,394 | ) | |||||||||
Expenses, Net | 6,560,466 | 24,460,472 | (3,863,616 | ) | 27,157,322 | |||||||||||
Net Investment Income (loss) | 9,213,619 | 30,805,625 | 3,863,616 | 43,882,860 | ||||||||||||
Net Realized and Unrealized Gain (Loss) | ||||||||||||||||
Net Realized Gain (Loss) on Investments, Foreign Currency Related Transactions | 52,421 | (3,325,935 | ) | — | (3,273,514 | ) | ||||||||||
Net Unrealized Appreciation (Depreciation) on Investments, and Foreign Currency Related Transactions | 76,938,891 | 216,329,418 | — | 293,268,309 | ||||||||||||
Net Increase In Net Assets From Operations | $ | 86,204,931 | $ | 243,809,108 | $ | 3,863,616 | $ | 333,877,655 | ||||||||
Notes to Pro Forma Combining Financial Statements
(Unaudited)
April 30, 2004
| 1. | These financial statements set forth the unaudited pro forma condensed Statement of Assets and Liabilities as of April 30, 2004, and the unaudited pro forma condensed Statement of Operations for the twelve month period ended April 30, 2004 for Scudder Balanced Fund and Scudder Total Return Fund as adjusted giving effect to the merger as if it had occurred as of the beginning of the period. These statements have been derived from the books and records utilized in calculating daily net asset value for each fund and have been prepared in accordance with accounting principles generally accepted in the United States of America which require the use of management estimates. Actual results could differ from those estimates. |
Basis of Combination
Under the terms of the Plan of Reorganization, the combination will be accounted for by the method of accounting for tax-free mergers of investment companies. The acquisition would be accomplished by an acquisition of the net assets of Scudder Balanced Fund in exchange for shares of Scudder Total Return Fund at net asset value. Following the acquisition, Scudder Total Return Fund will be the accounting survivor. In accordance with accounting principles generally accepted in the United States of America, the historical cost of investment securities will be carried forward to the surviving fund and the results of operations for pre-combination periods will not be restated.
Portfolio Valuation
Investments are stated at value determined as of the close of regular trading on the New York Stock Exchange on each day the exchange is open for trading. Equity securities are valued at the most recent sales price or official closing price reported on the exchange (US or foreign) or over-the-counter market on which the security is traded most extensively. Securities for which no sales are reported are valued at the calculated mean between the most recent bid and asked quotations on the relevant market or, if a mean cannot be determined, at the most recent bid quotation.
S-17
Table of Contents
Debt securities are valued by independent pricing services approved by the Trustees of the Fund. If the pricing services are unable to provide valuations, the securities are valued at the most recent bid quotation or evaluated price, as applicable, obtained from one or more broker-dealers. Such services may use various pricing techniques which may take into account appropriate factors such as yield, quality, coupon rate, maturity, type of issue, trading characteristics and other data, as well as broker quotes.
Money market instruments purchased with an original or remaining maturity of sixty days or less, maturing at par, are valued at amortized cost. Investments in open-end investment companies and Scudder Cash Management QP Trust are valued at their net asset value each day.
Securities and other assets for which market quotations are not readily available or for which the above valuation procedures are deemed not to reflect fair value are valued in a manner that is intended to reflect their fair value as determined in accordance with procedures approved by the Directors.
Federal Income Taxes
It is each Fund’s policy to comply with the requirements of the Internal Revenue Code, as amended, which are applicable to regulated investment companies, and to distribute all of their taxable income to shareholders. After the acquisition, Scudder Total Return Fund intends to continue to qualify as a regulated investment company.
| 2. | Represents reduction in management fees resulting from the application of Scudder Total Return Fund’s lower management fee agreement to the pro forma combined average net assets. |
| 3. | Represents a reduction in expense as Scudder Total Return Fund no longer has an Administrative Fee, effective September 30, 2003. |
| 4. | Represents estimated increase (decrease) in expenses as a result of Scudder Total Return Fund being responsible for certain expenses formerly covered under its Administrative Fee or resulting from the merger. |
| 5. | Represents decrease in expense reductions as a result of the overall decrease in expenses resulting from the merger. |
| 6. | Class I shares have been renamed Institutional Class shares. |
S-18
Table of Contents
[Insert SAI of Total Return Fund]
[To Come]
S-19
Table of Contents
[GRAPHIC APPEARS HERE]
Scudder Total Return Fund
Annual Report to Shareholders
October 31, 2003
1
Table of Contents
| 3 | ||
| 6 | ||
| 13 | ||
| 14 | ||
| 27 | ||
| 31 | ||
| 36 | ||
| 43 | ||
| 43 | ||
| 44 | ||
| 47 | ||
| 51 | ||
Scudder Investments is part of Deutsche Asset Management, which is the marketing name in the US for the asset management activities of Deutsche Bank AG, Deutsche Investment Management Americas Inc., Deutsche Asset Management Inc., Deutsche Asset Management Investment Services Ltd., Deutsche Bank Trust Company Americas and Scudder Trust Company.
This report must be preceded or accompanied by a prospectus. To obtain a prospectus for any of our funds, refer to the Account Management Resources information provided in the back of this booklet. The prospectus contains more complete information, including a description of the risks of investing in the fund, management fees and expenses. Please read it carefully before you invest or send money.
Fund shares are not FDIC-insured and are not deposits or other obligations of, or guaranteed by, any bank. Fund shares involve investment risk, including possible loss of principal.
2
Table of Contents
Performance Summary October 31, 2003
Average Annual Total Returns (Unadjusted for Sales Charge)
Scudder Total Return Fund | 1-Year | 3-Year | 5-Year | 10-Year | ||||||||
Class A | 12.69 | % | -4.74 | % | 1.66 | % | 6.11 | % | ||||
Class B | 11.67 | % | -5.62 | % | .71 | % | 5.12 | %(a) | ||||
Class C | 11.81 | % | -5.53 | % | .76 | % | 5.20 | %(a) | ||||
S&P 500 Index+ | 20.80 | % | -8.34 | % | .53 | % | 10.43 | % | ||||
Russell 1000 Growth Index++ | 21.81 | % | -16.22 | % | -2.90 | % | 8.84 | % | ||||
Lehman Brothers Aggregate Bond Index+++ | 4.90 | % | 8.36 | % | 6.54 | % | 6.78 | % | ||||
Lehman Brothers Government/Corporate Bond Index++++ | 6.17 | % | 8.91 | % | 6.57 | % | 6.77 | % |
Scudder Total Return Fund | 1-Year | 3-Year | 5-Year | Life of Class* | ||||||||
Class I** | 13.09 | % | -4.41 | % | 2.05 | % | 7.32 | % | ||||
S&P 500 Index+ | 20.80 | % | -8.34 | % | .53 | % | 9.98 | % | ||||
Russell 1000 Growth Index++ | 21.81 | % | -16.22 | % | -2.90 | % | 7.80 | % | ||||
Lehman Brothers Aggregate Bond Index+++ | 4.90 | % | 8.36 | % | 6.54 | % | 7.21 | % | ||||
Lehman Brothers Government/Corporate Bond Index++++ | 6.17 | % | 8.91 | % | 6.57 | % | 7.29 | % |
Sources: Lipper Inc. and Deutsche Investment Management Americas Inc.
Net Asset Value and Distribution Information
| Class A | Class B | Class C | Class I | Class R | |||||||||||
Net Asset Value: | |||||||||||||||
10/31/03 | $ | 8.44 | $ | 8.44 | $ | 8.42 | $ | 8.45 | $ | 8.44 | |||||
10/1/03 (commencement of operations for Class R++) | — | — | — | — | $ | 8.33 | |||||||||
10/31/02 | $ | 7.62 | $ | 7.62 | $ | 7.60 | $ | 7.63 | — | ||||||
Distribution Information: | |||||||||||||||
Twelve Months: | |||||||||||||||
Income Dividends | $ | .14 | $ | .06 | $ | .07 | $ | .17 | — | ||||||
Class A Lipper Rankings - Balanced Funds Category
Period | Rank | Number of Funds Tracked | Percentile Ranking | |||||
1-Year | 386 | of | 524 | 74 | ||||
3-Year | 350 | of | 422 | 83 | ||||
5-Year | 248 | of | 349 | 71 | ||||
10-Year | 91 | of | 112 | 81 |
Rankings are historical and do not guarantee future results. Rankings are based on total return unadjusted for sales charges with distributions reinvested. If sales charges had been included, rankings might have been less favorable.
Source: Lipper Inc.
3
Table of Contents
Growth of an Assumed $10,000 Investment(b) (Adjusted for Sales Charge)
¨ Scudder Total Return Fund - Class A(c)
¨ S&P 500 Index+
¨ Russell 1000 Growth Index++
¨ Lehman Brothers Aggregate Bond Index+++
¨ Lehman Brothers Government/Corporate Bond Index++++
[GRAPHIC APPEARS HERE]
Yearly periods ended October 31
Comparative Results (Adjusted for Sales Charge)
Scudder Total Return Fund | 1-Year | 3-Year | 5-Year | 10-Year | Life of Class* | |||||||||||||||||
Class A(c) | Growth of $10,000 | $ | 10,621 | $ | 8,148 | $ | 10,233 | $ | 17,060 | — | ||||||||||||
| Average annual total return | 6.21 | % | -6.60 | % | .46 | % | 5.49 | % | — | |||||||||||||
Class B(c) | Growth of $10,000 | $ | 10,867 | $ | 8,257 | $ | 10,282 | $ | 16,475 | (a) | — | |||||||||||
| Average annual total return | 8.67 | % | -6.18 | % | .56 | % | 5.12 | %(a) | — | |||||||||||||
Class C(c) | Growth of $10,000 | $ | 11,069 | $ | 8,347 | $ | 10,284 | $ | 16,439 | (a) | — | |||||||||||
| Average annual total return | 10.69 | % | -5.84 | % | .56 | % | 5.10 | %(a) | — | |||||||||||||
Class I** | Growth of $10,000 | $ | 11,309 | $ | 8,734 | $ | 11,067 | — | $ | 18,012 | ||||||||||||
| Average annual total return | 13.09 | % | -4.41 | % | 2.05 | % | — | 7.32 | % | |||||||||||||
S&P 500 Index+ | Growth of $10,000 | $ | 12,080 | $ | 7,701 | $ | 10,268 | $ | 26,968 | $ | 22,088 | |||||||||||
| Average annual total return | 20.80 | % | -8.34 | % | .53 | % | 10.43 | % | 9.98 | % | ||||||||||||
Russell 1000 Growth Index++ | Growth of $10,000 | $ | 12,181 | $ | 5,880 | $ | 8,631 | $ | 23,321 | $ | 18,699 | |||||||||||
| Average annual total return | 21.81 | % | -16.22 | % | -2.90 | % | 8.84 | % | 7.80 | % | ||||||||||||
Lehman Brothers Aggregate Bond Index+++ | Growth of $10,000 | $ | 10,490 | $ | 12,725 | $ | 13,727 | $ | 19,271 | $ | 17,868 | |||||||||||
| Average annual total return | 4.90 | % | 8.36 | % | 6.54 | % | 6.78 | % | 7.21 | % | ||||||||||||
Lehman Brothers Government/ Corporate Bond Index++++ | Growth of $10,000 | $ | 10,617 | $ | 12,917 | $ | 13,745 | $ | 19,256 | $ | 17,976 | |||||||||||
| Average annual total return | 6.17 | % | 8.91 | % | 6.57 | % | 6.77 | % | 7.29 | % | ||||||||||||
The growth of $10,000 is cumulative.
4
Table of Contents
Notes to Performance Summary - Classes A, B, C and I
| * | Class I shares commenced operations on July 3, 1995. Index returns begin June 30, 1995. |
| ** | Class I shares are not subject to sales charges. |
| ++ | Class R shares commenced operations on October 1, 2003 and are available for investment. Please refer to page 44 or the Fund’s prospectus for more information on Class R share performance. |
| a | Returns shown for Class B and C shares for the periods prior to their inception date on May 31, 1994 are derived from the historical performance of Class A shares of the Scudder Total Return Fund during such periods and have been adjusted to reflect the higher gross total annual operating expenses of each specific class. Any difference in expenses will affect performance. |
| b | The Fund’s growth of an assumed $10,000 investment is adjusted for the maximum sales charge of 5.75%. This results in a net initial investment of $9,425. |
| c | Returns shown for Class A, B and C shares have been adjusted to reflect the current applicable sales charges of each specific class. Returns for Class A reflect the current maximum initial sales charge of 5.75%. Class B share performance is adjusted for the applicable contingent deferred sales charge (“CDSC”), which is 4% within the first year after purchase, declining to 0% after six years. Returns for Class C reflect an initial sales charge of 1%. Redemptions on Class C shares within one year of purchase may be subject to a CDSC of 1%. Any difference in expenses will affect performance. |
| + | The Standard & Poor’s (S&P) 500 Index is a capitalization-weighted index of 500 stocks. The index is designed to measure performance of the broad domestic economy through changes in the aggregate market value of 500 stocks representing all major industries. |
| ++ | The Russell 1000 Growth Index consists of those stocks in the Russell 1000 Index that have greater-than-average growth orientation. |
| +++ | The Lehman Brothers Aggregate Bond (LBAB) Index is an unmanaged market value-weighted measure of treasury issues, corporate bond issues and mortgage securities. Beginning with the next report, the Lehman Brothers Aggregate Bond Index will replace the Lehman Brothers Government/Corporate Bond Index as one of the Fund’s primary benchmarks, as the Lehman Brothers Aggregate Bond Index is believed to be more reflective of the investment strategy pursued by the Fund’s Advisor. |
| ++++ | The Lehman Brothers Government/Corporate Bond Index is an unmanaged index comprising intermediate- and long-term government and investment-grade corporate debt securities. Index returns assume reinvestment of dividends and, unlike Fund returns, do not reflect any fees or expenses. It is not possible to invest directly into an index. |
All performance is historical, assumes reinvestment of all dividends and capital gains, and is not indicative of future results. Investment return and principal value will fluctuate, so an investor’s shares, when redeemed, may be worth more or less than when purchased. Performance figures do not reflect the deduction of taxes that a shareholder would pay on fund distributions or the redemption of fund shares. Returns and rankings may differ by share classes.
Investments in funds involve risk. Some funds have more risk than others. These include funds that allow exposure to or otherwise concentrate investments in certain sectors, geographic regions, security types, market capitalization or foreign securities (e.g., political or economic instability, which can be accentuated in emerging market countries). Please read this fund’s prospectus for specific details regarding its investments and risk profile.
Please call (800) 621-1048 for the Fund’s most up-to-date performance. On the Web, go to scudder.com.
5
Table of Contents
Scudder Total Return Fund: A Team Approach to Investing
Deutsche Investment Management Americas Inc. (“DeIM” or the “Advisor”), which is part of Deutsche Asset Management, is the investment advisor for Scudder Total Return Fund. DeIM and its predecessors have more than 80 years of experience managing mutual funds and DeIM provides a full range of investment advisory services to institutional and retail clients. DeIM is also responsible for selecting brokers and dealers and for negotiating brokerage commissions and dealer charges.
Deutsche Asset Management is a global asset management organization that offers a wide range of investing expertise and resources. This well-resourced global investment platform brings together a wide variety of experience and investment insight across industries, regions, asset classes and investing styles.
DeIM is an indirect, wholly owned subsidiary of Deutsche Bank AG. Deutsche Bank AG is a major global banking institution that is engaged in a wide range of financial services, including investment management, mutual funds, retail, private and commercial banking, investment banking and insurance.
Portfolio Management Team
Julie M. Van Cleave
CFA, Managing Director of Deutsche Asset Management and Lead Portfolio Manager of the fund.
| • | Joined Deutsche Asset Management and the fund in 2002. |
| • | Head of Large Cap Growth Portfolio Selection Team. |
| • | Previous experience includes 18 years’ investment industry experience at Mason Street Advisors, most recently serving as Managing Director and team leader for the large cap investment team. |
| • | MBA, University of Wisconsin - Madison. |
Jack A. Zehner
Director of Deutsche Asset Management and Portfolio Manager of the fund.
| • | Joined Deutsche Asset Management and the fund in 2002. |
| • | Previous experience includes 9 years’ investment industry experience at Mason Street Advisors where he served most recently as Director - Common Stock. |
| • | MBA, Marquette University. |
6
Table of Contents
Thomas J. Schmid
CFA, Director of Deutsche Asset Management and Portfolio Manager of the fund.
| • | Joined Deutsche Asset Management and the fund in 2002. |
| • | Previous experience includes 15 years’ investment industry experience, most recently serving as Director - Common Stock at Mason Street Advisors. |
| • | MBA, University of Chicago. |
J. Christopher Gagnier
Managing Director of Deutsche Asset Management and Portfolio Manager of the fund.
| • | Joined Deutsche Asset Management in 1997 and the fund in 2002. |
| • | Prior to that, portfolio manager, Paine Webber, from 1984 to 1997. |
| • | Analyst specializing in asset-backed securities and government investments. |
| • | Began investment career in 1979. |
| • | MBA, University of Chicago. |
Gary W. Bartlett
CFA, Managing Director of Deutsche Asset Management and Portfolio Manager of the fund.
| • | Joined Deutsche Asset Management in 1992 and the fund in 2002. |
| • | Analyst specializing in taxable municipal and government investments. |
| • | Began investment career in 1982. |
7
Table of Contents
| • | MBA, Drexel University. |
Warren S. Davis
Managing Director of Deutsche Asset Management and Portfolio Manager of the fund.
| • | Joined Deutsche Asset Management in 1995 and the fund in 2002. |
| • | Analyst specializing in mortgage- and asset-backed securities. |
| • | Began investment career in 1985. |
| • | MBA, Drexel University. |
Daniel R. Taylor
CFA, Managing Director of Deutsche Asset Management and Portfolio Manager of the fund.
| • | Joined Deutsche Asset Management in 1998 and the fund in 2002. |
| • | Prior to that, fixed income portfolio manager, asset backed securities analyst and senior credit analyst, CoreStates Investment Advisors, from 1992 to 1998. |
| • | Analyst specializing in asset-backed securities and government securities. |
| • | Began investment career in 1992. |
Thomas J. Flaherty
Managing Director of Deutsche Asset Management and Portfolio Manager of the fund.
| • | Joined Deutsche Asset Management in 1995 and the fund in 2002. |
| • | Analyst specializing in corporate bonds and mortgages. |
| • | Began investment career in 1984. |
Janet Campagna
Managing Director of Deutsche Asset Management and Portfolio Manager of the fund.
| • | Joined Deutsche Asset Management in 1999 and the fund in 2002. |
| • | Head of global and tactical asset allocation. |
| • | Investment strategist and manager of the asset allocation strategies group for Barclays Global Investors from 1994 to 1999. |
| • | Over 15 years of investment industry experience. |
| • | Master’s degree in Social Science from California Institute of Technology. |
| • | Ph.D in Political Science from University of California at Irvine. |
Andrew P. Cestone
Managing Director of Deutsche Asset Management and Portfolio Manager of the fund.
| • | Joined Deutsche Asset Management in 1998 and the fund in 2002. |
| • | Prior to that, investment analyst, Phoenix Investment Partners, from 1997 to 1998. |
| • | Prior to that, credit officer, asset based lending group, Fleet Bank, from 1995 to 1997. |
8
Table of Contents
William T. Lissenden
Director of Deutsche Asset Management and Portfolio Manager of the fund.
| • | Joined Deutsche Asset Management in 2002 and the fund in 2003. |
| • | Prior to that, fixed income strategist and director of research at Conseco Capital Management, director of fixed income research and product management at Prudential Securities, national sales manager for fixed income securities at Prudential Securities and institutional sales professional at several firms including Prudential, Goldman Sachs and Merrill Lynch. |
| • | MBA, Baruch College. |
Timothy C. Vile
CFA, Managing Director of Deutsche Asset Management and Portfolio Manager of the fund.
| • | Joined Deutsche Asset Management in 1991 and the fund in 2002. |
| • | Prior to that, portfolio manager for fixed income portfolios at Equitable Capital Management. |
| • | Began investment career in 1984. |
Brett Diment
Managing Director of Deutsche Asset Management and Consultant to the fund.
| • | Joined Deutsche Asset Management in 1991 and the fund in 2002. |
| • | Head of Emerging Market Debt for London Fixed Income and responsible for coordinating research into Continental European markets and managing global fixed income, balanced and cash based portfolios: London. |
| • | Began investment career in 1991. |
In the following interview, Lead Portfolio Manager Julie M. Van Cleave discusses the market environment and the fund’s performance during the 12-month period ended October 31, 2003. She assumed the role of lead manager in December 2002.
Q: How would you describe the investment environment during the 12 months ended October 31, 2003?
A: For the full 12-month period, both stocks and bonds gained ground. After three calendar years (2000, 2001, 2002) of losses, the stock market, as measured by the Standard & Poor’s 500 index (S&P 500), posted solid gains - up 20.80% for the 12 months ended October 31, 2003. The road to this recovery in stocks, however, was quite volatile - especially in the first half of the fiscal period. At the start of the period, technology stocks rallied and led the S&P 500 to a strong gain. In January, investors became skittish once again, as they speculated about the impending war with Iraq, continued sluggish economic growth and no solid improvement in corporate earnings. In the first quarter of 2003, the S&P 500 lost ground. This backdrop quickly changed for the better, however, once it became apparent that the active combat in the war would be resolved quickly. After reaching a low in mid-March, stocks staged a rally in the second calendar quarter of 2003, with the S&P 500 gaining 15.39%. Gains continued through the end of the reporting period, but at a more conservative pace. The market gains were broad-based, pushing the returns of all 10 S&P 500 industry sectors into positive territory for the full year.
9
Table of Contents
Gains of many high-quality bonds slowed in the period, while high-yield and lower-quality investment-grade corporate bond performance improved along with the stock market. The Federal Reserve Board (Fed) reduced the federal funds rate to its lowest level since the 1950s. The yields on 10-year Treasuries moved higher during the summer months, as did the yields on most other high-grade bonds, but remained low on a long-term historical basis. Corporate bonds, especially high-yield bonds, significantly outperformed mortgages and Treasuries.
Q: Did the change in the market environment cause you to shift the fund’s allocation between stocks and bonds?
A: We typically keep the asset allocation at about 60% stocks and 40% bonds. In working with our global and tactical asset allocation group, we have determined that this ratio provides us the best opportunity to add value by actively managing the fund’s stock and bond portfolios. The asset allocation group assesses the market environment by using a quantitative system to evaluate technical factors affecting the performance of stocks and bonds. Periodically, the group recommends changes to the fund’s allocation based on its analysis. Given the strength in the stock market, we increased our allocation to equities to about 61%. In most market environments, our allocation to stocks will fall within a range of 58% to 62% of the fund’s market value. That allocation provides the potential for growth, with what we believe is a reasonable level of volatility.
Q: Before discussing performance, will you remind us of the processes used for selecting stocks and bonds?
A: Our equity investment discipline starts with a thorough analysis of economic trends. For the fund’s stock holdings, this analysis helps us in our effort to determine industries that we believe are, or will be, the strongest drivers of growth. That process is combined with in-depth company research to narrow the field of investment candidates. We work closely with Scudder’s research analysts to identify companies within those industries that appear to offer the best potential for delivering strong and sustainable earnings growth. Stocks are chosen based on a thorough evaluation of each company’s management and strategy.
The fixed-income managers focus on smaller subsectors of the bond market and use a bottom-up issue selection process, instead of selecting bonds based on macroeconomic events or trying to predict the direction of interest rates. It is their view that interest rate forecasts do not considerably add value in terms of potential excess returns relative to the benchmark. The fixed-income managers select bonds by evaluating the individual creditworthiness and return potential of each security. They compare opportunities across fixed-income asset classes and among corporate bond sectors in an effort to achieve an attractive risk-vs.-return profile. The primary function of the bond portfolio is to provide stable returns to offset some of the volatility in the larger, equity portion of the fund.
Q: How did the fund perform in this environment?
A: For the 12 months ended October 31, 2003, the fund’s Class A shares (unadjusted for sales charges) posted a total return of 12.69%. (For returns of other share classes, please see page 3.) This compares with a 20.80% return for the fund’s equity benchmark, the S&P 500, and a 4.90% return for the Lehman Brothers Aggregate Bond Index, the fund’s bond benchmark. The fund’s equity holdings slightly underperformed the S&P 500 during the period, and its bond holdings outperformed the Lehman Brothers Aggregate Bond Index. The fund can also be compared with the Lipper Balanced Funds category, which posted an average return of 15.23%.1
| 1 | The Lipper Balanced Funds category is a group of mutual funds that invest in both equity and fixed-income investments. Returns represent the reinvestment of all distributions. It is not possible to invest directly in an index or category. |
10
Table of Contents
Q: Which holdings or sectors helped performance most in the equity portfolio?
A: Technology stocks were the strongest performers this year. The fund’s larger position in these stocks relative to the S&P 500 helped performance.
Our goal is to maintain a technology position with both breadth and strength. To this end, we have focused the fund’s investments in solid companies with long-term track records. Holdings represent a variety of industry subsectors - from semiconductors to software to storage companies. For the most part, the fund does not invest in the more speculative areas of the sector or in companies that don’t have proven track records. As a result, the fund holds a number of the largest names in tech, such as Intel, EMC, Cisco Systems, Oracle, International Business Machines Corp. and Texas Instruments. All were among the top contributors to the fund’s performance during the year. Semiconductor companies, as a group, posted the strongest returns this year, and this was an area in which the fund held an overweight position vs. the S&P 500.
The fund’s larger-than-benchmark position in biotechnology stocks was also a primary contributor to performance. This sector has been volatile over time, due in part to the small size of many companies within the industry. However, a number of biotech firms have grown substantially and reached “critical mass” in terms of their size and ability to compete with large pharmaceutical firms. Genentech was one of the best individual contributors to fund performance. The stock rose on better-than-expected results from a clinical study of Avastin, a new drug that treats colon cancer. Gilead Sciences also produced favorable returns for the fund due to the successful launch of its new AIDS drug, Viread.
Q: What stocks or sectors held back performance?
A: While the fund’s larger-than-benchmark position in energy helped performance during the first half of the period, it detracted from performance for the full 12 months. Energy, traditionally considered a defensive sector, trailed during the second half of the period, as investors favored industries that they believed could provide more high-powered returns in the strong market environment. As the economy regains its strength, we expect the current supply/demand imbalance, especially in North American natural gas, to exacerbate and keep commodity prices elevated. Supplies of natural gas had fallen to historic lows, and we expect exploration firms, rig companies and oil service firms to benefit as higher natural gas prices support further industry efforts to increase inventories. Our holdings in this area include exploration and production companies that stand to benefit from stronger natural gas prices, such as EOG Resources and Nabors Industries. (As of October 31, 2003, positions in EOG Resources were sold). We also hold stocks of companies that provide services to the drilling firms, such as Schlumberger and Baker Hughes. We believe services companies such as these will benefit from a revival in economic growth as well as the growing need to find and replace oil and natural gas reserves. Overall, we have a very favorable long-term view on the sector.
A few of the fund’s health care stocks also hurt performance. The most significant detractor from performance was Tenet Healthcare, which we inherited upon taking over the portfolio. Tenet, a health care provider, plunged in October 2002 amid allegations of unnecessary surgical procedures and fraudulent billing. Although we eliminated the stock from the portfolio when we assumed management, Tenet was by far the most significant negative contributor to fund performance among individual companies. Johnson & Johnson, a leading pharmaceutical and medical device company and a large holding for the fund, also declined during the period and hurt performance. Investors reacted negatively after the company launched its new drug-coated stent but could not keep pace with the strong demand for this device, which is used to treat cardiac patients. While this event detracted from the fund’s returns during the period, we continue to like the stock as a long-term holding. This favorable view is based on our belief that the company’s recent challenges have been fully factored in to its stock price, making it attractively valued. Additionally, Johnson & Johnson has a well-diversified product line that we expect will offset its recent weakness.
11
Table of Contents
Q: Will you tell us about the fund’s bond allocation?
A: The fund’s bond portfolio performed well in the period. Following its bottom-up security selection discipline, the fixed-income team selectively added to the portfolio’s position in lower-grade corporate bonds - both high-yield (non-investment grade) and BBB-rated bonds.2 This positioning aided performance, as lower-quality corporate issues were the best-performing portion of the fixed-income markets during the period. Additionally, the team’s allocation to structured mortgage-backed securities helped during the volatile summer period as cited previously. Asset-backed securities are high-quality bonds with short durations that are collateralized (backed) by real assets.
| 2 | Credit quality is a grade or rating that indicates the perceived ability of a bond issuer to repay principal and make interest payments in a timely fashion. The highest quality bonds are AAA-rated, medium grade securities are BBB-rated and those considered below investment-grade are BB-, B- and C-rated. A bond in default would be given a rating of D. |
It is important to note that the overall bond allocation is of high credit quality. The fixed-income managers aim to keep the portfolio’s average credit quality at single-A-rated. While the bond portfolio certainly contributed positively to returns this period and throughout the bear market, its primary purpose is to help reduce the fund’s overall volatility and provide some downside risk management in times when stocks are struggling.
Q: Do you have any other comments that you’d like to share?
A: We’d like to thank shareholders for their continued investment in Scudder Total Return Fund. The fund’s performance this period, we believe, illustrates its effectiveness. Losses in the equity portfolio early in the period were offset by gains in the bond portfolio. We believe this portfolio is suited for investors who want exposure to stocks but with less volatility than an all-stock portfolio.
The views expressed in this report reflect those of the portfolio managers only through the end of the period of the report as stated on the cover. The managers’ views are subject to change at any time based on market and other conditions and should not be construed as a recommendation.
12
Table of Contents
Portfolio Summary October 31, 2003
Asset Allocation | 10/31/03 | 10/31/02 | ||||
Common Stocks | 60 | % | 60 | % | ||
Corporate Bonds | 10 | % | 12 | % | ||
Collateralized Mortgage Obligations | 8 | % | 6 | % | ||
US Agency Pass-Thrus | 6 | % | 6 | % | ||
Asset Backed | 5 | % | 4 | % | ||
US Treasury Obligations | 4 | % | 8 | % | ||
Cash Equivalents | 3 | % | 3 | % | ||
Foreign Bonds - US$ Denominated | 3 | % | 1 | % | ||
Municipal Investments | 1 | % | — | |||
| 100 | % | 100 | % |
Sector Diversification (Excludes Cash Equivalents) | 10/31/03 | 10/31/02 | ||||
Information Technology | 26 | % | 22 | % | ||
Health Care | 21 | % | 22 | % | ||
Consumer Discretionary | 14 | % | 18 | % | ||
Consumer Staples | 12 | % | 9 | % | ||
Financials | 10 | % | 14 | % | ||
Industrials | 9 | % | 7 | % | ||
Energy | 6 | % | 6 | % | ||
Telecommunication Services | 1 | % | 2 | % | ||
Materials | 1 | % | — | |||
| 100 | % | 100 | % |
Asset allocation and sector diversification are subject to change.
Ten Largest Equity Holdings at October 31, 2003 (19.0% of Portfolio)
1. Intel Corp. Designer, manufacturer and seller of computer components and related products | 2.7% | |
2. Microsoft Corp. Developer of computer software | 2.5% | |
3. Pfizer, Inc. Manufacturer of prescription pharmaceuticals and non-prescription self-medications | 2.0% | |
4. General Electric Co. Industrial conglomerate | 1.9% | |
5. Wal-Mart Stores, Inc. Operator of discount stores | 1.9% | |
6. Johnson & Johnson Provider of health care products | 1.9% | |
7. Cisco Systems, Inc. Developer of computer network products | 1.6% | |
8. Applied Materials, Inc. Producer of semiconductor capital equipment | 1.5% | |
9. International Business Machines Corp. Manufacturer of computers and provider of information processing services | 1.5% | |
10. United Technologies Corp. Manufacturer of aerospace equipment, climate control systems and elevators | 1.5% | |
Portfolio holdings are subject to change.
For more complete details about the fund’s investment portfolio, see page 19. A quarterly Fact Sheet and Portfolio Holdings are available upon request.
13
Table of Contents
Investment Portfolio as of October 31, 2003
| Shares | Value ($) | |||
Common Stocks 60.8% | ||||
Consumer Discretionary 8.6% | ||||
Automobiles 0.9% | ||||
Harley-Davidson, Inc. | 385,000 | 18,252,850 | ||
Hotels, Restaurants & Leisure 1.5% | ||||
International Game Technology | 612,000 | 20,043,000 | ||
YUM! Brands, Inc.* | 325,100 | 11,098,914 | ||
| 31,141,914 | ||||
Media 3.0% | ||||
Comcast Corp. “A”* | 521,300 | 17,004,806 | ||
McGraw-Hill, Inc. | 203,300 | 13,610,935 | ||
Omnicom Group, Inc. | 238,300 | 19,016,340 | ||
Viacom, Inc. “B” | 343,404 | 13,691,517 | ||
| 63,323,598 | ||||
Multiline Retail 1.9% | ||||
Dollar General Corp. | 1 | 22 | ||
Kohl’s Corp.* | 214,400 | 12,021,408 | ||
Target Corp. | 663,200 | 26,355,568 | ||
| 38,376,998 | ||||
Specialty Retail 1.3% | ||||
Home Depot, Inc. | 218,450 | 8,097,942 | ||
Lowe’s Companies, Inc. | 199,100 | 11,732,963 | ||
Staples, Inc.* | 296,200 | 7,944,084 | ||
| 27,774,989 | ||||
Consumer Staples 7.2% | ||||
Beverages 1.9% | ||||
PepsiCo, Inc. | 578,800 | 27,678,216 | ||
The Coca-Cola Co. | 267,300 | 12,402,720 | ||
| 40,080,936 | ||||
Food & Drug Retailing 2.6% | ||||
Walgreen Co. | 411,700 | 14,335,394 | ||
Wal-Mart Stores, Inc. | 677,400 | 39,932,730 | ||
| 54,268,124 | ||||
Household Products 2.7% | ||||
Colgate-Palmolive Co. | 568,600 | 30,243,834 | ||
Procter & Gamble Co. | 257,500 | 25,309,675 | ||
| 55,553,509 | ||||
14
Table of Contents
Energy 3.5% | ||||
Energy Equipment & Services 2.3% | ||||
Baker Hughes, Inc. | 366,000 | 10,343,160 | ||
Nabors Industries Ltd.* | 516,600 | 19,527,480 | ||
Noble Corp.* | 167,500 | 5,750,275 | ||
Schlumberger Ltd. | 269,900 | 12,677,203 | ||
| 48,298,118 | ||||
Oil & Gas 1.2% | ||||
Burlington Resources, Inc. | 222,600 | 10,827,264 | ||
ConocoPhillips | 241,600 | 13,807,440 | ||
| 24,634,704 | ||||
Financials 6.5% | ||||
Banks 0.8% | ||||
Bank of America Corp. | 217,300 | 16,456,129 | ||
Bank United Corp.* | 3,300 | 132 | ||
| 16,456,261 | ||||
Diversified Financials 4.9% | ||||
American Express Co. | 530,000 | 24,872,900 | ||
Citigroup, Inc. | 576,729 | 27,336,955 | ||
Fannie Mae | 263,300 | 18,875,977 | ||
Goldman Sachs Group, Inc. | 33,500 | 3,145,650 | ||
Morgan Stanley | 289,600 | 15,890,352 | ||
State Street Corp. | 210,000 | 10,995,600 | ||
| 101,117,434 | ||||
Insurance 0.8% | ||||
American International Group, Inc. | 278,200 | 16,922,906 | ||
Health Care 12.8% | ||||
Biotechnology 2.3% | ||||
Amgen, Inc.* | 56,600 | 3,495,616 | ||
Genentech, Inc.* | 356,300 | 29,205,911 | ||
Gilead Sciences, Inc.* | 256,500 | 13,999,770 | ||
| 46,701,297 | ||||
Health Care Equipment & Supplies 2.7% | ||||
Baxter International, Inc. | 465,600 | 12,375,648 | ||
Boston Scientific Corp.* | 98,800 | 6,690,736 | ||
Medtronic, Inc. | 508,900 | 23,190,573 | ||
Zimmer Holdings, Inc.* | 213,800 | 13,642,578 | ||
| 55,899,535 | ||||
Health Care Providers & Services 0.9% | ||||
UnitedHealth Group, Inc. | 382,600 | 19,466,688 | ||
Pharmaceuticals 6.9% | ||||
Abbott Laboratories | 660,500 | 28,150,510 | ||
Eli Lilly & Co. | 340,500 | 22,684,110 | ||
Johnson & Johnson | 766,962 | 38,601,197 | ||
Merck & Co., Inc. | 255,500 | 11,305,875 | ||
Pfizer, Inc. | 1,313,775 | 41,515,290 | ||
| 142,256,982 | ||||
15
Table of Contents
Industrials 5.3% | ||||
Aerospace & Defense 1.5% | ||||
United Technologies Corp. | 360,100 | 30,496,869 | ||
Air Freight & Logistics 0.7% | ||||
FedEx Corp. | 187,300 | 14,189,848 | ||
Commercial Services & Supplies 0.6% | ||||
Fiserv, Inc.* | 370,000 | 13,068,400 | ||
Industrial Conglomerates 2.5% | ||||
3M Co. | 147,800 | 11,656,975 | ||
General Electric Co. | 1,391,600 | 40,370,316 | ||
| 52,027,291 | ||||
Information Technology 15.7% | ||||
Communications Equipment 1.6% | ||||
Cisco Systems, Inc.* | 1,570,500 | 32,949,090 | ||
Computers & Peripherals 3.0% | ||||
Dell, Inc.* | 210,300 | 7,596,036 | ||
EMC Corp.* | 1,689,200 | 23,378,528 | ||
International Business Machines Corp. | 346,800 | 31,031,664 | ||
| 62,006,228 | ||||
Semiconductor Equipment & Products 6.4% | ||||
Applied Materials, Inc.* | 1,346,500 | 31,467,705 | ||
Intel Corp. | 1,695,900 | 56,049,495 | ||
Linear Technology Corp. | 394,700 | 16,818,167 | ||
Texas Instruments, Inc. | 949,000 | 27,445,080 | ||
| 131,780,447 | ||||
Software 4.7% | ||||
BEA Systems, Inc.* | 235,100 | 3,267,890 | ||
Electronic Arts, Inc.* | 179,400 | 17,767,776 | ||
Microsoft Corp. | 1,991,900 | 52,088,185 | ||
MicroStrategy Inc. “A”* | 24 | 1,320 | ||
Oracle Corp.* | 833,800 | 9,972,248 | ||
Symantec Corp.* | 96,700 | 6,445,055 | ||
VERITAS Software Corp.* | 229,700 | 8,303,655 | ||
| 97,846,129 | ||||
Materials 0.5% | ||||
Chemicals | ||||
Ecolab, Inc. | 366,400 | 9,852,496 | ||
Telecommunication Services 0.7% | ||||
Diversified Telecommunication Services 0.4% | ||||
Verizon Communications, Inc. | 233,200 | 7,835,520 | ||
Wireless Telecommunication Services 0.3% | ||||
AT&T Wireless Services, Inc.* | 965,400 | 6,999,150 | ||
Total Common Stocks (Cost $1,032,462,481) | 1,259,578,311 | |||
16
Table of Contents
Warrants 0.0% | ||||
Information Technology | ||||
Software | ||||
MircoStrategy, Inc.* (Cost $0) | 106 | 30 | ||
Preferred Stocks 0.0% | ||||
Utilities | ||||
Electric Utilities | ||||
TNP Enterprises, Inc. (Cost $43,911) | 590 | 58,103 | ||
Convertible Preferred Stocks 0.0% | ||||
Materials | ||||
Chemicals | ||||
Hercules Trust II (Cost $240,491) | 385 | 249,524 | ||
| Principal Amount ($) | Value ($) | |||
Convertible Bonds 0.0% | ||||
Consumer Discretionary 0.0% | ||||
Textiles, Apparel & Luxury Goods | ||||
DIMON, Inc., 6.25%, 3/31/2007 | 120,000 | 114,000 | ||
Energy 0.0% | ||||
Energy Equipment & Services | ||||
Parker Drilling Co., 5.5%, 8/1/2004 | 220,000 | 218,086 | ||
Telecommunication Services 0.0% | ||||
Diversified Telecommunication Services | ||||
Nortel Networks Corp., 4.25%, 9/1/2008 | 130,000 | 122,798 | ||
Total Convertible Bonds (Cost $435,100) | 454,884 | |||
Corporate Bonds 10.5% | ||||
Consumer Discretionary 1.7% | ||||
American Achieve Corp., 11.625%, 1/1/2007 | 135,000 | 149,175 | ||
Ameristar Casino, Inc., 10.75%, 2/15/2009 | 65,000 | 74,913 | ||
AOL Time Warner, Inc.: | ||||
6.125%, 4/15/2006 | 2,035,000 | 2,188,854 | ||
6.75%, 4/15/2011 | 7,465,000 | 8,248,467 | ||
Boca Resorts, Inc., 9.875%, 4/15/2009 | 240,000 | 256,800 | ||
Broder Brothers Co., 144A, 11.25%, 10/15/2010 | 50,000 | 51,250 | ||
Buffets, Inc., 11.25%, 7/15/2010 | 130,000 | 140,400 | ||
Central Garden & Pet Co., 9.125%, 2/1/2013 | 80,000 | 87,800 | ||
Choctaw Resort Development Enterprises, 9.25%, 4/1/2009 | 235,000 | 256,444 | ||
Cinemark USA, Inc., 8.5%, 8/1/2008 | 245,000 | 255,413 | ||
Circus & Eldorado, 10.125%, 3/1/2012 | 100,000 | 102,375 | ||
17
Table of Contents
Comcast Cable Communications: | ||||
6.375%, 1/30/2006 | 3,075,000 | 3,311,926 | ||
6.875%, 6/15/2009 | 2,360,000 | 2,639,285 | ||
CSC Holdings, Inc., 7.875%, 12/15/2007 | 205,000 | 209,613 | ||
Dex Media East LLC, 12.125%, 11/15/2012 | 670,000 | 808,188 | ||
Dex Media West LLC, 144A, 9.875%, 8/15/2013 | 265,000 | 301,438 | ||
DIMON, Inc.: | ||||
144A, 7.75%, 6/1/2013 | 50,000 | 51,500 | ||
Series B, 9.625%, 10/15/2011 | 530,000 | 593,600 | ||
EchoStar DBS Corp.: | ||||
144A, 6.375%, 10/1/2011 | 650,000 | 646,750 | ||
9.375%, 2/1/2009 | 130,000 | 137,475 | ||
Eldorado Resorts LLC, 10.5%, 8/15/2006 | 141,000 | 142,586 | ||
Finlay Fine Jewelry Corp., 8.375%, 5/1/2008 | 270,000 | 278,100 | ||
General Motors Corp., 8.25%, 7/15/2023 | 1,290,000 | 1,357,001 | ||
Group 1 Automotive, Inc., 144A, 8.25%, 8/15/2013 | 120,000 | 130,200 | ||
Herbst Gaming, Inc., 10.75%, 9/1/2008 | 400,000 | 447,500 | ||
Host Marriott LP, 144A, 7.125%, 11/1/2013 | 215,000 | 214,731 | ||
International Game Technology, 8.375%, 5/15/2009 | 350,000 | 417,680 | ||
Intrawest Corp., 10.5%, 2/1/2010 | 145,000 | 159,319 | ||
J.C. Penney Co., Inc., 6.875%, 10/15/2015 | 65,000 | 65,650 | ||
Jacobs Entertainment Co., 11.875%, 2/1/2009 | 65,000 | 70,281 | ||
Jefra Cosmetics, 10.75%, 5/15/2011 | 80,000 | 88,000 | ||
Kellwood Co.: | ||||
7.625%, 10/15/2017 | 80,000 | 81,300 | ||
7.875%, 7/15/2009 | 55,000 | 58,781 | ||
Keystone Automotive Operation, 144A, 9.75%, 11/1/2013 | 70,000 | 73,850 | ||
Krystal, Inc., 10.25%, 10/1/2007 | 60,000 | 60,075 | ||
Laidlaw International, Inc., 144A, 10.75%, 6/15/2011 | 50,000 | 54,000 | ||
Lin Television Corp., 144A, 6.5%, 5/15/2013 | 85,000 | 82,663 | ||
Mediacom Broadband LLC, 11.0%, 7/15/2013 | 50,000 | 52,250 | ||
Mediacom LLC, 9.5%, 1/15/2013 | 50,000 | 47,500 | ||
Meritage Corp., 9.75%, 6/1/2011 | 70,000 | 77,700 | ||
MGM Mirage, Inc., 6.0%, 10/1/2009 | 175,000 | 177,188 | ||
Norcraft Co. LP, 144A, 9.0%, 11/1/2011 | 55,000 | 57,750 | ||
Park Place Entertainment Corp.: | ||||
8.875%, 9/15/2008 | 1,105,000 | 1,227,931 | ||
9.375%, 2/15/2007 | 395,000 | 444,375 | ||
PEI Holding, Inc., 11.0%, 3/15/2010 | 100,000 | 113,000 | ||
PRIMEDIA, Inc., 7.625%, 4/1/2008 | 145,000 | 144,275 | ||
Rayovac Corp., 144A, 8.5%, 10/1/2013 | 80,000 | 83,200 | ||
Remington Arms Co., Inc., 10.5%, 2/1/2011 | 145,000 | 151,706 | ||
Schuler Homes, Inc., 10.5%, 7/15/2011 | 275,000 | 313,844 | ||
Scientific Games Corp., 12.5%, 8/15/2010 | 92,000 | 108,560 | ||
Sealy Mattress Co., Series B, 9.875%, 12/15/2007 | 50,000 | 51,625 | ||
Sinclair Broadcast Group, Inc.: | ||||
8.0%, 3/15/2012 | 345,000 | 363,975 | ||
8.75%, 12/15/2011 | 275,000 | 301,125 | ||
Six Flags, Inc., 8.875%, 2/1/2010 | 245,000 | 232,750 | ||
Sonic Automotive, Inc., 144A, 8.625%, 8/15/2013 | 240,000 | 253,800 | ||
18
Table of Contents
Time Warner Cos., Inc.: | ||||
7.75%, 6/15/2005 | 2,020,000 | 2,189,108 | ||
8.11%, 8/15/2006 | 2,860,000 | 3,221,407 | ||
Transwestern Publishing, Series F, 9.625%, 11/15/2007 | 395,000 | 406,850 | ||
Venetian Casino Resort LLC, 144A, 11.0%, 6/15/2010 | 145,000 | 167,294 | ||
Wheeling Island Gaming, Inc., 10.125%, 12/15/2009 | 140,000 | 144,200 | ||
Williams Scotsman, Inc., 144A, 10.0%, 8/15/2008 | 85,000 | 93,500 | ||
Worldspan LP/ WS Finance Corp., 144A, 9.625%, 6/15/2011 | 100,000 | 97,500 | ||
| 34,815,796 | ||||
Consumer Staples 0.2% | ||||
Agrilink Foods, Inc., 11.875%, 11/1/2008 | 46,000 | 48,645 | ||
DaimlerChrysler NA, 6.5%, 11/15/2013 | 2,285,000 | 2,302,732 | ||
Elizabeth Arden, Inc., Series B, 11.75%, 2/1/2011 | 143,000 | 163,735 | ||
Hines Nurseries, Inc., 144A, 10.25%, 10/1/2011 | 50,000 | 53,500 | ||
National Beef Pack, 144A, 10.5%, 8/1/2011 | 65,000 | 71,500 | ||
Pilgrim’s Pride Corp., 9.625%, 9/15/2011 | 100,000 | 109,375 | ||
Salton, Inc., 10.75%, 12/15/2005 | 90,000 | 88,200 | ||
Stater Brothers Holdings, Inc., 10.75%, 8/15/2006 | 315,000 | 331,931 | ||
Williams Scotsman, Inc., 9.875%, 6/1/2007 | 75,000 | 76,125 | ||
| 3,245,743 | ||||
Energy 1.0% | ||||
Avista Corp., 9.75%, 6/1/2008 | 715,000 | 843,700 | ||
Chesapeake Energy Corp., 8.125%, 4/1/2011 | 170,000 | 186,575 | ||
Citgo Petroleum Corp., 11.375%, 2/1/2011 | 550,000 | 621,500 | ||
Dynegy Holdings, Inc., 144A, 9.875%, 7/15/2010 | 110,000 | 118,250 | ||
Gulfterra Energy Partner, 144A, 6.25%, 6/1/2010 | 55,000 | 55,275 | ||
Lone Star Technologies, Inc., Series B, 9.0%, 6/1/2011 | 180,000 | 175,050 | ||
Newpark Resources, Inc., 8.625%, 12/15/2007 | 90,000 | 92,925 | ||
Parker Drilling Co.: | ||||
144A, 9.625%, 10/1/2013 | 90,000 | 92,475 | ||
Series B, 10.125%, 11/15/2009 | 190,000 | 198,550 | ||
Pedernales Electric Cooperative, Series 02-A, 144A, 6.202%, 11/15/2032 | 7,330,000 | 7,331,686 | ||
Pioneer Natural Resources Co., 9.625%, 4/1/2010 | 750,000 | 912,758 | ||
Southern Natural Gas Co., 8.875%, 3/15/2010 | 110,000 | 119,900 | ||
Stone Energy Corp., 8.25%, 12/15/2011 | 300,000 | 321,000 | ||
Tristate Generation & Transmission Association: | ||||
144A, 6.04%, 1/31/2018 | 4,000,000 | 4,073,888 | ||
144A, 7.144%, 7/31/2033 | 3,740,000 | 3,880,534 | ||
Westport Resources Corp.: | ||||
Series 144, 8.25%, 11/1/2011 | 50,000 | 55,125 | ||
8.25%, 11/1/2011 | 335,000 | 369,338 | ||
Williams Co., Inc.: | ||||
8.75%, 3/15/2032 | 110,000 | 114,950 | ||
8.125% 3/15/2012 | 50,000 | 54,000 | ||
Williams Holdings of Delaware, Inc., 6.5%, 12/1/2008 | 215,000 | 217,150 | ||
| 19,834,629 | ||||
Financials 3.1% | ||||
Ahold Finance USA, Inc., 6.25%, 5/1/2009 | 275,000 | 273,625 | ||
19
Table of Contents
American General Finance Co., 4.625%, 9/1/2010 | 7,385,000 | 7,417,191 | ||
AmeriCredit Corp.: | ||||
9.25%, 5/1/2009 | 150,000 | 153,000 | ||
9.875%, 4/15/2006 | 240,000 | 244,800 | ||
ASIF Global Finance, 144A, 4.9%, 1/17/2013 | 1,920,000 | 1,891,722 | ||
CBRE Escrow, Inc., 144A, 9.75%, 5/15/2010 | 135,000 | 145,800 | ||
Citigroup, Inc., 6.0%, 10/31/2033 | 6,705,000 | 6,677,181 | ||
Dollar Financial Group, Series A, 10.875%, 11/15/2006 | 50,000 | 50,750 | ||
Farmers Insurance Exchange, 144A, 8.625%, 5/1/2024 | 280,000 | 289,100 | ||
Ford Motor Credit Co.: | ||||
5.8%, 1/12/2009 | 2,475,000 | 2,411,076 | ||
7.5%, 3/15/2005 | 6,395,000 | 6,718,709 | ||
General Electric Capital Corp., 5.45%, 1/15/2013 | 645,000 | 666,110 | ||
General Motors Acceptance Corp.: | ||||
4.5%, 7/15/2006 | 5,480,000 | 5,564,178 | ||
6.875%, 9/15/2011 | 2,075,000 | 2,140,576 | ||
Household Finance Corp., 6.5%, 1/24/2006 | 5,640,000 | 6,137,087 | ||
IOS Capital LLC, 7.25%, 6/30/2008 | 210,000 | 208,425 | ||
LaBranche & Co., Inc., 12.0%, 3/2/2007 | 125,000 | 128,125 | ||
OneAmerica Financial Partners, 144A, 7.0%, 10/15/2033 | 2,925,000 | 2,870,788 | ||
PNC Funding Corp., 5.75%, 8/1/2006 | 3,450,000 | 3,710,227 | ||
Pxre Capital Trust I, 8.85%, 2/1/2027 | 125,000 | 112,500 | ||
Qwest Corp., 7.25%, 10/25/2035 | 50,000 | 46,250 | ||
R.H. Donnelly Finance Corp.: 144A, 10.875%, 12/15/2012 | 175,000 | 208,688 | ||
10.875%, 12/15/2012 | 10,000 | 11,925 | ||
Thornburg Mortgage, Inc., 8.0%, 5/15/2013 | 225,000 | 236,250 | ||
UBS Preferred Funding Trust I, 8.622%**, 10/1/2049 | 2,525,000 | 3,094,531 | ||
Universal City Development, 11.75%, 4/1/2010 | 85,000 | 98,281 | ||
Verizon Global Funding Corp., 7.25%, 12/1/2010 | 5,395,000 | 6,161,430 | ||
Wachovia Corp., 7.5%, 7/15/2006 | 870,000 | 984,576 | ||
Westpac Capital Trust III, 144A, 5.819%, 12/31/2049 | 5,270,000 | 5,416,980 | ||
| 64,069,881 | ||||
Health Care 0.2% | ||||
AmerisourceBergen Corp., 7.25%, 11/15/2012 | 395,000 | 406,850 | ||
Genesis Healthcare Corp., 144A, 8.0%, 10/15/2013 | 55,000 | 56,169 | ||
Health Care Service Corp., 144A, 7.75%, 6/15/2011 | 2,000,000 | 2,325,780 | ||
National Nephrology Association, 144A, 9.0%, 11/1/2011 | 50,000 | 51,625 | ||
Neighbore, Inc., 144A, 6.875%, 11/15/2013 | 55,000 | 55,894 | ||
Norcross Safety Products, 144A, 9.875%, 8/15/2011 | 85,000 | 91,800 | ||
Quintiles Transnational Corp., 144A, 10.0%, 10/1/2013 | 50,000 | 52,750 | ||
Tenet Healthcare Corp.: | ||||
6.375%, 12/1/2011 | 570,000 | 528,675 | ||
7.375%, 2/1/2013 | 365,000 | 354,050 | ||
| 3,923,593 | ||||
Industrials 1.1% | ||||
Allied Waste North America, Inc.: | ||||
Series B, 8.5%, 12/1/2008 | 530,000 | 584,325 | ||
Series B, 8.875%, 4/1/2008 | 120,000 | 132,600 | ||
20
Table of Contents
Series B, 10.0%, 8/1/2009 | 340,000 | 369,750 | ||
AMI Semiconductor, Inc., 10.75%, 2/1/2013 | 85,000 | 98,600 | ||
Amsted Industries, Inc., 144A, 10.25%, 10/15/2011 | 50,000 | 55,125 | ||
Argo-Tech Corp., 8.625%, 10/1/2007 | 120,000 | 118,800 | ||
AutoNation, Inc., 9.0%, 8/1/2008 | 460,000 | 524,400 | ||
Avondale Mills, Inc., 144A, 10.25%, 7/1/2013 | 180,000 | 136,800 | ||
BAE System 2001 Asset Trust “B”, Series 2001, 144A, 7.156%, 12/15/2011 | 1,992,858 | 2,181,564 | ||
Case New Holland, Inc., 144A, 9.25%, 8/1/2011 | 110,000 | 122,100 | ||
Collins & Aikman Floor Cover, Series B, 9.75%, 2/15/2010 | 155,000 | 166,625 | ||
Collins & Aikman Products, 10.75%, 12/31/2011 | 135,000 | 113,400 | ||
Corrections Corp. of America: 144A, 7.5%, 5/1/2011 | 135,000 | 141,075 | ||
9.875%, 5/1/2009 | 200,000 | 224,250 | ||
CP Ships Ltd., 10.375%, 7/15/2012 | 260,000 | 299,000 | ||
Dana Corp.: | ||||
7.0%, 3/1/2029 | 85,000 | 75,438 | ||
9.0%, 8/15/2011 | 190,000 | 212,325 | ||
Delta Air Lines, Inc.: | ||||
Series 02-1, 6.417%, 7/2/2012 | 6,490,000 | 6,772,124 | ||
7.7%, 12/15/2005 | 65,000 | 60,938 | ||
DRS Technologies, Inc., 144A, 6.875%, 11/1/2013 | 70,000 | 70,350 | ||
Eagle-Picher Industries, Inc., 144A, 9.75%, 9/1/2013 | 85,000 | 90,100 | ||
Flextronics International Ltd., 144A, 6.5%, 5/15/2013 | 180,000 | 177,750 | ||
Golden State Petroleum Transportation, 8.04%, 2/1/2019 | 120,000 | 114,082 | ||
Hercules, Inc., 11.125%, 11/15/2007 | 480,000 | 556,800 | ||
Hornbeck Offshore Services, Inc., 10.625%, 8/1/2008 | 130,000 | 143,650 | ||
ISP Chemco, Inc., Series B, 10.25%, 7/1/2011 | 160,000 | 178,800 | ||
ISP Holdings, Inc., Series B, 10.625%, 12/15/2009 | 50,000 | 54,750 | ||
Kansas City Southern: | ||||
7.5%, 6/15/2009 | 50,000 | 51,875 | ||
9.5%, 10/1/2008 | 330,000 | 363,000 | ||
Millennium America, Inc.: | ||||
7.625%, 11/15/2026 | 125,000 | 106,875 | ||
9.25%, 6/15/2008 | 785,000 | 830,138 | ||
144A, 9.25%, 6/15/2008 | 90,000 | 95,175 | ||
Mobile Mini, Inc., 144A, 9.5%, 7/1/2013 | 125,000 | 136,875 | ||
Overseas Shipholding Group, 8.75%, 12/1/2013 | 55,000 | 59,400 | ||
Plainwell, Inc., Series B, 11.0%, 3/1/2008* | 4,230,000 | 211,500 | ||
Raytheon Co., 8.2%, 3/1/2006 | 1,190,000 | 1,330,393 | ||
Seabulk International, Inc., 144A, 9.5%, 8/15/2013 | 120,000 | 123,600 | ||
Systems 2001 Asset Trust LLC “G”, Series 2001, 144A, 6.664%, 9/15/2013 | 5,616,206 | 6,189,340 | ||
Tech Olympic USA, Inc., 10.375%, 7/1/2012 | 100,000 | 109,500 | ||
Westlake Chemical Corp., 144A, 8.75%, 7/15/2011 | 280,000 | 295,400 | ||
Xerox Corp., 7.125%, 6/15/2010 | 235,000 | 239,700 | ||
| 23,918,292 | ||||
Information Technology 0.0% | ||||
Cooperative Computing, 144A, 10.5%, 6/15/2011 | 50,000 | 54,000 | ||
Digitalnet, Inc., 144A, 9.0%, 7/15/2010 | 52,000 | 56,680 | ||
Telex Communications, Inc., 144A, 11.5%, 10/15/2008 | 50,000 | 51,750 | ||
| 162,430 | ||||
21
Table of Contents
Materials 0.9% | ||||
ARCO Chemical Co., 9.8%, 2/1/2020 | 560,000 | 501,200 | ||
Boise Cascade Co., 6.5%, 11/1/2010 | 80,000 | 81,740 | ||
Buckeye Technologies, Inc., 144A, 8.5%, 10/1/2013 | 100,000 | 104,500 | ||
Caraustar Industries, Inc., 9.875%, 4/1/2011 | 165,000 | 172,425 | ||
Cascades, Inc., 7.25%, 2/15/2013 | 245,000 | 256,025 | ||
Dow Chemical Co., 7.0%, 8/15/2005 | 6,450,000 | 6,915,251 | ||
Equistar Chemicals LP: | ||||
8.75%, 2/15/2009 | 1,035,000 | 1,029,825 | ||
144A, 10.625%, 5/1/2011 | 60,000 | 62,700 | ||
Euramax International PLC, 144A, 8.5%, 8/15/2011 | 120,000 | 127,200 | ||
Georgia-Pacific Corp.: | ||||
8.0%, 1/15/2014 | 50,000 | 53,750 | ||
8.875%, 2/1/2010 | 240,000 | 274,200 | ||
8.875%, 5/15/2031 | 1,120,000 | 1,190,000 | ||
Debenture, 7.7%, 6/15/2015 | 65,000 | 67,600 | ||
Huntsman Advanced Materials LLC, 144A, 11.0%, 7/15/2010 | 105,000 | 112,481 | ||
Huntsman International LLC, 144A, 11.625%, 10/15/2010 | 50,000 | 48,000 | ||
IMC Global, Inc., 144A, 10.875%, 8/1/2013 | 285,000 | 294,263 | ||
Koppers Industry, Inc., 144A, 9.875%, 10/15/2013 | 80,000 | 84,400 | ||
Nalco Co., 144A, 7.75%, 11/15/2011 | 165,000 | 171,600 | ||
Owens-Brockway Glass Container, 8.25%, 5/15/2013 | 270,000 | 284,850 | ||
Resolution Performance Products LLC, 9.5%, 4/15/2010 | 80,000 | 84,400 | ||
Rockwood Specialties Corp., 144A, 10.625%, 5/15/2011 | 75,000 | 80,625 | ||
Texas Industries, Inc., 144A, 10.25%, 6/15/2011 | 120,000 | 133,800 | ||
Toll Corp., 8.25%, 2/1/2011 | 225,000 | 249,750 | ||
Trimas Corp., 9.875%, 6/15/2012 | 145,000 | 145,725 | ||
United States Steel LLC, 9.75%, 5/15/2010 | 260,000 | 274,300 | ||
Weyerhaeuser Co., 7.375%, 3/15/2032 | 6,065,000 | 6,529,294 | ||
| 19,329,904 | ||||
Telecommunication Services 0.3% | ||||
ACC Escrow Corp., 144A, 10.0%, 8/1/2011 | 365,000 | 397,850 | ||
Cincinnati Bell, Inc., 144A, 8.375%, 1/15/2014 | 280,000 | 288,750 | ||
Insight Midwest: | ||||
9.75%, 10/1/2009 | 50,000 | 51,000 | ||
10.5%, 11/1/2010 | 100,000 | 104,500 | ||
Nextel Communications, Inc., 9.5%, 2/1/2011 | 370,000 | 417,175 | ||
Qwest Corp., 5.625%, 11/15/2008 | 695,000 | 681,100 | ||
Shaw Communications, Inc., 8.25%, 4/11/2010 | 185,000 | 204,425 | ||
Telecomunicaciones de Puerto Rico, Inc., 6.65%, 5/15/2006 | 2,965,000 | 3,207,110 | ||
Triton PCS, Inc., 8.5%, 6/1/2013 | 50,000 | 52,625 | ||
Verizon New York, Inc., 6.875%, 4/1/2012 | 582,000 | 638,486 | ||
| 6,043,021 | ||||
Utilities 2.0% | ||||
AES Corp., 144A, 9.0%, 5/15/2015 | 75,000 | 80,250 | ||
Alabama Power Co., 7.125%, 8/15/2004 | 3,500,000 | 3,657,455 | ||
Appalachian Power Co., 4.8%, 6/15/2005 | 8,730,000 | 9,060,535 | ||
CMS Energy Corp.: | ||||
7.5%, 1/15/2009 | 625,000 | 635,938 | ||
22
Table of Contents
144A, 7.75%, 8/1/2010 | 195,000 | 198,413 | ||
8.5%, 4/15/2011 | 210,000 | 219,450 | ||
Consumers Energy Co., 6.0%, 3/15/2005 | 3,925,000 | 4,124,421 | ||
El Paso Production Holding Corp., 144A, 7.75%, 6/1/2013 | 400,000 | 384,000 | ||
Indiana Michigan Power, 6.375%, 11/1/2012 | 5,040,000 | 5,404,815 | ||
MSW Energy Holdings/Finance, 144A, 8.5%, 9/1/2010 | 65,000 | 69,550 | ||
Pacificorp., 6.9%, 11/15/2011 | 2,105,000 | 2,381,435 | ||
Progress Energy, Inc., 6.75%, 3/1/2006 | 8,975,000 | 9,766,649 | ||
TNP Enterprises, Inc., Series B, 10.25%, 4/1/2010 | 275,000 | 290,125 | ||
Western Resources, Inc., 9.75%, 5/1/2007 | 260,000 | 296,075 | ||
Xcel Energy, Inc., 7.0%, 12/1/2010 | 3,685,000 | 4,140,190 | ||
| 40,709,301 | ||||
Total Corporate Bonds (Cost $212,615,628) | 216,052,590 | |||
Asset Backed 4.6% | ||||
Automobile Receivables 2.2% | ||||
Americredit Automobile Receivables Trust “A4”, Series 2001-C, 5.01%, 7/14/2008 | 13,420,000 | 13,874,851 | ||
MMCA Automobile Trust: | ||||
“A4”, Series 2002-3, 3.57%, 8/17/2009 | 10,625,000 | 10,629,553 | ||
“B”, Series 2002-2, 4.67%, 3/15/2010 | 9,457,956 | 8,305,627 | ||
“C”, Series 2002-2, 5.55%, 3/15/2010 | 2,953,961 | 2,067,773 | ||
WFS Financial Owner Trust, “A4”, Series 2002-2, 4.5%, 2/20/2010 | 9,540,000 | 9,894,873 | ||
| 44,772,677 | ||||
Home Equity Loans 1.3% | ||||
Centex Home Equity: | ||||
“AF6”, Series 2002-D, 4.66%, 12/25/2032 | 6,430,000 | 6,437,589 | ||
“AF6”, Series 2002-A, 5.54%, 1/25/2032 | 6,090,000 | 6,412,694 | ||
Chase Funding Mortgage Loan, “IA5”, Series 1999-2, 7.333%, 11/24/2011 | 4,855,164 | 5,224,455 | ||
Federal Home Loan Mortgage Corp.: “3A”, Series T-58, 7.0%, 10/25/2043 | 4,106,429 | 4,322,012 | ||
“3A”, Series T-41, 7.5%, 7/25/2032 | 3,363,712 | 3,693,776 | ||
| 26,090,526 | ||||
Miscellaneous 1.1% | ||||
Aircraft Certificate Owner Trust “E”, Series 2003-1A, 144A, 7.001%, 9/20/2022 | 8,365,000 | 8,749,706 | ||
Detroit Edison Securitization Funding LLC “A6”, Series 2001-1, 6.62%, 3/1/2016 | 9,186,000 | 10,291,866 | ||
PSE&G Transition Funding LLC “A8”, Series 2001-1, 6.89%, 12/15/2017 | 3,225,000 | 3,699,353 | ||
| 22,740,925 | ||||
Total Asset Backed (Cost $94,135,758) | 93,604,128 | |||
Foreign Bonds - US$ Denominated 3.0% | ||||
Arcel Finance Ltd., 144A, 7.048%, 9/1/2011 | 2,505,000 | 2,517,525 | ||
Autopista Del Maipo, 144A, 7.373%, 6/15/2022 | 6,805,000 | 7,413,571 | ||
Biovail Corp., 7.875%, 4/1/2010 | 190,000 | 186,675 | ||
Burns, Philp & Co., Ltd., 144A, 9.75%, 7/15/2012 | 110,000 | 112,200 | ||
Conproca SA de CV, 12.0%, 6/16/2010 | 240,000 | 304,800 | ||
Crown Euro Holdings SA, 10.875%, 3/1/2013 | 280,000 | 319,200 |
23
Table of Contents
Eircom Funding, 144A, 8.25%, 8/15/2013 | 150,000 | 163,125 | ||
Esprit Telecom Group PLC, 11.5%, 12/15/2007* | 2,370,000 | 237 | ||
Fage Dairy Industry SA, 9.0%, 2/1/2007 | 290,000 | 290,000 | ||
Federative Republic of Brazil, 8.0%, 4/15/2014 | 511,035 | 478,457 | ||
Gerdau Ameristeel Corp., 144A, 10.375%, 7/15/2011 | 55,000 | 57,475 | ||
Grupo Elektra SA de CV, 12.0%, 4/1/2008 | 115,000 | 122,763 | ||
Innova S de R.L.: | ||||
144A, 9.375%, 9/19/2013 | 195,000 | 196,463 | ||
12.875%, 4/1/2007 | 59,733 | 61,525 | ||
Inversiones CMPC SA, 144A, 4.875%, 6/18/2013 | 6,325,000 | 6,014,215 | ||
LeGrand SA, 8.5%, 2/15/2025 | 80,000 | 84,000 | ||
Luscar Coal Ltd., 9.75%, 10/15/2011 | 160,000 | 180,400 | ||
Mantis Reef Ltd., 144A, 4.692%, 11/14/2008 | 8,580,000 | 8,580,000 | ||
Mobile Telesystems Financial, 144A, 8.375%, 10/14/2010 | 130,000 | 128,050 | ||
OAO Gazprom, 144A, 9.625%, 3/1/2013 | 300,000 | 325,500 | ||
Petroleos Mexicanos, 9.5%, 9/15/2027 | 4,510,000 | 5,344,350 | ||
PTC International Finance II SA, 11.25%, 12/1/2009 | 115,000 | 125,638 | ||
QBE Insurance Group Ltd., 144A, 5.647%, 7/1/2023 | 3,600,000 | 3,394,026 | ||
Republic of Bulgaria, 144A, 8.25%, 1/15/2015 | 50,000 | 56,875 | ||
Republic of Poland, 5.25%, 1/15/2014 | 4,470,000 | 4,446,488 | ||
Royal Bank of Scotland Group PLC, Series 3, 7.816%, 11/1/2049 | 3,435,000 | 3,807,165 | ||
Royal Caribbean Cruises Ltd., 7.5%, 10/15/2027 | 135,000 | 125,550 | ||
SP Powerassets Ltd., 144A, 5.0%, 10/22/2013 | 3,750,000 | 3,738,285 | ||
St. George Bank Ltd., 144A, 5.3%, 10/15/2015 | 1,615,000 | 1,606,482 | ||
Telus Corp., 8.0%, 6/1/2011 | 415,000 | 477,113 | ||
Tembec Industries, Inc., 144A, 8.5%, 2/1/2011 | 510,000 | 492,150 | ||
TFM SA de CV: | ||||
10.25%, 6/15/2007 | 550,000 | 561,000 | ||
11.75% to 6/15/2009 | 110,000 | 110,825 | ||
12.5%, 6/15/2012 | 165,000 | 181,500 | ||
Tyco International Group SA: | ||||
5.8%, 8/1/2006 | 5,025,000 | 5,251,125 | ||
6.375%, 2/15/2006 | 3,810,000 | 4,033,838 | ||
6.75%, 2/15/2011 | 55,000 | 58,506 | ||
Ukraine Government, 144A, 7.65%, 6/11/2013 | 150,000 | 148,688 | ||
United Mexican States, 7.5%, 4/8/2033 | 564,000 | 575,844 | ||
Vicap SA, 11.375%, 5/15/2007 | 140,000 | 135,800 | ||
Vitro SA de CV, 144A, 11.75%, 11/1/2013 | 75,000 | 72,563 | ||
Vivendi Universal SA: | ||||
144A, 6.25%, 7/15/2008 | 375,000 | 391,875 | ||
144A, 9.25%, 4/15/2010 | 150,000 | 174,375 | ||
Yell Finance BV, Step-up Coupon, 0% to 8/1/2006, 13.5% to 8/1/2011 | 32,000 | 29,120 | ||
Total Foreign Bonds - US$ Denominated (Cost $65,036,514) | �� | 62,875,362 | ||
US Treasury Obligations 3.8% | ||||
US Treasury Bond: | ||||
5.375%, 2/15/2031 | 300,000 | 310,019 | ||
6.0%, 2/15/2026 | 36,292,000 | 39,867,343 | ||
24
Table of Contents
US Treasury Note: | ||||
1.625%, 4/30/2005 | 18,639,000 | 18,663,026 | ||
5.0%, 8/15/2011 | 13,480,000 | 14,384,104 | ||
6.125%, 8/15/2007 | 1,889,000 | 2,117,008 | ||
US Treasury STRIP, Principal only, 5.728%***, 8/15/2026 | 12,231,000 | 3,436,874 | ||
Total US Treasury Obligations (Cost $78,900,183) | 78,778,374 | |||
US Agency Pass-Thrus 5.7% | ||||
Federal Home Loan Mortgage Corp.: | ||||
5.0%, 7/1/2018 | 3,646,340 | 3,705,318 | ||
5.0%, 11/1/2033(e) | 8,300,000 | 8,167,715 | ||
6.5%, 11/1/2033 | 2,245,000 | 2,334,800 | ||
Federal National Mortgage Association: | ||||
4.5%, 11/1/2018(e) | 3,740,000 | 3,735,325 | ||
5.0% with various maturities from 6/1/2018 until 11/1/2033(e) | 9,973,380 | 9,989,227 | ||
5.5% with various maturities from 3/1/2018 until 8/1/2033(e) | 39,903,298 | 40,571,659 | ||
5.946%, 2/1/2012 | 14,155,616 | 15,367,699 | ||
6.0% with various maturities from 11/1/2017 until 11/1/2031(e) | 5,848,701 | 6,063,722 | ||
6.25%, 3/1/2011 | 8,040,000 | 8,954,395 | ||
6.5% with various maturities from 4/1/2017 until 11/1/2033 | 13,324,109 | 13,894,238 | ||
8.0%, 9/1/2015 | 1,895,722 | 2,029,047 | ||
Government National Mortgage Association, 5.0%, 9/20/2033 | 3,800,924 | 3,747,545 | ||
Total US Agency Pass-Thrus (Cost $118,444,891) | 118,560,690 | |||
Collateralized Mortgage Obligations 8.0% | ||||
CountryWide Home Loans, Series 2002-27, 5.5%, 12/25/2032 | 7,740,000 | 7,870,609 | ||
Federal Home Loan Corp., Series 2513, 5.0%, 8/15/2028 | 2,206,391 | 2,233,427 | ||
Federal Home Loan Mortgage Corp.: | ||||
“MA”, Series 2663, 3.5%, 1/15/2010 | 970,000 | 984,251 | ||
“A2B”, Series T-56, 4.29%, 5/25/2033 | 7,440,000 | 7,610,639 | ||
“TG”, Series 2690, 4.5%, 4/15/2032 | 3,750,000 | 3,551,614 | ||
“HG”, Series 2543, 4.75%, 9/15/2028 | 5,985,069 | 6,088,801 | ||
“JE”, Series 2639, 5.0%, 1/15/2032 | 3,700,000 | 3,656,427 | ||
“DB”, Series 2483, 5.5%, 9/15/2012 | 2,755,097 | 2,758,258 | ||
“PE”, Series 2512, 5.5%, 2/15/2022 | 585,000 | 597,052 | ||
“PL”, Series 2459, 5.5%, 6/15/2030 | 977,056 | 983,165 | ||
“PX”, Series 2097, 6.0%, 10/15/2027 | 4,808,142 | 4,916,361 | ||
“GA”, Series 2450, 6.25%, 10/15/2022 | 1,819,119 | 1,841,131 | ||
“A”, Series 2413, 6.5%, 11/15/2029 | 103,993 | 104,326 | ||
“PE”, Series 2208, 7.0%, 12/15/2028 | 307,943 | 308,875 | ||
Federal National Mortgage Association: | ||||
“WB”, Series 2003-106, 4.5%, 10/25/2015 | 5,680,000 | 5,887,676 | ||
“A2”, Series 2002-W10, 4.7%, 8/25/2042 | 2,525,000 | 2,574,443 | ||
“A2”, Series 2002-W9, 4.7%, 8/25/2042 | 2,525,000 | 2,569,324 | ||
“1A5”, Series 2003-W14, 4.71%, 9/25/2043 | 7,858,932 | 8,046,496 | ||
“PE”, Series 2003-58, 5.0%, 3/25/2032 | 3,780,000 | 3,658,674 | ||
25
Table of Contents
“PE”, Series 2002-3, 5.5%, 8/25/2015 | 16,234,500 | 16,853,773 | ||
“A2”, Series 2002-W3, 5.5%, 10/25/2021 | 7,046,716 | 7,168,209 | ||
“QN”, Series 2001-51, 6.0%, 10/25/2016 | 7,450,000 | 7,817,882 | ||
“VD”, Series 2002-56, 6.0%, 4/25/2020 | 1,810,000 | 1,895,406 | ||
“P4”, Series 2002-31, 6.0%, 11/25/2021 | 15,683,663 | 16,428,002 | ||
“QE”, Series 2001-64, 6.0%, 4/25/2027 | 5,490,000 | 5,529,729 | ||
“B”, Series 1999-32, 6.0%, 7/25/2029 | 3,425,722 | 3,591,364 | ||
“AN”, Series 2000-27, 6.0%, 8/25/2030 | 1,387,540 | 1,434,736 | ||
“ZQ”, Series G92-9, 7.0%, 12/25/2021 | 3,389,738 | 3,587,745 | ||
“2A”, Series 2003-W8, 7.0%, 10/25/2042 | 7,293,231 | 7,826,366 | ||
“A5”, Series 2002-W4, 7.5%, 5/25/2042 | 3,622,655 | 3,966,807 | ||
“2A”, Series 2002-W6, 7.5%, 6/25/2042 | 9,683,991 | 10,603,970 | ||
NYC Mortgage Loan Trust, Series 1996, 6.75%, 9/25/2019 | 4,100,000 | 4,515,125 | ||
Residential Funding Mortgage Securities I: “A1”, Series 2002-S6, 6.0%, 4/25/2017 | 3,492,236 | 3,515,258 | ||
“A5”, Series 2003-S2, 5.0%, 2/25/2033 | 1,916,782 | 1,937,404 | ||
Structured Asset Securities Corp., Series 2003-1, 6.0%, 2/25/2018 | 3,370,388 | 3,458,967 | ||
Total Collateralized Mortgage Obligations (Cost $163,876,628) | 166,372,292 | |||
Municipal Investments 1.0% | ||||
Bergen County, NJ, Core City GO, Improvement Authority Governmental Loan Revenue: | ||||
4.75%, 3/15/2015(d) | 2,105,000 | 2,026,063 | ||
4.8%, 3/15/2016(d) | 2,315,000 | 2,212,816 | ||
Charlotte-Mecklenberg, NC, Hospital Authority Health Care System Revenue, ETM, 5.0%, 8/1/2015 | 3,880,000 | 3,859,902 | ||
Indian Wells, CA, Industrial Development Revenue, Redevelopment Agency, 4.48%, 9/1/2022(c) | 2,325,000 | 2,275,919 | ||
Hoboken, NJ, Serie B: | ||||
3.57%, 2/1/2008(c) | 1,725,000 | 1,724,258 | ||
3.97%, 2/1/2009(c) | 2,860,000 | 2,854,480 | ||
New Jersey, Water & Sewer Revenue, District Water Supply, 5.19%, 7/1/2019(c) | 1,000,000 | 982,500 | ||
Oregon, State GO, 5.762%, 6/1/2023 | 4,665,000 | 4,680,908 | ||
Total Municipal Investments (Cost $20,825,839) | 20,616,846 | |||
| Shares | Value ($) | |||
Cash Equivalents 2.6% | ||||
Scudder Cash Management QP Trust, 1.07% (b) (Cost $53,374,227) | 53,374,227 | 53,374,227 | ||
Total Investment Portfolio - 100.0% (Cost $1,840,391,651) (a) | 2,070,575,361 | |||
| * | Non-income producing security. In the case of a bond, generally denotes that the issuer has defaulted on the payment of principal or interest or has filed for bankruptcy. |
| ** | Variable rate demand notes are securities whose interest rate are reset periodically at market levels. These securities are often payable on demand and are shown at their current rates as of October 31, 2003. *** Bond equivalent yield to maturity; not a coupon rate. |
| (a) | The cost for federal income tax purposes was $1,875,666,132. At October 31, 2003, net unrealized appreciation for all securities based on tax cost was $194,909,229. This consisted of aggregate gross unrealized appreciation for all securities in which there was an excess of value over tax cost of $244,988,291 and aggregate gross unrealized depreciation for all securities in which there was an excess of tax cost over value of $50,079,062. |
| (b) | Scudder Cash Management QP Trust is also managed by Deutsche Investment Management Americas Inc. The rate shown is the annualized seven-day yield at period end. (c) Bond is insured by one of these companies: |
AMBAC | AMBAC Assurance Corp. | |
MBIA | Municipal Bond Investors Assurance |
| (d) | Security incorporates a letter of credit or line of credit from a major bank. |
| (e) | Mortgage dollar rolls included |
Included in the portfolio are investments in mortgage or asset-backed securities which are interests in separate pools of mortgages or assets. Effective maturities of these investments may be shorter than stated maturities due to prepayments. Some separate investments in the Federal National Mortgage Association issues which have similar coupon rates have been aggregated for presentation purposes in the investment portfolio.
144A: Security exempt from registration under Rule 144A of the Securities Act of 1933. These securities may be resold in transactions exempt from registration, normally to qualified institutional buyers.
ETM: Bonds bearing the description ETM (escrowed to maturity) are collateralized by US Treasury securities which are held in escrow and used to pay principal and interest on bonds so designated.
The accompanying notes are an integral part of the financial statements.
26
Table of Contents
Statement of Assets and Liabilities as of October 31, 2003
Assets | ||||
Investments: | ||||
Investments in securities, at value (cost $1,787,017,424) | $ | 2,017,201,134 | ||
Investment in Scudder Cash Management QP Trust (cost $53,374,227) | 53,374,227 | |||
Total investments in securities, at value (cost $1,840,391,651) | 2,070,575,361 | |||
Cash | 10,000 | |||
Receivable for investments sold | 54,939,555 | |||
Dividends receivable | 1,530,888 | |||
Interest receivable | 6,623,471 | |||
Receivable for Fund shares sold | 894,330 | |||
Foreign taxes recoverable | 730 | |||
Total assets | 2,134,574,335 | |||
Liabilities | ||||
Payable for investments purchased | 34,653,844 | |||
Payable for investments purchased - mortgage dollar rolls | 26,223,636 | |||
Deferred Mortgage Dollar Roll | 45,510 | |||
Dividends payable | 1,797 | |||
Payable for Fund shares redeemed | 2,684,089 | |||
Accrued management fee | 1,009,187 | |||
Other accrued expenses and payables | 719,183 | |||
Total liabilities | 65,337,246 | |||
Net assets, at value | $ | 2,069,237,089 | ||
Net Assets | ||||
Net assets consist of: | ||||
Undistributed net investment income | 3,413,343 | |||
Net unrealized appreciation (depreciation) on: | ||||
Investments | 230,183,710 | |||
Foreign currency related transactions | 18 | |||
Accumulated net realized gain (loss) | (328,306,173 | ) | ||
Paid-in capital | 2,163,946,191 | |||
Net assets, at value | $ | 2,069,237,089 | ||
The accompanying notes are an integral part of the financial statements.
27
Table of Contents
Statement of Assets and Liabilities as of October 31, 2003 (continued)
Net Asset Value | |||
Class A Net Asset Value and redemption price per share ($1,763,802,470 / 208,992,106 outstanding shares of beneficial interest, $.01 par value, unlimited number of shares authorized) | $ | 8.44 | |
Maximum offering price per share (100 / 94.25 of $8.44) | $ | 8.95 | |
Class B Net Asset Value, offering and redemption price (subject to contingent deferred sales charge) per share ($248,227,749 / 29,415,258 outstanding shares of beneficial interest, $.01 par value, unlimited number of shares authorized) | $ | 8.44 | |
Class C Net Asset Value redemption price (subject to contingent deferred sales charge) per share ($56,788,433 / 6,747,625 outstanding shares of beneficial interest, $.01 par value, unlimited number of shares authorized) | $ | 8.42 | |
Maximum offering price per share (100 / 99.00 of $8.42) | $ | 8.51 | |
Class I Net Asset Value, offering and redemption price per share ($408,308 / 48,299 outstanding shares of beneficial interest, $.01 par value, unlimited number of shares authorized) | $ | 8.45 | |
Class R Net Asset Value, offering and redemption price per share ($10,129 / 1,200 outstanding shares of beneficial interest, $.01 par value, unlimited number of shares authorized) | $ | 8.44 |
The accompanying notes are an integral part of the financial statements.
28
Table of Contents
Statement of Operations for the year ended October 31, 2003
Investment Income | ||||
Dividends (net of foreign taxes withheld of $14,336) | $ | 14,053,544 | ||
Interest | 39,972,420 | |||
Dollar roll income | 377,744 | |||
Interest - Scudder Cash Management QP Trust | 981,492 | |||
Total Income | 55,385,200 | |||
Expenses: | ||||
Management fee | 11,239,708 | |||
Administrative fee | 5,777,776 | |||
Distribution service fees | 7,091,901 | |||
Services to shareholders | 362,526 | |||
Trustees’ fees and expenses | 77,949 | |||
Other | 62,645 | |||
Total expenses | 24,612,505 | |||
Net investment income (loss) | 30,772,695 | |||
Realized and Unrealized Gain (Loss) on Investment Transactions | ||||
Net realized gain (loss) from: | ||||
Investments | (144,860,900 | ) | ||
Foreign currency related transactions | 3,318 | |||
| (144,857,582 | ) | |||
Net unrealized appreciation (depreciation) during the period on: | ||||
Investments | 354,710,220 | |||
Foreign currency related transactions | (3,195 | ) | ||
| 354,707,025 | ||||
Net gain (loss) on investment transactions | 209,849,443 | |||
Net increase (decrease) in net assets resulting from operations | $ | 240,622,138 | ||
The accompanying notes are an integral part of the financial statements.
29
Table of Contents
Statement of Changes in Net Assets
| Years Ended October 31, | ||||||||
Increase (Decrease) in Net Assets | 2003 | 2002 | ||||||
Operations: | ||||||||
Net investment income (loss) | $ | 30,772,695 | $ | 48,174,597 | ||||
Net realized gain (loss) on investment transactions | (144,857,582 | ) | (37,702,785 | ) | ||||
Net unrealized appreciation (depreciation) on investment transactions during the period | 354,707,025 | (307,379,899 | ) | |||||
Net increase (decrease) in net assets resulting from operations | 240,622,138 | (296,908,087 | ) | |||||
Distributions to shareholders from: | ||||||||
Net investment income: | ||||||||
Class A | (29,860,070 | ) | (50,399,036 | ) | ||||
Class B | (2,192,527 | ) | (5,469,860 | ) | ||||
Class C | (500,557 | ) | (1,003,380 | ) | ||||
Class I | (69,415 | ) | (201,912 | ) | ||||
Fund share transactions: | ||||||||
Proceeds from shares sold | 176,046,055 | 257,922,505 | ||||||
Reinvestment of distributions | 30,358,072 | 53,109,578 | ||||||
Cost of shares redeemed | (480,583,918 | ) | (694,381,333 | ) | ||||
Net increase (decrease) in net assets from Fund share transactions | (274,179,791 | ) | (383,349,250 | ) | ||||
Increase (decrease) in net assets | (66,180,222 | ) | (737,331,525 | ) | ||||
Net assets at beginning of period | 2,135,417,311 | 2,872,748,836 | ||||||
Net assets at end of period (including undistributed net investment income of $3,413,343 and $3,065,905, respectively) | $ | 2,069,237,089 | $ | 2,135,417,311 | ||||
The accompanying notes are an integral part of the financial statements.
30
Table of Contents
Class A
Years Ended October 31, | 2003 | 2002a | 2001 | 2000 | 1999 | |||||||||||||||
Selected Per Share Data | ||||||||||||||||||||
Net asset value, beginning of period | $ | 7.62 | $ | 8.80 | $ | 11.34 | $ | 11.35 | $ | 10.54 | ||||||||||
Income (loss) from investment operations: | ||||||||||||||||||||
Net investment income (loss)b | .13 | .17 | .24 | .26 | .30 | |||||||||||||||
Net realized and unrealized gain (loss) on investment transactions | .83 | (1.15 | ) | (1.69 | ) | .47 | 1.50 | |||||||||||||
Total from investment operations | .96 | (.98 | ) | (1.45 | ) | .73 | 1.80 | |||||||||||||
Less distributions from: | ||||||||||||||||||||
Net investment income | (.14 | ) | (.20 | ) | (.24 | ) | (.28 | ) | (.31 | ) | ||||||||||
Net realized gains on investment transactions | — | — | (.85 | ) | (.46 | ) | (.68 | ) | ||||||||||||
Total distributions | (.14 | ) | (.20 | ) | (1.09 | ) | (.74 | ) | (.99 | ) | ||||||||||
Net asset value, end of period | $ | 8.44 | $ | 7.62 | $ | 8.80 | $ | 11.34 | $ | 11.35 | ||||||||||
Total Return (%)c | 12.69 | (11.32 | ) | (13.50 | ) | 6.52 | 17.91 | |||||||||||||
Ratios to Average Net Assets and Supplemental Data | ||||||||||||||||||||
Net assets, end of period ($ millions) | 1,764 | 1,774 | 2,328 | 2,862 | 2,885 | |||||||||||||||
Ratio of expenses before expense reductions (%) | 1.06 | 1.00 | 1.01d | 1.02 | 1.02 | |||||||||||||||
Ratio of expenses after expense reductions (%) | 1.06 | 1.00 | .99d | 1.01 | 1.02 | |||||||||||||||
Ratio of net investment income (loss) (%) | 1.64 | 2.01 | 2.48 | 2.29 | 2.71 | |||||||||||||||
Portfolio turnover rate (%) | 108 | 130 | 105 | 95 | 64 | |||||||||||||||
| a | As required, effective November 1, 2001, the Fund has adopted the provisions of the AICPA Audit and Accounting Guide for Investment Companies and began amortizing premium on debt securities. In addition, paydowns on mortgage backed securities which were included in realized gain/loss on investment transactions prior to November 1, 2001 are included as interest income. The effect of these changes for the year ended October 31, 2002 was to decrease net investment income by $.02, increase net realized and unrealized gain (loss) per share by $.02, and decrease the ratio of net investment income to average net assets from 2.20% to 2.01%. Per share data and ratios for periods prior to November 1, 2001 have not been restated to reflect this change in presentation. |
| b | Based on average shares outstanding during the period. |
| c | Total return does not reflect the effect of any sales charges. |
| d | The ratios of operating expenses excluding costs incurred in connection with the reorganization before and after expense reductions were .99% and .99%, respectively. |
31
Table of Contents
Class B
Years Ended October 31, | 2003 | 2002a | 2001 | 2000 | 1999 | |||||||||||||||
Selected Per Share Data | ||||||||||||||||||||
Net asset value, beginning of period | $ | 7.62 | $ | 8.79 | $ | 11.34 | $ | 11.34 | $ | 10.52 | ||||||||||
Income (loss) from investment operations: | ||||||||||||||||||||
Net investment income (loss)b | .06 | .09 | .14 | .16 | .19 | |||||||||||||||
Net realized and unrealized gain (loss) on investment transactions | .82 | (1.14 | ) | (1.69 | ) | .46 | 1.50 | |||||||||||||
Total from investment operations | .88 | (1.05 | ) | (1.55 | ) | .62 | 1.69 | |||||||||||||
Less distributions from: | ||||||||||||||||||||
Net investment income | (.06 | ) | (.12 | ) | (.15 | ) | (.16 | ) | (.19 | ) | ||||||||||
Net realized gains on investment transactions | — | — | (.85 | ) | (.46 | ) | (.68 | ) | ||||||||||||
Total distributions | (.06 | ) | (.12 | ) | (1.00 | ) | (.62 | ) | (.87 | ) | ||||||||||
Net asset value, end of period | $ | 8.44 | $ | 7.62 | $ | 8.79 | $ | 11.34 | $ | 11.34 | ||||||||||
Total Return (%)c | 11.67 | (12.09 | ) | (14.38 | ) | 5.58 | 16.76 | |||||||||||||
Ratios to Average Net Assets and Supplemental Data | ||||||||||||||||||||
Net assets, end of period ($ millions) | 248 | 298 | 464 | 556 | 744 | |||||||||||||||
Ratio of expenses before expense reductions (%) | 1.97 | 1.89 | 1.99d | 1.91 | 2.03 | |||||||||||||||
Ratio of expenses after expense reductions (%) | 1.97 | 1.89 | 1.99d | 1.90 | 2.03 | |||||||||||||||
Ratio of net investment income (loss) (%) | .73 | 1.11 | 1.48 | 1.40 | 1.70 | |||||||||||||||
Portfolio turnover rate (%) | 108 | 130 | 105 | 95 | 64 | |||||||||||||||
| a | As required, effective November 1, 2001, the Fund has adopted the provisions of the AICPA Audit and Accounting Guide for Investment Companies and began amortizing premium on debt securities. In addition, paydowns on mortgage backed securities which were included in realized gain/loss on investment transactions prior to November 1, 2001 are included as interest income. The effect of these changes for the year ended October 31, 2002 was to decrease net investment income by $.02, increase net realized and unrealized gain (loss) per share by $.02, and decrease the ratio of net investment income to average net assets from 1.31% to 1.11%. Per share data and ratios for periods prior to November 1, 2001 have not been restated to reflect this change in presentation. |
| b | Based on average shares outstanding during the period. |
| c | Total return does not reflect the effect of any sales charges. |
| d | The ratios of operating expenses excluding costs incurred in connection with the reorganization before and after expense reductions were 1.95% and 1.95%, respectively. |
32
Table of Contents
Class C
Years Ended October 31, | 2003 | 2002a | 2001 | 2000 | 1999 | |||||||||||||||
Selected Per Share Data | ||||||||||||||||||||
Net asset value, beginning of period | $ | 7.60 | $ | 8.78 | $ | 11.31 | $ | 11.32 | $ | 10.54 | ||||||||||
Income (loss) from investment operations: | ||||||||||||||||||||
Net investment income (loss)b | .06 | .10 | .15 | .16 | .20 | |||||||||||||||
Net realized and unrealized gain (loss) on investment transactions | .83 | (1.15 | ) | (1.67 | ) | .47 | 1.48 | |||||||||||||
Total from investment operations | .89 | (1.05 | ) | (1.52 | ) | .63 | 1.68 | |||||||||||||
Less distributions from: | ||||||||||||||||||||
Net investment income | (.07 | ) | (.13 | ) | (.16 | ) | (.18 | ) | (.22 | ) | ||||||||||
Net realized gains on investment transactions | — | — | (.85 | ) | (.46 | ) | (.68 | ) | ||||||||||||
Total distributions | (.07 | ) | (.13 | ) | (1.01 | ) | (.64 | ) | (.90 | ) | ||||||||||
Net asset value, end of period | $ | 8.42 | $ | 7.60 | $ | 8.78 | $ | 11.31 | $ | 11.32 | ||||||||||
Total Return (%)c | 11.81 | (12.13 | ) | (14.18 | ) | 5.63 | 16.64 | |||||||||||||
Ratios to Average Net Assets and Supplemental Data | ||||||||||||||||||||
Net assets, end of period ($ millions) | 57 | 57 | 72 | 61 | 43 | |||||||||||||||
Ratio of expenses before expense reductions (%) | 1.93 | 1.80 | 1.89d | 1.87 | 1.89 | |||||||||||||||
Ratio of expenses after expense reductions (%) | 1.93 | 1.80 | 1.87d | 1.86 | 1.89 | |||||||||||||||
Ratio of net investment income (loss) (%) | .77 | 1.21 | 1.59 | 1.44 | 1.84 | |||||||||||||||
Portfolio turnover rate (%) | 108 | 130 | 105 | 95 | 64 | |||||||||||||||
| a | As required, effective November 1, 2001, the Fund has adopted the provisions of the AICPA Audit and Accounting Guide for Investment Companies and began amortizing premium on debt securities. In addition, paydowns on mortgage backed securities which were included in realized gain/loss on investment transactions prior to November 1, 2001 are included as interest income. The effect of these changes for the year ended October 31, 2002 was to decrease net investment income by $.02, increase net realized and unrealized gain (loss) per share by $.02, and decrease the ratio of net investment income to average net assets from 1.40% to 1.21%. Per share data and ratios for periods prior to November 1, 2001 have not been restated to reflect this change in presentation. |
| b | Based on average shares outstanding during the period. |
| c | Total return does not reflect the effect of any sales charges. |
| d | The ratios of operating expenses excluding costs incurred in connection with the reorganization before and after expense reductions were 1.87% and 1.87%, respectively. |
33
Table of Contents
Class I
Years Ended October 31, | 2003 | 2002a | 2001 | 2000 | 1999 | |||||||||||||||
Selected Per Share Data | ||||||||||||||||||||
Net asset value, beginning of period | $ | 7.63 | $ | 8.82 | $ | 11.36 | $ | 11.38 | $ | 10.54 | ||||||||||
Income (loss) from investment operations: | ||||||||||||||||||||
Net investment income (loss)b | .16 | .20 | .27 | .29 | .34 | |||||||||||||||
Net realized and unrealized gain (loss) on investment transactions | .83 | (1.16 | ) | (1.69 | ) | .47 | 1.53 | |||||||||||||
Total from investment operations | .99 | (.96 | ) | (1.42 | ) | .76 | 1.87 | |||||||||||||
Less distributions from: | ||||||||||||||||||||
Net investment income | (.17 | ) | (.23 | ) | (.27 | ) | (.32 | ) | (.35 | ) | ||||||||||
Net realized gains on investment transactions | — | — | (.85 | ) | (.46 | ) | (.68 | ) | ||||||||||||
Total distributions | (.17 | ) | (.23 | ) | (1.12 | ) | (.78 | ) | (1.03 | ) | ||||||||||
Net asset value, end of period | $ | 8.45 | $ | 7.63 | $ | 8.82 | $ | 11.36 | $ | 11.38 | ||||||||||
Total Return (%) | 13.09 | (11.09 | ) | (13.14 | ) | 6.80 | 18.65 | |||||||||||||
Ratios to Average Net Assets and Supplemental Data | ||||||||||||||||||||
Net assets, end of period ($ millions) | .41 | 6 | 9 | 11 | 10 | |||||||||||||||
Ratio of expenses before expense reductions (%) | .67 | .64 | .66c | .63 | .67 | |||||||||||||||
Ratio of expenses after expense reductions (%) | .67 | .64 | .65c | .62 | .67 | |||||||||||||||
Ratio of net investment income (loss) (%) | 2.03 | 2.37 | 2.82 | 2.68 | 3.06 | |||||||||||||||
Portfolio turnover rate (%) | 108 | 130 | 105 | 95 | 64 | |||||||||||||||
| a | As required, effective November 1, 2001, the Fund has adopted the provisions of the AICPA Audit and Accounting Guide for Investment Companies and began amortizing premium on debt securities. In addition, paydowns on mortgage backed securities which were included in realized gain/loss on investment transactions prior to November 1, 2001 are included as interest income. The effect of these changes for the year ended October 31, 2002 was to decrease net investment income by $.02, increase net realized and unrealized gain (loss) per share by $.02, and decrease the ratio of net investment income to average net assets from 2.56% to 2.37%. Per share data and ratios for periods prior to November 1, 2001 have not been restated to reflect this change in presentation. |
| b | Based on average shares outstanding during the period. |
| c | The ratios of operating expenses excluding costs incurred in connection with the reorganization before and after expense reductions were .64% and .64%, respectively. |
34
Table of Contents
Class R
| 2003a | ||||
Selected Per Share Data | ||||
Net asset value, beginning of period | $ | 8.33 | ||
Income (loss) from investment operations: | ||||
Net investment income (loss)b | .20 | |||
Net realized and unrealized gain (loss) on investment transactions | (.09 | ) | ||
Total from investment operations | .11 | |||
Net asset value, end of period | $ | 8.44 | ||
Total Return (%) | 1.32 | ** | ||
Ratios to Average Net Assets and Supplemental Data | ||||
Net assets, end of period ($ millions) | .01 | |||
Ratio of expenses | 1.33 | * | ||
Ratio of net investment income (loss) (%) | 1.37 | * | ||
Portfolio turnover rate (%) | 108 | * | ||
| a | For the period from October 1, 2003 (commencement of sales of Class R shares) to October 31, 2003. |
| b | Based on average shares outstanding during the period. |
| * | Annualized |
| ** | Not Annualized |
35
Table of Contents
A. Significant Accounting Policies
Scudder Total Return Fund (the “Fund”) is registered under the Investment Company Act of 1940, as amended (the “1940 Act”), as an open-end, diversified management investment company organized as a Massachusetts business trust.
The Fund offers multiple classes of shares which provide investors with different purchase options. Class A shares are offered to investors subject to an initial sales charge. Class B shares are offered without an initial sales charge but are subject to higher ongoing expenses than Class A shares and a contingent deferred sales charge payable upon certain redemptions. Class B shares automatically convert to Class A shares six years after issuance. Class C shares are offered to investors subject to an initial sales charge and are subject to higher ongoing expenses than Class A shares and a contingent deferred sales charge payable upon certain redemptions within one year of purchase. Prior to February 3, 2003, Class C shares were offered without an initial sales charge. Class C shares do not convert into another class. Class I shares are offered to a limited group of investors, are not subject to initial or contingent deferred sales charges and have lower ongoing expenses than other classes. On October 1, 2003, the Fund commenced offering Class R shares which are offered to investors without an initial sales charge.
Investment income, realized and unrealized gains and losses, and certain fund-level expenses and expense reductions, if any, are borne pro rata on the basis of relative net assets by the holders of all classes of shares, except that each class bears certain expenses unique to that class such as distribution
36
Table of Contents
service fees, administrative fees and certain other class-specific expenses. Differences in class-level expenses may result in payment of different per share dividends by class. All shares of the Fund have equal rights with respect to voting subject to class-specific arrangements.
The Fund’s financial statements are prepared in accordance with accounting principles generally accepted in the United States of America which require the use of management estimates. Actual results could differ from those estimates. The policies described below are followed consistently by the Fund in the preparation of its financial statements.
Security Valuation. Investments are stated at value determined as of the close of regular trading on the New York Stock Exchange on each day the exchange is open for trading. Equity securities are valued at the most recent sale price reported on the exchange (US or foreign) or over-the-counter market on which the security is traded most extensively. Securities for which no sales are reported are valued at the calculated mean between the most recent bid and asked quotations on the relevant market or, if a mean cannot be determined, at the most recent bid quotation.
Debt securities are valued by independent pricing services approved by the Trustees of the Fund. If the pricing services are unable to provide valuations, the securities are valued at the most recent bid quotation or evaluated price, as applicable, obtained from one or more broker-dealers. Such services may use various pricing techniques which take into account appropriate factors such as yield, quality, coupon rate, maturity, type of issue, trading characteristics and other data, as well as broker quotes.
Money market instruments purchased with an original or remaining maturity of sixty days or less, maturing at par, are valued at amortized cost. Investments in open-end investments companies and Scudder Cash Management QP Trust are valued at their net asset value each business day.
Securities and other assets for which market quotations are not readily available or for which the above valuation procedures are deemed not to reflect fair value are valued in a manner that is intended to reflect their fair value as determined in accordance with procedures approved by the Trustees.
Foreign Currency Translations. The books and records of the Fund are maintained in US dollars. Investment securities and other assets and liabilities denominated in a foreign currency are translated into US dollars at the prevailing exchange rates at period end. Purchases and sales of investment securities, income and expenses are translated into US dollars at the prevailing exchange rates on the respective dates of the transactions.
Net realized and unrealized gains and losses on foreign currency transactions represent net gains and losses between trade and settlement dates on securities transactions, the disposition of forward foreign currency exchange contracts and foreign currencies, and the difference between the amount of net investment income accrued and the US dollar amount actually received. That portion of both realized and unrealized gains and losses on investments that results from fluctuations in foreign currency exchange rates is not separately disclosed but is included with net realized and unrealized gains and losses on investment securities.
Mortgage Dollar Rolls. The Fund may enter into mortgage dollar rolls in which the Fund sells to a bank or broker/dealer (the “counterparty”) mortgage-backed securities for delivery in the current month and simultaneously contracts to repurchase similar, but not identical, securities on a fixed date. The counterparty receives all principal and interest payments, including prepayments, made on the security while it is the holder. The Fund receives compensation as consideration for entering into the commitment to repurchase. The compensation is paid in the form of a lower price for the security upon its repurchase, or alternatively, a fee. Mortgage dollar rolls may be renewed with a new sale and repurchase price and a cash settlement made at each renewal without physical delivery of the securities subject to the contract.
37
Table of Contents
Mortgage dollar rolls may be treated for purposes of the 1940 Act as borrowings by the Fund because they involve the sale of a security coupled with an agreement to repurchase. A mortgage dollar roll involves costs to the Fund. For example, while the Fund receives compensation as consideration for agreeing to repurchase the security, the Fund forgoes the right to receive all principal and interest payments while the counterparty holds the security. These payments to the counterparty may exceed the compensation received by the Fund, thereby effectively charging the Fund interest on its borrowing. Further, although the Fund can estimate the amount of expected principal prepayment over the term of the mortgage dollar roll, a variation in the actual amount of prepayment could increase or decrease the cost of the Fund’s borrowing.
Certain risks may arise upon entering into mortgage dollar rolls from the potential inability of counterparties to meet the terms of their commitments. Additionally, the value of such securities may change adversely before the Fund is able to repurchase them. There can be no assurance that the Fund’s use of the cash that it receives from a mortgage dollar roll will provide a return that exceeds its borrowing costs.
Federal Income Taxes. The Fund’s policy is to comply with the requirements of the Internal Revenue Code, as amended, which are applicable to regulated investment companies, and to distribute all of its taxable income to its shareholders. Accordingly, the Fund paid no federal income taxes and no federal income tax provision was required.
At October 31, 2003 the Fund had a net tax basis capital loss carryforward of approximately $293,032,000 which may be applied against any realized net taxable capital gains of each succeeding year until fully utilized or until October 31, 2008 ($1,718,000), October 31, 2009 ($115,044,000), October 31, 2010 ($19,493,000), and October 31, 2011 ($156,777,000) the respective expiration dates, which may be subject to certain limitations under section 382-384 of the Internal Revenue Code.
Distribution of Income and Gains. Distributions of net investment income, if any, are made quarterly. Net realized gains from investment transactions, in excess of available capital loss carryforwards, would be taxable to the Fund if not distributed, and, therefore, will be distributed to shareholders at least annually.
The timing and characterization of certain income and capital gains distributions are determined annually in accordance with federal tax regulations which may differ from accounting principles generally accepted in the United States of America. These differences primarily relate to securities sold at a loss and premium amortization on debt securities. As a result, net investment income (loss) and net realized gain (loss) on investment transactions for a reporting period may differ significantly from distributions during such period. Accordingly, the Fund may periodically make reclassifications among certain of its capital accounts without impacting the net asset value of the Fund.
At October 31, 2003, the Fund’s components of distributable earnings (accumulated losses) on a tax-basis were as follows:
Undistributed ordinary income* | $ | 3,488,906 | ||
Undistributed net long-term capital gains | $ | — | ||
Capital loss carryforwards | $ | (293,032,000 | ) | |
Net unrealized appreciation (depreciation) on investments | $ | 194,909,229 |
38
Table of Contents
In addition, the tax character of distributions paid to shareholders by the Fund is summarized as follows:
| Years Ended October 31, | ||||||
| 2003 | 2002 | |||||
Distributions from ordinary income* | $ | 32,622,569 | $ | 57,074,188 | ||
| * | For tax purposes short-term capital gains distributions are considered ordinary income distributions. |
Other. Investment transactions are accounted for on a trade date plus one basis for daily net asset value calculations. However, for financial reporting purposes, investment transactions are reported on trade date. Interest income is recorded on the accrual basis. Dividend income is recorded on the ex-dividend date net of foreign withholding taxes. Certain dividends from foreign securities may be recorded subsequent to the ex-dividend date as soon as the Fund is informed of such dividends. Realized gains and losses from investment transactions are recorded on an identified cost basis.
B. Purchases and Sales of Securities
During the year ended October 31, 2003, purchases and sales of investment securities (excluding short-term investments and US Treasury securities) aggregated $1,429,632,447 and $1,578,688,856, respectively. Purchases and sales of US Treasury securities aggregated $718,714,843 and $814,445,443, respectively.
C. Related Parties
Management Agreement. Under the Management Agreement with Deutsche Investment Management Americas Inc. (“DeIM” or the “Advisor”), the Advisor directs the investments of the Fund in accordance with its investment objectives, policies and restrictions. The Advisor determines the securities, instruments and other contracts relating to investments to be purchased, sold or entered into by the Fund. In addition to portfolio management services, the Advisor provides certain administrative services in accordance with the Management Agreement. The management fee payable under the Management Agreement is equal to an annual rate of 0.58% of the first $250,000,000 of the Fund’s average daily net assets, 0.55% of the next $750,000,000 of such net assets, 0.53% of the next $1,500,000,000 of such net assets, 0.51% of the next $2,500,000,000 of such net assets, 0.48% of the next $2,500,000,000 of such net assets, 0.46% of the next $2,500,000,000 of such net assets, 0.44% of the next $2,500,000,000 of such net assets and 0.42% of such net assets in excess of $12,500,000,000, computed and accrued daily and payable monthly. Accordingly, for the year ended October 31, 2003, the fee pursuant to the Management Agreement was equivalent to an annual effective rate of 0.55% of the Fund’s average daily net assets.
Administrative Fee. Under the Administrative Agreement (the “Administrative Agreement”), the Advisor provides or pays others to provide substantially all of the administrative services required by the Fund (other than those provided by the Advisor under its Management Agreement with the Fund, as described above) in exchange for the payment by each class of the Fund of an administrative services fee (the “Administrative Fee”) of 0.225%, 0.375%, 0.300% and 0.100% of the average daily net assets for Class A, B, C and I shares, respectively, computed and accrued daily and payable monthly for the period November 1, 2002 to December 31, 2002.
39
Table of Contents
Effective January 1, 2003, the Fund’s Trustees approved new Administrative Fee rates of 0.300%, 0.425%, 0.400% and 0.145% of the average daily net assets for Class A, B, C and I shares, respectively, computed and accrued daily and payable monthly.
For the period from November 1, 2002 through September 30, 2003, the Administrative Fee was as follows:
Administrative Fee | Total Aggregated | ||
Class A | $ | 4,556,178 | |
Class B | 1,028,311 | ||
Class C | 190,164 | ||
Class I | 3,123 | ||
| $ | 5,777,776 | ||
The Administrative Agreement between the Advisor and the Fund terminated effective September 30, 2003 and the Fund will directly bear the cost of those expenses formerly covered under the Administrative Agreement.
Effective October 1, 2003 through September 30, 2005, the Advisor has agreed to contractually waive all or a portion of its management fee and reimburse or pay certain operating expenses of the Fund to the extent necessary to maintain the operating expenses of each class at 0.84%, 0.97%, 0.945%, 0.685% and 1.34% of average daily net assets for Class A, B, C, I and R shares, respectively (excluding certain expenses such as Rule 12b-1 and/or service fees, trustee and trustee counsel fees, extraordinary expenses, taxes, brokerage and interest).
Service Provider Fees.
Scudder Investments Service Company (“SISC”), an affiliate of the Advisor, is the Fund’s transfer, dividend-paying agent and shareholder service agent. Pursuant to a sub-transfer agency agreement between SISC and DST Systems, Inc. (“DST”), SISC has delegated certain transfer agent and dividend paying agent functions to DST. The costs and expenses of such delegation are borne by SISC, not by the Fund. For the period October 1, 2003 through October 31, 2003, the amount charged to the Fund by SISC aggregated $360,103, all of which is unpaid at October 31, 2003.
Prior to September 30, 2003, the fees outlined above were paid by the Advisor in accordance with the Administrative Agreement.
Distribution Service Agreement. Under the Distribution Service Agreement, in accordance with Rule 12b-1 under the 1940 Act, Scudder Distributors, Inc. (“SDI”), a subsidiary of the Advisor, receives a fee (“Distribution Fee”) of 0.25% of the average daily net assets of Class R shares and 0.75% of average daily net assets of Class B and C shares. Pursuant to the agreement, SDI enters into related selling group agreements with various firms at various rates for sales of Class B and C shares. For the year ended October 31, 2003, the Distribution Fee was as follows:
Distribution Fee | Total Aggregated | Unpaid at October 31, 2003 | ||||
Class B | $ | 1,989,322 | $ | 163,174 | ||
Class C | 411,381 | 37,281 | ||||
Class R | 2 | 2 | ||||
| $ | 2,400,705 | $ | 200,457 | |||
40
Table of Contents
In addition, SDI provides information and administrative services (“Service Fee”) to Class A, B, C and R shareholders at an annual rate of up to 0.25% of average daily net assets for each such class. SDI in turn has various agreements with financial services firms that provide these services and pays these fees based upon the assets of shareholder accounts the firms service. For the year ended October 31, 2003, the Service Fee was as follows:
Service Fee | Total Aggregated | Unpaid at October 31, 2003 | Effective Rate | ||||||
Class A | $ | 3,913,390 | $ | 78,775 | .23 | % | |||
Class B | 642,597 | 56,890 | .24 | % | |||||
Class C | 135,209 | 12,366 | .25 | % | |||||
| $ | 4,691,196 | $ | 148,031 | ||||||
Underwriting and Contingent Deferred Sales Charge. SDI is the principal underwriter for Class A, B and C shares. Underwriting commissions paid in connection with the distribution of Class A and C shares for the year ended October 31, 2003 aggregated $81,339 and $249, respectively.
In addition, SDI receives any contingent deferred sales charge (“CDSC”) from Class B share redemptions occurring within six years of purchase and Class C share redemptions occurring within one year of purchase. There is no such charge upon redemption of any share appreciation or reinvested dividends. The CDSC is based on declining rates ranging from 4% to 1% for Class B and 1% for Class C, of the value of the shares redeemed. For the year ended October 31, 2003, the CDSC for Class B and C shares aggregated $593,074 and $1,674, respectively. A deferred sales charge of up to 1% is assessed on certain redemptions of Class A shares. For the year ended October 31, 2003, SDI received $1,961.
Trustees’ Fees and Expenses. The Fund pays each Trustee not affiliated with the Advisor retainer fees plus specified amounts for attended board and committee meetings.
Scudder Cash Management QP Trust. Pursuant to an Exemptive Order issued by the SEC, the Fund may invest in the Scudder Cash Management QP Trust (the “QP Trust”) and other affiliated funds managed by the Advisor. The QP Trust seeks to provide as high a level of current income as is consistent with the preservation of capital and the maintenance of liquidity. The QP Trust does not pay the Advisor a management fee for the affiliated funds’ investments in the QP Trust.
D. Expense Off-Set Arrangement
The Fund has entered into an arrangement with its custodian whereby credits realized as a result of uninvested cash balances were used to reduce a portion of the Fund’s custodian expenses. During the year ended October 31, 2003, pursuant to the Administrative Agreement, no custodian credits were earned.
E. Line of Credit
The Fund and several other affiliated funds (the “Participants”) share in a $1.25 billion revolving credit facility administered by J.P. Morgan Chase Bank for temporary or emergency purposes, including the meeting of redemption requests that otherwise might require the untimely disposition of securities. The Participants are charged an annual commitment fee which is allocated, pro rata based upon net assets, among each of the Participants. Interest is calculated at the Federal Funds Rate plus 0.5 percent. The Fund may borrow up to a maximum of 33 percent of its net assets under the agreement.
41
Table of Contents
F. Share Transactions
The following table summarizes share and dollar activity in the Fund:
Year Ended October 31, 2003 | Year Ended October 31, 2002 | |||||||||||||
| Shares | Dollars | Shares | Dollars | |||||||||||
Shares sold | ||||||||||||||
Class A | 15,856,716 | $ | 124,447,235 | 21,394,436 | $ | 184,632,808 | ||||||||
Class B | 4,959,658 | 39,028,208 | 6,685,329 | 57,141,257 | ||||||||||
Class C | 1,546,325 | 12,153,000 | 1,823,267 | 15,476,467 | ||||||||||
Class I | 53,303 | 407,612 | 77,783 | 671,973 | ||||||||||
Class R | 1,200 | * | 10,000 | * | — | — | ||||||||
| $ | 176,046,055 | $ | 257,922,505 | |||||||||||
Shares issued to shareholders in reinvestment of distributions | ||||||||||||||
Class A | 3,541,994 | $ | 27,764,988 | 5,573,639 | $ | 46,868,937 | ||||||||
Class B | 267,733 | 2,080,844 | 607,813 | 5,134,773 | ||||||||||
Class C | 56,952 | 442,827 | 107,741 | 903,959 | ||||||||||
Class I | 9,146 | 69,413 | 23,852 | 201,909 | ||||||||||
| $ | 30,358,072 | $ | 53,109,578 | |||||||||||
Shares redeemed | ||||||||||||||
Class A | (43,354,778 | ) | $ | (339,271,204 | ) | (58,565,093 | ) | $ | (493,564,282 | ) | ||||
Class B | (14,992,524 | ) | (117,156,316 | ) | (20,839,333 | ) | (175,850,132 | ) | ||||||
Class C | (2,359,977 | ) | (18,401,255 | ) | (2,612,376 | ) | (21,850,260 | ) | ||||||
Class I | (762,375 | ) | (5,755,143 | ) | (362,139 | ) | (3,116,659 | ) | ||||||
| $ | (480,583,918 | ) | $ | (694,381,333 | ) | |||||||||
Net increase (decrease) | ||||||||||||||
Class A | (23,956,068 | ) | $ | (187,058,981 | ) | (31,597,018 | ) | $ | (262,062,537 | ) | ||||
Class B | (9,765,133 | ) | (76,047,264 | ) | (13,546,191 | ) | (113,574,102 | ) | ||||||
Class C | (756,700 | ) | (5,805,428 | ) | (681,368 | ) | (5,469,834 | ) | ||||||
Class I | (699,926 | ) | (5,278,118 | ) | (260,504 | ) | (2,242,777 | ) | ||||||
Class R | 1,200 | * | 10,000 | * | — | — | ||||||||
| $ | (274,179,791 | ) | $ | (383,349,250 | ) | |||||||||
| * | For the period October 1, 2003 (commencement of sales of Class R shares) to October 31, 2003. |
42
Table of Contents
Report of Ernst & Young LLP, Independent Auditors
To the Trustees and Shareholders of Scudder Total Return Fund:
We have audited the accompanying statement of assets and liabilities, including the investment portfolio, of the Scudder Total Return Fund (the “Fund”) as of October 31, 2003, and the related statement of operations for the year then ended, the statement of changes in net assets for each of the two years in the period then ended and the financial highlights for each of the periods indicated therein. These financial statements and financial highlights are the responsibility of the Fund’s management. Our responsibility is to express an opinion on these financial statements and financial highlights based on our audits.
We conducted our audits in accordance with auditing standards generally accepted in the United States. Those standards require that we plan and perform the audit to obtain reasonable assurance about whether the financial statements and financial highlights are free of material misstatement. An audit includes examining, on a test basis, evidence supporting the amounts and disclosures in the financial statements and financial highlights. Our procedures included confirmation of securities owned as of October 31, 2003, by correspondence with the custodian and brokers or by other appropriate auditing procedures where replies from brokers were not received. An audit also includes assessing the accounting principles used and significant estimates made by management, as well as evaluating the overall financial statement presentation. We believe that our audits provide a reasonable basis for our opinion.
In our opinion, the financial statements and financial highlights referred to above present fairly, in all material respects, the financial position of the Scudder Total Return Fund at October 31, 2003, the results of its operations for the year then ended, the changes in its net assets for each of the two years in the period then ended and the financial highlights for each of the periods indicated therein, in conformity with accounting principles generally accepted in the United States.
Boston, Massachusetts December 22, 2003 | /s/ Ernst & Young LLP |
For federal income tax purposes, the Fund designates $15,500,000, or the maximum amount allowable under tax law, as qualified dividend income.
Please consult a tax advisor if you have questions about federal or state income tax laws, or on how to prepare your tax returns. If you have specific questions about your account, please call 1-800-621-1048.
43
Table of Contents
The following table presents certain information regarding the Trustees and Officers of the fund as of October 31, 2003. Each individual’s age is set forth in parentheses after his or her name. Unless otherwise noted, (i) each individual has engaged in the principal occupation(s) noted in the table for at least the most recent five years, although not necessarily in the same capacity, and (ii) the address of each individual is c/o Deutsche Asset Management, 222 South Riverside Plaza, Chicago, Illinois, 60606. Each Trustee’s term of office extends until the next shareholder’s meeting called for the purpose of electing Trustees and until the election and qualification of a successor, or until such Trustee sooner dies, resigns or is removed as provided in the governing documents of the fund.
Independent Trustees
Name, Age, | Principal Occupation(s) During Past 5 Years and Other Directorships Held | Number of Funds | ||
John W. Ballantine (57)Trustee, 1999-present | Retired; formerly, Executive Vice President and Chief Risk Management Officer, First Chicago NBD Corporation/The First National Bank of Chicago (1996-1998); Executive Vice President and Head of International Banking (1995-1996). Directorships: Enron Corporation (energy trading firm) (effective May 30, 2002); First Oak Brook Bancshares, Inc.; Oak Brook Bank; American Healthways, Inc. (provider of disease and care management services); F.N.B. Corporation (bank holding company); Prisma Energy International (owner and operator of Enron’s international energy infrastructure business). | 82 | ||
Lewis A. Burnham (70)Trustee, 1977-present | Retired; formerly, Director of Management Consulting, McNulty & Company (1990-1998); prior thereto, Executive Vice President, Anchor Glass Container Corporation. | 82 | ||
Donald L. Dunaway (66)Trustee, 1980-present | Retired; formerly, Executive Vice President, A.O. Smith Corporation (diversified manufacturer) (1963-1994). | 82 | ||
James R. Edgar (57)Trustee, 1999-present | Distinguished Fellow, University of Illinois, Institute of Government and Public Affairs (1999-present); formerly, Governor, State of Illinois (1991-1999). Directorships: Kemper Insurance Companies; John B. Sanfilippo & Son, Inc. (processor/packager/marketer of nuts, snacks and candy products); Horizon Group Properties, Inc.; Youbet.com (online wagering platform); Alberto-Culver Company (manufactures, distributes and markets health and beauty-care products). | 82 | ||
Paul K. Freeman (53)Trustee, 2002-present | President, Cook Street Holdings (consulting); Adjunct Professor, University of Denver; Consultant, World Bank/Inter-American Development Bank; formerly, Project Leader, International Institute for Applied Systems Analysis (1998-2001); Chief Executive Officer, The Eric Group, Inc. (environmental insurance) (1986-1998). | 82 | ||
Robert B. Hoffman (66)Trustee, 1981-present | Retired; formerly, Chairman, Harnischfeger Industries, Inc. (machinery for the mining and paper industries) (1999-2000); prior thereto, Vice Chairman and Chief Financial Officer, Monsanto Company (agricultural, pharmaceutical and nutritional/food products) (1994-1999). | 82 | ||
Shirley D. Peterson (62)Trustee, 1995-present | Retired; formerly, President, Hood College (1995-2000); prior thereto, Partner, Steptoe & Johnson (law firm); Commissioner, Internal Revenue Service; Assistant Attorney General (Tax), US Department of Justice. Directorships: Federal Mogul Corp. (supplier of automotive components and subsystems); Trustee, Bryn Mawr College; AK Steel (steel production). | 82 | ||
Fred B. Renwick (73)Trustee, 1988-present | Retired; Professor Emeritus of Finance, New York University, Stern School of Business (2001-present); formerly, Professor, New York University Stern School of Business (1965-2001). Directorships: The Wartburg Foundation; Chairman, Finance Committee of Morehouse College Board of Trustees; formerly, Director of Board of Pensions, Evangelical Lutheran Church in America; member of the Investment Committee of Atlanta University Board of Trustees; Chair of the Investment Committee, American Bible Society Board of Trustees. | 82 | ||
William P. Sommers (70)Trustee, 1979-present | Retired; formerly, President and Chief Executive Officer, SRI International (research and development) (1994-1998); prior thereto, Executive Vice President, lameter (medical information and educational service provider); Senior Vice President and Director, Booz, Allen & Hamilton Inc. (management consulting firm). Directorships: PSI Inc. (satellite engineering and components); Evergreen Solar, Inc. (develop/manufacture solar electric system engines); H2 Gen (manufacture hydrogen generators); Zassi Medical Evolutions, Inc. (specialists in intellectual property opportunities in medical device arena); Guckenheimer Enterprises (executive food services). | 82 | ||
John G. Weithers (70)Trustee, 1993-present | Retired; formerly, Chairman of the Board and Chief Executive Officer, Chicago Stock Exchange. Directorships: Federal Life Insurance Company; Chairman of the Members of the Corporation and Trustee, DePaul University; formerly, International Federation of Stock Exchanges; Records Management Systems. | 82 | ||
44
Table of Contents
Interested Trustees and Officers2
Name, Age, | Principal Occupation(s) During Past 5 Years and Other Directorships Held | Number of Funds | ||
Richard T. Hale3 (58)Chairman and Trustee, 2002-present Chief Executive Officer, 2003-present | Managing Director, Deutsche Investment Management Americas Inc. (2003-present); Managing Director, Deutsche Bank Securities Inc. (formerly Deutsche Banc Alex. Brown Inc.) and Deutsche Asset Management (1999 to present); Director and President, Investment Company Capital Corp. (registered investment advisor) (1996 to present); Director, Deutsche Global Funds, Ltd. (2000 to present), CABEI Fund (2000 to present), North American Income Fund (2000 to present) (registered investment companies); Director, Scudder Global Opportunities Fund (since 2003); Director/Officer Deutsche/Scudder Mutual Funds (various dates); President, Montgomery Street Income Securities, Inc. (2002 to present) (registered investment companies); Vice President, Deutsche Asset Management, Inc. (2000 to present); formerly, Director, ISI Family of Funds (registered investment companies; 4 funds overseen) (1992-1999) | 201 | ||
Brenda Lyons4,8 (40)President, 2003-present | Managing Director, Deutsche Asset Management | n/a | ||
Gary W. Bartlett6 (44)Vice President, 2002-present | Managing Director, Deutsche Asset Management | n/a | ||
Janet C. Campagna5 (46)Vice President, 2002-present | Managing Director of Deutsche Asset Management (1999 to present); formerly, investment strategist and manager of Asset Allocation Strategies Group, Barclays Global Investors, and global asset allocation research director, First Quadrant Corp. | n/a | ||
Philip J. Collora (57)Vice President and Assistant Secretary, 1986-present | Director, Deutsche Asset Management | n/a | ||
J. Christopher Gagnier6 (46)Vice President, 2002-present | Managing Director, Deutsche Asset Management | n/a | ||
Daniel O. Hirsch3 (49)Vice President and Assistant Secretary, 2002-present | Managing Director, Deutsche Asset Management (2002-present) and Director, Deutsche Global Funds Ltd. (2002-present); formerly, Director, Deutsche Asset Management (1999-2002); Principal, BT Alex. Brown Incorporated (now Deutsche Bank Securities Inc.) (1998-1999); Assistant General Counsel, United States Securities and Exchange Commission (1993-1998) | n/a | ||
Kenneth Murphy4 (40)Vice President, 2002-present | Vice President, Deutsche Asset Management (2000-present); Vice President, Scudder Distributors, Inc. (December 2002-present); formerly, Director, John Hancock Signature Services (1992-2000); Senior Manager, Prudential Mutual Fund Services (1987-1992) | n/a | ||
Julie M. Van Cleave7 (44)Vice President, 2003-present | Managing Director, Deutsche Asset Management | n/a | ||
Charles A. Rizzo4 (46)Treasurer and Chief Financial Officer, 2002-present | Director, Deutsche Asset Management (April 2000-present). Formerly, Vice President and Department Head, BT Alex. Brown Incorporated (now Deutsche Bank Securities Inc.) (1998-1999); Senior Manager, Coopers & Lybrand L.L.P. (now PricewaterhouseCoopers LLP) (1993-1998) | n/a | ||
Salvatore Schiavone4 (37)Assistant Treasurer, 2003-present | Director, Deutsche Asset Management | n/a | ||
45
Table of Contents
Name, Age, | Principal Occupation(s) During Past 5 Years and Other Directorships Held | Number of Funds | ||
Lucinda H. Stebbins4 (57)Assistant Treasurer, 2003-present | Director, Deutsche Asset Management | n/a | ||
Kathleen Sullivan D’Eramo4 (46)Assistant Treasurer, 2003-present | Director, Deutsche Asset Management | n/a | ||
John Millette4 (41)Secretary, 2001-present | Director, Deutsche Asset Management | n/a | ||
Lisa Hertz5 (33)Assistant Secretary, 2003-present | Assistant Vice President, Deutsche Asset Management | n/a | ||
Caroline Pearson4 (41)Assistant Secretary, 1998-present | Managing Director, Deutsche Asset Management | n/a | ||
| 1 | Length of time served represents the date that each Trustee was first elected to the common board of trustees which oversees a number of investment companies, including the fund, managed by the Advisor. For the Officers of the fund, length of time served represents the date that each Officer was first elected to serve as an officer of any fund overseen by the aforementioned common board of trustees. |
| 2 | As a result of their respective positions held with the Advisor, these individuals are considered “interested persons” of the Advisor within the meaning of the 1940 Act, as amended. Interested persons receive no compensation from the fund. |
| 3 | Address: One South Street, Baltimore, Maryland |
| 4 | Address: Two International Place, Boston, Massachusetts |
| 5 | Address: 345 Park Avenue, New York, New York |
| 6 | Address: 150 South Independence Square West, Philadelphia, Pennsylvania |
| 7 | Address: 111 East Kilbourn Avenue, Milwaukee, Wisconsin |
| 8 | Ms. Lyons was elected by the Trustees as President on November 19, 2003. |
The fund’s Statement of Additional Information (“SAI”) includes additional information about the Trustees. The SAI is available, without charge, upon request. If you would like to request a copy of the SAI, you may do so by calling the following toll-free number: 1-800-621-1048.
46
Table of Contents
Scudder Funds
Growth Funds |
Scudder 21st Century Growth Fund |
Scudder Aggressive Growth Fund |
Scudder Blue Chip Fund |
Scudder Capital Growth Fund |
Scudder Development Fund |
Scudder Dynamic Growth Fund |
Scudder Flag Investors Communications Fund |
Scudder Gold & Precious Metals Fund |
Scudder Global Biotechnology Fund |
Scudder Growth Fund |
Scudder Health Care Fund |
Scudder Large Company Growth Fund |
Scudder Micro Cap Fund |
Scudder Mid Cap Fund |
Scudder Small Cap Fund |
Scudder Strategic Growth Fund |
Scudder Technology Fund |
Scudder Technology Innovation Fund |
Scudder Top 50 US Fund |
Value Funds |
Scudder Contrarian Fund |
Scudder-Dreman Financial Services Fund |
Scudder-Dreman High Return Equity Fund |
Scudder-Dreman Small Cap Value Fund |
Scudder Flag Investors Equity Partners Fund |
Scudder Growth and Income Fund |
Scudder Large Company Value Fund |
Scudder-RREEF Real Estate Securities Fund |
Scudder Small Company Stock Fund |
Scudder Small Company Value Fund |
Scudder Tax Advantaged Dividend Fund |
47
Table of Contents
Scudder Funds (continued)
Multicategory/Asset Allocation Funds |
Scudder Balanced Fund |
Scudder Flag Investors Value Builder Fund |
Scudder Focus Value+Growth Fund |
Scudder Lifecycle Mid Range Fund |
Scudder Lifecycle Long Range Fund |
Scudder Lifecycle Short Range Fund |
Scudder Pathway Conservative Portfolio |
Scudder Pathway Growth Portfolio |
Scudder Pathway Moderate Portfolio |
Scudder Target 2013 Fund |
Scudder Total Return Fund |
International/Global Funds |
Scudder Emerging Markets Growth Fund |
Scudder Emerging Markets Income Fund |
Scudder European Equity Fund |
Scudder Global Fund |
Scudder Global Bond Fund |
Scudder Global Discovery Fund |
Scudder Greater Europe Growth Fund |
Scudder International Fund |
Scudder International Equity Fund |
Scudder International Select Equity Fund |
Scudder Japanese Equity Fund |
Scudder Latin America Fund |
Scudder New Europe Fund |
Scudder Pacific Opportunities Fund |
Income Funds |
Scudder Cash Reserves Fund |
Scudder Fixed Income Fund |
Scudder GNMA Fund |
Scudder High Income Plus Fund (formerly Deutsche High Yield Bond Fund) |
Scudder High Income Fund |
Scudder High Income Opportunity Fund |
Scudder Income Fund |
Scudder PreservationPlus Fund |
Scudder PreservationPlus Income Fund |
Scudder Short Duration Fund (formerly Scudder Short-Term Fixed Income Fund) |
Scudder Short-Term Bond Fund |
Scudder Strategic Income Fund |
Scudder US Government Securities Fund |
48
Table of Contents
Scudder Funds (continued)
Tax-Free Income Funds
Scudder California Tax-Free Income Fund
Scudder Florida Tax-Free Income Fund
Scudder High Yield Tax-Free Fund
Scudder Intermediate Tax/AMT Free Fund (formerly Scudder Medium Term Tax-Free Fund)
Scudder Managed Municipal Bond Fund
Scudder Massachusetts Tax-Free Fund
Scudder Municipal Bond Fund
Scudder New York Tax-Free Income Fund
Scudder Short-Term Municipal Bond Fund
Index-Related Funds
Scudder EAFE ® Equity Index Fund
Scudder Equity 500 Index Fund
Scudder S&P 500 Index Fund
Scudder S&P 500 Stock Fund
Scudder Select 500 Fund
Scudder US Bond Index Fund
Money Market A large number of money market funds are available through Scudder Investments.
Retirement Programs and Education Accounts |
Retirement Programs |
Traditional IRA |
Roth IRA |
SEP-IRA |
Inherited IRA |
Keogh Plan |
401(k), 403(b) Plans |
Variable Annuities |
Education Accounts |
Coverdell Education Savings Account |
UGMA/UTMA |
IRA for Minors |
49
Table of Contents
Scudder Funds (continued)
Closed-End Funds |
The Brazil Fund, Inc. |
The Korea Fund, Inc. |
Montgomery Street Income Securities, Inc. |
Scudder Global High Income Fund, Inc. |
Scudder New Asia Fund, Inc. |
Scudder High Income Trust |
Scudder Intermediate Government Trust |
Scudder Multi-Market Income Trust |
Scudder Municipal Income Trust |
Scudder RREEF Real Estate Fund, Inc. |
Scudder RREEF Real Estate Fund II, Inc. |
Scudder Strategic Income Trust |
Scudder Strategic Municipal Income Trust |
The Central Europe and Russia Fund, Inc. (formerly The Central European Equity Fund, Inc.) |
The Germany Fund, Inc. |
The New Germany Fund, Inc. |
Not all funds are available in all share classes.
Scudder open-end funds are offered by prospectus only. For more complete information on any fund or variable annuity registered in your state, including information about a fund’s objectives, strategies, risks, advisory fees, distribution charges, and other expenses, please order a free prospectus. Read the prospectus before investing in any fund to ensure the fund is appropriate for your goals and risk tolerance.
A money market mutual fund investment is not insured or guaranteed by the Federal Deposit Insurance Corporation or any other government agency. Although a money market mutual fund seeks to preserve the value of your investment at $1 per share, it is possible to lose money by investing in such a fund.
The products described should not be considered a solicitation to buy or an offer to sell a security to any person in any jurisdiction where such offer, solicitation, purchase, or sale would be unlawful under the securities laws of such jurisdiction.
50
Table of Contents
For shareholders of Classes A, B and C
Automated Information Lines | ScudderACCESS (800) 972-3060
Personalized account information, information on other Scudder funds and services via touchtone telephone and for Classes A, B, and C only, the ability to exchange or redeem shares. | |
| Web Site | scudder.com
View your account transactions and balances, trade shares, monitor your asset allocation, and change your address, 24 hours a day. Obtain prospectuses and applications, blank forms, interactive worksheets, news about Scudder funds, subscription to fund updates by e-mail, retirement planning information, and more. | |
For More Information | (800) 621-1048
To speak with a Scudder service representative. | |
Written Correspondence | Scudder Investments
PO Box 219356 Kansas City, MO 64121-9356 | |
| Proxy Voting | A description of the fund’s policies and procedures for voting proxies for portfolio securities can be found on our Web site - scudder.com (type “proxy voting” in the search field) - or on the SEC’s Web site - www.sec.gov. To obtain a written copy without charge, call us toll free at (800) 621-1048. | |
Principal Underwriter | If you have questions, comments or complaints, contact:
Scudder Distributors, Inc.
222 South Riverside Plaza Chicago, IL 60606-5808 (800) 621-1148 |
| Class A | Class B | Class C | ||||
Nasdaq Symbol | KTRAX | KTRBX | KTRCX | |||
CUSIP Number | 81123H-104 | 81123H-203 | 81123H-302 | |||
Fund Number | 002 | 202 | 302 |
51
Table of Contents
SIGNATURES
Pursuant to the requirements of the Securities Exchange Act of 1934 and the Investment Company Act of 1940, the registrant has duly caused this report to be signed on its behalf by the undersigned, thereunto duly authorized.
Registrant: | Scudder Total Return Fund | |||||||
By: | /s/ Richard T. Hale | |||||||
Richard T. Hale | ||||||||
Chief Executive Officer | ||||||||
Date: | December 22, 2003 | |||||||
Pursuant to the requirements of the Securities Exchange Act of 1934 and the Investment Company Act of 1940, this report has been signed below by the following persons on behalf of the registrant and in the capacities and on the dates indicated.
Registrant: | Scudder Total Return Fund | |||||||
By: | /s/ Richard T. Hale | |||||||
Richard T. Hale | ||||||||
Chief Executive Officer | ||||||||
Date: | December 22, 2003 | |||||||
By: | /s/ Charles A. Rizzo | |||||||
Charles A. Rizzo | ||||||||
Chief Financial Officer | ||||||||
Date: | December 22, 2003 | |||||||
52
Table of Contents
[GRAPHIC APPEARS HERE]
Scudder Total Return Fund
Semiannual Report to Shareholders
April 30, 2004
Table of Contents
| 3 | ||
| 6 | ||
| 9 | ||
| 11 | ||
| 25 | ||
| 28 | ||
| 33 | ||
| 38 | ||
| 40 | ||
This report must be preceded or accompanied by a prospectus. To obtain a prospectus for any of our funds, refer to the Account Management Resources information provided in the back of this booklet. We advise you to consider the fund’s objectives, risks, charges and expenses carefully before investing. The prospectus contains this and other important information about the fund. Please read the prospectus carefully before you invest.
Investments in mutual funds involve risk. Some funds have more risk than others. The fund is subject to stock market risk, meaning stocks in the fund may decline in value for extended periods of time due to the activities and financial prospects of individual companies, or due to general market and economic conditions. The fund also invests in individual bonds whose yields and market values fluctuate so that your investment may be worth more or less than its original cost. Please read this fund’s prospectus for specific details regarding its investments and risk profile.
Scudder Investments is part of Deutsche Asset Management, which is the marketing name in the US for the asset management activities of Deutsche Bank AG, Deutsche Investment Management Americas Inc., Deutsche Asset Management Inc., Deutsche Asset Management Investment Services Ltd., Deutsche Bank Trust Company Americas and Scudder Trust Company.
Fund shares are not FDIC-insured and are not deposits or other obligations of, or guaranteed by, any bank. Fund shares involve investment risk, including possible loss of principal.
Table of Contents
Performance Summary April 30, 2004
All performance shown is historical, assumes reinvestment of all dividends and capital gains, and does not guarantee future results. Investment return and principal value fluctuate with changing market conditions so that, when redeemed, shares may be worth more or less than their original cost. Current performance may be lower or higher than the performance quoted. Please visit scudder.com for the product’s most recent month-end performance.
The maximum sales charge for Class A shares is 5.75%. For Class B shares, the maximum contingent deferred sales charge (CDSC) is 4% within the first year after purchase, declining to 0% after six years. Class C shares have no adjustment for front-end sales charges but redemptions within one year of purchase may be subject to a CDSC of 1%. Unadjusted returns do not reflect sales charges and would have been lower if they had. Class I and R shares are not subject to sales charges.
Performance figures do not reflect the deduction of taxes that a shareholder would pay on fund distributions or the redemption of fund shares. Returns and rankings may differ by share class.
Returns shown for Class B and C shares for the periods prior to their inception date on May 31, 1994 and for Class R shares prior to October 1, 2003 are derived from the historical performance of Class A shares of the Scudder Total Return Fund during such periods and have been adjusted to reflect the higher gross total annual operating expenses of each specific class. Any difference in expenses will affect performance.
Average Annual Total Returns (Unadjusted for Sales Charge) as of 4/30/04
Scudder Total Return Fund | 6-Month++ | 1-Year | 3-Year | 5-Year | 10-Year | ||||||||||
Class A | 3.39 | % | 12.56 | % | -1.71 | % | - .59 | % | 7.26 | % | |||||
Class B | 2.90 | % | 11.51 | % | -2.63 | % | -1.49 | % | 6.25 | % | |||||
Class C | 2.93 | % | 11.62 | % | -2.55 | % | -1.44 | % | 6.34 | % | |||||
Class R | 2.98 | % | 11.97 | % | -2.06 | % | -.91 | % | 6.94 | % | |||||
S&P 500 Index+ | 6.27 | % | 22.88 | % | -2.36 | % | -2.26 | % | 11.36 | % | |||||
Russell 1000 Growth Index++ | 4.14 | % | 21.65 | % | -5.93 | % | -6.37 | % | 9.61 | % | |||||
Lehman Brothers Aggregate Bond Index+++ | 1.25 | % | 1.82 | % | 6.65 | % | 6.66 | % | 7.34 | % |
Sources: Lipper Inc. and Deutsche Investment Management Americas Inc.
| ++ | Total returns shown for periods less than one year are not annualized. |
Average Annual Total Returns (Unadjusted for Sales Charge) as of 4/30/04
Scudder Total Return Fund | 6-Month++ | 1-Year | 3-Year | 5-Year | Life of Class* | ||||||||||
Class I | 3.67 | % | 13.06 | % | -1.35 | % | -.25 | % | 7.33 | % | |||||
S&P 500 Index+ | 6.27 | % | 22.88 | % | -2.36 | % | -2.26 | % | 10.14 | % | |||||
Russell 1000 Growth Index++ | 4.14 | % | 21.65 | % | -5.93 | % | -6.37 | % | 7.84 | % | |||||
Lehman Brothers Aggregate Bond Index+++ | 1.25 | % | 1.82 | % | 6.65 | % | 6.66 | % | 6.94 | % |
Sources: Lipper Inc. and Deutsche Investment Management Americas Inc.
| ++ | Total returns shown for periods less than one year are not annualized * Class I shares commenced operations on July 3, 1995. Index returns begin June 30, 1995. |
3
Table of Contents
Net Asset Value and Distribution Information
| Class A | Class B | Class C | Class I | Class R | |||||||||||
Net Asset Value: | |||||||||||||||
4/30/04 | $ | 8.65 | $ | 8.65 | $ | 8.63 | $ | 8.67 | $ | 8.66 | |||||
10/31/03 | $ | 8.44 | $ | 8.44 | $ | 8.42 | $ | 8.45 | $ | 8.44 | |||||
Distribution Information: | |||||||||||||||
Six Months: Income Dividends as of 4/30/04 | $ | .08 | $ | .03 | $ | .04 | $ | .09 | $ | .06 | |||||
Class A Lipper Rankings - Balanced Funds Category as of 4/30/04
Period | Rank | Number of Funds Tracked | Percentile Ranking | |||||
1-Year | 385 | of | 534 | 72 | ||||
3-Year | 380 | of | 441 | 86 | ||||
5-Year | 290 | of | 366 | 80 | ||||
10-Year | 97 | of | 132 | 73 |
Source: Lipper Inc. Rankings are historical and do not guarantee future results. Rankings are based on total return unadjusted for sales charges with distributions reinvested. If sales charges had been included, rankings might have been less favorable. Rankings are for Class A shares; other share classes may vary.
Growth of an Assumed $10,000 Investment (Adjusted for Maximum Sales Charge)
¨ Scudder Total Return Fund - Class A
¨ S&P 500 Index+
¨ Russell 1000 Growth Index++
¨ Lehman Brothers Aggregate Bond Index+++
[GRAPHIC APPEARS HERE]
Yearly periods ended April 30
The Fund’s growth of an assumed $10,000 investment is adjusted for the maximum sales charge of 5.75%. This results in a net initial investment of $9,425.
The growth of $10,000 is cumulative.
4
Table of Contents
Comparative Results (Adjusted for Maximum Sales Charge) as of 4/30/04
Scudder Total Return Fund | 1-Year | 3-Year | 5-Year | 10-Year | Life of Class* | |||||||||||||||||
Class A | Growth of $10,000 | $ | 10,609 | $ | 8,949 | $ | 9,151 | $ | 18,990 | — | ||||||||||||
| Average annual total return | 6.09 | % | -3.63 | % | -1.76 | % | 6.62 | % | — | |||||||||||||
Class B | Growth of $10,000 | $ | 10,851 | $ | 9,053 | $ | 9,199 | $ | 18,338 | — | ||||||||||||
| Average annual total return | 8.51 | % | -3.26 | % | -1.66 | % | 6.25 | % | — | |||||||||||||
Class C | Growth of $10,000 | $ | 11,162 | $ | 9,253 | $ | 9,303 | $ | 18,489 | — | ||||||||||||
| Average annual total return | 11.62 | % | -2.55 | % | -1.44 | % | 6.34 | % | — | |||||||||||||
Class R | Growth of $10,000 | $ | 11,197 | $ | 9,394 | $ | 9,554 | $ | 19,561 | — | ||||||||||||
| Average annual total return | 11.97 | % | -2.06 | % | -.91 | % | 6.94 | % | — | |||||||||||||
Class I | Growth of $10,000 | $ | 11,306 | $ | 9,602 | $ | 9,878 | — | $ | 18,672 | ||||||||||||
| Average annual total return | 13.06 | % | -1.35 | % | -.25 | % | — | 7.33 | % | |||||||||||||
S&P 500 Index+ | Growth of $10,000 | $ | 12,288 | $ | 9,307 | $ | 8,920 | $ | 29,341 | $ | 23,473 | |||||||||||
| Average annual total return | 22.88 | % | -2.36 | % | -2.26 | % | 11.36 | % | 10.14 | % | ||||||||||||
Russell 1000 Growth Index++ | Growth of $10,000 | $ | 12,165 | $ | 8,324 | $ | 7,195 | $ | 25,030 | $ | 19,472 | |||||||||||
| Average annual total return | 21.65 | % | -5.93 | % | -6.37 | % | 9.61 | % | 7.84 | % | ||||||||||||
Lehman Brothers Aggregate Bond Index+++ | Growth of $10,000 | $ | 10,182 | $ | 12,129 | $ | 13,803 | $ | 20,313 | $ | 18,091 | |||||||||||
| Average annual total return | 1.82 | % | 6.65 | % | 6.66 | % | 7.34 | % | 6.94 | % | ||||||||||||
The growth of $10,000 is cumulative.
| * | Class I shares commenced operations on July 3, 1995. Index returns begin June 30, 1995. |
| + | The Standard & Poor’s (S&P) 500 Index is a capitalization-weighted index of 500 stocks. The index is designed to measure performance of the broad domestic economy through changes in the aggregate market value of 500 stocks representing all major industries. |
| ++ | The Russell 1000 Growth Index consists of those stocks in the Russell 1000 Index that have greater-than-average growth orientation. |
| +++ | The Lehman Brothers Aggregate Bond (LBAB) Index is an unmanaged market value-weighted measure of treasury issues, corporate bond issues and mortgage securities. Index returns assume reinvestment of dividends and, unlike Fund returns, do not reflect any fees or expenses. It is not possible to invest directly into an index. |
5
Table of Contents
In the following interview, Lead Equity Portfolio Manager Julie M. Van Cleave and Lead Bond Portfolio Manager Gary Bartlett discuss the market environment and the fund’s performance for the six-month period ended April 30, 2004.
Q: How would you describe the investment environment during the six months ended April 30, 2004?
A: The markets continued to show signs of improvement in the six months ended April 30, 2004, as we saw robust economic growth, strong corporate earnings and a resilient consumer. And despite worries to the contrary, interest rates remained at low levels.
More recently, we’ve begun to receive increasingly positive employment data. Geopolitical events, however, caused the market to pause on several occasions as the continued conflict in Iraq heightened anxiety worldwide. On the economic front, rising commodity prices, such as oil and steel, began to feed inflation fears.
Fortunately for the equity market, the net result was that the positive outweighed the negative, as both the equity market in general and the fund’s benchmark indices posted solid gains over the time period.
Performance was driven by a variety of sectors, as the market broadened considerably from the initial stages of the rebound. Energy, materials, telecom and financials proved to be the best-performing sectors over this time period, while traditional growth pacesetters, such as technology and health care, lagged the market.
Large-cap and small-cap stocks were essentially even for the period as the S&P 500 and Russell 2000 indices were up 6.27% and 6.54%, respectively.1,2 US value stocks (companies thought to be underpriced) solidly outperformed growth stocks (companies thought to have strong earnings or revenue potential) as the 8.15% return of the Russell 1000 Value Index outdistanced the 4.14% return of the Russell 1000 Growth Index.3,4 In a departure from most of 2003 when lower-quality companies thrived in the speculative market environment, we have seen a rotation back to higher-quality companies. Therefore, for the six months ended April 30, lower-quality companies, those with a Standard & Poor’s common stock rating of C or D, proved, in aggregate, to be the worst performers. This underperformance was most dramatic over the last three months as those C- and D-rated stocks declined nearly 10% while the other quality sectors were essentially flat.
| 1 | “Standard & Poor’s,” “S&P,” “S&P 500” and “500” are trademarks of The McGraw-Hill Companies, Inc., and have been licensed for use. This fund is not sponsored, endorsed, sold or promoted by Standard & Poor’s, and Standard & Poor’s makes no representation regarding the advisability of investing in the portfolio. The S&P 500 is a capitalization-weighted index of 500 stocks. Index returns assume reinvestment of dividends and, unlike fund returns, do not reflect any fees or expenses. It is not possible to invest directly in an index. |
| 2 | The Russell 2000 Index is an unmanaged, capitalization-weighted measure of approximately 2,000 small US stocks. Index returns assume reinvestment of dividends and, unlike fund returns, do not reflect any fees or expenses. It is not possible to invest directly in an index. |
| 3 | The Russell 1000 Value Index is an unmanaged index that consists of those stocks in the Russell 1000 Index with lower price-to-book ratios and lower forecasted growth values. Index returns assume reinvestment of dividends and, unlike fund returns, do not reflect any fees or expenses. It is not possible to invest directly in an index. |
| 4 | The Russell 1000 Growth Index is an unmanaged index that consists of those stocks in the Russell 1000 Index with higher price-to-book ratios and higher forecasted growth values. Index returns assume reinvestment of dividends and, unlike fund returns, do not reflect any fees or expenses. It is not possible to invest directly in an index. |
Q: How did the bond market perform during the six-month period?
A: The semiannual period proved to be volatile for the bond market. The strengthening economy - signaled most notably by a strong March employment report - triggered a sharp decline in bond prices during April. For the month of April alone, the yield on Treasuries rose 66 basis points (0.66%), and month-over-month, Treasuries experienced a price decline of more than 4%. Despite a 2.60% decline in April, the Lehman Brothers Aggregate Bond Index managed to post a positive return of 1.25% for the entire six-month period. Against this backdrop, the markets saw the corporate rally - led by lower-rated issuers - carry through 2003 year-end, stall in the first quarter of 2004 and resume in April. Asset-backed and mortgage-backed securities also continued to perform well, as did most other spread sectors.5 Treasury bonds, while still delivering positive results, lagged the rest of the bond market as their yields rose dramatically in April.
| 5 | Spread refers to the difference in yield between the individual non-Treasury sectors compared with the yields of Treasury securities. |
Q: Did the change in the market environment cause you to shift the fund’s allocation between stocks and bonds?
A: We typically keep the asset allocation in a range around our allocation target of 60% stocks and 40% bonds. From this base, our global and tactical asset allocation group assesses the market environment by using a quantitative system to evaluate technical factors affecting the performance of stocks and bonds. Periodically, the group recommends changes to the fund’s allocation based on its analysis. In most market environments, our allocation to stocks will fall within a range of 58% to 62% of the fund’s market value. For this semiannual period, equities were near the top end of this range given their relative attractiveness versus bonds in the current economic environment.
Q: Before discussing performance, will you remind us of the processes used for selecting stocks and bonds?
A: Our equity investment discipline starts with a thorough analysis of economic trends. For the fund’s stock holdings, this analysis helps us in our effort to determine sectors and industries that we believe are, or will be, the strongest drivers of growth. That process is combined with in-depth company research to narrow the field of investment candidates. We work closely with Scudder’s research analysts to identify companies within those industries that appear to offer the best potential for delivering strong and sustainable earnings growth. Stocks are chosen based on a thorough evaluation of each company’s management and strategy.
The fixed-income managers focus on smaller subsectors of the bond market and use a bottom-up issue-selection process, instead of selecting bonds based on macroeconomic events or trying to predict the direction of interest rates. It is their view that interest rate forecasts do not considerably add value in terms of potential excess returns relative to the benchmark. The fixed-income managers select bonds by evaluating the individual creditworthiness and return potential of each security. They compare opportunities across fixed-income asset classes and among corporate bond sectors in an effort to achieve an attractive risk-versus-return profile. The primary function of the bond portfolio is to provide stable returns to offset some of the volatility in the larger, equity portion of the fund.
Q: How did the fund perform in this environment?
A: For the six months ended April 30, 2004, the fund posted a total return of 3.39%. (Class A shares unadjusted for sales charges. If sales charges had been included, return would have been lower. Past performance is no guarantee of future results. Please see pages 3 through 6 for performance of other share classes and more complete performance information.) This compares with a 6.27% return for the
6
Table of Contents
fund’s equity benchmark, the S&P 500 index, and a 1.25% return for the Lehman Brothers Aggregate Bond Index, the fund’s bond benchmark. The fund’s equity holdings slightly underperformed the S&P 500 during the period, and its bond holdings outperformed the Lehman Brothers Aggregate Bond Index. The fund can also be compared with the Lipper Balanced Funds category, which posted an average return of 4.13%.6
| 6 | The Lipper Balanced Funds category includes portfolios whose primary objective is to conserve principal by maintaining at all times a balance of both stocks and bonds. Typically, the stock/bond ratio ranges around 60%/40%. It is not possible to invest directly in a Lipper category. |
Q: What helped the fund’s equity performance?
A: As the market broadened during the course of the period, our strategic overweight in energy added to performance. Oil field services companies Schlumberger Ltd. and Nabors Industries Ltd. as well as energy giant ConocoPhillips exemplify the strength of the sector, as all of these holdings were up significantly with respect to the time frame.
Security selection within the health care sector and, specifically, the biotechnology industry provided the largest contribution to performance. Holdings in Genentech, Inc., UnitedHealth Group, Inc. and Zimmer Holdings, Inc. all helped drive outperformance in the health care sector.
Genentech was up due to its outstanding opportunities in the field of oncology. Avastin, its new oncology drug that reduces blood flow to cancerous tumors, reportedly provides an increase in survival among colon cancer patients. Genentech received Food and Drug Administration approval for Avastin in February 2004. At the end of April, the stock was up strongly on news that the company’s experimental lung cancer drug, Tarceva, has the potential to prolong the lives of patients. So, we continue to see positive news flow out of this company with its string of product successes. UnitedHealth Group’s stock rose on the news that medical claims for the most recent quarter were much lower than expected. Zimmer Holdings, an orthopedic company, has developed a minimally invasive hip-replacement treatment, and the company continued to generate better-than-expected results.
Positioning within consumer discretionary also added to performance: in particular, gaming-machine maker International Game Technology saw its stock soar based on strong demand for cashless slot machines and the potential for continued expansion of slot machine gaming.
As the economy continued to improve, merger and acquisition activity began to heat up. AT&T Wireless Services, Inc., in which the fund holds an overweight position, was the portfolio’s best-performing stock, rising after the company agreed to be acquired by Cingular. Merger and acquisition activity should continue to increase as corporations look to deploy very strong cash flow.
Q: What detracted from the fund’s equity performance?
A: Overall, sector allocation was added to returns over the time period, while stock selection was mildly disappointing.
Positioning in the information technology sector weighed on performance. After leading the market higher in 2003, technology stocks sold off in the first quarter of 2004 on concerns over slowing order growth. Specific weakness was visible in the highly cyclical semiconductors and semiconductor equipment industry. Therefore, our overweight position in this industry detracted from performance. In fact, the five largest detractors from performance over the last six months were technology companies: Applied Materials, Inc., Intel Corp., EMC Corp., Linear Technology Corp. and Texas Instruments, Inc., which all declined sharply.
7
Table of Contents
Despite the recent weakness, we maintain a healthy weighting in technology. We have, however, altered the composition of our technology exposure and placed more of an emphasis on software and services companies that produced more consistent earnings growth. Electronic Arts, Inc. in the video game arena and Symantec Corp. with its virus-defense and security offerings are examples of this consistency.
Another detractor was our position in media giant Comcast Corp., which was sold off on concerns over falling advertising revenue and its unsolicited bid for Disney. Also, retailer Kohl’s Corp. continued to misfire on merchandising, though it is working through this issue and continues to expand its store base nationally.
Q: How did the fund’s fixed-income strategy and positioning contribute to performance during the period?
A: We believe that the key to providing excess return, or return that exceeds the fund’s benchmarks, is the consistent application of our disciplined bottom-up security-selection style. This not only drives issuer selection but also entails identifying value along the credit curve and finding opportunistic entry and exit points for individual securities. Specifically, in cable/media, we were able to outperform the benchmark because we reduced exposure to Comcast and AOL Time Warner prior to 2003 year-end when these securities were fully valued. We also avoided investment in issuers such as Cox Cable, which was among the worst performers during the first quarter of 2004. In addition, we were able to add value in the auto subsector by concentrating our exposure within the cheapest portion of the credit curves of the individual issuers. In Ford Motor Credit Co., where we have a market weighting, our exposure was limited to the shorter portion of the market. These short-term issues posted positive returns compared with Treasuries, while the longer-term issues from Ford did not. Within General Motors, we added select longer-term issues at opportune times, and the fund benefited from these investments in General Motors, even though the company’s fixed-income issues as a group significantly underperformed Treasuries of comparable maturities during the first quarter.
The high-quality securitized sectors of the market performed well versus benchmark Treasuries during the period. We added opportunistically to our portfolio of relatively stable structured mortgages, which perform well across a wide variety of interest rate environments. During March and April, when volatility increased, this approach helped performance compared with the pass-through-only Lehman Mortgage Index.
Asset-backed securities were one of the better-performing sectors within the investment-grade markets during the period. While still significantly overweight in the sector, we decreased our exposure, selling out of Americredit and PEGTF bonds, as tightening spreads on individual securities enabled us to achieve our target valuations.
The fund’s fixed-income performance was negatively affected over the time period by its exposure to an asset-backed holding issued by Mitsubishi Motor Corporation of America. The performance of this bond has been hurt by the worse-than-expected performance of the loans underlying the transaction. (As of 4/30/04, the position in Mitsubishi was sold.)
Q: Will you tell us about some additions to the equity portfolio during the period?
A: Through our in-depth fundamental research process, we continue to find opportunities to initiate positions in companies that meet our key selection criteria of quality, growth and innovation. New opportunities over the past six months include Hershey Foods Corp., Intuit Inc., CR Bard, Inc., Adobe Systems, Inc. and Paychex, Inc. Obviously, there’s a case-by-case story for each of these additions. For example, Hershey complemented our existing consumer staples sector holdings: CR Bard, a medical device company, provided a nice entry point for its stock price, and the company has some innovative and growing product lines.
8
Table of Contents
Q: Any final thoughts?
A: As far as equities are concerned, it’s clear that we’ve seen an inflection point and a change in market leadership over the last few months, as the market is now rewarding the higher-quality companies that the portfolio has historically emphasized. The portfolio remains well diversified among economic sectors and we feel it is well positioned to capture the continued outperformance of high-quality companies with consistent earnings growth.
Regarding the fixed-income market, the past six months have demonstrated that attempting to determine the effect of changing macro factors on sector performance is a difficult and complex task. The market, yet again, had the interest rate “call” wrong, which no doubt hurt many managers who attempt to add returns by forecasting interest rates. Trying to correctly predict rates and such factors as the geopolitical environment and the US and global economies is a tough way to produce returns. In addition, fixed-income valuations, which have become less compelling as spreads have tightened during the period, made a macro approach all the more challenging. The good news is that dislocations and opportunities at the security level, where we spend all of our time and resources, remain. We believe that by applying our long-standing discipline of evaluating the creditworthiness, structural stability and liquidity of individual securities, we can continue to generate competitive returns for the fund.
The views expressed in this report reflect those of the portfolio managers only through the end of the period of the report as stated on the cover. The managers’ views are subject to change at any time based on market and other conditions and should not be construed as a recommendation.
Portfolio Summary April 30, 2004
Asset Allocation | 4/30/04 | 10/31/03 | ||||
Common Stocks | 62 | % | 60 | % | ||
Collateralized Mortgage Obligations | 11 | % | 8 | % | ||
Corporate Bonds | 10 | % | 10 | % | ||
US Government Backed | 4 | % | 4 | % | ||
US Government Agency Sponsored Pass-Thrus | 4 | % | 6 | % | ||
Foreign Bonds - US$ Denominated | 3 | % | 3 | % | ||
Cash Equivalents | 2 | % | 3 | % | ||
Asset Backed | 2 | % | 5 | % | ||
Municipal Investments | 2 | % | 1 | % | ||
| 100 | % | 100 | % | |||
Sector Diversification (Excludes Cash Equivalents) | 4/30/04 | 10/31/03 | ||||
Information Technology | 24 | % | 26 | % | ||
Health Care | 23 | % | 21 | % | ||
Consumer Discretionary | 13 | % | 14 | % | ||
Consumer Staples | 12 | % | 12 | % | ||
Financials | 12 | % | 10 | % | ||
Industrials | 7 | % | 9 | % | ||
Energy | 7 | % | 6 | % | ||
Telecommunication Services | 1 | % | 1 | % | ||
Materials | 1 | % | 1 | % | ||
| 100 | % | 100 | % | |||
Asset allocation and sector diversification are subject to change.
9
Table of Contents
Ten Largest Equity Holdings at April 30, 2004 (19.0% of Portfolio) | |||
1. Microsoft Corp. Developer of computer software | 2.5 | % | |
2. Pfizer, Inc. Manufacturer of prescription pharmaceuticals and non-prescription self-medications | 2.3 | % | |
3. Genentech, Inc. Developer and discoverer of human pharmaceuticals | 2.1 | % | |
4. Intel Corp. Designer, manufacturer and seller of computer components and related products | 2.0 | % | |
5. General Electric Co. Operator of an industrial conglomerate | 2.0 | % | |
6. Wal-Mart Stores, Inc. Operator of discount stores | 1.8 | % | |
7. Johnson & Johnson Provider of health care products | 1.8 | % | |
8. Cisco Systems, Inc. Developer of computer network products | 1.6 | % | |
9. PepsiCo, Inc. Provider of soft drinks, snack foods and food services | 1.6 | % | |
10. Procter & Gamble Co. Manufacturer of diversified consumer products | 1.3 | % | |
Portfolio holdings are subject to change.
For more complete details about the fund’s investment portfolio, see page 18. A quarterly Fact Sheet is available upon request. Information concerning portfolio holdings of the Fund as of month end is available upon request on the 16th of the following month. Please see the Account Management Resources section for contact information.
10
Table of Contents
Investment Portfolio as of April 30, 2004 (Unaudited)
| Shares | Value ($) | |||
Common Stocks 61.9% | ||||
Consumer Discretionary 8.3% | ||||
Automobiles 1.0% | ||||
| Harley-Davidson, Inc. | 334,600 | 18,844,672 | ||
Hotels Restaurants & Leisure 1.7% | ||||
International Game Technology | 592,800 | 22,372,272 | ||
YUM! Brands, Inc.* | 314,100 | 12,183,939 | ||
| 34,556,211 | ||||
Media 2.8% | ||||
Comcast Corp. “A”* | 350,700 | 10,166,793 | ||
McGraw-Hill, Inc. | 192,900 | 15,212,094 | ||
Omnicom Group, Inc. | 226,000 | 17,969,260 | ||
Viacom, Inc., “B” | 325,704 | 12,588,460 | ||
| 55,936,607 | ||||
Multiline Retail 1.6% | ||||
Kohl’s Corp.* | 153,200 | 6,402,228 | ||
Target Corp. | 572,900 | 24,846,673 | ||
| 31,248,901 | ||||
Specialty Retail 1.2% | ||||
Home Depot, Inc. | 210,550 | 7,409,254 | ||
Lowe’s Companies, Inc. | 192,600 | 10,026,756 | ||
Staples, Inc. | 281,100 | 7,241,136 | ||
| 24,677,146 | ||||
Consumer Staples 7.8% | ||||
Beverages 2.2% | ||||
Coca-Cola Co. | 253,600 | 12,824,552 | ||
PepsiCo, Inc. | 568,200 | 30,961,218 | ||
| 43,785,770 | ||||
Food & Drug Retailing 2.5% | ||||
Walgreen Co. | 390,600 | 13,467,888 | ||
Wal-Mart Stores, Inc.* | 654,300 | 37,295,100 | ||
| 50,762,988 | ||||
Food Products 0.5% | ||||
Dean Foods Co.* | 76,000 | 2,552,080 | ||
Hershey Foods Corp. | 83,900 | 7,457,871 | ||
| 10,009,951 | ||||
Household Products 2.6% | ||||
Colgate-Palmolive Co. | 427,700 | 24,755,276 | ||
Procter & Gamble Co. | 252,800 | 26,733,600 | ||
| 51,488,876 | ||||
Energy 4.1% | ||||
Energy Equipment & Services 2.5% | ||||
Baker Hughes, Inc. | 353,700 | 12,973,716 | ||
Nabors Industries Ltd.* | 507,100 | 22,494,956 | ||
Schlumberger Ltd. | 261,400 | 15,299,742 | ||
| 50,768,414 | ||||
11
Table of Contents
Oil & Gas 1.6% | ||||
Burlington Resources, Inc. | 218,500 | 14,698,495 | ||
ConocoPhillips | 229,100 | 16,334,830 | ||
| 31,033,325 | ||||
Financials 7.2% | ||||
Banks 0.8% | ||||
| Bank of America Corp. | 188,700 | 15,188,463 | ||
Capital Markets 1.7% | ||||
Goldman Sachs Group, Inc. | 63,800 | 6,172,650 | ||
Lehman Brothers Holdings, Inc. | 82,900 | 6,084,860 | ||
Morgan Stanley | 274,800 | 14,121,972 | ||
State Street Corp. | 170,800 | 8,335,040 | ||
| 34,714,522 | ||||
Consumer Finance 1.2% | ||||
| American Express Co. | 507,900 | 24,861,705 | ||
Diversified Financial Services 2.2% | ||||
Citigroup, Inc. | 547,029 | 26,306,625 | ||
Fannie Mae | 248,000 | 17,042,560 | ||
| 43,349,185 | ||||
Insurance 1.3% | ||||
AFLAC, Inc. | 160,700 | 6,786,361 | ||
American International Group, Inc.* | 262,200 | 18,786,630 | ||
| 25,572,991 | ||||
Health Care 14.2% | ||||
Biotechnology 3.0% | ||||
Amgen, Inc.* | 55,600 | 3,128,612 | ||
Genentech, Inc.* | 343,700 | 42,206,360 | ||
Gilead Sciences, Inc.* | 246,900 | 15,018,927 | ||
| 60,353,899 | ||||
Health Care Equipment & Supplies 3.1% | ||||
Baxter International, Inc. | 312,500 | 9,890,625 | ||
Boston Scientific Corp.* | 274,800 | 11,319,012 | ||
C.R. Bard, Inc. | 69,400 | 7,375,138 | ||
Medtronic, Inc. | 342,100 | 17,262,366 | ||
Zimmer Holdings, Inc.* | 206,600 | 16,497,010 | ||
| 62,344,151 | ||||
Health Care Providers & Services 1.1% | ||||
| UnitedHealth Group, Inc. | 369,800 | 22,735,304 | ||
Pharmaceuticals 7.0% | ||||
Abbott Laboratories | 496,500 | 21,855,930 | ||
Eli Lilly & Co. | 329,100 | 24,290,871 | ||
Johnson & Johnson | 658,562 | 35,582,105 | ||
Merck & Co., Inc. | 239,400 | 11,251,800 | ||
Pfizer, Inc. | 1,269,675 | 45,403,578 | ||
| 138,384,284 | ||||
12
Table of Contents
Industrials 4.4% | ||||
Aerospace & Defense 1.1% | ||||
| United Technologies Corp. | 261,100 | 22,522,486 | ||
Air Freight & Logistics 0.7% | ||||
| FedEx Corp. | 176,900 | 12,720,879 | ||
Industrial Conglomerates 2.6% | ||||
3M Co. | 140,100 | 12,115,848 | ||
General Electric Co. | 1,320,100 | 39,536,995 | ||
| 51,652,843 | ||||
Information Technology 14.8% | ||||
Communications Equipment 1.6% | ||||
| Cisco Systems, Inc.* | 1,538,000 | 32,098,060 | ||
Computers & Peripherals 2.6% | ||||
Dell, Inc.* | 203,300 | 7,056,543 | ||
EMC Corp.* | 1,606,500 | 17,928,540 | ||
International Business Machines Corp. | 300,500 | 26,495,085 | ||
| 51,480,168 | ||||
IT Consulting & Services 1.0% | ||||
Accenture Ltd., “A”* | 181,800 | 4,321,386 | ||
Fiserv, Inc.* | 351,000 | 12,832,560 | ||
Paychex, Inc. | 103,800 | 3,869,664 | ||
| 21,023,610 | ||||
Semiconductors & Semiconductor Equipment 4.4% | ||||
Applied Materials, Inc.* | 713,700 | 13,010,751 | ||
Intel Corp. | 1,572,700 | 40,465,571 | ||
Linear Technology Corp. | 381,600 | 13,596,408 | ||
Texas Instruments, Inc. | 867,400 | 21,771,740 | ||
| 88,844,470 | ||||
Software 5.2% | ||||
Adobe Systems, Inc. | 63,500 | 2,625,090 | ||
BEA Systems, Inc.* | 231,100 | 2,636,851 | ||
Electronic Arts, Inc.* | 347,000 | 17,565,140 | ||
Intuit, Inc.* | 138,900 | 5,899,083 | ||
Microsoft Corp. | 1,895,500 | 49,226,135 | ||
MicroStrategy, Inc.* | 24 | 1,153 | ||
Oracle Corp.* | 806,100 | 9,044,442 | ||
Symantec Corp.* | 221,100 | 9,960,555 | ||
VERITAS Software Corp.* | 223,100 | 5,950,077 | ||
| 102,908,526 | ||||
Materials 0.5% | ||||
Chemicals | ||||
| Ecolab, Inc. | 359,700 | 10,719,060 | ||
Telecommunication Services 0.6% | ||||
Diversified Telecommunication Services 0.2% | ||||
| Verizon Communications, Inc. | 112,700 | 4,253,298 | ||
Wireless Telecommunication Services 0.4% | ||||
AT&T Wireless Services, Inc.* | 573,600 | 7,921,416 | ||
Total Common Stocks (Cost $955,517,551) | 1,236,762,181 | |||
13
Table of Contents
Warrants 0.0% | ||||
Information Technology | ||||
Software | ||||
| MircoStrategy, Inc.* (Cost $0) | 106 | 24 | ||
Preferred Stocks 0.4% | ||||
Industrials 0.4% | ||||
Aerospace & Defense | ||||
| Raytheon Co.* | 156,600 | 8,471,089 | ||
Utilities 0.0% | ||||
Electric Utilities | ||||
| TNP Enterprises, Inc. “D” | 633 | 73,071 | ||
Total Preferred Stocks (Cost $8,429,235) | 8,544,160 | |||
Convertible Preferred Stocks 0.0% | ||||
Materials | ||||
Chemicals | ||||
| Hercules Trust II (Cost $237,204) | 380 | 304,000 | ||
Convertible Bonds 0.0% | ||||
Consumer Discretionary 0.0% | ||||
Textiles, Apparel & Luxury Goods | ||||
| DIMON, Inc., 6.25%, 3/31/2007 | 140,000 | 130,760 | ||
Telecommunication Services 0.0% | ||||
Diversified Telecommunication Services | ||||
| Nortel Networks Corp., 4.25%, 9/1/2008 | 95,000 | 89,656 | ||
Total Convertible Bonds (Cost $218,796) | 220,416 | |||
Principal Amount ($) | Value ($) | |||
Corporate Bonds 9.9% | ||||
Consumer Discretionary 0.8% | ||||
Amscan Holdings, Inc., 144A, 8.75%, 5/1/2014 | 40,000 | 40,600 | ||
Bally Total Fitness Holdings Corp., 10.5%, 7/15/2011 | 130,000 | 120,900 | ||
Boca Resorts, Inc., 9.875%, 4/15/2009 | 210,000 | 221,025 | ||
Buffets, Inc., 11.25%, 7/15/2010 | 70,000 | 76,825 | ||
Cablevision Systems Corp.: | ||||
144A, 5.67%, 4/1/2009** | 155,000 | 159,650 | ||
144A, 8.0%, 4/15/2012 | 65,000 | 65,162 | ||
14
Table of Contents
Carrols Corp., 9.5%, 12/1/2008 | 125,000 | 129,375 | ||
Choctaw Resort Development Enterprises, 9.25%, 4/1/2009 | 215,000 | 232,737 | ||
Circus & Eldorado, 10.125%, 3/1/2012 | 155,000 | 157,325 | ||
Comcast Cable Communications: | ||||
6.2%, 11/15/2008 | 475,000 | 510,272 | ||
8.375%, 5/1/2007 | 1,290,000 | 1,462,402 | ||
8.375%, 3/15/2013 | 1,056,000 | 1,259,943 | ||
CSC Holdings, Inc., 7.875%, 12/15/2007 | 210,000 | 223,650 | ||
Dex Media East LLC, 12.125%, 11/15/2012 | 670,000 | 777,200 | ||
DIMON, Inc., Series B, 9.625%, 10/15/2011 | 505,000 | 540,350 | ||
EchoStar DBS Corp., 144A, 6.375%, 10/1/2011 | 95,000 | 96,069 | ||
Eldorado Resorts LLC, 10.5%, 8/15/2006 | 176,000 | 179,080 | ||
Finlay Fine Jewelry Corp., 8.375%, 5/1/2008 | 150,000 | 154,313 | ||
General Motors Corp.: | ||||
8.25%, 7/15/2023 | 245,000 | 262,194 | ||
8.375%, 7/15/2033 | 130,000 | 140,597 | ||
Herbst Gaming, Inc., Series B, 10.75%, 9/1/2008 | 290,000 | 326,250 | ||
International Game Technology, 8.375%, 5/15/2009 | 235,000 | 275,172 | ||
Jacobs Entertainment Co., 11.875%, 2/1/2009 | 190,000 | 209,000 | ||
Kellwood Co., 7.625%, 10/15/2017 | 80,000 | 85,227 | ||
Krystal, Inc., 10.25%, 10/1/2007 | 125,000 | 126,719 | ||
Laidlaw International, Inc., 144A, 10.75%, 6/15/2011 | 145,000 | 162,762 | ||
Lin Television Corp., 6.5%, 5/15/2013 | 85,000 | 83,725 | ||
Mail-Well I Corp., 144A, 7.875%, 12/1/2013 | 80,000 | 75,600 | ||
Mediacom LLC, 9.5%, 1/15/2013 | 155,000 | 154,225 | ||
PEI Holding, Inc., 11.0%, 3/15/2010 | 100,000 | 116,250 | ||
Petro Stopping Centers, 144A, 9.0%, 2/15/2012 | 315,000 | 329,175 | ||
Premier Entertainment Biloxi LLC/Finance, 144A, 10.75%, 2/1/2012 | 70,000 | 75,600 | ||
PRIMEDIA, Inc., 7.625%, 4/1/2008 | 245,000 | 246,837 | ||
Rent-Way Inc., 11.875%, 6/15/2010 | 60,000 | 66,900 | ||
River Rock Entertainment, 144A, 9.75%, 11/1/2011 | 75,000 | 79,875 | ||
Schuler Homes, Inc., 10.5%, 7/15/2011 | 265,000 | 304,750 | ||
Scientific Games Corp., 12.5%, 8/15/2010 | 132,000 | 153,780 | ||
Sealy Mattress Co., Series B, 9.875%, 12/15/2007 | 50,000 | 51,646 | ||
Seneca Gaming Corp., 144A, 7.25%, 5/1/2012 | 60,000 | 61,065 | ||
Sinclair Broadcast Group, Inc.: | ||||
8.0%, 3/15/2012 | 290,000 | 308,125 | ||
8.75%, 12/15/2011 | 290,000 | 319,000 | ||
Six Flags, Inc., 8.875%, 2/1/2010 | 15,000 | 15,263 | ||
Sonic Automotive, Inc., 8.625%, 8/15/2013 | 195,000 | 210,112 | ||
The Reader’s Digest Association, Inc., 144A, 6.5%, 3/1/2011 | 70,000 | 70,700 | ||
Time Warner, Inc., 8.11%, 8/15/2006 | 2,860,000 | 3,156,796 | ||
Toys “R” Us, Inc.: | ||||
7.375%, 10/15/2018 | 330,000 | 315,975 | ||
7.875%, 4/15/2013 | 120,000 | 123,600 | ||
United Auto Group, Inc., 9.625%, 3/15/2012 | 115,000 | 128,513 | ||
United Rentals North America, Inc., 144A, 6.5%, 2/15/2012 | 215,000 | 207,475 | ||
Venetian Casino Resort LLC, 11.0%, 6/15/2010 | 90,000 | 105,300 | ||
VICORP Restaurants, Inc., 144A, 10.5%, 4/15/2011 | 110,000 | 108,900 | ||
Wheeling Island Gaming, Inc., 10.125%, 12/15/2009 | 130,000 | 140,400 | ||
15
Table of Contents
Williams Scotsman, Inc., 9.875%, 6/1/2007 | 130,000 | 129,350 | ||
Worldspan LP\WS Finance Corp., 9.625%, 6/15/2011 | 200,000 | 214,500 | ||
| 15,348,236 | ||||
Consumer Staples 0.0% | ||||
Agrilink Foods, Inc., 11.875%, 11/1/2008 | 46,000 | 48,760 | ||
Gold Kist, Inc., 144A, 10.25%, 3/15/2014 | 125,000 | 131,250 | ||
North Atlantic Trading Co., 144A, 9.25%, 3/1/2012 | 155,000 | 156,938 | ||
Pilgrim’s Pride Corp., 9.625%, 9/15/2011 | 80,000 | 87,200 | ||
Standard Commercial Corp., 144A, 8.0%, 4/15/2012 | 40,000 | 41,300 | ||
Swift & Co.: | ||||
10.125%, 10/1/2009 | 135,000 | 144,281 | ||
12.5%, 1/1/2010 | 70,000 | 74,200 | ||
United Agri Products, 144A, 8.25%, 12/15/2011 | 80,000 | 90,600 | ||
| 774,529 | ||||
Energy 1.3% | ||||
Avista Corp., 9.75%, 6/1/2008 | 430,000 | 516,000 | ||
Citgo Petroleum Corp., 11.375%, 2/1/2011 | 475,000 | 548,625 | ||
Duke Capital Corp., 4.302%, 5/18/2006 | 3,667,000 | 3,751,084 | ||
FirstEnergy Corp., Series B, 6.45%, 11/15/2011 | 195,000 | 205,296 | ||
MAPCO, Inc., 7.25%, 3/1/2009 | 90,000 | 90,675 | ||
Newpark Resources, Inc., Series B, 8.625%, 12/15/2007 | 220,000 | 226,050 | ||
Pedernales Electric Cooperative, Series 02-A, 144A, 6.202%, 11/15/2032 | 7,330,000 | 7,350,084 | ||
Pioneer Natural Resources Co., 9.625%, 4/1/2010 | 145,000 | 179,658 | ||
Southern Natural Gas, 8.875%, 3/15/2010 | 220,000 | 243,100 | ||
Stone Energy Corp., 8.25%, 12/15/2011 | 195,000 | 210,600 | ||
Tristate Generation & Trans Association: | ||||
144A, 6.04%, 1/31/2018 | 4,000,000 | 4,040,120 | ||
144A, 7.144%, 7/31/2033 | 3,740,000 | 3,894,948 | ||
Westport Resources Corp., 8.25%, 11/1/2011 | 125,000 | 140,313 | ||
Williams Cos., Inc.: | ||||
144A, 6.75%, 4/15/2009 | 55,000 | 54,450 | ||
8.75%, 3/15/2032 | 200,000 | 204,000 | ||
XTO Energy, Inc., 4.9%, 2/1/2014 | 3,874,000 | 3,722,736 | ||
| 25,377,739 | ||||
Financials 3.1% | ||||
Ahold Finance USA, Inc., 6.25%, 5/1/2009 | 330,000 | 333,712 | ||
American General Finance Corp., 4.0%, 3/15/2011 | 6,320,000 | 6,031,543 | ||
AmeriCredit Corp., 9.25%, 5/1/2009 | 290,000 | 308,850 | ||
ASIF Global Finance, 144A, 4.9%, 1/17/2013 | 1,250,000 | 1,231,956 | ||
BF Saul REIT, 144A, 7.5%, 3/1/2014 | 205,000 | 205,512 | ||
Capital One Bank, 5.125%, 2/15/2014 | 1,795,000 | 1,717,020 | ||
CB Richard Ellis Services, Inc., 9.75%, 5/15/2010 | 120,000 | 133,800 | ||
Consolidated Communications Holdings, 144A, 9.75%, 4/1/2012 | 100,000 | 103,000 | ||
Dollar Financial Group, Inc., 9.75%, 11/15/2011 | 105,000 | 112,875 | ||
Farmers Insurance Exchange, 144A, 8.625%, 5/1/2024 | 305,000 | 344,986 | ||
Ford Motor Credit Co.: | ||||
5.8%, 1/12/2009 | 2,585,000 | 2,632,861 | ||
6.875%, 2/1/2006 | 8,379,000 | 8,868,971 | ||
16
Table of Contents
General Motors Acceptance Corp.: | ||||
4.5%, 7/15/2006 | 5,720,000 | 5,843,924 | ||
6.75%, 1/15/2006 | 4,460,000 | 4,722,716 | ||
6.875%, 9/15/2011 | 4,145,000 | 4,350,638 | ||
Goldman Sachs Group, Inc.: | ||||
5.15%, 1/15/2014 | 3,100,000 | 3,016,873 | ||
6.345%, 2/15/2034 | 2,075,000 | 1,983,364 | ||
HSBC Bank USA, 4.625%, 4/1/2014 | 4,635,000 | 4,381,354 | ||
IOS Capital LLC, 7.25%, 6/30/2008 | 18,000 | 19,193 | ||
iStar Financial, Inc., 6.0%, 12/15/2010 | 90,000 | 90,383 | ||
OneAmerica Financial Partners, 144A, 7.0%, 10/15/2033 | 2,925,000 | 2,913,976 | ||
Poster Financial Group, 144A, 8.75%, 12/1/2011 | 205,000 | 215,250 | ||
PXRE Capital Trust I, 8.85%, 2/1/2027 | 125,000 | 126,563 | ||
R.H. Donnelly Finance Corp., 10.875%, 12/15/2012 | 245,000 | 291,550 | ||
RAM Holdings Ltd., 144A, 6.875%, 4/1/2024 | 1,500,000 | 1,394,679 | ||
Republic New York Corp., 5.875%, 10/15/2008 | 3,125,000 | 3,328,109 | ||
Thornburg Mortgage, Inc., 8.0%, 5/15/2013 | 165,000 | 169,537 | ||
Universal City Development, 11.75%, 4/1/2010 | 245,000 | 282,975 | ||
Verizon Global Funding Corp., 7.25%, 12/1/2010 | 5,395,000 | 6,099,155 | ||
WMC Finance Co., 144A, 11.75%, 12/15/2008 | 135,000 | 166,725 | ||
| 61,422,050 | ||||
Health Care 0.2% | ||||
AmerisourceBergen Corp., 7.25%, 11/15/2012 | 210,000 | 223,650 | ||
Biovail Corp., 7.875%, 4/1/2010 | 285,000 | 280,012 | ||
Curative Health Services, Inc., 144A, 10.75%, 5/1/2011 | 70,000 | 70,263 | ||
Health Care Service Corp., 144A, 7.75%, 6/15/2011 | 2,000,000 | 2,304,498 | ||
Interactive Health LLC, 144A, 7.25%, 4/1/2011 | 95,000 | 82,650 | ||
Team Health, Inc., 144A, 9.0%, 4/1/2012 | 60,000 | 57,600 | ||
Tenet Healthcare Corp., 6.375%, 12/1/2011 | 755,000 | 658,737 | ||
| 3,677,410 | ||||
Industrials 0.8% | ||||
Aearo Co. I, 144A, 8.25%, 4/15/2012 | 90,000 | 92,250 | ||
Allied Waste North America, Inc.: | ||||
144A, 5.75%, 2/15/2011 | 400,000 | 384,000 | ||
Series B, 8.875%, 4/1/2008 | 100,000 | 111,000 | ||
AMI Semiconductor, Inc., 10.75%, 2/1/2013 | 122,000 | 143,045 | ||
Amsted Industries, Inc., 144A, 10.25%, 10/15/2011 | 50,000 | 56,500 | ||
BAE System 2001 Asset Trust, “B”, Series B 2001, 144A, 7.156%, 12/15/2011 | 1,945,601 | 2,101,093 | ||
Brickman Group, Ltd., Series B, 11.75%, 12/15/2009 | 120,000 | 138,600 | ||
Browning-Ferris Industries: | ||||
7.4%, 9/15/2035 | 275,000 | 254,375 | ||
9.25%, 5/1/2021 | 65,000 | 71,825 | ||
CHC Helicopter Corp., 144A, 7.375%, 5/1/2014 | 105,000 | 106,312 | ||
Collins & Aikman Floor Cover, Series B, 9.75%, 2/15/2010 | 280,000 | 296,800 | ||
Collins & Aikman Products, 10.75%, 12/31/2011 | 225,000 | 232,875 | ||
Corrections Corp. of America, 9.875%, 5/1/2009 | 210,000 | 236,775 | ||
CP Ships Ltd., 10.375%, 7/15/2012 | 210,000 | 243,600 | ||
Dana Corp.: | ||||
7.0%, 3/1/2029 | 330,000 | 316,800 | ||
9.0%, 8/15/2011 | 150,000 | 177,000 | ||
17
Table of Contents
Delta Air Lines, Inc., Series 02-1, 6.417%, 7/2/2012 | 5,620,000 | 5,802,635 | ||
Eagle-Pitcher, Inc., 9.75%, 9/1/2013 | 160,000 | 175,200 | ||
Erico International Corp., 144A, 8.875%, 3/1/2012 | 100,000 | 103,500 | ||
Golden State Petroleum Transportation, 8.04%, 2/1/2019 | 120,000 | 118,991 | ||
Hercules, Inc.: | ||||
144A, 6.75%, 10/15/2029 | 20,000 | 19,800 | ||
11.125%, 11/15/2007 | 335,000 | 402,000 | ||
Hornbeck Offshore Services, Inc., 10.625%, 8/1/2008 | 220,000 | 241,450 | ||
ISP Chemco, Inc., Series B, 10.25%, 7/1/2011 | 185,000 | 209,050 | ||
ISP Holdings, Inc., Series B, 10.625%, 12/15/2009 | 85,000 | 94,350 | ||
Kansas City Southern: | ||||
7.5%, 6/15/2009 | 50,000 | 51,500 | ||
9.5%, 10/1/2008 | 330,000 | 365,475 | ||
MemberWorks, Inc., 144A, 9.25%, 4/1/2014 | 40,000 | 39,900 | ||
Meritage Corp., 144A, 7.0%, 5/1/2014 | 150,000 | 145,500 | ||
Millennium America, Inc.: | ||||
7.625%, 11/15/2026 | 170,000 | 153,000 | ||
9.25%, 6/15/2008 | 390,000 | 425,100 | ||
144A, 9.25%, 6/15/2008 | 140,000 | 152,600 | ||
Mobile Mini, Inc., 9.5%, 7/1/2013 | 170,000 | 190,400 | ||
Plainwell, Inc., Series B, 11.0%, 3/1/2008 * | 4,230,000 | 253,800 | ||
Ply Gem Industries, Inc., 144A, 9.0%, 2/15/2012 | 95,000 | 97,375 | ||
Sea Containers Ltd., 10.5%, 5/15/2012 | 105,000 | 103,163 | ||
Seabulk International, Inc., 9.5%, 8/15/2013 | 165,000 | 171,600 | ||
Ship Finance International Ltd., 144A, 8.5%, 12/15/2013 | 240,000 | 231,600 | ||
Systems 2001 Asset Trust LLC, “G”, Series 2001, 144A, 6.664%, 9/15/2013 | 1,494,840 | 1,630,826 | ||
Tech Olympic USA, Inc.: | ||||
144A, 7.5%, 3/15/2011 | 150,000 | 144,000 | ||
10.375%, 7/1/2012 | 100,000 | 110,000 | ||
Westlake Chemical Corp., 8.75%, 7/15/2011 | 125,000 | 137,187 | ||
| 16,532,852 | ||||
Information Technology 0.0% | ||||
Activant Solutions, Inc., 10.5%, 6/15/2011 | 135,000 | 140,062 | ||
Communications & Powers Industry, Inc., 144A, 8.0%, 2/1/2012 | 105,000 | 107,100 | ||
DigitalNet, Inc., 9.0%, 7/15/2010 | 132,000 | 141,900 | ||
Mediacom Broadband LLC, 11.0%, 7/15/2013 | 50,000 | 53,500 | ||
Telex Communications, Inc., 144A, 11.5%, 10/15/2008 | 60,000 | 64,200 | ||
| 506,762 | ||||
Materials 0.7% | ||||
American Rock Salt Co. LLC, 144A, 9.5%, 3/15/2014 | 95,000 | 98,563 | ||
ARCO Chemical Co., 9.8%, 2/1/2020 | 525,000 | 522,375 | ||
Caraustar Industries, Inc., 9.875%, 4/1/2011 | 145,000 | 147,900 | ||
Dayton Superior Corp., 10.75%, 9/15/2008 | 115,000 | 115,000 | ||
Dow Chemical Co., 7.0%, 8/15/2005 | 6,450,000 | 6,825,667 | ||
Equistar Chemicals LP: | ||||
8.75%, 2/15/2009 | 385,000 | 405,212 | ||
10.625%, 5/1/2011 | 30,000 | 33,600 | ||
Euramax International, Inc., 8.5%, 8/15/2011 | 170,000 | 180,200 | ||
18
Table of Contents
Georgia-Pacific Corp.: | ||||
144A, 8.0%, 1/15/2024 | 895,000 | 939,750 | ||
9.375%, 2/1/2013 | 280,000 | 325,500 | ||
Huntsman Advanced Materials LLC, 144A, 11.0%, 7/15/2010 | 155,000 | 175,925 | ||
Huntsman International LLC, 11.625%, 10/15/2010 | 125,000 | 137,500 | ||
IMC Global, Inc., 10.875%, 8/1/2013 | 205,000 | 251,638 | ||
International Steel Group, Inc., 144A, 6.5%, 4/15/2014 | 300,000 | 288,000 | ||
Mueller Group Inc., 144A, 5.919%, 11/1/2011 | 60,000 | 61,650 | ||
Omnova Solutions, Inc., 11.25%, 6/1/2010 | 60,000 | 66,000 | ||
Owens-Brockway Glass Container, 8.25%, 5/15/2013 | 300,000 | 309,750 | ||
Pliant Corp.: | ||||
144A, 11.125%, 6/15/2009 | 95,000 | 79,325 | ||
11.125%, 9/1/2009 | 95,000 | 101,175 | ||
TriMas Corp., 9.875%, 6/15/2012 | 285,000 | 307,800 | ||
United States Steel LLC, 9.75%, 5/15/2010 | 154,000 | 174,405 | ||
Valmont Industries, Inc., 144A, 6.875%, 5/1/2014 | 65,000 | 65,055 | ||
Weyerhaeuser Co., 7.375%, 3/15/2032 | 2,690,000 | 2,946,946 | ||
| 14,558,936 | ||||
Telecommunication Services 0.4% | ||||
American Cellular Corp., Series B, 10.0%, 8/1/2011 | 395,000 | 381,175 | ||
Bell Atlantic New Jersey, Inc., 7.85%, 11/15/2029 | 877,000 | 1,013,575 | ||
Cincinnati Bell, Inc., 8.375%, 1/15/2014 | 455,000 | 429,975 | ||
GCI, Inc., 144A, 7.25%, 2/15/2014 | 145,000 | 140,650 | ||
Insight Midwest LP: | ||||
9.75%, 10/1/2009 | 35,000 | 36,925 | ||
10.5%, 11/1/2010 | 55,000 | 59,950 | ||
144A, 10.5%, 11/1/2010 | 155,000 | 168,950 | ||
MCI, Inc.: | ||||
6.688%, 5/1/2009 | 145,000 | 137,750 | ||
7.735%, 5/1/2014 | 750,000 | 695,625 | ||
Nextel Communications, Inc., 5.95%, 3/15/2014 | 90,000 | 84,600 | ||
Nortel Networks Corp., 7.4%, 6/15/2006 | 135,000 | 135,675 | ||
Northern Telecom Capital, 7.875%, 6/15/2026 | 405,000 | 384,750 | ||
Qwest Corp.: | ||||
5.625%, 11/15/2008 | 1,085,000 | 1,052,450 | ||
7.25%, 9/15/2025 | 35,000 | 30,450 | ||
Telecomunicaciones de Puerto Rico, Inc., 6.65%, 5/15/2006 | 2,965,000 | 3,158,843 | ||
Triton PCS, Inc., 8.5%, 6/1/2013 | 75,000 | 78,000 | ||
| 7,989,343 | ||||
Utilities 2.6% | ||||
Alabama Power Co., 7.125%, 8/15/2004 | 3,500,000 | 3,556,147 | ||
Appalachian Power Co., 4.8%, 6/15/2005 | 8,730,000 | 8,964,470 | ||
Cleveland Electric Illuminating Co., 144A, 5.65%, 12/15/2013 | 3,655,000 | 3,606,590 | ||
CMS Energy Corp.: | ||||
7.5%, 1/15/2009 | 290,000 | 292,175 | ||
144A, 7.75%, 8/1/2010 | 90,000 | 90,900 | ||
8.5%, 4/15/2011 | 75,000 | 78,563 | ||
Consumers Energy Co., 6.0%, 3/15/2005 | 3,925,000 | 4,034,362 | ||
19
Table of Contents
DPL, Inc.: | ||||
6.875%, 9/1/2011 | 300,000 | 295,500 | ||
8.125%, 9/1/2031 | 125,000 | 115,625 | ||
Illinova Corp., 11.5%, 12/15/2010 | 330,000 | 391,050 | ||
Indiana Michigan Power, 6.375%, 11/1/2012 | 5,040,000 | 5,423,982 | ||
Metropolitan Edison Co., 144A, 4.875%, 4/1/2014 | 4,975,000 | 4,692,146 | ||
NRG Energy, Inc., 144A, 8.0%, 12/15/2013 | 585,000 | 589,388 | ||
Pacific Gas & Electric Co., 6.05%, 3/1/2034 | 5,467,000 | 5,170,147 | ||
PG&E Corp., 144A, 6.875%, 7/15/2008 | 235,000 | 250,275 | ||
Progress Energy, Inc., 6.75%, 3/1/2006 | 8,975,000 | 9,588,468 | ||
TNP Enterprises, Inc., Series B, 10.25%, 4/1/2010 | 185,000 | 202,113 | ||
Xcel Energy, Inc., 7.0%, 12/1/2010 | 3,685,000 | 4,129,264 | ||
| 51,471,165 | ||||
Total Corporate Bonds (Cost $199,020,954) | 197,659,022 | |||
Asset Backed 2.3% | ||||
Automobile Receivables 0.9% | ||||
MMCA Automobile Trust: | ||||
“A4”, Series 2002-3, 3.57%, 8/17/2009 | 6,595,000 | 6,663,523 | ||
“B”, Series 2002-2, 4.67%, 3/15/2010 | 9,457,956 | 9,367,089 | ||
“C”, Series 2002-2, 5.55%, 3/15/2010 | 3,165,228 | 2,647,093 | ||
| 18,677,705 | ||||
Credit Card Receivables 0.1% | ||||
| MBNA Credit Card Master Note Trust, “A2”, Series 2004-A2, 1.24%, 7/15/2013 | 1,745,000 | 1,744,998 | ||
Home Equity Loans 1.3% | ||||
Centex Home Equity: | ||||
“AF6”, Series 2002-D, 4.66%, 12/25/2032 | 6,430,000 | 6,555,318 | ||
“AF6”, Series 2002-A, 5.54%, 1/25/2032 | 6,090,000 | 6,366,566 | ||
Chase Funding Mortgage Loan, “IA5”, Series 1999-2, 7.333%, 11/25/2011 | 4,022,597 | 4,169,668 | ||
Equity One ABS, Inc., “AF3”, Series 2004-1, 3.054%, 4/25/2034 | 3,740,000 | 3,722,288 | ||
Long Beach Mortgage Loan Trust, “A3”, Series 2004-1, 1.4%, 2/25/2034 | 5,281,974 | 5,290,469 | ||
| 26,104,309 | ||||
Total Asset Backed (Cost $47,240,459) | 46,527,012 | |||
Foreign Bonds - US$ Denominated 3.3% | ||||
Alcan, Inc., 6.125%, 12/15/2033 | 5,095,000 | 5,002,373 | ||
Alestra SA de RL de CV, 8.0%, 6/30/2010 | 260,000 | 223,600 | ||
Antenna TV SA, 9.0%, 8/1/2007 | 85,000 | 85,956 | ||
Arcel Finance Ltd., 144A, 7.048%, 9/1/2011 | 2,505,000 | 2,530,050 | ||
Autopista Del Maipo, 144A, 7.373%, 6/15/2022 | 6,805,000 | 7,564,234 | ||
Axtel SA, 144A, 11.0%, 12/15/2013 | 225,000 | 223,875 | ||
Cascades, Inc., 7.25%, 2/15/2013 | 240,000 | 250,200 | ||
Citigroup (JSC Severstal), 144A, 9.25%, 4/19/2014 | 175,000 | 161,000 | ||
Conproca SA de CV, 144A, 12.0%, 6/16/2010 | 240,000 | 302,400 | ||
Crown Euro Holdings SA, 10.875%, 3/1/2013 | 180,000 | 209,700 | ||
Deutsche Telekom International Finance BV, 8.25%, 6/15/2030 | 3,683,000 | 4,574,595 | ||
20
Table of Contents
Eircom Funding, 8.25%, 8/15/2013 | 190,000 | 205,200 | ||
Empresa Brasileira de Telecom SA, 144A, 11.0%, 12/15/2008 | 190,000 | 201,400 | ||
Esprit Telecom Group PLC, 11.5%, 12/15/2007 * | 2,370,000 | 237 | ||
Fage Dairy Industry SA, 9.0%, 2/1/2007 | 685,000 | 695,275 | ||
Federative Republic of Brazil: | ||||
C Bond, 8.0%, 4/15/2014 | 67,728 | 62,174 | ||
8.875%, 4/15/2024 | 325,000 | 260,975 | ||
Gazprom OAO, 144A, 9.625%, 3/1/2013 | 290,000 | 297,975 | ||
Inmarsat Finance PLC, 144A, 7.625%, 6/30/2012 | 235,000 | 239,700 | ||
Innova S. de R.L., 9.375%, 9/19/2013 | 255,000 | 276,994 | ||
Inversiones CMPC SA, 144A, 4.875%, 6/18/2013 | 4,820,000 | 4,507,360 | ||
Jefra Cosmetics International, Inc., 10.75%, 5/15/2011 | 195,000 | 220,838 | ||
LeGrand SA, 8.5%, 2/15/2025 | 180,000 | 189,675 | ||
Luscar Coal Ltd., 9.75%, 10/15/2011 | 195,000 | 221,325 | ||
Mantis Reef Ltd., 144A, 4.692%, 11/14/2008 | 8,580,000 | 8,537,778 | ||
Millicom International Cellular SA, 144A, 10.0%, 12/1/2013 | 225,000 | 230,625 | ||
Mizuho Financial Group, 8.375%, 12/29/2049 | 2,865,000 | 3,019,710 | ||
Mobile Telesystems Financial, 144A, 8.375%, 10/14/2010 | 200,000 | 193,000 | ||
New ASAT (Finance) Ltd., 144A, 9.25%, 2/1/2011 | 180,000 | 189,900 | ||
Nortel Networks Corp., 6.875%, 9/1/2023 | 20,000 | 17,900 | ||
Nortel Networks Ltd., 6.125%, 2/15/2006 | 220,000 | 217,525 | ||
Petroleos Mexicanos, 9.5%, 9/15/2027 | 4,510,000 | 5,276,700 | ||
Petroleum Geo-Services ASA: | ||||
8.0%, 11/5/2006 | 25,000 | 25,563 | ||
10.0%, 11/5/2010 | 437,005 | 476,335 | ||
QBE Insurance Group Ltd., 144A, 5.647%, 7/1/2023 | 3,600,000 | 3,449,804 | ||
Republic of Turkey, 11.0%, 1/14/2013 | 80,000 | 92,800 | ||
Rogers Wireless Communications, Inc., 144A, 6.375%, 3/1/2014 | 130,000 | 122,200 | ||
Royal Bank of Scotland Group PLC, Series 3, 7.816%, 11/29/2049 | 2,675,000 | 2,890,255 | ||
Shaw Communications, Inc.: | ||||
Series B, 7.25%, 4/6/2011 | 190,000 | 203,375 | ||
8.25%, 4/11/2010 | 145,000 | 162,835 | ||
Sistema Capital SA, 144A, 8.875%, 1/28/2011 | 150,000 | 147,000 | ||
Stena AB, 9.625%, 12/1/2012 | 50,000 | 56,250 | ||
Tembec Industries, Inc., 8.5%, 2/1/2011 | 485,000 | 494,700 | ||
TFM SA de CV: | ||||
Step-up Coupon, 11.75%, 6/15/2009 | 110,000 | 109,175 | ||
10.25%, 6/15/2007 | 395,000 | 410,800 | ||
12.5%, 6/15/2012 | 165,000 | 183,975 | ||
Tyco International Group SA: | ||||
5.8%, 8/1/2006 | 5,025,000 | 5,271,868 | ||
144A, 6.0%, 11/15/2013 | 37,000 | 37,508 | ||
6.375%, 2/15/2006 | 3,810,000 | 4,014,006 | ||
6.75%, 2/15/2011 | 178,000 | 191,962 | ||
United Mexican States, 5.875%, 1/15/2014 | 40,000 | 38,720 | ||
Vicap SA, 11.375%, 5/15/2007 | 105,000 | 106,050 | ||
Vitro SA de CV, Series A, 144A, 11.75%, 11/1/2013 | 215,000 | 203,175 | ||
Vivendi Universal SA, Series B, 9.25%, 4/15/2010 | 365,000 | 426,138 | ||
Total Foreign Bonds - US$ Denominated (Cost $68,041,449) | 65,304,743 | |||
21
Table of Contents
US Government Backed 4.0% | ||||
US Treasury Bond: | ||||
5.375%, 2/15/2031 | 135,000 | 136,772 | ||
6.0%, 2/15/2026 | 28,847,000 | 31,195,319 | ||
US Treasury Note: | ||||
3.125%, 4/15/2009 | 725,000 | 709,141 | ||
5.0%, 8/15/2011 | 45,410,000 | 47,744,346 | ||
Total US Government Backed (Cost $81,230,011) | 79,785,578 | |||
US Government Agency Sponsored Pass-Thrus 3.5% | ||||
Federal Home Loan Mortgage Corp.: | ||||
4.5%, 12/1/2018 | 785,000 | 772,489 | ||
5.0%, 12/31/2033 | 3,045,000 | 2,949,844 | ||
5.0%, 12/1/2017 | 3,845,000 | 3,866,628 | ||
5.0%, 7/1/2018 | 3,429,547 | 3,456,659 | ||
5.0%, 12/1/2033 | 3,900,000 | 3,780,562 | ||
Federal National Mortgage Association: | ||||
4.5%, 12/1/2018 (d) | 1,356,252 | 1,336,687 | ||
4.96%, 1/1/2015 | 3,340,665 | 3,357,129 | ||
5.0% with various maturities from 6/1/2018 until 8/1/2023 (d) | 3,536,993 | 3,561,909 | ||
5.5% with various maturities from 3/1/2018 until 8/1/2033 (d) | 11,175,762 | 11,374,797 | ||
6.0% with various maturities from 11/1/2017 until 12/1/2033 (d) | 6,947,492 | 7,183,783 | ||
6.25%, 3/1/2011 | 8,040,000 | 8,849,212 | ||
6.5% with various maturities from 4/1/2017 until 11/1/2033 | 6,926,390 | 7,257,194 | ||
8.0%, 9/1/2015 | 1,542,280 | 1,657,893 | ||
Government National Mortgage Association: | ||||
5.0%, 9/20/2033 | 3,689,677 | 3,585,638 | ||
6.0%, 3/20/2034 | 7,081,523 | 7,255,402 | ||
Total US Government Agency Sponsored Pass-Thrus (Cost $70,939,904) | 70,245,826 | |||
Collateralized Mortgage Obligations 10.7% | ||||
Bank of America Alternative Loan Trust, “2A1”, Series 2004-4, 6.0%, 5/25/2034 | 3,497,000 | 3,570,765 | ||
Bank of America Mortgage Securities, “3A1”, Series 2002-1, 6.25%, 1/25/2017 | 4,450,155 | 4,478,566 | ||
Chase Commercial Mortgage Securities Corp., “A1”, Series 2000-1, 7.656%, 4/15/2032 | 3,442,497 | 3,630,694 | ||
Countrywide Alternative Loan Trust, “1A1”, Series 2004-J1, 6.0%, 2/25/2034 | 2,812,801 | 2,872,466 | ||
CountryWide Home Loans, “A5”, Series 2002-27, 5.5%, 12/25/2032 | 5,436,431 | 5,480,048 | ||
Fannie Mae Grantor Trust, “1A3”, Series 2004-T2, 7.0%, 11/25/2043 | 3,270,000 | 3,479,878 | ||
Fannie Mae Whole Loan, “5A”, Series 2004-W2, 7.5%, 3/25/2044 | 6,106,358 | 6,571,968 | ||
Federal Home Loan Mortgage Corp.: | ||||
“AU”, Series 2759, 3.5%, 5/15/2019 | 3,621,000 | 3,642,788 | ||
“MA”, Series 2663, 3.5%, 8/1/2033 | 970,000 | 982,589 | ||
“NB”, Series 2750, 4.0%, 12/15/2022 | 3,074,000 | 3,081,898 | ||
“PB”, Series 2727, 4.25%, 4/15/2023 | 7,087,500 | 7,169,341 | ||
“LC”, Series 2682, 4.5%, 7/15/2032 | 5,470,000 | 5,104,423 | ||
“PE”, Series 2727, 4.5%, 7/15/2032 | 3,720,000 | 3,473,022 | ||
“TG”, Series 2690, 4.5%, 4/15/2032 | 3,750,000 | 3,496,402 | ||
22
Table of Contents
“HG”, Series 2543, 4.75%, 9/15/2028 | 5,125,345 | 5,260,725 | ||
5.0%, 1/15/2033 | 9,590,000 | 9,452,144 | ||
“PE”, Series 2721, 5.0%, 1/15/2023 | 6,928,000 | 6,636,840 | ||
“QK”, Series 2513, 5.0%, 8/15/2028 | 1,292,893 | 1,304,350 | ||
“PE”, Series 2512, 5.5%, 2/15/2022 | 585,000 | 598,377 | ||
“BD”, Series 2453, 6.0%, 5/15/2017 | 440,000 | 463,615 | ||
“PX”, Series 2097, 6.0%, 10/15/2027 | 3,328,227 | 3,406,243 | ||
“GA”, Series 2450, 6.25%, 10/15/2022 | 446,644 | 447,751 | ||
“3A”, Series T-41, 7.5%, 7/25/2032 | 2,767,574 | 2,978,602 | ||
Federal National Mortgage Association: | ||||
“NA”, Series 2003-128, 4.0%, 8/25/2009 | 9,722,000 | 9,891,132 | ||
“PU”, Series 2003-33, 4.5%, 5/25/2033 | 397,006 | 406,416 | ||
“WB”, Series 2003-106, 4.5%, 10/25/2015 | 6,085,000 | 6,233,815 | ||
“A2”, Series 2002-W10, 4.7%, 8/25/2042 | 1,802,404 | 1,822,126 | ||
“A2”, Series 2002-W9, 4.7%, 8/25/2042 | 1,320,510 | 1,333,003 | ||
“1A5”, Series 2003-W14, 4.71%, 9/25/2043 | 7,858,932 | 8,051,574 | ||
“2A3”, Series 2003-W15, 4.71%, 8/25/2043 | 530,000 | 542,357 | ||
“KY”, Series 2002-55, 4.75%, 4/25/2028 | 2,543,742 | 2,555,788 | ||
“LA”, Series 2002-50, 5.0%, 12/25/2029 | 4,697,040 | 4,783,694 | ||
“A2”, Series 2002-W3, 5.5%, 10/25/2021 | 2,572,849 | 2,593,896 | ||
“MC”, Series 2002-56, 5.5%, 9/25/2017 | 935,000 | 968,639 | ||
“PE”, Series 2002-3, 5.5%, 8/25/2015 | 16,234,500 | 16,879,136 | ||
“PD”, Series 2002-31, 6.0%, 11/25/2021 | 15,200,000 | 15,962,470 | ||
“QE”, Series 2001-64, 6.0%, 4/25/2027 | 1,355,116 | 1,356,032 | ||
“Z”, Series 2001-14, 6.0%, 5/25/2031 | 1,374,371 | 1,416,412 | ||
“2A”, Series 2003-W8, 7.0%, 10/25/2042 | 6,053,106 | 6,428,667 | ||
“ZQ”, Series G92-9, 7.0%, 12/25/2021 | 2,461,328 | 2,580,954 | ||
FHLMC Structured Pass Through Securities: | ||||
“A2B”, Series T-56, 4.29%, 7/25/2036 | 7,440,000 | 7,564,078 | ||
“3A”, Series T-58, 7.0%, 9/25/2043 | 3,521,933 | 3,721,622 | ||
GMAC Commercial Mortgage Securities, Inc., “A3”, Series 1997-C1, 6.869%, 7/15/2029 | 3,115,233 | 3,379,784 | ||
Master Alternative Loan Trust: | ||||
“7A1”, Series 2004-4, 6.0%, 5/25/2034 | 1,065,000 | 1,086,966 | ||
“2A1”, Series 2004-3, 6.25%, 4/25/2034 | 7,265,000 | 7,493,628 | ||
“3A1”, Series 2004-5, 6.5%, 5/25/2034 | 1,310,000 | 1,365,470 | ||
“8A1”, Series 2004-3, 7.0%, 4/25/2034 | 3,987,055 | 4,180,931 | ||
NYC Mortgage Loan Trust, “A3”, Series 1996, 144A, 6.75%, 9/25/2019 | 4,100,000 | 4,420,169 | ||
Residential Funding Mortgage Securities I: | ||||
“A1”, Series 2003-S2, 5.0%, 2/25/2033 | 1,300,282 | 1,311,513 | ||
“A5”, Series 2002-S6, 6.0%, 4/25/2017 | 2,319,409 | 2,340,819 | ||
Structured Asset Securities Corp., “2A1”, Series 2003-1, 6.0%, 2/25/2018 | 2,470,186 | 2,547,955 | ||
Washington Mutual MSC Mortgage Pass-Through, Series, “1A1”, Series 2003-MS, 5.75%, 3/25/2033 | 1,939,070 | 1,952,108 | ||
Total Collateralized Mortgage Obligations (Cost $212,587,151) | 212,754,649 | |||
Municipal Investments 1.6% | ||||
Bergen County, Core City GO, Improvement Authority Governmental Loan Revenue: | ||||
4.75%, 3/15/2015 | 2,105,000 | 2,018,506 | ||
4.8%, 3/15/2016 | 2,315,000 | 2,213,811 | ||
Charlotte-Meckelberg, NC, Hospital Authority Health Care System Revenue, ETM, 5.0%, 8/1/2015 | 3,880,000 | 3,822,615 | ||
23
Table of Contents
Hoboken, NJ, GO: | ||||
Series B, 3.57%, 2/1/2008(c) | 1,725,000 | 1,717,738 | ||
Series B, 3.97%, 2/1/2009(c) | 2,860,000 | 2,835,547 | ||
Illinois, State GO, 4.95%, 6/1/2023 | 4,665,000 | 4,286,062 | ||
Indian Wells, CA, Industrial Development Revenue, Redevelopment Agency, | 2,325,000 | 2,257,296 | ||
Jicarilla, NM, Sales & Special Tax Revenue, Apache Nation Revenue, 5.2%, 12/1/2013 | 2,990,000 | 2,937,675 | ||
New Jersey, Water & Sewer Revenue, District Water Supply, 5.19%, 7/1/2019(c) | 1,000,000 | 979,670 | ||
New York, Environmental Facilities Corp., Series B, 4.7%, 3/15/2011 | 5,350,000 | 5,330,472 | ||
Wisconsin, State (REV) Lease, Series A, 5.7%, 5/1/2026(c) | 3,200,000 | 3,188,704 | ||
Total Municipal Investments (Cost $32,128,575) | 31,588,096 | |||
| Shares | Value ($) | |||
Cash Equivalents 2.4% | ||||
Scudder Cash Management QP Trust, 1.08%(b) (Cost $47,479,185) | 47,479,185 | 47,479,185 | ||
Total Investment Portfolio - 100.0% (Cost $1,723,070,474)(a) | 1,997,174,892 | |||
| * | Non-income producing security. In the case of a bond, generally denotes that the issuer has defaulted on the payment of principal or interest or has filed for bankruptcy. |
| ** | Variable rate demand notes are securities whose interest rate are reset periodically at market levels. These securities are often payable on demand and are shown at their current rates as of April 30, 2004. |
| (a) | The cost for federal income tax purposes was $1,753,980,328. At April 30, 2004, net unrealized appreciation for all securities based on tax cost was $243,194,564. This consisted of aggregate gross unrealized appreciation for all securities in which there was an excess of value over tax cost of $296,470,349 and aggregate gross unrealized depreciation for all securities in which there was an excess of tax cost over value of $53,275,785. |
| (b) | Scudder Cash Management QP Trust is also managed by Deutsche Investment Management Americas Inc. The rate shown is the annualized seven-day yield at period end. |
| (c) | Bond is insured by one of these companies: |
| As a % of Total Investment Portfolio | ||||
AMBAC | AMBAC Assurance Corp. | 0.1 | ||
MBIA | Municipal Bond Investors Assurance | 0.3 | ||
FSA | Financial Security Assurance | 0.2 |
| (d) | Mortgage dollar rolls included |
Included in the portfolio are investments in mortgage or asset-backed securities which are interests in separate pools of mortgages or assets. Effective maturities of these investments may be shorter than stated maturities due to prepayments. Some separate investments in the Federal National Mortgage Association issues which have similar coupon rates have been aggregated for presentation purposes in the investment portfolio.
144A: Security exempt from registration under Rule 144A of the Securities Act of 1933. These securities may be resold in transactions exempt from registration, normally to qualified institutional buyers.
ETM: Bonds bearing the description ETM (escrowed to maturity) are collateralized by US Treasury securities which are held in escrow and used to pay principal and interest on bonds so designated.
The accompanying notes are an integral part of the financial statements.
24
Table of Contents
Statement of Assets and Liabilities as of April 30, 2004 (Unaudited)
Assets | ||||
Investments: | ||||
Investments in securities, at value (cost $1,675,591,289) | $ | 1,949,695,707 | ||
Investment in Scudder Cash Management QP Trust (cost $47,479,185) | 47,479,185 | |||
Total investments in securities, at value (cost $1,723,070,474) | 1,997,174,892 | |||
Cash | 96 | |||
Receivable for investments sold | 35,138,530 | |||
Dividends receivable | 1,053,599 | |||
Interest receivable | 7,588,350 | |||
Receivable for Fund shares sold | 660,200 | |||
Other | 57,131 | |||
Total assets | 2,041,672,798 | |||
Liabilities | ||||
Payable for investments purchased | 52,188,222 | |||
Payable for investments purchased - mortgage dollar rolls | 9,254,822 | |||
Deferred Mortgage Dollar Roll | 5,784 | |||
Payable for Fund shares redeemed | 2,818,037 | |||
Accrued management fee | 964,950 | |||
Other accrued expenses and payables | 2,095,083 | |||
Total liabilities | 67,326,898 | |||
Net assets, at value | $ | 1,974,345,900 | ||
Net Assets | ||||
Net assets consist of: Undistributed net investment income | 1,760,268 | |||
Net unrealized appreciation (depreciation) on investments | 274,104,418 | |||
Accumulated net realized gain (loss) | (316,931,133 | ) | ||
Paid-in capital | 2,015,412,347 | |||
Net assets, at value | $ | 1,974,345,900 | ||
The accompanying notes are an integral part of the financial statements.
Statement of Assets and Liabilities as of April 30, 2004 (Unaudited) (continued)
Net Asset Value | |||
Class A | |||
Net Asset Value and redemption price per share ($1,705,828,913 / 197,125,803 outstanding shares of beneficial interest, $.01 par value, unlimited number of shares authorized) | $ | 8.65 | |
Maximum offering price per share (100 / 94.25 of $8.65) | $ | 9.18 | |
Class B | |||
Net Asset Value, offering and redemption price (subject to contingent deferred sales charge) per share ($213,725,565 / 24,697,054 outstanding shares of beneficial interest, $.01 par value, unlimited number of shares authorized) | $ | 8.65 | |
Class C | |||
Net Asset Value, offering and redemption price (subject to contingent deferred sales charge) per share ($54,068,959 / 6,264,023 outstanding shares of beneficial interest, $.01 par value, unlimited number of shares authorized) | $ | 8.63 | |
Class I | |||
Net Asset Value, offering and redemption price per share ($278,990 / 32,180 outstanding shares of beneficial interest, $.01 par value, unlimited number of shares authorized) | $ | 8.67 | |
Class R | |||
Net Asset Value, offering and redemption price per share ($443,473 / 51,213 outstanding shares of beneficial interest, $.01 par value, unlimited number of shares authorized) | $ | 8.66 |
The accompanying notes are an integral part of the financial statements.
25
Table of Contents
Statement of Operations for the six months ended April 30, 2004 (Unaudited)
Investment Income | ||||
Dividends | $ | 6,575,728 | ||
Interest | 19,724,151 | |||
Dollar roll income | 230,919 | |||
Interest - Scudder Cash Management QP Trust | 224,765 | |||
Total Income | 26,755,563 | |||
Expenses: | ||||
Management fee | 5,573,835 | |||
Distribution service fees | 3,896,369 | |||
Custodian fees | 41,246 | |||
Legal | 14,452 | |||
Auditing | 23,977 | |||
Services to shareholders | 2,261,274 | |||
Reports to shareholders | 23,007 | |||
Registration fees | 27,695 | |||
Trustees’ fees and expenses | 32,090 | |||
Other | 41,038 | |||
Total expenses, before expense reductions | 11,934,983 | |||
Expense reductions | (676 | ) | ||
Total expenses, after expense reductions | 11,934,307 | |||
Net investment income (loss) | 14,821,256 | |||
Realized and Unrealized Gain (Loss) on Investment Transactions | ||||
Net realized gain (loss) from: Investments | 11,374,886 | |||
Foreign currency related transactions | 154 | |||
| 11,375,040 | ||||
Net unrealized appreciation (depreciation) during the period on: Investments | 43,920,708 | |||
Foreign currency related transactions | (18 | ) | ||
| 43,920,690 | ||||
Net gain (loss) on investment transactions | 55,295,730 | |||
Net increase (decrease) in net assets resulting from operations | $ | 70,116,986 | ||
The accompanying notes are an integral part of the financial statements.
26
Table of Contents
Statement of Changes in Net Assets
Increase (Decrease) in Net Assets | Six Months April 30, 2004 (Unaudited) | Year Ended 2003 | ||||||
Operations: | ||||||||
Net investment income (loss) | $ | 14,821,256 | $ | 30,772,695 | ||||
Net realized gain (loss) on investment transactions | 11,375,040 | (144,857,582 | ) | |||||
Net unrealized appreciation (depreciation) on investment transactions during the period | 43,920,690 | 354,707,025 | ||||||
Net increase (decrease) in net assets resulting from operations | 70,116,986 | 240,622,138 | ||||||
Distributions to shareholders from: Net investment income: Class A | (15,311,001 | ) | (29,860,070 | ) | ||||
Class B | (919,080 | ) | (2,192,527 | ) | ||||
Class C | (238,182 | ) | (500,557 | ) | ||||
Class I | (4,488 | ) | (69,415 | ) | ||||
Class R | (1,580 | ) | — | |||||
Fund share transactions: Proceeds from shares sold | 98,422,493 | 176,046,055 | ||||||
Reinvestment of distributions | 15,364,332 | 30,358,072 | ||||||
Cost of shares redeemed | (262,320,669 | ) | (480,583,918 | ) | ||||
Net increase (decrease) in net assets from Fund share transactions | (148,533,844 | ) | (274,179,791 | ) | ||||
Increase (decrease) in net assets | (94,891,189 | ) | (66,180,222 | ) | ||||
Net assets at beginning of period | 2,069,237,089 | 2,135,417,311 | ||||||
Net assets at end of period (including undistributed net investment income of $1,760,268 and $3,413,343, respectively) | $ | 1,974,345,900 | $ | 2,069,237,089 | ||||
The accompanying notes are an integral part of the financial statements.
27
Table of Contents
Class A
Years Ended October 31, | 2004a | 2003 | 2002b | 2001 | 2000 | 1999 | ||||||||||||||||||
Selected Per Share Data | ||||||||||||||||||||||||
Net asset value, beginning of period | $ | 8.44 | $ | 7.62 | $ | 8.80 | $ | 11.34 | $ | 11.35 | $ | 10.54 | ||||||||||||
Income (loss) from investment operations: | ||||||||||||||||||||||||
Net investment income (loss)c | .06 | .13 | .17 | .24 | .26 | .30 | ||||||||||||||||||
Net realized and unrealized gain (loss) on investment transactions | .23 | .83 | (1.15 | ) | (1.69 | ) | .47 | 1.50 | ||||||||||||||||
Total from investment operations | .29 | .96 | (.98 | ) | (1.45 | ) | .73 | 1.80 | ||||||||||||||||
Less distributions from: Net investment income | (.08 | ) | (.14 | ) | (.20 | ) | (.24 | ) | (.28 | ) | (.31 | ) | ||||||||||||
Net realized gains on investment transactions | — | — | — | (.85 | ) | (.46 | ) | (.68 | ) | |||||||||||||||
Total distributions | (.08 | ) | (.14 | ) | (.20 | ) | (1.09 | ) | (.74 | ) | (.99 | ) | ||||||||||||
Net asset value, end of period | $ | 8.65 | $ | 8.44 | $ | 7.62 | $ | 8.80 | $ | 11.34 | $ | 11.35 | ||||||||||||
Total Return (%)d | 3.39 | ** | 12.69 | (11.32 | ) | (13.50 | ) | 6.52 | 17.91 | |||||||||||||||
Ratios to Average Net Assets and Supplemental Data | ||||||||||||||||||||||||
Net assets, end of period ($ millions) | 1,706 | 1,764 | 1,774 | 2,328 | 2,862 | 2,885 | ||||||||||||||||||
Ratio of expenses before expense reductions (%) | 1.02 | * | 1.06 | 1.00 | 1.01e | 1.02 | 1.02 | |||||||||||||||||
Ratio of expenses after expense reductions (%) | 1.02 | * | 1.06 | 1.00 | .99e | 1.01 | 1.02 | |||||||||||||||||
Ratio of net investment income (loss) (%) | 1.56 | * | 1.64 | 2.01 | 2.48 | 2.29 | 2.71 | |||||||||||||||||
Portfolio turnover rate (%) | 99 | * | 108 | 130 | 105 | 95 | 64 | |||||||||||||||||
| a | For the six months ended April 30, 2004 (Unaudited). |
| b | As required, effective November 1, 2001, the Fund has adopted the provisions of the AICPA Audit and Accounting Guide for Investment Companies and began amortizing premium on debt securities. In addition, paydowns on mortgage backed securities which were included in realized gain/loss on investment transactions prior to November 1, 2001 are included as interest income. The effect of these changes for the year ended October 31, 2002 was to decrease net investment income by $.02, increase net realized and unrealized gain (loss) per share by $.02, and decrease the ratio of net investment income to average net assets from 2.20% to 2.01%. Per share data and ratios for periods prior to November 1, 2001 have not been restated to reflect this change in presentation. |
| c | Based on average shares outstanding during the period. |
| d | Total return does not reflect the effect of any sales charges. |
| e | The ratios of operating expenses excluding costs incurred in connection with the reorganization before and after expense reductions were .99% and .99%, respectively. |
| * | Annualized |
| ** | Not annualized |
28
Table of Contents
Class B
Years Ended October 31, | 2004a | 2003 | 2002b | 2001 | 2000 | 1999 | ||||||||||||||||||
Selected Per Share Data | ||||||||||||||||||||||||
Net asset value, beginning of period | $ | 8.44 | $ | 7.62 | $ | 8.79 | $ | 11.34 | $ | 11.34 | $ | 10.52 | ||||||||||||
Income (loss) from investment operations: | ||||||||||||||||||||||||
Net investment income (loss)c | .02 | .06 | .09 | .14 | .16 | .19 | ||||||||||||||||||
Net realized and unrealized gain (loss) on investment transactions | .22 | .82 | (1.14 | ) | (1.69 | ) | .46 | 1.50 | ||||||||||||||||
Total from investment operations | .24 | .88 | (1.05 | ) | (1.55 | ) | .62 | 1.69 | ||||||||||||||||
Less distributions from: | ||||||||||||||||||||||||
Net investment income | (.03 | ) | (.06 | ) | (.12 | ) | (.15 | ) | (.16 | ) | (.19 | ) | ||||||||||||
Net realized gains on investment transactions | — | — | — | (.85 | ) | (.46 | ) | (.68 | ) | |||||||||||||||
Total distributions | (.03 | ) | (.06 | ) | (.12 | ) | (1.00 | ) | (.62 | ) | (.87 | ) | ||||||||||||
Net asset value, end of period | $ | 8.65 | $ | 8.44 | $ | 7.62 | $ | 8.79 | $ | 11.34 | $ | 11.34 | ||||||||||||
Total Return (%)d | 2.90 | ** | 11.67 | (12.09 | ) | (14.38 | ) | 5.58 | 16.76 | |||||||||||||||
Ratios to Average Net Assets and Supplemental Data | ||||||||||||||||||||||||
Net assets, end of period ($ millions) | 214 | 248 | 298 | 464 | 556 | 744 | ||||||||||||||||||
Ratio of expenses before expense reductions (%) | 1.97 | * | 1.97 | 1.89 | 1.99e | 1.91 | 2.03 | |||||||||||||||||
Ratio of expenses after expense reductions (%) | 1.97 | * | 1.97 | 1.89 | 1.99e | 1.90 | 2.03 | |||||||||||||||||
Ratio of net investment income (loss) (%) | .61 | * | .73 | 1.11 | 1.48 | 1.40 | 1.70 | |||||||||||||||||
Portfolio turnover rate (%) | 99 | * | 108 | 130 | 105 | 95 | 64 | |||||||||||||||||
| a | For the six months ended April 30, 2004 (Unaudited). |
| b | As required, effective November 1, 2001, the Fund has adopted the provisions of the AICPA Audit and Accounting Guide for Investment Companies and began amortizing premium on debt securities. In addition, paydowns on mortgage backed securities which were included in realized gain/loss on investment transactions prior to November 1, 2001 are included as interest income. The effect of these changes for the year ended October 31, 2002 was to decrease net investment income by $.02, increase net realized and unrealized gain (loss) per share by $.02, and decrease the ratio of net investment income to average net assets from 1.31% to 1.11%. Per share data and ratios for periods prior to November 1, 2001 have not been restated to reflect this change in presentation. |
| c | Based on average shares outstanding during the period. |
| d | Total return does not reflect the effect of any sales charges. |
| e | The ratios of operating expenses excluding costs incurred in connection with the reorganization before and after expense reductions were 1.95% and 1.95%, respectively. |
| * | Annualized |
| ** | Not annualized |
29
Table of Contents
Class C
Years Ended October 31, | 2004a | 2003 | 2002b | 2001 | 2000 | 1999 | ||||||||||||||||||
Selected Per Share Data | ||||||||||||||||||||||||
Net asset value, beginning of period | $ | 8.42 | $ | 7.60 | $ | 8.78 | $ | 11.31 | $ | 11.32 | $ | 10.54 | ||||||||||||
Income (loss) from investment operations: | ||||||||||||||||||||||||
Net investment income (loss)c | .02 | .06 | .10 | .15 | .16 | .20 | ||||||||||||||||||
Net realized and unrealized gain (loss) on investment transactions | .23 | .83 | (1.15 | ) | (1.67 | ) | .47 | 1.48 | ||||||||||||||||
Total from investment operations | .25 | .89 | (1.05 | ) | (1.52 | ) | .63 | 1.68 | ||||||||||||||||
Less distributions from: | ||||||||||||||||||||||||
Net investment income | (.04 | ) | (.07 | ) | (.13 | ) | (.16 | ) | (.18 | ) | (.22 | ) | ||||||||||||
Net realized gains on investment transactions | — | — | — | (.85 | ) | (.46 | ) | (.68 | ) | |||||||||||||||
Total distributions | (.04 | ) | (.07 | ) | (.13 | ) | (1.01 | ) | (.64 | ) | (.90 | ) | ||||||||||||
Net asset value, end of period | $ | 8.63 | $ | 8.42 | $ | 7.60 | $ | 8.78 | $ | 11.31 | $ | 11.32 | ||||||||||||
Total Return (%)d | 2.93 | ** | 11.81 | (12.13 | ) | (14.18 | ) | 5.63 | 16.64 | |||||||||||||||
Ratios to Average Net Assets and Supplemental Data | ||||||||||||||||||||||||
Net assets, end of period ($ millions) | 54 | 57 | 57 | 72 | 61 | 43 | ||||||||||||||||||
Ratio of expenses before expense reductions (%) | 1.89 | * | 1.93 | 1.80 | 1.89e | 1.87 | 1.89 | |||||||||||||||||
Ratio of expenses after expense reductions (%) | 1.89 | * | 1.93 | 1.80 | 1.87e | 1.86 | 1.89 | |||||||||||||||||
Ratio of net investment income (loss) (%) | .69 | * | .77 | 1.21 | 1.59 | 1.44 | 1.84 | |||||||||||||||||
Portfolio turnover rate (%) | 99 | * | 108 | 130 | 105 | 95 | 64 | |||||||||||||||||
| a | For the six months ended April 30, 2004 (Unaudited). |
| b | As required, effective November 1, 2001, the Fund has adopted the provisions of the AICPA Audit and Accounting Guide for Investment Companies and began amortizing premium on debt securities. In addition, paydowns on mortgage backed securities which were included in realized gain/loss on investment transactions prior to November 1, 2001 are included as interest income. The effect of these changes for the year ended October 31, 2002 was to decrease net investment income by $.02, increase net realized and unrealized gain (loss) per share by $.02, and decrease the ratio of net investment income to average net assets from 1.40% to 1.21%. Per share data and ratios for periods prior to November 1, 2001 have not been restated to reflect this change in presentation. |
| c | Based on average shares outstanding during the period. d Total return does not reflect the effect of any sales charges. |
| e | The ratios of operating expenses excluding costs incurred in connection with the reorganization before and after expense reductions were 1.87% and 1.87%, respectively. |
| * | Annualized |
| ** | Not annualized |
30
Table of Contents
Class I
Years Ended October 31, | 2004a | 2003 | 2002b | 2001 | 2000 | 1999 | ||||||||||||||||||
Selected Per Share Data | ||||||||||||||||||||||||
Net asset value, beginning of period | $ | 8.45 | $ | 7.63 | $ | 8.82 | $ | 11.36 | $ | 11.38 | $ | 10.54 | ||||||||||||
Income (loss) from investment operations: | ||||||||||||||||||||||||
Net investment income (loss)c | .08 | .16 | .20 | .27 | .29 | .34 | ||||||||||||||||||
Net realized and unrealized gain (loss) on investment transactions | .23 | .83 | (1.16 | ) | (1.69 | ) | .47 | 1.53 | ||||||||||||||||
Total from investment operations | .31 | .99 | (.96 | ) | (1.42 | ) | .76 | 1.87 | ||||||||||||||||
Less distributions from: | ||||||||||||||||||||||||
Net investment income | (.09 | ) | (.17 | ) | (.23 | ) | (.27 | ) | (.32 | ) | (.35 | ) | ||||||||||||
Net realized gains on investment transactions | — | — | — | (.85 | ) | (.46 | ) | (.68 | ) | |||||||||||||||
Total distributions | (.09 | ) | (.17 | ) | (.23 | ) | (1.12 | ) | (.78 | ) | (1.03 | ) | ||||||||||||
Net asset value, end of period | $ | 8.67 | $ | 8.45 | $ | 7.63 | $ | 8.82 | $ | 11.36 | $ | 11.38 | ||||||||||||
Total Return (%) | 3.67 | ** | 13.09 | (11.09 | ) | (13.14 | ) | 6.80 | 18.65 | |||||||||||||||
Ratios to Average Net Assets and Supplemental Data | ||||||||||||||||||||||||
Net assets, end of period ($ millions) | .28 | .41 | 6 | 9 | 11 | 10 | ||||||||||||||||||
Ratio of expenses before expense reductions (%) | .70 | * | .67 | .64 | .66d | .63 | .67 | |||||||||||||||||
Ratio of expenses after expense reductions (%) | .70 | * | .67 | .64 | .65d | .62 | .67 | |||||||||||||||||
Ratio of net investment income (loss) (%) | 1.88 | * | 2.03 | 2.37 | 2.82 | 2.68 | 3.06 | |||||||||||||||||
Portfolio turnover rate (%) | 99 | * | 108 | 130 | 105 | 95 | 64 | |||||||||||||||||
| a | For the six months ended April 30, 2004 (Unaudited). |
| b | As required, effective November 1, 2001, the Fund has adopted the provisions of the AICPA Audit and Accounting Guide for Investment Companies and began amortizing premium on debt securities. In addition, paydowns on mortgage backed securities which were included in realized gain/loss on investment transactions prior to November 1, 2001 are included as interest income. The effect of these changes for the year ended October 31, 2002 was to decrease net investment income by $.02, increase net realized and unrealized gain (loss) per share by $.02, and decrease the ratio of net investment income to average net assets from 2.56% to 2.37%. Per share data and ratios for periods prior to November 1, 2001 have not been restated to reflect this change in presentation. |
| c | Based on average shares outstanding during the period. |
| d | The ratios of operating expenses excluding costs incurred in connection with the reorganization before and after expense reductions were .64% and .64%, respectively. |
| * | Annualized |
| ** | Not annualized |
31
Table of Contents
Class R
| 2004a | 2003b | |||||||
Selected Per Share Data | ||||||||
Net asset value, beginning of period | $ | 8.44 | $ | 8.33 | ||||
Income (loss) from investment operations: | ||||||||
Net investment income (loss)c | .06 | .20 | ||||||
Net realized and unrealized gain (loss) on investment transactions | .22 | (.09 | ) | |||||
Total from investment operations | .28 | .11 | ||||||
Less distributions from: Net investment income | (.06 | ) | — | |||||
Total distributions | (.06 | ) | — | |||||
Net asset value, end of period | $ | 8.66 | $ | 8.44 | ||||
Total Return (%) | 2.98 | ** | 1.32 | ** | ||||
Ratios to Average Net Assets and Supplemental Data | ||||||||
Net assets, end of period ($ millions) | .44 | .01 | ||||||
Ratio of expenses | 1.11 | * | 1.33 | * | ||||
Ratio of net investment income (loss) (%) | 1.47 | * | 1.37 | * | ||||
Portfolio turnover rate (%) | 99 | * | 108 | * | ||||
| a | For the six months ended April 30, 2004 (Unaudited). |
| b | For the period from October 1, 2003 (commencement of sales of Class R shares) to October 31, 2003. |
| c | Based on average shares outstanding during the period. |
| * | Annualized |
| ** | Not annualized |
32
Table of Contents
Notes to Financial Statements (Unaudited)
A. Significant Accounting Policies
Scudder Total Return Fund (the “Fund”) is registered under the Investment Company Act of 1940, as amended (the “1940 Act”), as an open-end, diversified management investment company organized as a Massachusetts business trust.
The Fund offers multiple classes of shares which provide investors with different purchase options. Class A shares are offered to investors subject to an initial sales charge. Class B shares are offered without an initial sales charge but are subject to higher ongoing expenses than Class A shares and a contingent deferred sales charge payable upon certain redemptions. Class B shares automatically convert to Class A shares six years after issuance. Class C shares are offered without an initial sales charge but are subject to higher ongoing expenses than Class A shares and a contingent deferred sales charge payable upon certain redemptions within one year of purchase. Prior to March 1, 2004, Class C shares were offered with an initial sales charge. Class C shares do not convert into another class. Class I shares are offered to a limited group of investors, are not subject to initial or contingent deferred sales charges and have lower ongoing expenses than other classes. Class R shares are offered to investors without an initial sales charge or contingent deferred sales charge.
Investment income, realized and unrealized gains and losses, and certain fund-level expenses and expense reductions, if any, are borne pro rata on the basis of relative net assets by the holders of all classes of shares, except that each class bears certain expenses unique to that class such as distribution service fees, and certain other class-specific expenses. Differences in class-level expenses may result in payment of different per share dividends by class. All shares of the Fund have equal rights with respect to voting subject to class-specific arrangements.
The Fund’s financial statements are prepared in accordance with accounting principles generally accepted in the United States of America which require the use of management estimates. Actual results could differ from those estimates. The policies described below are followed consistently by the Fund in the preparation of its financial statements.
Security Valuation. Investments are stated at value determined as of the close of regular trading on the New York Stock Exchange on each day the exchange is open for trading. Equity securities are valued at the most recent sale price or official closing price reported on the exchange (US or foreign) or over-the-counter market on which the security is traded most extensively. Securities for which no sales are reported are valued at the calculated mean between the most recent bid and asked quotations on the relevant market or, if a mean cannot be determined, at the most recent bid quotation.
Debt securities are valued by independent pricing services approved by the Trustees of the Fund. If the pricing services are unable to provide valuations, the securities are valued at the most recent bid quotation or evaluated price, as applicable, obtained from one or more broker-dealers. Such services may use various pricing techniques which take into account appropriate factors such as yield, quality, coupon rate, maturity, type of issue, trading characteristics and other data, as well as broker quotes.
Money market instruments purchased with an original or remaining maturity of sixty days or less, maturing at par, are valued at amortized cost. Investments in open-end investments companies and Scudder Cash Management QP Trust are valued at their net asset value each business day.
Securities and other assets for which market quotations are not readily available or for which the above valuation procedures are deemed not to reflect fair value are valued in a manner that is intended to reflect their fair value as determined in accordance with procedures approved by the Trustees.
Foreign Currency Translations. The books and records of the Fund are maintained in US dollars. Investment securities and other assets and liabilities denominated in a foreign currency are translated into US dollars at the prevailing exchange rates at period end. Purchases and sales of investment securities, income and expenses are translated into US dollars at the prevailing exchange rates on the respective dates of the transactions.
Net realized and unrealized gains and losses on foreign currency transactions represent net gains and losses between trade and settlement dates on securities transactions, the disposition of forward foreign currency exchange contracts and foreign currencies, and the difference between the amount of net investment income accrued and the US dollar amount actually received. That portion of both realized and unrealized gains and losses on investments that results from fluctuations in foreign currency exchange rates is not separately disclosed but is included with net realized and unrealized gains and losses on investment securities.
Mortgage Dollar Rolls. The Fund may enter into mortgage dollar rolls in which the Fund sells to a bank or broker/dealer (the “counterparty”) mortgage-backed securities for delivery in the current month and simultaneously contracts to repurchase similar, but not identical, securities on a fixed date. The counterparty receives all principal and interest payments, including prepayments, made on the security while it is the holder. The Fund receives compensation as consideration for entering into the commitment to repurchase. The compensation is paid in the form of a lower price for the security upon its repurchase, or alternatively, a fee. Mortgage dollar rolls may be renewed with a new sale and repurchase price and a cash settlement made at each renewal without physical delivery of the securities subject to the contract.
33
Table of Contents
Mortgage dollar rolls may be treated for purposes of the 1940 Act as borrowings by the Fund because they involve the sale of a security coupled with an agreement to repurchase. A mortgage dollar roll involves costs to the Fund. For example, while the Fund receives compensation as consideration for agreeing to repurchase the security, the Fund forgoes the right to receive all principal and interest payments while the counterparty holds the security. These payments to the counterparty may exceed the compensation received by the Fund, thereby effectively charging the Fund interest on its borrowing. Further, although the Fund can estimate the amount of expected principal prepayment over the term of the mortgage dollar roll, a variation in the actual amount of prepayment could increase or decrease the cost of the Fund’s borrowing.
Certain risks may arise upon entering into mortgage dollar rolls from the potential inability of counterparties to meet the terms of their commitments. Additionally, the value of such securities may change adversely before the Fund is able to repurchase them. There can be no assurance that the Fund’s use of the cash that it receives from a mortgage dollar roll will provide a return that exceeds its borrowing costs.
Federal Income Taxes. The Fund’s policy is to comply with the requirements of the Internal Revenue Code, as amended, which are applicable to regulated investment companies, and to distribute all of its taxable income to its shareholders. Accordingly, the Fund paid no federal income taxes and no federal income tax provision was required.
At October 31, 2003 the Fund had a net tax basis capital loss carryforward of approximately $293,032,000 which may be applied against any realized net taxable capital gains of each succeeding year until fully utilized or until October 31, 2008 ($1,718,000), October 31, 2009 ($115,044,000), October 31, 2010 ($19,493,000), and October 31, 2011 ($156,777,000) the respective expiration dates, which may be subject to certain limitations under section 382-384 of the Internal Revenue Code.
Distribution of Income and Gains. Distributions of net investment income, if any, are made quarterly. Net realized gains from investment transactions, in excess of available capital loss carryforwards, would be taxable to the Fund if not distributed, and, therefore, will be distributed to shareholders at least annually.
The timing and characterization of certain income and capital gains distributions are determined annually in accordance with federal tax regulations which may differ from accounting principles generally accepted in the United States of America. These differences primarily relate to certain securities sold at a loss and premium amortization
on debt securities. These differences primarily relate to securities sold at a loss and premium amortization on debt securities. As a result, net investment income (loss) and net realized gain (loss) on investment transactions for a reporting period may differ significantly from distributions during such period. Accordingly, the Fund may periodically make reclassifications among certain of its capital accounts without impacting the net asset value of the Fund.
The tax character of current year distributions, if any, will be determined at the end of the fiscal year.
Other. Investment transactions are accounted for on a trade date plus one basis for daily net asset value calculations. However, for financial reporting purposes, investment transactions are reported on trade date. Interest income is recorded on the accrual basis. Dividend income is recorded on the ex-dividend date net of foreign withholding taxes. Certain dividends from foreign securities may be recorded subsequent to the ex-dividend date as soon as the Fund is informed of such dividends. Realized gains and losses from investment transactions are recorded on an identified cost basis.
34
Table of Contents
B. Purchases and Sales of Securities
During the six months ended April 30, 2004, purchases and sales of investment securities (excluding short-term investments and US Treasury securities) aggregated $811,554,107 and $934,577,784, respectively. Purchases and sales of US Treasury securities aggregated $863,883,787 and $987,091,507, respectively.
C. Related Parties
Management Agreement. Under the Management Agreement with Deutsche Investment Management Americas Inc. (“DeIM” or the “Advisor”), the Advisor directs the investments of the Fund in accordance with its investment objectives, policies and restrictions. The Advisor determines the securities, instruments and other contracts relating to investments to be purchased, sold or entered into by the Fund. In addition to portfolio management services, the Advisor provides certain administrative services in accordance with the Management Agreement. The management fee payable under the Management Agreement is equal to an annual rate of 0.58% of the first $250,000,000 of the Fund’s average daily net assets, 0.55% of the next $750,000,000 of such net assets, 0.53% of the next $1,500,000,000 of such net assets, 0.51% of the next $2,500,000,000 of such net assets, 0.48% of the next $2,500,000,000 of such net assets, 0.46% of the next $2,500,000,000 of such net assets, 0.44% of the next $2,500,000,000 of such net assets and 0.42% of such net assets in excess of $12,500,000,000, computed and accrued daily and payable monthly. Accordingly, for the six months ended April 30, 2004, the fee pursuant to the Management Agreement was equivalent to an annualized effective rate of 0.54% of the Fund’s average daily net assets.
Effective October 1, 2003 through September 30, 2005, the Advisor has agreed to contractually waive all or a portion of its management fee and reimburse or pay certain
operating expenses of the Fund to the extent necessary to maintain the operating expenses of each class at 0.84%, 0.97%, 0.945%, 0.685% and 1.34% of average daily net assets for Class A, B, C, I and R shares, respectively (excluding certain expenses such as extraordinary expenses, taxes, brokerage, interest, Rule 12b-1 and/or service fees, trustee and trustee counsel fees, and organizational and offering expenses).
Service Provider Fees.
Scudder Investments Service Company (“SISC”), an affiliate of the Advisor, is the transfer, dividend-paying agent and shareholder service agent. Pursuant to a sub-transfer agency agreement between SISC and DST Systems, Inc. (“DST”), SISC has delegated certain transfer agent and dividend paying agent functions to DST. The costs and expenses of such delegation are borne by SISC, not by the Fund. For the six months ended April 30, 2004, the amounts charged to the Fund by SISC were as follows:
Services to Shareholders | Total Aggregated | Not Imposed | Unpaid at April 30, 2004 | ||||||
Class A | $ | 1,516,392 | $ | — | $ | 1,033,528 | |||
Class B | 469,405 | 537 | 334,468 | ||||||
Class C | 92,305 | — | 63,595 | ||||||
Class I | 273 | 37 | 38 | ||||||
Class R | 18 | — | 21 | ||||||
| $ | 2,078,393 | $ | 574 | $ | 1,431,650 | ||||
Distribution Service Agreement. Under the Distribution Service Agreement, in accordance with Rule 12b-1 under the 1940 Act, Scudder Distributors, Inc. (“SDI”), a subsidiary of the Advisor, receives a fee (“Distribution Fee”) of 0.75%, 0.75% and 0.25% of average daily net assets of Class B, C and R shares, respectively. Pursuant to the agreement, SDI enters into related selling group agreements with various firms at various rates for sales of Class B, C and R shares. For the six months ended April 30, 2004, the Distribution Fee was as follows:
35
Table of Contents
Distribution Fee | Total Aggregated | Unpaid at April 30, 2004 | ||||
Class B | $ | 884,421 | $ | 141,303 | ||
Class C | 213,672 | 35,469 | ||||
Class R | 305 | 51 | ||||
| $ | 1,098,398 | $ | 176,823 | |||
In addition, SDI provides information and administrative services (“Service Fee”) to Class A, B, C and R shareholders at an annual rate of up to 0.25% of average daily net assets for each such class. SDI in turn has various agreements with financial services firms that provide these services and pays these fees based upon the assets of shareholder accounts the firms service. For the six months ended April 30, 2004, the Service Fee was as follows:
Service Fee | Total Aggregated | Unpaid at April 30, 2004 | Annualized Effective Rate | ||||||
Class A | $ | 2,441,655 | $ | 379,738 | .26 | %* | |||
Class B | 289,206 | 48,663 | .24 | % | |||||
Class C | 66,809 | 9,660 | .23 | % | |||||
Class R | 301 | 89 | .25 | % | |||||
| $ | 2,797,971 | $ | 438,150 | ||||||
| * | Included in this period’s expense is a one time adjustment for prior period. |
Underwriting and Contingent Deferred Sales Charge. SDI is the principal underwriter for the Fund. Underwriting commissions paid in connection with the distribution of Class A and C shares for the six months ended April 30, 2004 aggregated $60,155 and $169, respectively.
In addition, SDI receives any contingent deferred sales charge (“CDSC”) from Class B share redemptions occurring within six years of purchase and Class C share redemptions occurring within one year of purchase. There is no such charge upon redemption of any share appreciation or reinvested dividends. The CDSC is based on declining rates ranging from 4% to 1% for Class B and 1% for Class C, of the value of the shares redeemed. For the six months ended April 30, 2004, the CDSC for Class B and C shares aggregated $306,084 and $1,935, respectively. A deferred sales charge of up to 1% is assessed on certain redemptions of Class A shares. For the six months ended April 30, 2004, SDI received $1,012.
Trustees’ Fees and Expenses. The Fund pays each Trustee not affiliated with the Advisor retainer fees plus specified amounts for attended board and committee meetings.
Scudder Cash Management QP Trust. Pursuant to an Exemptive Order issued by the SEC, the Fund may invest in the Scudder Cash Management QP Trust (the “QP Trust”) and other affiliated funds managed by the Advisor. The QP Trust seeks to provide as high a level of current income as is consistent with the preservation of capital and the maintenance of liquidity. The QP Trust does not pay the Advisor a management fee for the affiliated funds’ investments in the QP Trust.
36
Table of Contents
D. Expense Off-Set Arrangement
The Fund has entered into an arrangement with its custodian whereby credits realized as a result of uninvested cash balances were used to reduce a portion of the Fund’s custodian expenses. During the six months ended April 30, 2004, the custodian fee was reduced by $104 for custody credits earned.
E. Line of Credit
The Fund and several other affiliated funds (the “Participants”) share in a $1.25 billion revolving credit facility administered by J.P. Morgan Chase Bank for temporary or emergency purposes, including the meeting of redemption requests that otherwise might require the untimely disposition of securities. The Participants are charged an annual commitment fee which is allocated, based upon net assets, among each of the Participants. Interest is calculated at the Federal Funds Rate plus 0.5 percent. The Fund may borrow up to a maximum of 33 percent of its net assets under the agreement.
F. Share Transactions
The following table summarizes share and dollar activity in the Fund:
Six Months Ended April 30, 2004 | Year Ended October 31, 2003 | |||||||||||||
| Shares | Dollars | Shares | Dollars | |||||||||||
Shares sold | ||||||||||||||
Class A | 8,246,872 | $ | 71,733,115 | 15,856,716 | $ | 124,447,235 | ||||||||
Class B | 2,338,932 | 20,352,431 | 4,959,658 | 39,028,208 | ||||||||||
Class C | 671,917 | 5,816,344 | 1,546,325 | 12,153,000 | ||||||||||
Class I | 1,982 | 16,845 | 53,303 | 407,612 | ||||||||||
Class R | 57,530 | 503,758 | 1,200 | * | 10,000 | * | ||||||||
| $ | 98,422,493 | $ | 176,046,055 | |||||||||||
Shares issued to shareholders in reinvestment of distributions | ||||||||||||||
Class A | 1,658,874 | $ | 14,268,156 | 3,541,994 | $ | 27,764,988 | ||||||||
Class B | 102,379 | 881,117 | 267,733 | 2,080,844 | ||||||||||
Class C | 24,336 | 208,991 | 56,952 | 442,827 | ||||||||||
Class I | 521 | 4,488 | 9,146 | 69,413 | ||||||||||
Class R | 183 | 1,580 | — | — | ||||||||||
| $ | 15,364,332 | $ | 30,358,072 | |||||||||||
Shares redeemed | ||||||||||||||
Class A | (21,772,049 | ) | $ | (189,582,767 | ) | (43,354,778 | ) | $ | (339,271,204 | ) | ||||
Class B | (7,159,515 | ) | (62,250,343 | ) | (14,992,524 | ) | (117,156,316 | ) | ||||||
Class C | (1,179,855 | ) | (10,256,159 | ) | (2,359,977 | ) | (18,401,255 | ) | ||||||
Class I | (18,622 | ) | (163,679 | ) | (762,375 | ) | (5,755,143 | ) | ||||||
Class R | (7,700 | ) | (67,721 | ) | — | — | ||||||||
| $ | (262,320,669 | ) | $ | (480,583,918 | ) | |||||||||
37
Table of Contents
Net increase (decrease) | ||||||||||||||
Class A | (11,866,303 | ) | $ | (103,581,496 | ) | (23,956,068 | ) | $ | (187,058,981 | ) | ||||
Class B | (4,718,204 | ) | (41,016,795 | ) | (9,765,133 | ) | (76,047,264 | ) | ||||||
Class C | (483,602 | ) | (4,230,824 | ) | (756,700 | ) | (5,805,428 | ) | ||||||
Class I | (16,119 | ) | (142,346 | ) | (699,926 | ) | (5,278,118 | ) | ||||||
Class R | 50,013 | 437,617 | 1,200 | * | 10,000 | * | ||||||||
| $ | (148,533,844 | ) | $ | (274,179,791 | ) | |||||||||
| * | For the period October 1, 2003 (commencement of sales of Class R shares) to October 31, 2003. |
G. Regulatory Matters and Litigation
Since at least July 2003, federal, state and industry regulators have been conducting ongoing inquiries and investigations (“inquiries”) into the mutual fund industry, and have requested information from numerous mutual fund companies, including Scudder Investments. We are unable to determine what the outcome of these inquiries will be or what the effect, if any, would be on the funds or their advisors. Publicity about mutual fund practices arising from these industry-wide inquiries serves as the general basis of a number of private lawsuits against the Scudder funds. These lawsuits, which previously have been reported in the press, involve purported class action and derivative lawsuits, making various allegations and naming as defendants various persons, including certain Scudder funds, Deutsche Asset Management (“DeAM”) and its affiliates, certain individuals, including in some cases Fund Trustees/Directors, and other parties. DeAM has undertaken to bear all liabilities and expenses incurred by the Scudder funds in connection with these lawsuits, or other lawsuits or regulatory actions that may be filed making allegations similar to these lawsuits regarding fund valuation, market timing, revenue sharing or other subjects of the pending inquiries. Based on currently available information, DeAM believes the likelihood that the pending lawsuits will have a material adverse financial impact on a Scudder fund is remote and such actions are not likely to materially affect its ability to perform under its investment management agreements with the Scudder funds.
For shareholders of Classes A, B and C
| Automated | ScudderACCESS (800) 972-3060 | |
| Information Lines | Personalized account information, information on other Scudder funds and services via touchtone telephone and | |
| Web Site | scudder.com
View your account transactions and balances, trade shares, monitor your asset allocation, and change your | |
For More
Information | (800) 621-1048
To speak with a Scudder service representative. | |
Written
Correspondence |
Scudder Investments
PO Box 219356 Kansas City, MO 64121-9356 | |
| Proxy Voting | A description of the fund’s policies and procedures for voting proxies for portfolio securities can be found on our Web site—scudder.com (type “proxy voting” in the search field)—or on the SEC’s Web site— www.sec.gov. To obtain a written copy without charge, call us toll free at (800) 621-1048. | |
Principal
Underwriter | If you have questions, comments or complaints, contact:
Scudder Distributors, Inc.
222 South Riverside Plaza Chicago, IL 60606-5808(800) 621-1148 | |
38
Table of Contents
| Class A | Class B | Class C | ||||
Nasdaq Symbol | KTRAX | KTRBX | KTRCX | |||
CUSIP Number | 81123H-104 | 81123H-203 | 81123H-302 | |||
Fund Number | 002 | 202 | 302 |
For shareholders of Class R
| Automated Information Lines | Scudder Flex Plan Access (800) 532-8411
24-hour access to your retirement plan account. | |
| Web Site | scudder.com
Click “Retirement Plans” to reallocate assets, process transactions and review your funds through our secure online account access. Obtain prospectuses and applications, blank forms, interactive worksheets, news about Scudder funds, subscription to fund updates by e-mail, retirement planning information, and more. | |
| For More Information | (800) 543-5776 To speak with a Scudder service representative. | |
Written
Correspondence | Scudder Retirement Services
222 South Riverside Plaza Chicago, IL 60606-5806 | |
| Proxy Voting | A description of the fund’s policies and procedures for voting proxies for portfolio securities can be found on our Web site - scudder.com (type “proxy voting” in the search field) - or on the SEC’s Web site - www.sec.gov. To obtain a written copy without charge, call us toll free at (800) 543-5776. | |
Principal
Underwriter | If you have questions, comments or complaints, contact:
Scudder Distributors, Inc.
222 South Riverside Plaza Chicago, IL 60606-5808 (800) 621-1148 | |
| Nasdaq Symbol | KTRRX | |
| CUSIP Number | 81123H-500 | |
| Fund Number | 1513 | |
39
Table of Contents
This privacy statement is issued by Deutsche Investment Management Americas Inc., Deutsche Asset Management, Inc., Scudder Distributors, Inc., Scudder Investor Services, Inc., Scudder Trust Company and the Scudder Funds.
We never sell customer lists or individual client information. We consider privacy fundamental to our client relationships and adhere to the policies and practices described below to protect current and former clients’ information. Internal policies are in place to protect confidentiality, while allowing client needs to be served. Only individuals who need to do so in carrying out their job responsibilities may access client information. We maintain physical, electronic and procedural safeguards that comply with federal standards to protect confidentiality. These safeguards extend to all forms of interaction with us, including the Internet.
In the normal course of business, clients give us nonpublic personal information on applications and other forms, on our websites, and through transactions with us or our affiliates. Examples of the nonpublic personal information collected are name, address, Social Security number and transaction and balance information. To be able to serve our clients, certain of this client information is shared with affiliated and nonaffiliated third party service providers such as transfer agents, custodians, and broker-dealers to assist us in processing transactions and servicing your account with us. In addition, we may disclose all of the information we collect to companies that perform marketing services on our behalf or to other financial institutions with which we have joint marketing agreements. The organizations described above that receive client information may only use it for the purpose designated by the Scudder Companies listed above.
We may also disclose nonpublic personal information about you to other parties as required or permitted by law. For example, we are required or we may provide information to government entities or regulatory bodies in response to requests for information or subpoenas, to private litigants in certain circumstances, to law enforcement authorities, or any time we believe it necessary to protect the firm.
Questions on this policy may be sent to:
Scudder Investments Attention:
Correspondence - Chicago
P.O. Box 219415
Kansas City, MO 64121-9415
August 2003
Notes
Notes
Notes
[GRAPHIC APPEARS HERE]
40
Table of Contents
SIGNATURES
Pursuant to the requirements of the Securities Exchange Act of 1934 and the Investment Company Act of 1940, the registrant has duly caused this report to be signed on its behalf by the undersigned, thereunto duly authorized.
Registrant: | Scudder Total Return Fund | |||||||
| By: | /s/ Julian Sluyters | |||||||
| Julian Sluyters | ||||||||
| Chief Executive Officer | ||||||||
| Date: | June 29, 2004 | |||||||
Pursuant to the requirements of the Securities Exchange Act of 1934 and the Investment Company Act of 1940, this report has been signed below by the following persons on behalf of the registrant and in the capacities and on the dates indicated.
| Registrant: | Scudder Total Return Fund | |||||||
By: | /s/ Julian Sluyters | |||||||
| Julian Sluyters | ||||||||
| Chief Executive Officer | ||||||||
Date: | June 29, 2004 | |||||||
By: | /s/ Charles A. Rizzo | |||||||
| Charles A. Rizzo | ||||||||
| Chief Financial Officer | ||||||||
Date: | June 29, 2004 | |||||||
41
Table of Contents

Scudder Balanced Fund
Annual Report to Shareholders
December 31, 2003
Table of Contents
| 3 | ||
| 5 | ||
| 11 | ||
| 13 | ||
| 20 | ||
| 23 | ||
| 25 | ||
| 30 | ||
| 30 | ||
| 30 | ||
| 32 | ||
This report must be preceded or accompanied by a prospectus. To obtain a prospectus for any of our funds, refer to the Account Management Resources information provided in the back of this booklet. We advise you to consider the fund’s objectives, risks, charges and expenses carefully before investing. The prospectus contains this and other important information about the fund. Please read the prospectus carefully before you invest.
Investments in mutual funds involve risk. Some funds have more risk than others. The fund is subject to stock market risk, meaning stocks in the fund may decline in value for extended periods of time due to the activities and financial prospects of individual companies, or due to general market and economic conditions. Additionally, the fund invests in individual bonds whose yields and market values fluctuate so that your investment may be worth more or less than its original cost. Please read this fund’s prospectus for specific details regarding its investments and risk profile.
Scudder Investments is part of Deutsche Asset Management, which is the marketing name in the US for the asset management activities of Deutsche Bank AG, Deutsche Investment Management Americas Inc., Deutsche Asset Management Inc., Deutsche Asset Management Investment Services Ltd., Deutsche Bank Trust Company Americas and Scudder Trust Company.
Fund shares are not FDIC-insured and are not deposits or other obligations of, or guaranteed by, any bank. Fund shares involve investment risk, including possible loss of principal.
Table of Contents
Performance Summary December 31, 2003
All performance shown is historical and does not guarantee future results. Investment return and principal value fluctuate with changing market conditions so that, when redeemed, shares may be worth more or less than their original cost. Current performance may be lower or higher than the performance quoted. Please visit aarp.scudder.com (Class AARP) or myScudder.com (Class S) for the product’s most recent month-end performance.
Returns and rankings for the 10-year period shown reflect a fee waiver and/or expense reimbursement. Without the waiver/reimbursement, returns and rankings would have been lower.
Returns shown for Class AARP for periods prior to its inception on August 28, 2000 are derived from historical performance of Class S of Scudder Balanced Fund during such periods and have assumed the same expense structure during such periods. Any difference in expenses will affect performance.
Average Annual Returns
Scudder Balanced Fund | 1-Year | 3-Year | 5-Year | 10-Year | ||||||||
Class S | 17.19 | % | -2.23 | % | .69 | % | 7.80 | % | ||||
Class AARP | 17.26 | % | -2.22 | % | .70 | % | 7.80 | % | ||||
S&P 500 Index+ | 28.68 | % | -4.05 | % | -.57 | % | 11.07 | % | ||||
Lehman Brothers Aggregate Bond Index++ | 4.10 | % | 7.57 | % | 6.62 | % | 6.95 | % | ||||
Russell 1000 Growth Index+++ | 29.75 | % | -9.36 | % | -5.11 | % | 9.21 | % |
Sources: Lipper Inc. and Deutsche Investment Management Americas Inc.
Net Asset Value and Distribution Information
| Class AARP | Class S | |||||
| Net Asset Value: | ||||||
12/31/03 | $ | 16.75 | $ | 16.74 | ||
12/31/02 | $ | 14.51 | $ | 14.50 | ||
| Distribution Information: | ||||||
Twelve Months: Income Dividends | $ | .25 | $ | .25 | ||
Class S Lipper Rankings - Balanced Funds Category
Period | Rank | Number of Funds Tracked | Percentile Ranking | |||||
1-Year | 369 | of | 537 | 69 | ||||
3-Year | 353 | of | 433 | 82 | ||||
5-Year | 272 | of | 357 | 76 | ||||
10-Year | 63 | of | 120 | 53 |
Rankings are historical and do not guarantee future results. Rankings are based on total return with distributions reinvested.
Source: Lipper Inc.
3
Table of Contents
Growth of an Assumed $10,000 Investment
| ¨ | Scudder Balanced Fund - Class S |
| ¨ | S&P 500 Index+ |
| ¨ | Russell 1000 Growth Index+++ |
| ¨ | Lehman Brothers Aggregate Bond Index++ |
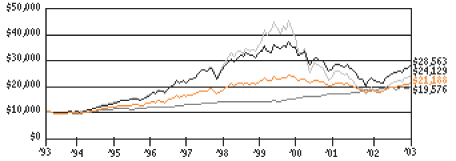
Yearly periods ended December 31
Comparative Results
Scudder Balanced Fund
| 1-Year | 3-Year | 5-Year | 10-Year | |||||||||||||||
Class S | Growth of $10,000 | $ | 11,719 | $ | 9,347 | $ | 10,348 | $ | 21,188 | |||||||||
| Average annual total return | 17.19 | % | -2.23 | % | .69 | % | 7.80 | % | ||||||||||
Class AARP | Growth of $10,000 | $ | 11,726 | $ | 9,347 | $ | 10,353 | $ | 21,197 | |||||||||
| Average annual total return | 17.26 | % | -2.22 | % | .70 | % | 7.80 | % | ||||||||||
S&P 500 Index + | Growth of $10,000 | $ | 12,868 | $ | 8,833 | $ | 9,718 | $ | 28,563 | |||||||||
| Average annual total return | 28.68 | % | -4.05 | % | -.57 | % | 11.07 | % | ||||||||||
Lehman Brothers Aggregate Bond Index ++ | Growth of $10,000 | $ | 10,410 | $ | 12,447 | $ | 13,780 | $ | 19,576 | |||||||||
| Average annual total return | 4.10 | % | 7.57 | % | 6.62 | % | 6.95 | % | ||||||||||
Russell 1000 Growth Index+++ | Growth of $10,000 | $ | 12,975 | $ | 7,446 | $ | 7,692 | $ | 24,129 | |||||||||
| Average annual total return | 29.75 | % | -9.36 | % | -5.11 | % | 9.21 | % | ||||||||||
The growth of $10,000 is cumulative.
| + | The Standard & Poor’s 500 (S&P 500) Index is a capitalization-weighted index of 500 stocks. The index is designed to measure performance of the broad domestic economy through changes in the aggregate market value of 500 stocks representing all major industries. |
| ++ | The Lehman Brothers Aggregate Bond (LBAB) Index is an unmanaged market value-weighted measure of treasury issues, agency issues, corporate bond issues and mortgage securities. |
| +++ | Russell 1000 Growth Index is an unmanaged capitalization-weighted index containing those securities in the Russell 1000 Index with higher book-to-price ratios and higher forecasted growth values. Index returns assume reinvestment of dividends and, unlike Fund returns, do not reflect any fees or expenses. It is not possible to invest directly into an index. |
4
Table of Contents
Scudder Balanced Fund: A Team Approach to Investing
Deutsche Investment Management Americas Inc. (“DeIM” or the “Advisor”), which is part of Deutsche Asset Management, is the investment advisor for Scudder Balanced Fund. DeIM and its predecessors have more than 80 years of experience managing mutual funds and DeIM provides a full range of investment advisory services to institutional and retail clients. DeIM is also responsible for selecting brokers and dealers and for negotiating brokerage commissions and dealer charges.
Deutsche Asset Management is a global asset management organization that offers a wide range of investing expertise and resources. This well-resourced global investment platform brings together a wide variety of experience and investment insight across industries, regions, asset classes and investing styles.
DeIM is an indirect, wholly owned subsidiary of Deutsche Bank AG. Deutsche Bank AG is a major global banking institution that is engaged in a wide range of financial services, including investment management, mutual funds, retail, private and commercial banking, investment banking and insurance.
Portfolio Management Team
Portfolio Managers - Equity portion of the fund
Julie M. Van Cleave, CFA
Managing Director of Deutsche Asset Management and lead portfolio manager of the fund.
| • | Joined Deutsche Asset Management and the fund in 2002. |
| • | Head of Large Cap Growth Portfolio Selection Team. |
| • | Previous experience includes 18 years’ investment industry experience at Mason Street Advisors, most recently serving as Managing Director and team leader for the large cap investment team. |
| • | MBA, University of Wisconsin - Madison. |
Jack A. Zehner
Director of Deutsche Asset Management and portfolio manager of the fund.
| • | Joined Deutsche Asset Management and the fund in 2002. |
| • | Previous experience includes nine years’ investment industry experience at Mason Street Advisors where he served most recently as Director - Common Stock. |
| • | MBA, Marquette University. |
Thomas J. Schmid, CFA
Director of Deutsche Asset Management and portfolio manager of the fund.
| • | Joined Deutsche Asset Management and the fund in 2002. |
| • | Previous experience includes 15 years’ investment industry experience, most recently serving as Director - Common Stock at Mason Street Advisors. |
| • | MBA, University of Chicago. |
5
Table of Contents
Portfolio Managers - Fixed income portion of the fund
J. Christopher Gagnier
Managing Director of Deutsche Asset Management and portfolio manager of the fund.
| • | Joined Deutsche Asset Management in 1997 and the fund in 2002. |
| • | Prior to that, portfolio manager, Paine Webber, from 1984 to 1997. |
| • | Analyst specializing in asset-backed securities and government investments. |
| • | Over 25 years of investment industry experience. |
| • | MBA, University of Chicago. |
Gary W. Bartlett, CFA
Managing Director of Deutsche Asset Management and portfolio manager of the fund.
| • | Joined Deutsche Asset Management in 1992 and the fund in 2002. |
| • | Analyst specializing in taxable municipal and government investments. |
| • | Over 22 years of investment industry experience. |
| • | MBA, Drexel University. |
Warren S. Davis
Managing Director of Deutsche Asset Management and portfolio manager of the fund.
| • | Joined Deutsche Asset Management in 1995 and the fund in 2002. |
| • | Analyst specializing in mortgage- and asset-backed securities. |
| • | Over 18 years of investment industry experience. |
| • | MBA, Drexel University. |
Daniel R. Taylor, CFA
Managing Director of Deutsche Asset Management and portfolio manager of the fund.
| • | Joined Deutsche Asset Management in 1998 and the fund in 2002. |
| • | Prior to that, fixed income portfolio manager, asset-backed securities analyst and senior credit analyst, CoreStates Investment Advisors, from 1992 to 1998. |
| • | Analyst specializing in asset-backed securities and government securities. |
| • | Over 11 years of investment industry experience. |
Thomas J. Flaherty
Managing Director of Deutsche Asset Management and portfolio manager of the fund.
| • | Joined Deutsche Asset Management in 1995 and the fund in 2002. |
| • | Analyst specializing in corporate bonds and mortgages. |
| • | Over 19 years of investment industry experience. |
6
Table of Contents
Janet Campagna
Managing Director of Deutsche Asset Management and portfolio manager of the fund.
| • | Joined Deutsche Asset Management in 1999 and the fund in 2002. |
| • | Head of global and tactical asset allocation. |
| • | Investment strategist and manager of the asset allocation strategies group for Barclays Global Investors from 1994 to 1999. |
| • | Over 16 years of investment industry experience. |
| • | Master’s degree in Social Science from California Institute of Technology. |
| • | Ph.D in Political Science from University of California at Irvine. |
Andrew P. Cestone
Managing Director of Deutsche Asset Management and portfolio manager of the fund.
| • | Joined Deutsche Asset Management in 1998 and the fund in 2002. |
| • | Prior to that, investment analyst, Phoenix Investment Partners, from 1997 to 1998. |
| • | Prior to that, credit officer, asset based lending group, Fleet Bank, from 1995 to 1997. |
William T. Lissenden
Director of Deutsche Asset Management and portfolio manager of the fund.
| • | Joined Deutsche Asset Management in 2002 and the fund in 2003. |
| • | Prior to that, fixed income strategist and director of research at Conseco Capital Management, director of fixed income research and product management at Prudential Securities, national sales manager for fixed income securities at Prudential Securities and institutional sales professional at several firms including Prudential, Goldman Sachs and Merrill Lynch. |
| • | MBA, Baruch College. |
Timothy C. Vile, CFA
Managing Director of Deutsche Asset Management and portfolio manager of the fund.
| • | Joined Deutsche Asset Management in 1991 and the fund in 2003. |
| • | Prior to that, portfolio manager for fixed income portfolios at Equitable Capital Management. |
| • | Over 19 years of investment industry experience. |
7
Table of Contents
In the following interview, Lead Portfolio Manager Julie M. Van Cleave and Portfolio Manager Gary Bartlett discuss Scudder Balanced Fund’s performance strategy and the market environment during the 12-month period ended December 31, 2003.
Q: How would you characterize the market environment of the past year?
A: The investment backdrop was extremely favorable, as 2003 marked the first time since 1999 that both stocks and bonds registered gains in the same calendar year. Stocks began the year on a down note, as uncertainty leading up to the war in Iraq put the economy and markets on hold. However, a swift conclusion of the main military offensive in Iraq paved the way for an impressive worldwide economic rebound. As growth resumed and corporate earnings improved, investors appeared to regain their appetite for risk. Stocks performed very well as a result, with the S&P 500 index rising from its March 11, 2003, low of
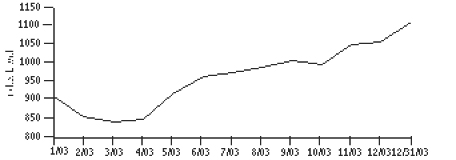
Source: Deutsche Asset Management
Past performance is not indicative of future results. This chart is for illustrative purposes only and is not intended to be representative of the Scudder Balanced Fund’s performance.
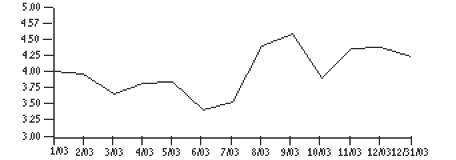
Source: Deutsche Asset Management
Past performance is not indicative of future results. This chart is for illustrative purposes only and is not intended to be representative of Scudder Balanced Fund’s performance.
approximately 801 to 1,112 by year-end. Smaller, higher-risk and lower-quality companies generally provided the best performance during the year.
In the bond market, the gains for Treasuries were muted following three years of strong performance. For the year, the yield on the 10-year note rose slightly from 4.03% to 4.26%. The 10-year Treasury’s total return for the year (which includes interest payments) was only 2.2%, compared with 11.5% in 2002. With the exception of government agency notes (such as those issued by Fannie Mae and Freddie Mac), other sectors of the bond market generally performed well. Corporate bonds, led by higher-yield, lower-quality issues, delivered particularly strong returns.
Q: How did the fund perform during the period?
A: For the 12-month period ended December 31, 2003, Scudder Balanced Fund produced a total return of 17.19% (Class S shares). This compares with a return of 28.68% for its equity benchmark, the S&P
8
Table of Contents
500 index, and 4.10% for its fixed-income benchmark, the Lehman Brothers Aggregate Bond Index. (Please see pages 4 through 6 for performance of other share classes and more complete performance information.) For the year, the fund trailed the 19.09% average return of the 537 funds in the Lipper Balanced Funds category. We believe this discrepancy is due largely to the fact that we seek to emphasize quality in both the stock and bond portions of the portfolio. Regarding equities, we focus on companies that are leaders or potential leaders in their respective industries. In terms of bonds, we carefully consider the issuer’s creditworthiness.1 However, 2003 was an unusual year in that lower-quality securities generally outperformed across the entire investment spectrum. Given our belief that higher-quality securities generally produce the best performance on a longer-term basis, we think it wise to maintain our disciplined approach in response to short-term anomalies in the markets.
| 1 | Creditworthiness reflects the ability of an individual, an institution or a company to meet debt obligations. |
Q: Will you review your investment process?
A: When we select stocks for the fund, we begin by conducting a thorough analysis of economic trends. This helps us determine the sectors and industries that we believe are likely to experience the strongest growth. We then work closely with Scudder’s large team of research analysts in an attempt to identify companies within those industries that offer the best potential to deliver strong and sustainable earnings growth. Stocks are chosen based on a thorough evaluation of each company’s management and strategy.
In the bond portion of the portfolio, we emphasize fundamental security research to ensure that the fund’s holdings offer a favorable balance of risk and return potential. We do not try to forecast the direction of the economy or interest rates, since we believe we are better able to add value through security selection. Instead, we select bonds based on the creditworthiness and return potential of each individual security. The primary function of the bond portfolio is to seek to provide stable returns and to offset some of the volatility of the equity portion of the fund.
Q: How is the fund allocated between stocks and bonds?
A: We consider an allocation of 60% stocks/40% bonds to be our baseline asset allocation for the fund. We will adjust this, but not by much - our holdings in stocks usually range from 58% to 62%. During 2003, we generally held more than the 60% target weighting in stocks, usually about 61% to 62%. The reason for this was our favorable view on the outlook for stocks in an environment of low interest rates and strong global growth. This positioning added modestly to the fund’s performance.
Q: What factors helped and hurt performance in the stock portion of the portfolio?
A: The fund’s equity holdings underperformed the S&P 500 index. This was due largely to our sector allocations, but security selection also played a part.
On the positive side, the health care sector was the most significant contributor to performance. Specifically, our biotechnology holdings outpaced those of the benchmark by a wide margin. Driving this outperformance was our position in Genentech, Inc.
Our positioning in the information technology sector was also helpful. Particular strength was visible in the semiconductor (computer chip) and semiconductor equipment industries. As with most other economically sensitive industries, the performance of semiconductor companies was extremely strong during the past year. As a result, our overweight position in the sector was rewarded. The fund’s holdings in Intel Corp., Texas Instruments, Inc., Applied Materials, Inc. and Linear Technology Corp. all produced strong gains during the year.
9
Table of Contents
Our positioning within the consumer discretionary2 sector proved to be the largest drag on performance due to poor stock selection. The retail industry was a negative for us as Kohl’s Corp. reported disappointing earnings and same-store sales in the third quarter. In addition, Harley-Davidson, Inc. and Newell Rubbermaid were detractors. (As of 12/31/03, the fund’s position in Newell Rubbermaid was sold.) On the positive side, International Game Technology gained more than 89% for the year as casinos added new “cashless” gaming machines. Within the consumer staples3 sector, an overweight position in Colgate-Palmolive Co. detracted from relative performance; the household products company announced disappointing North American sales and slower new product growth.
| 2 | Consumer discretionary products are those, such as home electronics, that are nonnecessities and are therefore more sensitive to economic conditions. |
| 3 | Consumer staples companies are those that make products consumers need to buy regardless of economic conditions, such as food and beverages. |
Finally, our positioning in the energy sector proved to be a detractor from annual performance. We were overweighted energy for most of 2003 as we believe years of underinvestment by the industry argues for sustained higher energy prices, an issue that has yet to be fully realized in the stock prices As stated earlier, investors gravitated to the most aggressive, most cyclical sectors of the market in 2003. Energy has historically been a late cycle performer, and therefore trailed the market in 2003.
Q: How did the fund’s positioning in bonds help or hurt performance?
A: The fixed-income portion of the portfolio performed well in relation to its benchmark. We were overweight in corporate bonds, the area of the bond market that produced the best returns in 2003. Performance was also helped by the fact that we hold a fairly large position in BBB-rated securities, which are on the lower end of the investment-grade spectrum. This was a positive, given that lower-quality issues produced the best performance during the year.
Elsewhere in the bond market, we were underweight in Treasuries, which was a positive in light of their tepid relative performance. The fund was underweight in mortgage-backed securities as well, which also helped, since mortgages were the only bond market sector to underperform Treasuries in 2003.
The underweight in these two sectors was offset by a corresponding overweight in asset-backed securities4, which we felt offered attractive yields compared with Treasuries given the relatively small amount of additional risk that we would take on by owning them. This too was a positive for returns, but we pared back the fund’s position in asset-backed holdings during the fourth quarter on the belief that they had become more fully valued over the course of the year.
| 4 | Asset-backed securities are bonds or notes backed by loans or accounts receivable originated by banks, credit card companies or other providers of credit. |
Q: Do you have any final thoughts you would like to share with investors?
A: The past year was unusual in the sense that both lower-quality stocks and lower-quality bonds outperformed their higher-quality counterparts. This is typical in an environment in which the economy and the markets are rebounding from a downturn. In the event that the market begins to once again favor higher-quality securities, this would likely be a positive for the fund. But even if such a rotation does not take place, we intend to remain focused on investing in high-quality companies with superior growth attributes, as well as bonds that we believe to be reasonably valued and fundamentally sound. We believe this approach will bear fruit when measured over a full, longer-term market and economic cycle.
The views expressed in this report reflect those of the portfolio managers only through the end of the period of the report as stated on the cover. The managers’ views are subject to change at any time based on market and other conditions and should not be construed as a recommendation.
10
Table of Contents
Portfolio Summary December 31, 2003
Diversification | 12/31/03 | 12/31/02 | ||||
Common Stocks | 63 | % | 58 | % | ||
Fixed Income Holdings | 33 | % | 39 | % | ||
Cash Equivalents | 4 | % | 3 | % | ||
| 100 | % | 100 | % | |||
Fixed Income Holdings (Excludes Cash Equivalents) | 12/31/03 | 12/31/02 | ||||
Diversification | ||||||
US Government Sponsored Agencies | 38 | % | 37 | % | ||
Corporate Bonds | 28 | % | 25 | % | ||
Asset Backed | 12 | % | 12 | % | ||
US Government Backed | 9 | % | 19 | % | ||
Foreign Bonds - US$ Denominated | 8 | % | 4 | % | ||
Municipal Investments | 5 | % | 3 | % | ||
| 100 | % | 100 | % | |||
Quality | ||||||
US Government Backed and US Government Sponsored Agencies | 47 | % | 56 | % | ||
AAA* | 24 | % | 19 | % | ||
AA | 2 | % | 3 | % | ||
A | 13 | % | 12 | % | ||
BBB | 12 | % | 10 | % | ||
BB | 2 | % | — | |||
| 100 | % | 100 | % | |||
Weighted Average Quality | AAA | AAA |
Five Largest Fixed Income Holdings (4.5% of Portfolio) | ||
1. US Treasury Bond, 6.00%, 2/15/2026 | 1.3% | |
2. Federal National Mortgage Association “PD”, Series 2002-31, 6.00%, 11/25/2021 | 1.0% | |
3. US Treasury Note, 5.00%, 8/15/2011 | 0.8% | |
4. Federal National Mortgage Association “PE”, Series 2003-3, 5.50%, 8/25/2015 | 0.7% | |
5. US Treasury Note, 1.625%, 4/30/2005 | 0.7% | |
| * | Category includes cash equivalents net. |
11
Table of Contents
Diversification and holdings are subject to change.
Equity Holdings (Excludes Cash Equivalents) | 12/31/03 | 12/31/02 | ||||
Sector Diversification | ||||||
Information Technology | 26 | % | 20 | % | ||
Health Care | 22 | % | 22 | % | ||
Consumer Discretionary | 14 | % | 19 | % | ||
Consumer Staples | 11 | % | 9 | % | ||
Financials | 11 | % | 12 | % | ||
Industrials | 8 | % | 7 | % | ||
Energy | 6 | % | 8 | % | ||
Telecommunication Services | 1 | % | 2 | % | ||
Materials | 1 | % | 1 | % | ||
| 100 | % | 100 | % | |||
Five Largest Equity Holdings (11.5% of Portfolio) | |||
1. Microsoft Corp. Developer of computer software | 2.7 | % | |
2. Intel Corp. Designer, manufacturer and seller of computer components and related products | 2.6 | % | |
3. Pfizer, Inc. Manufacturer of prescription pharmaceuticals and non-prescription self-medications | 2.2 | % | |
4. General Electric Co. Industrial conglomerate | 2.0 | % | |
5. Cisco Systems, Inc. Developer of computer network products | 1.9 | % | |
Diversification and holdings are subject to change.
For more complete details about the fund’s investment portfolio, see page 19. A quarterly Fact Sheet and Portfolio Holdings are available upon request.
12
Table of Contents
Investment Portfolio as of December 31, 2003
| Shares | Value ($) | |||
Common Stocks 63.2% | ||||
Consumer Discretionary 9.0% | ||||
Automobiles 0.8% | ||||
| Harley-Davidson, Inc. | 135,500 | 6,440,315 | ||
Hotels, Restaurants & Leisure 1.7% | ||||
International Game Technology | 239,200 | 8,539,440 | ||
YUM! Brands, Inc.* | 115,400 | 3,969,760 | ||
| 12,509,200 | ||||
Media 3.5% | ||||
Comcast Corp., “A”* | 183,500 | 5,739,880 | ||
McGraw-Hill, Inc. | 71,500 | 4,999,280 | ||
Omnicom Group, Inc. | 83,800 | 7,318,254 | ||
Time Warner, Inc.* | 168,000 | 3,022,320 | ||
Viacom, Inc., “B” | 120,862 | 5,363,855 | ||
| 26,443,589 | ||||
Multiline Retail 1.7% | ||||
Kohl’s Corp.* | 77,300 | 3,473,862 | ||
Target Corp. | 237,900 | 9,135,360 | ||
| 12,609,222 | ||||
Specialty Retail 1.3% | ||||
Home Depot, Inc. | 78,100 | 2,771,769 | ||
Lowe’s Companies, Inc. | 71,300 | 3,949,307 | ||
Staples, Inc.* | 104,800 | 2,861,040 | ||
| 9,582,116 | ||||
Consumer Staples 6.8% | ||||
Beverages 1.9% | ||||
Coca-Cola Co. | 94,000 | 4,770,500 | ||
PepsiCo, Inc. | 202,550 | 9,442,881 | ||
| 14,213,381 | ||||
Food & Drug Retailing 2.4% | ||||
Wal-Mart Stores, Inc. | 242,900 | 12,885,845 | ||
Walgreen Co. | 144,900 | 5,271,462 | ||
| 18,157,307 | ||||
Household Products 2.5% | ||||
Colgate-Palmolive Co. | 199,000 | 9,959,950 | ||
Procter & Gamble Co. | 90,100 | 8,999,188 | ||
| 18,959,138 | ||||
Energy 4.1% | ||||
Energy Equipment & Services 2.7% | ||||
Baker Hughes, Inc. | 130,000 | 4,180,800 | ||
Nabors Industries Ltd.* | 199,300 | 8,270,950 | ||
Noble Corp.* | 58,900 | 2,107,442 | ||
Schlumberger Ltd. | 105,000 | 5,745,600 | ||
| 20,304,792 | ||||
13
Table of Contents
Oil & Gas 1.4% | ||||
Burlington Resources, Inc. | 84,800 | 4,696,224 | ||
ConocoPhillips | 85,000 | 5,573,450 | ||
| 10,269,674 | ||||
Financials 7.2% | ||||
Banks 0.8% | ||||
Bank of America Corp. | 76,500 | 6,152,895 | ||
Capital Markets 0.5% | ||||
State Street Corp. | 74,200 | 3,864,336 | ||
Consumer Finance 1.2% | ||||
American Express Co. | 185,500 | 8,946,665 | ||
Diversified Financial Services 3.7% | ||||
Citigroup, Inc. | 202,966 | 9,851,970 | ||
Fannie Mae | 93,200 | 6,995,592 | ||
Goldman Sachs Group, Inc. | 23,700 | 2,339,901 | ||
Lehman Brothers Holdings, Inc. | 30,700 | 2,370,654 | ||
Morgan Stanley | 101,900 | 5,896,953 | ||
| 27,455,070 | ||||
Insurance 1.0% | ||||
AFLAC, Inc. | 33,200 | 1,201,176 | ||
American International Group, Inc. | 98,474 | 6,526,856 | ||
| 7,728,032 | ||||
Health Care 13.6% | ||||
Biotechnology 2.5% | ||||
Amgen, Inc.* | 20,300 | 1,254,540 | ||
Genentech, Inc.* | 130,700 | 12,229,599 | ||
Gilead Sciences, Inc.* | 98,000 | 5,697,720 | ||
| 19,181,859 | ||||
Health Care Equipment & Supplies 2.9% | ||||
Baxter International, Inc. | 164,000 | 5,005,280 | ||
Boston Scientific Corp.* | 70,600 | 2,595,256 | ||
Medtronic, Inc. | 179,100 | 8,706,051 | ||
Zimmer Holdings, Inc.* | 75,900 | 5,343,360 | ||
| 21,649,947 | ||||
Health Care Providers & Services 1.1% | ||||
UnitedHealth Group, Inc. | 135,800 | 7,900,844 | ||
Pharmaceuticals 7.1% | ||||
Abbott Laboratories | 219,300 | 10,219,380 | ||
Eli Lilly & Co. | 121,900 | 8,573,227 | ||
Johnson & Johnson | 268,154 | 13,852,836 | ||
Merck & Co., Inc. | 89,300 | 4,125,660 | ||
Pfizer, Inc. | 466,500 | 16,481,445 | ||
| 53,252,548 | ||||
Industrials 4.8% | ||||
Aerospace & Defense 1.6% | ||||
United Technologies Corp. | 126,100 | 11,950,497 | ||
14
Table of Contents
Air Freight & Logistics 0.6% | ||||
FedEx Corp. | 66,300 | 4,475,250 | ||
Industrial Conglomerates 2.6% | ||||
3M Co. | 52,000 | 4,421,560 | ||
General Electric Co. | 489,700 | 15,170,906 | ||
| 19,592,466 | ||||
Information Technology 16.4% | ||||
Communications Equipment 1.9% | ||||
Cisco Systems, Inc.* | 591,400 | 14,365,106 | ||
Computers & Peripherals 2.9% | ||||
Dell, Inc.* | 75,300 | 2,557,188 | ||
EMC Corp.* | 599,800 | 7,749,416 | ||
International Business Machines Corp. | 124,100 | 11,501,588 | ||
| 21,808,192 | ||||
IT Consulting & Services 0.7% | ||||
Fiserv, Inc.* | 130,200 | 5,144,202 | ||
Semiconductor & Semiconductor Equipment 6.0% | ||||
Applied Materials, Inc.* | 473,800 | 10,636,810 | ||
Intel Corp. | 594,000 | 19,126,800 | ||
Linear Technology Corp. | 141,300 | 5,944,491 | ||
Texas Instruments, Inc. | 330,700 | 9,715,966 | ||
| 45,424,067 | ||||
Software 4.9% | ||||
BEA Systems, Inc.* | 84,100 | 1,034,430 | ||
Electronic Arts, Inc.* | 128,400 | 6,134,952 | ||
Microsoft Corp. | 711,000 | 19,580,940 | ||
Oracle Corp.* | 298,500 | 3,940,200 | ||
Symantec Corp.* | 69,200 | 2,397,780 | ||
VERITAS Software Corp.* | 94,500 | 3,511,620 | ||
| 36,599,922 | ||||
Materials 0.5% | ||||
Chemicals 0.5% | ||||
Ecolab, Inc. | 132,600 | 3,629,262 | ||
Telecommunication Services 0.8% | ||||
Diversified Telecommunication Services 0.4% | ||||
Verizon Communications, Inc. | 83,600 | 2,932,688 | ||
Wireless Telecommunication Services 0.4% | ||||
AT&T Wireless Services, Inc.* | 338,000 | 2,700,620 | ||
Total Common Stocks (Cost $392,398,212) | 474,243,202 | |||
15
Table of Contents
| Principal Amount ($) | Value ($) | |||
Corporate Bonds 7.5% | ||||
Consumer Discretionary 0.7% | ||||
Comcast Cable Communications: | ||||
6.375%, 1/30/2006 | 900,000 | 968,893 | ||
6.875%, 6/15/2009 | 930,000 | 1,048,423 | ||
8.375%, 5/1/2007 | 1,049,000 | 1,216,189 | ||
Comcast Corp., 7.05%, 3/15/2033 | 1,020,000 | 1,109,569 | ||
General Motors Corp., 8.25%, 7/15/2023 | 380,000 | 431,455 | ||
Liberty Media Corp., Series A, 3.5%, 9/25/2006 | 850,000 | 854,248 | ||
| 5,628,777 | ||||
Energy 0.3% | ||||
Pedernales Electric Cooperative, Series 02-A, 144A, 6.202%, 11/15/2032 | 2,255,000 | 2,319,155 | ||
Financials 4.3% | ||||
American General: | ||||
144A, 7.57%, 12/1/2045 | 675,000 | 802,970 | ||
144A, 8.125%, 3/15/2046 | 1,235,000 | 1,574,992 | ||
ASIF Global Finance, 144A, 4.9%, 1/17/2013 | 1,510,000 | 1,500,747 | ||
Citigroup, Inc., 6.0%, 10/31/2033 | 770,000 | 769,921 | ||
Ford Motor Credit Co.: | ||||
5.8%, 1/12/2009 | 1,095,000 | 1,127,689 | ||
6.875%, 2/1/2006 | 1,292,000 | 1,378,962 | ||
7.5%, 3/15/2005 | 555,000 | 585,754 | ||
General Motors Acceptance Corp.: | ||||
4.5%, 7/15/2006 | 2,725,000 | 2,803,379 | ||
6.875%, 9/15/2011 | 85,000 | 91,556 | ||
Household Finance Corp., 6.5%, 1/24/2006 | 1,960,000 | 2,119,693 | ||
Mantis Reef Ltd., 144A, 4.692%, 11/14/2008 | 3,135,000 | 3,150,637 | ||
Nationwide Building Society, 144A, 5.25%, 1/15/2014 | 1,965,000 | 1,982,811 | ||
OneAmerica Financial Partners, 144A, 7.0%, 10/15/2033 | 1,050,000 | 1,039,437 | ||
Pemex Project Funding Master Trust, 8.5%, 2/15/2008 | 1,425,000 | 1,624,500 | ||
PLC Trust, 144A, 2.709%, 3/31/2006 | 1,850,000 | 1,850,000 | ||
PNC Funding Corp., 5.75%, 8/1/2006 | 1,720,000 | 1,846,607 | ||
SLM Corp., 5.0%, 10/1/2013 | 2,760,000 | 2,742,422 | ||
Verizon Global Funding Corp.: | ||||
7.25%, 12/1/2010 | 1,800,000 | 2,072,497 | ||
7.75%, 12/1/2030 | 620,000 | 728,320 | ||
Wachovia Corp., 7.5%, 7/15/2006 | 305,000 | 344,053 | ||
Westpac Capital Trust III, 144A, 5.819%, 12/29/2049 | 1,935,000 | 1,997,055 | ||
| 32,134,002 | ||||
Industrials 0.2% | ||||
BAE System 2001 Asset Trust, “B”, Series B 2001, 144A, 7.156%, 12/15/2011 | 278,664 | �� | 304,173 | |
Systems 2001 Asset Trust LLC, “G”, Series 2001, 144A, 6.664%, 9/15/2013 | 942,899 | 1,042,091 | ||
| 1,346,264 | ||||
Materials 0.1% | ||||
Weyerhaeuser Co., 7.375%, 3/15/2032 | 835,000 | 907,897 | ||
Telecommunication Services 0.1% | ||||
PCCW Capital Ltd., 144A, 6.0%, 7/15/2013 | 625,000 | 638,024 | ||
16
Table of Contents
Utilities 1.8% | ||||
AEP Texas Central Co., 5.5%, 2/15/2013 | 957,000 | 980,354 | ||
Alabama Power Co., 7.125%, 8/15/2004 | 3,200,000 | 3,312,826 | ||
Centerior Energy Corp., Series B, 7.13%, 7/1/2007 | 1,985,000 | 2,230,660 | ||
Cleveland Electric Illuminating Co., 144A, 5.65%, 12/15/2013 | 1,080,000 | 1,063,034 | ||
Consumers Energy Co., 144A, 4.0%, 5/15/2010 | 1,820,000 | 1,761,043 | ||
Ohio Power Co., Series H, 144A, 4.85%, 1/15/2014 | 200,000 | 195,963 | ||
Pacificorp., 6.9%, 11/15/2011 | 670,000 | 771,416 | ||
Public Service Co. of Oklahoma, Series C, 4.85%, 9/15/2010 | 1,230,000 | 1,254,306 | ||
Xcel Energy, Inc., 7.0%, 12/1/2010 | 1,345,000 | 1,525,163 | ||
| 13,094,765 | ||||
Total Corporate Bonds (Cost $54,381,920) | 56,068,884 | |||
Asset Backed 4.0% | ||||
Automobile Receivables 2.6% | ||||
AmeriCredit Automobile Receivables Trust, “A4”, Series 2001-C, 5.01%, 7/14/2008 | 3,360,000 | 3,464,192 | ||
Bay View Auto Trust, “A4”, Series 2003-LJ1, 3.44%, 4/25/2012 | 2,600,000 | 2,615,205 | ||
Household Automotive Trust, “A4”, Series 2002-1, 4.39%, 5/18/2009 | 2,615,000 | 2,704,678 | ||
MMCA Automobile Trust: | ||||
“A4”, Series 2002-3, 3.57%, 8/17/2009 | 690,000 | 694,119 | ||
“B”, Series 2002-1, 5.37%, 1/15/2010 | 2,751,984 | 2,653,724 | ||
“C”, Series 2002-2, 5.55%, 3/15/2010 | 2,595,562 | 1,713,071 | ||
WFS Financial Owner Trust: | ||||
“A4”, Series 2003-3, 3.25%, 5/20/2011 | 2,740,000 | 2,752,206 | ||
“A4”, Series 2002-2, 4.5%, 2/20/2010 | 2,550,000 | 2,639,316 | ||
| 19,236,511 | ||||
Home Equity Loans 0.5% | ||||
Advanta Mortgage Loan Trust, “A6”, Series 2000-2, 7.72%, 3/25/2015 | 1,488,567 | 1,606,059 | ||
Centex Home Equity, “A6”, Series 2000-B, 7.97%, 7/25/2031 | 2,221,020 | 2,350,365 | ||
| 3,956,424 | ||||
Manufactured Housing Receivables 0.2% | ||||
Conseco Finance Securitizations Corp., “A4”, Series 2001-1, 6.21%, 7/1/2032 | 1,380,000 | 1,399,240 | ||
Miscellaneous 0.7% | ||||
Federal Home Loan Mortgage Corp., “3A”, Series T-41, 7.5%, 7/25/2032 | 1,073,338 | 1,175,305 | ||
PSE&G Transition Funding LLC, “A7”, Series 2001-1, 6.89%, 12/15/2017 | 975,000 | 1,129,052 | ||
US Airways Aircraft Certificate Owner Trust, “C”, Series 2003-1A, 144A, 5.551%, 9/20/2022 | 3,145,000 | 3,251,364 | ||
| 5,555,721 | ||||
Total Asset Backed (Cost $30,907,491) | 30,147,896 | |||
Foreign Bonds - US$ Denominated 2.8% | ||||
Alcan, Inc., 6.125%, 12/15/2033 | 1,880,000 | 1,891,453 | ||
Arcel Finance Ltd., 144A, 7.048%, 9/1/2011 | 870,000 | 896,100 | ||
Brazilian Merchant Voucher, 144A, 5.911%, 6/15/2011 | 1,000,000 | 975,000 | ||
France Telecom, 9.0%, 3/1/2011 | 900,000 | 1,080,974 | ||
Hutchison Whampoa International Ltd., 144A, 5.45%, 11/24/2010 | 1,355,000 | 1,374,386 | ||
Inversiones CMPC SA, 144A, 4.875%, 6/18/2013 | 1,785,000 | 1,716,294 | ||
17
Table of Contents
PacifiCorp Australia LLC, 144A, 6.15%, 1/15/2008 | 1,455,000 | 1,580,073 | ||
Petroleos Mexicanos S.A., 8.85%, 9/15/2007 | 1,295,000 | 1,498,962 | ||
QBE Insurance Group Ltd., 144A, 5.647%, 7/1/2023 | 1,255,000 | 1,196,009 | ||
Sappi Papier Holding AG, 144A, 6.75%, 6/15/2012 | 2,445,000 | 2,672,722 | ||
Sociedad Concesionaria Autopista Contral, 144A, 6.223%, 12/15/2026 | 2,250,000 | 2,255,535 | ||
Tyco International Group SA: | ||||
5.8%, 8/1/2006 | 1,520,000 | 1,607,400 | ||
144A, 6.0%, 11/15/2013 | 335,000 | 345,050 | ||
6.375%, 2/15/2006 | 1,395,000 | 1,485,675 | ||
United Mexican States, 7.5%, 4/8/2033 | 197,000 | 203,895 | ||
Total Foreign Bonds - US$ Denominated (Cost $20,682,388) | 20,779,528 | |||
US Government Backed 2.8% | ||||
US Treasury Bond, 6.0%, 2/15/2026 | 8,475,000 | 9,398,309 | ||
US Treasury Note: | ||||
1.625%, 4/30/2005 | 5,066,000 | 5,081,238 | ||
5.0%, 8/15/2011 | 5,569,000 | 5,959,699 | ||
6.125%, 8/15/2007 | 685,000 | 766,638 | ||
Total US Government Backed (Cost $20,838,638) | 21,205,884 | |||
US Government Agency Sponsored Pass-Thrus 6.2% | ||||
Federal Home Loan Mortgage Corp.: | ||||
2.875%, 12/15/2006 | 2,845,000 | 2,865,396 | ||
5.0% with various maturities from 1/15/2023 to 12/1/2029(b) | 3,820,000 | 3,753,225 | ||
6.5%, 10/1/2033 | 734,319 | 769,233 | ||
Federal National Mortgage Association: | ||||
4.0% with various maturities from 8/25/2009 to 5/25/2016 | 4,808,875 | 4,896,554 | ||
4.5%, 10/25/2015 | 2,020,000 | 2,070,522 | ||
5.0% with various maturities from 6/1/2018 to 8/1/2023 | 6,447,156 | 6,493,929 | ||
5.5% with various maturities from 8/25/2015 to 12/1/2028(b) | 12,260,720 | 12,496,409 | ||
5.946%, 2/1/2012 | 4,392,598 | 4,805,893 | ||
6.0%, 11/1/2017 | 1,246,833 | 1,310,258 | ||
6.003%, 12/1/2033 | 1,305,000 | 1,354,753 | ||
6.31%, 6/1/2008 | 3,570,000 | 3,910,760 | ||
6.5%, 6/1/2017 | 1,156,947 | 1,227,848 | ||
8.0%, 9/1/2015 | 554,614 | 595,004 | ||
| Total US Government Agency Sponsored Pass-Thrus (Cost $46,188,919) | 46,549,784 | |||
Collateralized Mortgage Obligations 7.6% | ||||
ABN AMRO Mortgage Corp., Series 2002-3, 6.0%, 4/25/2017 | 316,141 | 318,080 | ||
Federal Home Loan Mortgage Corp.: | ||||
“ME”, Series 2691, 4.5%, 4/15/2032 | 2,661,000 | 2,531,097 | ||
“HG”, Series 2543, 4.75%, 9/15/2028 | 2,008,829 | 2,041,177 | ||
“EU”, Series 2494, 5.0%, 4/15/2026 | 1,435,069 | 1,439,930 | ||
18
Table of Contents
“PE”, Series 2512, 5.5%, 2/15/2022 | 310,000 | 319,584 | ||
“PL”, Series 2459, 5.5%, 6/15/2030 | 160,298 | 160,703 | ||
“BD”, Series 2453, 6.0%, 5/15/2017 | 360,000 | 382,627 | ||
“DA”, Series 2444, 6.5%, 2/15/2030 | 141,182 | 142,032 | ||
Federal Home Loan Mortgage Corp. Structured Pass Through Securities: | ||||
“A2B”, Series T-56, 4.29%, 7/25/2036 | 2,660,000 | 2,719,168 | ||
“3A”, Series T-58, 7.0%, 9/25/2043 | 1,345,279 | 1,444,249 | ||
Federal National Mortgage Association: | ||||
“3A2B”, Series 2003-W10, Whole Loan, 3.056%, 7/25/2037 | 1,390,000 | 1,393,409 | ||
“PU”, Series 2003-33, 4.5%, 5/25/2033 | 2,079,803 | 2,127,638 | ||
“A2”, Series 2002-W9, 4.7%, 8/25/2042 | 811,641 | 817,954 | ||
“A2”, Series 2002-W10, 4.7%, 8/25/2042 | 855,000 | 870,929 | ||
“2A3”, Series 2003-W15, 4.71%, 8/25/2043 | 2,630,000 | 2,712,853 | ||
“1A3”, Series 2003-W18, 4.732%, 8/25/2033 | 1,350,000 | 1,392,312 | ||
“KH”, Series 2003-92, 5.0%, 3/25/2032 | 1,420,000 | 1,392,957 | ||
“PE”, Series 2002-3, 5.5%, 8/25/2015 | 5,050,000 | 5,241,641 | ||
“AN”, Series 2000-27, 6.0%, 8/25/2030 | 405,222 | 418,813 | ||
“B”, Series 1999-32, 6.0%, 7/25/2029 | 910,910 | 944,861 | ||
“PD”, Series 2002-31, 6.0%, 11/25/2021 | 7,000,000 | 7,379,070 | ||
“QN”, Series 2001-51, 6.0%, 10/25/2016 | 2,430,000 | 2,561,366 | ||
“VD”, Series 2002-56, 6.0%, 4/25/2020 | 561,436 | 576,429 | ||
“HM”, Series 2002-36, 6.5%, 12/25/2029 | 303,334 | 312,050 | ||
“1A2”, Series 2003-W3, 7.0%, 8/25/2042 | 1,122,497 | 1,211,245 | ||
“A5”, Series 2002-W4, 7.5%, 5/25/2042 | 1,070,031 | 1,168,339 | ||
“2A”, Series 2002-W6, 7.5%, 6/25/2042 | 2,841,864 | 3,102,961 | ||
Master Asset Securitization Trust: | ||||
“3A2”, Series 2003-2, 4.25%, 4/25/2033 | 2,476,155 | 2,446,857 | ||
Series 2003-6, 5.5%, 7/25/2033 | 2,084,801 | 2,130,656 | ||
Residential Accredit Loans, Inc., “A5”, Series 2002-QS14, 5.125%, 9/25/2032 | 2,231,085 | 2,260,741 | ||
Residential Asset Securitization Trust, “A4”, Series 2000-A3, 8.0%, 5/25/2030 | 106,192 | 106,155 | ||
Residential Funding Mortgage Security I, “A1”, Series 2003-S2, 5.0%, 2/25/2033 | 1,234,905 | 1,247,801 | ||
Structured Asset Securities Corp., “2A1”, Series 2003-1, 6.0%, 2/25/2018 | 1,094,200 | 1,128,907 | ||
Wells Fargo Mortgage Backed Securities Trust, “1A1”, Series 2003-6, 5.0%, 6/25/2018 | 2,596,675 | 2,651,800 | ||
Total Collateralized Mortgage Obligations (Cost $56,133,046) | 57,096,391 | |||
Municipal Investments 1.7% | ||||
Dallas, TX, Airport Revenue, Industrial Airport Facilities, 6.6%, 11/1/2012(c) | 1,635,000 | 1,814,556 | ||
Denver, CO, School District (REV) Lease, School District Number 01, 6.82%, 12/15/2009(c) | 1,600,000 | 1,834,240 | ||
Hoboken, NJ, Core City GO, Series B, 3.8%, 1/1/2008(c) | 1,895,000 | 1,935,496 | ||
Indiana, State GO, Series 3, 5.15%, 7/15/2013(c) | 2,005,000 | 2,041,210 | ||
Oregon, School District GO,Series A, Zero Coupon, 6/30/2014(c) | 6,855,000 | 3,936,141 | ||
Wisconsin, State GO, General Revenue, Series A, 5.7%, 5/1/2026(c) | 1,180,000 | 1,189,948 | ||
Total Municipal Investments (Cost $12,715,089) | 12,751,591 | |||
Government National Mortgage Association 0.2% | ||||
Government National Mortgage Association, 5.0%, 9/20/2033 (Cost $1,310,067) | 1,319,759 | 1,306,303 | ||
Cash Equivalents 4.0% | ||||
| Scudder Cash Management QP Trust, 1.11%(d) (Cost $29,962,581) | 29,962,581 | 29,962,581 | ||
Total Investment Portfolio - 100.0% (Cost $665,518,351)(a) | 750,112,044 | |||
| * | Non-income producing security. |
| (a) | The cost for federal income tax purposes was $679,090,275. At December 31, 2003, net unrealized appreciation for all securities based on tax cost was $71,021,769. This consisted of aggregate gross unrealized appreciation for all securities in which there was an excess of value over tax cost of $87,507,501 and aggregate gross unrealized depreciation for all securities in which there was an excess of tax cost over value of $16,485,732. |
| (b) | Mortgage dollar rolls included. |
| (c) | Bond is insured by one of these companies: |
AMBAC | AMBAC Assurance Corp. | |
FGIC | Financial Guaranty Insurance Company | |
MBIA | Municipal Bond Investors Assurance | |
FSA | Financial Security Assurance |
| (d) | Scudder Cash Management QP Trust is also managed by Deutsche Investment Management Americas Inc. The rate shown is the annualized seven-day yield at period end. |
Included in the portfolio are investments in mortgage-or asset-backed securities which are interests in separate pools of mortgages or assets. Effective maturities of these investments may be shorter than stated maturities due to prepayments. Some separate investments in the Federal National Mortgage Association issues which have similar coupon rates have been aggregated for presentation purposes in the investment portfolio.
144A: Security exempt from registration under Rule 144A of the Securities Act of 1933. These securities may be resold in transactions exempt from registration, normally to qualified institutional buyers.
The accompanying notes are an integral part of the financial statements.
19
Table of Contents
Statement of Assets and Liabilities as of December 31, 2003
Assets | ||||
Investments: | ||||
Investments in securities, at value (cost $635,555,770) | $ | 720,149,463 | ||
Investment in Scudder Cash Management QP Trust (cost $29,962,581) | 29,962,581 | |||
Total investment in securities, at value (cost $665,518,351) | 750,112,044 | |||
Cash | 1,108,692 | |||
Receivable for investments sold | 5,043,936 | |||
Dividends receivable | 401,835 | |||
Interest receivable | 2,198,568 | |||
Receivable for Fund shares sold | 334,137 | |||
Total assets | 759,199,212 | |||
Liabilities | ||||
Payable for investments purchased | 5,710,360 | |||
Payable for investments purchased - mortgage dollar rolls | 3,779,968 | |||
Payable for Fund shares redeemed | 12,775,028 | |||
Deferred mortgage dollar roll income | 11,623 | |||
Accrued management fee | 296,025 | |||
Other accrued expenses and payables | 278,308 | |||
Total liabilities | 22,851,312 | |||
Net assets, at value | $ | 736,347,900 | ||
Net Assets | ||||
Net assets consist of: | ||||
Undistributed net investment income | $ | 611,430 | ||
Net unrealized appreciation (depreciation) on investments | 84,593,693 | |||
Accumulated net realized gain (loss) | (138,521,852 | ) | ||
Paid-in capital | 789,664,629 | |||
Net assets, at value | $ | 736,347,900 | ||
Net Asset Value | ||||
Class AARP | ||||
Net Asset Value, offering and redemption price per share ($332,491,356 / 19,849,812 outstanding shares of beneficial interest, $.01 par value, unlimited number of shares authorized) | $16.75 | |||
Class S | ||||
Net Asset Value, offering and redemption price per share ($403,856,544 / 24,126,140 outstanding shares of beneficial interest, $.01 par value, unlimited number of shares authorized) | $16.74 |
The accompanying notes are an integral part of the financial statements.
20
Table of Contents
Statement of Operations for the year ended December 31, 2003
Investment Income | ||||
Income: | ||||
Dividends | $ | 4,873,414 | ||
Interest | 10,961,525 | |||
Interest - Scudder Cash Management QP Trust | 276,953 | |||
Total Income | 16,111,892 | |||
Expenses: | ||||
Management fee | 3,285,039 | |||
Administrative fee | 3,111,025 | |||
Trustees’ fees and expenses | 22,805 | |||
Other | 13,593 | |||
Total expenses, before expense reductions | 6,432,462 | |||
Expense reductions | (718 | ) | ||
Total expenses, after expense reductions | 6,431,744 | |||
Net investment income | 9,680,148 | |||
Realized and Unrealized Gain (Loss) on Investment Transactions | ||||
Net realized gain (loss) from investments | (16,796,639 | ) | ||
Net unrealized appreciation (depreciation) during the period on investments | 119,264,366 | |||
Net gain (loss) on investment transactions | 102,467,727 | |||
Net increase (decrease) in net assets resulting from operations | $ | 112,147,875 | ||
The accompanying notes are an integral part of the financial statements.
21
Table of Contents
Statement of Changes in Net Assets
| Years Ended December 31, | ||||||||
| 2003 | 2002 | |||||||
Increase (Decrease) in Net Assets | ||||||||
Operations: | ||||||||
Net investment income | $ | 9,680,148 | $ | 15,937,103 | ||||
Net realized gain (loss) on investment transactions | (16,796,639 | ) | (35,891,437 | ) | ||||
Net unrealized appreciation (depreciation) on investment transactions during the period | 119,264,366 | (116,864,192 | ) | |||||
Net increase (decrease) in net assets resulting from operations | 112,147,875 | (136,818,526 | ) | |||||
Distributions to shareholders from: | ||||||||
Net investment income: | (4,884,205 | ) | (7,529,060 | ) | ||||
Class AARP | ||||||||
Class S | (6,129,360 | ) | (9,653,945 | ) | ||||
Fund share transactions: | ||||||||
Proceeds from shares sold | 114,307,281 | 115,448,730 | ||||||
Reinvestment of distributions | 10,387,000 | 16,227,895 | ||||||
Cost of shares redeemed | (170,703,039 | ) | (217,079,305 | ) | ||||
Net increase (decrease) in net assets from Fund share transactions | (46,008,758 | ) | (85,402,680 | ) | ||||
Increase (decrease) in net assets | 55,125,552 | (239,404,211 | ) | |||||
Net assets at beginning of period | 681,222,348 | 920,626,559 | ||||||
Net assets at end of period (including undistributed net investment of $611,430 at December 31, 2003) | $ | 736,347,900 | $ | 681,222,348 | ||||
The accompanying notes are an integral part of the financial statements.
22
Table of Contents
Class AARP
Years Ended December 31, | 2003 | 2002 | 2001d | 2000a | ||||||||||||
Selected Per Share Data | ||||||||||||||||
Net asset value, beginning of period | $ | 14.51 | $ | 17.48 | $ | 19.26 | $ | 21.46 | ||||||||
Income (loss) from investment operations: | ||||||||||||||||
Net investment incomeb | .21 | .31 | .41 | .18 | ||||||||||||
Net realized and unrealized gain (loss) on investment transactions | 2.28 | (2.94 | ) | (1.59 | ) | (1.42 | ) | |||||||||
Total from investment operations | 2.49 | (2.63 | ) | (1.18 | ) | (1.24 | ) | |||||||||
Less distributions from: | ||||||||||||||||
Net investment income | (.25 | ) | (.34 | ) | (.43 | ) | (.21 | ) | ||||||||
Net realized gains on investment transactions | — | — | (.17 | ) | (.75 | ) | ||||||||||
Total distributions | (.25 | ) | (.34 | ) | (.60 | ) | (.96 | ) | ||||||||
Net asset value, end of period | $ | 16.75 | $ | 14.51 | $ | 17.48 | $ | 19.26 | ||||||||
Total Return (%) | 17.26 | (15.18 | ) | (6.02 | ) | (5.80 | )** | |||||||||
Ratios to Average Net Assets and Supplemental Data | ||||||||||||||||
Net assets, end of period ($ millions) | 332 | 298 | 409 | 499 | ||||||||||||
Ratio of expenses (%) | .92 | .78 | .77 | .72c | * | |||||||||||
Ratio of net investment income (%) | 1.39 | 1.98 | 2.29 | 2.45 | * | |||||||||||
Portfolio turnover rate (%) | 103 | 150 | 112 | 131 | ||||||||||||
| a | For the period August 28, 2000 (commencement of sales of Class AARP shares) to December 31, 2000. |
| b | Based on average shares outstanding during the period. |
| c | The ratio of operating expenses includes a one-time reduction in reorganization expenses. The ratio without this reduction is .77%. |
| d | As required, effective January 1, 2001, the Fund has adopted the provisions of the AICPA Audit and Accounting Guide for Investment Companies and began amortizing premium on debt securities. In addition, paydowns on mortgage-backed securities which were included in realized gain/loss on investment transactions prior to January 1, 2001 are included as interest income. The effect of this change for the year ended December 31, 2001 was to decrease net investment income by $.01, increase net realized and unrealized gains and losses per share by $.01, and decrease the ratio of net investment income to average net assets from 2.37% to 2.29%. Per share data and ratios for periods prior to January 1, 2001 have not been restated to reflect this change in presentation. |
| * | Annualized |
| ** | Not annualized |
23
Table of Contents
Class S
Years Ended December 31, | 2003 | 2002 | 2001c | 2000 | 1999 | |||||||||||||||
Selected Per Share Data | ||||||||||||||||||||
Net asset value, beginning of period | $ | 14.50 | $ | 17.48 | $ | 19.25 | $ | 21.15 | $ | 18.96 | ||||||||||
Income (loss) from investment operations: | ||||||||||||||||||||
Net investment incomea | .21 | .31 | .41 | .38 | .33 | |||||||||||||||
Net realized and unrealized gain (loss) on investment transactions | 2.28 | (2.95 | ) | (1.58 | ) | (.87 | ) | 2.20 | ||||||||||||
Total from investment operations | 2.49 | (2.64 | ) | (1.17 | ) | (.49 | ) | 2.53 | ||||||||||||
Less distributions from: | ||||||||||||||||||||
Net investment income | (.25 | ) | (.34 | ) | (.43 | ) | (.37 | ) | (.32 | ) | ||||||||||
Net realized gains on investment transactions | — | — | (.17 | ) | (1.04 | ) | (.02 | ) | ||||||||||||
Total distributions | (.25 | ) | (.34 | ) | (.60 | ) | (1.41 | ) | (.34 | ) | ||||||||||
Net asset value, end of period | $ | 16.74 | $ | 14.50 | $ | 17.48 | $ | 19.25 | $ | 21.15 | ||||||||||
Total Return (%) | 17.19 | (15.13 | ) | (6.02 | ) | (2.42 | ) | 13.46 | ||||||||||||
Ratios to Average Net Assets and Supplemental Data | ||||||||||||||||||||
Net assets, end of period ($ millions) | 404 | 383 | 512 | 520 | 572 | |||||||||||||||
Ratio of expenses before expense reductions (%) | .92 | .78 | .77 | 1.17b | 1.29 | |||||||||||||||
Ratio of net investment income (%) | 1.39 | 1.98 | 2.29 | 1.85 | 1.69 | |||||||||||||||
Portfolio turnover rate (%) | 103 | 150 | 112 | 131 | 102 | |||||||||||||||
| a | Based on average shares outstanding during the period. |
| b | The ratios of operating expenses excluding costs incurred in connection with a fund complex reorganization before and after expense reductions were 1.14% and 1.14%, respectively. |
| c | As required, effective January 1, 2001, the Fund has adopted the provisions of the AICPA Audit and Accounting Guide for Investment Companies and began amortizing premium on debt securities. In addition, paydowns on mortgage-backed securities which were included in realized gain/loss on investment transactions prior to January 1, 2001 are included as interest income. The effect of this change for the year ended December 31, 2001 was to decrease net investment income by $.01, increase net realized and unrealized gains and losses per share by $.01, and decrease the ratio of net investment income to average net assets from 2.37% to 2.29%. Per share data and ratios for periods prior to January 1, 2001 have not been restated to reflect this change in presentation.. |
24
Table of Contents
A. Significant Accounting Policies
Scudder Balanced Fund (the “Fund”) is a diversified series of Scudder Portfolio Trust (the “Trust”) which is registered under the Investment Company Act of 1940, as amended (the “1940 Act”), as an open-end management investment company organized as a Massachusetts business trust.
The Fund offers two classes of shares. Shares of Class AARP are designed for members of AARP. Class S shares of the Fund are generally not available to new investors.
Investment income, realized and unrealized gains and losses, and certain fund-level expenses and expense reductions, if any, are borne pro rata on the basis of relative net assets by the holders of both classes of shares. All shares of the Fund have equal rights with respect to voting subject to class-specific arrangements.
The Fund’s financial statements are prepared in accordance with accounting principles generally accepted in the United States of America which require the use of management estimates. Actual results could differ from those estimates. The policies described below are followed consistently by the Fund in the preparation of its financial statements.
Security Valuation. Investments are stated at value determined as of the close of regular trading on the New York Stock Exchange on each day the exchange is open for trading. Equity securities are valued at the most recent sale price reported on the exchange (US or foreign) or over-the-counter market on which the security is traded most extensively. Securities for which no sales are reported are valued at the calculated mean between the most recent bid and asked quotations on the relevant market or, if a mean cannot be determined, at the most recent bid quotation.
Debt securities are valued by independent pricing services approved by the Trustees/Directors of the Fund. If the pricing services are unable to provide valuations, the securities are valued at the most recent bid quotation or evaluated price, as applicable, obtained from one or more broker-dealers. Such services may use various pricing techniques which take into account appropriate factors such as yield, quality, coupon rate, maturity, type of issue, trading characteristics and other data, as well as broker quotes.
Money market instruments purchased with an original or remaining maturity of sixty days or less, maturing at par, are valued at amortized cost. Investments in open-end investment companies and Scudder Cash Management QP Trust are valued at their net asset value each business day.
Securities and other assets for which market quotations are not readily available or for which the above valuation procedures are deemed not to reflect fair value are valued in a manner that is intended to reflect their fair value as determined in accordance with procedures approved by the Trustees/Directors.
Mortgage Dollar Rolls. The Fund may enter into mortgage dollar rolls in which the Fund sells mortgage-backed securities for delivery in the current month and simultaneously contracts to repurchase similar, but not identical, securities on a fixed date. The Fund receives compensation as consideration for entering into the commitment to repurchase. The compensation is paid in the form of a lower price for the security upon its repurchase or, alternatively, a fee. Mortgage dollar rolls may be renewed with a new sale and repurchase price and a cash settlement made at each renewal without physical delivery of the securities subject to the contract.
Certain risks may arise upon entering into mortgage dollar rolls from the potential inability of counterparties to meet the terms of their commitments. Additionally, the value of such securities may change adversely before the Fund is able to repurchase them.
When-Issued/Delayed Delivery Securities. The Fund may purchase securities with delivery or payment to occur at a later date beyond the normal settlement period. At the time the Fund enters into a commitment to purchase a security, the transaction is recorded and the value of the security is reflected in the net asset value. The price of such security and the date when the security will be delivered and paid for are fixed at the time the transaction is negotiated. The value of the security may vary with market fluctuations. No interest accrues to the Fund until payment takes place. At the time the Fund enters into this type of transaction it is required to segregate cash or other liquid assets at least equal to the amount of the commitment.
Certain risks may arise upon entering when-issued or delayed delivery securities from the potential inability of counterparties to meet the terms of their contracts or if the issuer does not issue the securities due to political, economic, or other factors. Additionally, losses may arise due to changes in the value of the underlying securities.
25
Table of Contents
Federal Income Taxes. The Fund’s policy is to comply with the requirements of the Internal Revenue Code, as amended, which are applicable to regulated investment companies and to distribute all of its taxable income to its shareholders. Accordingly, the Fund paid no federal income taxes and no federal income tax provision was required.
At December 31, 2003 the Fund had a net tax basis capital loss carryforward of approximately $124,897,000 which may be applied against any realized net taxable capital gains of each succeeding year until fully utilized or until December 31, 2009 ($76,067,000), December 31, 2010 ($261,000) and December 31, 2011 ($48,569,000), the respective expiration dates, whichever occurs first.
Distribution of Income and Gains. Distributions of net investment income, if any, are made quarterly. Net realized gains from investment transactions, in excess of available capital loss carryforwards, would be taxable to the Fund if not distributed, and, therefore, will be distributed to shareholders at least annually.
The timing and characterization of certain income and capital gains distributions are determined annually in accordance with federal tax regulations which may differ from accounting principles generally accepted in the United States of America. These differences primarily relate to premium amortization on debt securities and certain securities sold at a loss. As a result, net investment income (loss) and net realized gain (loss) on investment transactions for a reporting period may differ significantly from distributions during such period. Accordingly, the Fund may periodically make reclassifications among certain of its capital accounts without impacting the net asset value of the Fund.
At December 31, 2003, the Fund’s components of distributable earnings (accumulated losses) on a tax basis are as follows:
Undistributed ordinary income* | $ | 611,430 | ||
Undistributed net long-term capital gains | $ | — | ||
Capital loss carryforwards | $ | (124,897,000 | ) | |
Net unrealized appreciation (depreciation) on investments | $ | 71,021,769 |
In addition, the tax character of distributions paid to shareholders by the Fund are summarized as follows:
| Years Ended December 31, | ||||||
| 2003 | 2002 | |||||
Distributions from ordinary income* | $ | 11,013,565 | $ | 17,183,005 | ||
| * | For tax purposes short-term capital gains distributions are considered ordinary income distributions. |
Other. Investment transactions are accounted for on a trade date plus one basis for daily net asset value calculations. However, for financial reporting purposes, investment transactions are reported on trade date. Interest income is recorded on the accrual basis. Dividend income is recorded on the ex-dividend date net of foreign withholding taxes. Realized gains and losses from investment transactions are recorded on an identified cost basis. All premiums and discounts are amortized/accreted for financial reporting purposes.
B. Purchases and Sales of Securities
During the year ended December 31, 2003, purchases and sales of investment securities (excluding short-term investments, US Treasury Obligations and mortgage dollar rolls) aggregated $329,930,487 and $350,992,493 respectively. Purchases and sales of US Treasury Obligations aggregated $279,757,246 and $307,908,753, respectively. Purchases and sales of mortgage dollar rolls aggregated $97,799,585 and $97,492,886, respectively.
26
Table of Contents
C. Related Parties
Management Agreement. Under the Management Agreement with Deutsche Investment Management Inc. (“DeIM” or the “Advisor”), the Advisor directs the investments of the Fund in accordance with its investment objectives, policies and restrictions. The Advisor determines the securities, instruments and other contracts relating to investments to be purchased, sold or entered into by the Fund. In addition to portfolio management services, the Advisor provides certain administrative services in accordance with the Management Agreement. The management fee payable under the Management Agreement is equal to an annual rate of 0.47% of the first $1,500,000,000 of the Fund’s average daily net assets, 0.445% of the next $500,000,000 of such net assets and 0.42% of such net assets in excess of $2,000,000,000, computed and accrued daily and payable monthly. Accordingly, for the year ended December 31, 2003, the fee pursuant to the Management Agreement was equivalent to an annualized effective rate of 0.47% of the Fund’s average daily net assets.
Administrative Fee. Under the Administrative Agreement (the “Administrative Agreement”), the Advisor provides or pays others to provide substantially all of the administrative services required by each class of the Fund (other than those provided by the Advisor under its Management Agreement with the Fund, as described above) in exchange for the payment by each class of the Fund of an administrative services fee (the “Administrative Fee”).
Effective January 1, 2003, the Fund’s Trustees approved a new Administrative Fee rate of 0.445% of average daily net assets for each class, computed and accrued daily and payable monthly.
Various third-party service providers, some of which are affiliated with the Advisor, provide certain services to the Fund under the Administrative Agreement. Scudder Fund Accounting Corporation, a subsidiary of the Advisor, computes the net asset value for the Fund and maintains the accounting records of the Fund. Scudder Service Corporation, also a subsidiary of the Advisor, is the transfer, shareholder service and dividend-paying agent for the Fund. Scudder Trust Company, an affiliate of the Advisor, provides subaccounting and recordkeeping services for shareholders in certain retirement and employee benefit plans. These affiliated entities have in turn entered into various agreements with third-party service providers to provide these services. In addition, other service providers not affiliated with the Advisor provide certain services (i.e., custody, legal and audit) to the Fund under the Administrative Agreement. The Advisor pays the service providers for the provision of their services to the Fund and pays other Fund expenses, including insurance, registration, printing, postage and other costs. Certain expenses of the Fund will not be borne by the Advisor under the Administrative Agreement, such as taxes, brokerage, interest and extraordinary expenses, and the fees and expenses of the Independent Trustees (including the fees and expenses of their independent counsel). For the year ended December 31, 2003, the Administrative Fee was as follows:
Administrative Fee | Total Aggregated | Unpaid at December 31, 2003 | ||||
Class AARP | $ | 1,377,172 | $ | 122,991 | ||
Class S | 1,733,853 | 153,567 | ||||
| $ | 3,111,025 | $ | 276,558 | |||
27
Table of Contents
The Administrative Agreement between the Advisor and the Fund had been scheduled to terminate effective September 30, 2003. The Advisor and the Fund have agreed to temporarily continue the Administrative Agreement until March 31, 2004. Effective April 1, 2004, the Fund will directly bear the cost of expenses formerly covered under the Administrative Agreement. In addition, effective October 1, 2003 through September 30, 2005, the Advisor has agreed to contractually waive all or a portion of its management fee and reimburse or pay certain operating expenses of the Fund to the extent necessary to maintain the operating expenses of each class at 0.915% of average daily net assets for Class S and AARP shares, respectively (excluding certain expenses such as extraordinary expenses, taxes, brokerage, interest, Rule 12b-1 and/or service fees, trustees and trustee counsel fees).
Trustees’ Fees and Expenses. The Trust pays each Trustee not affiliated with the Advisor retainer fees plus specified amounts for attended board and committee meetings.
Scudder Cash Management QP Trust. Pursuant to an Exemptive Order issued by the SEC, the Fund may invest in the Scudder Cash Management QP Trust (the “QP Trust”) and other affiliated funds managed by the Advisor. The QP Trust seeks to provide as high a level of current income as is consistent with the preservation of capital and the maintenance of liquidity. The QP Trust does not pay the Advisor a management fee for the affiliated funds’ investments in the QP Trust.
Other Related Parties. AARP through its affiliates monitors and approves the AARP Investment Program from the Advisor. The Advisor has agreed to pay a fee to AARP and/or its affiliates in return for the use of the AARP trademark and services relating to investments by AARP members in Class AARP shares of the Fund. This fee is calculated on a daily basis as a percentage of the combined net assets of the AARP classes of all funds managed by the Advisor. The fee rates, which decrease as the aggregate net assets of the AARP classes become larger, are as follows: 0.07% for the first $6,000,000,000 of net assets, 0.06% for the next $10,000,000,000 of such net assets and 0.05% of such net assets thereafter. These amounts are used for the general purposes of AARP and its members.
D. Expense Off-Set Arrangement
The Fund has entered into an arrangement with its custodian whereby credits realized as a result of uninvested cash balances were used to reduce a portion of the Fund’s custodian expenses. For the year ended December 31, 2003, pursuant to the Administrative Agreement, the Administrative Fee was reduced by $718 for custodian credits earned.
E. Line of Credit
The Fund and several other affiliated Funds (the “Participants”) share in a $1.25 billion revolving credit facility administered by J.P. Morgan Chase Bank for temporary or emergency purposes, including the meeting of redemption requests that otherwise might require the untimely disposition of securities. The Participants are charged an annual commitment fee which is allocated, pro rata based upon net assets, among each of the Participants. Interest is calculated at the Federal Funds Rate plus 0.5 percent. The Fund may borrow up to a maximum of 33 percent of its net assets under the agreement.
28
Table of Contents
F. Share Transactions
The following table summarizes share and dollar activity in the Fund:
| Year Ended December 31, 2003 | Year Ended December 31, 2002 | |||||||||||||
| Shares | Dollars | Shares | Dollars | |||||||||||
Shares sold | ||||||||||||||
Class AARP | 1,750,855 | $ | 27,620,758 | 1,072,375 | $ | 17,376,406 | ||||||||
Class S | 5,717,330 | 86,686,523 | 5,919,866 | 98,072,324 | ||||||||||
| $ | 114,307,281 | $ | 115,448,730 | |||||||||||
Shares issued to shareholders in reinvestment of distributions | ||||||||||||||
Class AARP | 278,776 | $ | 4,362,324 | 434,313 | $ | 6,727,902 | ||||||||
Class S | 385,324 | 6,024,676 | 614,246 | 9,499,993 | ||||||||||
| $ | 10,387,000 | $ | 16,227,895 | |||||||||||
Shares redeemed | ||||||||||||||
Class AARP | (2,747,069 | ) | $ | (42,331,462 | ) | (4,333,666 | ) | $ | (67,639,147 | ) | ||||
Class S | (8,372,675 | ) | (128,371,577 | ) | (9,408,631 | ) | (149,440,158 | ) | ||||||
| $ | (170,703,039 | ) | $ | (217,079,305 | ) | |||||||||
Net increase (decrease) | ||||||||||||||
Class AARP | (717,438 | ) | $ | (10,348,380 | ) | (2,826,978 | ) | $ | (43,534,839 | ) | ||||
Class S | (2,270,021 | ) | (35,660,378 | ) | (2,874,519 | ) | (41,867,841 | ) | ||||||
| $ | (46,008,758 | ) | $ | (85,402,680 | ) | |||||||||
G. Ownership of the Fund
At December 31, 2003, one shareholder held approximately 36% of the outstanding shares of the Fund.
29
Table of Contents
Report of Independent Auditors
To the Trustees of Scudder Portfolio Trust and the Shareholders of Scudder Balanced Fund:
In our opinion, the accompanying statement of assets and liabilities, including the investment portfolio, and the related statements of operations and of changes in net assets and the financial highlights present fairly, in all material respects, the financial position of Scudder Balanced Fund (the “Fund”) at December 31, 2003, and the results of its operations, the changes in its net assets and the financial highlights for each of the periods indicated therein, in conformity with accounting principles generally accepted in the United States of America. These financial statements and financial highlights (hereafter referred to as “financial statements”) are the responsibility of the Fund’s management; our responsibility is to express an opinion on these financial statements based on our audits. We conducted our audits of these financial statements in accordance with auditing standards generally accepted in the United States of America, which require that we plan and perform the audit to obtain reasonable assurance about whether the financial statements are free of material misstatement. An audit includes examining, on a test basis, evidence supporting the amounts and disclosures in the financial statements, assessing the accounting principles used and significant estimates made by management, and evaluating the overall financial statement presentation. We believe that our audits, which included confirmation of securities at December 31, 2003 by correspondence with the custodian and brokers, provide a reasonable basis for our opinion.
Boston, Massachusetts PricewaterhouseCoopers LLP
February 27, 2004
For Federal Income tax purposes, the Fund designates $4,900,000, or the maximum amount under tax law, as qualified divided income.
Please consult a tax advisor if you have questions about federal or state income tax laws, or on how to prepare your tax returns. If you have specific questions about your account, please call 1-800-SCUDDER.
The following table presents certain information regarding the Trustees and Officers of the fund as of December 31, 2003. Each individual’s age is set forth in parentheses after his or her name. Unless otherwise noted, (i) each individual has engaged in the principal occupation(s) noted in the table for at least the most recent five years, although not necessarily in the same capacity, and (ii) the address of each Trustee is c/o Dawn-Marie Driscoll, PO Box 100176, Cape Coral, FL 33910. Unless otherwise indicated, the address of each officer is Two International Place, Boston, Massachusetts 02110-4103. Each Trustee’s term of office extends until the next shareholder’s meeting called for the purpose of electing Trustees and until the election and qualification of a successor, or until such Trustee sooner dies, resigns or is removed as provided in the governing documents of the fund.
Independent Trustees
Name, Age, Position(s) Held with the Fund and | Principal Occupation(s) During Past 5 Years and Other Directorships Held | Number of Funds in Fund Complex Overseen | ||
| Henry P. Becton, Jr. (60)Trustee, 1990-present | President, WGBH Educational Foundation. Directorships: Becton Dickinson and Company (medical technology company); The A.H. Belo Company (media company); Concord Academy; Boston Museum of Science; Public Radio International. Former Directorships: American Public Television; New England Aquarium; Mass Corporation for Educational Telecommunications; Committee for Economic Development; Public Broadcasting Service | 48 | ||
| Dawn-Marie Driscoll (57)Trustee, 1987-present | President, Driscoll Associates (consulting firm); Executive Fellow, Center for Business Ethics, Bentley College; formerly, Partner, Palmer & Dodge (1988-1990); Vice President of Corporate Affairs and General Counsel, Filene’s (1978-1988). Directorships: CRS Technology (technology service company); Advisory Board, Center for Business Ethics, Bentley College; Board of Governors, Investment Company Institute; former Chairman, ICI Directors Services Committee | 48 | ||
| Keith R. Fox (49)Trustee, 1996-present | Managing Partner, Exeter Capital Partners (private equity funds). Directorships: Facts on File (school and library publisher); Progressive Holding Corporation (kitchen importer and distributor); Cloverleaf Transportation Inc. (trucking); K-Media, Inc. (broadcasting); Natural History, Inc. (magazine publisher); National Association of Small Business Investment Companies (trade association) | 48 | ||
| Louis E. Levy (71)Trustee, 2002-present | Retired. Formerly, Chairman of the Quality Control Inquiry Committee, American Institute of Certified Public Accountants (1992-1998); Partner, KPMG LLP (1958-1990). Directorships: Household International (banking and finance); ISI Family of Funds (registered investment companies; 4 funds overseen) | 48 | ||
| Jean Gleason Stromberg (60)Trustee, 1999-present | Retired. Formerly, Consultant (1997-2001); Director, US General Accounting Office (1996-1997); Partner, Fulbright & Jaworski, L.L.P. (law firm) (1978-1996). Directorships: The William and Flora Hewlett Foundation; Service Source, Inc. | 48 | ||
| Jean C. Tempel (60)Trustee, 1994-present | Managing Partner, First Light Capital (venture capital group) (2000-present); formerly, Special Limited Partner, TL Ventures (venture capital fund) (1996-1998); General Partner, TL Ventures (1994-1996); President and Chief Operating Officer, Safeguard Scientifics, Inc. (public technology business incubator company) (1991-1993). Directorships: Sonesta International Hotels, Inc.; Aberdeen Group (technology research); United Way of Mass Bay; The Commonwealth Institute (supports women entrepreneurs). Trusteeships: Connecticut College, Vice Chair of Board, Chair, Finance Committee; Northeastern University, Vice Chair of Finance Committee, Chair, Funds and Endowment Committee | 48 | ||
| Carl W. Vogt (67) Trustee, 2002-present | Senior Partner, Fulbright & Jaworski, L.L.P. (law firm); formerly, President (interim) of Williams College (1999-2000); President, certain funds in the Deutsche Asset Management Family of Funds (formerly, Flag Investors Family of Funds) (registered investment companies) (1999-2000). Directorships: Yellow Corporation (trucking); American Science & Engineering (x-ray detection equipment); ISI Family of Funds (registered investment companies, 4 funds overseen); National Railroad Passenger Corporation (Amtrak); formerly, Chairman and Member, National Transportation Safety Board | 48 | ||
30
Table of Contents
Interested Trustees and Officers2
Name, Age, Position(s) Held with the Fund and | Principal Occupation(s) During Past 5 Years and Other Directorships Held | Number of Funds in Fund Complex Overseen | ||
| Richard T. Hale3 (58)Chairman and Trustee, 2002-presentChief Executive Officer, 2003-present | Managing Director, Deutsche Investment Management Americas Inc. (2003-present); Managing Director, Deutsche Bank Securities Inc. (formerly Deutsche Banc Alex. Brown Inc.) and Deutsche Asset Management (1999 to present); Director and President, Investment Company Capital Corp. (registered investment advisor) (1996 to present); Director, Deutsche Global Funds, Ltd. (2000 to present), CABEI Fund (2000 to present), North American Income Fund (2000 to present) (registered investment companies); Director, Scudder Global Opportunities Fund (since 2003); Director/Officer Deutsche/Scudder Mutual Funds (various dates); President, Montgomery Street Income Securities, Inc. (2002 to present) (registered investment companies); Vice President, Deutsche Asset Management, Inc. (2000 to present); formerly, Director, ISI Family of Funds (registered investment companies; 4 funds overseen) (1992-1999) | 201 | ||
| Brenda Lyons (40)President, 2003-present | Managing Director, Deutsche Asset Management | n/a | ||
| Daniel O. Hirsch3 (49)Vice President and Assistant Secretary, 2002-present5 | Managing Director, Deutsche Asset Management (2002-present) and Director, Deutsche Global Funds Ltd. (2002-present); formerly, Director, Deutsche Asset Management (1999-2002); Principal, BT Alex. Brown Incorporated (now Deutsche Bank Securities Inc.) (1998-1999); Assistant General Counsel, United States Securities and Exchange Commission (1993-1998) | n/a | ||
| John Millette (41)Vice President and Secretary, 1999-present | Director, Deutsche Asset Management | n/a | ||
| Kenneth Murphy (40)Vice President, 2002-present | Vice President, Deutsche Asset Management (2000-present); Vice President, Scudder Distributors, Inc. (December 2002-present); formerly, Director, John Hancock Signature Services (1992-2000) | n/a | ||
| Charles A. Rizzo (46)Treasurer and Chief Financial Officer, 2002-present | Director, Deutsche Asset Management (April 2000-present). Formerly, Vice President and Department Head, BT Alex. Brown Incorporated (now Deutsche Bank Securities Inc.) (1998-1999); Senior Manager, Coopers & Lybrand L.L.P. (now PricewaterhouseCoopers LLP) (1993-1998) | n/a | ||
| Salvatore Schiavone (38)Assistant Treasurer, 2003-present | Director, Deutsche Asset Management | n/a | ||
| Lucinda H. Stebbins (58)Assistant Treasurer, 2003-present | Director, Deutsche Asset Management | n/a | ||
| Kathleen Sullivan D’Eramo (46)Assistant Treasurer, 2003-present | Director, Deutsche Asset Management | n/a | ||
| Lisa Hertz4 (33)Assistant Secretary, 2003-present | Assistant Vice President, Deutsche Asset Management | n/a | ||
| Caroline Pearson (41)Assistant Secretary, 1997-present | Managing Director, Deutsche Asset Management | n/a | ||
| 1 | Length of time served represents the date that each Trustee was first elected to the common board of Trustees which oversees a number of investment companies, including the fund, managed by the Advisor. For the Officers of the fund, length of time served represents the date that each Officer was first elected to serve as an officer of any fund overseen by the aforementioned common board of trustees. |
| 2 | As a result of their respective positions held with the Advisor, these individuals are considered “interested persons” of the Advisor within the meaning of the 1940 Act. Interested persons receive no compensation from the fund. |
| 3 | Address: One South Street, Baltimore, Maryland |
| 4 | Address: 345 Park Avenue, New York, New York |
| 5 | Effective January 16, 2004, Mr. Hirsch is no longer Vice President of the fund. |
The fund’s Statement of Additional Information (“SAI”) includes additional information about the Trustees. The SAI is available, without charge, upon request. If you would like to request a copy of the SAI, you may do so by calling the following toll-free number: 1-800-SCUDDER.
31
Table of Contents
| AARP Investment Program Shareholders | Scudder Class S Shareholders | |||
| Automated Information Lines | Easy-Access Line (800) 631-4636 | SAIL™ (800) 343-2890 | ||
| Personalized account information, the ability to exchange or redeem shares, and information on other Scudder funds and services via touchtone telephone. | ||||
| Web Sites | aarp.scudder.com | myScudder.com | ||
| View your account transactions and balances, trade shares, monitor your asset allocation, and change your address, 24 hours a day. Obtain prospectuses and applications, blank forms, interactive worksheets, news about Scudder funds, subscription to fund updates by e-mail, retirement planning information, and more. | ||||
| For More Information | (800) 253-2277 To speak with an AARP Investment Program service representative | (800) SCUDDER
To speak with a Scudder service representative. | ||
| Written Correspondence | AARP Investment Program from Scudder Investments
PO Box 219735 Kansas City, MO 64121-9735 | Scudder Investments
PO Box 219669 Kansas City, MO 64121-9669 | ||
| Proxy Voting | A description of the fund’s policies and procedures for voting proxies for portfolio securities can be found on our Web sites-aarp.scudder.com or myScudder.com (type “proxy voting” in the search field)-or on the SEC’s Web site-www.sec.gov. To obtain a written copy without charge, call your service representative. | |||
| Principal Underwriter | If you have questions, comments or complaints, contact:
Scudder Distributors, Inc.
222 South Riverside Plaza Chicago, IL 60606-5808 (800) 621-1148 | |||
| Class AARP | Class S | |||
| Nasdaq Symbol | ABLNX | SCBAX | ||
| Fund Number | 162 | 062 | ||
Notes |
Notes |
Notes |
Notes |
32
Table of Contents
SIGNATURES
Pursuant to the requirements of the Securities Exchange Act of 1934 and the Investment Company Act of 1940, the registrant has duly caused this report to be signed on its behalf by the undersigned, thereunto duly authorized.
| Registrant: | Scudder Balanced Fund | |||
| By: | /s/Richard T. Hale | |||
Richard T. Hale | ||||
Chief Executive Officer | ||||
| Date: | February 27, 2004 | |||
Pursuant to the requirements of the Securities Exchange Act of 1934 and the Investment Company Act of 1940, this report has been signed below by the following persons on behalf of the registrant and in the capacities and on the dates indicated.
Registrant: | Scudder Balanced Fund | |||
By: | /s/Richard T. Hale | |||
Richard T. Hale | ||||
Chief Executive Officer | ||||
Date: | February 27, 2004 | |||
By: | /s/Charles A. Rizzo | |||
Charles A. Rizzo | ||||
Chief Financial Officer | ||||
Date: | February 27, 2004 | |||
33
Table of Contents
[GRAPHIC APPEARS HERE]
Scudder Balanced Fund
Semiannual Report to Shareholders
June 30, 2004
Table of Contents
| Contents | ||
| 3 | ||
| 5 | ||
| 9 | ||
| 11 | ||
| 19 | ||
| 22 | ||
| 24 | ||
| 30 | ||
| 30 | ||
This report must be preceded or accompanied by a prospectus. To obtain a prospectus for any of our funds, refer to the Account Management Resources information provided in the back of this booklet. We advise you to consider the fund’s objectives, risks, charges and expenses carefully before investing. The prospectus contains this and other important information about the fund. Please read the prospectus carefully before you invest.
Investments in mutual funds involve risk. Some funds have more risk than others. The fund is subject to stock market risk, meaning stocks in the fund may decline in value for extended periods of time due to the activities and financial prospects of individual companies, or due to general market and economic conditions. Additionally, the fund invests in individual bonds whose yields and market values fluctuate so that your investment may be worth more or less than its original cost. Please read this fund’s prospectus for specific details regarding its investments and risk profile.
Scudder Investments is part of Deutsche Asset Management, which is the marketing name in the US for the asset management activities of Deutsche Bank AG, Deutsche Investment Management Americas Inc., Deutsche Asset Management Inc., Deutsche Asset Management Investment Services Ltd., Deutsche Bank Trust Company Americas and Scudder Trust Company.
Fund shares are not FDIC-insured and are not deposits or other obligations of, or guaranteed by, any bank. Fund shares involve investment risk, including possible loss of principal.
Table of Contents
Performance Summary June 30, 2004
All performance shown is historical, assumes reinvestment of all dividends and capital gains, and does not guarantee future results. Investment return and principal value fluctuate with changing market conditions so that, when redeemed, shares may be worth more or less than their original cost. Current performance may be lower or higher than the performance quoted. Please visit aarp.scudder.com (Class AARP) or myScudder.com (Class S) for the product’s most recent month-end performance.
Returns and rankings for the 10-year period shown reflect a fee waiver and/or expense reimbursement. Without the waiver/reimbursement, returns and rankings would have been lower.
Returns shown for Class AARP for periods prior to its inception on August 28, 2000 are derived from historical performance of Class S of Scudder Balanced Fund during such periods and have assumed the same expense structure during such periods. Any difference in expenses will affect performance.
Average Annual Total Returns (Unadjusted for Sales Charge) as of 6/30/04
Scudder Balanced Fund | 6-Month++ | 1-Year | 3-Year | 5-Year | 10-Year | ||||||||||
Class S | 2.16 | % | 10.22 | % | -.46 | % | .14 | % | 8.64 | % | |||||
Class AARP | 2.34 | % | 10.41 | % | -.40 | % | .18 | % | 8.66 | % | |||||
S&P 500 Index+ | 3.44 | % | 19.11 | % | -.70 | % | -2.20 | % | 11.83 | % | |||||
Lehman Brothers Aggregate Bond Index++ | .15 | % | .32 | % | 6.36 | % | 6.95 | % | 7.39 | % | |||||
Russell 1000 Growth Index+++ | 2.74 | % | 17.88 | % | -3.74 | % | -6.48 | % | 10.11 | % |
Sources: Lipper Inc. and Deutsche Investment Management Americas Inc.
| ++ | Total returns shown for periods less than one year are not annualized. |
Net Asset Value and Distribution Information
| Class AARP | Class S | |||||
Net Asset Value: | ||||||
6/30/04 | $ | 16.98 | $ | 16.97 | ||
12/31/03 | $ | 16.75 | $ | 16.74 | ||
Distribution Information: | ||||||
Six Months: | ||||||
Income Dividends as of 6/30/04 | $ | .14 | $ | .14 | ||
Class S Lipper Rankings - Balanced Funds Category as of 6/30/04
Period | Rank | Number of Funds Tracked | Percentile Ranking | |||||
1-Year | 347 | of | 527 | 66 | ||||
3-Year | 357 | of | 435 | 82 | ||||
5-Year | 266 | of | 363 | 73 | ||||
10-Year | 61 | of | 136 | 45 |
Source: Lipper Inc. Rankings are historical and do not guarantee future results. Rankings are based on total return with distributions reinvested. Rankings are for Class S; other share classes may vary.
3
Table of Contents
Growth of an Assumed $10,000 Investment
¨ Scudder Balanced Fund - Class S
¨ S&P 500 Index+
¨ Lehman Brothers Aggregate Bond Index++
¨ Russell 1000 Growth Index+++
[GRAPHIC APPEARS HERE]
Yearly periods ended June 30
The growth of $10,000 is cumulative.
Comparative Results as of 6/30/04
Scudder Balanced Fund | 1-Year | 3-Year | 5-Year | 10-Year | ||||||||||||||
Class S | Growth of $10,000 | $ | 11,022 | $ | 9,864 | $ | 10,069 | $ | 22,907 | |||||||||
| Average annual total return | 10.22 | % | -.46 | % | .14 | % | 8.64 | % | ||||||||||
Class AARP | Growth of $10,000 | $ | 11,041 | $ | 9,881 | $ | 10,090 | $ | 22,956 | |||||||||
| Average annual total return | 10.41 | % | -.40 | % | .18 | % | 8.66 | % | ||||||||||
S&P 500 Index+ | Growth of $10,000 | $ | 11,911 | $ | 9,793 | $ | 8,945 | $ | 30,585 | |||||||||
| Average annual total return | 19.11 | % | -.70 | % | -2.20 | % | 11.83 | % | ||||||||||
Lehman Brothers Aggregate Bond Index++ | Growth of $10,000 | $ | 10,032 | $ | 12,031 | $ | 13,993 | $ | 20,392 | |||||||||
| Average annual total return | .32 | % | 6.36 | % | 6.95 | % | 7.39 | % | ||||||||||
Russell 1000 Growth Index+++ | Growth of $10,000 | $ | 11,788 | $ | 8,920 | $ | 7,155 | $ | 26,205 | |||||||||
| Average annual total return | 17.88 | % | -3.74 | % | -6.48 | % | 10.11 | % | ||||||||||
The growth of $10,000 is cumulative.
| + | The Standard & Poor’s 500 (S&P 500) Index is a capitalization-weighted index of 500 stocks. The index is designed to measure performance of the broad domestic economy through changes in the aggregate market value of 500 stocks representing all major industries. |
| ++ | The Lehman Brothers Aggregate Bond (LBAB) Index is an unmanaged market value-weighted measure of treasury issues, agency issues, corporate bond issues and mortgage securities. |
| +++ | The Russell 1000 Growth Index is an unmanaged capitalization-weighted index containing those securities in the Russell 1000 Index with higher book-to-price ratios and higher forecasted growth values. |
Index returns assume reinvestment of dividends and, unlike Fund returns, do not reflect any fees or expenses. It is not possible to invest directly into an index.
4
Table of Contents
In the following interview, Equity Portfolio Manager Julie M. Van Cleave and Fixed-Income Portfolio Manager Gary W. Bartlett discuss Scudder Balanced Fund’s performance strategy and the market environment during the six-month period ended June 30, 2004.
Q: How would you characterize the market environment of the past six months?
A: Mixed signals resulted in modestly positive equity and fixed-income returns for the six-month period ended June 30, 2004. Although economic growth and strong corporate earnings lifted the markets, geopolitical risks, high oil prices and concerns over inflation acted as a counterweight, balancing out overall performance.
Both bullish and bearish data points were plentiful. On the bulls’ side, economic expansion continued, as did strong corporate earnings growth. We believe estimates now call for greater than 20% growth in year-over-year second-quarter earnings. In addition, the improving economic backdrop appears to have led to a dramatic improvement in the financial state of US corporations, fueling speculation of increased merger and acquisition activity as well as strong capital spending. Finally, given the dramatic increase in earnings, equity valuations, for the most part, appear to be more reasonable.
Economic and geopolitical risks contributed to the bears’ negative viewpoint. Higher commodity prices and an improving US labor market prompted concerns that inflationary pressure might soon follow. There were indeed signs that prices have begun to creep up, prompting the Federal Reserve to begin the process of gradually removing its accommodative monetary policy by raising interest rates one-quarter point. Despite the uneventful handover of power in Iraq, the insurgency continued, adding to the overall level of market
Standard & Poor’s 500 index levels 1/1/04 to 6/30/04
[GRAPHIC APPEARS HERE]
Source: Deutsche Asset Management
Past performance is not indicative of future results. This chart is for illustrative purposes only and is not intended to be representative of Scudder Balanced Fund’s performance.
uncertainty and investor concern. The net result of these conflicting factors was slightly positive equity and fixed-income performance.
5
Table of Contents
While not dramatic, a market shift began in the second quarter of the period. As investors reassessed their tolerances for risk and uncertainty, they began to favor larger, well-established companies rather than the smaller-capitalization stocks that had significantly outperformed in 2003 and the first quarter of 2004. The 1.7% quarterly return of the S&P 500 outpaced the Russell 2000 Index’s 0.5% return. Additionally, growth outperformed value as the Russell 1000 Growth Index returned 1.9% while the Russell 1000 Value Index returned just 0.9%.1
| 1 | The Russell 2000 Index is an unmanaged, capitalization-weighted measure of approximately 2,000 small-cap US stocks. |
The Russell 1000 Growth Index is an unmanaged capitalization-weighted index containing those securities in the Russell 1000 Index with higher book-to-price ratios and higher forecasted growth values.
The Russell 1000 Value Index is an unmanaged index that consists of those stocks in the Russell 1000 Index with lower price-to-book ratios and lower forecasted growth values.
Index returns assume reinvestment of dividends and, unlike Fund returns, do not reflect any fees or expenses. It is not possible to invest directly into an index.
Q: How did the fund perform during the six-month period?
A: Even in this climate of mixed messages, the fund delivered a positive total return of 2.16% (Class S shares), as both the equity and fixed-income portions of the portfolio posted positive performance. This compares with a return of 3.44% for the fund’s equity benchmark, the S&P 500 index, and 0.15% for its fixed-income benchmark, the Lehman Brothers Aggregate Bond Index. (Please see pages 4 through 5 for performance of other share classes and more complete performance information.) For the semiannual period, the fund outperformed the 1.79% average return of the 578 funds in the Lipper Balanced Funds category.2 We believe this relative outperformance is due largely to the fact that we seek to emphasize quality in both the stock and bond portions of the portfolio. The long-term benefits of high-quality investing became increasingly apparent to investors over the last six months.
| 2 | Source: Lipper Inc. The Lipper Balanced Funds category comprises portfolios whose primary objective is to conserve principal by maintaining at all times a balance of both stocks and bonds. Typically, the stock/bond ratio ranges around 60%/40%. It is not possible to invest directly in a Lipper category. |
Q: What factors helped and hurt performance in the stock portion of the portfolio?
A: The equity portfolio benefited as investors abandoned the lower-quality, early-cycle stocks that dominated market performance in 2003 and gravitated to higher-quality names such as those held by the
6
Table of Contents
fund. During the first half of 2004, security selection, specifically within the health care sector, was a strong contributor to equity returns as the medical equipment and biotechnology industries continued to be focal points of the portfolio. Examples of strength within the equity portfolio’s health care holdings include Genentech, Inc., Gilead Sciences, Inc. and Zimmer Holdings, Inc. Genentech, Inc. received positive news on two of its cancer products. Avastin was shown to provide a superior survival benefit in treating colorectal cancer and Tarceva, for non-small-cell lung cancer, was shown to increase patient survival in a recently reported clinical trial. Gilead Sciences’ stock soared on news that its two-drug combination pill for HIV was assigned priority review status by the Food and Drug Administration. Zimmer Holdings’ stock rose after the company reported better-than-expected sales and earnings. Zimmer has proven to be a leader in the orthopedic sector as demand for its products, specifically reconstructive knee and hip implants, continues to increase rapidly.
The fund’s allocation to the energy sector also added to returns. As oil prices reached record levels and remained stubbornly high, a great deal of investor attention centered on the sector. While the spike in oil prices provided the catalyst for the near-term outperformance of the sector, the portfolio has been overweight in energy since early last year based on the long-term growth opportunities created by chronic underinvestment in the exploration and development of new reserves. EOG Resources, Inc., a North American natural gas company, reported strong earnings and quantified significant future reserve opportunities in the Barnett Shale region of Texas. EOG Resources, Inc. shares climbed during the quarter, rewarding our overweight position and making the holding one of the best-performing stocks in the portfolio. Also within the sector, refiner ConocoPhillips was a gainer after reporting record earnings and expanding margins.
The fund’s positioning in the consumer staples sector further bolstered performance.3 Household products giant Colgate-Palmolive Co. saw its stock rise after reporting its 32nd consecutive quarter of increasing earnings. It is this type of consistent, repeatable earnings growth that we look for when evaluating equity investment candidates.
| 3 | Consumer staples are products that consumers need to buy regardless of economic conditions, such as food and beverages. |
| 4 | Consumer discretionary includes products such as home electronics that are nonnecessities and therefore more sensitive to economic conditions. |
Positioning within the consumer discretionary sector yielded mixed results during the second quarter.4 Harley-Davidson, Inc. surged on better-than-expected earnings, continued strong sales and news that the company is taking initial steps to enter the Chinese market. Office supply retailer Staples, Inc. also posted strong performance as the company continues to benefit from the strong economic recovery and improving employment trends.
Detracting from performance was the fund’s position in International Game Technology. The maker of gaming machines reported earnings that failed to beat estimates, as had been the case for the last several quarters. Further contributing to the stock’s weakness were concerns over future replacement sales of its cashless gaming machines and uncertainty over further expansion of gaming permits. These factors combined to send the company’s shares down in the second quarter.
Profit taking continued in the information technology sector. Early-cycle outperformers such as Applied Materials, Inc., Texas Instruments, Inc. and EMC Corp. declined as concern mounted over slowing order growth. While we have altered the composition of our technology holdings to emphasize companies with more recurring revenue, we continue to believe that record levels of corporate cash flow, coupled with the year-end elimination of the accelerated method of depreciation, have the potential to ignite a meaningful increase in technology capital spending.
7
Table of Contents
Q: How did the fund’s positioning in bonds help or hurt performance?
A: The Federal Open Market Committee, after preparing the market for a policy change, increased the federal funds rate by 25 basis points in late June and set expectations for a “measured” pace of monetary policy tightening going forward. Over the period, volatility continued within the fixed-income markets as Treasury rates declined in the first quarter in response to disappointing job-creation reports. Treasury yields then spiked - with the yield of the 10-year Treasury note increasing 24 basis points in just one day - when a surprisingly strong jobs report came out in April. During the period, mortgages outperformed comparable Treasuries and were a significant contributor to performance. Although asset-backed securities underperformed Treasuries in the second quarter, our
[GRAPHIC APPEARS HERE]
Source: Deutsche Asset Management
Past performance is not indicative of future results. This chart is for illustrative purposes only and is not intended to be representative of Scudder Balanced Fund’s performance.
overall overweight in the asset-backed sector boosted six-month returns.5 Credit (corporate bonds) was the worst-performing sector in the investment-grade universe during the first half of the year. Concerns about valuations in the context of a rising-interest-rate environment appear to have halted the sector’s momentum. But the good news is that individual security selection has generated positive returns from the credit sector for the portfolio.
| 5 | Asset-backed securities are bonds or notes backed by loans or accounts receivable originated by banks, credit card companies or other providers of credit. |
Q: Do you have any final thoughts you would like to share with investors?
A: As the Federal Reserve gradually removes its ultra-accommodative monetary policy and as commodity prices remain high, we continue to look for stocks that can consistently deliver the top-line revenue growth needed to offset these factors. In terms of sector allocation, we continue to maintain a procyclical tilt with healthy weightings in the technology and consumer discretionary sectors.
With regard to our fixed-income investment strategy, we believe that our disciplined, value-oriented approach can help to dampen the effect of rising interest rates should the Federal Reserve continue to tighten.
While we continue to believe the economic expansion and corporate earnings growth are sustainable through 2004 and beyond, a good deal of uncertainty remains in the market. We are confident that our approach to equity and fixed-income investing will serve the portfolio well in times of market uncertainty.
The views expressed in this report reflect those of the portfolio managers only through the end of the period of the report as stated on the cover. The managers’ views are subject to change at any time based on market and other conditions and should not be construed as a recommendation.
8
Table of Contents
Portfolio Summary June 30, 2004
Diversification | 6/30/04 | 12/31/03 | ||||
Common Stocks | 64 | % | 63 | % | ||
Fixed Income Holdings | 31 | % | 33 | % | ||
Cash Equivalents | 5 | % | 4 | % | ||
| 100 | % | 100 | % | |||
Fixed Income Holdings (Excludes Cash Equivalents) | 6/30/04 | 12/31/03 | ||||
Diversification | ||||||
US Government Sponsored Agencies | 36 | % | 38 | % | ||
Corporate Bonds | 20 | % | 28 | % | ||
Asset Backed | 15 | % | 12 | % | ||
US Government Backed | 13 | % | 9 | % | ||
Foreign Bonds-US$ Denominated | 11 | % | 8 | % | ||
Municipal Investments | 5 | % | 5 | % | ||
| 100 | % | 100 | % | |||
Quality | ||||||
US Government Backed and US Government Sponsored Agencies | 48 | % | 47 | % | ||
AAA* | 22 | % | 24 | % | ||
AA | 2 | % | 2 | % | ||
A | 12 | % | 13 | % | ||
BBB | 13 | % | 12 | % | ||
BB | 3 | % | 2 | % | ||
| 100 | % | 100 | % | |||
Weighted Average Quality | AA+ | AAA |
9
Table of Contents
Five Largest Fixed Income Holdings (5.3% of Portfolio)
1. US Treasury Note, 4.375%, 8/15/2012 | 1.9 | % | |
2. US Treasury Bond, 6.00%, 2/15/2026 | 1.2 | % | |
3. Federal National Mortgage Association “PD”, Series 2002-31, 6.00%, 11/25/2021 | 1.0 | % | |
4. Federal National Mortgage Association “PE”, Series 2002-3, 5.50%, 8/25/2015 | 0.7 | % | |
5. Oregon, School District GO, Series A, Zero Coupon, 6/30/2014 | 0.5 | % | |
* Category includes cash equivalents net.
Diversification and holdings are subject to change.
Equity Holdings (Excludes Cash Equivalents) | 6/30/04 | 12/31/03 | ||||
Sector Diversification | ||||||
Information Technology | 25 | % | 26 | % | ||
Health Care | 23 | % | 22 | % | ||
Consumer Discretionary | 13 | % | 14 | % | ||
Consumer Staples | 12 | % | 11 | % | ||
Financials | 10 | % | 11 | % | ||
Industrials | 7 | % | 8 | % | ||
Energy | 7 | % | 6 | % | ||
Telecommunication Services | 2 | % | 1 | % | ||
Materials | 1 | % | 1 | % | ||
| 100 | % | 100 | % | |||
Five Largest Equity Holdings (11.0% of Portfolio)
1. Microsoft Corp. Developer of computer software | 2.7 | % | |
2. Intel Corp. Designer, manufacturer and seller of computer components and related products | 2.2 | % | |
3. Pfizer, Inc. Manufacturer of prescription pharmaceuticals and non-prescription self-medications | 2.1 | % | |
4. General Electric Co. Industrial conglomerate | 2.1 | % | |
5. Genentech, Inc. Developer and discoverer of human pharmaceuticals | 1.9 | % | |
Diversification and holdings are subject to change.
For more complete details about the fund’s investment portfolio, see page 15. A quarterly Fact Sheet is available upon request. Information concerning portfolio holdings of the Fund as of month end is available upon request on the 16th of the following month. Please see the Account Management Resources section for contact information.
10
Table of Contents
Investment Portfolio as of June 30, 2004 (Unaudited)
| Shares | Value ($) | |||
Common Stocks 63.0% | ||||
Consumer Discretionary 8.1% | ||||
Automobiles 1.0% | ||||
Harley-Davidson, Inc. | 123,200 | 7,631,008 | ||
Hotels Restaurants & Leisure 1.6% | ||||
International Game Technology | 188,400 | 7,272,240 | ||
YUM! Brands, Inc.* | 112,400 | 4,183,528 | ||
| 11,455,768 | ||||
Internet & Catalog Retail 0.4% | ||||
eBay, Inc.* | 31,100 | 2,859,645 | ||
Media 2.6% | ||||
Comcast Corp., “A”* | 129,400 | 3,572,734 | ||
McGraw-Hill, Inc. | 69,600 | 5,329,272 | ||
Omnicom Group, Inc. | 81,700 | 6,200,213 | ||
Viacom, Inc., “B” | 117,762 | 4,206,459 | ||
| 19,308,678 | ||||
Multiline Retail 1.3% | ||||
Kohl’s Corp.* | 56,500 | 2,388,820 | ||
Target Corp. | 175,700 | 7,461,979 | ||
| 9,850,799 | ||||
Specialty Retail 1.2% | ||||
Bed Bath & Beyond, Inc.* | 38,700 | 1,488,015 | ||
Home Depot, Inc. | 31,800 | 1,119,360 | ||
Lowe’s Companies, Inc. | 69,400 | 3,646,970 | ||
Staples, Inc. | 102,100 | 2,992,551 | ||
| 9,246,896 | ||||
Consumer Staples 7.6% | ||||
Beverages 2.1% | ||||
Coca-Cola Co. | 91,500 | 4,618,920 | ||
PepsiCo, Inc. | 197,250 | 10,627,830 | ||
| 15,246,750 | ||||
Food & Drug Retailing 2.3% | ||||
Wal-Mart Stores, Inc. | 227,400 | 11,997,624 | ||
Walgreen Co. | 141,100 | 5,109,231 | ||
| 17,106,855 | ||||
Food Products 0.6% | ||||
Dean Foods Co.* | 36,900 | 1,376,739 | ||
Hershey Foods Corp. | 61,800 | 2,859,486 | ||
| 4,236,225 | ||||
Household Products 2.6% | ||||
Colgate-Palmolive Co. | 157,600 | 9,211,720 | ||
Procter & Gamble Co. | 190,100 | 10,349,044 | ||
| 19,560,764 | ||||
11
Table of Contents
Energy 4.5% | ||||
Energy Equipment & Services 2.5% | ||||
Baker Hughes, Inc. | 126,600 | 4,766,490 | ||
Nabors Industries Ltd.* | 166,300 | 7,520,086 | ||
Schlumberger Ltd. | 102,300 | 6,497,073 | ||
| 18,783,649 | ||||
Oil & Gas 2.0% | ||||
Burlington Resources, Inc. | 135,600 | 4,906,008 | ||
ConocoPhillips | 82,700 | 6,309,183 | ||
EOG Resources, Inc. | 60,100 | 3,588,571 | ||
| 14,803,762 | ||||
Financials 6.8% | ||||
Banks 0.8% | ||||
Bank of America Corp. | 65,900 | 5,576,458 | ||
Capital Markets 1.6% | ||||
Goldman Sachs Group, Inc. | 23,100 | 2,175,096 | ||
Lehman Brothers Holdings, Inc. | 29,900 | 2,249,975 | ||
Morgan Stanley | 99,200 | 5,234,784 | ||
State Street Corp. | 48,200 | 2,363,728 | ||
| 12,023,583 | ||||
Consumer Finance 1.3% | ||||
American Express Co. | 180,700 | 9,284,366 | ||
Diversified Financial Services 1.7% | ||||
Citigroup, Inc. | 162,566 | 7,559,319 | ||
Fannie Mae | 69,400 | 4,952,384 | ||
| 12,511,703 | ||||
Insurance 1.4% | ||||
AFLAC, Inc. | 86,100 | 3,513,741 | ||
American International Group, Inc. | 95,874 | 6,833,898 | ||
| 10,347,639 | ||||
Health Care 14.3% | ||||
Biotechnology 3.0% | ||||
Amgen, Inc.* | 21,400 | 1,167,798 | ||
Genentech, Inc.* | 254,600 | 14,308,520 | ||
Gilead Sciences, Inc.* | 95,500 | 6,398,500 | ||
| 21,874,818 | ||||
Health Care Equipment & Supplies 3.6% | ||||
Baxter International, Inc. | 115,500 | 3,985,905 | ||
Boston Scientific Corp.* | 101,500 | 4,344,200 | ||
C.R. Bard, Inc. | 51,400 | 2,911,810 | ||
Hospira, Inc.* | 18,320 | 505,632 | ||
Medtronic, Inc. | 126,000 | 6,138,720 | ||
Zimmer Holdings, Inc.* | 103,100 | 9,093,420 | ||
| 26,979,687 | ||||
Health Care Providers & Services 1.1% | ||||
UnitedHealth Group, Inc. | 132,300 | 8,235,675 | ||
Pharmaceuticals 6.6% | ||||
Abbott Laboratories | 182,800 | 7,450,928 | ||
Eli Lilly & Co. | 118,700 | 8,298,317 | ||
Johnson & Johnson | 243,254 | 13,549,248 | ||
Merck & Co., Inc. | 87,000 | 4,132,500 | ||
Pfizer, Inc. | 454,400 | 15,576,832 | ||
| 49,007,825 | ||||
12
Table of Contents
Industrials 4.6% | ||||
Aerospace & Defense 1.2% | ||||
United Technologies Corp. | 96,600 | 8,836,968 | ||
Air Freight & Logistics 0.7% | ||||
FedEx Corp. | 64,600 | 5,277,174 | ||
Industrial Conglomerates 2.7% | ||||
3M Co. | 50,600 | 4,554,506 | ||
General Electric Co. | 476,900 | 15,451,560 | ||
| 20,006,066 | ||||
Information Technology 15.6% | ||||
Communications Equipment 1.8% | ||||
Cisco Systems, Inc.* | 568,400 | 13,471,080 | ||
Computers & Peripherals 2.6% | ||||
Dell, Inc.* | 103,900 | 3,721,698 | ||
EMC Corp.* | 584,200 | 6,659,880 | ||
International Business Machines Corp. | 98,900 | 8,718,035 | ||
| 19,099,613 | ||||
IT Consulting & Services 1.2% | ||||
Accenture Ltd., “A”* | 70,000 | 1,923,600 | ||
Fiserv, Inc.* | 126,800 | 4,931,252 | ||
Paychex, Inc. | 63,900 | 2,164,932 | ||
| 9,019,784 | ||||
Semiconductors & Semiconductor Equipment 4.6% | ||||
Applied Materials, Inc.* | 232,400 | 4,559,688 | ||
Intel Corp. | 578,500 | 15,966,600 | ||
Linear Technology Corp. | 137,600 | 5,431,072 | ||
Texas Instruments, Inc. | 322,100 | 7,788,378 | ||
| 33,745,738 | ||||
Software 5.4% | ||||
Adobe Systems, Inc. | 23,400 | 1,088,100 | ||
BEA Systems, Inc.* | 82,000 | 674,040 | ||
Electronic Arts, Inc.* | 125,000 | 6,818,750 | ||
Intuit, Inc.* | 61,800 | 2,384,244 | ||
Microsoft Corp. | 692,500 | 19,777,800 | ||
Oracle Corp.* | 290,700 | 3,468,051 | ||
Symantec Corp.* | 81,800 | 3,581,204 | ||
VERITAS Software Corp.* | 85,100 | 2,357,270 | ||
| 40,149,459 | ||||
Materials 0.5% | ||||
Chemicals | ||||
Ecolab, Inc. | 120,600 | 3,823,020 | ||
Telecommunication Services 1.0% | ||||
Diversified Telecommunication Services 0.4% | ||||
Verizon Communications, Inc. | 81,400 | 2,945,866 | ||
Wireless Telecommunication Services 0.6% | ||||
AT&T Wireless Services, Inc.* | 305,000 | 4,367,600 | ||
Total Common Stocks (Cost $371,286,858) | 466,674,921 | |||
13
Table of Contents
| Principal Amount ($) | Value ($) | |||
Corporate Bonds 6.2% | ||||
Consumer Discretionary 0.7% | ||||
Comcast Cable Communications, 8.375%, 3/15/2013 | 1,760,000 | 2,066,143 | ||
Cox Communications, Inc., 6.75%, 3/15/2011 | 975,000 | 1,051,281 | ||
DaimlerChrysler NA Holdings Corp., 4.75%, 1/15/2008 | 1,095,000 | 1,104,074 | ||
Liberty Media Corp., Series A, 2.61%, 9/17/2006 | 1,181,000 | 1,202,884 | ||
| 5,424,382 | ||||
Energy 0.7% | ||||
FirstEnergy Corp., Series B, 6.45%, 11/15/2011 | 750,000 | 777,569 | ||
Pedernales Electric Cooperative, Series 02-A, 144A, 6.202%, 11/15/2032 | 2,255,000 | 2,255,339 | ||
Pemex Project Funding Master Trust, 8.5%, 2/15/2008 | 1,452,000 | 1,597,200 | ||
XTO Energy, Inc., 4.9%, 2/1/2014 | 872,000 | 821,049 | ||
| 5,451,157 | ||||
Financials 2.9% | ||||
American General, 144A, 8.125%, 3/15/2046 | 1,235,000 | 1,506,535 | ||
American General Finance Corp., 4.0%, 3/15/2011 | 2,060,000 | 1,954,759 | ||
Capital One Bank: | ||||
5.0%, 6/15/2009 | 1,310,000 | 1,313,749 | ||
5.125%, 2/15/2014 | 375,000 | 354,836 | ||
Ford Motor Credit Co.: | ||||
5.8%, 1/12/2009 | 575,000 | 580,405 | ||
6.875%, 2/1/2006 | 2,501,000 | 2,623,291 | ||
7.0%, 10/1/2013 | 390,000 | 393,692 | ||
General Motors Acceptance Corp.: | ||||
5.625%, 5/15/2009 | 1,695,000 | 1,691,603 | ||
6.75%, 1/15/2006 | 2,409,000 | 2,524,273 | ||
6.875%, 9/15/2011 | 430,000 | 440,878 | ||
Goldman Sachs Group, Inc.: | ||||
5.15%, 1/15/2014 | 1,740,000 | 1,670,953 | ||
6.345%, 2/15/2034 | 725,000 | 680,828 | ||
OneAmerica Financial Partners, 144A, 7.0%, 10/15/2033 | 1,050,000 | 1,035,698 | ||
PLC Trust, Series 2003-1, 144A, 2.709%, 3/31/2006 | 1,802,372 | 1,803,651 | ||
Protective Life Secured Trs Secured, 4.0%, 4/1/2011 | 1,330,000 | 1,258,788 | ||
RAM Holdings Ltd., 144A, 6.875%, 4/1/2024 | 1,495,000 | 1,393,942 | ||
| 21,227,881 | ||||
14
Table of Contents
Industrials 0.2% | ||||
BAE System 2001 Asset Trust, “B”, Series B 2001, 144A, 7.156%, 12/15/2011 | 992,719 | 1,056,634 | ||
Telecommunication Services 0.4% | ||||
Continental Cable, 9.0%, 9/1/2008 | 730,000 | 850,722 | ||
PCCW Capital Ltd., 144A, 6.0%, 7/15/2013 | 810,000 | 800,727 | ||
Verizon Communications, 8.75%, 11/1/2021 | 384,000 | 464,620 | ||
Verizon Pennsylvania, 5.65%, 11/15/2011 | 795,000 | 806,540 | ||
| 2,922,609 | ||||
Utilities 1.3% | ||||
Alabama Power Co., 7.125%, 8/15/2004 | 3,200,000 | 3,218,678 | ||
Centerior Energy Corp., Series B, 7.13%, 7/1/2007 | 1,985,000 | 2,161,790 | ||
Cleveland Electric Illuminating Co., 144A, 5.65%, 12/15/2013 | 1,080,000 | 1,050,961 | ||
Consumers Energy Co., Series F, 4.0%, 5/15/2010 | 1,820,000 | 1,723,060 | ||
Xcel Energy, Inc., 7.0%, 12/1/2010 | 1,345,000 | 1,487,809 | ||
| 9,642,298 | ||||
Total Corporate Bonds (Cost $46,569,782) | 45,724,961 | |||
Asset Backed 2.6% | ||||
Automobile Receivables 1.0% | ||||
Chase Manhattan Auto Owner Trust, “A4”, Series 2003-B, 2.57%, 2/16/2010 | 2,490,000 | 2,433,369 | ||
Daimler Chrysler Auto Trust, “A4:, Series 2002-A, 4.49%, 10/6/2008 | 1,201,000 | 1,223,430 | ||
Drive Auto Receivables Trust, “A3”, Series 2004-1, 144A, 3.5%, 8/15/2008 | 1,390,000 | 1,389,832 | ||
MMCA Automobile Trust: | ||||
“A4”, Series 2002-3, 3.57%, 8/17/2009 | 690,000 | 693,609 | ||
“A4”, Series 2001-4, 4.92%, 8/15/2007 | 1,076,113 | 1,091,876 | ||
“B”, Series 2002-1, 5.37%, 1/15/2010 | 872,580 | 833,314 | ||
| 7,665,430 | ||||
Credit Card Receivables 0.5% | ||||
MBNA Credit Card Master Note Trust: | ||||
“A2”, Series 2004-A2, 1.53%, 7/15/2013 | 610,000 | 609,627 | ||
“A4”, Series 2004-A4, 2.7%, 9/15/2009 | 3,070,000 | 3,003,158 | ||
| 3,612,785 | ||||
Home Equity Loans 1.1% | ||||
Advanta Mortgage Loan Trust, “A6”, Series 2000-2, 7.72%, 3/25/2015 | 1,375,849 | 1,460,450 | ||
Centex Home Equity, “A6”, Series 2000-B, 7.97%, 7/25/2031 | 2,071,815 | 2,166,875 | ||
Countrywide Asset-Backed Certificates, “N1”, Series 2004-2N, 144A, 5.0%, 2/25/2035 | 1,200,000 | 1,193,813 | ||
Equity One ABS, Inc., “AF3”, Series 2004-1, 3.054%, 4/25/2034 | 815,000 | 796,251 | ||
Long Beach Mortgage Loan Trust: | ||||
“A3”, Series 2004-1, 1.4%**, 2/25/2034 | 1,713,880 | 1,715,181 | ||
“M3”, Series 2001-4, 3.85%, 3/25/2032 | 350,000 | 350,830 | ||
Novastar NIM Trust, Series 2004-N1, 144A, 4.458%, 2/26/2034 | 442,586 | 442,586 | ||
| 8,125,986 | ||||
Total Asset Backed (Cost $19,712,712) | 19,404,201 | |||
15
Table of Contents
Foreign Bonds - US$ Denominated 3.4% | ||||
Deutsche Telekom International Finance BV: | ||||
8.5%, 6/15/2010 | 245,000 | 286,297 | ||
8.75%, 6/15/2030 | 1,034,000 | 1,258,518 | ||
Encana Holdings Finance Corp., 5.8%, 5/1/2014 | 2,365,000 | 2,406,037 | ||
HSBC Capital Funding LP, 144A, 4.61%, 12/29/2049 | 2,020,000 | 1,831,209 | ||
Inversiones CMPC SA, 144A, 4.875%, 6/18/2013 | 1,785,000 | 1,657,130 | ||
Mantis Reef Ltd., 144A, 4.692%, 11/14/2008 | 3,135,000 | 3,096,355 | ||
Mizuho Financial Group, 8.375%, 12/29/2049 | 1,925,000 | 1,982,750 | ||
PacifiCorp Australia LLC, 144A, 6.15%, 1/15/2008 | 525,000 | 554,532 | ||
Petroleos Mexicanos S.A., 8.85%, 9/15/2007 | 1,295,000 | 1,447,163 | ||
QBE Insurance Group Ltd., 144A, 5.647%, 7/1/2023 | 1,255,000 | 1,193,870 | ||
Sappi Papier Holding AG, 144A, 6.75%, 6/15/2012 | 2,445,000 | 2,609,128 | ||
Sociedad Concesionaria Autopista Contral, 144A, 6.223%, 12/15/2026 | 2,250,000 | 2,196,045 | ||
Tyco International Group SA: | ||||
5.8%, 8/1/2006 | 155,000 | 161,649 | ||
6.375%, 2/15/2006 | 505,000 | 530,203 | ||
6.75%, 2/15/2011 | 409,000 | 444,412 | ||
6.875%, 1/15/2029 | 2,250,000 | 2,355,547 | ||
United Mexican States, 7.5%, 4/8/2033 | 490,000 | 474,320 | ||
WPP Finance Corp., 144A, 5.875%, 6/15/2014 | 945,000 | 948,872 | ||
Total Foreign Bonds - US$ Denominated (Cost $25,770,749) | 25,434,037 | |||
US Government Backed 4.0% | ||||
US Treasury Bond: | ||||
6.0%, 2/15/2026 (e) | 8,043,000 | 8,666,646 | ||
7.25%, 5/15/2016 | 3,196,000 | 3,863,788 | ||
US Treasury Note: | ||||
1.5%, 3/31/2006 | 100,000 | 98,184 | ||
3.125%, 10/15/2008 | 2,767,000 | 2,711,552 | ||
4.375%, 8/15/2012 | 14,166,000 | 14,100,156 | ||
Total US Government Backed (Cost $29,039,264) | 29,440,326 | |||
US Government Agency Sponsored Pass-Thrus 2.2% | ||||
Federal Home Loan Mortgage Corp., 2.875%, 12/15/2006 | 2,845,000 | 2,817,276 | ||
Federal National Mortgage Association: | ||||
4.5%, 12/1/2018 | 461,205 | 451,916 | ||
5.0%, 6/1/2018 | 1,079,508 | 1,083,350 | ||
5.5% with various maturities from 10/1/2018 until 6/1/2034 | 3,351,238 | 3,353,942 | ||
6.0% with various maturities from 11/1/2017 until 12/1/2033 | 2,274,447 | 2,346,970 | ||
6.31%, 6/1/2008 | 3,570,000 | 3,819,549 | ||
6.5% with various maturities from 6/1/2017 until 11/1/2033 | 1,634,227 | 1,717,828 | ||
8.0%, 9/1/2015 | 438,528 | 468,554 | ||
Total US Government Agency Sponsored Pass-Thrus (Cost $16,055,534) | 16,059,385 | |||
16
Table of Contents
Commercial and Non-Agency Mortgage-Backed Securities 2.0% | ||||
ABN AMRO Mortgage Corp., Series 2002-3, 6.0%, 4/25/2017 | 220,602 | 220,313 | ||
Chase Commercial Mortgage Securities Corp., “A1”, Series 2000-1, 7.656%, 4/15/2032 | 1,219,417 | 1,272,040 | ||
Countrywide Alternative Loan Trust, “1A1”, Series 2004-J1, 6.0%, 2/25/2034 | 824,174 | 837,028 | ||
DLJ Mortgage Acceptance Corp., “A1B”, Series 1997-CF2, 144A, 6.82%, 10/15/2030 | 1,092,043 | 1,163,452 | ||
GMAC Commercial Mortgage Securities, Inc., “A3”, Series 1997-C1, 6.869%, 7/15/2029 | 1,037,439 | 1,111,409 | ||
Master Alternative Loan Trust: | ||||
“7A1”, Series 2004-4, 6.0%, 5/25/2034 | 342,879 | 343,239 | ||
“3A1”, Series 2004-5, 6.5%, 6/25/2034 | 419,831 | 433,652 | ||
“8A1”, Series 2004-3, 7.0%, 4/25/2034 | 1,042,798 | 1,092,235 | ||
Master Asset Securitization Trust: | ||||
“3A2”, Series 2003-2, 4.25%, 4/25/2033 | 1,761,492 | 1,760,714 | ||
“8A1”, Series 2003-6, 5.5%, 7/25/2033 | 1,567,147 | 1,531,909 | ||
Residential Accredit Loans, Inc., “A5”, Series 2002-QS14, 5.125%, 9/25/2032 | 1,029,588 | 1,038,654 | ||
Residential Funding Mortgage Securities I, “A1”, Series 2003-S2, 5.0%, 2/25/2033 | 693,291 | 697,366 | ||
Structured Asset Securities Corp., “2A1”, Series 2003-1, 6.0%, 2/25/2018 | 808,323 | 838,771 | ||
WAMU Mortgage Pass-Through Certificates, “4A”, Series 2004-CB1, 6.0%, 6/25/2034 | 807,553 | 831,239 | ||
Wells Fargo Mortgage Backed Securities Trust, “1A1”, Series 2003-6, 5.0%, 6/25/2018 | 2,128,754 | 2,128,590 | ||
Commercial and Non-Agency Mortgage-Backed Securities (Cost $15,506,287) | 15,300,611 | |||
Collateralized Mortgage Obligations 7.7% | ||||
Fannie Mae Grantor Trust, “1A3”, Series 2004-T2, 7.0%, 11/25/2043 | 734,412 | 775,590 | ||
Fannie Mae Whole Loan, “5A”, Series 2004-W2, 7.5%, 3/25/2044 | 2,170,416 | 2,325,731 | ||
Federal Home Loan Mortgage Corp.: | ||||
“AU”, Series 2759, 3.5%, 5/15/2019 | 1,275,000 | 1,279,845 | ||
“NB”, Series 2750, 4.0%, 12/15/2022 | 390,000 | 388,097 | ||
“ME”, Series 2691, 4.5%, 4/15/2032 | 2,661,000 | 2,474,850 | ||
“PE”, Series 2727, 4.5%, 7/15/2032 | 1,345,000 | 1,247,291 | ||
“HG”, Series 2543, 4.75%, 9/15/2028 | 1,613,534 | 1,634,599 | ||
“JD”, Series 2778, 5.0%, 12/15/2032 | 1,785,000 | 1,708,409 | ||
“PE”, Series 2721, 5.0%, 1/15/2023 | 940,000 | 897,047 | ||
“PE”, Series 2777, 5.0%, 4/15/2033 | 2,550,000 | 2,438,850 | ||
“UE”, Series 2764, 5.0%, 10/15/2032 | 1,910,000 | 1,818,932 | ||
“PE”, Series 2512, 5.5%, 2/15/2022 | 935,000 | 951,015 | ||
“BD”, Series 2453, 6.0%, 5/15/2017 | 360,000 | 376,051 | ||
“3A”, Series T-41, 7.5%, 7/25/2032 | 866,569 | 928,581 | ||
Federal Home Loan Mortgage Corp. Structured Pass Through Securities: | ||||
“A2B”, Series T-56, 4.29%, 7/25/2036 | 2,660,000 | 2,689,869 | ||
“3A”, Series T-58, 7.0%, 9/25/2043 | 1,162,000 | 1,230,965 | ||
Federal National Mortgage Association: | ||||
“3A2B”, Series 2003-W10, Whole Loan, 3.056%, 7/25/2037 | 1,390,000 | 1,373,937 | ||
“NA”, Series 2003-128, 4.0%, 8/25/2009 | 2,716,000 | 2,746,082 | ||
“TU”, Series 2003-122, 4.0%, 5/25/2016 | 2,092,875 | 2,101,231 | ||
“PU”, Series 2003-33, 4.5%, 5/25/2033 | 1,787,800 | 1,805,771 | ||
“WB”, Series 2003-106, 4.5%, 10/25/2015 | 2,020,000 | 2,053,228 | ||
“A2”, Series 2002-W10, 4.7%, 8/25/2042 | 445,309 | 446,982 | ||
“A2”, Series 2002-W9, 4.7%, 8/25/2042 | 277,972 | 279,387 | ||
“2A3”, Series 2003-W15, 4.71%, 8/25/2043 | 2,630,000 | 2,673,544 | ||
“1A3”, Series 2003-W18, 4.732%, 8/25/2033 | 1,350,000 | 1,368,568 | ||
17
Table of Contents
“KH”, Series 2003-92, 5.0%, 3/25/2032 | 1,420,000 | 1,364,316 | ||
“MC”, Series 2002-56, 5.5%, 9/25/2017 | 1,157,680 | 1,201,015 | ||
“PE”, Series 2002-3, 5.5%, 8/25/2015 | 5,050,000 | 5,224,193 | ||
“PD”, Series 2002-31, 6.0%, 11/25/2021 | 7,000,000 | 7,289,160 | ||
“HM”, Series 2002-36, 6.5%, 12/25/2029 | 188,923 | 192,882 | ||
“1A2”, Series 2003-W3, 7.0%, 8/25/2042 | 916,389 | 964,067 | ||
“1A3”, Series 2004-T3, 7.0%, 2/25/2044 | 370,000 | 391,969 | ||
Government National Mortgage Association: | ||||
“GD”, Series 2004-26, 5.0%, 11/16/2032 | 1,202,000 | 1,147,255 | ||
“PD”, Series 2004-30, 5.0%, 2/20/2033 | 1,203,000 | 1,147,664 | ||
Total Collateralized Mortgage Obligations (Cost $56,136,289) | 56,936,973 | |||
Municipal Investments 1.7% | ||||
Dallas, TX, Airport Revenue, Industrial Airport Facilities, 6.6%, 11/1/2012(c) | 1,635,000 | 1,770,623 | ||
Denver, CO, School District (REV) Lease, School District Number 01, 6.82%, 12/15/2009(c) | 1,600,000 | 1,785,616 | ||
Hoboken, NJ, Core City General Obligation, Series B, 3.8%, 1/1/2008(c) | 1,895,000 | 1,909,724 | ||
Indiana, State General Obligation, Series 3, 5.15%, 7/15/2013(c) | 2,005,000 | 2,001,792 | ||
Myrtle Beach, SC, Hospitality Fee RevenueSeries B, 5.75%, 6/1/2019(c) | 1,440,000 | 1,422,202 | ||
Oregon, School District General Obligation, Series A, Zero Coupon, 6/30/2014(c) | 6,855,000 | 3,965,549 | ||
Total Municipal Investments (Cost $13,039,054) | 12,855,506 | |||
US Government Sponsored Agencies 1.4% | ||||
Federal Home Loan Mortgage Corp.: | ||||
4.0%, 2/15/2023 | 910,000 | 905,899 | ||
5.0% with various maturities from 7/15/2032 until 12/1/2033(b) | 4,663,000 | 4,501,759 | ||
Federal National Mortgage Association: | ||||
4.5%, 12/1/2018 | 245,000 | 239,334 | ||
5.0% with various maturities from 12/1/2017 until 12/1/2033 | 5,015,000 | 4,889,929 | ||
Total US Government Sponsored Agencies (Cost $10,477,141) | 10,536,921 | |||
Government National Mortgage Association 0.4% | ||||
Government National Mortgage Association: | ||||
3.75%, 6/20/2026 | 1,452,000 | 1,443,650 | ||
5.0%, 9/20/2033 | 1,262,008 | 1,225,119 | ||
Total Government National Mortgage Association (Cost $2,718,125) | 2,668,769 | |||
| Shares | Value ($) | |||
Securities Lending Collateral 0.9% | ||||
Daily Assets Fund Institutional, 1.13%(f) (Cost $6,495,293) | 6,495,293 | 6,495,293 | ||
Cash Equivalents 4.5% | ||||
Scudder Cash Management QP Trust, 1.20%(d) (Cost $33,461,293) | 33,461,293 | 33,461,293 | ||
Total Investment Portfolio - 100.0% (Cost $646,268,381)(a) | 740,993,197 | |||
| * | Non-income producing security. |
| ** | Floating rate notes are securities whose yields vary with a designated market index or market rate, such as the coupon-equivalent of the US Treasury bill rate. These securities are shown at their current rate as of June 30, 2004. |
| (a) | The cost for federal income tax purposes was $656,069,965. At June 30, 2004, net unrealized appreciation for all securities based on tax cost was $84,923,232. This consisted of aggregate gross unrealized appreciation for all securities in which there was an excess of value over tax cost of $101,218,138 and aggregate gross unrealized depreciation for all securities in which there was an excess of tax cost over value of $16,294,906. |
| (b) | Mortgage dollar rolls included. |
| (c) | Bond is insured by one of these companies: |
As a % of total investment portfolio | ||||
AMBAC | AMBAC Assurance Corp. | 0.2 | ||
FGIC | Financial Guaranty Insurance Company | 1.0 | ||
MBIA | Municipal Bond Investors Assurance | 0.5 |
| (d) | Scudder Cash Management QP Trust is also managed by Deutsche Investment Management Americas Inc. The rate shown is the annualized seven-day yield at period end. |
| (e) | All or a portion of these securities were on loan (see Notes to Financial Statements). The value of all securities loaned at June 30, 2004 amounted to $6,455,445, which is 8.9% of total net assets. |
| (f) | Represents collateral held in connection with securities lending. |
Included in the portfolio are investments in mortgage-or asset-backed securities which are interests in separate pools of mortgages or assets. Effective maturities of these investments may be shorter than stated maturities due to prepayments. Some separate investments in the Federal National Mortgage Association issues which have similar coupon rates have been aggregated for presentation purposes in the investment portfolio.
144A: Security exempt from registration under Rule 144A of the Securities Act of 1933. These securities may be resold in transactions exempt from registration, normally to qualified institutional buyers.
The accompanying notes are an integral part of the financial statements.
18
Table of Contents
Statement of Assets and Liabilities as of June 30, 2004 (Unaudited)
Assets | ||||
Investments: Investments in securities, at value (cost $606,311,795) | $ | 701,036,611 | ||
Investments in Scudder Cash Management QP Trust (cost $33,461,293) | 33,461,293 | |||
Investments in Daily Assets Fund Institutional (cost $6,495,293) (a) | 6,495,293 | |||
Total investments in securities, at value (cots $646,268,381) | 740,993,197 | |||
Cash | 530,761 | |||
Receivable for investments sold | 4,640,023 | |||
Dividends receivable | 282,429 | |||
Interest receivable | 1,753,585 | |||
Receivable for Fund shares sold | 290,593 | |||
Total assets | 748,490,588 | |||
Liabilities | ||||
Payable for investments purchased | 9,866,529 | |||
Payable for investments purchased - mortgage dollar rolls | 2,746,100 | |||
Deferred mortgage dollar rolls | 4,600 | |||
Payable for Fund shares redeemed | 3,735,165 | |||
Collateral on securities loaned | 6,495,293 | |||
Accrued management fee | 283,307 | |||
Other accrued expenses and payables | 577,111 | |||
Total liabilities | 23,708,105 | |||
Net assets, at value | $ | 724,782,483 | ||
Net Assets | ||||
Net assets consist of: | ||||
Distributions in excess of net investment income | (96,796 | ) | ||
Net unrealized appreciation (depreciation) on investments | 94,724,816 | |||
Accumulated net realized gain (loss) | (138,225,854 | ) | ||
Paid-in capital | 768,380,317 | |||
Net assets, at value | $ | 724,782,483 | ||
Net Asset Value | ||||
Class AARP | ||||
Net Asset Value, offering and redemption price per share ($333,297,436 / 19,629,400 outstanding shares of beneficial interest, $.01 par value, unlimited number of shares authorized) | $16.98 | |||
Class S | ||||
Net Asset Value, offering and redemption price per share ($391,485,047 / 23,070,757 outstanding shares of beneficial interest, $.01 par value, unlimited number of shares authorized) | $16.97 |
| (a) | Represents collateral on securities loaned. |
The accompanying notes are an integral part of the financial statements.
19
Table of Contents
Statement of Operations for the six months ended June 30, 2004 (Unaudited)
Investment Income | ||||
Income: | ||||
Dividends | $ | 2,417,408 | ||
Interest | 5,740,246 | |||
Interest - Scudder Cash Management QP Trust | 110,930 | |||
Securities lending income | 1,384 | |||
Total Income | 8,269,968 | |||
Expenses: | ||||
Management fee | 1,685,311 | |||
Administrative fee | 788,241 | |||
Services to shareholders* | 516,334 | |||
Trustees’ fees and expenses | 9,585 | |||
Other* | 109,319 | |||
Total expenses, before expense reductions | 3,108,790 | |||
Expense reductions | (2,411 | ) | ||
Total expenses, after expense reductions | 3,106,379 | |||
Net investment income | 5,163,589 | |||
Realized and Unrealized Gain (Loss) on Investment Transactions | ||||
Net realized gain (loss) from investments | 295,998 | |||
Net unrealized appreciation (depreciation) during the period on investments | 10,131,123 | |||
Net gain (loss) on investment transactions | 10,427,121 | |||
Net increase (decrease) in net assets resulting from operations | $ | 15,590,710 | ||
| * | Included herein are amounts representing three months of operating expenses previously covered by the Administrative Agreement (see Note C of the Notes to Financial Statements) including custodian and accounting fees, auditing, legal, reports to shareholders and registration fees. |
The accompanying notes are an integral part of the financial statements.
20
Table of Contents
Statement of Changes in Net Assets
| Six Months Ended June 30, 2004 | Year Ended December 31, 2003 | |||||||
| (Unaudited) | ||||||||
Increase (Decrease) in Net Assets | ||||||||
Operations: | ||||||||
Net investment income | $ | 5,163,589 | $ | 9,680,148 | ||||
Net realized gain (loss) on investment transactions | 295,998 | (16,796,639 | ) | |||||
Net unrealized appreciation (depreciation) on investment transactions during the period | 10,131,123 | 119,264,366 | ||||||
Net increase (decrease) in net assets resulting from operations | 15,590,710 | 112,147,875 | ||||||
Distributions to shareholders from: | ||||||||
Net investment income: | ||||||||
Class AARP | (2,772,769 | ) | (4,884,205 | ) | ||||
Class S | (3,099,046 | ) | (6,129,360 | ) | ||||
Fund share transactions: | ||||||||
Proceeds from shares sold | 85,549,444 | 114,307,281 | ||||||
Reinvestment of distributions | 5,530,453 | 10,387,000 | ||||||
Cost of shares redeemed | (112,364,209 | ) | (170,703,039 | ) | ||||
Net increase (decrease) in net assets from Fund share transactions | (21,284,312 | ) | (46,008,758 | ) | ||||
Increase (decrease) in net assets | (11,565,417 | ) | 55,125,552 | |||||
Net assets at beginning of period | 736,347,900 | 681,222,348 | ||||||
Net assets at end of period (including distributions in excess of net investment income and undistributed net investment income of $96,796 and $611,430, respectively) | $ | 724,782,483 | $ | 736,347,900 | ||||
The accompanying notes are an integral part of the financial statements.
21
Table of Contents
Class AARP
Years Ended December 31, | 2004a | 2003 | 2002 | 2001e | 2000b | |||||||||||||||
Selected Per Share Data | ||||||||||||||||||||
Net asset value, beginning of period | $ | 16.75 | $ | 14.51 | $ | 17.48 | $ | 19.26 | $ | 21.46 | ||||||||||
Income (loss) from investment operations: | ||||||||||||||||||||
Net investment incomec | .13 | .21 | .31 | .41 | .18 | |||||||||||||||
Net realized and unrealized gain (loss) on investment transactions | .24 | 2.28 | (2.94 | ) | (1.59 | ) | (1.42 | ) | ||||||||||||
Total from investment operations | .37 | 2.49 | (2.63 | ) | (1.18 | ) | (1.24 | ) | ||||||||||||
Less distributions from: | ||||||||||||||||||||
Net investment income | (.14 | ) | (.25 | ) | (.34 | ) | (.43 | ) | (.21 | ) | ||||||||||
Net realized gains on investment transactions | — | — | — | (.17 | ) | (.75 | ) | |||||||||||||
Total distributions | (.14 | ) | (.25 | ) | (.34 | ) | (.60 | ) | (.96 | ) | ||||||||||
Net asset value, end of period | $ | 16.98 | $ | 16.75 | $ | 14.51 | $ | 17.48 | $ | 19.26 | ||||||||||
Total Return (%) | 2.34 | ** | 17.26 | (15.18 | ) | (6.02 | ) | (5.80 | )** | |||||||||||
Ratios to Average Net Assets and Supplemental Data | ||||||||||||||||||||
Net assets, end of period ($ millions) | 333 | 332 | 298 | 409 | 499 | |||||||||||||||
Ratio of expenses (%) | .86 | * | .92 | .78 | .77 | .72d | * | |||||||||||||
Ratio of net investment income (%) | 1.51 | * | 1.39 | 1.98 | 2.29 | 2.45 | * | |||||||||||||
Portfolio turnover rate (%) | 102 | * | 103 | 150 | 112 | 131 | ||||||||||||||
| a | For the six months ended June 30, 2004 (Unaudited). |
| b | For the period August 28, 2000 (commencement of sales of Class AARP shares) to December 31, 2000. |
| c | Based on average shares outstanding during the period. |
| d | The ratio of operating expenses includes a one-time reduction in reorganization expenses. The ratio without this reduction is .77%. |
| e | As required, effective January 1, 2001, the Fund has adopted the provisions of the AICPA Audit and Accounting Guide for Investment Companies and began amortizing premium on debt securities. In addition, paydowns on mortgage-backed securities which were included in realized gain/loss on investment transactions prior to January 1, 2001 are included as interest income. The effect of this change for the year ended December 31, 2001 was to decrease net investment income by $.01, increase net realized and unrealized gains and losses per share by $.01, and decrease the ratio of net investment income to average net assets from 2.37% to 2.29%. Per share data and ratios for periods prior to January 1, 2001 have not been restated to reflect this change in presentation. |
| * | Annualized |
| ** | Not annualized |
22
Table of Contents
Class S
Years Ended December 31, | 2004a | 2003 | 2002 | 2001d | 2000 | 1999 | ||||||||||||||||||
Selected Per Share Data | ||||||||||||||||||||||||
Net asset value, beginning of period | $ | 16.74 | $ | 14.50 | $ | 17.48 | $ | 19.25 | $ | 21.15 | $ | 18.96 | ||||||||||||
Income (loss) from investment operations: | ||||||||||||||||||||||||
Net investment incomeb | .13 | .21 | .31 | .41 | .38 | .33 | ||||||||||||||||||
Net realized and unrealized gain (loss) on investment transactions | .24 | 2.28 | (2.95 | ) | (1.58 | ) | (.87 | ) | 2.20 | |||||||||||||||
Total from investment operations | .37 | 2.49 | (2.64 | ) | (1.17 | ) | (.49 | ) | 2.53 | |||||||||||||||
| �� | ||||||||||||||||||||||||
Less distributions from: | ||||||||||||||||||||||||
Net investment income | (.14 | ) | (.25 | ) | (.34 | ) | (.43 | ) | (.37 | ) | (.32 | ) | ||||||||||||
Net realized gains on investment transactions | — | — | — | (.17 | ) | (1.04 | ) | (.02 | ) | |||||||||||||||
Total distributions | (.14 | ) | (.25 | ) | (.34 | ) | (.60 | ) | (1.41 | ) | (.34 | ) | ||||||||||||
Net asset value, end of period | $ | 16.97 | $ | 16.74 | $ | 14.50 | $ | 17.48 | $ | 19.25 | $ | 21.15 | ||||||||||||
Total Return (%) | 2.16 | ** | 17.19 | (15.13 | ) | (6.02 | ) | (2.42 | ) | 13.46 | ||||||||||||||
Ratios to Average Net Assets and Supplemental Data | ||||||||||||||||||||||||
Net assets, end of period ($ millions) | 391 | 404 | 383 | 512 | 520 | 572 | ||||||||||||||||||
Ratio of expenses (%) | .87 | * | .92 | .78 | .77 | 1.17c | 1.29 | |||||||||||||||||
Ratio of net investment income (%) | 1.50 | * | 1.39 | 1.98 | 2.29 | 1.85 | 1.69 | |||||||||||||||||
Portfolio turnover rate (%) | 102 | * | 103 | 150 | 112 | 131 | 102 | |||||||||||||||||
| a | For the six months ended June 30, 2004 (Unaudited). |
| b | Based on average shares outstanding during the period. |
| c | The ratio of operating expenses excluding costs incurred in connection with a fund complex reorganization was 1.14%. |
| d | As required, effective January 1, 2001, the Fund has adopted the provisions of the AICPA Audit and Accounting Guide for Investment Companies and began amortizing premium on debt securities. In addition, paydowns on mortgage-backed securities which were included in realized gain/loss on investment transactions prior to January 1, 2001 are included as interest income. The effect of this change for the year ended December 31, 2001 was to decrease net investment income by $.01, increase net realized and unrealized gains and losses per share by $.01, and decrease the ratio of net investment income to average net assets from 2.37% to 2.29%. Per share data and ratios for periods prior to January 1, 2001 have not been restated to reflect this change in presentation. |
| * | Annualized |
| ** | Not annualized |
23
Table of Contents
Notes to Financial Statements (Unaudited)
A. Significant Accounting Policies
Scudder Balanced Fund (the “Fund”) is a diversified series of Scudder Portfolio Trust (the “Trust”) which is registered under the Investment Company Act of 1940, as amended (the “1940 Act”), as an open-end management investment company organized as a Massachusetts business trust.
The Fund offers two classes of shares. Shares of Class AARP are designed for members of AARP. Class S shares of the Fund are generally not available to new investors.
Investment income, realized and unrealized gains and losses, and certain fund-level expenses and expense reductions, if any, are borne pro rata on the basis of relative net assets by the holders of both classes of shares. All shares of the Fund have equal rights with respect to voting subject to class-specific arrangements.
The Fund’s financial statements are prepared in accordance with accounting principles generally accepted in the United States of America which require the use of management estimates. Actual results could differ from those estimates. The policies described below are followed consistently by the Fund in the preparation of its financial statements.
Security Valuation. Investments are stated at value determined as of the close of regular trading on the New York Stock Exchange on each day the exchange is open for trading. Equity securities are valued at the most recent sale price or official closing price reported on the exchange (US or foreign) or over-the-counter market on which the security is traded most extensively. Securities for which no sales are reported are valued at the calculated mean between the most recent bid and asked quotations on the relevant market or, if a mean cannot be determined, at the most recent bid quotation.
Debt securities are valued by independent pricing services approved by the Trustees of the Fund. If the pricing services are unable to provide valuations, the securities are valued at the most recent bid quotation or evaluated price, as applicable, obtained from a broker-dealer. Such services may use various pricing techniques which take into account appropriate factors such as yield, quality, coupon rate, maturity, type of issue, trading characteristics and other data, as well as broker quotes.
24
Table of Contents
Money market instruments purchased with an original or remaining maturity of sixty days or less, maturing at par, are valued at amortized cost. Investments in open-end investment companies and Scudder Cash Management QP Trust are valued at their net asset value each business day.
Securities and other assets for which market quotations are not readily available or for which the above valuation procedures are deemed not to reflect fair value are valued in a manner that is intended to reflect their fair value as determined in accordance with procedures approved by the Trustees.
Mortgage Dollar Rolls. The Fund may enter into mortgage dollar rolls in which the Fund sells mortgage-backed securities for delivery in the current month and simultaneously contracts to repurchase similar, but not identical, securities on a fixed date. The Fund receives compensation as consideration for entering into the commitment to repurchase. The compensation is paid in the form of lower price for the security upon its repurchase or, alternatively, a fee. Mortgage dollar rolls may be renewed with a new sale and repurchase price and a cash settlement made at each renewal without physical delivery of the securities subject to the contract.
Certain risks may arise upon entering into mortgage dollar rolls from the potential inability of counterparties to meet the terms of their commitments. Additionally, the value of such securities may change adversely before the Fund is able to repurchase them.
Securities Lending
The Fund may lend securities to financial institutions. The Fund retains beneficial ownership of the securities it has loaned and continues to receive interest and dividends paid by the securities and to participate in any changes in their market value. The Fund requires the borrowers of the securities to maintain collateral with the Fund in the form of cash and/or government securities equal to 102 percent of the value of domestic securities and 105 percent of the value of foreign denominated securities on loan. The Fund may invest the cash collateral in Daily Assets Fund Institutional, an affiliated money market fund. The Fund receives compensation for lending its securities either in the form of fees or by earning interest on invested cash collateral net fees paid to the lending agent. Either the Fund or the borrower may terminate the loan. The Fund is subject to all investment risks associated with the value of any cash collateral received, including, but not limited to, interest rate, credit and liquidity risk associated with such investments.
When-Issued/Delayed Delivery Securities. The Fund may purchase securities with delivery or payment to occur at a later date beyond the normal settlement period. At the time the Fund enters into a commitment to purchase a security, the transaction is recorded and the value of the security is reflected in the net asset value. The price of such security and the date when the security will be delivered and paid for are fixed at the time the transaction is negotiated. The value of the security may vary with market fluctuations. No interest accrues to the Fund until payment takes place. At the time the Fund enters into this type of transaction it is required to segregate cash or other liquid assets at least equal to the amount of the commitment.
Certain risks may arise upon entering when-issued or delayed delivery securities from the potential inability of counterparties to meet the terms of their contracts or if the issuer does not issue the securities due to political, economic, or other factors. Additionally, losses may arise due to changes in the value of the underlying securities.
25
Table of Contents
Federal Income Taxes. The Fund’s policy is to comply with the requirements of the Internal Revenue Code, as amended, which are applicable to regulated investment companies and to distribute all of its taxable income to its shareholders. Accordingly, the Fund paid no federal income taxes and no federal income tax provision was required.
At December 31, 2003 the Fund had a net tax basis capital loss carryforward of approximately $124,897,000 which may be applied against any realized net taxable capital gains of each succeeding year until fully utilized or until December 31, 2009 ($76,067,000), December 31, 2010 ($261,000) and December 31, 2011 ($48,569,000), the respective expiration dates, whichever occurs first.
Distribution of Income and Gains. Distributions of net investment income, if any, are made quarterly. Net realized gains from investment transactions, in excess of available capital loss carryforwards, would be taxable to the Fund if not distributed, and, therefore, will be distributed to shareholders at least annually.
The timing and characterization of certain income and capital gains distributions are determined annually in accordance with federal tax regulations which may differ from accounting principles generally accepted in the United States of America. These differences primarily relate to premium amortization on debt securities and certain securities sold at a loss. As a result, net investment income (loss) and net realized gain (loss) on investment transactions for a reporting period may differ significantly from distributions during such period. Accordingly, the Fund may periodically make reclassifications among certain of its capital accounts without impacting the net asset value of the Fund.
The tax character of current year distributions will be determined at the end of the fiscal year.
Other. Investment transactions are accounted for on a trade date plus one basis for daily net asset value calculations. However, for financial reporting purposes, investment security transactions are reported on trade date. Interest income is recorded on the accrual basis. Dividend income is recorded on the ex-dividend date. Realized gains and losses from investment transactions are recorded on an identified cost basis. All premiums and discounts are amortized/accreted for financial reporting purposes.
B. Purchases and Sales of Securities
During the six months ended June 30, 2004, purchases and sales of investment securities (excluding short-term investments, US Treasury obligations and mortgage dollar rolls) aggregated $191,858,959 and $225,258,675, respectively. Purchases and sales of US Treasury obligations aggregated $142,864,118 and $133,744,846, respectively. Purchases and sales of mortgage dollar rolls aggregated $26,449,126 and $31,531,605, respectively.
C. Related Parties
Management Agreement. Under the Management Agreement with Deutsche Investment Management Inc. (“DeIM” or the “Advisor”), the Advisor directs the investments of the Fund in accordance with its investment objectives, policies and restrictions. The Advisor determines the securities, instruments and other contracts relating to investments to be purchased, sold or entered into by the Fund. In addition to portfolio management services, the Advisor provides certain administrative services in accordance with the Management Agreement. The management fee payable under the Management Agreement is equal to an annual rate of 0.47% of the first $1,500,000,000 of the Fund’s average daily net assets, 0.445% of the next $500,000,000 of such net assets and 0.42% of such net assets in excess of $2,000,000,000, computed and accrued daily and payable monthly. Accordingly, for the six months ended June 30, 2004, the fee pursuant to the Management Agreement was equivalent to an annualized effective rate of 0.47% of the Fund’s average daily net assets.
26
Table of Contents
For the six months ended June 30, 2004, the Advisor had agreed to reimburse the Fund an additional $2,018 for expenses.
Administrative Fee. Under the Administrative Agreement (the “Administrative Agreement”), the Advisor provided or paid others to provide substantially all of the administrative services required by each class of the Fund (other than those provided by the Advisor under its Management Agreement with the Fund, as described above) in exchange for the payment by each class of the Fund of an administrative services fee (the “Administrative Fee”) of 0.445% of the average daily net assets for each class computed and accrued daily and payable monthly.
The Administrative Agreement between the Advisor and the Fund terminated March 31, 2004 and effective April 1, 2004, the Fund directly bears the cost of those expenses formerly covered under the Administrative Agreement.
For the period January 1, 2004 through March 31, 2004, the Administrative Fee was as follows:
Administrative Fee | Total Aggregated | ||
Class AARP | $ | 374,800 | |
Class S | 413,441 | ||
| $ | 788,241 | ||
Effective October 1, 2003 through September 30, 2005, the Advisor has contractually agreed to waive all or a portion of its management fee and/or administrative fee and reimburse or pay certain operating expenses of the Fund to the extent necessary to maintain the operating expenses of each class at 0.915% of average daily net assets for Class S and AARP shares (excluding certain expenses such as extraordinary expenses, taxes, brokerage, interest, Rule 12b-1 distribution and/or service fees, trustee and trustee counsel fees, and organizational and offering expenses).
Service Provider Fees. Scudder Service Corporation (“SSC”), a subsidiary of the Advisor, is the transfer, dividend-paying agent and shareholder service agent for Class AARP and S shares of the Fund. Pursuant to a sub-transfer agency agreement between SSC and DST Systems, Inc. (“DST”), SSC has delegated certain transfer agent and dividend-paying agent functions to DST. The costs and expenses of such delegation are borne by SSC, not by the Fund. For the period April 1, 2004 through June 30, 2004, the amounts charged to the Fund by SSC were as follows:
Services to Shareholders | Total Aggregated | Unpaid at June 30, 2004 | ||||
Class AARP | 186,274 | 186,274 | ||||
Class S | 241,244 | 241,244 | ||||
| $ | 427,518 | $ | 427,518 | |||
Scudder Fund Accounting Corporation (“SFAC”), an affiliate of the Advisor, is responsible for computing the daily net asset value per share and maintaining the portfolio and general accounting records of the Fund. SFAC has retained State Street Bank and Trust Company to provide certain administrative, fund accounting and record-keeping services to the Fund. For the period April 1, 2004 through June 30, 2004, the amount charged to the Fund by SFAC for accounting services aggregated $33,670, of which all is unpaid at June 30, 2004.
27
Table of Contents
Prior to April 1, 2004, the service provider fees outlined above were paid by the Advisor in accordance with the Administrative Agreement.
Trustees’ Fees and Expenses. The Trust pays each Trustee not affiliated with the Advisor retainer fees plus specified amounts for attended board and committee meetings.
Scudder Cash Management QP Trust. Pursuant to an Exemptive Order issued by the SEC, the Fund may invest in the Scudder Cash Management QP Trust (the “QP Trust”) and other affiliated funds managed by the Advisor. The QP Trust seeks to provide as high a level of current income as is consistent with the preservation of capital and the maintenance of liquidity. The QP Trust does not pay the Advisor a management fee for the affiliated funds’ investments in the QP Trust.
Other Related Parties. AARP through its affiliate, AARP Services, Inc., monitors and oversees the AARP Investment Program from Scudder Investments, but does not act as an investment advisor or recommend specific mutual funds. DeIM has agreed to pay a fee to AARP and/or its affiliates in return for the use of the AARP trademark and services relating to investments by AARP members in AARP Class shares of the Fund. This fee is calculated on a daily basis as a percentage of the combined net assets of the AARP classes of all funds managed by DeIM. The fee rates, which decrease as the aggregate net assets of the AARP classes become larger, are as follows: 0.07% for the first $6 billion of net assets, 0.06% for the next $10 billion and 0.05% thereafter. These amounts are used for the general purposes of AARP and its members.
D. Expense Off-Set Arrangement
The Fund has entered into an arrangement with its custodian whereby credits realized as a result of uninvested cash balances were used to reduce a portion of the Fund’s custodian expenses. For the six months ended June 30, 2004, the custodian fee was reduced by $393 for custodian credits earned.
E. Line of Credit
The Fund and several other affiliated Funds (the “Participants”) share in a $1.25 billion revolving credit facility administered by J.P. Morgan Chase Bank for temporary or emergency purposes, including the meeting of redemption requests that otherwise might require the untimely disposition of securities. The Participants are charged an annual commitment fee which is allocated, based upon net assets, among each of the Participants. Interest is calculated at the Federal Funds Rate plus 0.5 percent. The Fund may borrow up to a maximum of 33 percent of its net assets under the agreement.
28
Table of Contents
F. Share Transactions
The following table summarizes share and dollar activity in the Fund:
Six Months Ended June 30, 2004 | Year Ended December 31, 2003 | |||||||||||||
| Shares | Dollars | Shares | Dollars | |||||||||||
Shares sold | ||||||||||||||
Class AARP | 949,837 | $ | 16,169,142 | 1,750,855 | $ | 27,620,758 | ||||||||
Class S | 4,105,697 | 69,380,302 | 5,717,330 | 86,686,523 | ||||||||||
| $ | 85,549,444 | $ | 114,307,281 | |||||||||||
Shares issued to shareholders in reinvestment of distributions | ||||||||||||||
Class AARP | 146,688 | $ | 2,472,359 | 278,776 | $ | 4,362,324 | ||||||||
Class S | 181,815 | 3,058,094 | 385,324 | 6,024,676 | ||||||||||
| $ | 5,530,453 | $ | 10,387,000 | |||||||||||
Shares redeemed | ||||||||||||||
Class AARP | (1,316,937 | ) | $ | (22,403,069 | ) | (2,747,069 | ) | $ | (42,331,462 | ) | ||||
Class S | (5,342,895 | ) | (89,961,140 | ) | (8,372,675 | ) | (128,371,577 | ) | ||||||
| $ | (112,364,209 | ) | $ | (170,703,039 | ) | |||||||||
Net increase (decrease) | ||||||||||||||
Class AARP | (220,412 | ) | $ | (3,761,568 | ) | (717,438 | ) | $ | (10,348,380 | ) | ||||
Class S | (1,055,383 | ) | (17,522,744 | ) | (2,270,021 | ) | (35,660,378 | ) | ||||||
| $ | (21,284,312 | ) | $ | (46,008,758 | ) | |||||||||
G. Ownership of the Fund
At June 30, 2004, one shareholder held approximately 36% of the outstanding shares of the Fund.
H. Regulatory Matters and Litigation
Since at least July 2003, federal, state and industry regulators have been conducting ongoing inquiries and investigations (“inquiries”) into the mutual fund industry, and have requested information from numerous mutual fund companies, including Scudder Investments. We are unable to determine what the outcome of these inquiries will be or what the effect, if any, would be on the funds or their advisors. Publicity about mutual fund practices arising from these industry-wide inquiries serves as the general basis of a number of private lawsuits against the Scudder funds. These lawsuits, which previously have been reported in the press, involve purported class action and derivative lawsuits, making various allegations and naming as defendants various persons, including certain Scudder funds, Deutsche Asset Management (“DeAM”) and its affiliates, certain individuals, including in some cases Fund Trustees/Directors, and other parties. DeAM has undertaken to bear all liabilities and expenses incurred by the Scudder funds in connection with these lawsuits, or other lawsuits or regulatory actions that may be filed making allegations similar to these lawsuits regarding fund valuation, market timing, revenue sharing or other subjects of the pending inquiries. Based on currently available information, DeAM believes the likelihood that the pending lawsuits will have a material adverse financial impact on a Scudder fund is remote and such actions are not likely to materially affect its ability to perform under its investment management agreements with the Scudder funds.
29
Table of Contents
| AARP Investment Program Shareholders | Scudder Class S Shareholders | |||
Automated Information Lines | Easy-Access Line
(800) 631-4636 | SAIL™
(800) 343-2890 | ||
| Personalized account information, the ability to exchange or redeem shares, and information on other Scudder funds and services via touchtone telephone. | ||||
| Web Sites | aarp.scudder.com | myScudder.com | ||
| View your account transactions and balances, trade shares, monitor your asset allocation, and change your address, 24 hours a day. Obtain prospectuses and applications, blank forms, interactive worksheets, news about Scudder funds, subscription to fund updates by e-mail, retirement planning information, and more. | ||||
For More Information | (800) 253-2277
To speak with an AARP Investment Program service representative | (800) SCUDDER
To speak with a Scudder service representative. | ||
Written Correspondence | AARP Investment Program from Scudder Investments
PO Box 219735 Kansas City, MO 64121-9735 | Scudder Investments
PO Box 219669 Kansas City, MO 64121-9669 | ||
| Proxy Voting | A description of the fund’s policies and procedures for voting proxies for portfolio securities and information about how the fund voted proxies related to its portfolio securities during the 12-month period ended June 30 is available on our Web sites - aarp.scudder.com or myScudder.com (type “proxy voting” in the search field) - or on the SEC’s Web site - www.sec.gov. To obtain a written copy of the fund’s policies and procedures without charge, upon request, call your service representative. | |||
Principal Underwriter | If you have questions, comments or complaints, contact:
Scudder Distributors, Inc.
222 South Riverside Plaza Chicago, IL 60606-5808(800) 621-1148 | |||
| Class AARP | Class S | |||
| Nasdaq Symbol | ABLNX | SCBAX | ||
| Fund Number | 162 | 062 | ||
30
Table of Contents
This privacy statement is issued by Deutsche Investment Management Americas Inc., Deutsche Asset Management, Inc., Scudder Distributors, Inc., Scudder Investor Services, Inc., Scudder Trust Company and the Scudder Funds.
We never sell customer lists or individual client information. We consider privacy fundamental to our client relationships and adhere to the policies and practices described below to protect current and former clients’ information. Internal policies are in place to protect confidentiality, while allowing client needs to be served. Only individuals who need to do so in carrying out their job responsibilities may access client information. We maintain physical, electronic and procedural safeguards that comply with federal standards to protect confidentiality. These safeguards extend to all forms of interaction with us, including the Internet.
In the normal course of business, clients give us nonpublic personal information on applications and other forms, on our websites, and through transactions with us or our affiliates. Examples of the nonpublic personal information collected are name, address, Social Security number and transaction and balance information. To be able to serve our clients, certain of this client information is shared with affiliated and nonaffiliated third party service providers such as transfer agents, custodians, and broker-dealers to assist us in processing transactions and servicing your account with us. In addition, we may disclose all of the information we collect to companies that perform marketing services on our behalf or to other financial institutions with which we have joint marketing agreements. The organizations described above that receive client information may only use it for the purpose designated by the Scudder Companies listed above.
We may also disclose nonpublic personal information about you to other parties as required or permitted by law. For example, we are required or we may provide information to government entities or regulatory bodies in response to requests for information or subpoenas, to private litigants in certain circumstances, to law enforcement authorities, or any time we believe it necessary to protect the firm.
For AARP shareholders only: Certain investors in the AARP Investment Program are advised that limited nonpublic personal information is shared with AARP and its subsidiary AARP Services Inc. (ASI). This includes an investor’s status as a current or former Program participant, name, address, and type of account maintained (i.e. IRA or non-IRA). This information must be shared so that ASI can provide quality control services, such as monitoring satisfaction with the Program. However, AARP and ASI may also use this information for other purposes such as member research, and may share this information with other AARP providers to inform members of AARP benefits and services. Shareholders residing in states with certain state specific privacy restrictions are excluded from this information sharing. All other shareholders may instruct us in writing not to share information regarding themselves or joint account holders with AARP or ASI for any purposes unrelated to the AARP Investment Program. With respect to accounts that are jointly held, an opt-out request received from any of the joint account holders will be applied to the entire account.
Questions on this policy may be sent to:
For Class AARP:
AARP Investment Program, Attention: Correspondence,
P.O. Box 219735, Kansas City, MO 64121-9735
For Class S:
Scudder Investments, Attention: Correspondence,
P.O. Box 219669, Kansas City, MO 64121-9669
August 2003
31
Table of Contents
SIGNATURES
Pursuant to the requirements of the Securities Exchange Act of 1934 and the Investment Company Act of 1940, the registrant has duly caused this report to be signed on its behalf by the undersigned, thereunto duly authorized.
Registrant: | Scudder Balanced Fund | |||||||
| By: | /s/ Julian Sluyters | |||||||
Julian Sluyters | ||||||||
Chief Executive Officer | ||||||||
Date: | August 23, 2004 | |||||||
Pursuant to the requirements of the Securities Exchange Act of 1934 and the Investment Company Act of 1940, this report has been signed below by the following persons on behalf of the registrant and in the capacities and on the dates indicated.
Registrant: | Scudder Balanced Fund | |||||||
By: | /s/ Julian Sluyters | |||||||
Julian Sluyters | ||||||||
Chief Executive Officer | ||||||||
Date: | August 23, 2004 | |||||||
By: | Charles A. Rizzo | |||||||
/s/ Charles A. Rizzo | ||||||||
Chief Financial Officer | ||||||||
Date: | August 23, 2004 | |||||||
32
Table of Contents
SCUDDER TOTAL RETURN FUND
PART C – OTHER INFORMATION
Item 15. Indemnification.
Article VIII of the Registrant’s Agreement and Declaration of Trust (Exhibit (1)(a) hereto, which is incorporated herein by reference) provides in effect that the Registrant will indemnify its officers and trustees under certain circumstances. However, in accordance with Section 17(h) and 17(i) of the Investment Company Act of 1940 and its own terms, said Article of the Agreement and Declaration of Trust does not protect any person against any liability to the Registrant or its shareholders to which such Trustee would otherwise be subject by reason of willful misfeasance, bad faith, gross negligence, or reckless disregard of the duties involved in the conduct of his or her office.
Each of the trustees who is not an “interested person” (as defined under the Investment Company Act of 1940) of Registrant (a “Non-interested Trustee”) has entered into an indemnification agreement with Registrant, which agreement provides that the Registrant shall indemnify the Non-interested Trustee against certain liabilities which such Trustee may incur while acting in the capacity as a trustee, officer or employee of the Registrant to the fullest extent permitted by law, now or in the future, and requires indemnification and advancement of expenses unless prohibited by law. The indemnification agreement cannot be altered without the consent of the Non-interested Trustee and is not affected by amendment of the Agreement and Declaration of Trust. In addition, the indemnification agreement adopts certain presumptions and procedures which may make the process of indemnification and advancement of expenses more timely, efficient and certain. In accordance with Section 17(h) of the Investment Company Act of 1940, the indemnification agreement does not protect a Non-interested Trustee against any liability to the Registrant or its shareholders to which such Trustee would otherwise be subject by reason of willful misfeasance, bad faith, gross negligence, or reckless disregard of the duties involved in the conduct of his or her office.
The Registrant has purchased insurance policies insuring its officers and trustees against certain liabilities which such officers and trustees may incur while acting in such capacities and providing reimbursement to the Registrant for sums which it may be permitted or required to pay to its officers and trustees by way of indemnification against such liabilities, subject to certain deductibles.
On April 5, 2002, Zurich Scudder Investments, Inc. (“Scudder”), the investment adviser, now known as Deutsche Investment Management Americas Inc. (“DeIM”), was acquired by Deutsche Bank AG, not including certain U.K. Operations (the “Transaction”). In connection with the Trustees’ evaluation of the Transaction, Deutsche Bank agreed to indemnify, defend and hold harmless Registrant and the trustees who were not “interested persons” of Scudder, Deutsche Bank or Registrant (the “Independent Trustees”) for and against any liability and claims and expenses based upon or arising from, whether in whole or in part, or directly or indirectly, any untrue statement or alleged untrue statement of a material fact made to the Independent Trustees by Deutsche Bank in connection with the Independent Trustees’ consideration of the Transaction, or any omission or alleged omission of a material fact necessary in order to make statements made, in light of the circumstances under which they were made, not misleading.
C-1
Table of Contents
DeIM, the investment advisor, has agreed, subject to applicable law and regulation, to indemnify and hold harmless the Registrant against any loss, damage, liability and expense, including, without limitation, the advancement and payment, as incurred, of reasonable fees and expenses of counsel (including counsel to the Registrant and counsel to the Non-interested Trustees) and consultants, whether retained by the Registrant or the Non-interested Trustees, and other customary costs and expenses incurred by the Registrant in connection with any litigation or regulatory action related to possible improper market timing or other improper trading activity or possible improper marketing and sales activity in the Registrant (“Private Litigation and Enforcement Actions.”). In the event that this indemnification is unavailable to the Registrant for any reason, then DeIM has agreed to contribute to the amount paid or payable by the Registrant as a result of any loss, damage, liability or expense in such proportion as is appropriate to reflect the relative fault of DeIM and the Registrant with respect to the matters which resulted in such loss, damage, liability or expense, as well as any other relevant equitable considerations; provided; however, if no final determination is made in such action or proceeding as to the relative fault of DeIM and the Registrant, then DeIM shall pay the entire amount of such loss, damage, liability or expense.
In recognition of its undertaking to indemnify the Registrant, DeIM has also agreed, subject to applicable law and regulation, to indemnify and hold harmless each of the Non-interested Trustees against any and all loss, damage, liability and expense, including without limitation the advancement and payment as incurred of reasonable fees and expenses of counsel and consultants, and other customary costs and expenses incurred by the Non-interested Trustees, arising from the Private Litigation and Enforcement, including without limitation:
| 1. | all reasonable legal and other expenses incurred by the Non-interested Trustees in connection with the Private Litigation and Enforcement Actions, and any actions that may be threatened or commenced in the future by any person (including any governmental authority), arising from or similar to the matters alleged in the Private Litigation and Enforcement Actions, including without limitation expenses related to the defense of, service as a witness in, or monitoring of such proceedings or actions; |
| 2. | all liabilities and expenses incurred by any Non-interested Trustee in connection with any judgment resulting from, or settlement of, any such proceeding, action or matter; |
| 3. | any loss or expense incurred by any Non-interested Trustee as a result of the denial of, or dispute about, any insurance claim under, or actual or purported rescission or termination of, any policy of insurance arranged by DeIM (or by a representative of DeIM acting as such, acting as a representative of the Registrant or of the Non-interested Trustee or acting otherwise) for the benefit of the Non-interested Trustee, to the extent that such denial, dispute or rescission is based in whole or in part upon any alleged misrepresentation made in the application for such policy or any other alleged improper conduct on the part of DeIM, any of its corporate affiliates, or any of their directors, officers or employees; |
| 4. | any loss or expense incurred by any Non-interested Trustee, whether or not such loss or expense is otherwise covered under the terms of a policy of insurance, but for which the Non-interested Trustee is unable to obtain advancement of expenses or indemnification under that policy of insurance, due to the exhaustion of policy limits which is due in whole or in part to DeIM or any affiliates thereof having received advancement of expenses or indemnification under that policy for or with respect to a matter which is the subject of the indemnification agreement; provided, however, the total amount which DeIM will be obligated to pay under this provision for all loss or expense, will not exceed the amount that DeIM and any of its affiliate actually receive under that policy or insurance for or with respect to a matter which is the subject of the indemnification agreement; and |
| 5. | all liabilities and expenses incurred by any Non-interested Trustee in connection with any proceeding or action to enforce his or her rights under the agreement, unless DeIM prevails on the merits of any such dispute in a final, nonappealable court order. |
C-2
Table of Contents
DeIM is not required to pay costs or expenses or provide indemnification to or for any individual Non-interested Trustee (i) with respect to any particular proceeding or action as to which the Board of the Registrant has determined that such Non-interested Trustee ultimately will not be entitled to indemnification with respect thereto, or (ii) for any liability of the Non-interested Trustee to the Registrant or its shareholders to which such Non-interested Trustee would otherwise be subject by reason of willful misfeasance, bad faith, gross negligence, or reckless disregard of the Non-interested Trustee’s duties as a Trustee of the Registrant as determined in a final adjudication in such proceeding or action. In addition, to the extent that DeIM has paid costs or expenses under the agreement to any individual Non-interested Trustee with respect to a particular proceeding or action, and there is a final adjudication in such proceeding or action of the Non-interested Trustee’s liability to the Registrant or its shareholders by reason of willful misfeasance, bad faith, gross negligence, or reckless disregard of the Non-interested Trustee’s duties as a Trustee of the Registrant, such Non-interested Trustee has undertaken to repay such costs or expenses to DeIM.
| Item 16. Exhibits. | ||||||
Exhibit 1 | (a) | Amended and Restated Agreement and Declaration of Trust. (Incorporated by reference to Post-Effective Amendment No. 49 to Registrant’s Registration Statement on Form N-1A which was filed on January 30, 1996.) | ||||
| (b) | Certificate of Amendment of Declaration of Trust dated November 29, 2000. (Incorporated by reference to Post-Effective Amendment No. 58 to Registrant’s Registration Statement on Form N-1A.) | |||||
Exhibit 2 | (a) | By-laws. (Incorporated by reference to Post-Effective Amendment No. 49 to Registrant’s Registration Statement on Form N-1A.) | ||||
| (b) | Amendment to the By-laws. (Incorporated by reference to Post-Effective Amendment No. 57 to Registrant’s Registration Statement on Form N-1A.) | |||||
| (c) | Amendment to the By-laws, dated January 9, 2004. (Incorporated by reference to Post-Effective Amendment No. 62 to the Registrant’s Registration Statement on Form N-1A.) | |||||
| (d) | Amendment to the By-laws, dated September 24, 2004, to be filed by amendment to Registrant’s Registration Statement on Form N-1A. | |||||
Exhibit 3 | Not Applicable. | |||||
Exhibit 4 | Form of Agreement and Plan of Reorganization is filed herein as Exhibit A to Part A of this Registration Statement on Form N-14. | |||||
Exhibit 5 | (a) | Text of Share Certificate. (Incorporated by reference to Post-Effective Amendment No. 49 to the Registrant’s Registration Statement on Form N-1A.) | ||||
| (b) | Written Instrument Establishing and Designating Separate Classes of Shares dated May 27, 1994. (Incorporated by reference to Post-Effective Amendment No. 49 to the Registrant’s Registration Statement on Form N-1A.) | |||||
| (c) | Amended and Restated Written Instrument Establishing and Designating Separate Classes of Shares dated March 9, 1996. (Incorporated by reference to Post-Effective Amendment No. 50 to the Registrant’s Registration Statement on Form N-1A.) | |||||
| (d) | Amended and Restated Written Instrument Establishing and Designating Separate Classes of Shares dated May 14, 2003. (Incorporated by reference to Post-Effective Amendment No. 61 to the Registrant’s Registration Statement on Form N-1A.) | |||||
C-3
Table of Contents
| (e) | Amended and Restated Written Instrument Establishing and Designating Separate Classes of Shares dated , 2004, to be filed by amendment to Registrant’s Registration Statement on Form N-1A. | |||||
Exhibit 6 | Investment Management Agreement between the Registrant and Deutsche Investment Management Americas Inc. dated April 5, 2002. (Incorporated by reference to Post-Effective Amendment No. 59 to the Registrant’s Registration Statement on Form N-1A.) | |||||
Exhibit 7 | (a) | Underwriting and Distributions Services Agreement between the Registrant and Kemper Distributors, Inc., dated April 5, 2002. (Incorporated by reference to Post-Effective Amendment No. 59 to the Registrant’s Registration Statement on Form N-1A.) | ||||
| (b) | Underwriting Agreement between the Registrant and Scudder Distributors Inc., on behalf of Class S and Class AARP of the Fund, to be filed by amendment to Registrant’s Registration Statement on Form N-1A. | |||||
Exhibit 8 | Not Applicable. | |||||
Exhibit 9 | (a) | Foreign Custody Agreement between the Registrant, on behalf of Scudder Total Return Fund, and The Chase Manhattan Bank. (Incorporated by reference to Post-Effective Amendment No. 49 to Registrant’s Registration Statement on Form N-1A.) | ||||
| (b) | Custodian Agreement between the Registrant and Investors Fiduciary Trust Company. (Incorporated by reference to Post-Effective Amendment No. 49 to Registrant’s Registration Statement on Form N-1A.) | |||||
| (c) | Amendment to Custody Contract dated July 2, 2001 between the Registrant and State Street Bank and Trust Company. (Incorporated by reference to Post-Effective Amendment No. 58 to Registrant’s Registration Statement on Form N-1A.) | |||||
Exhibit 10 | (a) | Rule 12b-1 Plan between Scudder Total Return Fund (Class A Shares) and Scudder Distributors, Inc. dated July 1, 2001. (Incorporated by reference to Post-Effective Amendment No. 58 to Registrant’s Registration Statement on Form N-1A.) | ||||
| (b) | Amended and Restated Rule 12b-1 Plan between Scudder Total Return Fund (Class B Shares) and Scudder Distributors, Inc. dated July 1, 2001. (Incorporated by reference to Post-Effective Amendment No. 58 to Registrant’s Registration Statement on Form N-1A.) | |||||
| (c) | Amended and Restated Rule 12b-1 Plan between Scudder Total Return Fund (Class C Shares) and Scudder Distributors, Inc. dated July 1, 2001. (Incorporated by reference to Post-Effective Amendment No. 58 to Registrant’s Registration Statement on Form N-1A.) | |||||
| (d) | Shareholder Services Agreement for Class A, Class B and Class C dated April 5, 2002 between Scudder Total Return Fund and Scudder Distributors, Inc. (Incorporated by reference to Post-Effective Amendment No. 59 to the Registrant’s Registration Statement on Form N-1A.) | |||||
| (e) | Amended and Restated Rule 12b-1 Plan between Scudder Total Return Fund (Class R shares) and Scudder Distributors, Inc. dated October 1, 2003. (Incorporated by reference to Post-Effective Amendment No. 61 to the Registrant’s Registration Statement on Form N-1A.) | |||||
C-4
Table of Contents
| (f) | Rule 18f-3 Plan. (Incorporated by reference to Post-Effective Amendment No. 50 to Registrant’s Registration Statement on Form N-1A.) | |||||
| (g) | Amended and Restated 18f-3 Plan dated July 1, 2001. (Incorporated by reference to Post-Effective Amendment No. 58 to Registrant’s Registration Statement on Form N-1A.) | |||||
| (h) | Amended and Restated Multi-Distribution System Plan (Rule 18f-3 Plan), dated November 20, 2002. (Incorporated by reference to Post-Effective Amendment No. 59 to the Registrant’s Registration Statement on Form N-1A.) | |||||
| (i) | Amended and Restated Multi-Distribution System Plan (Rule 18f-3 Plan), dated , 2004, to be filed by amendment to Registrant’s Registration Statement on Form N-1A. | |||||
Exhibit 11 | Opinion and Consent of Vedder, Price, Kaufman & Kammholz, P.C. to be filed by amendment. | |||||
Exhibit 12 | Form of Tax Opinion and Consent of Willkie Farr & Gallagher LLP to be filed by amendment. | |||||
Exhibit 13 | (a) | Agency Agreement. (Incorporated by reference to Post-Effective Amendment No. 49 to Registrant’s Registration Statement on Form N-1A.) | ||||
| (b) | Supplement to Agency Agreement between Registrant and Investors Fiduciary Trust Company dated June 1, 1997. (Incorporated by reference to Post-Effective Amendment No. 51 to the Registrant’s Registration Statement on Form N-1A.) | |||||
| (c) | Supplement to Agency Agreement dated January, 1 1999. (Incorporated by reference to Post-Effective Amendment No. 57 to Registrant’s Registration Statement on Form N-1A.) | |||||
| (d) | Transfer Agency and Service Agreement and the amendments thereto between the Registrant and Scudder Service Corporation, on behalf of Class S and Class AARP Shares of the Fund, to be filed by amendment to Registrant’s Registration Statement on Form N-1A. | |||||
| (e) | Administrative Services Agreement with Zurich Scudder Investments, Inc., dated July 1, 2001. (Incorporated by reference to Post-Effective Amendment No. 58 to Registrant’s Registration Statement on Form N-1A.) | |||||
| (f) | Fund Accounting Agreement between the Registrant and Scudder Fund Accounting Corporation dated December 31, 1997. (Incorporated by reference to Post-Effective Amendment No. 51 to the Registrant’s Registration Statement on Form N-1A.) | |||||
| (g) | First Amendment to Fund Accounting Services Agreement between the Registrant and Scudder Fund Accounting Corporation dated March 19, 2003. (Incorporated by reference to Post-Effective Amendment No. 62 to the Registrant’s Registration Statement on Form N-1A.) | |||||
| (h) | Letters of Indemnity, dated September 10, 2004 (Incorporated by reference to Post-Effective Amendment No. 63 to the Registrant’s Registration Statement on Form N-1A). | |||||
Exhibit 14 | (a) | Consent of Ernst & Young LLP to be filed by amendment. | ||||
| (b) | Consent of PricewaterhouseCoopers LLP to be filed by amendment. | |||||
C-5
Table of Contents
Exhibit 15 | Not Applicable. | |||||
Exhibit 16 | Powers of Attorney are filed herein. | |||||
Exhibit 17 | Form of Proxy is filed herein and appears following Part A of this Registration Statement on Form N-14. | |||||
Item 17. Undertakings.
(1) The undersigned registrant agrees that prior to any public reoffering of the securities registered through the use of a prospectus which is a part of this registration statement by any person or party who is deemed to be an underwriter within the meaning of Rule 145(c) of the Securities Act, the reoffering prospectus will contain the information called for by the applicable registration form for reofferings by persons who may be deemed underwriters, in addition to the information called for by the other items of the applicable form.
(2) The undersigned registrant agrees that every prospectus that is filed under paragraph (1) above will be filed as a part of an amendment to the registration statement and will not be used until the amendment is effective, and that, in determining any liability under the 1933 Act, each post-effective amendment shall be deemed to be a new registration statement for the securities offered therein, and the offering of the securities at that time shall be deemed to be the initial bona fide offering of them.
C-6
Table of Contents
SIGNATURES
As required by the Securities Act of 1933, this Registration Statement has been signed on behalf of the registrant, in the City of New York, and State of New York, on the 15th day of November, 2004.
| SCUDDER TOTAL RETURN FUND | ||
| By: | /s/ Julian F. Sluyters | |
Julian F. Sluyters Chief Executive Officer | ||
As required by the Securities Act of 1933, this Registration Statement has been signed below by the following persons in the capacities and on the dates indicated.
Signature | Title | Date | ||
/s/ Julian F. Sluyters Julian F. Sluyters | Chief Executive Officer | November 15, 2004 | ||
/s/ Paul Schubert Paul Schubert | Chief Financial Officer and Principal Accounting Officer | November 15, 2004 | ||
John W. Ballantine * John W. Ballantine | Trustee | November 15, 2004 | ||
Lewis A. Burnham * Lewis A. Burnham | Trustee | November 15, 2004 | ||
Donald L. Dunaway * Donald L. Dunaway | Trustee | November 15, 2004 | ||
James R. Edgar * James R. Edgar | Trustee | November 15, 2004 | ||
Paul K. Freeman * Paul K. Freeman | Trustee | November 15, 2004 | ||
Robert B. Hoffman * Robert B. Hoffman | Trustee | November 15, 2004 | ||
Shirley D. Peterson* Shirley D. Peterson | Trustee | November 15, 2004 | ||
Fred B. Renwick* Fred B. Renwick | Trustee | November 15, 2004 | ||
William N. Shiebler* William N. Shiebler | Trustee | November 15, 2004 | ||
John G. Weithers* John G. Weithers | Trustee | November 15, 2004 | ||
*By | /s/ Caroline Pearson | |
Caroline Pearson** Assistant Secretary | ||
| ** | Attorney-in-fact pursuant to the powers of attorney filed herein. |
Table of Contents
INDEX OF EXHIBITS
| EXHIBIT NUMBER | EXHIBIT TITLE | |
| 16 | Powers of Attorney | |