 Sysco 2Q12 Earnings Results Sysco 2Q12 Earnings Results February 6, 2012 Exhibit 99.1 |
 2 Forward-Looking Statements Certain statements made herein that look forward in time or express management’s expectations or beliefs with respect to the occurrence of future events are forward-looking statements under the Private Securities Litigation Reform Act of 1995. They include statements regarding our guidance for fiscal 2012, including fiscal 2012 estimates with respect to capital spending, capital expenditures and gross expense related to our Business Transformation Project, pension expense and fuel expense. They also include statements regarding our efforts to more effectively leverage our case growth and improve profitability, and our statement that our investments in our business will provide a solid foundation for future growth as the industry continues to improve. These statements involve risks and uncertainties and are based on management's current expectations and estimates actual results may differ materially. Factors impacting these forward-looking statements include the general risks associated with our business, including the risk of interruption of supplies due to lack of long-term contracts, severe weather, work stoppages or otherwise, inflation risks, the impact of fuel prices, and labor issues. Risks and uncertainties also include risks impacting the economy generally, including the risk that the current economic downturn will continue, or that consumer confidence in the economy may not increase and decreases in consumer spending, particularly on food prepared outside the home, may not reverse. Also, there are risks related to our Business Transformation Project, including that the expected costs of our Business Transformation Project in fiscal 2012 may be greater or less than currently expected because we may encounter the need for changes in design or revisions of the project calendar and budget, including the incurrence of expenses at an earlier or later time than currently anticipated; the risk that our business and results of operations may be adversely affected if we experience operating problems, scheduling delays, cost overages or limitations on the extent of the business transformation during the ERP implementation process; and the risk of adverse effects if the ERP system, and the associated process changes, do not prove to be cost effective or result in the cost savings and other benefits that we anticipate. In fiscal 2011, we took additional time to test the underlying ERP system and are taking additional time in fiscal 2012 to improve the underlying systems prior to larger scale development, and these actions have caused a delay in the project; until we reach the point where the underlying system functions as intended, our development timeline is uncertain. Capital expenditures may vary from those projected based on changes in business plans and other factors, including risks related to the implementation of our Business Transformation Project and our regional distribution centers, the timing and successful completions of acquisitions, construction schedules and the possibility that other cash requirements could result in delays or cancellations of capital spending. Pension expense and fuel expense may vary from projections based on performance of plan assets and fluctuations in fuel costs, respectively, both of which are impacted by general economic conditions beyond our control. In the past, increased fuel prices have significantly increased our costs and reduced consumers’ demand for meals served away from home. Our efforts to effectively leverage our case growth and improve profitability, and current investments in our business, such as the Business Transformation Project, may not prove successful or provide the expected benefits in a timely and cost effective manner, if at all. For a discussion of additional factors impacting Sysco’s business, see the Risk Factors contained in Sysco’s Annual Report on Form 10-K for the year ended July 2, 2011, as filed with the Securities and Exchange Commission. Except where otherwise noted, the forward-looking statements contained herein speak as of the date of this Presentation. We do not undertake to update the forward-looking statements contained in this Presentation. |
 Bill DeLaney President & CEO Bill DeLaney President & CEO 3 |
 2Q12 Highlights 2Q12 Highlights 4 Adjusted Reported $ Millions 2Q12 YOY % Change 2Q12 YOY % Change Sales $10,244 9.2% $10,244 9.2% Gross Profit $1,846 4.8% $1,846 4.8% Operating Expenses $1,383 5.5% $1,419 7.1% Operating Income $462 2.5% $427 (2.3%) Net Earnings $272 3.3% $250 (3.1%) EPS $0.46 2.2% $0.43 (2.3%) 1 1 “Adjusted” financial results exclude the impact of COLI and gross business transformation expenses and are Non-GAAP financial measures. See Non-GAAP Reconciliations at the end of this presentation. |
 Arkansas Pilot (April 2011) Second Pilot Launched in Oklahoma (January 2012) Arkansas Enhancements (November 2011) Delivered product Areas of improvement : Performance Order entry Reporting Business Transformation Timeline Business Transformation Timeline 5 Future Waves Additional enhancements |
 Key Takeaways Key Takeaways 6 Improved conditions during the holiday season, combined with aggressive action to support our customers resulted in stronger case growth during the second quarter We are taking action across the business to more effectively leverage our case growth and improve profitability Sysco’s unique capabilities and the investments we are making in the business provide a solid foundation for future growth as the industry continues to improve |
 Chris Kreidler EVP & CFO Chris Kreidler EVP & CFO 7 |
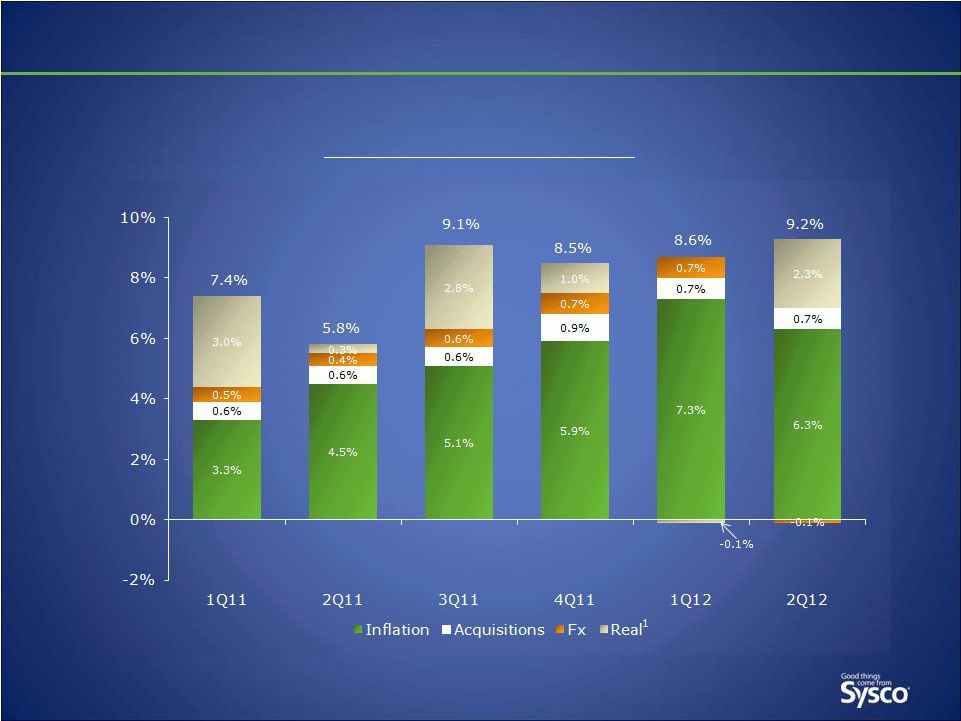 Sales Growth Sales Growth 8 Total Sysco Components of Sales Growth 1 Real growth defined as the nominal change in sales growth less inflation, acquisitions, and foreign exchange |
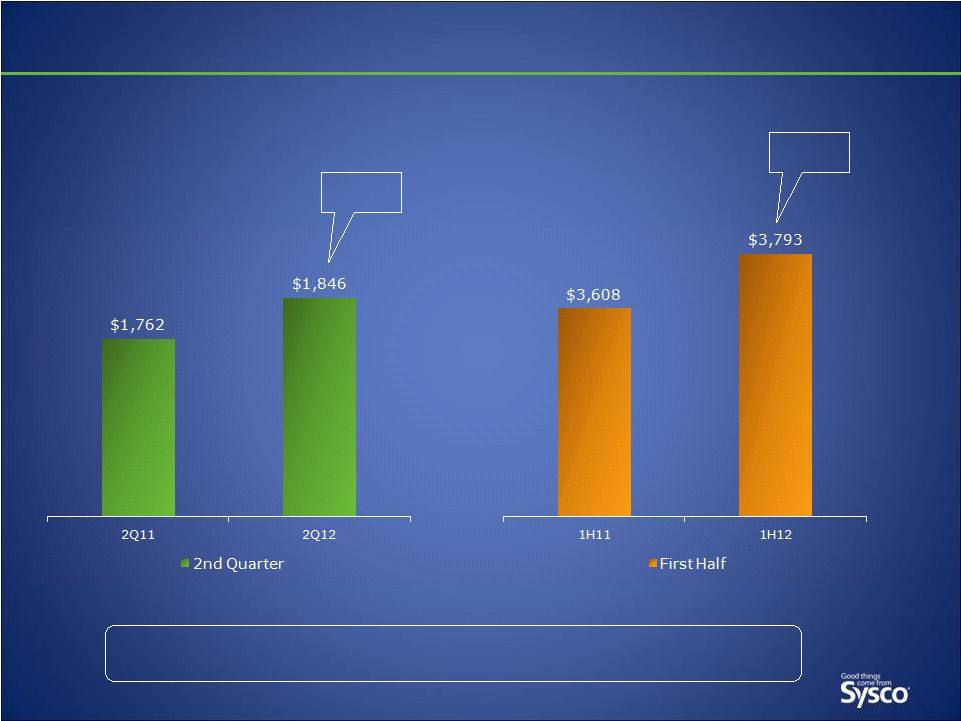 Gross Profit Trend Gross Profit Trend 9 +4.8% YOY ($ in millions) Gross profit per case and per stop also increased +5.1% YOY |
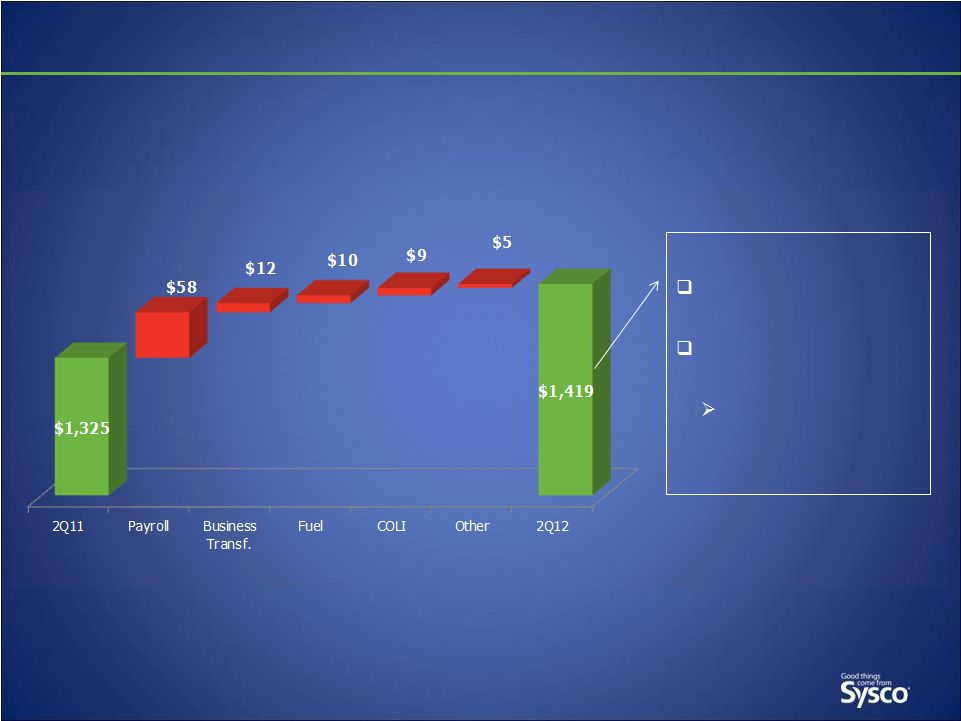 Operating Expenses Operating Expenses 10 (YOY change; $ in millions) 1 See Non-GAAP reconciliations at the end of this presentation. 2Q12 Reported operating expense +7.1% Adjusted 1 operating expense +5.5% Excluding gross business transformation expense and COLI |
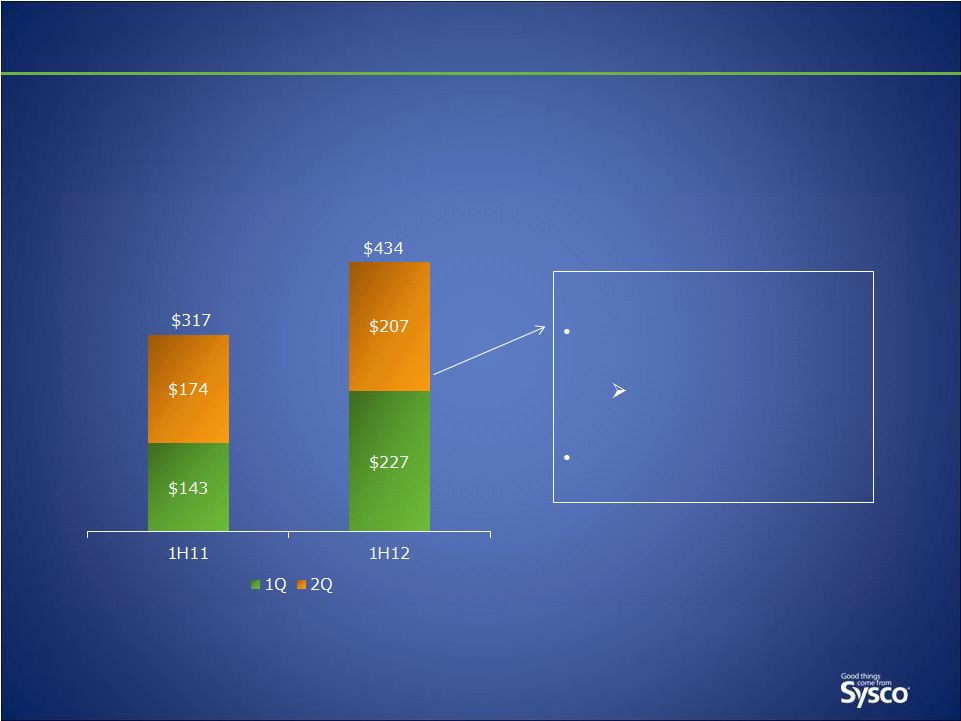
 (in millions) 2Q12 1H12 2Q11 1H11 Operating Expense $36 $73 $24 $46 Capital $33 $79 $51 $104 11 Business Transformation Project Costs Business Transformation Project Costs |
 Adjusted Operating Income Adjusted Operating Income 12 1 Excludes impact of COLI and gross business transformation expenses. See Non-GAAP reconciliations at the end of this presentation. +4.4% YOY 1 ($ in millions) +2.5% YOY 1 $451 $462 2Q11 2Q12 2nd Quarter $965 $1,008 1H11 1H12 First Half |
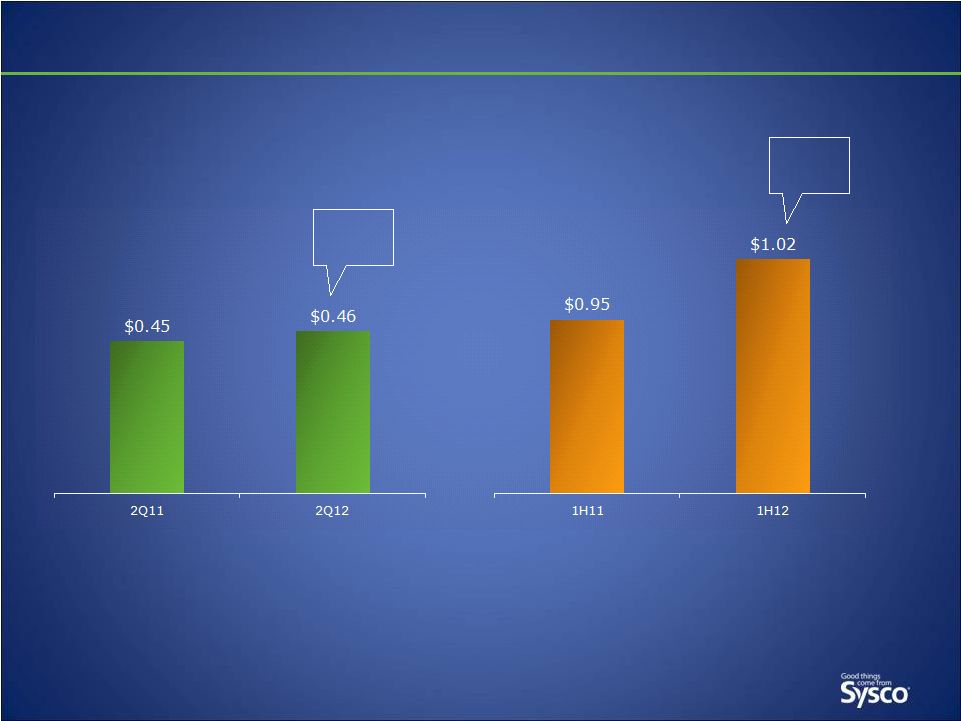 Adjusted EPS Adjusted EPS 13 1 Excludes impact of COLI and gross business transformation expenses. See Non-GAAP reconciliations at the end of this presentation. +2.2% YOY +7.4% YOY |
 First Half Fiscal 2012 Highlights First Half Fiscal 2012 Highlights 14 Adjusted Results 1 Reported $ Millions 1H12 YOY % Change 1H12 YOY % Change Sales $20,831 8.9% $20,831 8.9% Gross Profit $3,793 5.1% $3,793 5.1% Operating Expenses $2,785 5.4% $2,857 7.2% Operating Income $1,008 4.4% $936 (0.7%) EPS $1.02 7.4% $0.94 (1.1%) 1 Excludes impact of COLI and gross business transformation expenses. See Non-GAAP reconciliations at the end of this presentation. |
 Capital Expenditures Capital Expenditures 15 ($ millions) New facilities under construction: Long Island, Boston, Central Texas Expansions underway in several locations 1H12 |
 FY12 Guidance FY12 Guidance 16 Guidance FY12 Prior Guidance Capital spending $700 – 750 million No change Business Transformation CapEx (included in above) $125 – 145 million $100 – 120 million Gross Business Transformation expense $230 – 250 million $250 – 275 million Pension expense $25 million lower than FY11 No change Fuel expense $30 – 40 million higher than FY11 $25 – 35 million higher than FY11 |
 17 |
 Non-GAAP Reconciliations 18 |
 2Q12 & 1H12 Financial Results 2Q12 & 1H12 Financial Results 19 Sysco’s results of operations are impacted by costs from our multi-year Business Transformation Project. Additionally, near the end of fiscal 2011, we reallocated all of our investments in our COLI policies into low-risk, fixed-income securities and therefore we do not expect significant volatility in operating expenses, operating income, net earnings and diluted earnings per share in future periods related to these policies. We experienced significant gains in these policies during fiscal 2011. We do not expect a significant impact on fiscal 2012’s operating income, net earnings and diluted earnings per share in future periods from these policies. Management believes that adjusting its operating expenses, operating income, net earnings and diluted earnings per share to remove the impact of the Business Transformation Project expenses and COLI gains provides an important perspective of underlying business trends and results and provides meaningful supplemental information to both management and investors that is indicative of the performance of the company’s underlying operations and facilitates comparison on a year-over year basis. The company uses these non-GAAP measures when evaluating its financial results as well as for internal planning and forecasting purposes. These financial measures should not be used as a substitute in assessing the company’s results of operations for the 13-week and 26-week periods ending December 31, 2011 and January 1, 2011. An analysis of any non-GAAP financial measure should be used in conjunction with results presented in accordance with GAAP. As a result, in the table below, the results for the second quarter of fiscal 2012 and the second quarter of fiscal 2011 and the first 26 weeks of fiscal 2012 and the first 26 weeks of fiscal 2011 are adjusted to remove expenses related to the Business Transformation Project and gains recorded on the adjustments to the carrying value of COLI policies. Set forth below is a reconciliation of actual operating expenses, operating income, net earnings and diluted earnings per share to adjusted results for these measures for the periods presented: |
 2Q12 Financial Results 2Q12 Financial Results 20 13-Week Period Ended December 31, 2011 GAAP Business Transformation COLI Non-GAAP Operating expenses $ 1,418,652 $ (36,356) $ 985 $ 1,383,281 Operating income 426,998 36,356 (985) 462,369 Net earnings (1) 250,113 22,610 (985) 271,738 Diluted earnings per share $ 0.43 $ 0.03 $ - $ 0.46 13-Week Period Ended January 1, 2011 GAAP Business Transformation COLI Non-GAAP Operating expenses $ 1,324,642 $ (24,224) $10,335 $ 1,310,753 Operating income 437,025 24,224 (10,335) 450,914 Net earnings (1) 258,173 15,244 (10,335) 263,082 Diluted earnings per share $ 0.44 $ 0.03 $ (0.02) $ 0.45 13-Week Period Change in Dollars 13-Week Period % Change GAAP Non-GAAP GAAP Non-GAAP Operating expenses $ 94,010 $ 72,528 7.1% 5.5% Operating income (10,027) 11,455 -2.3% 2.5% Net earnings (8,060) 8,656 -3.1% 3.3% Diluted earnings per share $ (0.01) $ 0.01 -2.3% 2.2% (1) Tax impact of adjustments was $13,746 and $8,980 for the 13-week periods ended December 31, 2011 and January 1, 2011, respectively. |
 1H12 Financial Results 1H12 Financial Results 21 26-Week Period Ended December 31, 2011 GAAP Business Transformation COLI Non-GAAP Operating expenses $ 2,856,912 $ (73,361) $ 1,779 $ 2,785,330 Operating income 936,338 73,361 (1,779) 1,007,920 Net earnings (2) 552,766 45,990 (1,779) 596,977 Diluted earnings per share $ 0.94 $ 0.08 $ - $ 1.02 26-Week Period Ended January 1, 2011 GAAP Business Transformation COLI Non-GAAP Operating expenses $ 2,664,506 $ (45,971) $23,853 $ 2,642,388 Operating income 943,265 45,971 (23,853) 965,383 Net earnings (2) 557,242 28,879 (23,853) 562,268 Diluted earnings per share $ 0.95 $ 0.04 $ (0.04) $ 0.95 26-Week Period Change in Dollars 26-Week Period % Change GAAP Non-GAAP GAAP Non-GAAP Operating expenses $ 192,406 $ 142,942 7.2% 5.4% Operating income (6,927) 42,537 -0.7% 4.4% Net earnings (4,476) 34,709 -0.8% 6.2% Diluted earnings per share $ (0.01) $ 0.07 -1.1% 7.4% (2) Tax impact of adjustments was $27,371 and $17,092 for the 26-week periods ended December 31, 2011 and January 1, 2011, respectively. |