Exhibit 99

Exhibit 99
Leucadia National Corporation
October 2013
Notes on Forward Looking Statements
This document contains “forward looking statements” within the meaning of the safe harbor provisions of Section 27A of the Securities Act of 1933 and Section 21E of the Securities Exchange Act of 1934. Forward looking statements include statements about our future and statements that are not historical facts. These forward looking statements are usually preceded by the words “expect,” “intend,” “may,” “will,” or similar expressions. Forward looking statements may contain expectations regarding revenues, earnings, operations, and other results, and may include statements of future performance, plans, and objectives. Forward looking statements also include statements pertaining to our strategies for future development of our business and products. Forward looking statements represent only our belief regarding future events, many of which by their nature are inherently uncertain. It is possible that the actual results may differ, possibly materially, from the anticipated results indicated in these forward-looking statements. Information regarding important factors that could cause actual results to differ, perhaps materially, from those in our forward looking statements is contained in reports we file with the SEC. You should read and interpret any forward looking statement together with reports we file with the SEC.
Leucadia / October 2013
i
Table of Contents
Leucadia Overview 1
Leucadia Leverage, Liquidity and Balance Sheet Parameters 8
Leucadia Businesses 14
Jefferies 15
National Beef 21
Berkadia 25
Garcadia 28
Other Businesses 30
Appendix 32
Leucadia / October 2013
ii

Leucadia Overview
Leucadia / October 2013
1
Executive Summary
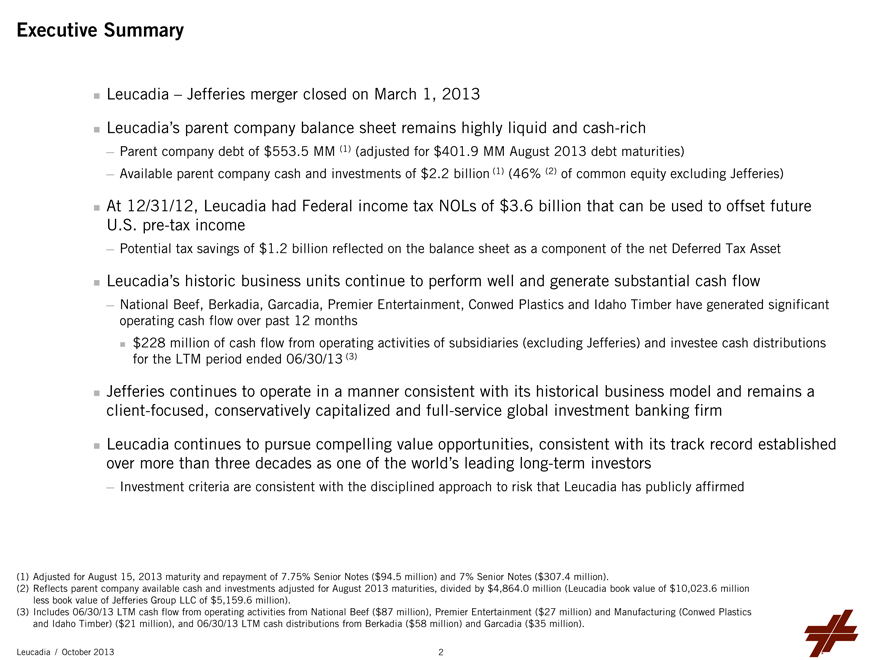
Leucadia – Jefferies merger closed on March 1, 2013
Leucadia’s parent company balance sheet remains highly liquid and cash-rich
Parent company debt of $553.5 MM (1) (adjusted for $401.9 MM August 2013 debt maturities)
Available parent company cash and investments of $2.2 billion (1) (46% (2) of common equity excluding Jefferies)
At 12/31/12, Leucadia had Federal income tax NOLs of $3.6 billion that can be used to offset future U.S. pre-tax income
Potential tax savings of $1.2 billion reflected on the balance sheet as a component of the net Deferred Tax Asset
Leucadia’s historic business units continue to perform well and generate substantial cash flow
National Beef, Berkadia, Garcadia, Premier Entertainment, Conwed Plastics and Idaho Timber have generated significant operating cash flow over past 12 months
$228 million of cash flow from operating activities of subsidiaries (excluding Jefferies) and investee cash distributions for the LTM period ended 06/30/13 (3)
Jefferies continues to operate in a manner consistent with its historical business model and remains a client-focused, conservatively capitalized and full-service global investment banking firm
Leucadia continues to pursue compelling value opportunities, consistent with its track record established over more than three decades as one of the world’s leading long-term investors
Investment criteria are consistent with the disciplined approach to risk that Leucadia has publicly affirmed
(1) Adjusted for August 15, 2013 maturity and repayment of 7.75% Senior Notes ($94.5 million) and 7% Senior Notes ($307.4 million).
(2) Reflects parent company available cash and investments adjusted for August 2013 maturities, divided by $4,864.0 million (Leucadia book value of $10,023.6 million less book value of Jefferies Group LLC of $5,159.6 million).
(3) Includes 06/30/13 LTM cash flow from operating activities from National Beef ($87 million), Premier Entertainment ($27 million) and Manufacturing (Conwed Plastics and Idaho Timber) ($21 million), and 06/30/13 LTM cash distributions from Berkadia ($58 million) and Garcadia ($35 million).
Leucadia / October 2013
2
Leucadia Overview
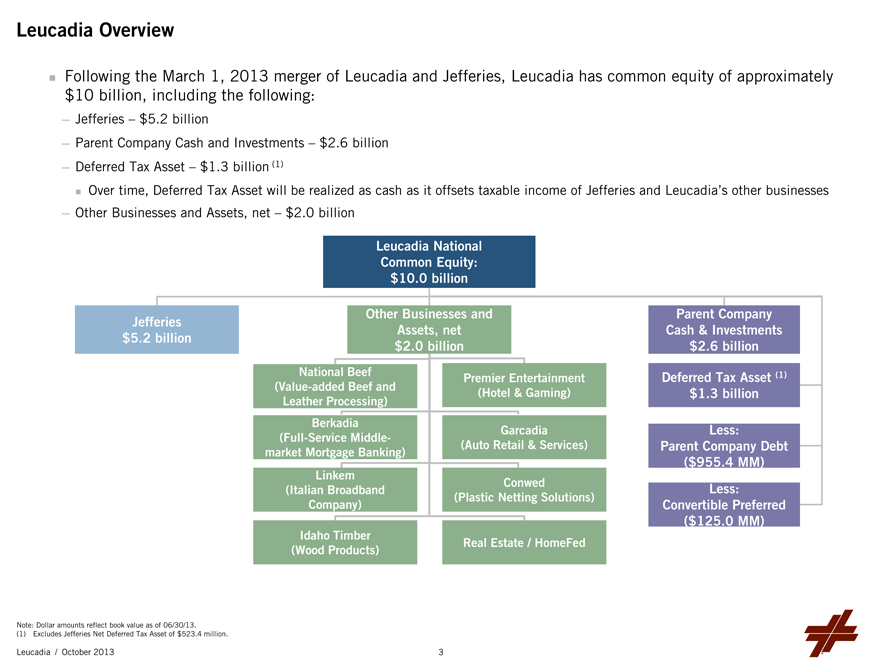
Following the March 1, 2013 merger of Leucadia and Jefferies, Leucadia has common equity of approximately $10 billion, including the following:
Jefferies – $5.2 billion
Parent Company Cash and Investments – $2.6 billion
Deferred Tax Asset – $1.3 billion (1)
Over time, Deferred Tax Asset will be realized as cash as it offsets taxable income of Jefferies and Leucadia’s other businesses
Other Businesses and Assets, net – $2.0 billion
Leucadia National
Common Equity:
$10.0 billion
Jefferies Other Businesses and Parent Company
$5.2 billion Assets, net Cash & Investments
$2.0 billion $2.6 billion
National Beef Premier Entertainment Deferred Tax Asset (1)
(Value-added Beef and(Hotel & Gaming) $1.3 billion
Leather Processing)
Berkadia Garcadia Less:
(Full-Service Middle-
market Mortgage Banking)(Auto Retail & Services) Parent Company Debt
($ 955.4 MM)
Linkem Conwed
(Italian Broadband Less:
(Plastic Netting Solutions)
Company) Convertible Preferred
($ 125.0 MM)
Idaho Timber
(Wood Products) Real Estate / HomeFed
Note: Dollar amounts reflect book value as of 06/30/13.
(1) Excludes Jefferies Net Deferred Tax Asset of $523.4 million.
Leucadia / October 2013 3
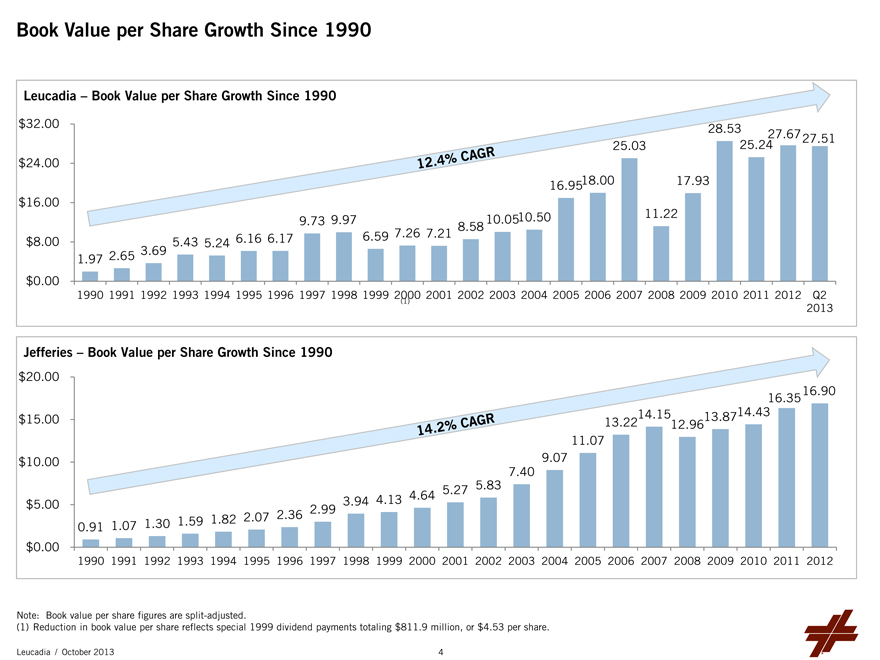
Book Value per Share Growth Since 1990
Leucadia – Book Value per Share Growth Since 1990
$32.00 28.53
27.67 27.51
25.03 25.24
$24.00
16.95 18.00 17.93
12.4%CAGR
$16.00
9.73 9.97 8.58 10.0510.50 11.22
$8.00 5.43 5.24 6.16 6.17 6.59 7.26 7.21
1.97 2.65 3.69
$0.00
1990 1991 1992 1993 1994 1995 1996 1997 1998 1999 2000 2001 2002 2003 2004 2005 2006 2007 2008 2009 2010 2011 2012 Q2
(1)
2013
Jefferies – Book Value per Share Growth Since 1990
$20.00
16.35 16.90
$15.00 13.2214.1512.9613.87 14.43
11.07
$10.00 9.07
14.2%CAGR
7.40
5.27 5.83
$5.00 3.94 4.13 4.64
0.91 1.07 1.30 1.59 1.82 2.07 2.36 2.99
$0.00
1990 1991 1992 1993 1994 1995 1996 1997 1998 1999 2000 2001 2002 2003 2004 2005 2006 2007 2008 2009 2010 2011 2012
Note: Book value per share figures are split-adjusted.
(1) Reduction in book value per share reflects special 1999 dividend payments totaling $811.9 million, or $4.53 per share.
Leucadia / October 2013
4
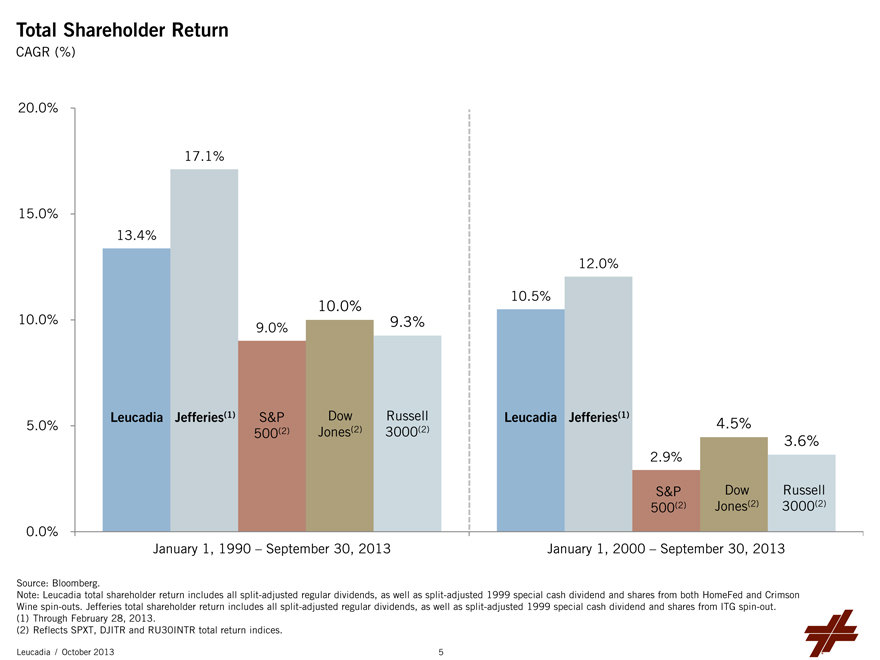
Total Shareholder Return
CAGR (%)
20.0%
17.1%
15.0%
13.4%
12.0%
10.0%
10.5%
10.0%
9.0%
9.3%
5.0% Leucadia Jefferies(1) S&P Dow (2) 3000 Russell Leucadia Jefferies(1) 4.5%
500(2) Jones(2) 3.6%
2.9%
S&P Dow Russell
500(2) Jones(2) 3000(2)
0.0%
January 1, 1990 – September 30, 2013 January 1, 2000 – September 30, 2013
Source: Bloomberg.
Note: Leucadia total shareholder return includes all split-adjusted regular dividends, as well as split-adjusted 1999 special cash dividend and shares from both HomeFed and Crimson Wine spin-outs. Jefferies total shareholder return includes all split-adjusted regular dividends, as well as split-adjusted 1999 special cash dividend and shares from ITG spin-out.
(1) Through February 28, 2013.
(2) Reflects SPXT, DJITR and RU30INTR total return indices.
Leucadia / October 2013
5
Liquidity Events – Last Four Quarters
Leucadia has generated over $2 billion of proceeds over the last four quarters:
Fortescue Metals note redemption and stock sale (July and October 2012): $868 million
Inmet Mining merger consideration (March 2013): $732 million, including $340 million of First Quantum stock
Mueller stock sale (September 2012): $427 million
Keen Energy sale (October 2012): $128 million plus $40 million note
TeleBarbados sale (September 2012): $28 million
Leucadia / October 2013
6
Long-Term Strategy – Compelling Value in Sectors We Understand
Financial Services
Jefferies
Berkadia
Asset Management
Auto Retail – Garcadia
Agribusiness – National Beef
Project Development
Gasification
Oregon Liquefied Natural Gas
Real Estate
HomeFed
Energy, Metals and Mining, Consumer, Healthcare, Industrial, Media and Telecom
Leucadia / October 2013
7

Leucadia Leverage, Liquidity and Balance Sheet Parameters
Leucadia / October 2013
8
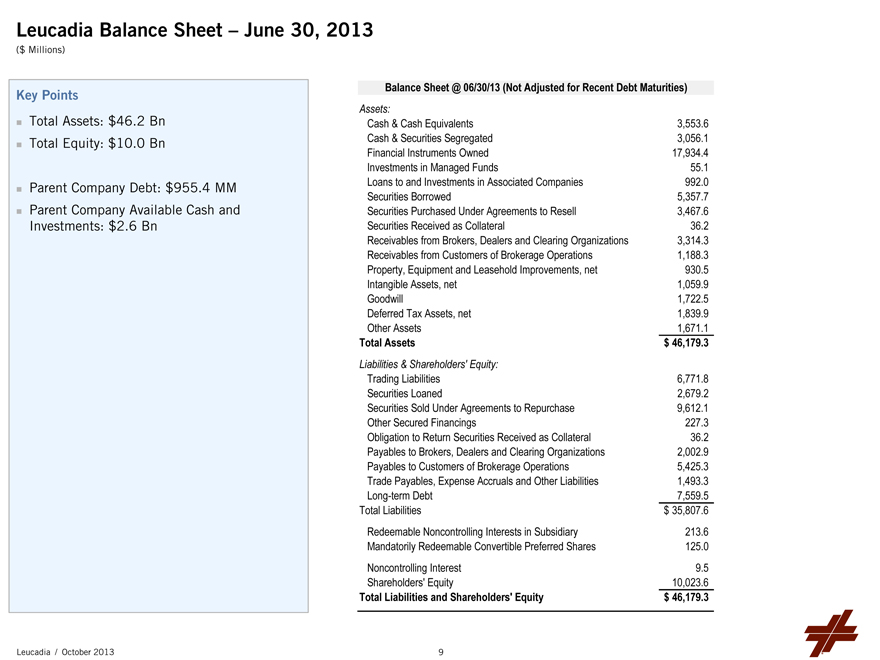
Leucadia Balance Sheet – June 30, 2013
($ Millions)
Key Points Balance Sheet @ 06/30/13 (Not Adjusted for Recent Debt Maturities)
Assets:
Total Assets: $46.2 Bn Cash & Cash Equivalents 3,553.6
Total Equity: $10.0 Bn Cash & Securities Segregated 3,056.1
Financial Instruments Owned 17,934.4
Investments in Managed Funds 55.1
Loans to and Investments in Associated Companies 992.0
Parent Company Debt: $955.4 MM
Securities Borrowed 5,357.7
Parent Company Available Cash and Securities Purchased Under Agreements to Resell 3,467.6
Investments: $2.6 Bn Securities Received as Collateral 36.2
Receivables from Brokers, Dealers and Clearing Organizations 3,314.3
Receivables from Customers of Brokerage Operations 1,188.3
Property, Equipment and Leasehold Improvements, net 930.5
Intangible Assets, net 1,059.9
Goodwill 1,722.5
Deferred Tax Assets, net 1,839.9
Other Assets 1,671.1
Total Assets $ 46,179.3
Liabilities & Shareholders' Equity:
Trading Liabilities 6,771.8
Securities Loaned 2,679.2
Securities Sold Under Agreements to Repurchase 9,612.1
Other Secured Financings 227.3
Obligation to Return Securities Received as Collateral 36.2
Payables to Brokers, Dealers and Clearing Organizations 2,002.9
Payables to Customers of Brokerage Operations 5,425.3
Trade Payables, Expense Accruals and Other Liabilities 1,493.3
Long-term Debt 7,559.5
Total Liabilities $ 35,807.6
Redeemable Noncontrolling Interests in Subsidiary 213.6
Mandatorily Redeemable Convertible Preferred Shares 125.0
Noncontrolling Interest 9.5
Shareholders' Equity 10,023.6
Total Liabilities and Shareholders' Equity $ 46,179.3
Leucadia / October 2013
9
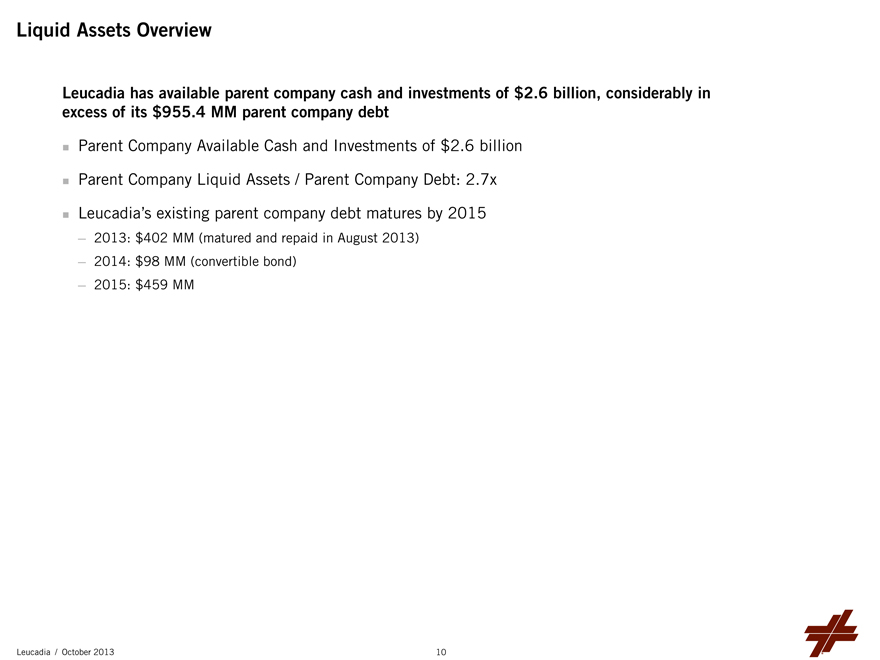
Liquid Assets Overview
Leucadia has available parent company cash and investments of $2.6 billion, considerably in excess of its $955.4 MM parent company debt
Parent Company Available Cash and Investments of $2.6 billion
Parent Company Liquid Assets / Parent Company Debt: 2.7x
Leucadia’s existing parent company debt matures by 2015
2013: $402 MM (matured and repaid in August 2013)
2014: $98 MM (convertible bond)
2015: $459 MM
Leucadia / October 2013
10
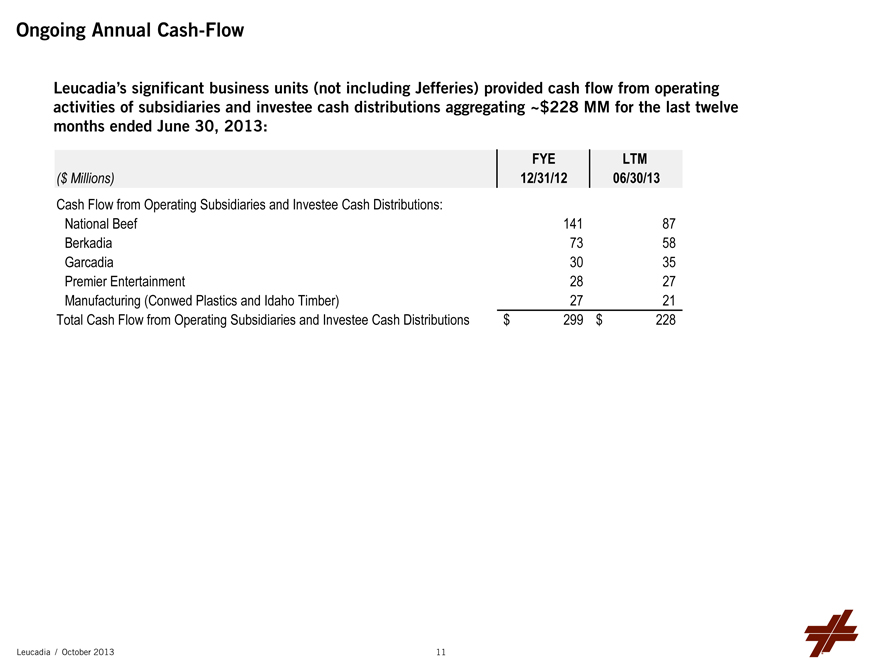
Ongoing Annual Cash-Flow
Leucadia’s significant business units (not including Jefferies) provided cash flow from operating activities of subsidiaries and investee cash distributions aggregating ~$228 MM for the last twelve months ended June 30, 2013:
FYE LTM
($ Millions) 12/31/12 06/30/13
Cash Flow from Operating Subsidiaries and Investee Cash Distributions:
National Beef 141 87
Berkadia 73 58
Garcadia 30 35
Premier Entertainment 28 27
Manufacturing (Conwed Plastics and Idaho Timber) 27 21
Total Cash Flow from Operating Subsidiaries and Investee Cash Distributions $ 299 $ 228
Leucadia / October 2013
11
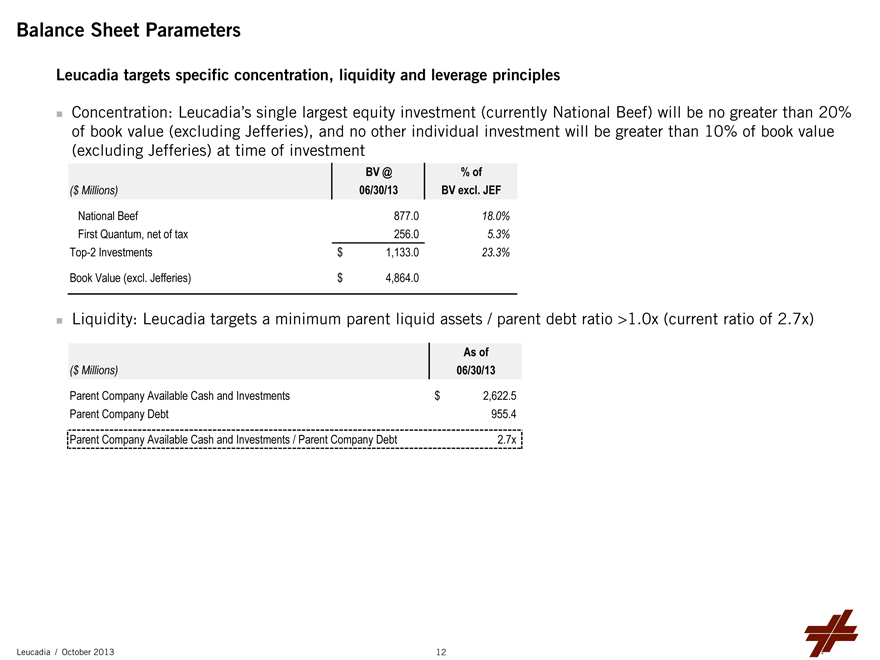
Balance Sheet Parameters
Leucadia targets specific concentration, liquidity and leverage principles
Concentration: Leucadia’s single largest equity investment (currently National Beef) will be no greater than 20% of book value (excluding Jefferies), and no other individual investment will be greater than 10% of book value (excluding Jefferies) at time of investment
BV @% of
($ Millions) 06/30/13 BV excl. JEF
National Beef 877.0 18.0%
First Quantum, net of tax 256.0 5.3%
Top-2 Investments $ 1,133.0 23.3%
Book Value (excl. Jefferies) $ 4,864.0
Liquidity: Leucadia targets a minimum parent liquid assets / parent debt ratio >1.0x (current ratio of 2.7x)
As of
($ Millions) 06/30/13
Parent Company Available Cash and Investments $ 2,622.5
Parent Company Debt 955.4
Parent Company Available Cash and Investments / Parent Company Debt 2.7x
Leucadia / October 2013
12
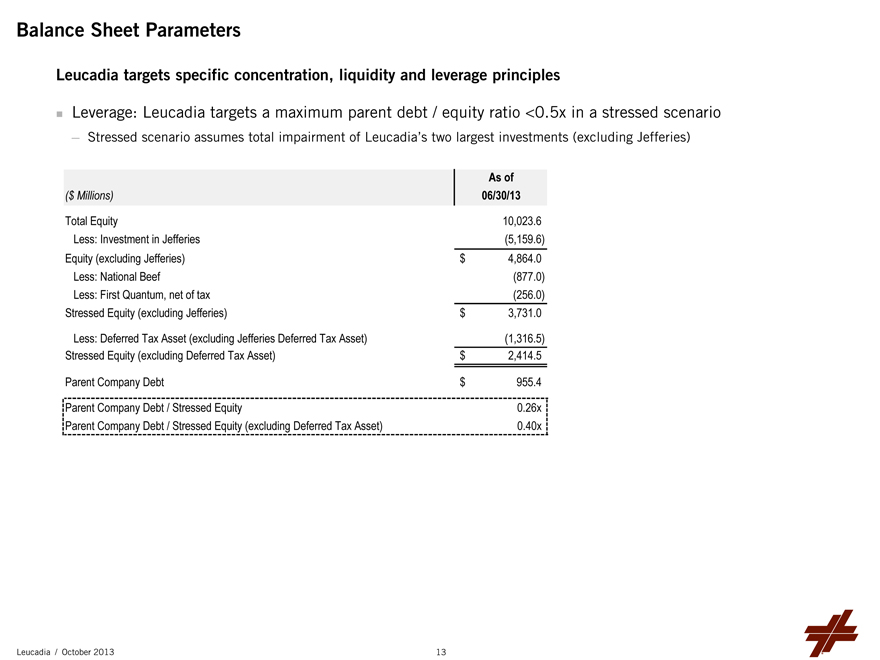
Balance Sheet Parameters
Leucadia targets specific concentration, liquidity and leverage principles
Leverage: Leucadia targets a maximum parent debt / equity ratio <0.5x in a stressed scenario
Stressed scenario assumes total impairment of Leucadia’s two largest investments (excluding Jefferies)
As of
($ Millions) 06/30/13
Total Equity 10,023.6
Less: Investment in Jefferies(5,159.6)
Equity (excluding Jefferies) $ 4,864.0
Less: National Beef(877.0)
Less: First Quantum, net of tax(256.0)
Stressed Equity (excluding Jefferies) $ 3,731.0
Less: Deferred Tax Asset (excluding Jefferies Deferred Tax Asset)(1,316.5)
Stressed Equity (excluding Deferred Tax Asset) $ 2,414.5
Parent Company Debt $ 955.4
Parent Company Debt / Stressed Equity 0.26x
Parent Company Debt / Stressed Equity (excluding Deferred Tax Asset) 0.40x
Leucadia / October 2013
13

Leucadia Businesses
Leucadia / October 2013
14

Jefferies
Jefferies
Leucadia / October 2013
15

Jefferies – Overview
Full Service Capital Markets Platform: expertise and depth across equities, fixed income, commodities and investment banking
Client-Focused: providing investor and issuer clients with the highest quality advice and execution
Global Footprint: sales & trading and investment banking presence across the United States, Europe and Asia
Strong, Stable Foundation: robust long-term capital base, comparatively low leverage and free from dependence upon government support
Positioned to Seize Market Share: having broadened our product offering and hired additional key talent during the downturn, Jefferies is growing rapidly
Leucadia / October 2013
16

Jefferies – A Full Service Investment Bank
Jefferies offers clients advice and execution across all major products and markets globally
Jefferies
Investment
Equities Fixed Income Jefferies Bache Banking
Cash Electronic Investment Leveraged Equity Capital
Listed Futures Base Metals Consumer Energy
Equities Trading Grade Credit Markets
Prime
Brokerage / Emerging Precious Foreign Leveraged
Derivatives MBS / ABS Financials Healthcare
Securities Markets Metals Exchange Finance
Finance
Metals & Mergers &
ETFs Converts Rates / Repos Municipals Research Industrials Mining Acquisitions
Wealth Real Estate, Technology,
Management Research ETFs Research Gaming & Media & Restructuring
Lodging Telecom
Financial Public
Sponsors Finance
Leucadia / October 2013
17
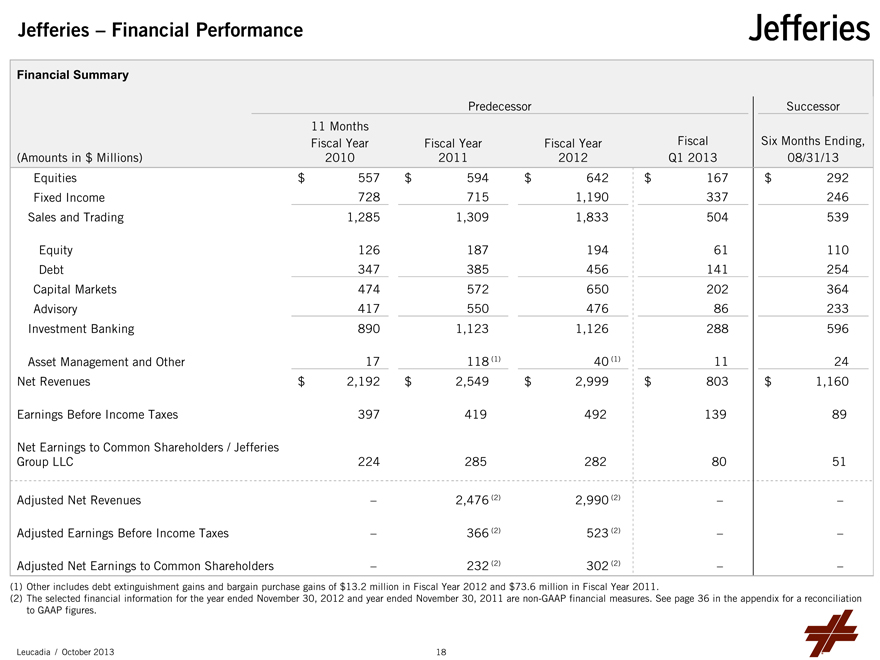
Jefferies – Financial Performance
Financial Summary
Predecessor Successor
11 Months
Fiscal Year Fiscal Year Fiscal Year Fiscal Six Months Ending,
(Amounts in $ Millions) 2010 2011 2012 Q1 2013 08/31/13
Equities $ 557 $ 594 $ 642 $ 167 $ 292
Fixed Income 728 715 1,190 337 246
Sales and Trading 1,285 1,309 1,833 504 539
Equity 126 187 194 61 110
Debt 347 385 456 141 254
Capital Markets 474 572 650 202 364
Advisory 417 550 476 86 233
Investment Banking 890 1,123 1,126 288 596
Asset Management and Other 17 118 (1) 40 (1) 11 24
Net Revenues $ 2,192 $ 2,549 $ 2,999 $ 803 $ 1,160
Earnings Before Income Taxes 397 419 492 139 89
Net Earnings to Common Shareholders / Jefferies
Group LLC 224 285 282 80 51
Adjusted Net Revenues – 2,476 (2) 2,990 (2) – –
Adjusted Earnings Before Income Taxes – 366 (2) 523 (2) – –
Adjusted Net Earnings to Common Shareholders – 232 (2) 302 (2) – –
(1) Other includes debt extinguishment gains and bargain purchase gains of $13.2 million in Fiscal Year 2012 and $73.6 million in Fiscal Year 2011.
(2) The selected financial information for the year ended November 30, 2012 and year ended November 30, 2011 are non-GAAP financial measures. See page 36 in the appendix for a reconciliation to GAAP figures.
Leucadia / October 2013
18
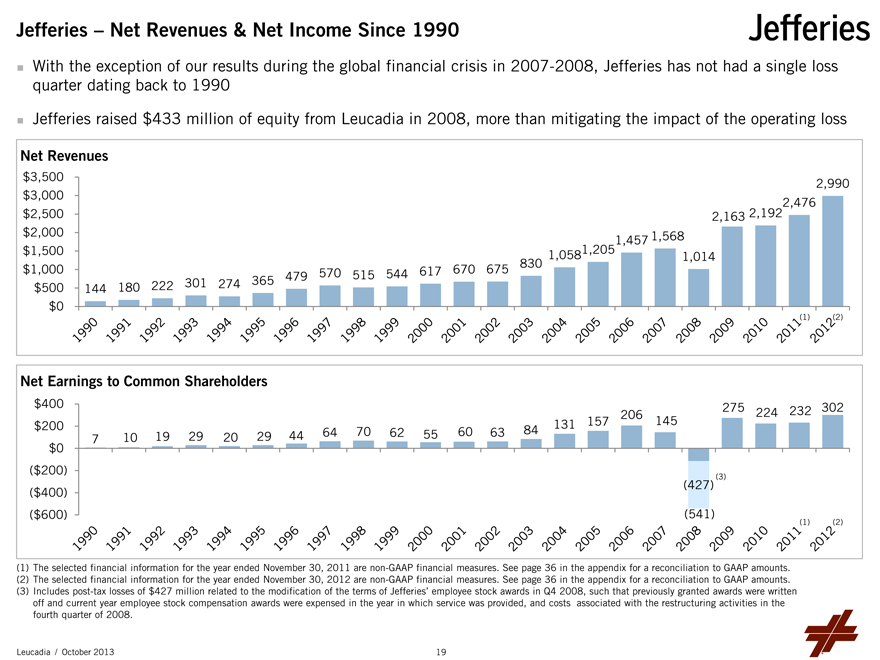
Jefferies – Net Revenues & Net Income Since 1990
With the exception of our results during the global financial crisis in 2007-2008, Jefferies has not had a single loss quarter dating back to 1990
Jefferies raised $433 million of equity from Leucadia in 2008, more than mitigating the impact of the operating loss
Net Revenues
$3,500 2,990
$3,000 2,476
$2,500 2,163 2,192
$2,000 1,457 1,568
$1,500 1,058 1,205 1,014
$1,000 479 570 515 544 617 670 675 830
$500 144 180 222 301 274 365
$0
1990 1991 1992 1993 1994 1995 1996 1997 1998 1999 2000 2001 2002 2003 2004 2005 2006 2007 2008 2009 2010 2011 2012
(1)(2)
Net Earnings to Common Shareholders
$400 206 275 224 232 302
$200 7 10 19 29 20 29 44 64 70 62 55 60 63 84 131 157 145
$0
($200)(3)
($400)(427)
($600)(541)
1990 1991 1992 1993 1994 1995 1996 1997 1998 1999 2000 2001 2002 2003 2004 2005 2006 2007 2008 2009 2010 2011 2012
(1)(2)
(1) The selected financial information for the year ended November 30, 2011 are non-GAAP financial measures. See page 36 in the appendix for a reconciliation to GAAP amounts.
(2) The selected financial information for the year ended November 30, 2012 are non-GAAP financial measures. See page 36 in the appendix for a reconciliation to GAAP amounts.
(3) Includes post-tax losses of $427 million related to the modification of the terms of Jefferies’ employee stock awards in Q4 2008, such that previously granted awards were written off and current year employee stock compensation awards were expensed in the year in which service was provided, and costs associated with the restructuring activities in the fourth quarter of 2008.
Leucadia / October 2013
19
Jefferies – Recent Developments
Jefferies continues to win market share and is consistently profitable
Investment Banking revenues underline the quality and durability of Jefferies’ platform
Solid growth in Equities revenues (new senior leadership)
Durable Fixed Income, Commodities and Currencies platforms
Continued emphasis on earnings growth through increased employee productivity
Jefferies’ full service capabilities and momentum outside the U.S. present a significant growth opportunity
In September 2013, performance returned to more normal levels
Client flows have been stronger and results have markedly improved
Investment Banking backlog at an all-time high
Capital markets activity remains robust
M&A activity remains strong following an active summer
Leucadia / October 2013
20

National Beef
Leucadia / October 2013
21
National Beef – Overview
Company Overview
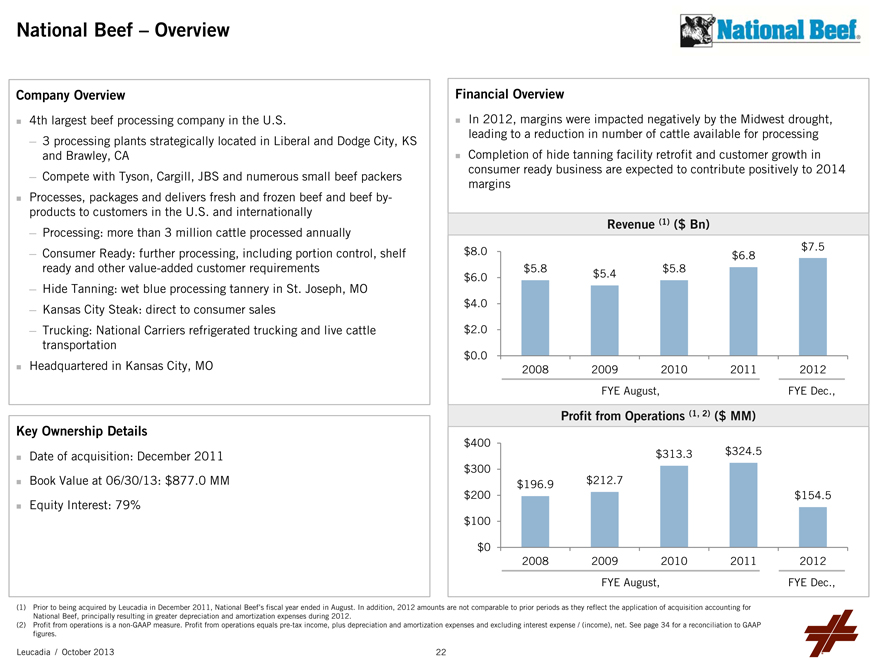
4th largest beef processing company in the U.S.
3 processing plants strategically located in Liberal and Dodge City, KS and Brawley, CA
Compete with Tyson, Cargill, JBS and numerous small beef packers
Processes, packages and delivers fresh and frozen beef and beef by- products to customers in the U.S. and internationally
Processing: more than 3 million cattle processed annually
Consumer Ready: further processing, including portion control, shelf ready and other value-added customer requirements
Hide Tanning: wet blue processing tannery in St. Joseph, MO
Kansas City Steak: direct to consumer sales
Trucking: National Carriers refrigerated trucking and live cattle transportation
Headquartered in Kansas City, MO
Key Ownership Details
Date of acquisition: December 2011
Book Value at 06/30/13: $877.0 MM
Equity Interest: 79%
Financial Overview
In 2012, margins were impacted negatively by the Midwest drought, leading to a reduction in number of cattle available for processing
Completion of hide tanning facility retrofit and customer growth in consumer ready business are expected to contribute positively to 2014 margins
Revenue (1) ($ Bn)
$7.5
$8.0 $6.8
$6.0 $5.8 $5.4 $5.8
$4.0
$2.0
$0.0
2008 2009 2010 2011 2012
FYE August, FYE Dec.,
Profit from Operations (1, 2) ($ MM)
$400
$313.3 $324.5
$300
$196.9 $212.7
$200 $154.5
$100
$0
2008 2009 2010 2011 2012
FYE August, FYE Dec.,
(1) Prior to being acquired by Leucadia in December 2011, National Beef’s fiscal year ended in August. In addition, 2012 amounts are not comparable to prior periods as they reflect the application of acquisition accounting for National Beef, principally resulting in greater depreciation and amortization expenses during 2012.
(2) Profit from operations is a non-GAAP measure. Profit from operations equals pre-tax income, plus depreciation and amortization expenses and excluding interest expense / (income), net. See page 34 for a reconciliation to GAAP figures.
Leucadia / October 2013
22
National Beef – Industry Trends
US Beef Production and Net Imports
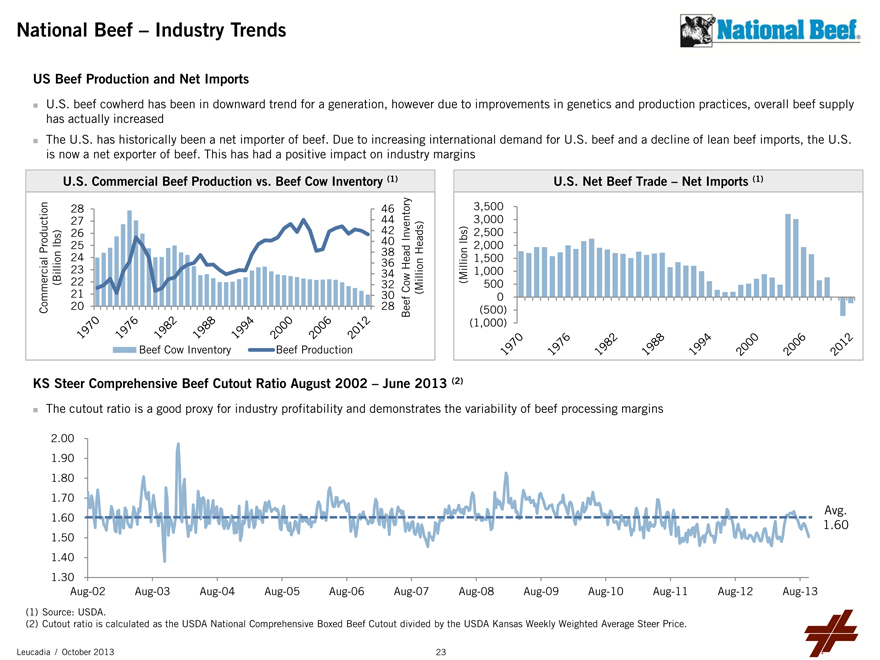
U.S. beef cowherd has been in downward trend for a generation, however due to improvements in genetics and production practices, overall beef supply has actually increased
The U.S. has historically been a net importer of beef. Due to increasing international demand for U.S. beef and a decline of lean beef imports, the U.S. is now a net exporter of beef. This has had a positive impact on industry margins
U.S. Commercial Beef Production vs. Beef Cow Inventory (1) U.S. Net Beef Trade – Net Imports (1)
28 46 3,500
27 44 3,000
26 42 2,500
Production lbs) 25 40 Inventory Heads) lbs) 2,000
38
24 36 1,500
34 1,000
(Billion 22 23 32 Cow Head (Million(Million 500
21 30 0
Commercial 20 28 Beef(500)
(1,000)
1970 1976 1982 1988 1994 2000 2006 2012
1970 1976 1982 1988 1994 2000 2006 2012
Beef Cow Inventory Beef Production
KS Steer Comprehensive Beef Cutout Ratio August 2002 – June 2013 (2)
The cutout ratio is a good proxy for industry profitability and demonstrates the variability of beef processing margins
2.00
1.90
1.80
1.70
1.60
1.50
1.40
1.30
Aug-02 Aug-03 Aug-04 Aug-05 Aug-06 Aug-07 Aug-08 Aug-09 Aug-10 Aug-11 Aug-12 Aug-13 Aug.1.60
(1) Source: USDA.
(2) Cutout ratio is calculated as the USDA National Comprehensive Boxed Beef Cutout divided by the USDA Kansas Weekly Weighted Average Steer Price.
Leucadia / October 2013
23
National Beef – Recent Developments
Global protein demand is expected to continue current growth trend; growth of middle class in developing countries points to increasing demand for beef
Recent regulatory change in cattle age requirement by Japan has resulted in industry-wide increase in export volume to Japan
Acquired remaining minority interest in Kansas City Steaks, increasing ownership from 75% to 100%
Retrofit of hide tanning facility expected to be completed in early 2014, at which point National Beef will have what is anticipated to be the largest and most efficient tannery in the U.S.
Widespread drought conditions have contributed to a delay in the reversal of the downward trend in U.S beef cow numbers. Fewer cows ultimately result in lower supplies of fed cattle and that has reduced industry-wide beef packing margins and National Beef’s profitability
Leucadia / October 2013
24

BERKADIA
THE INDUSTRY OF ONE
Leucadia / October 2013
25
Berkadia – Overview
Company Overview
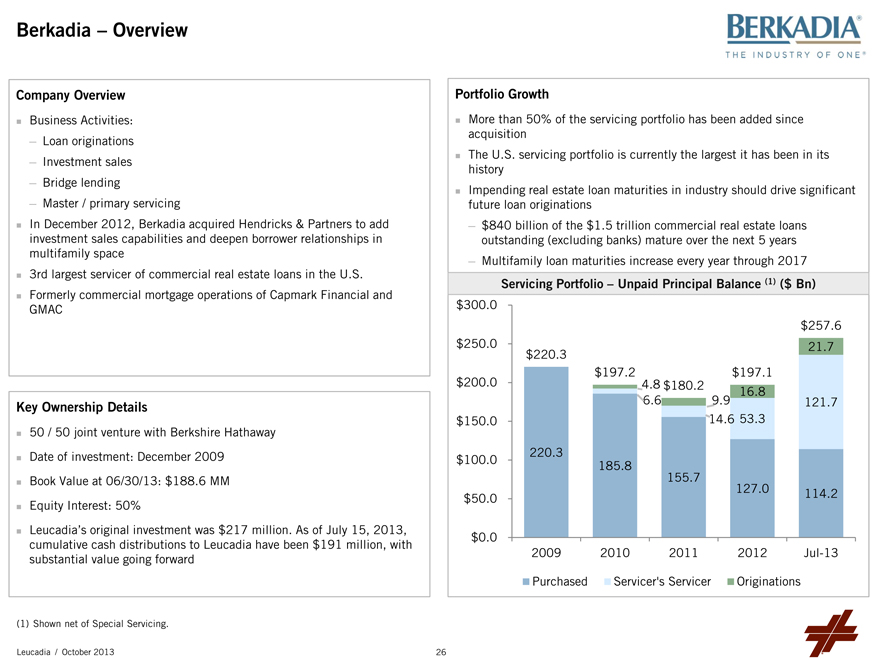
Business Activities:
Loan originations
Investment sales
Bridge lending
Master / primary servicing
In December 2012, Berkadia acquired Hendricks & Partners to add investment sales capabilities and deepen borrower relationships in multifamily space
3rd largest servicer of commercial real estate loans in the U.S.
Formerly commercial mortgage operations of Capmark Financial and GMAC
Key Ownership Details
50 / 50 joint venture with Berkshire Hathaway
Date of investment: December 2009
Book Value at 06/30/13: $188.6 MM
Equity Interest: 50%
Leucadia’s original investment was $217 million. As of July 15, 2013, cumulative cash distributions to Leucadia have been $191 million, with substantial value going forward
(1) Shown net of Special Servicing.
Leucadia / October 2013
Portfolio Growth
More than 50% of the servicing portfolio has been added since acquisition
The U.S. servicing portfolio is currently the largest it has been in its history
Impending real estate loan maturities in industry should drive significant future loan originations
$840 billion of the $1.5 trillion commercial real estate loans outstanding (excluding banks) mature over the next 5 years
Multifamily loan maturities increase every year through 2017
Servicing Portfolio – Unpaid Principal Balance (1) ($ Bn)
$300.0
$257.6
$250.0 21.7
$220.3
$197.2 $197.1
$200.0 4.8 $180.2 16.8
6.6 9.9 121.7
$150.0 14.6 53.3
220.3
$100.0 185.8
155.7
127.0
$50.0 114.2
$0.0
2009 2010 2011 2012 Jul-13
Purchased Servicer's Servicer Originations
26
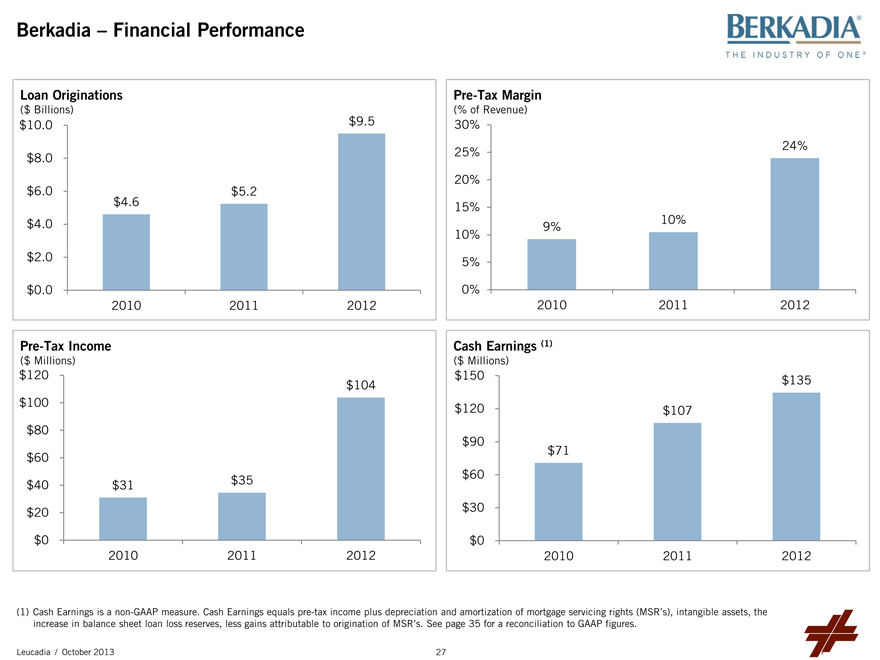
Berkadia – Financial Performance
Loan Originations Pre-Tax Margin
($ Billions)(% of Revenue)
$10.0 $9.5 30%
24%
$8.0 25%
20%
$6.0 $5.2
$4.6 15%
$4.0 9% 10%
10%
$2.0 5%
$0.0 0%
2010 2011 2012 2010 2011 2012
Pre-Tax Income Cash Earnings (1)
($ Millions)($ Millions)
$120 $150 $135
$104
$100 $120 $107
$80
$90
$60 $71
$60
$40 $31 $35
$20 $30
$0 $0
2010 2011 2012 2010 2011 2012
(1) Cash Earnings is a non-GAAP measure. Cash Earnings equals pre-tax income plus depreciation and amortization of mortgage servicing rights (MSR’s), intangible assets, the increase in balance sheet loan loss reserves, less gains attributable to origination of MSR’s. See page 35 for a reconciliation to GAAP figures.
Leucadia / October 2013
27

Garcadia
Leucadia / October 2013
28
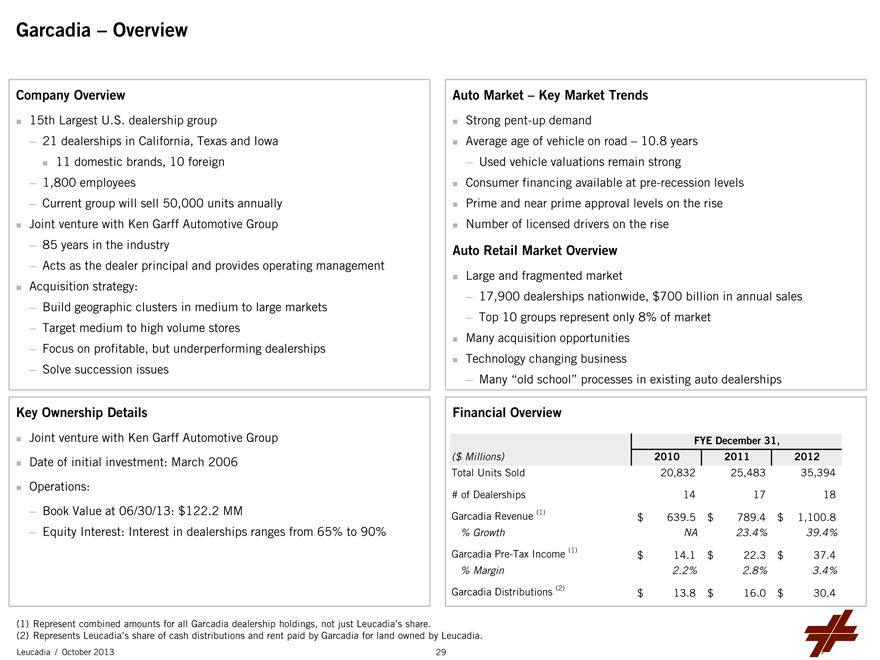
Garcadia – Overview
Company Overview
15th Largest U.S. dealership group
21 dealerships in California, Texas and Iowa 11 domestic brands, 10 foreign
1,800 employees
Current group will sell 50,000 units annually
Joint venture with Ken Garff Automotive Group
85 years in the industry
Acts as the dealer principal and provides operating management
Acquisition strategy:
Build geographic clusters in medium to large markets
Target medium to high volume stores
Focus on profitable, but underperforming dealerships
Solve succession issues
Key Ownership Details
Joint venture with Ken Garff Automotive Group
Date of initial investment: March 2006
Operations:
Book Value at 06/30/13: $122.2 MM
Equity Interest: Interest in dealerships ranges from 65% to 90%
Auto Market – Key Market Trends
Strong pent-up demand
Average age of vehicle on road – 10.8 years Used vehicle valuations remain strong
Consumer financing available at pre-recession levels
Prime and near prime approval levels on the rise
Number of licensed drivers on the rise
Auto Retail Market Overview
Large and fragmented market
17,900 dealerships nationwide, $700 billion in annual sales
Top 10 groups represent only 8% of market
Many acquisition opportunities
Technology changing business
Many “old school” processes in existing auto dealerships
Financial Overview
FYE December 31,
($ Millions) 2010 2011 2012
Total Units Sold 20,832 25,483 35,394
# of Dealerships 14 17 18
Garcadia Revenue (1) $ 639.5 $ 789.4 $ 1,100.8
% Growth NA 23.4% 39.4%
Garcadia Pre-Tax Income (1) $ 14.1 $ 22.3 $ 37.4
% Margin 2.2% 2.8% 3.4%
Garcadia Distributions (2) $ 13.8 $ 16.0 $ 30.4
(1) Represent combined amounts for all Garcadia dealership holdings, not just Leucadia’s share.
(2) Represents Leucadia’s share of cash distributions and rent paid by Garcadia for land owned by Leucadia.
Leucadia / October 2013
29

Other Businesses
Leucadia / October 2013
30
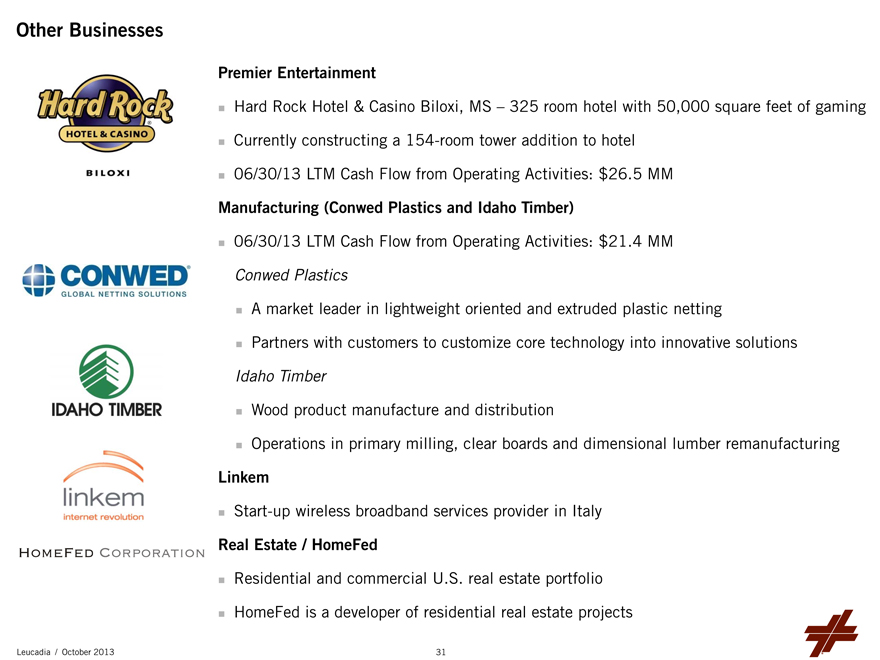
Other Businesses
Premier Entertainment
Hard Rock Hotel & Casino Biloxi, MS – 325 room hotel with 50,000 square feet of gaming
Currently constructing a 154-room tower addition to hotel
06/30/13 LTM Cash Flow from Operating Activities: $26.5 MM
Manufacturing (Conwed Plastics and Idaho Timber)
06/30/13 LTM Cash Flow from Operating Activities: $21.4 MM
Conwed Plastics
A market leader in lightweight oriented and extruded plastic netting
Partners with customers to customize core technology into innovative solutions
Idaho Timber
Wood product manufacture and distribution
Operations in primary milling, clear boards and dimensional lumber remanufacturing
Linkem
Start-up wireless broadband services provider in Italy
Real Estate / HomeFed
Residential and commercial U.S. real estate portfolio
HomeFed is a developer of residential real estate projects
Leucadia / October 2013
31

Appendix
Leucadia / October 2013
32

2013 and 2014 Calendar of Fixed Income Investor and Shareholder Meetings
October 10, 2013 – Jefferies Fixed Income Investor Day
March 4, 2014 – Combined Leucadia and Jefferies Investor Discussion recapping 2013 performance and giving a high-level overview of strategies and plans for 2014
May 14, 2014 – Leucadia Annual Shareholder Meeting
August 7, 2014 – Leucadia Investor Day
October 9, 2014 – Jefferies Fixed Income Investor Day
Leucadia / October 2013
33
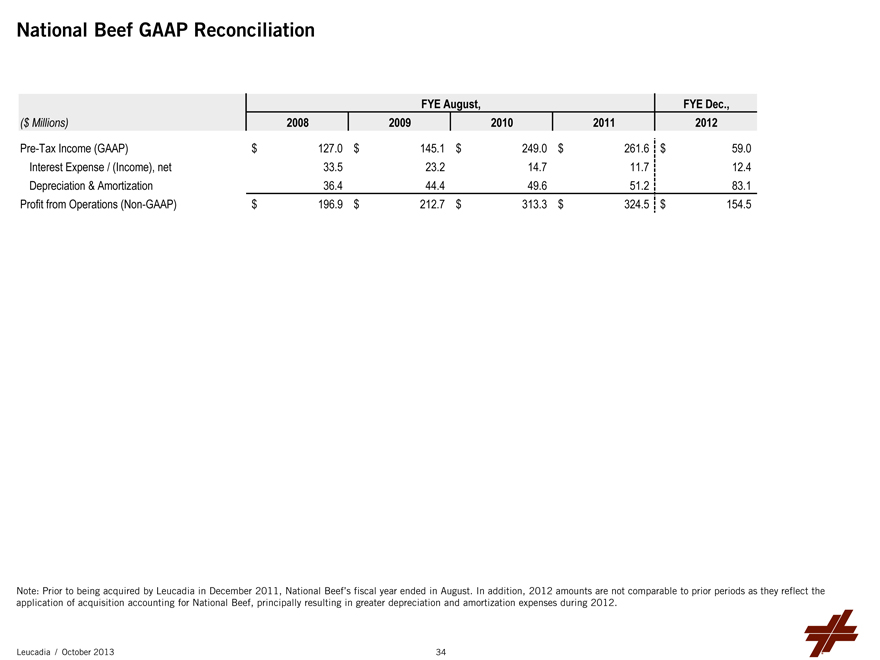
National Beef GAAP Reconciliation
FYE August, FYE Dec.,
($ Millions) 2008 2009 2010 2011 2012
Pre-Tax Income (GAAP) $ 127.0 $ 145.1 $ 249.0 $ 261.6 $ 59.0
Interest Expense / (Income), net 33.5 23.2 14.7 11.7 12.4
Depreciation & Amortization 36.4 44.4 49.6 51.2 83.1
Profit from Operations (Non-GAAP) $ 196.9 $ 212.7 $ 313.3 $ 324.5 $ 154.5
Note: Prior to being acquired by Leucadia in December 2011, National Beef’s fiscal year ended in August. In addition, 2012 amounts are not comparable to prior periods as they reflect the application of acquisition accounting for National Beef, principally resulting in greater depreciation and amortization expenses during 2012.
Leucadia / October 2013
34
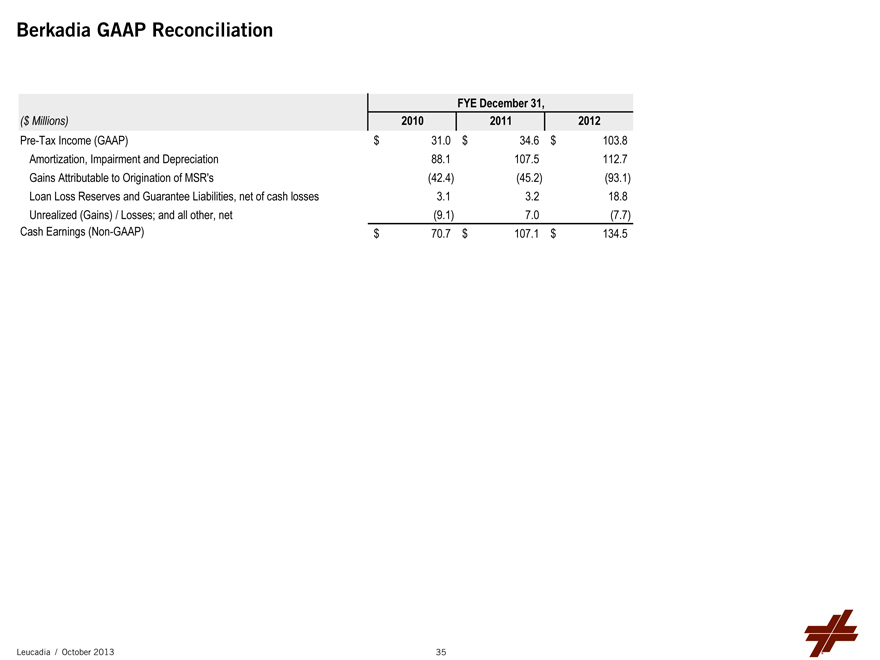
Berkadia GAAP Reconciliation
FYE December 31,
($ Millions) 2010 2011 2012
Pre-Tax Income (GAAP) $ 31.0 $ 34.6 $ 103.8
Amortization, Impairment and Depreciation 88.1 107.5 112.7
Gains Attributable to Origination of MSR's(42.4)(45.2)(93.1)
Loan Loss Reserves and Guarantee Liabilities, net of cash losses 3.1 3.2 18.8
Unrealized (Gains) / Losses; and all other, net(9.1) 7.0(7.7)
Cash Earnings (Non-GAAP) $ 70.7 $ 107.1 $ 134.5
Leucadia / October 2013
35
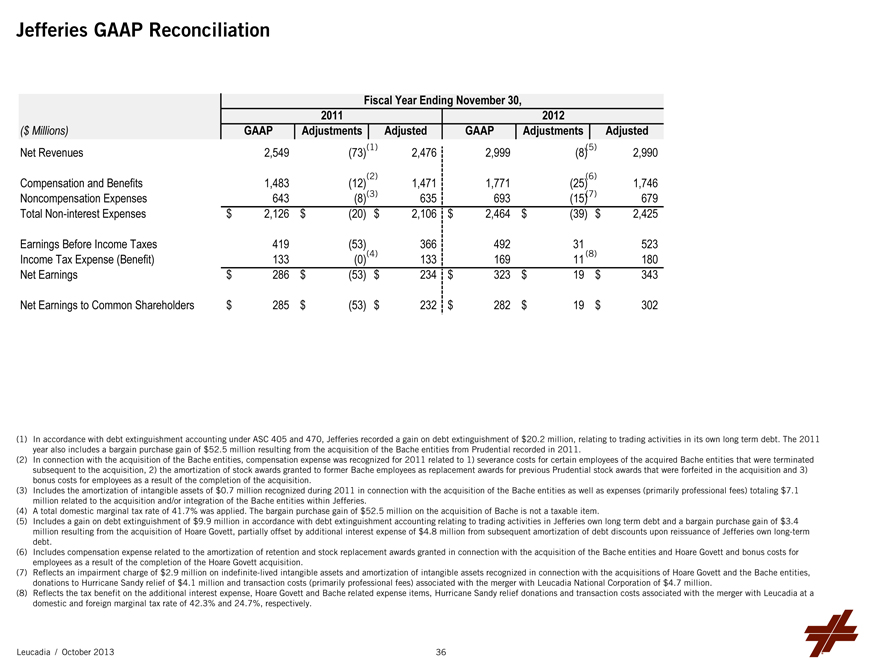
Jefferies GAAP Reconciliation
Fiscal Year Ending November 30,
2011 2012
($ Millions) GAAP Adjustments Adjusted GAAP Adjustments Adjusted
Net Revenues 2,549(73)(1) 2,476 2,999(8)(5) 2,990
Compensation and Benefits 1,483(12)(2) 1,471 1,771(25)(6) 1,746
Noncompensation Expenses 643(8)(3) 635 693(15)(7) 679
Total Non-interest Expenses $ 2,126 $(20) $ 2,106 $ 2,464 $(39) $ 2,425
Earnings Before Income Taxes 419(53) 366 492 31 523
Income Tax Expense (Benefit) 133(0)(4) 133 169 11 (8) 180
Net Earnings $ 286 $(53) $ 234 $ 323 $ 19 $ 343
Net Earnings to Common Shareholders $ 285 $(53) $ 232 $ 282 $ 19 $ 302
(1) In accordance with debt extinguishment accounting under ASC 405 and 470, Jefferies recorded a gain on debt extinguishment of $20.2 million, relating to trading activities in its own long term debt. The 2011 year also includes a bargain purchase gain of $52.5 million resulting from the acquisition of the Bache entities from Prudential recorded in 2011.
(2) In connection with the acquisition of the Bache entities, compensation expense was recognized for 2011 related to 1) severance costs for certain employees of the acquired Bache entities that were terminated subsequent to the acquisition, 2) the amortization of stock awards granted to former Bache employees as replacement awards for previous Prudential stock awards that were forfeited in the acquisition and 3) bonus costs for employees as a result of the completion of the acquisition.
(3) Includes the amortization of intangible assets of $0.7 million recognized during 2011 in connection with the acquisition of the Bache entities as well as expenses (primarily professional fees) totaling $7.1 million related to the acquisition and/or integration of the Bache entities within Jefferies.
(4) A total domestic marginal tax rate of 41.7% was applied. The bargain purchase gain of $52.5 million on the acquisition of Bache is not a taxable item.
(5) Includes a gain on debt extinguishment of $9.9 million in accordance with debt extinguishment accounting relating to trading activities in Jefferies own long term debt and a bargain purchase gain of $3.4 million resulting from the acquisition of Hoare Govett, partially offset by additional interest expense of $4.8 million from subsequent amortization of debt discounts upon reissuance of Jefferies own long-term debt.
(6) Includes compensation expense related to the amortization of retention and stock replacement awards granted in connection with the acquisition of the Bache entities and Hoare Govett and bonus costs for employees as a result of the completion of the Hoare Govett acquisition.
(7) Reflects an impairment charge of $2.9 million on indefinite-lived intangible assets and amortization of intangible assets recognized in connection with the acquisitions of Hoare Govett and the Bache entities, donations to Hurricane Sandy relief of $4.1 million and transaction costs (primarily professional fees) associated with the merger with Leucadia National Corporation of $4.7 million.
(8) Reflects the tax benefit on the additional interest expense, Hoare Govett and Bache related expense items, Hurricane Sandy relief donations and transaction costs associated with the merger with Leucadia at a domestic and foreign marginal tax rate of 42.3% and 24.7%, respectively.
Leucadia / October 2013
36