Exhibit 99

Leucadia National Corporation
2015 Investor Day
October 8, 2015
Note on Forward Looking Statements
This document contains “forward looking statements” within the meaning of the safe harbor provisions of Section 27A of the Securities Act of 1933 and Section 21E of the Securities Exchange Act of 1934. Forward looking statements include statements about our future and statements that are not historical facts. These forward looking statements are usually preceded by the words “should,” “expect,” “intend,” “may,” “will,” or similar expressions. Forward looking statements may contain expectations regarding revenues, earnings, operations, and other results, and may include statements of future performance, plans, and objectives. Forward looking statements also include statements pertaining to our strategies for future development of our business and products. Forward looking statements represent only our belief regarding future events, many of which by their nature are inherently uncertain. It is possible that the actual results may differ, possibly materially, from the anticipated results indicated in these forward-looking statements. Information regarding important factors, including our Risk Factors, that could cause actual results to differ, perhaps materially, from those in our forward looking statements is contained in reports we file with the SEC. You should read and interpret any forward looking statement together with reports we file with the SEC.
i
Leucadia Today
Goal is long-term value creation
Senior management is aligned with shareholders – 11.2%(1) ownership for top three officers
14 of our 16 businesses are operating well and have strong value creation potential
Jefferies Investment Banking and Equities are performing well, growing and creating value; we are addressing the challenges in Fixed Income; Bache exit is accretive
We expect National Beef to recover on the back of a steady increase in the cattle herd
Leveraging the Jefferies platform to source unique investment opportunities is working well (LAM, FXCM, HRG)
(1) Per Leucadia’s most recent proxy statement. Assumes Richard B. Handler and Brian P. Friedman’s respective continued employment with Leucadia through the expiration of all applicable vesting and deferral periods.
1
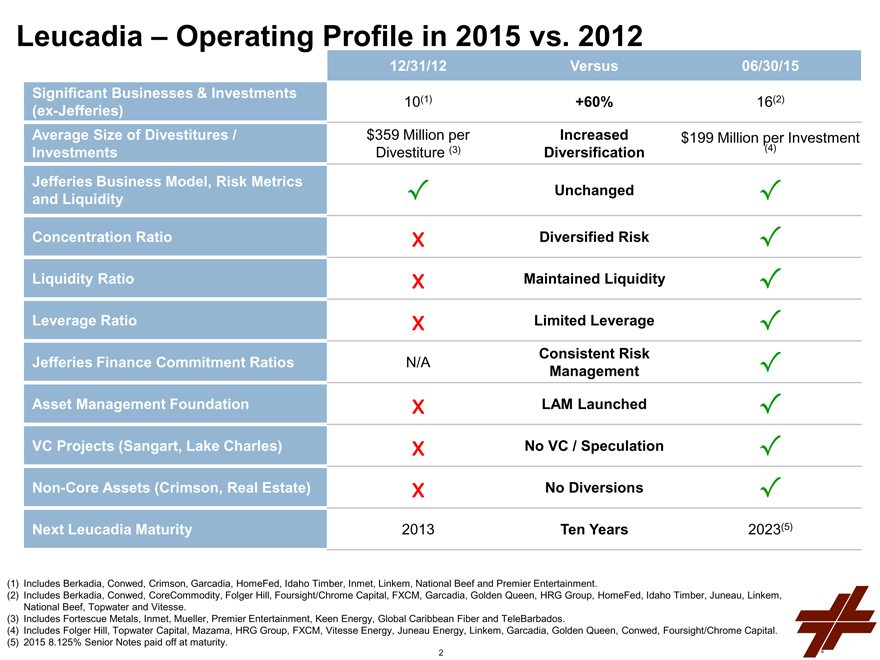
Leucadia – Operating Profile in 2015 vs. 2012
12/31/12 Versus 06/30/15
Significant Businesses & Investments 10(1) +60% 16(2)
(ex-Jefferies)
Average Size of Divestitures /Investments $359 Million per Divestiture (3) Increased Diversification $199 Million per Investment (4)
Jefferies Business Model, Risk Metrics and Liquidity Unchanged
Concentration Ratio x Diversified Risk
Liquidity Ratio x Maintained Liquidity
Leverage Ratio x Limited Leverage
Jefferies Finance Commitment Ratios N/A Consistent Risk Management
Asset Management Foundation x LAM Launched
VC Projects (Sangart, Lake Charles) x No VC / Speculation
Non-Core Assets (Crimson, Real Estate) x No Diversions
Next Leucadia Maturity 2013 Ten Years 2023(5)
(1) Includes Berkadia, Conwed, Crimson, Garcadia, HomeFed, Idaho Timber, Inmet, Linkem, National Beef and Premier Entertainment.
(2) Includes Berkadia, Conwed, CoreCommodity, Folger Hill, Foursight/Chrome Capital, FXCM, Garcadia, Golden Queen, HRG Group, HomeFed, Idaho Timber, Juneau, Linkem, National Beef, Topwater and Vitesse.
(3) Includes Fortescue Metals, Inmet, Mueller, Premier Entertainment, Keen Energy, Global Caribbean Fiber and TeleBarbados.
(4) Includes Folger Hill, Topwater Capital, Mazama, HRG Group, FXCM, Vitesse Energy, Juneau Energy, Linkem, Garcadia, Golden Queen, Conwed, Foursight/Chrome Capital.
(5) 2015 8.125% Senior Notes paid off at maturity.
2

Leucadia Overview
Leucadia National Corporation Parent Capital – $11.8 Billion (1)
Common Equity – $10.7 Billion (2) Preferred Equity – $0.125 Billion Parent Debt – $1.0 Billion (1)
Financial Services $7.4 Billion Merchant Banking $2.5 Billion Corporate / Liquidity $1.9 Billion
Jefferies (100%) $5.5 Billion (3)
Jefferies Finance (50%) $500 Million
Jefferies LoanCore (49%) $241 Million
KCG Holdings (4) (17%) $176 Million ($0 Million at Cost)
Leucadia Asset Management (100%) $548 Million (5)
Folger Hill
Topwater Capital
Strategic Investments
Global Equity Events
CoreCommodity
Mazama Capital
FXCM $759 Million ($184 Million Invested, Net of Receipts) (6)
HomeFed (65%) $234 Million (7) ($479 Million at MV) (8)
Berkadia (50%) $207 Million
Foursight (100%) and Chrome (74%) $77 Million
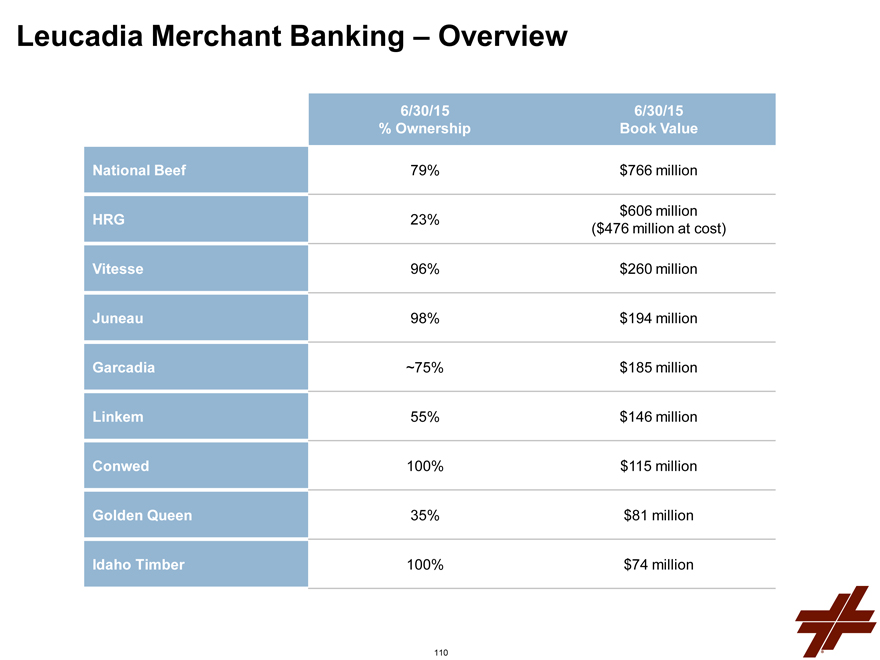
National Beef (79%) $766 Million
HRG Group (23%) $606 Million ($476 Million at Cost)
Vitesse Energy (96%) $260 Million
Juneau Energy (98%) $194 Million
Garcadia (~75%) $185 Million
Linkem (55%) $146 Million
Conwed (100%) $115 Million
Golden Queen (35%) $81 Million
Idaho Timber (100%) $74 Million
Parent Company Cash & Investments $0.9 Billion (1, 5)
Deferred Tax Asset $1.2 Billion (9)
Corporate Other Liabilities, Net $(152) Million
Note: Dollar amounts are Leucadia’s net carrying amount as of 6/30/15 for each investment, for consolidated Golden Queen (35%) subsidiaries equal to their assets less liabilities. $81 Million
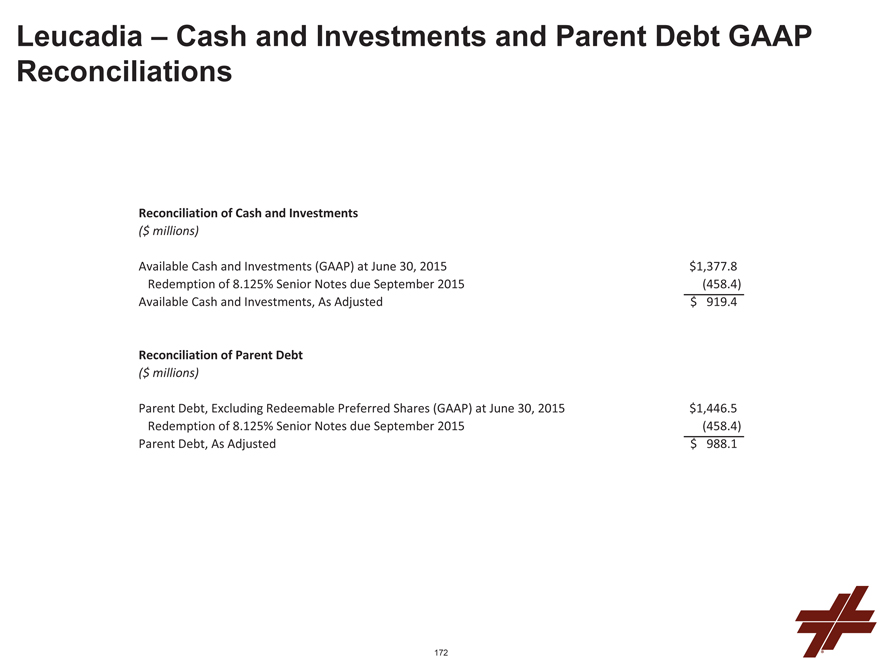
(1) Reduced for payoff at maturity of 2015 8.125% Sr. Notes using Parent Company Cash. See Appendix on page 172 for reconciliation to GAAP amounts. Idaho Timber (100%)
(2) Includes $2.7 billion of goodwill and intangibles. $74 Million
(3) Includes $2.0 billion of goodwill and intangibles.
(4) Adjusted for KCG Holdings’ tender offer completed on 6/9/15, where Jefferies sold 6.5 million shares at $14.00 per share resulting in $91 million of proceeds.
(5) Leucadia Asset Management excludes $348 million of highly liquid marketable securities, available for sale immediately (included in Parent Company Cash & Investments).
(6) Represents the initial cash outlay of $279 million reduced by cash receipts of $95 million as of 6/30/15.
(7) Carrying amount is net of deferred gain on real estate sale.
(8) Market value as of 6/30/15.
(9) Represents the Leucadia net deferred tax asset; the Jefferies net deferred tax asset is reflected within the Jefferies book value presented.
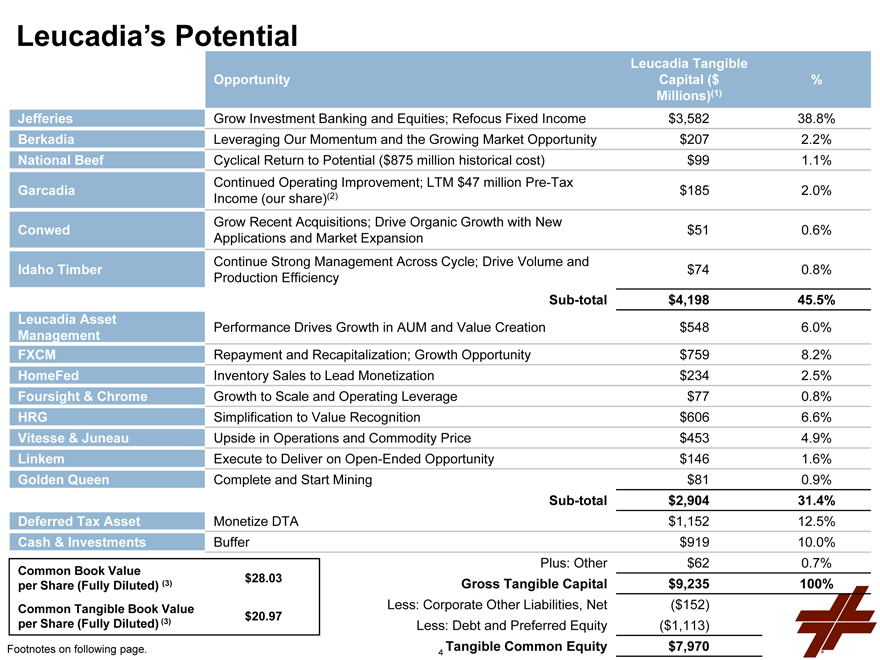
Leucadia’s Potential
Opportunity
Leucadia Tangible Capital ($ Millions)(1)
%
Jefferies Grow Investment Banking and Equities; Refocus Fixed Income $3,582 38.8%
Berkadia Leveraging Our Momentum and the Growing Market Opportunity $207 2.2%
National Beef Cyclical Return to Potential ($875 million historical cost) $99 1.1%
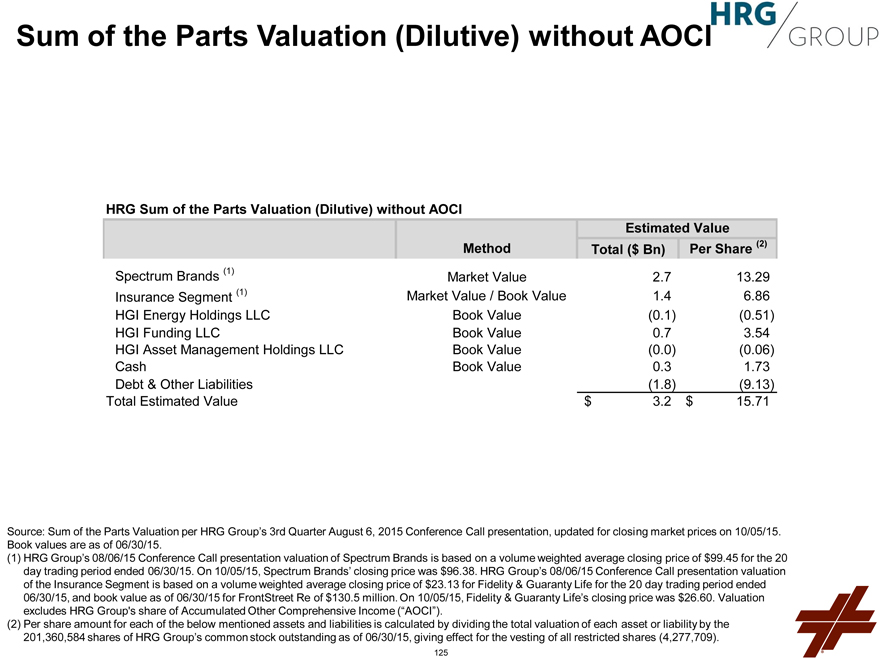
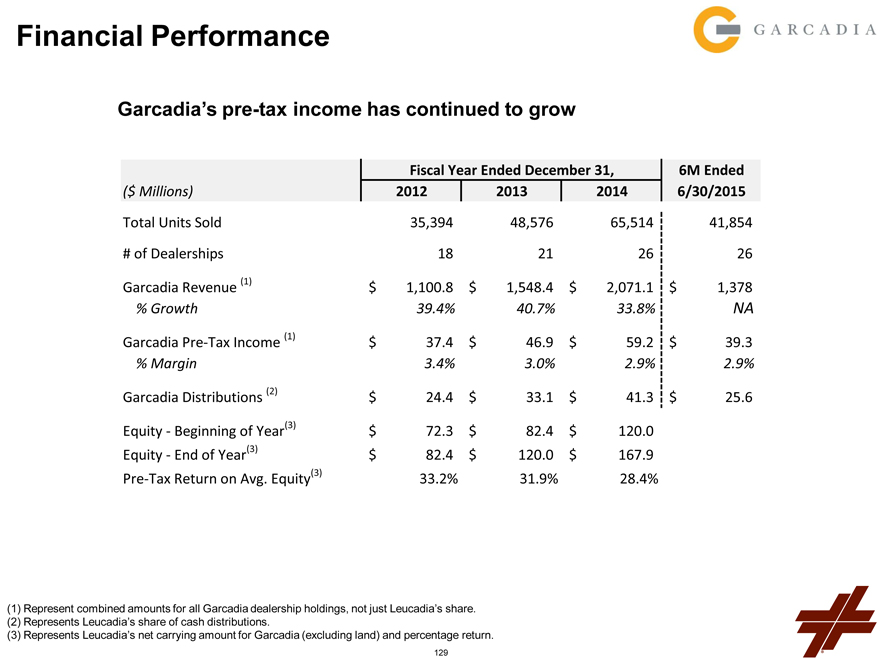
Garcadia Continued Operating Improvement; LTM $47 million Pre-Tax Income (our share)(2) $185 2.0%
Conwed Grow Recent Acquisitions; Drive Organic Growth with New Applications and Market Expansion $51 0.6%
Idaho Timber Continue Strong Management Across Cycle; Drive Volume and Production Efficiency $74 0.8%
Sub-total $4,198 45.5%
Leucadia Asset Management Performance Drives Growth in AUM and Value Creation $548 6.0%
FXCM Repayment and Recapitalization; Growth Opportunity $759 8.2%
HomeFed Inventory Sales to Lead Monetization $234 2.5%
Foursight & Chrome Growth to Scale and Operating Leverage $77 0.8%
HRG Simplification to Value Recognition $606 6.6%
Vitesse & Juneau Upside in Operations and Commodity Price $453 4.9%
Linkem Execute to Deliver on Open-Ended Opportunity $146 1.6%
Golden Queen Complete and Start Mining $81 0.9%
Sub-total $2,904 31.4%
Deferred Tax Asset Monetize DTA $1,152 12.5%
Cash & Investments Buffer $919 10.0%
Plus: Other $62 0.7%
Gross Tangible Capital $9,235 100%
Less: Corporate Other Liabilities, Net($152)
Less: Debt and Preferred Equity($1,113)
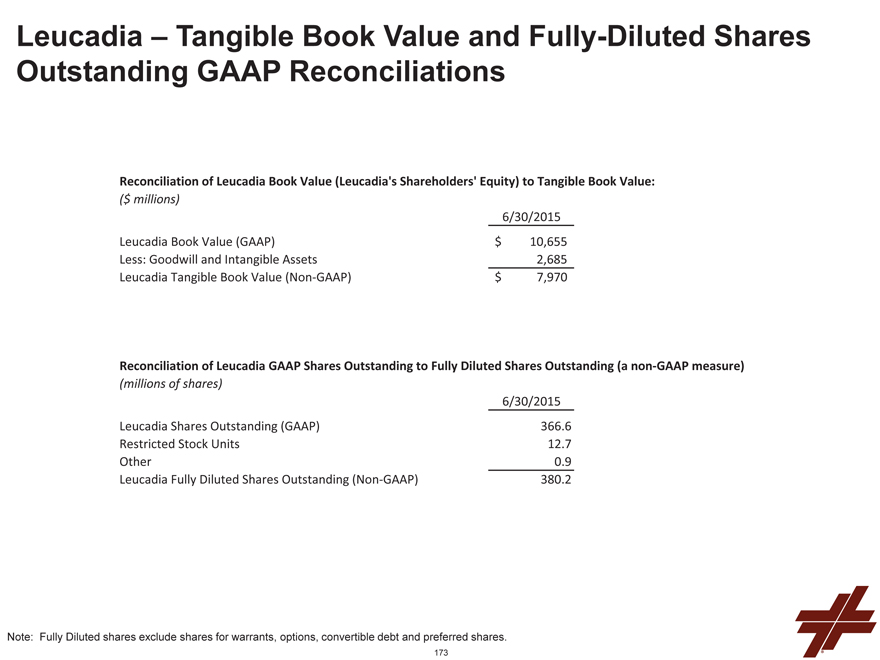
Tangible Common Equity $7,970
Common Book Value $ 28.03
per Share (Fully Diluted) (3)
Common Tangible Book
Value per Share (Fully $ 20.97
Diluted) (3)
Footnotes on following page.
4
Footnotes: Leucadia’s Potential
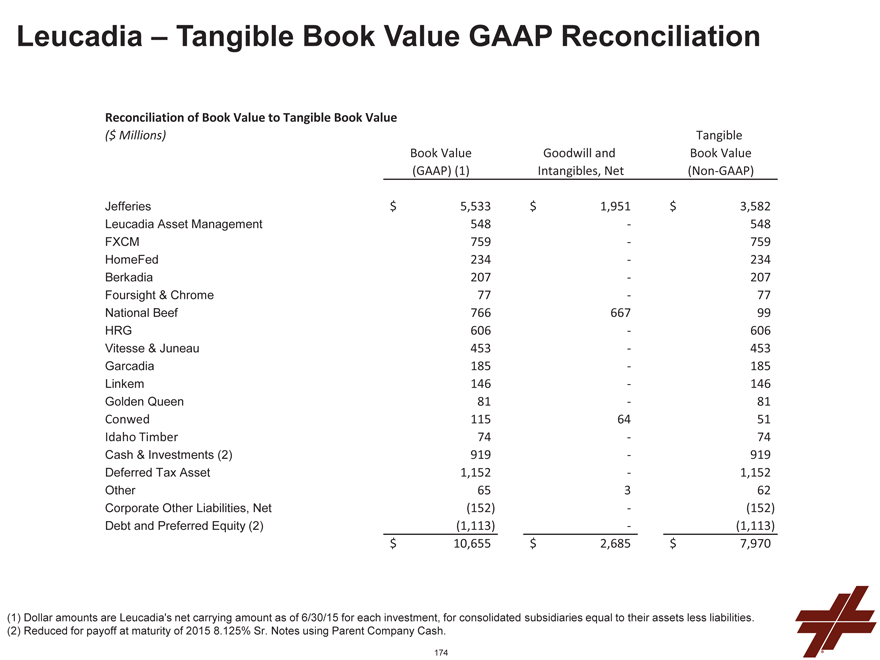
1. Leucadia Tangible Capital is a non-GAAP financial measure excluding goodwill and intangibles from Book Value. See appendix on pages 174 for reconciliation to GAAP measures.
2. Our share of Garcadia pre-tax income, excluding our interest in Garcadia land, is a non-GAAP measure, however, there are no income taxes at the Garcadia level; therefore our share of their net income equals our share of their pre-tax income.
3. Common Book Value per Share (fully-diluted) and Common Tangible Book Value per Share (fully-diluted) are non-GAAP financial measures widely used by investors in assessing investment and financial services firms. See Appendix on page 173 for a reconciliation to GAAP measure.
A Unique Financial Services and Merchant Banking Platform
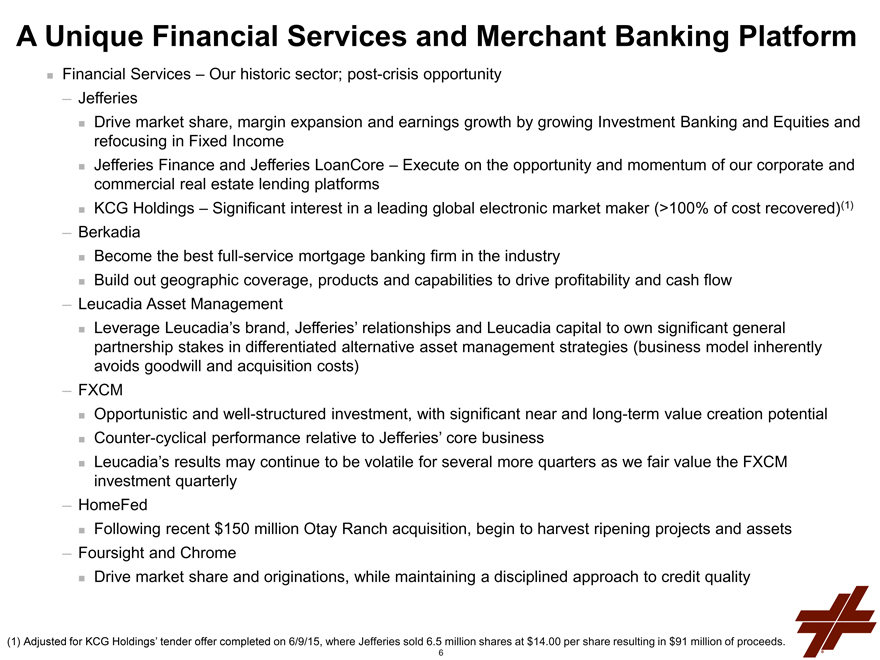
Financial Services – Our historic sector; post-crisis opportunity
Jefferies
Drive market share, margin expansion and earnings growth by growing Investment Banking and Equities and refocusing in Fixed Income
Jefferies Finance and Jefferies LoanCore – Execute on the opportunity and momentum of our corporate and commercial real estate lending platforms
KCG Holdings – Significant interest in a leading global electronic market maker (>100% of cost recovered)(1)
Berkadia
Become the best full-service mortgage banking firm in the industry
Build out geographic coverage, products and capabilities to drive profitability and cash flow
Leucadia Asset Management
Leverage Leucadia’s brand, Jefferies’ relationships and Leucadia capital to own significant general partnership stakes in differentiated alternative asset management strategies (business model inherently avoids goodwill and acquisition costs)
FXCM
Opportunistic and well-structured investment, with significant near and long-term value creation potential
Counter-cyclical performance relative to Jefferies’ core business
Leucadia’s results may continue to be volatile for several more quarters as we fair value the FXCM investment quarterly
HomeFed
Following recent $150 million Otay Ranch acquisition, begin to harvest ripening projects and assets
Foursight and Chrome
Drive market share and originations, while maintaining a disciplined approach to credit quality
(1) Adjusted for KCG Holdings’ tender offer completed on 6/9/15, where Jefferies sold 6.5 million shares at $14.00 per share resulting in $91 million of proceeds.
6
A Unique Financial Services and Merchant Banking Platform
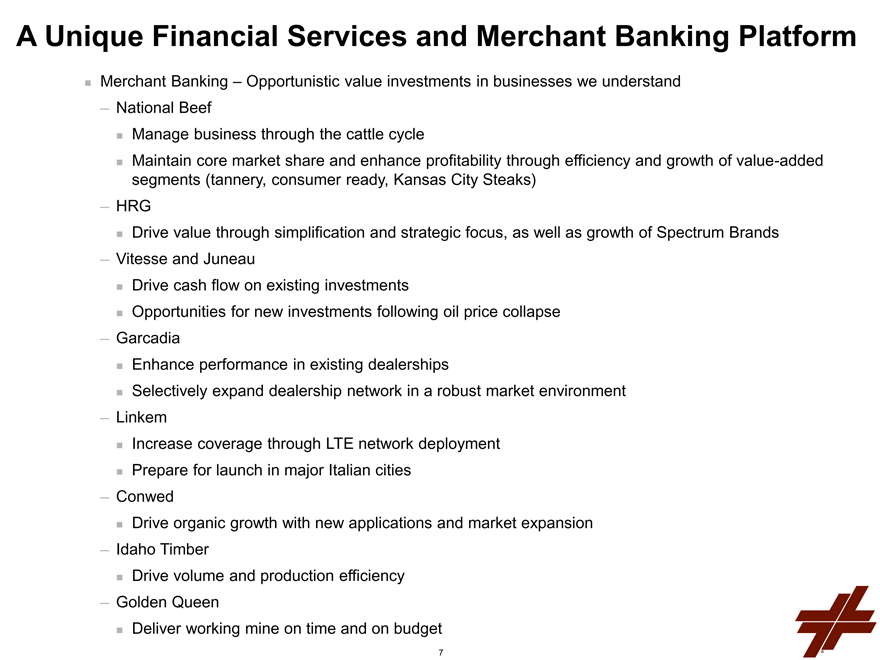
Merchant Banking – Opportunistic value investments in businesses we understand
National Beef
Manage business through the cattle cycle
Maintain core market share and enhance profitability through efficiency and growth of value-added segments (tannery, consumer ready, Kansas City Steaks)
HRG
Drive value through simplification and strategic focus, as well as growth of Spectrum Brands
Vitesse and Juneau
Drive cash flow on existing investments
Opportunities for new investments following oil price collapse
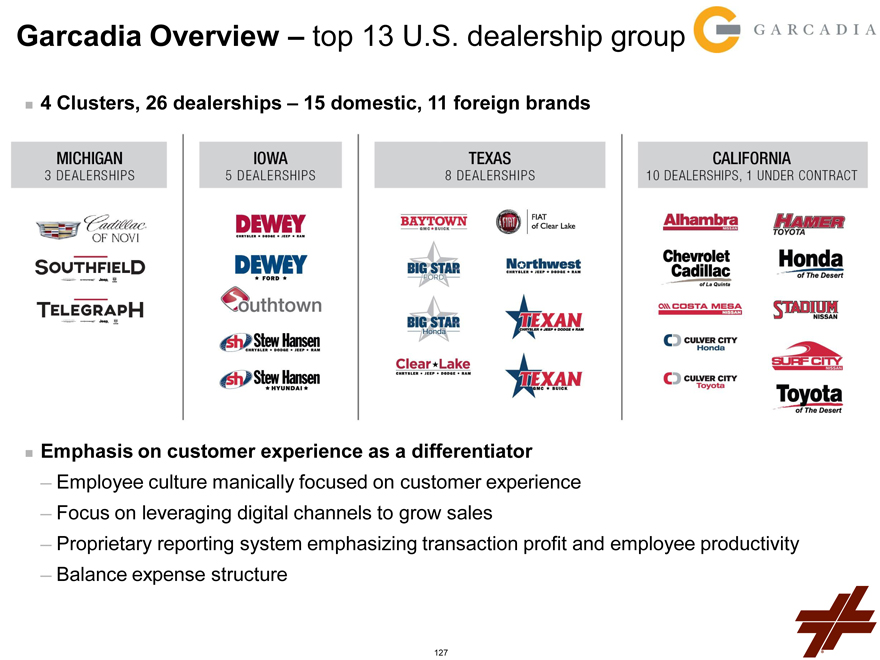
Garcadia
Enhance performance in existing dealerships
Selectively expand dealership network in a robust market environment
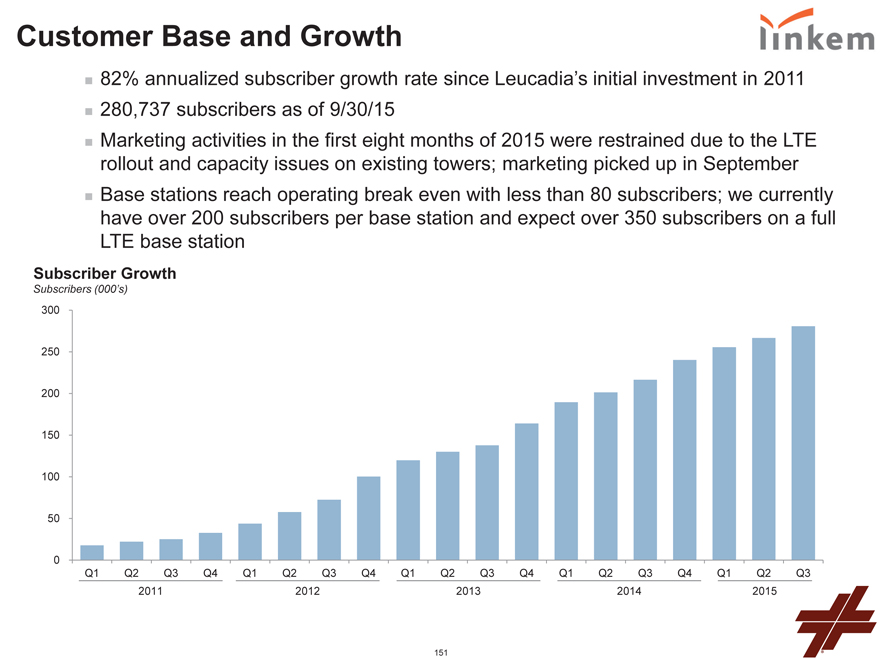
Linkem
Increase coverage through LTE network deployment
Prepare for launch in major Italian cities
Conwed
Drive organic growth with new applications and market expansion
Idaho Timber
Drive volume and production efficiency
Golden Queen
Deliver working mine on time and on budget

Three Q & A’s –
IRQuestions@Leucadia.com

Leucadia Financial Services
8
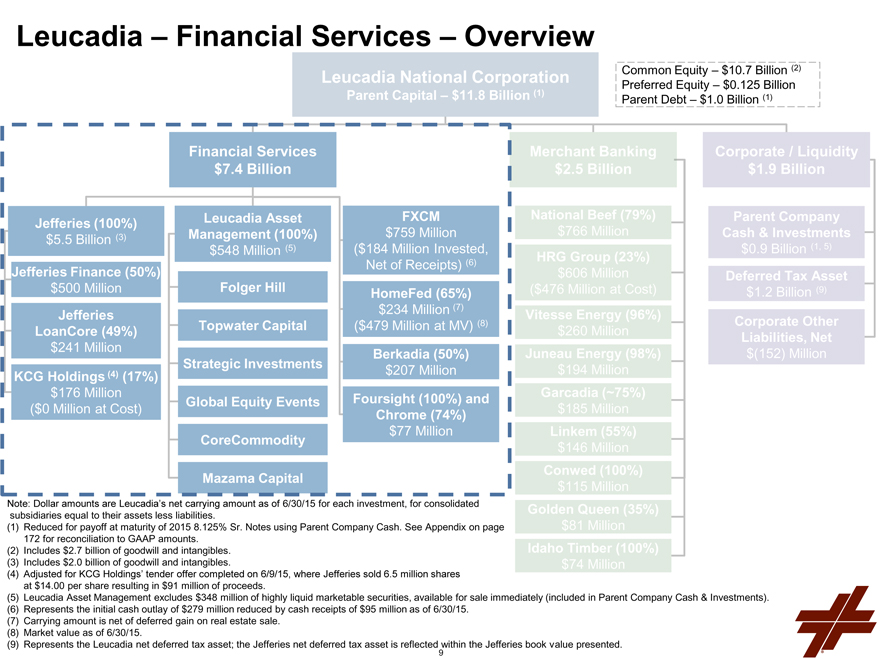
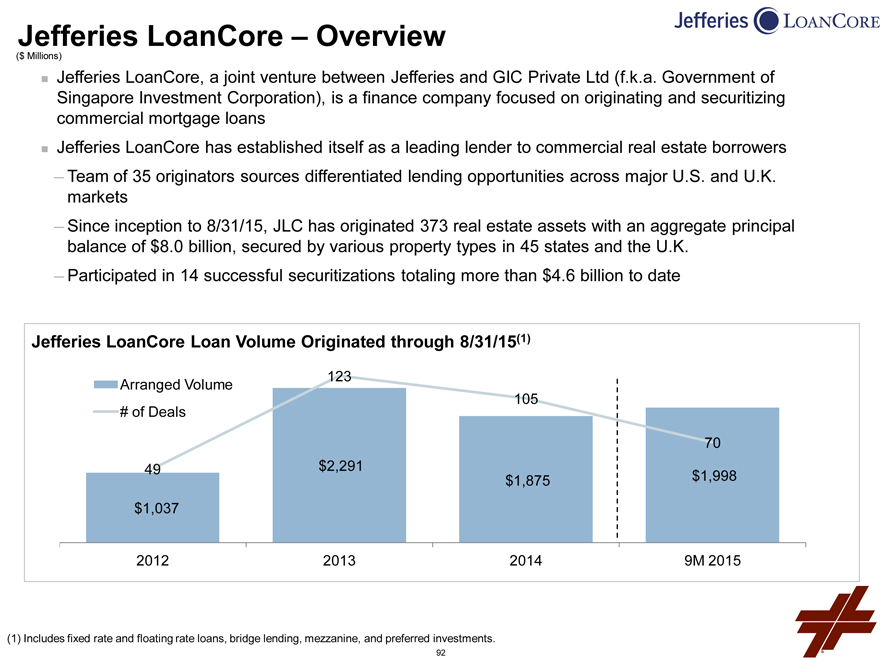
Leucadia – Financial Services – Overview
Leucadia National Corporation
Parent Capital – $11.8 Billion (1)
Common Equity – $10.7 Billion (2) Preferred Equity – $0.125 Billion Parent Debt – $1.0 Billion (1)
Jefferies (100%) $5.5 Billion (3)
Jefferies Finance (50%) $500 Million
Jefferies LoanCore (49%) $241 Million
KCG Holdings (4) (17%) $176 Million
($0 Million at Cost)
Financial Services $7.4 Billion
Leucadia Asset Management (100%) $548 Million (5)
Folger Hill Topwater Capital Strategic Investments Global Equity Events CoreCommodity Mazama Capital
FXCM $759 Million
($184 Million Invested, Net of Receipts) (6)
HomeFed (65%) $234 Million (7)
($479 Million at MV) (8)
Berkadia (50%) $207 Million
Foursight (100%) and Chrome (74%)
$77 Million
Merchant Banking $2.5 Billion
National Beef (79%) $766 Million
HRG Group (23%) $606 Million
($476 Million at Cost)
Vitesse Energy (96%) $260 Million
Juneau Energy (98%) $194 Million
Garcadia (~75%) $185 Million
Linkem (55%) $146 Million
Conwed (100%) $115 Million
Golden Queen (35%)
$81 Million
Idaho Timber (100%)
$74 Million
Corporate / Liquidity $1.9 Billion
Parent Company Cash & Investments $0.9 Billion (1, 5)
Deferred Tax Asset $1.2 Billion (9)
Corporate Other Liabilities, Net $(152) Million
Note: Dollar amounts are Leucadia’s net carrying amount as of 6/30/15 for each investment, for consolidated subsidiaries equal to their assets less liabilities.
(1) Reduced for payoff at maturity of 2015 8.125% Sr. Notes using Parent Company Cash. See Appendix on page 172 for reconciliation to GAAP amounts.
(2) Includes $2.7 billion of goodwill and intangibles. (3) Includes $2.0 billion of goodwill and intangibles.
(4) Adjusted for KCG Holdings’ tender offer completed on 6/9/15, where Jefferies sold 6.5 million shares at $14.00 per share resulting in $91 million of proceeds.
(5) Leucadia Asset Management excludes $348 million of highly liquid marketable securities, available for sale immediately (included in Parent Company Cash & Investments). (6) Represents the initial cash outlay of $279 million reduced by cash receipts of $95 million as of 6/30/15.
(7) Carrying amount is net of deferred gain on real estate sale. (8) Market value as of 6/30/15.
(9) Represents the Leucadia net deferred tax asset; the Jefferies net deferred tax asset is reflected within the Jefferies book value presented.
9

BERKADIA
10
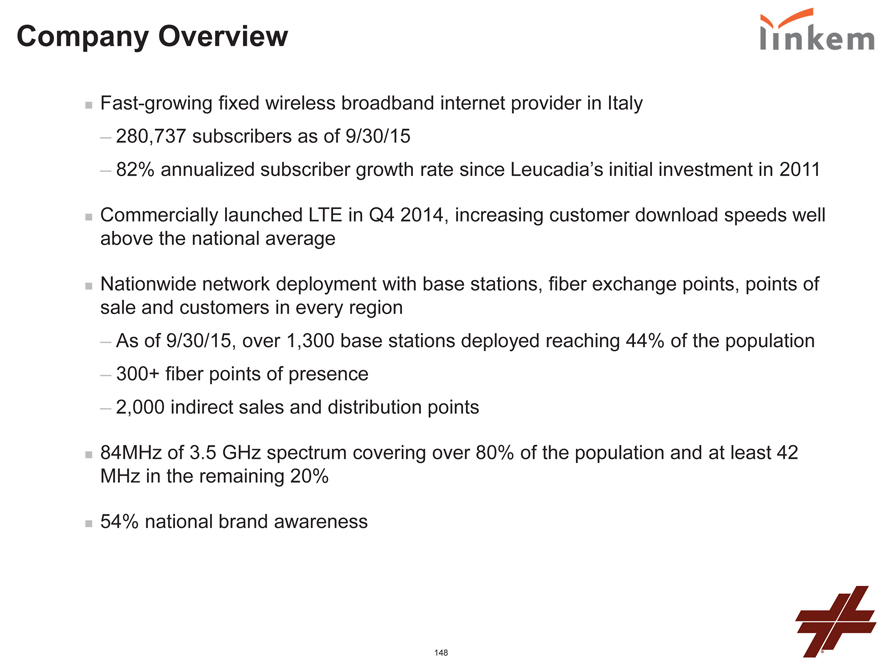
Company Overview
Berkadia is a full-service mortgage banking firm focused on providing clients best of class middle market mortgage finance and advisory services
Business Lines:
Permanent and construction loans
Investment Sales
Bridge Loans
Master/Primary Servicing
Largest FHA commercial real estate lender by # of commitments 2nd largest FHLMC commercial real estate lender by $ volume 3rd largest FNMA commercial real estate lender by $ volume 3rd largest servicer of U.S. commercial real estate loans by $ volume
11
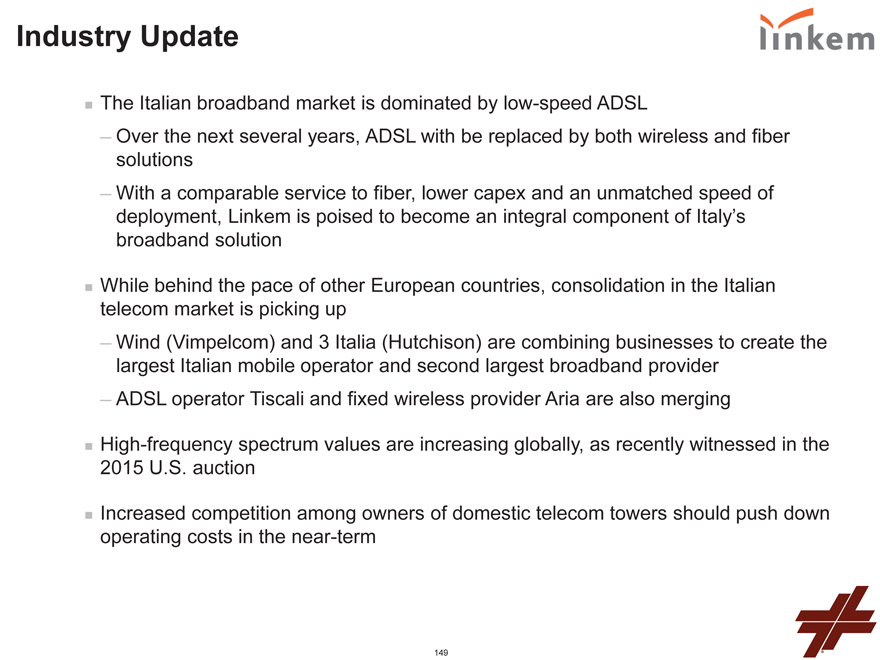
Industry Update
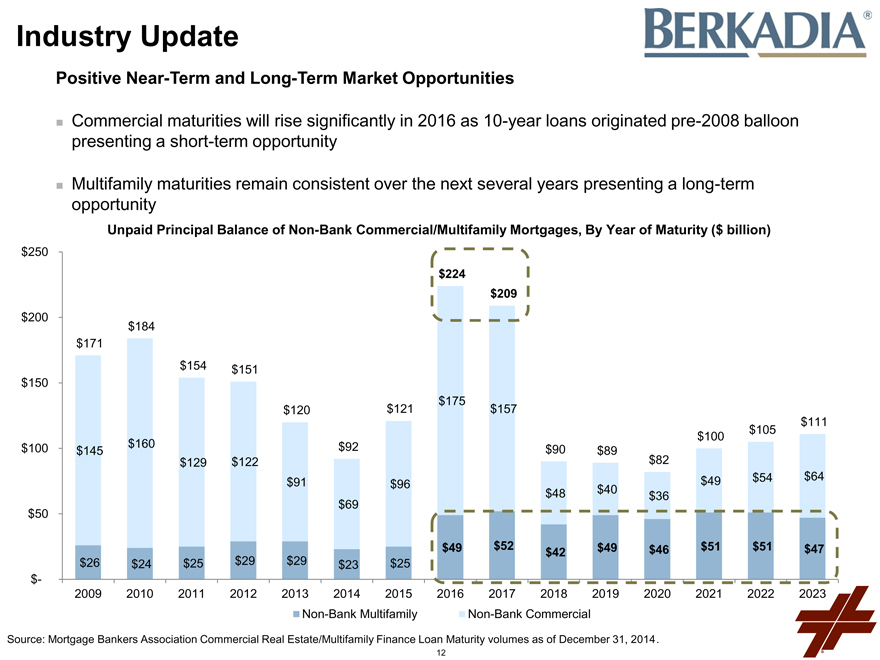
Positive Near-Term and Long-Term Market Opportunities
Commercial maturities will rise significantly in 2016 as 10-year loans originated pre-2008 balloon presenting a short-term opportunity
Multifamily maturities remain consistent over the next several years presenting a long-term opportunity
Unpaid Principal Balance of Non-Bank Commercial/Multifamily Mortgages, By Year of Maturity ($ billion)
$250 $224 $209 $200 $184 $171 $154 $151 $150 $175 $120 $121 $157 $111 $105 $100 $100 $160 $92 $145 $90 $89 $82 $129 $122
$49 $54 $64
$91 $96
$48 $40 $36 $69 $50
$49 $52 $49 $46 $51 $51 $47 $42
$26 $24 $25 $29 $29 $23 $25 $-
2009 2010 2011 2012 2013 2014 2015 2016 2017 2018 2019 2020 2021 2022 2023
Non-Bank Multifamily Non-Bank Commercial
Source: Mortgage Bankers Association Commercial Real Estate/Multifamily Finance Loan Maturity volumes as of December 31, 2014.
12
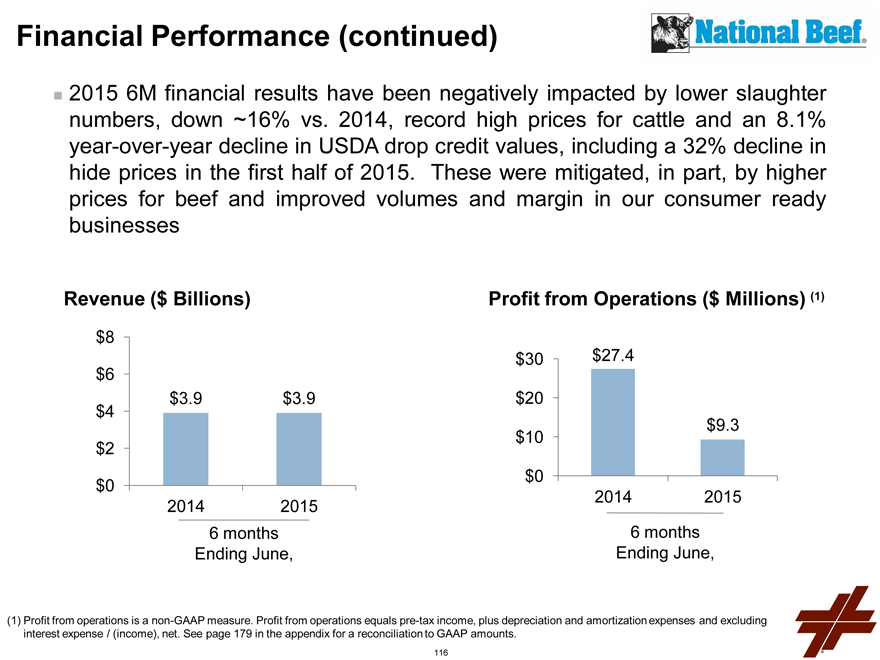
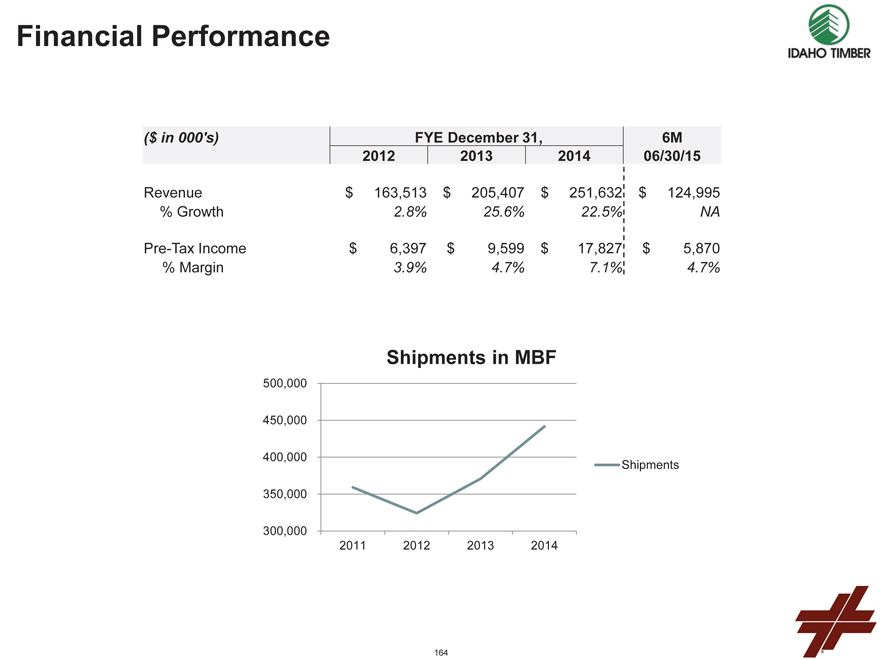
Financial Performance
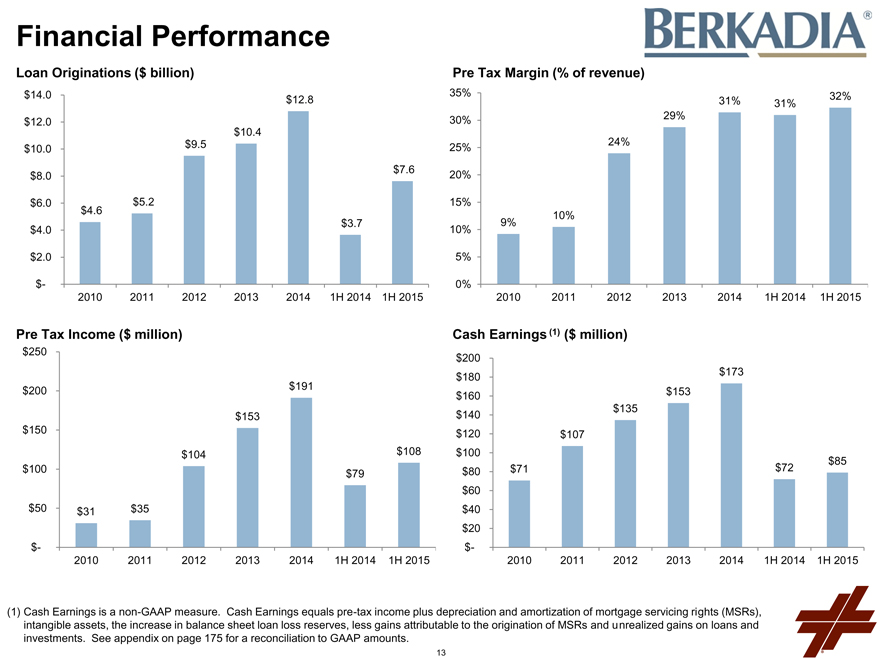
Loan Originations ($ billion)
Pre Tax Margin (% of revenue)
$14.0 $12.8
$12.0 $10.4 $10.0 $9.5
$7.6
$8.0
$6.0 $5.2
$4.6
$3.7
$4.0
$2.0
$-
2010 2011 2012 2013 2014 1H 2014 1H 2015
35% 32% 31% 31% 30% 29% 24% 25%
20%
15%
10% 9% 10%
5%
0%
2010 2011 2012 2013 2014 1H 2014 1H 2015
Pre Tax Income ($ million)
$250
$200 $191 $153 $150 $104 $108 $100 $79
$50 $31 $35
$-
2010 2011 2012 2013 2014 1H 2014 1H 2015
Cash Earnings (1) ($ million)
$200 $173 $180 $160 $153 $135 $140 $120 $107 $100 $85
$80 $71 $72 $60 $40 $20 $-
2010 2011 2012 2013 2014 1H 2014 1H 2015
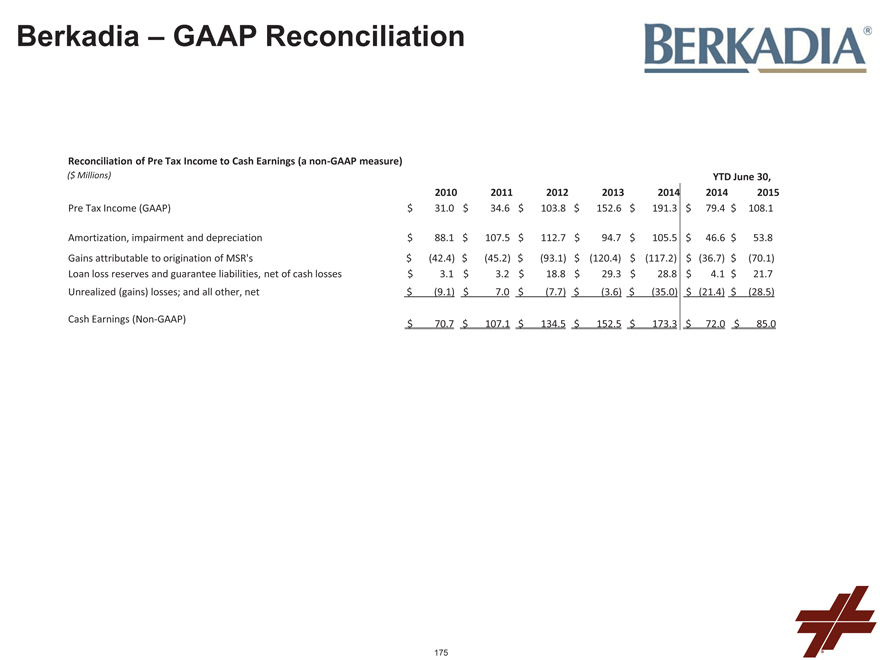
(1) Cash Earnings is a non-GAAP measure. Cash Earnings equals pre-tax income plus depreciation and amortization of mortgage servicing rights (MSRs), intangible assets, the increase in balance sheet loan loss reserves, less gains attributable to the origination of MSRs and unrealized gains on loans and investments. See appendix on page 175 for a reconciliation to GAAP amounts.
13
Servicing Portfolio
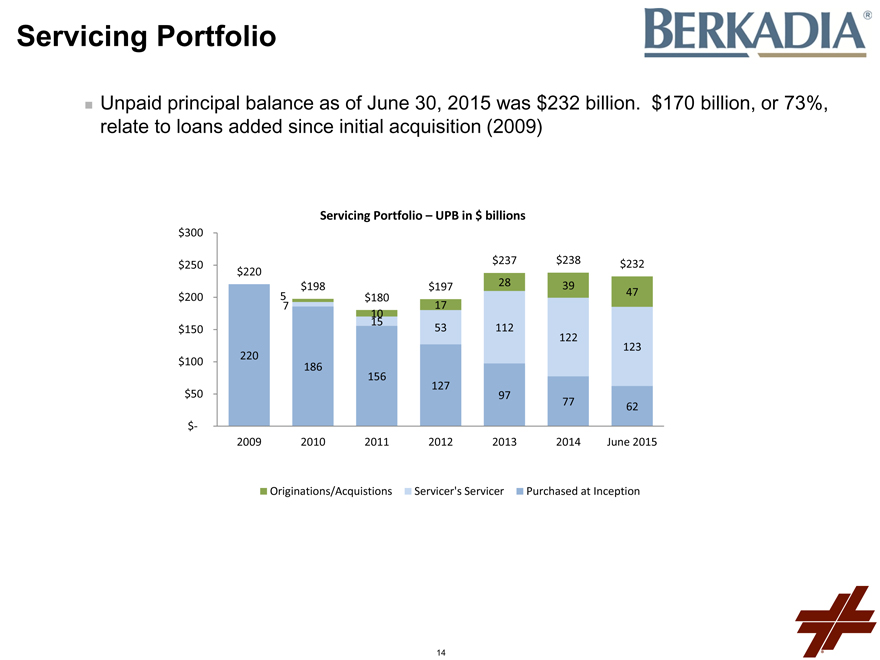
Unpaid principal balance as of June 30, 2015 was $232 billion. $170 billion, or 73%, relate to loans added since initial acquisition (2009)
Servicing Portfolio – UPB in $ billions
$300
$237 $238 $232 $250 $220 $198 $197 28 39 47 $200 5 7 $180 17 10 15 $150 53 112 122 123 220 $100 186 156 127
$50 97
77
62 $-2009 2010 2011 2012 2013 2014 June 2015
Originations/Acquistions Servicer’s Servicer Purchased at Inception
14
2015 Developments
Berkadia’s 1H benefited from industry activity being significantly up year over year
Our debt originations were up 109% compared to 1H 2014
Our sales transactions were up 76% compared to 1H 2014
Recruiting success
Recruited 11 new Mortgage Bankers. Our MB team is currently 135
Recruited 18 new Investment Sales advisors. Our IS team is currently 107
Established / expanded specialty groups Hospitality Affordable Housing Student Housing
Integration
Out of 59 total Mortgage Banking and Investment Sales locations, our Mortgage Banking and Investment Sales teams are co-located at 13 locations:
Offer combination of services to clients, including Investment Sales, Conventional and FHA
Banking, underwriting, and equity investment in same location
Round trips increased from negligible levels in 2014 to 16% in 1H 2015. A roundtrip is defined as a transaction where we act as both sales advisor and debt originator
15
2015-2016 Strategic Priorities
Increase Business with Existing Clients
Unique Ideas, Proprietary Databases and Solutions
Speed
Expand Client Reach
Rifle-Shot Recruiting
Continued Integration of Offices / Team Approach
Drive Profitability and Cash Flow
Market Share and Revenue Growth
Process and Technology Improvements
Relentlessly.
16
FXCM LISTED NYSE
FXCM
17
Note on Forward Looking Statements
Certain statements contained herein may constitute “forward-looking statements” within the meaning of Section 27A of the Securities Act of 1933, Section 21E of the Securities Exchange Act of 1934 and/or the Private Securities Litigation Reform Act of 1995, which reflect FXCM’s current views with respect to, among other things, its operations and financial performance in the future, and the potential impact to FXCM of the cybersecurity incident described in this press release. These forward-looking statements are not historical facts and are based on current expectations, estimates and projections about FXCM’s industry, management’s beliefs and certain assumptions made by management, many of which, by their nature, are inherently uncertain and beyond our control. Accordingly, readers are cautioned that any such forward-looking statements are not guarantees of future performance and are subject to certain risks, uncertainties and assumptions that are difficult to predict including, without limitation, risks associated with the events that took place in the currency markets on January 15, 2015 and their impact on FXCM’s capital structure, risks associated with FXCM’s ability to recover all or a portion of any capital losses, risks relating to the ability of FXCM to satisfy the terms and conditions of or make payments pursuant to the terms of the credit agreement with Leucadia, risks related to FXCM’s dependence on FX market makers, market conditions, risks associated with the outcome of any potential litigation or regulatory inquiries to which FXCM may become subject as a result of this cybersecurity incident, risks associated with potential reputational damage to FXCM resulting from this cybersecurity incident, the outcome of FXCM’s ongoing investigation (including FXCM’s potential discovery of additional information relating to this cybersecurity incident) and the extent of remediation costs and other additional expenses that may be incurred by FXCM as a result of this security incident, and those other risks described under “Risk Factors” in FXCM Inc.‘s Annual Report on Form 10-K and other reports or documents FXCM files with, or furnishes to, the SEC from time to time, which are accessible on the SEC website at sec.gov. This information should also be read in conjunction with FXCM’s Consolidated Financial Statements and the Notes thereto contained in FXCM’s Annual Report on Form 10-K, and in other reports or documents the FXCM files with, or furnishes to, the SEC from time to time, which are accessible on the SEC website at sec.gov.
18
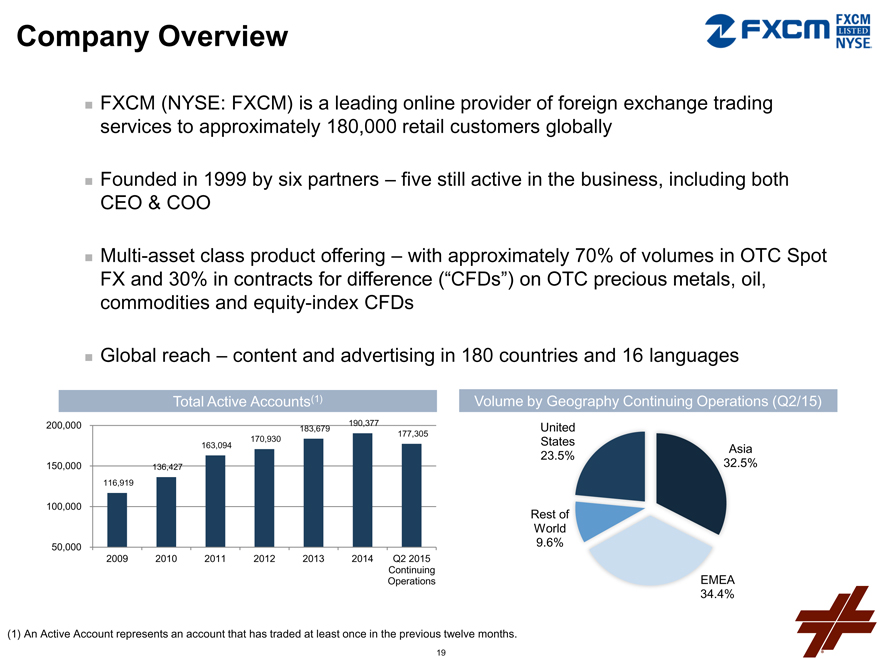
Company Overview
FXCM (NYSE: FXCM) is a leading online provider of foreign exchange trading services to approximately 180,000 retail customers globally
Founded in 1999 by six partners – five still active in the business, including both CEO & COO
Multi-asset class product offering – with approximately 70% of volumes in OTC Spot
FX and 30% in contracts for difference (“CFDs”) on OTC precious metals, oil, commodities and equity-index CFDs
Global reach – content and advertising in 180 countries and 16 languages
Total Active Accounts(1)
200,000 190,377 183,679
177,305 170,930 163,094
150,000 136,427 116,919
100,000
50,000
2009 2010 2011 2012 2013 2014 Q2 2015 Continuing Operations
Volume by Geography Continuing Operations (Q2/15)
United States
Asia 23.5% 32.5%
Rest of World
9.6%
EMEA 34.4%
(1) An Active Account represents an account that has traded at least once in the previous twelve months.
19
Transaction Summary
2014 adjusted revenues of $453 million and adjusted EBITDA of $107 million; market capitalization of $1.2 billion prior to Swiss National Bank (“SNB”) currency adjustment
Leucadia provided a two-year $300 million secured financing in January 2015 to support the capital shortfall that resulted from extraordinary volatility in the Swiss Franc as a result of the action taken by the SNB on January 15, 2015
$203 million remains outstanding today, which is expected to be repaid in the next 6 months, and Leucadia has realized $148 million from principal repayments, interest and fees through September 30, 2015
Leucadia is entitled to a percentage of the proceeds received in connection with certain transactions, including sale proceeds, dividends and distributions
20
Industry Update
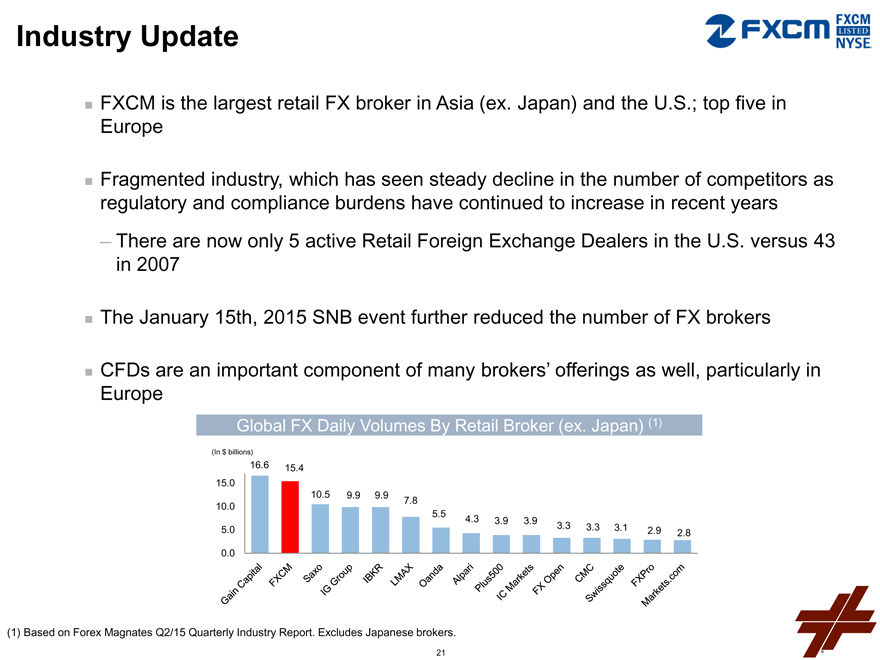
FXCM is the largest retail FX broker in Asia (ex. Japan) and the U.S.; top five in Europe
Fragmented industry, which has seen steady decline in the number of competitors as regulatory and compliance burdens have continued to increase in recent years
There are now only 5 active Retail Foreign Exchange Dealers in the U.S. versus 43 in 2007
The January 15th, 2015 SNB event further reduced the number of FX brokers
CFDs are an important component of many brokers’ offerings as well, particularly in Europe
Global FX Daily Volumes By Retail Broker (ex. Japan) (1)
(In $ billions)
16.6 15.4
15.0
10.5 9.9 9.9
7.8 10.0
5.5 4.3
3.9 3.9 3.3
5.0 3.3 3.1 2.9
2.8
0.0
Gain Capital FXCM Saxo IG Group IBKR LMAX ONDA Alpari Plus500 IC MARKETS FXOpen CMC Swissquote FXPro Markets.com
(1) Based on Forex Magnates Q2/15 Quarterly Industry Report. Excludes Japanese brokers.
21
Financial Performance
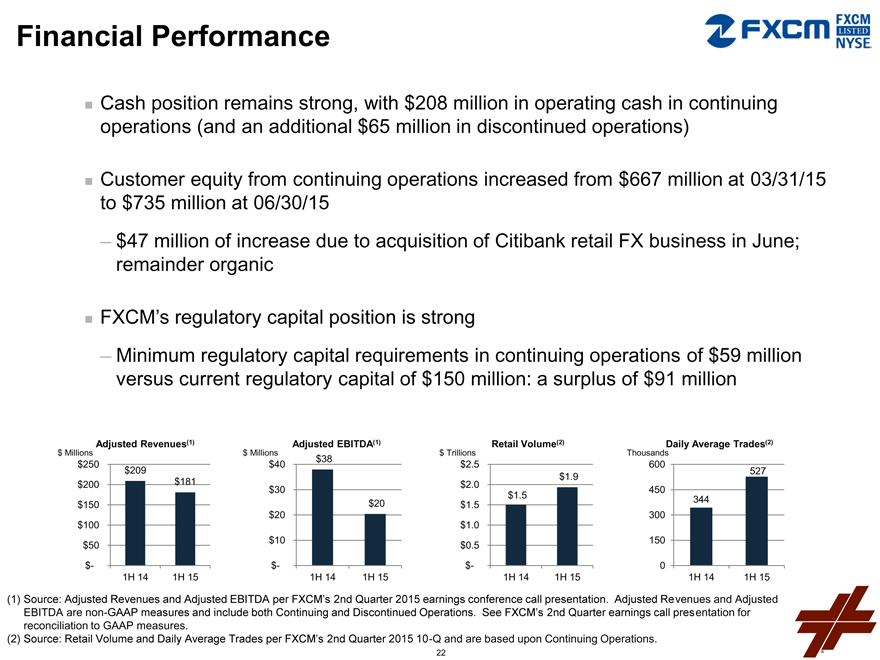
Cash position remains strong, with $208 million in operating cash in continuing
operations (and an additional $65 million in discontinued operations)
Customer equity from continuing operations increased from $667 million at 03/31/15
to $735 million at 06/30/15
$47 million of increase due to acquisition of Citibank retail FX business in June;
remainder organic
FXCM’s regulatory capital position is strong
Minimum regulatory capital requirements in continuing operations of $59 million
versus current regulatory capital of $150 million: a surplus of $91 million
Adjusted Revenues(1) $ Millions $250 $209 $200 $181 $150
$100
$50
$-
1H 14 1H 15
Adjusted EBITDA(1) $ Millions $38 $40
$30 $20 $20
$10
$-
1H 14 1H 15
Retail Volume(2) $ Trillions
$2.5
$1.9
$2.0
$1.5
$1.5
$1.0
$0.5
$-
1H 14 1H 15
Daily Average Trades(2)
Thousands
600
527 450 344 300
150
0
1H 14 1H 15
(1) Source: Adjusted Revenues and Adjusted EBITDA per FXCM’s 2nd Quarter 2015 earnings conference call presentation. Adjusted Revenues and Adjusted EBITDA are non-GAAP measures and include both Continuing and Discontinued Operations. See FXCM’s 2nd Quarter earnings call presentation for reconciliation to GAAP measures.
(2) Source: Retail Volume and Daily Average Trades per FXCM’s 2nd Quarter 2015 10-Q and are based upon Continuing Operations.
22
2015 Developments
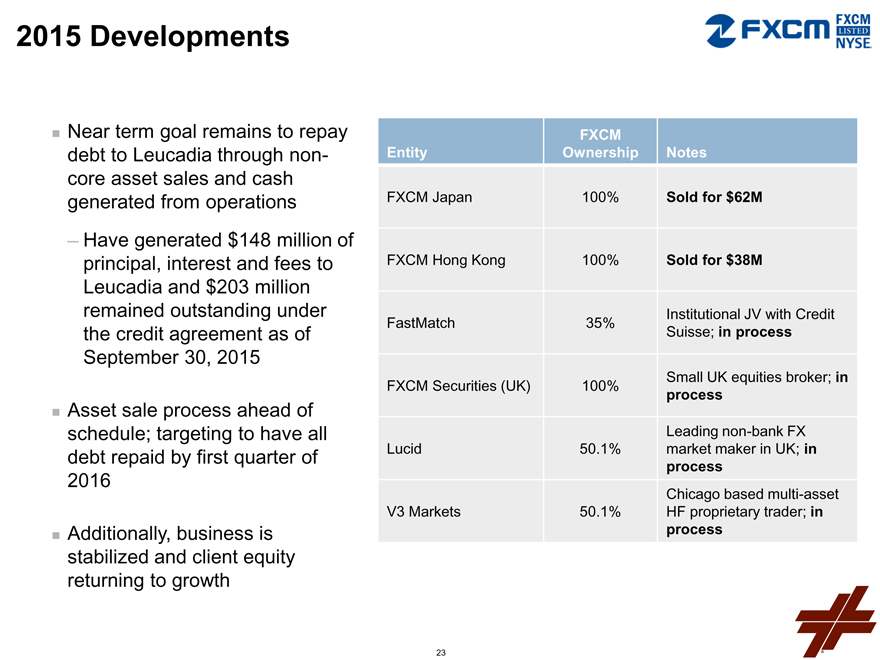
Near term goal remains to repay debt to Leucadia through non-core asset sales and cash generated from operations
Have generated $148 million of principal, interest and fees to Leucadia and $203 million remained outstanding under the credit agreement as of September 30, 2015
Asset sale process ahead of schedule; targeting to have all debt repaid by first quarter of 2016
Additionally, business is stabilized and client equity returning to growth
FXCM
Entity Ownership Notes
FXCM Japan 100% Sold for $ 62M
FXCM Hong Kong 100% Sold for $ 38M
FastMatch 35% Institutional JV with Credit
Suisse; in process
FXCM Securities (UK) 100% Small UK equities broker; in
process
Leading non-bank FX
Lucid 50.1% market maker in UK; in
process
Chicago based multi-asset
V3 Markets 50.1% HF proprietary trader; in
process
23
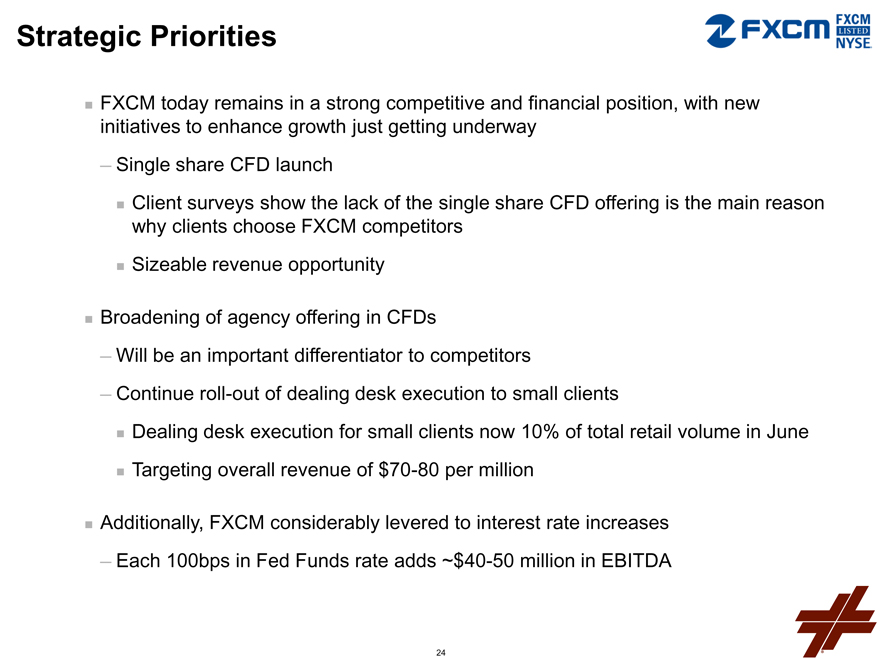
Strategic Priorities
FXCM today remains in a strong competitive and financial position, with new initiatives to enhance growth just getting underway
Single share CFD launch
Client surveys show the lack of the single share CFD offering is the main reason why clients choose FXCM competitors Sizeable revenue opportunity
Broadening of agency offering in CFDs
Will be an important differentiator to competitors
Continue roll-out of dealing desk execution to small clients
Dealing desk execution for small clients now 10% of total retail volume in June
Targeting overall revenue of $70-80 per million
Additionally, FXCM considerably levered to interest rate increases
Each 100bps in Fed Funds rate adds ~$40-50 million in EBITDA
24

HOMEFED CORPORATION
25
Company Overview
HomeFed is a public company (OTC:HOFD), 65% owned by Leucadia, that develops and owns residential and mixed-use real estate projects in California, Florida, Maine, New York, South Carolina and Virginia; after many years in the entitlement process, vast majority of HomeFed’s assets are now either operating real estate or entitled land ready for sale
Activities include:
Acquisition of unentitled, partially entitled or entitled land
Land planning and design engineering
Entitlement and permitting of project with local, state and federal agencies
Grading and construction of public infrastructure and other facilities
Master planned community formation, governance and sales to national and local builders
Oversight and management of operating assets
HOMEFED CORPORATION
26

Property Locations
Rampage Vineyard
Pacho
San Elijo Hills
Fanita Ranch
Otay Ranch
Northeast Point
Renaissance Plaza
Ashville Park
The Market Common
SweetBay
Mexico
United States
Gulf of Mexico
27
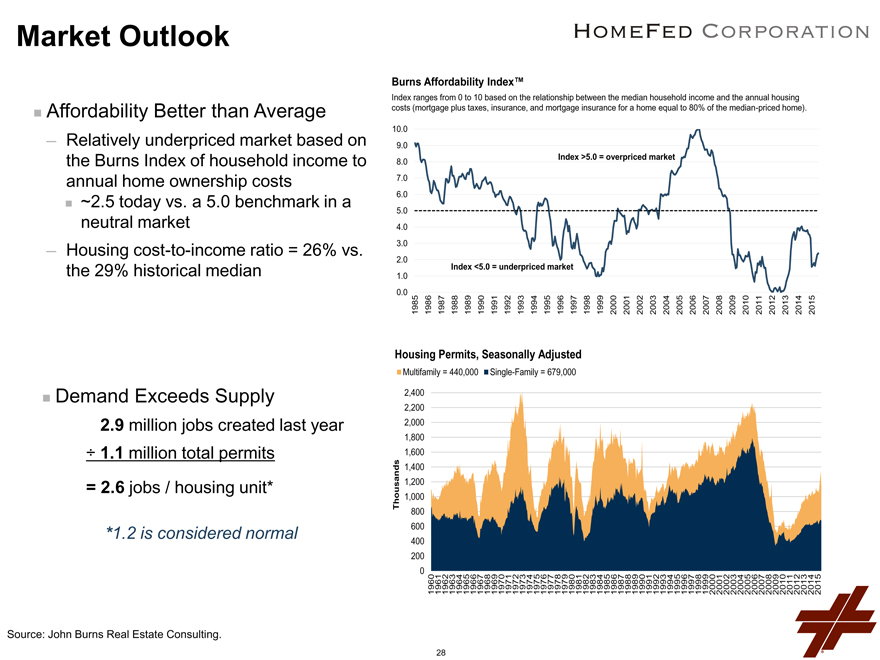
Market Outlook
Affordability Better than Average
Relatively underpriced market based on the Burns Index of household income to annual home ownership costs
~2.5 today vs. a 5.0 benchmark in a neutral market
Housing cost-to-income ratio = 26% vs. the 29% historical median
Demand Exceeds Supply
2.9 million jobs created last year
÷ 1.1 million total permits
= 2.6 jobs / housing unit*
*1.2 is considered normal
Burns Affordability Index™
Index ranges from 0 to 10 based on the relationship between the median household income and the annual housing costs (mortgage plus taxes, insurance, and mortgage insurance for a home equal to 80% of the median-priced home).
10.0
9.0
Index >5.0 = overpriced market
8.0
7.0
6.0
5.0
4.0
3.0
2.0
Index <5.0 = underpriced market
1.0
0.0 1985 1986 1987 1988 1989 1990 1991 1992 1993 1994 1995 1996 1997 1998 1999 2000 2001 2002 2003 2004 2005 2006 2007 2008 2009 2010 2011 2012 2013 2014 2015
Source: John Burns Real Estate Consulting, LLC BHVI (Data: Jul-15, 2.4 Current; Pub: Aug-15)
Housing Permits, Seasonally Adjusted
Multifamily = 440,000 Single-Family = 679,000
Source: Thousands
Census 0 200 400 600 800 1,000 1,200 1,400 1,600 1,800 2,000 2,200 2,400
1960
1961
Bureau 1962
1963
(Data: 1964
1965
Jul 1966
-
15, 1967
Pub: 1969 1968
Aug 1971 1970
-
15) 1972
1973
1974
1975
1976
1977
1978
1979
1980
1981
1982
1983
1984
1985
1986
1987
1988
1989
1990
1991
1992
1993
1994
1995
1996
1997
1998
1999
2000
2001
2002
2003
2004
2005
2006
2007
2008
2009
2010
2011
2012
2013
2014
2015
28
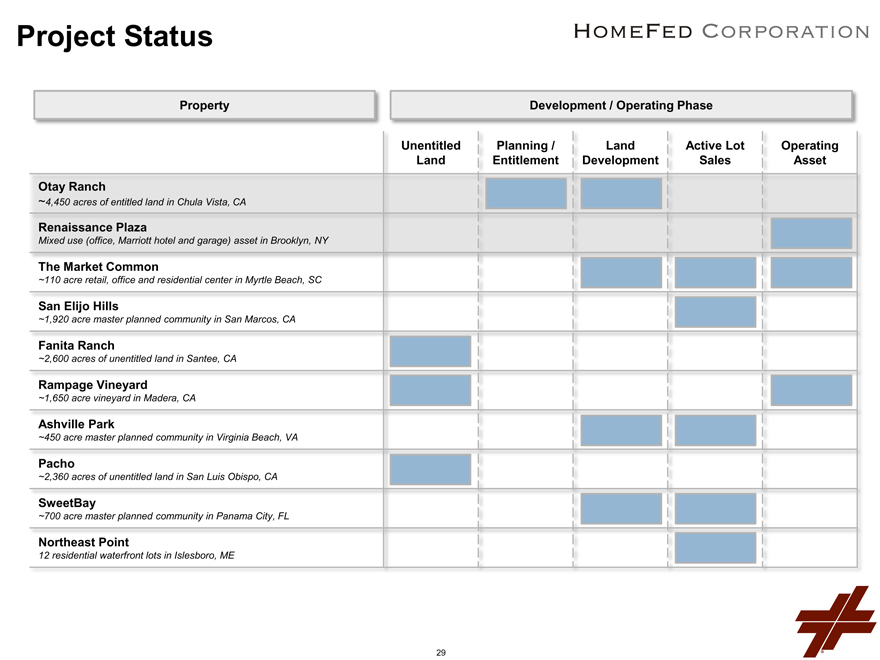
Project Status
Property
Development / Operating Phase
Unentitled
Land Planning /
Entitlement Land
Development Active Lot
Sales Operating
Asset
Otay Ranch
~4,450 acres of entitled land in Chula Vista, CA
Renaissance Plaza
Mixed use (office, Marriott hotel and garage) asset in Brooklyn, NY
The Market Common
~110 acre retail, office and residential center in Myrtle Beach, SC
San Elijo Hills
~1,920 acre master planned community in San Marcos, CA
Fanita Ranch
~2,600 acres of unentitled land in Santee, CA
Rampage Vineyard
~1,650 acre vineyard in Madera, CA
Ashville Park
~450 acre master planned community in Virginia Beach, VA
Pacho
~2,360 acres of unentitled land in San Luis Obispo, CA
SweetBay
~700 acre master planned community in Panama City, FL
Northeast Point
12 residential waterfront lots in Islesboro, ME
29
2015 Developments
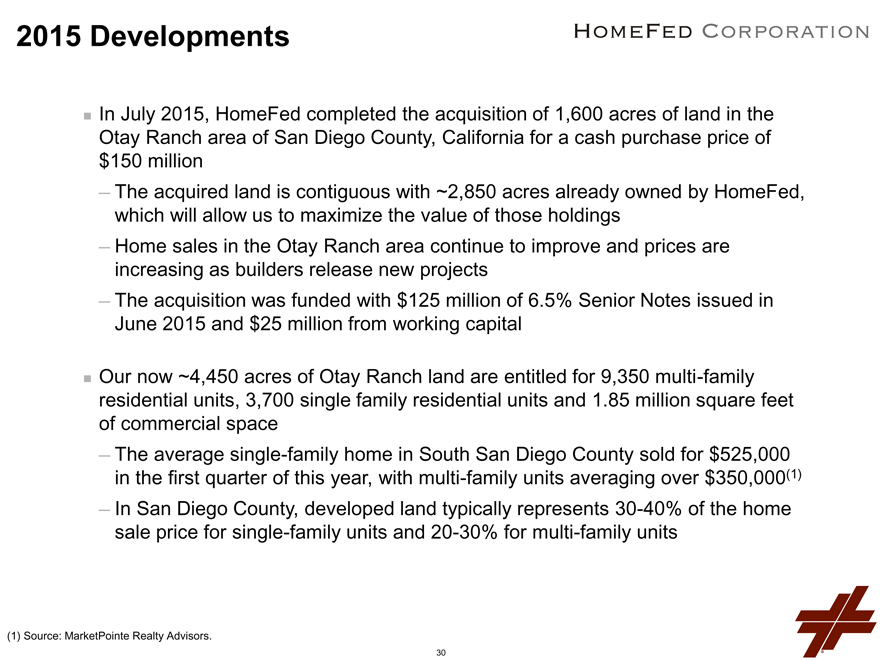
In July 2015, HomeFed completed the acquisition of 1,600 acres of land in the Otay Ranch area of San Diego County, California for a cash purchase price of $150 million
The acquired land is contiguous with ~2,850 acres already owned by HomeFed, which will allow us to maximize the value of those holdings
Home sales in the Otay Ranch area continue to improve and prices are increasing as builders release new projects
The acquisition was funded with $125 million of 6.5% Senior Notes issued in June 2015 and $25 million from working capital
Our now ~4,450 acres of Otay Ranch land are entitled for 9,350 multi-family residential units, 3,700 single family residential units and 1.85 million square feet of commercial space
The average single-family home in South San Diego County sold for $525,000 in the first quarter of this year, with multi-family units averaging over $350,000(1)
In San Diego County, developed land typically represents 30-40% of the home sale price for single-family units and 20-30% for multi-family units
(1) Source: MarketPointe Realty Advisors.
30
Strategic Priorities
Turn our land into cash
Optimize Otay Ranch assets – focus on expediting development programs and maximizing revenue over the coming years Increase lot and home sales throughout our other active projects, including:
Ashville Park in Virginia
The Market Common in South Carolina
San Elijo Hills in California
SweetBay in Florida
Develop land strategically and continue entitlement processes where ongoing
31
Foursight Capital
32
Company Overview
Auto loan originator and servicer
Successor to Franklin Capital’s auto finance business
Franklin was liquidated in early 2012 after pulling back during the credit crisis
Funded and serviced $5.2 billion of cumulative auto receivables and serviced a peak $1.2 billion portfolio
Leucadia partnered with management to restart the business, initially leveraging originations from Garcadia, but most of the growth has come from 3rd party dealerships
80% of Q2 ’15 originations from 3rd party dealerships, up from 70% in Q4 ’14
33
Industry Update
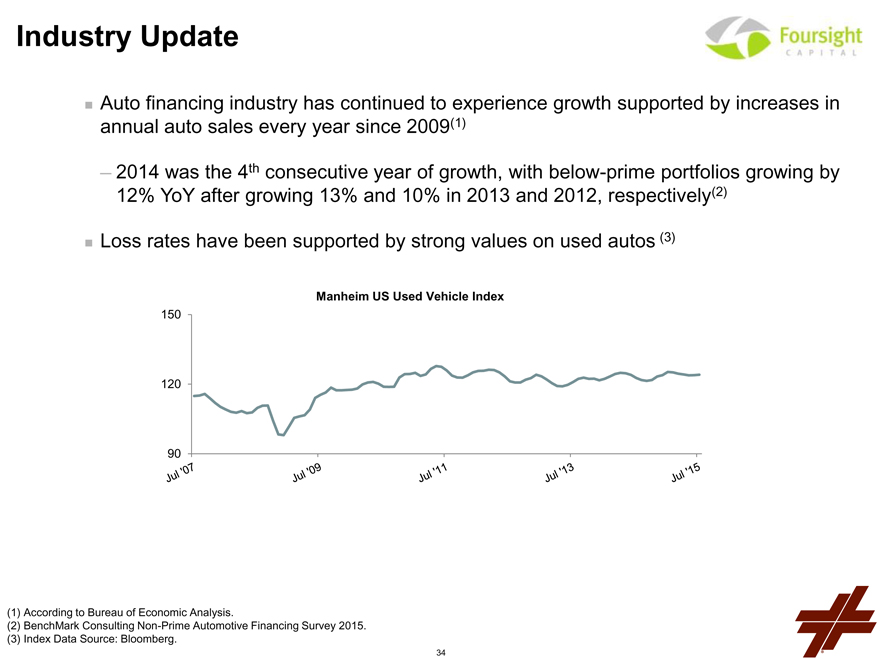
Auto financing industry has continued to experience growth supported by increases in annual auto sales every year since 2009(1)
2014 was the 4th consecutive year of growth, with below-prime portfolios growing by 12% YoY after growing 13% and 10% in 2013 and 2012, respectively(2)
Loss rates have been supported by strong values on used autos (3)
Manheim US Used Vehicle Index
150 120 90
Jul’07 jul’09 jul’11 JUL’13 JUL’15
(1) According to Bureau of Economic Analysis.
(2) BenchMark Consulting Non-Prime Automotive Financing Survey 2015. (3) Index Data Source: Bloomberg.
34
2015 Developments & Portfolio Growth
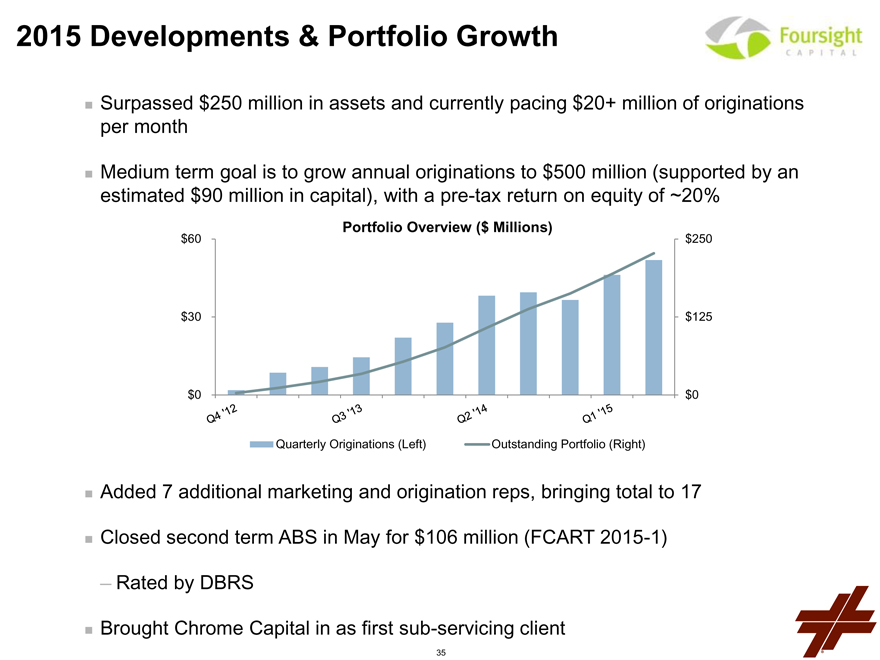
Surpassed $250 million in assets and currently pacing $20+ million of originations per month
Medium term goal is to grow annual originations to $500 million (supported by an estimated $90 million in capital), with a pre-tax return on equity of ~20%
$60 Portfolio Overview ($ Millions) $250
$30 $125
$0 $0
Quarterly Originations (Left) Outstanding Portfolio (Right)
Added 7 additional marketing and origination reps, bringing total to 17
Closed second term ABS in May for $106 million (FCART 2015-1)
Rated by DBRS
Brought Chrome Capital in as first sub-servicing client
35
Strategic Priorities
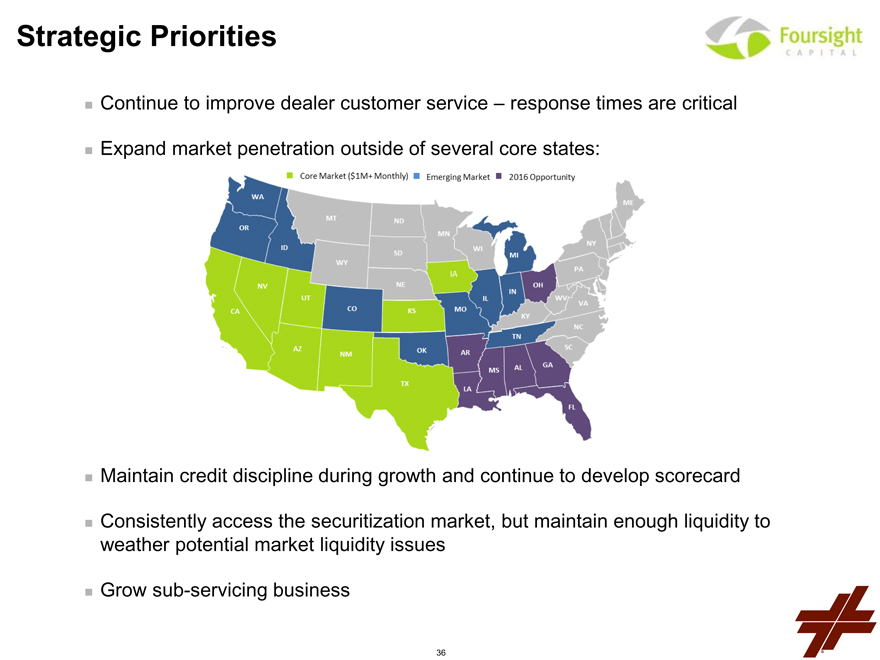
Continue to improve dealer customer service – response times are critical
Expand market penetration outside of several core states:
Maintain credit discipline during growth and continue to develop scorecard
Consistently access the securitization market, but maintain enough liquidity to weather potential market liquidity issues
Grow sub-servicing business
36
Leucadia Asset Management
37
General Disclaimer
Past performance is not indicative of future results.
This presentation does not constitute an offer of any commodities, securities or investment advisory services and should not be used to form the basis of any investment decision in any of the investment strategies or funds described herein. Information contained herein does not purport to be complete and is subject to change. Actual characteristics and performance may differ from the assumptions used in preparing these materials. Changes in assumptions may have a material impact on the information set forth in these materials. Neither Leucadia nor its affiliates makes any representation or warranty as to the appropriateness or accuracy of such assumptions or the actual yield that an account adviser or investor may receive.
38
Business Overview
Diversified alternative asset management platform – seeding and developing focused funds managed by distinct management teams
Fee-generating assets, long-term stable cash flows, able to recycle capital
Goal of growing third party AUM, while earning a reasonable return on our capital
Compelling edge – leverage Jefferies to source, and Leucadia to capitalize and syndicate
$548 million Leucadia book value in LAM products as of June 30, 2015, excluding $348 million of investments in marketable securities available for sale immediately; this does not reflect any potential value of the management companies executing these strategies (1)
Recently initiated LAM-level marketing & IR function
Continue to seek new platforms / partners
(1) The $548 million of LAM book value is across Folger Hill, Topwater Capital and CoreCommodity. The $348 million includes investments across Mazama Capital, Strategic Investments, Global Equity Events and others, which are highly liquid marketable securities available for sale immediately.
39
Platforms and Strategies
Strategic Investments Division (Quantitative Strategies)
Proprietary Jefferies strategy since 2006; flagship external fund established in 2011; $1.1 billion AUM equivalent
Systematic Macro Investment Division (Quantitative Strategies)
Division to be launched Q4 2015 to create fund that will pursue macro quantitative strategies
Folger Hill Asset Management (Multi-Manager)
Launched in 2015 with $400 million Leucadia seed investment; $1.1 billion AUM
Topwater Capital (Multi-Manager / First-loss)
Launched in 2013 with Leucadia $100 million seed investment; 22 consecutive positive months through August 2015; $843 million regulatory AUM
CoreCommodity Management (Commodity Strategies)
Proprietary Jefferies strategy since 2003; spun off in 2013; $5.7 billion AUM
Global Equity Events Opportunity Fund (Event-Driven Strategies)
Proprietary Jefferies strategy since 2007; external fund established in 2014; $134 million AUM equivalent
Mazama Capital Management (1) (Long-Only Growth Equity)
20+ year track record of long only growth equity investing; $503 million AUM
54 Madison (Real Estate)
Recently launched real estate / hospitality special situations; initial investments approved in September; maximum Leucadia commitment of $225 million
(1) Leucadia owns a revenue share in Mazama Capital Management but does not have any equity interest.
40
FOLGER HILL
41
Overview
Founded in mid-2014; Launched fund in March 2015 with Leucadia seed investment of $400 million; $1.1 billion AUM as of June 30, 2015
Multi-manager discretionary long/short equity hedge fund platform aiming to deliver strong positive results with lower volatility and market correlation than typical equity long/short hedge funds
Absolute return investment strategy, with broad industry and geographic diversification
Portfolio manager expense pass-through plus incentive fee model Robust risk systems and focus on liquidity 58 full time employees as of September 30, 2015 Board of Directors: Rich Handler, Brian Friedman and Sol Kumin
42
Key Differentiators
High-pedigree portfolio managers and analytical support
PMs average 15 years of investment experience
Sourced from best-in-class fundamental equity investment firms
Large allocations: average PM buying power of $337 million as of June 30, 2015 (1)
Top caliber compliance and finance teams centrally monitoring portfolios and limits
CRO: Todd Rapp – Highfields, Karsch, Goldman Sachs
CCO: Lisa Baroni – U.S. Attorney’s Office, Southern District of N.Y., Securities and
Commodities Fraud Unit
CFO: John Larre – Karsch, Morgan Stanley
General Counsel: Jason Ketchen – Fidelity, Geode, Bingham McCutchen
Business Development: Kevin McDonald & Jared Brecher
Head Trader: Tucker Jones – MFS Investment Management
(1) Buying Power is equivalent to available Gross Market Value.
43
Talent Selection
What We Look For
Long/short equity PMs, primarily with a sector-specific focus
Investment processes that utilize fundamental idea generation to identify a path that will drive prices over a specified time horizon
Repeatable and scalable investment process
Proven alpha generation capability
Individuals we believe can successfully operate within our risk parameters and culture
How We Find It
Talent acquisition is a dedicated, full-time and ongoing function
Leverage management team and Leucadia contacts with investment professionals to identify candidates
Engage in multi-step vetting process whereby potential PMs will meet with Business Development professionals, Senior Management and existing PMs
Conduct independent and robust due diligence and background checks
44
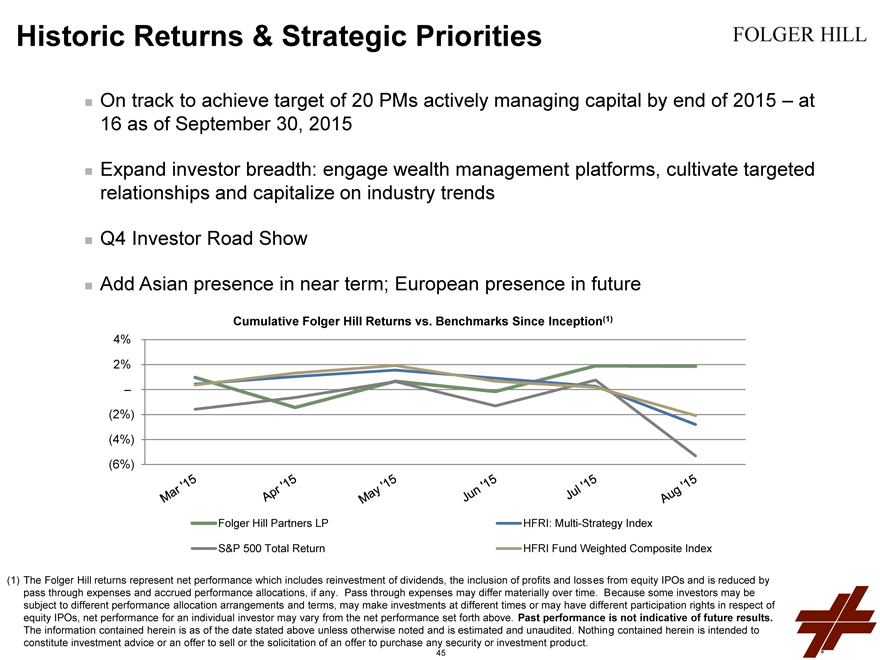
Historic Returns & Strategic Priorities
On track to achieve target of 20 PMs actively managing capital by end of 2015 – at 16 as of September 30, 2015
Expand investor breadth: engage wealth management platforms, cultivate targeted relationships and capitalize on industry trends
Q4 Investor Road Show
Add Asian presence in near term; European presence in future
Cumulative Folger Hill Returns vs. Benchmarks Since Inception(1)
4%
2%
–
(2%)
(4%)
(6%)
Folger Hill Partners LP HFRI: Multi-Strategy Index
S&P 500 Total Return HFRI Fund Weighted Composite Index
(1) The Folger Hill returns represent net performance which includes reinvestment of dividends, the inclusion of profits and losses from equity IPOs and is reduced by pass through expenses and accrued performance allocations, if any. Pass through expenses may differ materially over time. Because some investors may be subject to different performance allocation arrangements and terms, may make investments at different times or may have different participation rights in respect of equity IPOs, net performance for an individual investor may vary from the net performance set forth above. Past performance is not indicative of future results.
The information contained herein is as of the date stated above unless otherwise noted and is estimated and unaudited. Nothing contained herein is intended to constitute investment advice or an offer to sell or the solicitation of an offer to purchase any security or investment product.
45
Topwater Capital
46
Topwater Capital – Overview
Highly-scalable multi-manager and multi-strategy liquid securities fund targeting low volatility and positive returns in all market environments
Continuous track record dating back to 2004
Initial Leucadia investment in Q3 2013
Soft launch in late 2013 and first full year of operation in 2014
Pioneered the first-loss model of investing
Portfolio managers required to contribute capital that sits in a first loss position
Creates strong layer of principal protection
Portfolio managers compensated by above-market incentives Returns are beating benchmarks, with lower volatility
$ 843 million regulatory AUM as of June 30, 2015
47
Topwater Capital – Key Differentiators
Proven track record of delivering consistent positive uncorrelated performance, with 100% positive annual performance dating back to 2004, including a 10% annual return in 2008 and positive returns in August and September 2015
Added well over 200 managers to platform since 2004
Experienced, dedicated risk team, fully devoted to monitoring underlying aggregated risks
Fund Portfolio Metrics:
2014 Rate of Return: 7.7%, net; YTD August 31, 2015: 5.8%, net
Annualized Standard Deviation: 1.63%
Annualized Sharpe Ratio: 3.88
% Positive Months: 92.0%
Correlation to S&P 500: 0.15
48
Topwater Capital – Historic Returns & Priorities
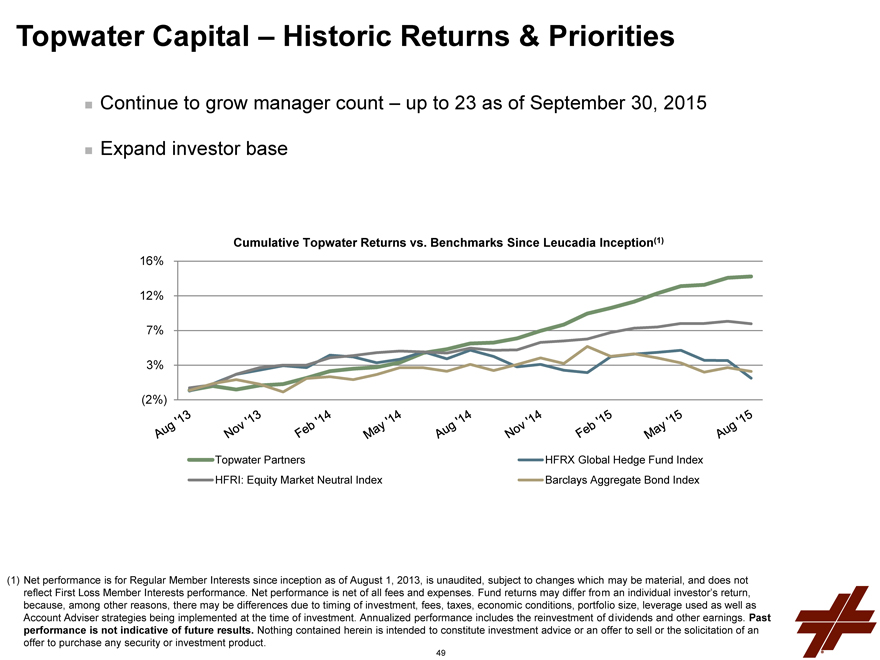
Continue to grow manager count – up to 23 as of September 30, 2015
Expand investor base
Cumulative Topwater Returns vs. Benchmarks Since Leucadia Inception(1)
16%
12%
7%
3%
(2%)
Topwater Partners HFRX Global Hedge Fund Index
HFRI: Equity Market Neutral Index Barclays Aggregate Bond Index
Net performance is for Regular Member Interests since inception as of August 1, 2013, is unaudited, subject to changes which may be material, and does not reflect First Loss Member Interests performance. Net performance is net of all fees and expenses. Fund returns may differ from an individual investor’s return, because, among other reasons, there may be differences due to timing of investment, fees, taxes, economic conditions, portfolio size, leverage used as well as Account Adviser strategies being implemented at the time of investment. Annualized performance includes the reinvestment of dividends and other earnings. Past performance is not indicative of future results. Nothing contained herein is intended to constitute investment advice or an offer to sell or the solicitation of an offer to purchase any security or investment product.
49
Strategic Investments Division
50
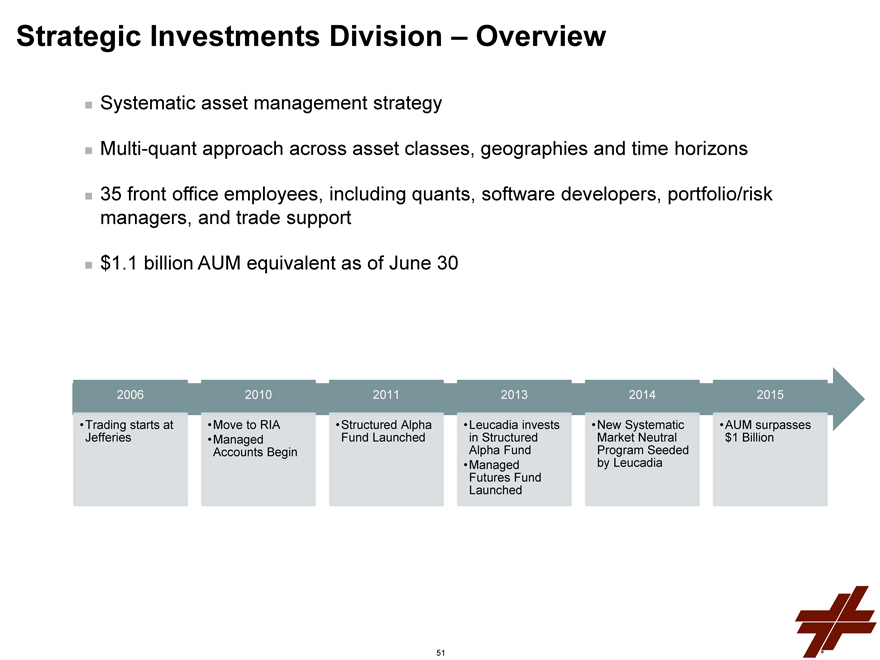
Strategic Investments Division – Overview
Systematic asset management strategy
Multi-quant approach across asset classes, geographies and time horizons
35 front office employees, including quants, software developers, portfolio/risk managers, and trade support
$1.1 billion AUM equivalent as of June 30
2006 2010 2011 2013 2014 2015
Trading starts at Move to RIA Structured Alpha Leucadia invests New Systematic AUM surpasses
Jefferies • Managed Fund Launched in Structured Market Neutral $1 Billion
Accounts Begin Alpha Fund Program Seeded
• Managed by Leucadia
Futures Fund
Launched
51
Strategic Investments Division – Key Differentiators
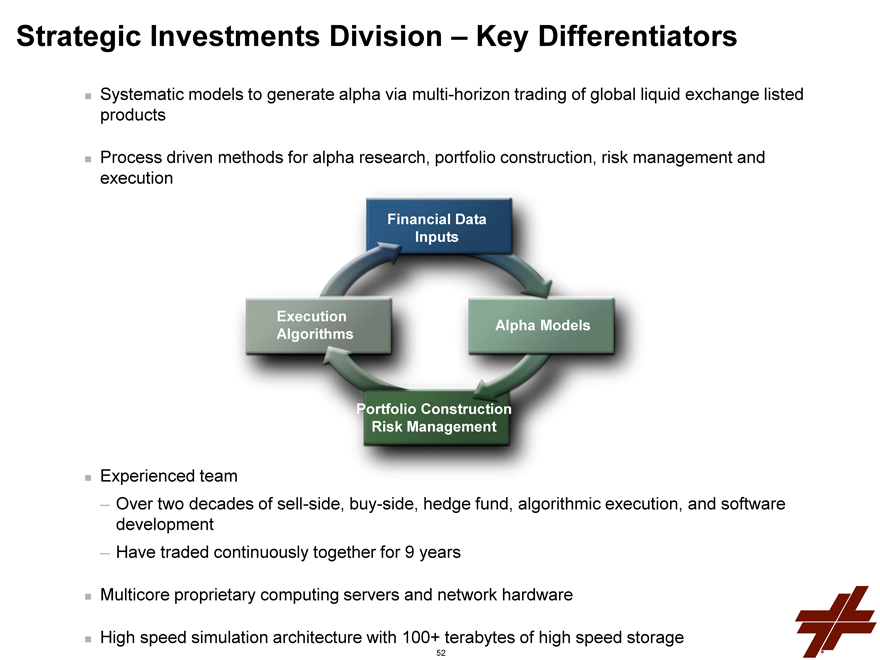
Systematic models to generate alpha via multi-horizon trading of global liquid exchange listed
products
Process driven methods for alpha research, portfolio construction, risk management and
execution
Financial Data
Inputs
Execution
Algorithms
Alpha Models
Portfolio Construction
Risk Management
Experienced team
Over two decades of sell-side, buy-side, hedge fund, algorithmic execution, and software
development
Have traded continuously together for 9 years
Multicore proprietary computing servers and network hardware
High speed simulation architecture with 100+ terabytes of high speed storage
52
Strategic Investments Division – Product Overview
Structured Alpha Program
11.8% annualized net returns since the program’s inception at Jefferies in 2006
Sharpe ratio above 2; typical turnover 5—10 days;
Low correlation to major asset classes, risk factors and peers
Managed Futures Program
Short term systematic diversified strategy set applied to global futures
Low correlation to CTA / Trend followers by design
10x the annualized rate of return of Newedge Short-Term Trading index since the program’s inception at Jefferies in 2007
Systematic Equity Market Neutral Program
Leucadia seeded October 2014, results to date meeting expectations
Targets mid-teens net return with 10% annualized volatility
Anticipate Founders Share Class launch early 2016
53
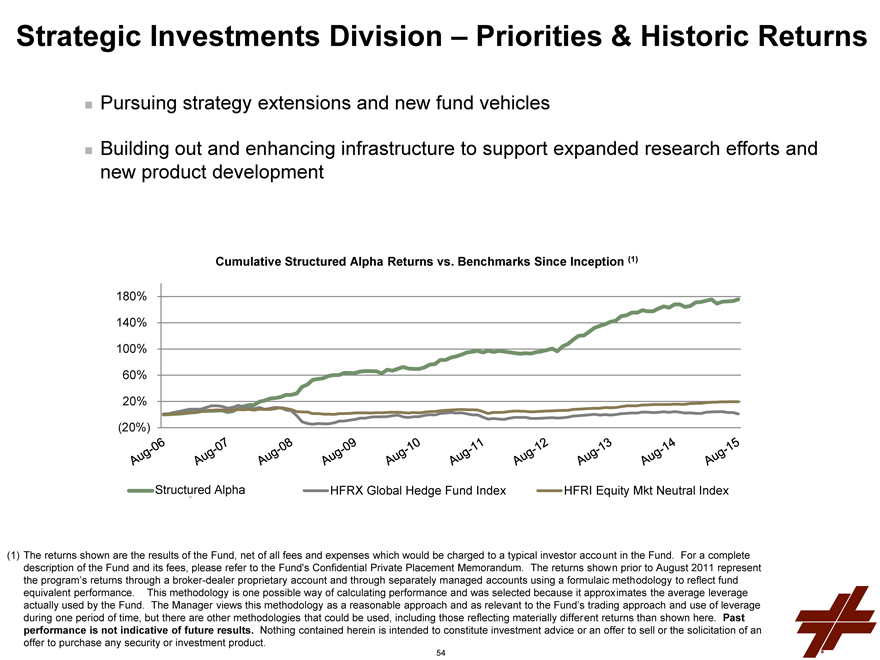
Strategic Investments Division – Priorities & Historic Returns Pursuing strategy extensions and new fund vehicles Building out and enhancing infrastructure to support expanded research efforts and new product development
Cumulative Structured Alpha Returns vs. Benchmarks Since Inception (1)
180%
140%
100%
60%
20%
(20%)
Structured Alpha HFRX Global Hedge Fund Index HFRI Equity Mkt Neutral Index
(1) The returns shown are the results of the Fund, net of all fees and expenses which would be charged to a typical investor account in the Fund. For a complete description of the Fund and its fees, please refer to the Fund’s Confidential Private Placement Memorandum. The returns shown prior to August 2011 represent the program’s returns through a broker-dealer proprietary account and through separately managed accounts using a formulaic methodology to reflect fund equivalent performance. This methodology is one possible way of calculating performance and was selected because it approximates the average leverage
actually used by the Fund. The Manager views this methodology as a reasonable approach and as relevant to the Fund’s trading approach and use of leverage during one period of time, but there are other methodologies that could be used, including those reflecting materially different returns than shown here. Past
performance is not indicative of future results. Nothing contained herein is intended to constitute investment advice or an offer to sell or the solicitation of an offer to purchase any security or investment product.
54
Q & A IRQuestions@Leucadia.com
Jefferies
55
Note on Adjusted Financials
Note on the Use of Non-GAAP Financial Measures to Show Results Exclusive of the Bache Futures Business:
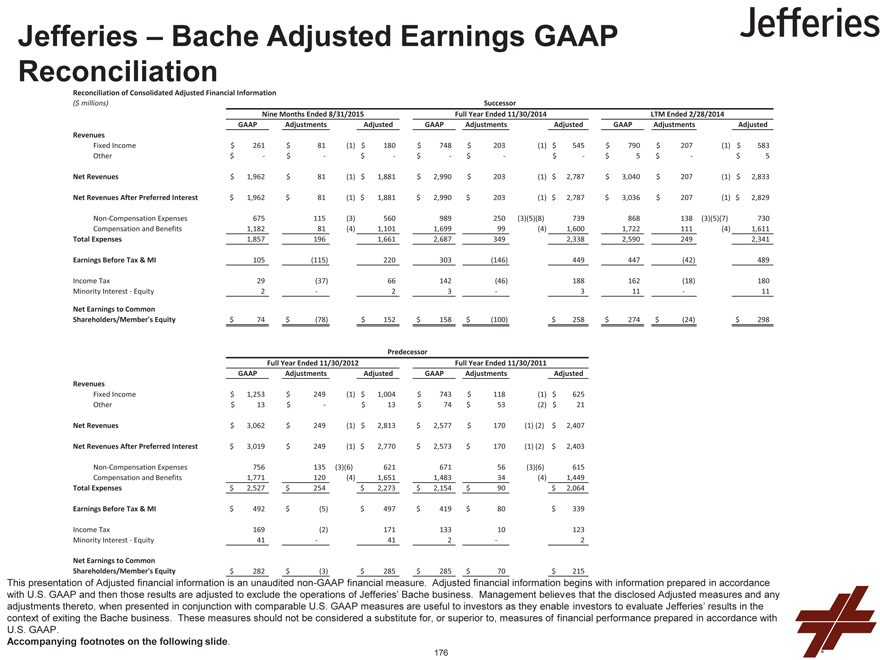
Jefferies announced during its fourth quarter 2014 that it would pursue strategic alternatives for its Bache futures business. Since that time, Jefferies has taken steps to exit the Bache futures business and has supplemented certain of its financial disclosures to show results that exclude the Bache futures business. These supplemental financial measures begin with information prepared in accordance with U.S. GAAP and are adjusted to exclude the operations of the Bache futures business. These adjusted financial measures are non-GAAP financial measures. Management believes such measures, when presented in conjunction with comparable U.S. GAAP measures, provide meaningful information as it enables investors to evaluate results in the context of the announced exit of the Bache futures business. These measures should not be considered a substitute for, or superior to, financial information prepared in accordance with U.S. GAAP.
Reconciliations of these non-GAAP financial measures to U.S. GAAP financial measures are contained throughout this presentation and on pages 176—177 of the appendix.
56
Jefferies Overview
57
Jefferies Strategic Update
We are building the leading, client-focused global investment banking firm, with our focus to provide clients with the best ideas, expertise and execution in global capital markets
Investment Banking and Equities have delivered solid, multi-year growth, and have continued momentum and meaningful upside
Fixed Income has proven more challenging due to periods of price volatility and low market activity in cash credit markets, which are Jefferies’ primary focus
Priorities are margin expansion and earnings growth
Fixed Income will be refocused to match opportunity ahead, reducing risk, balance sheet and capital utilization, and to deliver reasonable margins and returns
Bache exit is accretive to Jefferies’ earnings
58
Jefferies Operating Results
59
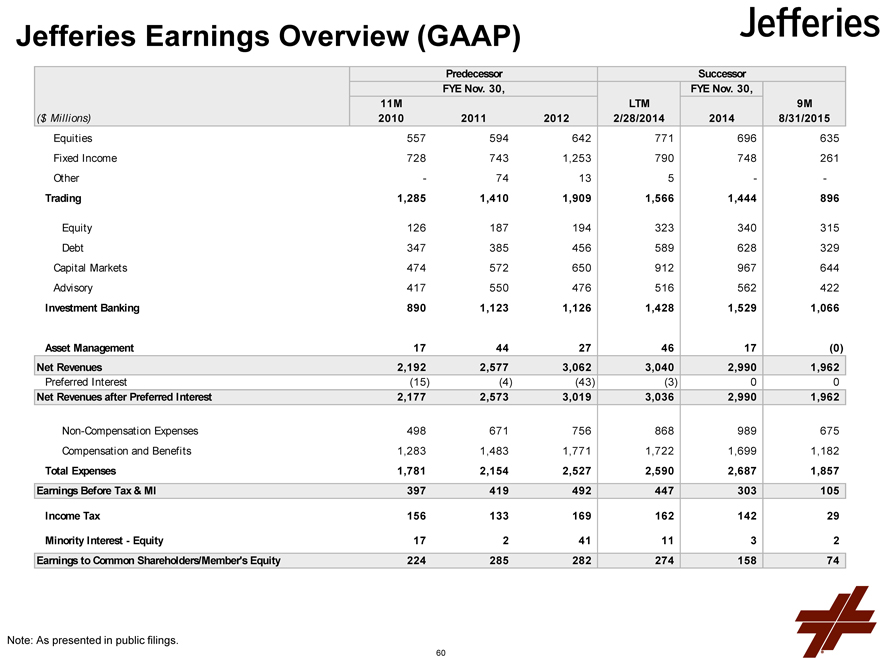
Jefferies Earnings Overview (GAAP)
Predecessor Successor
FYE Nov. 30, FYE Nov. 30,
11M LTM 9M
($ Millions) 2010 2011 2012 2/28/2014 2014 8/31/2015
Equities 557 594 642 771 696 635
Fixed Income 728 743 1,253 790 748 261
Other—74 13 5 —
Trading 1,285 1,410 1,909 1,566 1,444 896
Equity 126 187 194 323 340 315
Debt 347 385 456 589 628 329
Capital Markets 474 572 650 912 967 644
Advisory 417 550 476 516 562 422
Investment Banking 890 1,123 1,126 1,428 1,529 1,066
Asset Management 17 44 27 46 17(0)
Net Revenues 2,192 2,577 3,062 3,040 2,990 1,962
Preferred Interest(15)(4)(43)(3) 0 0
Net Revenues after Preferred Interest 2,177 2,573 3,019 3,036 2,990 1,962
Non-Compensation Expenses 498 671 756 868 989 675
Compensation and Benefits 1,283 1,483 1,771 1,722 1,699 1,182
Total Expenses 1,781 2,154 2,527 2,590 2,687 1,857
Earnings Before Tax & MI 397 419 492 447 303 105
Income Tax 156 133 169 162 142 29
Minority Interest—Equity 17 2 41 11 3 2
Earnings to Common Shareholders/Member’s Equity 224 285 282 274 158 74
Note: As presented in public filings.
60
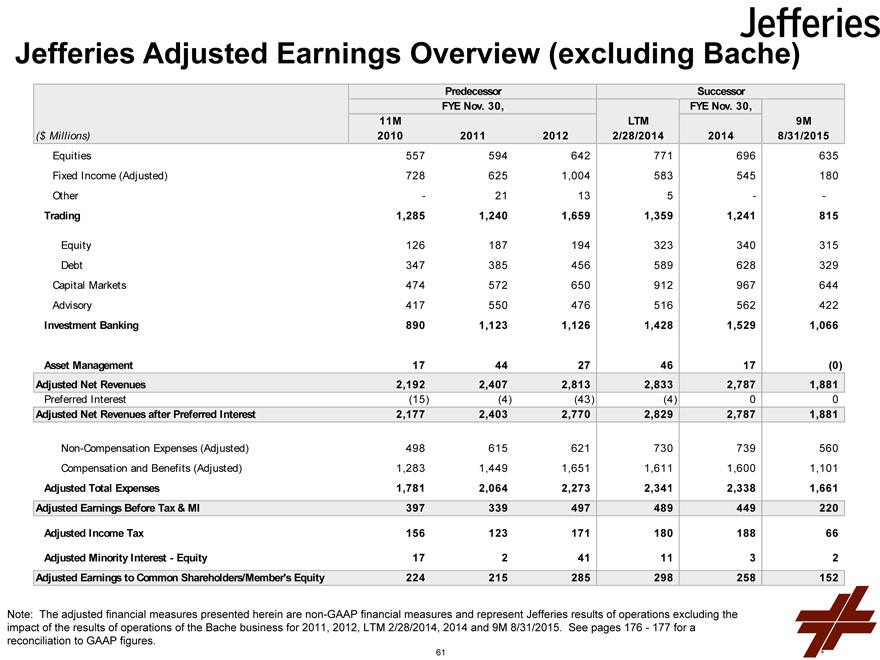
Jefferies Adjusted Earnings Overview (excluding Bache)
Predecessor Successor
FYE Nov. 30, FYE Nov. 30,
11M LTM 9M
($ Millions) 2010 2011 2012 2/28/2014 2014 8/31/2015
Equities 557 594 642 771 696 635
Fixed Income (Adjusted) 728 625 1,004 583 545 180
Other—21 13 5 —
Trading 1,285 1,240 1,659 1,359 1,241 815
Equity 126 187 194 323 340 315
Debt 347 385 456 589 628 329
Capital Markets 474 572 650 912 967 644
Advisory 417 550 476 516 562 422
Investment Banking 890 1,123 1,126 1,428 1,529 1,066
Asset Management 17 44 27 46 17(0)
Adjusted Net Revenues 2,192 2,407 2,813 2,833 2,787 1,881
Preferred Interest(15)(4)(43)(4) 0 0
Adjusted Net Revenues after Preferred Interest 2,177 2,403 2,770 2,829 2,787 1,881
Non-Compensation Expenses (Adjusted) 498 615 621 730 739 560
Compensation and Benefits (Adjusted) 1,283 1,449 1,651 1,611 1,600 1,101
Adjusted Total Expenses 1,781 2,064 2,273 2,341 2,338 1,661
Adjusted Earnings Before Tax & MI 397 339 497 489 449 220
Adjusted Income Tax 156 123 171 180 188 66
Adjusted Minority Interest—Equity 17 2 41 11 3 2
Adjusted Earnings to Common Shareholders/Member’s Equity 224 215 285 298 258 152
Note: The adjusted financial measures presented herein are non-GAAP financial measures and represent Jefferies results of operations excluding the impact of the results of operations of the Bache business for 2011, 2012, LTM 2/28/2014, 2014 and 9M 8/31/2015. See pages 176—177 for a reconciliation to GAAP figures.
61
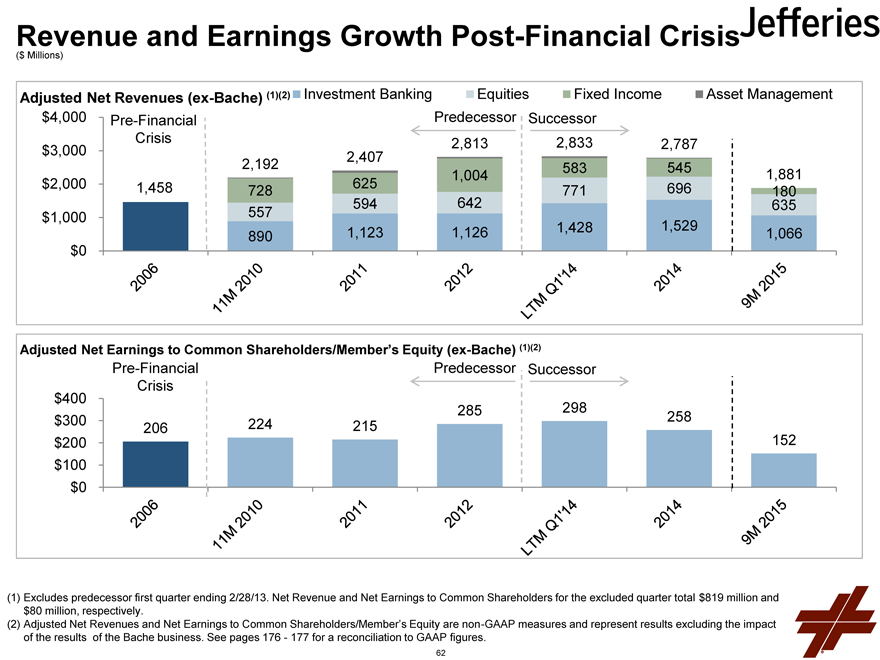
Revenue and Earnings Growth Post-Financial Crisis
($ Millions)
Adjusted Net Revenues (ex-Bache) (1)(2) Investment Banking Equities Fixed Income Asset Management
$4,000 Pre-Financial Predecessor Successor
Crisis 2,813 2,833 2,787
$3,000 2,407
2,192 583 545
625 1,004 1,881
$2,000 1,458 728 771 696 180
594 642 635
$1,000 557 1,428 1,529
890 1,123 1,126 1,066
$0
Adjusted Net Earnings to Common Shareholders/Member’s Equity (ex-Bache) (1)(2)
Pre-Financial Predecessor Successor
Crisis
$400
285 298
$300 206 224 215 258
$200 152
$100
$0
Excludes predecessor first quarter ending 2/28/13. Net Revenue and Net Earnings to Common Shareholders for the excluded quarter total $819 million and $80 million, respectively.
Adjusted Net Revenues and Net Earnings to Common Shareholders/Member’s Equity are non-GAAP measures and represent results excluding the impact of the results of the Bache business. See pages 176—177 for a reconciliation to GAAP figures.
62
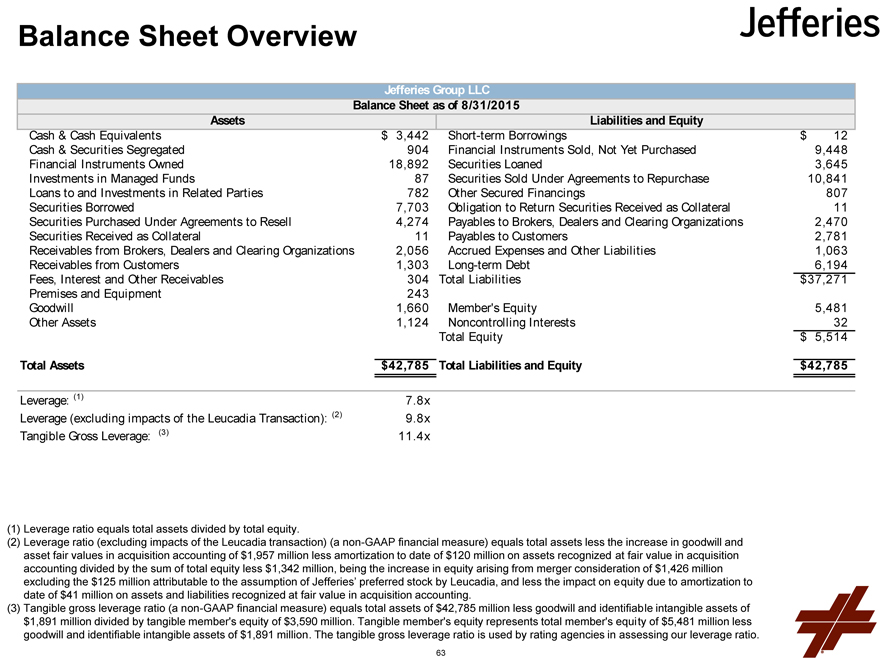
Balance Sheet Overview
Jefferies Group LLC
Balance Sheet as of 8/31/2015
Assets Liabilities and Equity
Cash & Cash Equivalents $ 3,442 Short-term Borrowings $ 12
Cash & Securities Segregated 904 Financial Instruments Sold, Not Yet Purchased 9,448
Financial Instruments Owned 18,892 Securities Loaned 3,645
Investments in Managed Funds 87 Securities Sold Under Agreements to Repurchase 10,841
Loans to and Investments in Related Parties 782 Other Secured Financings 807
Securities Borrowed 7,703 Obligation to Return Securities Received as Collateral 11
Securities Purchased Under Agreements to Resell 4,274 Payables to Brokers, Dealers and Clearing Organizations 2,470
Securities Received as Collateral 11 Payables to Customers 2,781
Receivables from Brokers, Dealers and Clearing Organizations 2,056 Accrued Expenses and Other Liabilities 1,063
Receivables from Customers 1,303 Long-term Debt 6,194
Fees, Interest and Other Receivables 304 Total Liabilities $37,271
Premises and Equipment 243
Goodwill 1,660 Member’s Equity 5,481
Other Assets 1,124 Noncontrolling Interests 32
Total Equity $ 5,514
Total Assets $42,785 Total Liabilities and Equity $42,785
Leverage: (1) 7.8x
Leverage (excluding impacts of the Leucadia Transaction): (2) 9.8x
Tangible Gross Leverage: (3) 11.4x
Leverage ratio equals total assets divided by total equity.
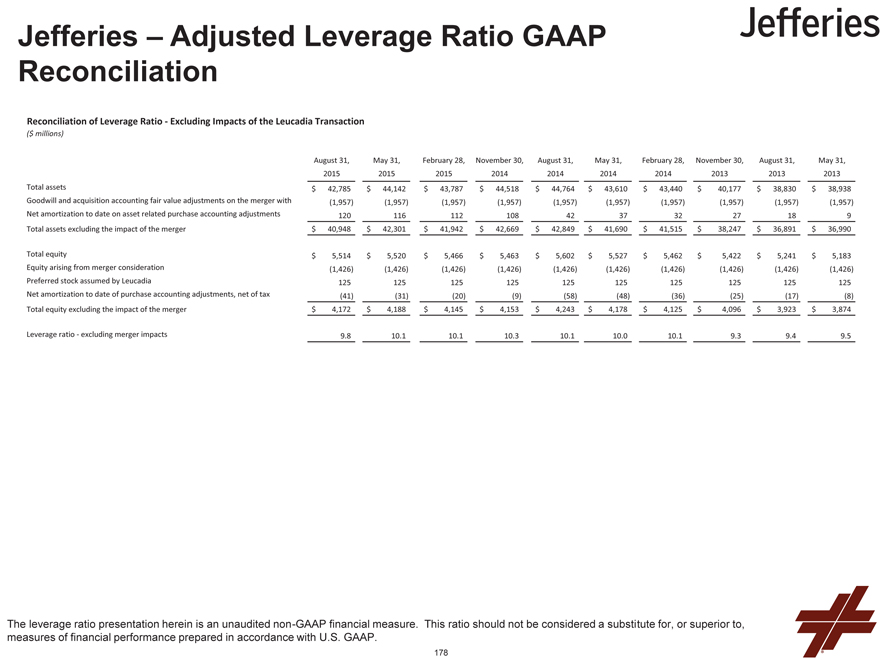
Leverage ratio (excluding impacts of the Leucadia transaction) (a non-GAAP financial measure) equals total assets less the increase in goodwill and asset fair values in acquisition accounting of $1,957 million less amortization to date of $120 million on assets recognized at fair value in acquisition accounting divided by the sum of total equity less $1,342 million, being the increase in equity arising from merger consideration of $1,426 million excluding the $125 million attributable to the assumption of Jefferies’ preferred stock by Leucadia, and less the impact on e quity due to amortization to date of $41 million on assets and liabilities recognized at fair value in acquisition accounting.
Tangible gross leverage ratio (a non-GAAP financial measure) equals total assets of $42,785 million less goodwill and identifiable intangible assets of $1,891 million divided by tangible member’s equity of $3,590 million. Tangible member’s equity represents total member’s equity of $5,481 million less goodwill and identifiable intangible assets of $1,891 million. The tangible gross leverage ratio is used by rating agencies in assessing our leverage ratio.
63
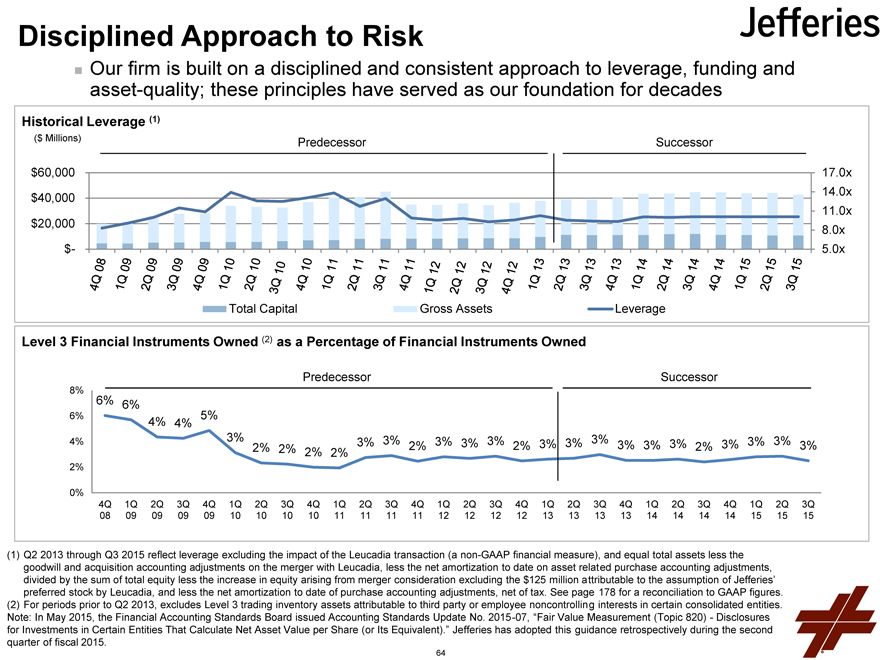
Disciplined Approach to Risk
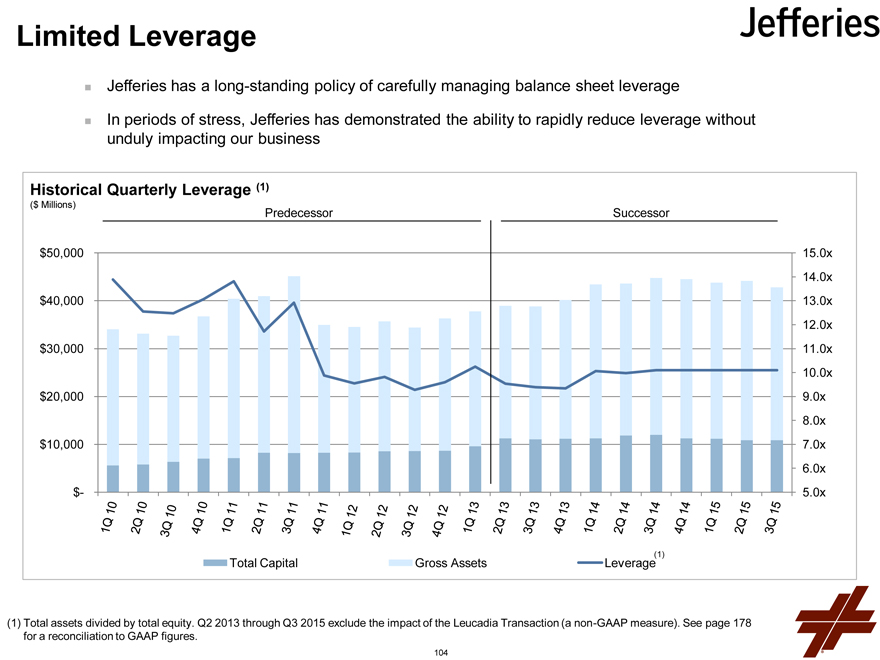
Our firm is built on a disciplined and consistent approach to leverage, funding and asset-quality; these principles have served as our foundation for decades
Historical Leverage (1)
($ Millions) Predecessor Successor
$60,000 17.0x
$40,000 14.0x
11.0x
$20,000 8.0x
$- 5.0x
Total Capital Gross Assets Leverage
Level 3 Financial Instruments Owned (2) as a Percentage of Financial Instruments Owned
Predecessor Successor
8%
6% 6%
6% 5%
4% 4%
4% 3% 2% 2% 2% 2% 3% 3% 2% 3% 3% 3% 2% 3% 3% 3% 3% 3% 3% 2% 3% 3% 3% 3%
2%
0%
4Q 1Q 2Q 3Q 4Q 1Q 2Q 3Q 4Q 1Q 2Q 3Q 4Q 1Q 2Q 3Q 4Q 1Q 2Q 3Q 4Q 1Q 2Q 3Q 4Q 1Q 2Q 3Q
08 09 09 09 09 10 10 10 10 11 11 11 11 12 12 12 12 13 13 13 13 14 14 14 14 15 15 15
(1) Q2 2013 through Q3 2015 reflect leverage excluding the impact of the Leucadia transaction (a non-GAAP financial measure), and equal total assets less the goodwill and acquisition accounting adjustments on the merger with Leucadia, less the net amortization to date on asset related purchase accounting adjustments, divided by the sum of total equity less the increase in equity arising from merger consideration excluding the $125 million attributable to the assumption of Jefferies’ preferred stock by Leucadia, and less the net amortization to date of purchase accounting adjustments, net of tax. See page 178 for a reconciliation to GAAP figures. (2) For periods prior to Q2 2013, excludes Level 3 trading inventory assets attributable to third party or employee noncontrolling interests in certain consolidated entities. Note: In May 2015, the Financial Accounting Standards Board issued Accounting Standards Update No. 2015-07, “Fair Value Measurement (Topic 820)—Disclosures for Investments in Certain Entities That Calculate Net Asset Value per Share (or Its Equivalent).” Jefferies has adopted this guidance retrospectively during the second quarter of fiscal 2015.
64
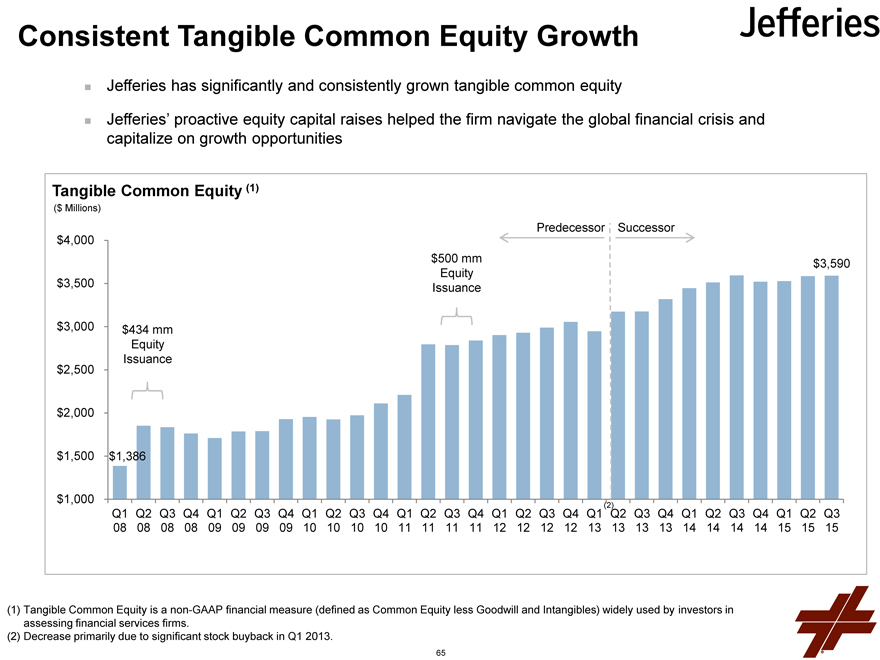
Consistent Tangible Common Equity Growth
Jefferies has significantly and consistently grown tangible common equity
Jefferies’ proactive equity capital raises helped the firm navigate the global financial crisis and capitalize on growth opportunities
Tangible Common Equity (1)
($ Millions)
Predecessor Successor
$4,000
$500 mm $3,590
Equity
$3,500 Issuance
$3,000 $434 mm
Equity
Issuance
$2,500
$2,000
$1,500 $1,386
$1,000(2)
Q1 Q2 Q3 Q4 Q1 Q2 Q3 Q4 Q1 Q2 Q3 Q4 Q1 Q2 Q3 Q4 Q1 Q2 Q3 Q4 Q1 Q2 Q3 Q4 Q1 Q2 Q3 Q4 Q1 Q2 Q3
08 08 08 08 09 09 09 09 10 10 10 10 11 11 11 11 12 12 12 12 13 13 13 13 14 14 14 14 15 15 15
Tangible Common Equity is a non-GAAP financial measure (defined as Common Equity less Goodwill and Intangibles) widely used by investors in assessing financial services firms.
Decrease primarily due to significant stock buyback in Q1 2013.
65
Jefferies Business Review
66
Investment Banking
67
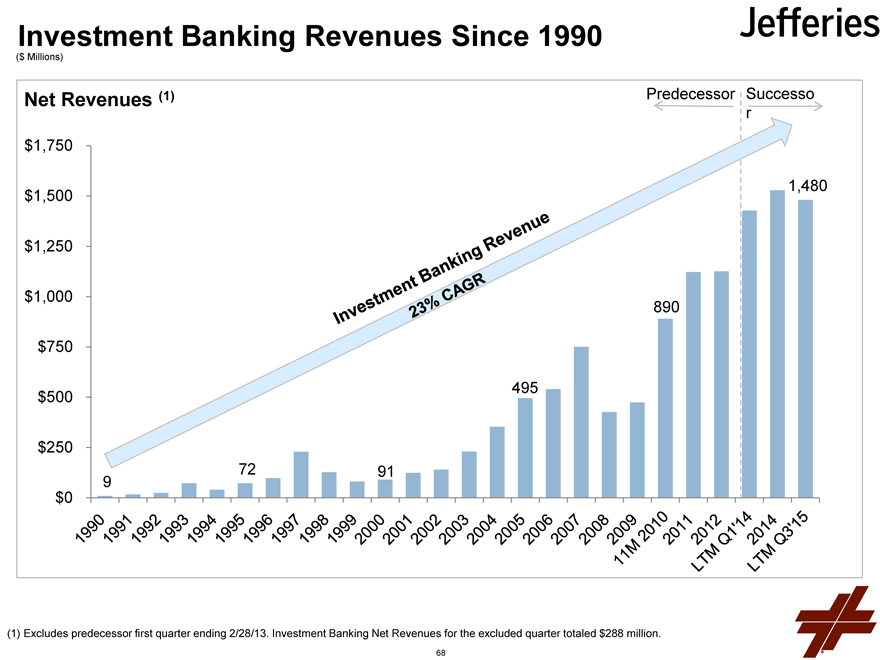
Investment Banking Revenues Since 1990
($ Millions)
Net Revenues(1) Predecessor Successo
r
$1,750
$1,500 1,480
$1,250
$1,000
890
$750
$500 495
$250
9 72 91
$0
(1) Excludes predecessor first quarter ending 2/28/13. Investment Banking Net Revenues for the excluded quarter totaled $288 million.
68
Investment Banking – Overview
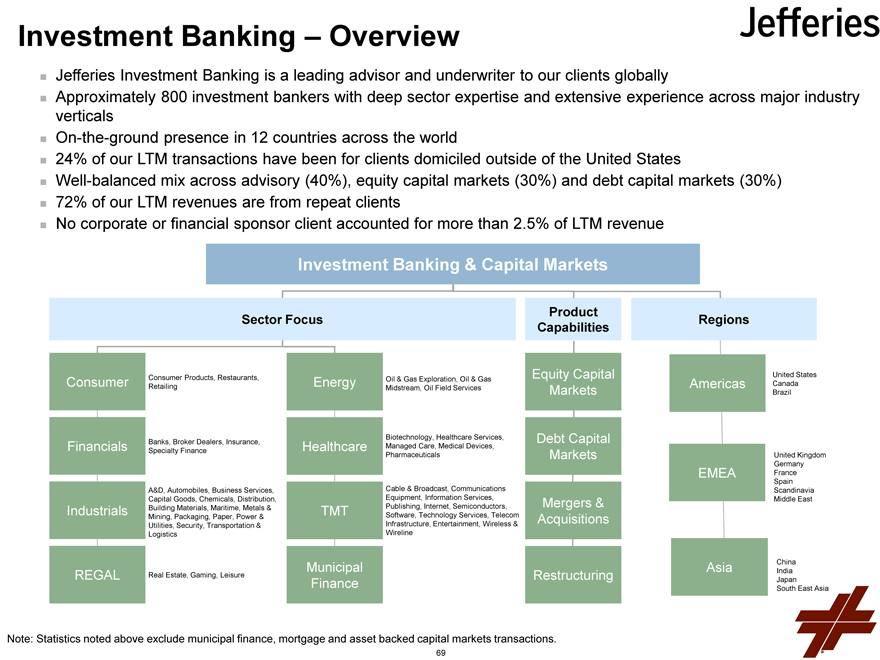
Jefferies Investment Banking is a leading advisor and underwriter to our clients globally
Approximately 800 investment bankers with deep sector expertise and extensive experience across major industry verticals
On-the-ground presence in 12 countries across the world
24% of our LTM transactions have been for clients domiciled outside of the United States
Well-balanced mix across advisory (40%), equity capital markets (30%) and debt capital markets (30%)
72% of our LTM revenues are from repeat clients
No corporate or financial sponsor client accounted for more than 2.5% of LTM revenue
Investment Banking & Capital Markets
Product
Sector Focus Regions
Capabilities
Consumer Products, Restaurants, Oil & Gas Exploration, Oil & Gas Equity Capital United States
Consumer Retailing Energy Midstream, Oil Field Services Americas Canada
Markets Brazil
Banks, Broker Dealers, Insurance, Biotechnology, Healthcare Services, Debt Capital
Financials Specialty Finance Healthcare Managed Care, Medical Devices,
Pharmaceuticals Markets United Kingdom
Germany
EMEA France
Spain
A&D, Automobiles, Business Services, Cable & Broadcast, Communications Scandinavia
Capital Goods, Chemicals, Distribution, Equipment, Information Services, Mergers & Middle East
Industrials Building Materials, Maritime, Metals & TMT Publishing, Internet, Semiconductors,
Mining, Packaging, Paper, Power & Software, Technology Services, Telecom Acquisitions
Utilities, Security, Transportation & Infrastructure, Entertainment, Wireless &
Logistics Wireline
Municipal Asia China
REGAL Real Estate, Gaming, Leisure Restructuring India
Finance South Japan East Asia
Note: Statistics noted above exclude municipal finance, mortgage and asset backed capital markets transactions.
69
Investment Banking – Market Update
M&A: Large Transactions Were Active, But Deals Under $5 Billion Accounted For 76% Of The Global M&A Fee Pool(1)
In this $5 billion segment, Jefferies increased its market share globally
We advised on 25% more $1+ billion M&A transactions in 9M 2015 vs. 9M 2014 The size of our median M&A transaction increased 16% in 9M 2015 vs. 9M 2014
Grew 12% In 9M 2015 vs 9M 2014 ECM: Jefferies ECM Revenue
The global ECM fee declined 7%(1) in the same time frame pool Fiscal Q3 2015 was our best quarter ever in ECM revenue
Leveraged Finance: Global Finance Fee Pool Declined 27%(2) In 9M 2015 vs 9M 2014 Leveraged
Jefferies Leveraged Finance business, while impacted by this market trend, increased its market share in 2015 We also made significant progress penetrating the top tier of financial sponsors
We executed “first time” lead left debt financings for 5 of the 10 largest and 8 of the 20 largest global financial sponsors
Per Dealogic.
Global High Yield Bond and Institutional Leverage Loan Issuance per S&P Capital IQ’s LCD Comps.
70
Investment Banking – Financial Overview
($ Millions)
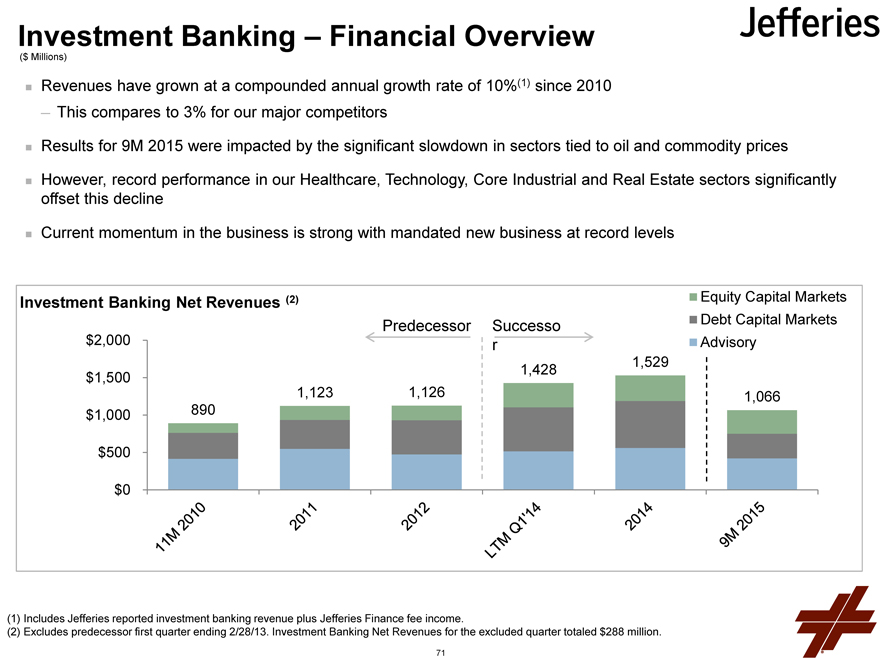
Revenues have grown at a compounded annual growth rate of 10%(1) since 2010 ? This compares to 3% for our major competitors
Results for 9M 2015 were impacted by the significant slowdown in sectors tied to oil and commodity prices
However, record performance in our Healthcare, Technology, Core Industrial and Real Estate sectors significantly offset this decline
Current momentum in the business is strong with mandated new business at record levels
Investment Banking Net Revenues (2) Equity Capital Markets
Predecessor Successo Debt Capital Markets
$2,000 r Advisory
1,428 1,529
$1,500
1,123 1,126 1,066
$1,000 890
$500
$0
Includes Jefferies reported investment banking revenue plus Jefferies Finance fee income.
Excludes predecessor first quarter ending 2/28/13. Investment Banking Net Revenues for the excluded quarter totaled $288 million.
71
Investment Banking – Strategic Priorities
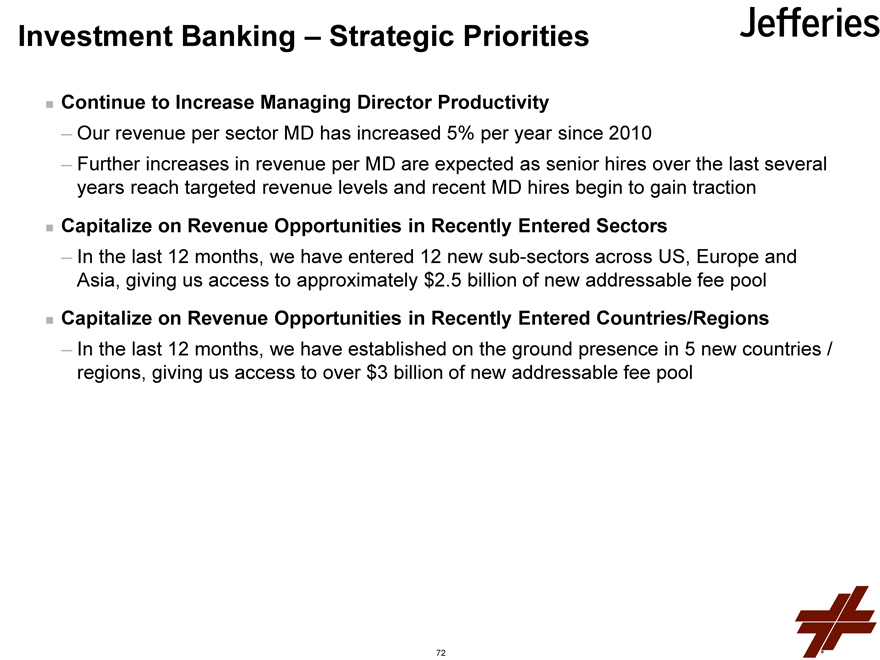
Continue to Increase Managing Director Productivity
Our revenue per sector MD has increased 5% per year since 2010
Further increases in revenue per MD are expected as senior hires over the last several years reach targeted revenue levels and recent MD hires begin to gain traction
Capitalize on Revenue Opportunities in Recently Entered Sectors
In the last 12 months, we have entered 12 new sub-sectors across US, Europe and Asia, giving us access to approximately $2.5 billion of new addressable fee pool
Capitalize on Revenue Opportunities in Recently Entered Countries/Regions
In the last 12 months, we have established on the ground presence in 5 new countries / regions, giving us access to over $3 billion of new addressable fee pool
72
Jefferies Finance LLC
73
Jefferies Finance – Overview
Jefferies Finance LLC
($ Millions)
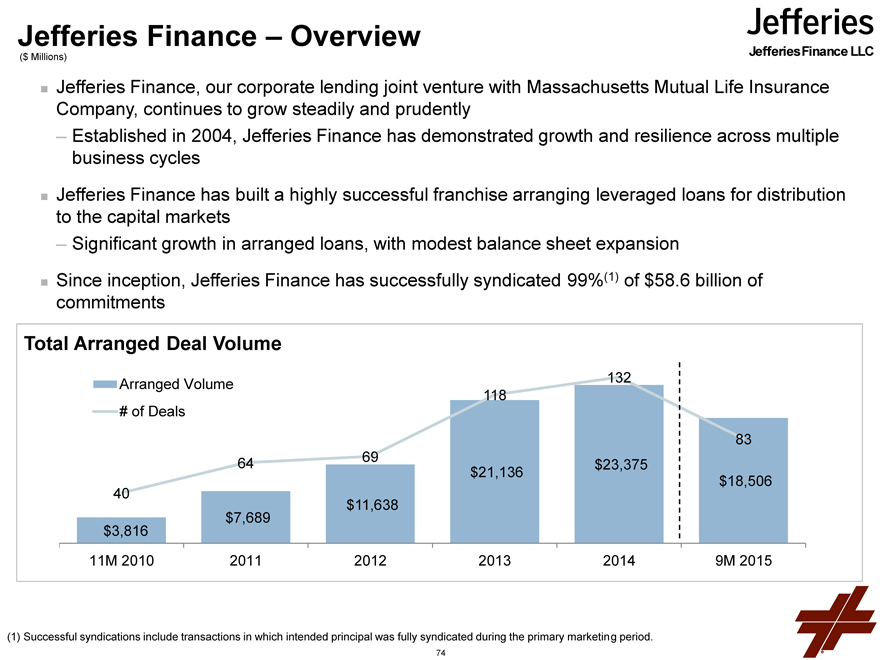
Jefferies Finance, our corporate lending joint venture with Massachusetts Mutual Life Insurance Company, continues to grow steadily and prudently
Established in 2004, Jefferies Finance has demonstrated growth and resilience across multiple business cycles
Jefferies Finance has built a highly successful franchise arranging leveraged loans for distribution to the capital markets
Significant growth in arranged loans, with modest balance sheet expansion
Since inception, Jefferies has successfully syndicated 99%(1) of $58.6 billion of ? Finance commitments
Total Arranged Deal Volume
140
Arranged Volume 132
118 120
# of Deals 100
83 80
64 69 $23,375 60
$21,136 $18,506
40 40
$11,638
$7,689 20
$3,816
0
11M 2010 2011 2012 2013 2014 9M 2015
(1) Successful syndications include transactions in which intended principal was fully syndicated during the primary marketing period.
74
Jefferies Finance – Dedicated Team
Jefferies Finance LLC
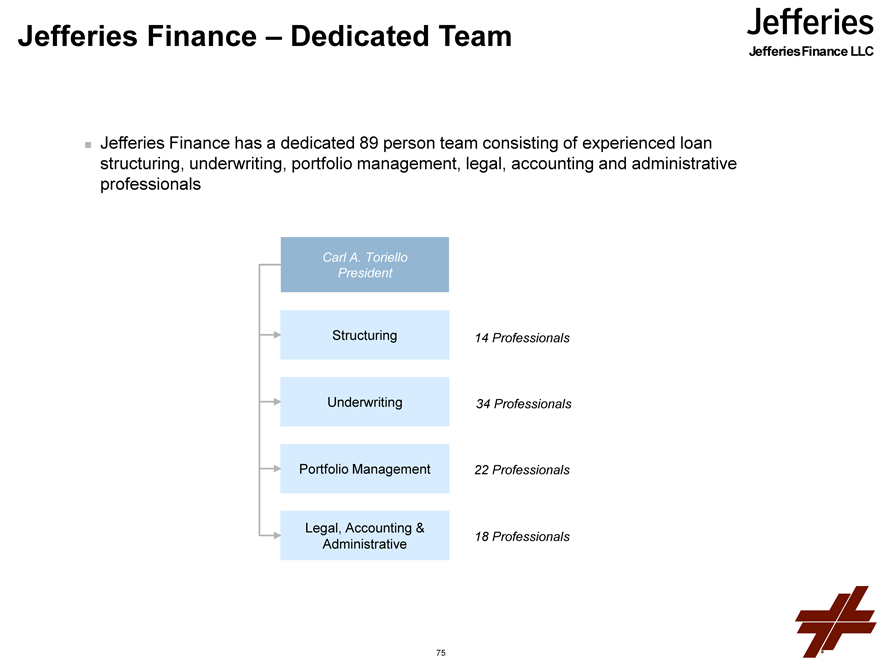
Jefferies Finance has a dedicated 89 person team consisting of experienced loan structuring, underwriting, portfolio management, legal, accounting and administrative professionals
Carl A. Toriello
President
Structuring 14 Professionals
Underwriting 34 Professionals
Portfolio Management 22 Professionals
Legal, Accounting &
Administrative 18 Professionals
75
Jefferies Finance – Product Offerings
Jefferies Finance LLC
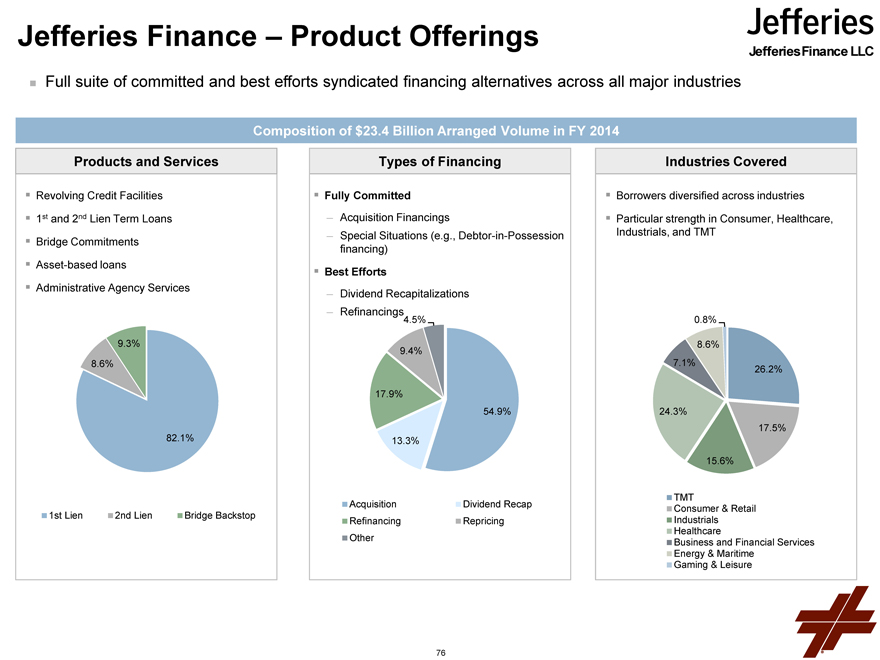
Full suite of committed and best efforts syndicated financing alternatives across all major industries
Composition of $23.4 Billion Arranged Volume in FY 2014
Products and Services Types of Financing Industries Covered
Revolving Credit Facilities Fully Committed Borrowers diversified across industries
1st and 2nd Lien Term Loans ? Acquisition Financings Particular strength in Consumer, Healthcare,
? Special Situations (e.g., Debtor-in-Possession Industrials, and TMT
Bridge Commitments financing)
Asset-based loans Best Efforts
Administrative Agency Services ? Dividend Recapitalizations
Refinancings
4.5% 0.8%
9.3% 8.6%
9.4%
8.6% 7.1% 26.2%
17.9%
54.9% 24.3%
17.5%
82.1% 13.3%
15.6%
TMT
Acquisition Dividend Recap Consumer & Retail
1st Lien 2nd Lien Bridge Backstop Refinancing Repricing Industrials
Healthcare
Other Business and Financial Services
Energy & Maritime
Gaming & Leisure
76
Jefferies Finance – League Tables
Jefferies Finance LLC
($ Millions)
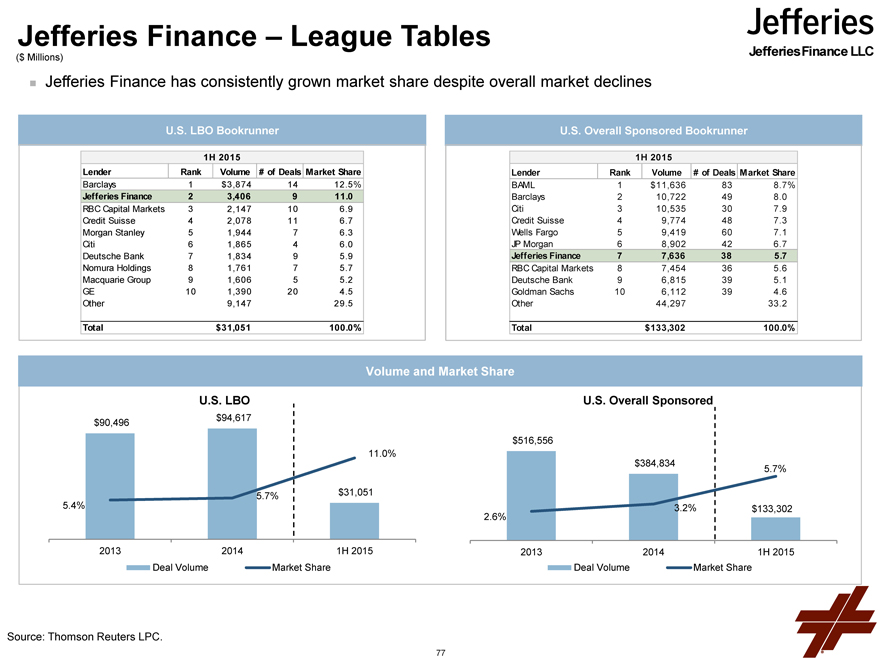
Jefferies Finance has consistently grown market share despite overall market declines
U.S. LBO Bookrunner U.S. Overall Sponsored Bookrunner
1H 2015 1H 2015
Lender Rank Volume # of Deals Market Share Lender Rank Volume # of Deals Market Share
Barclays 1 $3,874 14 12.5% BAML 1 $11,636 83 8.7%
Jefferies Finance 2 3,406 9 11.0 Barclays 2 10,722 49 8.0
RBC Capital Markets 3 2,147 10 6.9 Citi 3 10,535 30 7.9
Credit Suisse 4 2,078 11 6.7 Credit Suisse 4 9,774 48 7.3
Morgan Stanley 5 1,944 7 6.3 Wells Fargo 5 9,419 60 7.1
Citi 6 1,865 4 6.0 JP Morgan 6 8,902 42 6.7
Deutsche Bank 7 1,834 9 5.9 Jefferies Finance 7 7,636 38 5.7
Nomura Holdings 8 1,761 7 5.7 RBC Capital Markets 8 7,454 36 5.6
Macquarie Group 9 1,606 5 5.2 Deutsche Bank 9 6,815 39 5.1
GE 10 1,390 20 4.5 Goldman Sachs 10 6,112 39 4.6
Other 9,147 29.5 Other 44,297 33.2
Total $31,051 100.0% Total $133,302 100.0%
Volume and Market Share
U.S. LBO U.S. Overall Sponsored
$90,496 $94,617
$516,556
11.0%
$384,834 5.7%
5.7% $31,051
5.4% 3.2% $133,302
2.6%
2013 2014 1H 2015 2013 2014 1H 2015
Deal Volume Market Share Deal Volume Market Share
Source: Thomson Reuters LPC.
77
Jefferies Finance – Summary Financials
($ Millions) Jefferies Finance LLC
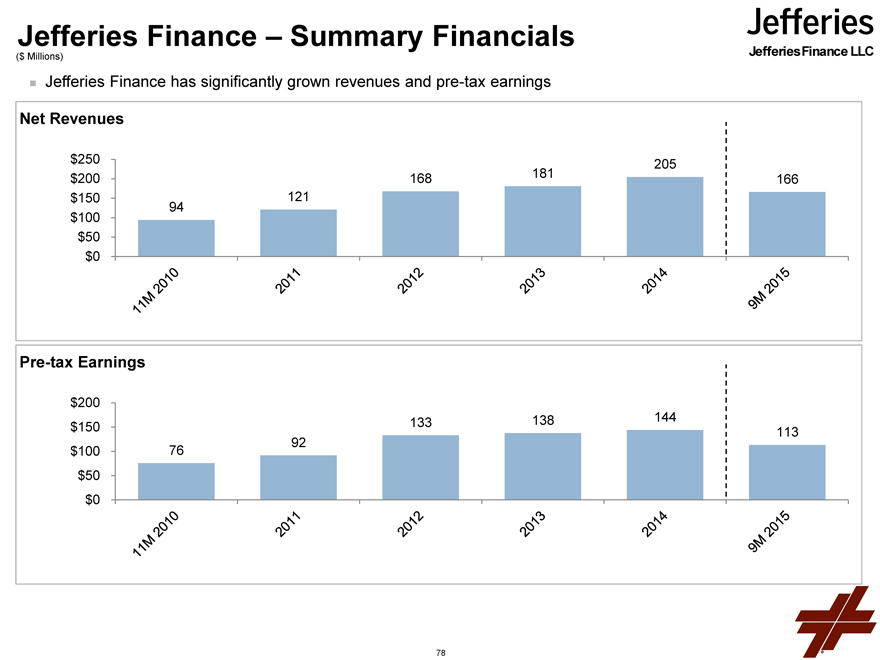
Jefferies Finance has significantly grown revenues and pre-tax earnings
Net Revenues
$250 205
$200 168 181 166
$150 121
94
$100
$50
$0
Pre-tax Earnings
$200
$150 133 138 144
113
$100 76 92
$50
$0
78
Jefferies Finance – Strategic Priorities
Jefferies Finance LLC
Continue to drive market share in our core U.S. Sponsor Finance business, leveraging the strength and momentum of Jefferies Investment Banking
Expand in complementary areas: middle market, asset-based lending and asset management
Grow European franchise, leveraging Jefferies’ European Investment Banking platform
79
Equities
80
Equities – Overview
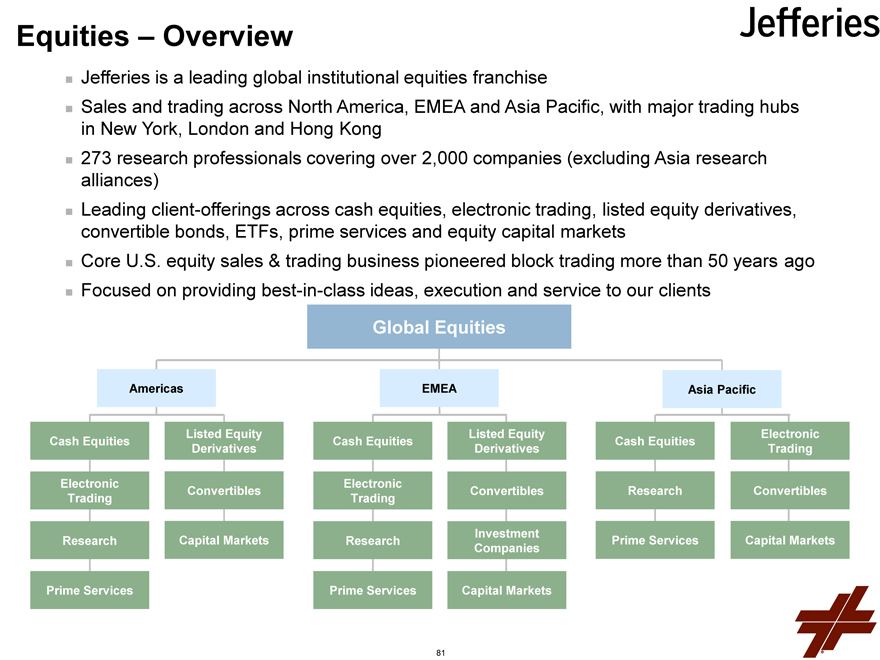
Jefferies is a leading global institutional equities franchise
Sales and trading across North America, EMEA and Asia Pacific, with major trading hubs in New York, London and Hong Kong 273 research professionals covering over 2,000 companies (excluding Asia research alliances) Leading client-offerings across cash equities, electronic trading, listed equity derivatives, convertible bonds, ETFs, prime services and equity capital markets
Core U.S. equity sales & trading business pioneered block trading more than 50 years ago Focused on providing best-in-class ideas, execution and service to our clients
Global Equities
Americas EMEA Asia Pacific
Listed Equity Listed Equity Electronic
Cash Equities Cash Equities Cash Equities
Derivatives Derivatives Trading
Electronic Electronic
Convertibles Convertibles Research Convertibles
Trading Trading
Investment
Research Capital Markets Research Prime Services Capital Markets
Companies
Prime Services Prime Services Capital Markets
81
Equities – Market Update
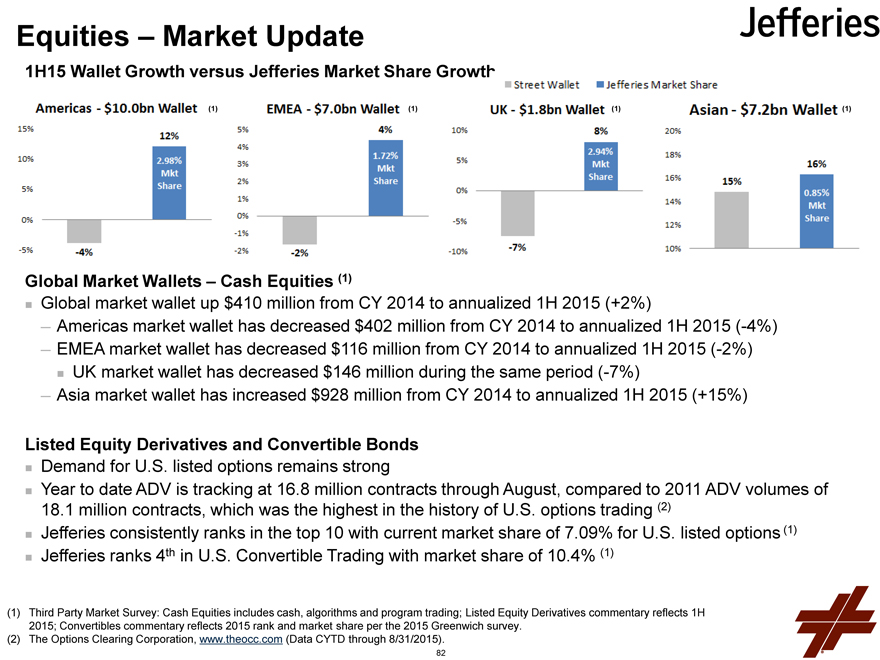
1H15 Wallet Growth versus Jefferies Market Share Growth
(1)(1)(1)(1)
Global Market Wallets – Cash Equities (1)
Global market wallet up $410 million from CY 2014 to annualized 1H 2015 (+2%)
Americas market wallet has decreased $402 million from CY 2014 to annualized 1H 2015 (-4%)
EMEA market wallet has decreased $116 million from CY 2014 to annualized 1H 2015 (-2%)
UK market wallet has decreased $146 million during the same period (-7%)
Asia market wallet has increased $928 million from CY 2014 to annualized 1H 2015 (+15%)
Listed Equity Derivatives and Convertible Bonds
Demand for U.S. listed options remains strong
Year to date ADV is tracking at 16.8 million contracts through August, compared to 2011 ADV volumes of
18.1 million contracts, which was the highest in the history of U.S. options trading (2)
Jefferies consistently ranks in the top 10 with current market share of 7.09% for U.S. listed options (1)
Jefferies ranks 4th in U.S. Convertible Trading with market share of 10.4% (1)
Third Party Market Survey: Cash Equities includes cash, algorithms and program trading; Listed Equity Derivatives commentary reflects 1H 2015; Convertibles commentary reflects 2015 rank and market share per the 2015 Greenwich survey.
The Options Clearing Corporation, www.theocc.com (Data CYTD through 8/31/2015).
82
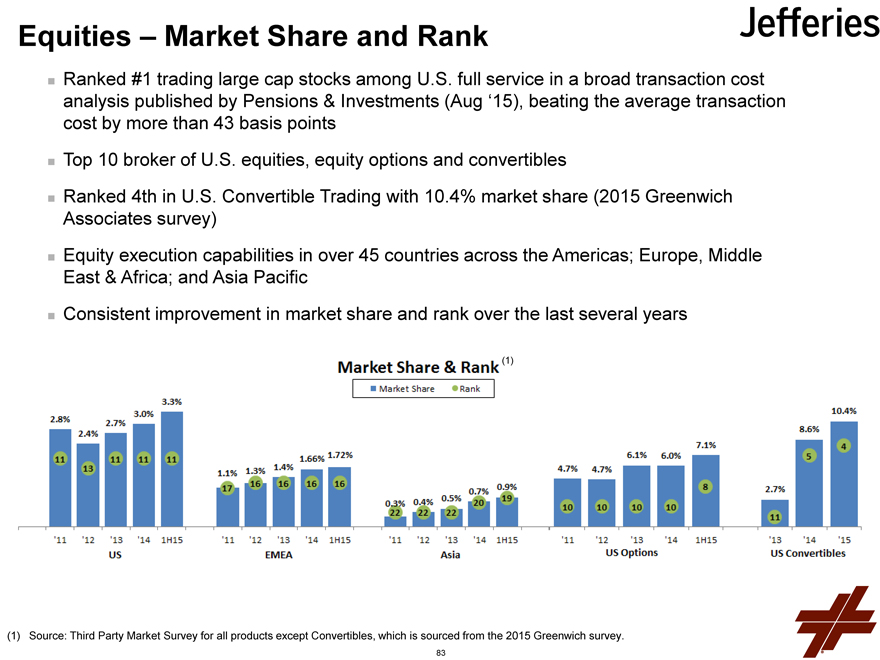
Equities – Market Share and Rank
Ranked #1 trading large cap stocks among U.S. full service in a broad transaction cost analysis published by Pensions & Investments (Aug ‘15), beating the average transaction cost by more than 43 basis points
Top 10 broker of U.S. equities, equity options and convertibles
Ranked 4th in U.S. Convertible Trading with 10.4% market share (2015 Greenwich
Associates survey)
Equity execution capabilities in over 45 countries across the Americas; Europe, Middle East & Africa; and Asia Pacific
Consistent improvement in market share and rank over the last several years
(1)
Source: Third Party Market Survey for all products except Convertibles, which is sourced from the 2015 Greenwich survey.
83
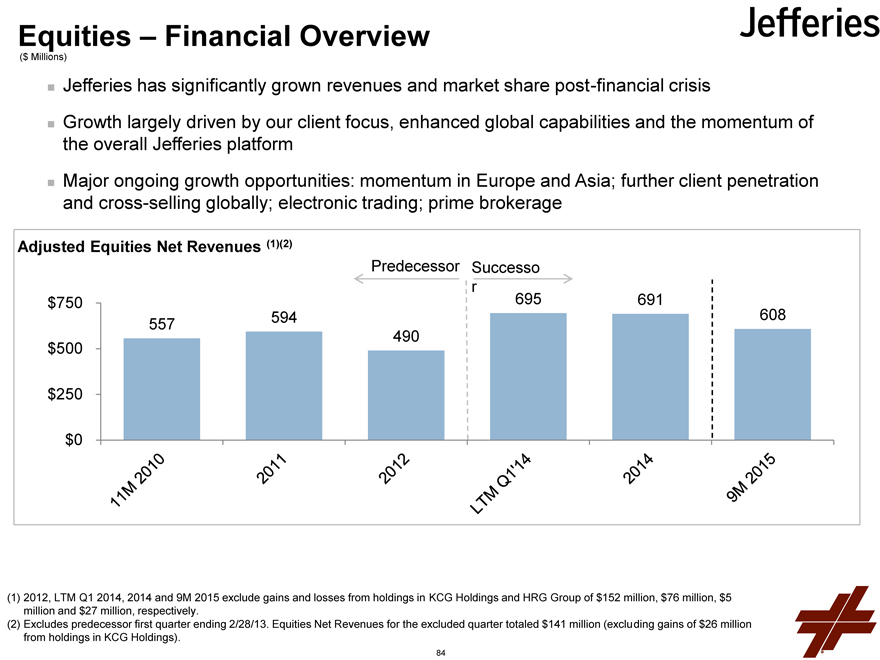
Equities – Financial Overview
($ Millions)
Jefferies has significantly grown revenues and market share post-financial crisis
Growth largely driven by our client focus, enhanced global capabilities and the momentum of the overall Jefferies platform
Major ongoing growth opportunities: momentum in Europe and Asia; further client penetration and cross-selling globally; electronic trading; prime brokerage
2012, LTM Q1 2014, 2014 and 9M 2015 exclude gains and losses from holdings in KCG Holdings and HRG Group of $152 million, $76 million, $5 million and $27 million, respectively.
Excludes predecessor first quarter ending 2/28/13. Equities Net Revenues for the excluded quarter totaled $141 million (excluding gains of $26 million from holdings in KCG Holdings).
84
Equities – Global Strategic Priorities
Global Electronic Trading Distribution
Increase the breadth of clients, as well as expanding penetration with existing clients
Grow the EMEA and Asia Electronic distribution platform and continue to cross-sell capabilities across regions
Prime Brokerage
Capitalize on U.S. opportunities to serve mid-sized prime brokerage clients that are increasingly underserved by the large bank holding companies
Continued focus on the efficient use of balance sheet and higher ROA clients
Leverage the Strength and Depth of our European Capabilities
Grow European research coverage into new sectors and broaden existing sector coverage
Further enhance distribution capabilities in Continental Europe
85
Fixed Income
86
Fixed Income – Overview
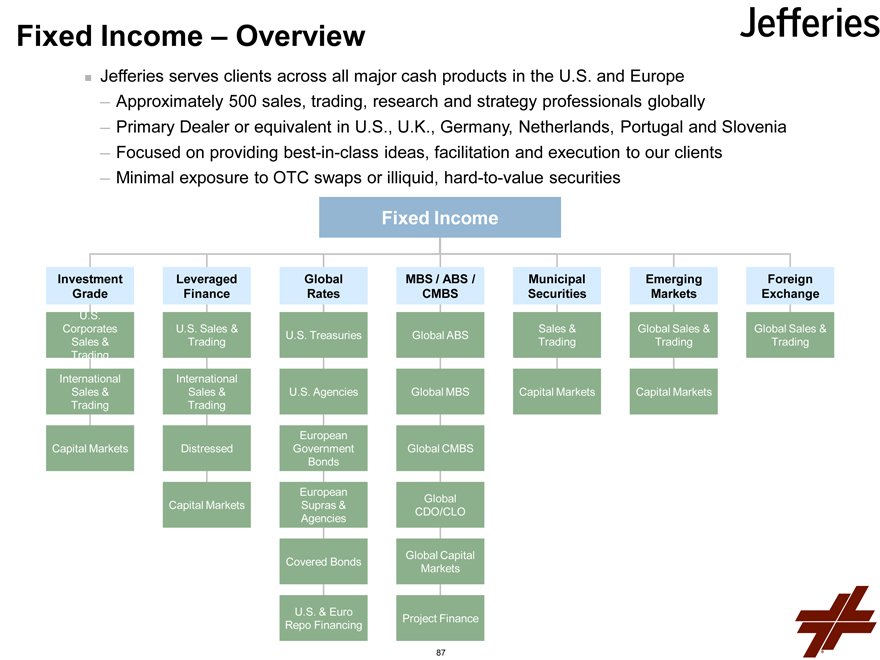
.Jefferies serves clients across all major cash products in the U.S. and Europe
-Approximately 500 sales, trading, research and strategy professionals globally
-Primary Dealer or equivalent in U.S., U.K., Germany, Netherlands, Portugal and Slovenia
-Focused on providing best-in-class ideas, facilitation and execution to our clients
-Minimal exposure to OTC swaps or illiquid, hard-to-value securities
Fixed Income
Emerging
Markets
Capital Markets
Global Sales &
Trading
Municipal
Securities
Sales &
Trading
Capital Markets
Investment
Grade
Capital Markets
U.S.
Corporates
Sales &
Trading
International
Sales &
Trading
Leveraged
Finance
U.S. Sales &
Trading
International
Sales &
Trading
Distressed
Global
Rates
U.S. Treasuries
U.S. Agencies
European
Government
Bonds
U.S. & Euro
Repo Financing
European
Supras &
Agencies
Covered Bonds
MBS / ABS /
CMBS
Global
CDO/CLO
Global ABS
Global MBS
Global CMBS
Project Finance
Global Capital
Markets
Foreign
Exchange
Global Sales &
Trading
Capital Markets
87
Fixed Income – Market Update
.Markets are currently being influenced by central bank intervention and global balance
sheet deleveraging
.Over the last twelve months, uncertainty surrounding the global economy has increased,
driven by China, Emerging Markets, Greece and commodities
-This caused a further slowdown in secondary market volumes as spreads widened, new
issue activity in leveraged products slowed, and trading liquidity in certain market
segments declined
.Significant regulation has also been implemented; most notably Dodd Frank, the Volcker
Rule and additional capital requirements
-This has resulted in a decrease in RWAs, balance sheet and market liquidity, as well as
reduced product offerings and increased capital and compliance costs across bank
holding company trading platforms
88
Fixed Income – Financial Overview
($ Millions)
Adjusted Fixed Income Net Revenues (ex-Bache); No Credit for Investment Banking Origination and Distribution
(1,2)
245
728 625
1,004
583
545
180
$0
$500
$1,000
$1,500
2006
11M 2010
2011
2012
LTM Q1’14
2014
9M 2015
Predecessor
Successor
Pre-Financial
Crisis
(1)Excludes predecessor Q113 Fixed Income Net Revenues of $292 million.
(2)Adjusted Fixed Income Net Revenues is a non-GAAP measure and represents results excluding the impact of the net revenues of the Bache business.
See pages 176—177 for a reconciliation to GAAP figures.
.Jefferies Fixed Income is focused on high margin, differentiated cash products, primarily in
credit markets
.The period September 2014 through August 2015 has been characterized by inconsistent
credit market activity, and significant price declines due to challenges at energy companies
and the ongoing transition from quantitative easing
.Against the challenging revenue environment, the quality of Jefferies’ team and relationships
have improved and should continue to strengthen
.As market activity recovers, Jefferies continues to have an opportunity to build relationships
further, enhance capabilities and grow market share
89
Fixed Income – Strategic Priorities
.Refocus Fixed Income by better utilizing our resources to be
more efficient with capital, risk and balance sheet, and deliver
better margins and returns
.Focus on further developing our core businesses, such as
global credit, which align well with our growing Investment
Banking platform
.Leverage our platform to selectively target opportunities
-Grow average transaction size for increased profitability
-Globally coordinate and grow complementary products to align
further and more fully with our clients (Agency Foreign Exchange
and Emerging Markets)
90
JefferiesLCC_Jef logo_without tag.wmf
91
Jefferies LoanCore Loan Volume Originated through 8/31/15(1)
Jefferies LoanCore – Overview
.Jefferies LoanCore, a joint venture between Jefferies and GIC Private Ltd (f.k.a. Government of
Singapore Investment Corporation), is a finance company focused on originating and securitizing
commercial mortgage loans
.Jefferies LoanCore has established itself as a leading lender to commercial real estate borrowers
-Team of 35 originators sources differentiated lending opportunities across major U.S. and U.K.
markets
-Since inception to 8/31/15, JLC has originated 373 real estate assets with an aggregate principal
balance of $8.0 billion, secured by various property types in 45 states and the U.K.
-Participated in 14 successful securitizations totaling more than $4.6 billion to date
($ Millions)
(1)Includes fixed rate and floating rate loans, bridge lending, mezzanine, and preferred investments.
$1,037
$2,291
$1,875 $1,998
49
123
105
70
-10
10
30
50
70
90
110
130
2012
2013
2014 9M 2015
Arranged Volume
# of Deals JefferiesLCC_Jef logo_without tag.wmf
92
Jefferies LoanCore – Origination Platform
.Jefferies LoanCore’s team is comprised of over 50 professionals, 35 of whom are dedicated to origination
.Long-standing strategic relationships with property owners, developers, mortgage brokers and investors
.Ability to provide borrowers with access to mortgage loan products on a ‘‘wholesale’’ (or direct lender) basis
3
5
3
6
3
Chicago
Atlanta
San Francisco
Los Angeles
Orange County
Greenwich
3
United Kingdom
12
Key
West
Southeast
Midwest
Northeast
#
Origination staff
JefferiesLCC_Jef logo_without tag.wmf
93
Jefferies LoanCore – Diversified Loan Origination
.Jefferies LoanCore has diverse origination capabilities with loans (primarily consisting of first
mortgages) spanning multiple geographies and property types
Asset Type (1)
Property Type (1)
Regions Covered (1)
(1) Loans originated and purchased by original balance from inception to 8/31/15.
CA
22%
NY
16%
FL
8%
TX
6%
United
Kingdom
4%
MI
3%
GA
3%
NV
3%
DC
3%
IL
3%
WA
3%
36 Other
States
26%
Office
26%
Retail
16%
Hospitality
14%
Multifamily
14%
Mixed Use
13%
Industrial
6%
Various &
Other
5%
Manufactured Housing
5%
Self Storage
1%
First
Mortgage
95%
Subordinated
Debt
5%
JefferiesLCC_Jef logo_without tag.wmf
94
Jefferies LoanCore – Financial Overview
.Following a challenging market environment in 2014, Jefferies LoanCore’s profitability has recovered in
2015 driven by improved volume and market execution
-Opportunities for significant medium-term growth; upcoming CMBS maturity-wall as well as expansion
in dislocated, but well-established, markets such as the U.K.
Jefferies LoanCore Pre-Tax Earnings
($ Millions)
$84
$85
$38
$62
$0
$50
$100
2012
2013
2014
9M 2015
JefferiesLCC_Jef logo_without tag.wmf
95
Jefferies LoanCore – Strategic Priorities
.Grow loan originations, capitalizing on the upcoming “wall” of CMBS maturities in
2016 and 2017
.Establish a complementary REIT platform
.Capitalize on growth in dislocated but well-established markets, such as the U.K.
JefferiesLCC_Jef logo_without tag.wmf
96
Risk Management
97
Risk Principles
Jefferies’ comprehensive risk management framework has been a foundation for our
success across market cycles
.Culture
-We are all Partners at our firm, collectively building for the long-term on a foundation
established over 50+ years
.Hands-on
-Our senior management and Board are deeply involved in the “nuts and bolts” of how and
where we are taking risks across the firm
.Integrated
-Our independent risk management group and our business leaders are deeply integrated
into our trading desks, ensuring a clear and comprehensive view of the firm’s risk
.Asset Quality
-Jefferies is dedicated to serving our clients in liquid, transparent products. We limit illiquid
assets and derivatives to ensure the overall liquidity and health of our balance sheet
98
Risk Management Summary Framework
Note: Dotted lines represent communication lines.
Jefferies Group
Board of Directors
Firmwide
Committees
Independent
Price
Verification
New Business
Business Line
Committees
Market Risk
Management
Credit Risk
Management
Operational
Risk
Management
Underwriting
Acceptance
Audit Firm Management
Compensation
Corporate
Governance and
Nominating
Executive
Operating
Risk
Management
Asset / Liability
Chief Risk Officer /
Global Treasurer
Capital and
Liquidity
Margin
Oversight
99
Quarterly VaR Average
($ Millions)
Annual VaR Average
($ Millions)
VaR Report
$0
$5
$10
$15
$20
1Q 10
3Q 10
1Q 11
3Q 11
1Q 12
3Q 12
1Q 13
3Q 13
1Q 14
3Q 14
1Q 15
3Q 15
Avg. VaR related to KCG & HRG
Avg. Firmwide VaR excluding KCG & HRG
$0
$5
$10
$15
$20
2010
2011
2012 2013
2014
9M 2015
Avg. VaR related to KCG & HRG
Avg. Firmwide VaR excluding KCG & HRG
100
0
20
40
60
80
100
120
140
<(8)
(8)-(4)
(4)-(0)
0-4 4-8
8-12
12-16
16-20
>20
# of Days
$ Millions
2011
2012
2013 2014
2015 LTM
Distribution of Daily Net Trading Revenues (Excluding KCG Holdings and HRG Group)(1)
VaR Report and Trading Revenues
(1)Historically, Jefferies has presented Distribution of Daily Net Trading Revenues including KCG Holdings and HRG Group.
(2)Number of Breaches represents the number of days during a given period where net trading losses were greater than VaR estimates.
Historical Negative Trading Revenues Days
20112012201320142015Q1Q2Q3Q4Q1Q2Q3Q4Q1Q2Q3Q4Q1Q2Q3Q4Q1Q2Q3Negative Trading Rev. Days ex. KCG Holdings and HRG Group10010102662011114162169518Total Number of Negative Trading Rev. Days:1001010266201100187717111021Number of Breaches (2)—2———11—1-2—2
101
Capital and Liquidity
Management
102
Liquidity and Funding Principles
Jefferies’ long-standing liquidity and funding principles have maintained the
strength and soundness of our platform across market cycles
.Owning inventory that is composed of liquid assets that turn over regularly, with Level
3 assets less than 3% of inventory
.Maintaining a sound, long-term capital base and reasonable leverage relative to our
business activity
.No material reliance on short-term unsecured funding or customer balances. No
commercial paper program
.Short term secured funding that is readily and consistently available through clearing
houses, or fixed for periods of time that exceed the expected tenure of the inventory
they are funding
.Assessing capital reserves and maintaining liquidity to withstand adverse changes in
the trading or financing markets and a firm specific idiosyncratic stress
.Where appropriate, entering into partnerships and joint ventures with complementary
long-term partners to pursue business opportunities that otherwise may exceed our
capital capacity or risk tolerance (Jefferies Finance, Jefferies LoanCore)
103
5.0x
6.0x
7.0x
8.0x
9.0x
10.0x
11.0x
12.0x
13.0x
14.0x
15.0x
$-
$10,000
$20,000
$30,000
$40,000
$50,000
1Q 10
2Q 10
3Q 10
4Q 10
1Q 11
2Q 11
3Q 11
4Q 11
1Q 12
2Q 12
3Q 12
4Q 12
1Q 13
2Q 13
3Q 13
4Q 13
1Q 14
2Q 14
3Q 14
4Q 14
1Q 15
2Q 15
3Q 15
Total Capital
Gross Assets
Leverage
Historical Quarterly Leverage (1)
($ Millions)
Limited Leverage
Predecessor
Successor
(1)Total assets divided by total equity. Q2 2013 through Q3 2015 exclude the impact of the Leucadia Transaction (a non-GAAP measure). See page 178
for a reconciliation to GAAP figures.
(1)
.Jefferies has a long-standing policy of carefully managing balance sheet leverage
.In periods of stress, Jefferies has demonstrated the ability to rapidly reduce leverage without
unduly impacting our business
104
Fundability of Collateral
.Liquid, easy to fund collateral. 91% Tier 1 or Tier 2 collateral funded with average
haircuts of 5% or below. Tier 3 average haircut of 11%
.98 Lenders providing liquidity for Tier 2,3 and 4 collateral with the largest lender at only
10% of the total
.Less than 1% of inventory deemed Tier 4 with an average haircut of 31%
Tier 1: CCP Eligible
60%
Tier 2: Agency CMO’s, IG
Fixed Income, Listed
Equities
31%
Tier 3 Non-IG Fixed
Income, Convertibles,
Mortgage Whole Loan
9%
Tier 4: Corporate Loans,
Distressed Debt and
Equities, Investments,
CLO/CDO Equity
0.4%
105
Global and Legal Entity Liquidity Stress Model
.Stress test contingency liquidity outflows at the global and regional level
-100% loss of non-cleared repo and stock loan
-Higher margins at CCP’s and clearing organizations
-100% loss of customer credit balances
-Buy back Jefferies debt for market support
-Collateral outflows on ISDA/CSA’s
-Intraday liquidity at clearing banks
-No sale of assets for a minimum 30 Days
-Assume no movement of liquidity between regulated entities.
.Maintain positive stressed liquidity position for a minimum of 30 days at global and at legal entity level
Jefferies Group,
$1,418MM 27%
Jefferies
International,
$1,227MM
24%
Jefferies LLC,
$1,998MM 39%
Other, $508MM
10%
Global Liquidity Pool—$5,151mm or 12% of
Assets
106
Long-Term Debt Profile
Long-Term Debt Maturity Schedule (Notional) (1)
($ Millions)
.As of 08/31/15, our $5 billion notional of long-term debt had a weighted average maturity of approximately 8.4
years (1)
.No maturity of long-term debt in a single year is greater than 20% of outstanding long-term debt; $850 million
of formerly long-term debt matures in the next six months and will be repaid using available cash
$0
$200
$400
$600
$800
$1,000
2017
2018
2019
2020
2021
2022
2023
2024
2025
2026
2027
2028
2029
2030
2031
2032+
(1)Long-Term Debt does not include $500 million Senior Notes maturing November 9, 2015 and $350 million Senior Notes maturing March 15, 2016.
107
Summary
.Our business model, risk metrics, and liquidity/funding
principles and implementation haven’t changed, and remain
focused and vigilant, as always
.With the refocus of Fixed Income, we expect reduced balance
sheet, risk and capital utilization, along with better
profitability and returns
108
Q & A
IRQuestions@Leucadia.com
Leucadia Merchant Banking
109
Leucadia Merchant Banking – Overview
6/30/15
% Ownership
6/30/15
Book Value
National Beef 79%
$766 million
HRG
23%
$606 million
($476 million at cost)
Vitesse
96%
$260 million
Juneau
98%
$194 million
Garcadia
~75%
$185 million
Linkem
55%
$146 million
Conwed
100%
$115 million
Golden Queen
35%
$81 million
Idaho Timber
100%
$74 million
110
National Beef®
111
Business Overview
.National Beef processes ~3 million fed cattle per year representing ~12.5% market
share
-2 processing plants strategically located in Liberal and Dodge City, KS
-Primary competitors: Cargill, JBS, Tyson
-Export beef and beef by-products to more than 20 countries
.Beef processing is a spread margin business, so National Beef is intensely focused on
value-added production to drive superior performance versus its commodity-focused
competitors
-National Beef operates 3 further processing plants converting beef and pork into
fresh, consumer-ready products
-Strategically located in PA, GA and KS
.National Beef’s tannery is among the largest in the world
-Converts raw cattle hides to wet blue leather for use in finished leather production for
automotive, shoes, fashion, etc.
.www.kansascitysteaks.com
-Premium direct-to-consumer beef, center-of-the-plate entrees, side dishes and
desserts
112
.U.S. beef cowherd is positioned for meaningful growth. Record profits in cow-calf
sector and excellent pasture conditions have led to increased heifer retention and
reduced beef cow slaughter. While this has put negative pressure on packing industry
margins for the last few years, in the longer run it bodes well for margins as it will lead
to an increase in the number of fed cattle available for slaughter
Industry Update
28%
30%
32%
34%
36%
38%
40%
42%
44%
Jan-80
Jan-85 Jan-90
Jan-95 Jan-00
Jan-05 Jan-10
Jan-15
Heifer Slaughter as a % of Combined Steer/Heifer Slaughter
Monthly Ratio
13-month
Rolling
Average Ratio
Source: USDA.
113
.Supplies of cattle available for slaughter are projected to start increasing in 2016
.Beef demand should improve as prices become more competitive with pork and
poultry products
.As plant capacity utilization rates begin to increase, industry margins should improve
U.S. Steer & Heifer slaughter
Million head
Years
Projected 2015-20
Industry Update (continued)
Source: USDA and CattleFax.
114
Profit from Operations ($ Millions) (1, 2)
Revenue ($ Billions) (1)
Financial Performance
.The beef processing industry is cyclical and working capital intensive. However, it
has significant barriers to entry and offers attractive prospects for free cash flow
generation over the cycle
.Given cattle supply constraints, strategies designed to drive margin expansion are
more important to long-term profit growth versus those focused on increasing total
revenue
(1)Prior to being acquired by Leucadia in December 2011, National Beef’s fiscal year ended in August. In addition, 2012 amounts are not comparable to prior
periods as they reflect the application of acquisition accounting for National Beef, principally resulting in greater depreciation and amortization expenses
during 2012, 2013 and 2014.
(2)Profit from operations is a non-GAAP measure. Profit from operations equals pre-tax income, plus depreciation and amortization expenses and excluding
interest expense / (income), net, and an impairment in 2013. See page 179 in the appendix for a reconciliation to GAAP amounts.
$5.4
$5.8
$6.8
$7.5
$7.5
$7.8
$0
$2
$4
$6
$8
2009
2010
2011
2012
2013 2014
FYE August, FYE December,
$212.7
$313.3 $324.5
$154.5
$121.7
$59.5
$0
$100
$200
$300
$400
2009
2010
2011
2012
2013 2014
FYE August, FYE December,
115
Profit from Operations ($ Millions) (1)
Revenue ($ Billions)
Financial Performance (continued)
.2015 6M financial results have been negatively impacted by lower slaughter
numbers, down ~16% vs. 2014, record high prices for cattle and an 8.1%
year-over-year decline in USDA drop credit values, including a 32% decline in
hide prices in the first half of 2015. These were mitigated, in part, by higher
prices for beef and improved volumes and margin in our consumer ready
businesses
(1)Profit from operations is a non-GAAP measure. Profit from operations equals pre-tax income, plus depreciation and amortization expenses and excluding
interest expense / (income), net. See page 179 in the appendix for a reconciliation to GAAP amounts.
$3.9 $3.9
$0
$2
$4
$6
$8
2014 2015
6 months
Ending June,
$27.4
$9.3
$0
$10
$20
$30
2014
2015
6 months
Ending June,
116
2015 Developments
.In our Consumer Ready business, we have replaced much of the volume
lost when Walmart exited our relationship in 2013 with a more diverse
customer base seeking a broader selection of product offerings
.In response to a worldwide disruption in the leather industry, caused by
reduced end-user demand, ongoing realignment in the Chinese market and
U.S. port disruptions, we temporarily reduced our production of wet blue
leather and significantly decreased our inventory
.Kansas City Steak Company is growing revenue at 30% vs. 2014
117
Strategic Priorities
.Focus on additional value-added production
-Ongoing dialogue with retailer and food service providers regarding
consumer-ready, portion-controlled and ready-to-cook product lines
-Currently operate 3 further processing plants with capacity available for
growth
-We are increasing value-added capabilities at our Kansas beef
processing plants
.Drive volume and margin through our expanded and modernized tannery
-Providing high quality lime-fleshed, wet blue hides to recurring customers
from one of the largest and most technologically advanced facilities in the
world
.Maintain market share and enhance profitability
-Capture value of efficiencies and operational improvements
-Position company for long-term rebound in domestic herd size
-Focus on export opportunities as markets develop
.Execute on strategic plan to drive significant growth of Kansas City Steak
Company
118
HRG/GROUP
119
Company Overview
.NYSE-listed diversified holding company (NYSE: HRG) that operates in four
business segments:
-Consumer Products – Spectrum Brands (NYSE: SPB, ~58% ownership (1))
-Insurance – Fidelity & Guaranty Life (NYSE: FGL, ~81% ownership (1)); FrontStreet
Re (100% ownership)
-Energy – Compass Production (~100% ownership)
-Asset Management (de minimis net book value)
Spectrum Brands
untitled
(1)Source: HRG Group’s 3rd Quarter August 6, 2015 Conference Call presentation
https://photos.prnewswire.com/prnvar/20150309/180478LOGO
120
Key Ownership Details
.Initial investment September 2013 with follow-on purchases in March and
November 2014
.Total Cost: $476 million
.Fair Market Value at 06/30/15: $605.8 million
.Ownership: 23.1% (1)
.Joseph Steinberg serves as Chairman and Andrew Whittaker serves as a Director
(1)Leucadia owned 46.6 million shares as of 6/30/15.
121
2015 Developments
.Driving simplification and strategic focus
-Supporting growth initiatives at Spectrum
-Exploring strategic alternatives for Fidelity
-Maximizing recovery of capital at Salus
-Managing liquidity and leverage at Compass(1)
.Successfully raised $400 million through a series of tack-ons to existing notes
-Offers were all well over-subscribed
-$282 million of proceeds used to acquire 49% of common stock offered by
Spectrum Brands in connection with acquisition of Armored AutoGroup (2)
https://photos.prnewswire.com/prnvar/20150309/180478LOGO
(1)As per HRG Group’s 3rd Quarter 2015 Conference Call Presentation released on August 6th, 2015.
(2)As per HRG Group’s 3rd Quarter 2015 10-Q.
122
Spectrum Brands Overview
https://photos.prnewswire.com/prnvar/20150309/180478LOGO
.Spectrum Brands (NYSE: SPB) is a global
consumer products company focused on
delivering a portfolio of consumer products
with the same performance for a lower
price / better value
.Core segments are Global Batteries &
Appliances, Pet, Home & Garden,
Hardware & Home Improvement, and
Global Auto Care
.Achieved quarter-over-quarter net sales
and adjusted EBITDA growth with few
exceptions since FY 2009. Expects to
generate up to $440 million of free cash
flow in FY 2015 (ending 9/30/15), up from
$359 million in 2014 (1)
.Closed $1.4 billion Armored AutoGroup
acquisition on May 21, 2015 which
expanded SPB into the growing, highly-
profitable automotive aftermarket category
(1)As per Spectrum Brands 9/29/15 Press Release.
(2)As per Spectrum Brands 9/30/15 Denver Investors Presentation. (a) Reflects pro forma as if Russell Hobbs merger completed at beginning of respective
period. (b) Reflects pro forma as if HHI acquired at beginning of respective period. The pre-acquisition earnings and capital expenditures of HHI do not
include the TLM Taiwan business as stand alone financial data is not available for the periods presented. The TLM Taiwan business is not deemed
material to the Company’s operating results.
(3)LTM 6/30/15 financials per HRG Group’s 3rd Quarter 2015 10-Q.
$272 $297
$391
$432 $457
$668 $677
$724
$757
11.7%
12.2%
13.0%
13.9% 14.3%
15.8% 15.8%
16.4% 16.6%
FY2007
FY2008
FY2009(a)
FY2010(a)
FY2011
FY2012(b)
FY2013(b)
FY2014
LTM 6/30/15(3)
Adjusted EBITDA ($ Millions) / Margin Performance (2)
$2,333 $2,427
$3,006
$3,111 $3,187
$4,226 $4,277 $4,429 $4,560
FY2007
FY2008
FY2009(a)
FY2010(a)
FY2011
FY2012(b)
FY2013(b)
FY2014
LTM 6/30/15(3)
Net Sales Performance ($ Millions) (2)
123
Financial Performance
(1)Source: Consumer, Insurance and Energy FY 2012, FY 2013 and FY 2014 financials per HRG Group’s 2014 10-K. All 9M Ending financials per HRG
Group’s 3rd Quarter 2015 10-Q. Consumer – Pro Forma Net Sales and Adjusted EBITDA; Insurance – Adjusted Operating Income; and Energy –
Adjusted EBITDA are non-GAAP measures. See HRG Group’s 2014 10-K and 2015 3rd Quarter 2015 10-Q for reconciliation to GAAP measures.
(2)FY 2012 and FY 2013 are pro forma as if Hardware & Home Improvement Group was acquired at the beginning of the respective periods.
https://photos.prnewswire.com/prnvar/20150309/180478LOGO
FYE September 30,9M Ending2012201320146/30/146/30/15Consumer (1)(2)Pro Forma Net Sales4,226$ 4,277$ 4,429$ 3,251$ 3,382$
Adjusted EBITDA668 677 724 538 571
% Margin15.8%15.8%16.4%16.5%16.9%
Insurance (1)Revenues1,222$ 1,348$ 1,350$ 1,067$ 725$
Adjusted Op. Income278 154 155 123 75
% Margin22.7%11.4%11.4%11.5%10.3%
Energy (1)RevenuesNA90$ 147$ 112$ 85$
Adjusted EBITDANA40 63 50 24
% MarginNA43.9%43.1%44.3%28.6%
($ Millions)
124
Sum of the Parts Valuation (Dilutive) without AOCI
Source: Sum of the Parts Valuation per HRG Group’s 3rd Quarter August 6, 2015 Conference Call presentation, updated for closing market prices on 10/05/15.
Book values are as of 06/30/15.
(1)HRG Group’s 08/06/15 Conference Call presentation valuation of Spectrum Brands is based on a volume weighted average closing price of $99.45 for the 20
day trading period ended 06/30/15. On 10/05/15, Spectrum Brands’ closing price was $96.38. HRG Group’s 08/06/15 Conference Call presentation valuation
of the Insurance Segment is based on a volume weighted average closing price of $23.13 for Fidelity & Guaranty Life for the 20 day trading period ended
06/30/15, and book value as of 06/30/15 for FrontStreet Re of $130.5 million. On 10/05/15, Fidelity & Guaranty Life’s closing price was $26.60. Valuation
excludes HRG Group’s share of Accumulated Other Comprehensive Income (“AOCI”).
(2)Per share amount for each of the below mentioned assets and liabilities is calculated by dividing the total valuation of each asset or liability by the
201,360,584 shares of HRG Group’s common stock outstanding as of 06/30/15, giving effect for the vesting of all restricted shares (4,277,709).
https://photos.prnewswire.com/prnvar/20150309/180478LOGO
HRG Sum of the Parts Valuation (Dilutive) without AOCITotal ($ Bn)Per Share (2)
Spectrum Brands (1)
Market Value2.7 13.29Insurance Segment (1)Market Value / Book Value1.4 6.86HGI Energy Holdings LLCBook Value(0.1) (0.51)
HGI Funding LLCBook Value0.7 3.54HGI Asset Management Holdings LLCBook Value(0.0) (0.06)
CashBook Value0.3 1.73Debt & Other Liabilities(1.8) (9.13)
Total Estimated Value3.2$ 15.71$
Estimated ValueMethod
125
GARCADIA
126
Garcadia Overview – top 13 U.S. dealership group
.4 Clusters, 26 dealerships – 15 domestic, 11 foreign brands
.Emphasis on customer experience as a differentiator
-Employee culture manically focused on customer experience
-Focus on leveraging digital channels to grow sales
-Proprietary reporting system emphasizing transaction profit and employee productivity
-Balance expense structure
127
Industry Update – key indicators are very favorable
U.S. Annual New Vehicle sales1
30 Day LIBOR
Avg. Age of all u.s. light vehicles2
Average Dealership pre-tax earnings2
(1)Source: Wards Auto and Morgan Stanley Research.
(2)Source: Wards Auto.
128
Financial Performance
Garcadia’s pre-tax income has continued to grow
(1)Represent combined amounts for all Garcadia dealership holdings, not just Leucadia’s share.
(2)Represents Leucadia’s share of cash distributions.
(3)Represents Leucadia’s net carrying amount for Garcadia (excluding land) and percentage return.
Fiscal Year Ended December 31,6M Ended($ Millions)2012201320146/30/2015Total Units Sold35,394 48,576 65,514 41,854
# of Dealerships18 21 26 26
Garcadia Revenue (1)1,100.8$ 1,548.4$ 2,071.1$ 1,378$
% Growth39.4%40.7%33.8%NAGarcadia Pre-Tax Income (1)37.4$ 46.9$ 59.2$ 39.3$
% Margin3.4%3.0%2.9%2.9%
Garcadia Distributions (2)24.4$ 33.1$ 41.3$ 25.6$
Equity—Beginning of Year(3)72.3$ 82.4$ 120.0$
Equity—End of Year(3)82.4$ 120.0$ 167.9$
Pre-Tax Return on Avg. Equity(3)33.2%31.9%28.4%
129
Strategic Priorities
.Simplify car buying experience for consumers – i.e., shorten time
-Prepare for a 30 minute transaction
-Eliminate unnecessary transaction steps
-Redefine and retrain sales associates to complete entire sale
.Increase lifetime customers – do more with higher through put
-Emphasis on customer retention through service
-Business model that includes maintenance and lower sales per transaction
-Reliance on efficiencies through processes and technology
.Integrate technology partners – simplify
-Current sales transaction can require up to 15 different logins
-Need to reduce partners and integrate
-Prepare for online shopping and online buying
.At this stage in the cycle, we will remain patient on the acquisition front
-Maintain “smart buyer” status
-Acquire dealerships with meaningful upside potential
130
VITESSE ENERGY
Velocity of Capital Compounding
131
Company Overview
Formed in May 2014 – Leucadia has funded $248 million to date for acquisitions and property development
Non-operating owner of oil and gas properties
in the core of the Bakken field
Strategy – acquire and develop leasehold
properties and convert undeveloped drilling
locations into cash flow producing assets
Partner with leading operators to drill and
complete new horizontal wells
More than 75% of current activity with
Burlington (COP), Oasis, XTO (Exxon),
Liberty Resources, EOG and Whiting
90% + of the Company’s value is in the
ground (undeveloped drilling locations)
Profitable every month even at $40 oil
Source: EIA
132
Current Hedge Position
Contract Period Swap or Collar Pricing (Floor / Ceiling)
July - December 2015 Collar $55.00 / $65.05 2016 Collar $52.50 / $70.702016 Swap $57.152017 Collar $55.00 / $64.652018 Collar $50.00 / $74.50 2019 Collar $50.00 / $78.90 2020 Collar $50.00 / $81.20
133
Industry Update
Oil prices have fallen ~50% from a year ago
Rig activity in the Bakken has dropped from 200 to 70 active rigs
Operators have responded by focusing activity in the core of the Bakken, cutting
costs and optimizing well designs
Drilling and completion costs have decreased by 30% - 40%
Reserves per new well have increased over 30%
Well density continues to increase (more wells drilled on same acreage)
Example: EOG increased Bakken total net resource potential by 2.5x in Q2 2015
without an acquisition
Economics in the core of the Bakken continue to be attractive
Vitesse owns under 1% of the acreage in the Bakken, but is participating in more
than 15% of the current drilling activity
134
Financial Performance
21,212 net acres in the core counties of Williams, McKenzie, Mountrail and Dunn
991 gross producing wells (23.3 net)
387 permitted, drilling or completing wells (9.4 net, of which 5.71 are completing)
225+ net future drilling locations ($1.5 billion of capital expenditures)
Financial and operating results for 1H 2015:
2,143 boe/d
$16.0 million revenue
$9.8 million EBITDA / $4.3 million of pre-tax income
$36.1 million of capital expenditures
Cash margin of $27.39/boe (Q2 2015)
135
2015 Developments
VE’s Thesis: Deeper, Denser, Cheaper, Better
Deeper
- Operators continue to see positive results in lower formations
- This adds future inventory in up to three new benches in the Three Forks
Denser
- Current spacing now 12-16 total wells per 1280 acre drilling unit (8-10 in Bakken
and 4-6 in Three Forks) up from 8 total wells previously
Cheaper
- Per well costs have fallen to between $6.0 million and $7.5 million (~30% decrease
since year-end 2014)
- Operators are cutting operating costs by leveraging infrastructure and technology
Better
- Improved completion techniques have yielded ~30% increase in reserves per well
from an average of 600 Mboe to ~800 Mboe
136
Quantifying Deeper / Denser / Cheaper / Better
Oil prices fell ~50% over the last year
Future net cash flow rises to $3.02 billion at $65.00/bbl WTI in 2017 and thereafter
$248 million invested to date
Future Net Cash Flow based on WTI strip pricing of:
October 2014 October 2015% Change Remaining Net Well Locations 182 224 23%
Total Net Reserves (Mboe) 91,752 119,250 30%
Total Future Capex ($ billions) $1.46 $1.42 (3%)
Future Net Cash Flow ($ billions) $3.18 $2.66 (16%)
2015
2016
2017
2018
2019
2020
2021
$46/bbl
$50/bbl
$53/bbl
$56/bbl
$58/bbl
$59/bbl
$60/bbl
137
$32.63 $32.36
$31.71
$30.48
$29.07
$25.13
$23.70
–
$5.00 $10.00 $15.00 $20.00 $25.00 $30.00 $35.00 $40.00 VE OASIS BLACK RIDGE Continental WHITING Northern Oil & Gas Inc. eog resources $/boe
Q2 2015 Operating Margin ($/boe)
VE
Operating margin per boe = revenue per boe less: lease operating costs (LOE), production taxes and transportation costs. Margin
based on Q215 WTI price of $57.84 (without hedges).
138
Strategic Priorities
Aggregate at compelling valuations
- Buying assets in the core of the Bakken
- Window of opportunity likely to be open in late 2015 and first half 2016
Optimize
- Focus on the assets we have – drilling elections
- Increase exposure in areas with highest rates of return
Monetize
- Selectively sell assets when appropriate
139
JUNEAU ENERGY
140
Company Overview
Juneau Energy (“JE”) is a Houston and Denver-based oil and gas company led by Brad
Juneau, CEO, and Jeff Edgar, President
- Focus is to leverage team’s engineering, geologic and financial experience to make
sound capital allocation decisions
Since formation in early 2014, JE has completed four acquisitions/joint ventures:
- Acquired significant leasehold interests in targeted areas in East and South Texas
22,000+ net acres in core East Texas Eagle Ford Shale (EEF) in Brazos, Burleson,
Lee and Grimes Counties, TX
21,000+ net acres in the Buda-Georgetown-Glen Rose (BGGR) development area
of Houston and Leon Counties, TX
Non-operated interests in South Texas Buda and EEF
- Joint venture with AEXCO Petroleum to develop horizontal Mississippi Lime in Alfalfa
County, OK
141
Industry Update
Sharp decline in oil prices since mid-2014 – July 2014 price of $108/Bbl to
$45/Bbl (1)
Rig count has dropped over 50%
since September 2014 (2)
Industry has needed to adjust with
costs falling 20-30% (3)
Many areas are uneconomic to
develop at current prices
Companies with high quality assets
and low leverage likely to weather the
storm better than others
Environment should provide
opportunities for well-capitalized
companies like Juneau
Quarterly Nominal Prices and Forecast (4)
120 100 80 60 40 0
Brent WTI
forecast
Q1 2013 Q3 2013 Q1 2014 Q3 2014 Q1 2015 Q3 2015 Q1 2016 Q3 2016
US$/bbl
(1) Bloomberg. WTI oil price of $107.62/Bbl on July 23, 2014 and $45.09/Bbl on September 30, 2015.
(2) Baker Hughes.
(3) Wood Mackenzie.
(4) Wood Mackenzie - Macro oils short-term outlook (August 4, 2015).
142
Financial Performance
1,294 Boe/d of production in July with majority coming from AEXCO JV (1,165
Boe/d), up from 1,112 Boe/d in June
Positive operating cash flow in second quarter even in low price environment
Expect EBITDA to grow substantially as EEF drilling program begins
Financial and operating results for 1H 2015:
938 boe/d
$6.3 million revenue
Operating margin of $23.11/boe
$17.6 million of capital expenditures
143
2015 Developments
East Texas Eagle Ford
Moving forward plan to drill and operate initial two wells, which will hold over 2,500 core
net acres
Recent Apache Walker wells are on strike with our acreage and are Apache’s best
results to date
AEXCO Mississippi Lime Joint Venture: Continued execution with recent well results
performing above expectations
Single well economics remain attractive in current price environment (+20% IRR)
East Texas Buda-Georgetown-Glen Rose
Drilled four wells to date to hold core acreage until end of 2016 – initial results have been disappointing
Working to review and interpret results to evaluate best method of development
Waiting on seismic (3Q15) before allocating more capital to the area
144
High Quality Assets Performing Well in
Low Price Environment
Rig activity in EEF picking up (Anadarko, Halcón, Apache, PetroMax) as operators drill their best
assets in low oil price environment
Apache added 2nd rig after recently drilling their best wells to date, which are delivering above
Juneau’s forecast
Lower drilling costs (falling from $9.5mm to $7.5mm) and continued improvement in projected
reserves/well support expected returns by partially offsetting falling oil prices
Recent sizeable nearby acreage sales over $6,000/acre are above Juneau’s acreage cost
Juneau’s position is one of the largest privately-held positions in the play and is expected to
command a premium if Juneau’s acreage and future wells were to be sold
Eastern
Eagle Ford
AEXCO
Miss Lime
Joint
Venture
New horizontal wells outperforming Leucadia underwriting case, with lower drilling costs and higher
production rates helping maintain strong rates of return
At current NYMEX oil strip, total future Aexco anticipated cash flow over $90 million. Potential ROI
of 3.6x vs. underwriting case ROI of 4x
Higher future oil prices would materially increase ROI
East Texas
BGGR
Fulfilled drilling commitment until end of 2016
Waiting on seismic to analyze results
Operators continue development around Juneau’s position
145
Strategic Priorities
Focus on execution of two well program in East Eagle Ford to illustrate value of
position
Maximize value of existing assets through detailed technical work
Seismic to be available for Houston and Brazos/Burleson assets in Q3/Q4 2015
Understand best practices in each area
Continue data sharing with nearby operators
Continue funding AEXCO drilling program from cash flow and as long as returns are
adequate (+20%)
Evaluate opportunities to add high quality assets to Juneau portfolio
146
linken
147
Company Overview
Fast-growing fixed wireless broadband internet provider in Italy
280,737 subscribers as of 9/30/15
82% annualized subscriber growth rate since Leucadia’s initial investment in 2011
Commercially launched LTE in Q4 2014, increasing customer download speeds well
above the national average
Nationwide network deployment with base stations, fiber exchange points, points of
sale and customers in every region
As of 9/30/15, over 1,300 base stations deployed reaching 44% of the population
300+ fiber points of presence
2,000 indirect sales and distribution points
.84MHz of 3.5 GHz spectrum covering over 80% of the population and at least 42
MHz in the remaining 20%
.54% national brand awareness
148
Industry Update
.The Italian broadband market is dominated by low-speed ADSL
- Over the next several years, ADSL with be replaced by both wireless and fiber
solutions
- With a comparable service to fiber, lower capex and an unmatched speed of
deployment, Linkem is poised to become an integral component of Italy’s
broadband solution
. While behind the pace of other European countries, consolidation in the Italian
telecom market is picking up
- Wind (Vimpelcom) and 3 Italia (Hutchison) are combining businesses to create the
largest Italian mobile operator and second largest broadband provider
- ADSL operator Tiscali and fixed wireless provider Aria are also merging
. High-frequency spectrum values are increasing globally, as recently witnessed in the
2015 U.S. auction
. Increased competition among owners of domestic telecom towers should push down
operating costs in the near-term
149
Italian Market Potential
Today: LTE & WiMAX Coexistence
2018E: ~100% LTE Network
Household Coverage Evolution
Over the next 3 years Linkem plans to significantly increase its coverage and penetration
across Italy’s 26 million households
0-20%
21-40%
41-60%
61-80%
81-100%
Household Coverage Key
.Linkem currently covers 44%
of the country, representing
11.3 million households
.Linkem has been
aggressively deploying LTE
technology since Q4 2014;
57% of the network is now
LTE-enabled
.Initial LTE deployment
focused on Southern Italy,
including the city of Bari,
Puglia, where Linkem has
reached 5.7% household
penetration
(Bari)
150
Customer Base and Growth
.82% annualized subscriber growth rate since Leucadia’s initial investment in 2011
.280,737 subscribers as of 9/30/15
.Marketing activities in the first eight months of 2015 were restrained due to the LTE
rollout and capacity issues on existing towers; marketing picked up in September
.Base stations reach operating break even with less than 80 subscribers; we currently
have over 200 subscribers per base station and expect over 350 subscribers on a full
LTE base station
Subscriber Growth
0
50
100
150
200
250
300
Q1
Q2
Q3
Q4
Q1
Q2
Q3
Q4
Q1
Q2
Q3
Q4
Q1
Q2
Q3
Q4
Q1
Q2
Q3
Subscribers (000’s)
2011
2012 2013
2014
2015
151
2015 Developments
. EBITDA positive since Q4 2014
. Migrating our network to LTE from legacy WiMax technology
- The company ended August 2015 with 245 greenfield LTE base stations and 511
LTE overlay antennae on-air
. The company’s network is now 57% LTE-enabled
- With LTE, customers are experiencing peak speeds up to 30 mbps, versus the
Italian average of 5 mbps
. Our prices remain below the national average, creating strong incentives for new
customers to switch to Linkem and providing significant value to existing
customers
. Signed a new hardware agreement to support the LTE deployment
- Related equipment financing at attractive rates
. Established a second customer call center in Taranto, Puglia
. National marketing campaign commenced in September 2015
152
Strategic Priorities
. Increase coverage through LTE network deployment
- Long-term goal of 80%+ Italian household coverage
. Early focus on the region of Puglia in order to take meaningful market share
- The region is a microcosm for the country as a whole
- As of September 2015, 81.0% of households in the region are covered with 3.5%
household penetration
. We cover 100% of Bari, the largest city in Puglia, with 5.7% household
penetration
. Maintain subscriber growth on the existing footprint
. Maintain excellent operating metrics and customer satisfaction
. Prepare to deploy network in major Italian cities
- Rome launch expected in 1H 2016
- Launches in major northern cities expected in 2H 2016 / 2017
153
CONWED
GLOBAL NETTING SOLUTIONS
154
Company Overview
. Leading manufacturer of extruded, oriented and knitted plastic netting used in
a variety of applications, including agriculture, automotive, building &
construction, energy, filtration, hygiene, medical and packaging
- 90% share in core markets such as sediment control and carpet cushion
- Operates 5 manufacturing facilities on 2 continents and has a global
distribution network
- Facilities located in Minnesota, Georgia, Illinois, Virginia and Belgium
. In 2014, Conwed acquired 80% of Filtrexx, a manufacturer and marketer of a
knitted sock product with numerous applications in sediment control and storm
water management, and 100% of Weaver Express, the leading installer of
Filtrexx’s knitted sock products manufactured and marketed by Filtrexx
. Filtrexx and Weaver Express have been combined under the Filtrexx name –
Filtrexx is a growing manufacturer, marketer and installer of compost filter
socks to oil and gas drillers and the construction industry
155
Industry Update
. Raw material prices have dropped 27% since October 2014. Lower oil prices
have driven down costs, but a tight capacity situation has allowed
polypropylene manufacturers to increase margins
. Modest economic growth expected from increased building and construction
in both commercial and residential areas
. Increased domestic competition from our main competitor’s relocation of
capacity from Europe to the U.S.
- Relationships, customer service and superior product quality have mitigated
this risk
. Growth expected from Filtrexx/Weaver acquisitions as we continue to look to
expand geographically and into new applications
. Continued development of new products and markets will provide modest
growth; development lifecycle is 18 to 36 months
156
Financial Performance
. YTD 2015 margin compression is primarily driven by first quarter seasonality
in Filtrexx, lower demand from the oil and gas industry and a weak euro
FYE December 31,6M ($ in 000s) 2012 2013 2014 06/30/15 Revenue 89,357 $ 105,355 $ 128,831 $ 66,802$
% Growth 4.0% 17.9% 22.3% 15.3%
Pre-tax Income 11,453$ 15,329$ 13,856$ 6,480$
% Margin 12.8%14.6%10.8%9.7%
157
2015 Developments
. Continued integration of Filtrexx and Weaver Express since their acquisitions
in 2014
- Combined annual revenues of $35 million at time of acquisition
- Superior product replacement for silt fence in the sediment control area
- Control of supply chain from production of yarn to installation of filter sock
. Filtrexx has endured headwinds as lower oil prices have slowed drilling in
major shale plays
. Despite increased competition and a weak euro, Conwed’s legacy business
has performed well thanks in part to lower raw material costs
. Continued to gain market share in reverse osmosis filtration
. Developing new products in core businesses
158
Strategic Priorities
. Drive annual organic growth
- Continued co-development with customers
- New products, markets and applications for Conwed’s core technology
- Geographic market expansion
. Minimize lost business
. Relentlessly improve customer service levels
. Develop Filtrexx business organically and through acquisitions
159
IDAHO TIMBER
160
Company Overview
. Manufacturer and distributor of wood products including:
- Remanufacturing dimension lumber
- Remanufacturing, bundling and bar coding of home center boards and related
products
- Primary manufacturing of pine dimension lumber, pine decking and cedar
products
. plants and 3 sawmills located in Arkansas, Florida, Idaho, Louisiana, New
Mexico, North Carolina and Texas
- 922,000 square feet of manufacturing and office space, covering ~214 acres
161
Company Overview (continued)
. Remanufacturing Segment
- Purchase lower-value dimension lumber and remanufacture to add value and
develop tallies that allow us to provide just-in-time deliveries of specified products
to our customers
- Customer base consists primarily of pro dealers and lumber yards
. Home Center Board Segment
- Proprietarily grade, bundle and bar code board products for delivery to home
center stores
- Additional service provided through vendor managed inventory programs
. Sawmill Segment
- Primary sawmills located in Arkansas and Louisiana manufacture southern yellow
pine products and sell primarily to lumber treating companies
- Much of the product we sell ends up as treated decking for sale in home center
stores
162
Industry Update
.Since 2007, the recession and U.S. housing market collapse caused significant
headwinds
.In 2014, the housing industry saw continued signs of life and Idaho Timber
delivered its best full-year performance since Leucadia’s acquisition in 2005
.Although 6M 2015 housing starts continue to improve at a moderate pace, the
lumber industry has out-produced demand causing a lumber market correction
-
500.0
1,000.0
1,500.0
2,000.0
2,500.0
1990
1992
1994
1996
1998
2000
2002
2004
2006
2008
2010
2012
Starts in 000’s
Housing Starts
Actual starts
Ave starts since 1959
163
Financial Performance
300,000
350,000
400,000
450,000
500,000
2011
2012
2013
2014
Shipments in MBF
Shipments
($ in 000’s)
FYE December 31,
6M
2012
2013
2014
06/30/15
Revenue
$ 163,513
$ 205,407
$ 251,632
$ 124,995
% Growth
2.8%
25.6%
22.5%
NA
Pre-Tax Income $ 6,397
$ 9,599
$ 17,827
$ 5,870
% Margin
3.9% 4.7%
7.1%
4.7%
164
2015 Developments
. The remanufacturing segment is experiencing additional supply opportunities and
spread challenges due to industry wide production increases and moderating
demand by the Chinese of certain lumber items
. We expect continued market volatility which could create strategic purchasing
opportunities
. We have increased volumes to our largest customer for the home center board
segment, thereby improving current year results and segment outlook
. The sawmill in Coushatta is operating on a one-shift basis and showing steady
improvement in production efficiency as our work force gains experience
165
Strategic Priorities
. Primary Mill: Develop production capabilities to achieve more efficient production on a full one-shift capacity basis
. Boards: Continue working with home centers to develop viable programs
. Remanufacturing: Increase profitability by increasing shipments over 2014 while maximizing spread
. Business Development: Explore opportunities to expand by organic growth or acquisition
166
GOLDEN QUEEN
167
Company Overview
. Golden Queen Mining Company LLC (“Golden Queen”) is currently constructing its
100%-owned Soledad Mountain gold and silver project located in Kern County,
California, approximately 90 miles northeast of Los Angeles
- Open-pit, heap-leach operation
- Stable jurisdiction with excellent infrastructure
. A recently commissioned feasibility study estimates that the project will produce, on
average, ~84,000 gold equivalent ounces annually over its 12 year mine life (1)
- Opportunities may exist to extend the project mine life
Fully funded to production and on track to start commissioning in late 2015, with metals sales commencing shortly thereafter
Leucadia effectively owns approximately 35% of Golden Queen through a joint venture with the Golden Queen Mining Company Ltd. (TSX:GQM) (“GQ Canada”) and the Clay family, GQ Canada’s largest shareholder
- Set up as a pass through for tax purposes
- Governance and oversight is split equally among Leucadia, the Clay family and GQ Canada
Source: Soledad Mountain Project Technical Report and Updated Feasibility Study (February 25, 2015).
(1)~84,000 Gold Equivalent Ounces produced represents the average between years 2-11.
168
2015 Developments
. As of August 2015, project construction remains on-time and on-budget
- Construction ~70% completed, with over $75 million of initial capital expenditures
spent
- ~60% of remaining capital expenditures are locked in under contracts
Bob Walish was appointed CEO of the project in July 2015
- Most recently the General Manager of the SCM Franke Operation of KGHM
International, an open-pit, heap-leach copper mine in northern Chile
Completed an updated Feasibility Study and Resource Estimate
- Only ~65% of the estimated resource is currently included in the mine plan
- A number of initiatives are underway to maximize the value of the defined resource
- Total cash costs, including sustaining capital expenditures and net of silver credit, are expected to average $558 / oz gold sold over the life of the project (1)
Source: Bloomberg, Soledad Mountain Project Technical Report and Updated Feasibility Study (February 25, 2015).
(1)Per the 2015 Feasibility Study, Total Cash Costs, Net of Silver By-product per Ounce includes mining, processing and site G&A operating expenses as well as sustaining capital expenditures, net of silver revenue, per ounce of gold sold.
169
Strategic Priorities
. Maintain construction momentum and promote a safe work environment
- Commissioning of the various processing plants is expected to begin in Q4 2015
Optimize near-term mine planning to maximize upfront cash flows
- Already completed one infill drill program that positively impacted expected production
Continue to strategically acquire land around the project, which will facilitate efforts to increase the approved project boundary in the future
. Actively pursue a by-product aggregate business
- The project’s waste rock has potential for use in ready-mix concrete, hot mix asphalt and other products with minimal further processing
- Strategically located by rail and highway to large Southern California markets
170
Q & A
IRQuestions@Leucadia.com
Appendix
171
Leucadia – Cash and Investments and Parent Debt GAAP
Reconciliations
Reconciliation of Cash and Investments($ millions)
Available Cash and Investments (GAAP) at June 30, 2015$1,377.8
Redemption of 8.125% Senior Notes due September 2015(458.4)
Available Cash and Investments, As Adjusted 919.4$
Reconciliation of Parent Debt ($ millions)
Parent Debt, Excluding Redeemable Preferred Shares (GAAP) at June 30, 2015$1,446.5
Redemption of 8.125% Senior Notes due September 2015(458.4)
Parent Debt, As Adjusted 988.1$
172
Leucadia – Tangible Book Value and Fully-Diluted Shares
Outstanding GAAP Reconciliations
Note: Fully Diluted shares exclude shares for warrants, options, convertible debt and preferred shares.
Reconciliation of Leucadia Book Value (Leucadia’s Shareholders’ Equity) to Tangible Book Value:
($ millions)
6/30/2015 Leucadia Book Value (GAAP) 10,655$
Less: Goodwill and Intangible Assets 2,685
Leucadia Tangible Book Value (Non-GAAP) 7,970$
Reconciliation of Leucadia GAAP Shares Outstanding to Fully Diluted Shares Outstanding (a non-GAAP measure)
(millions of shares)
6/30/2015 Leucadia Shares Outstanding (GAAP) 366.6 Restricted Stock Units 12.7 Other 0.9 Leucadia Fully Diluted Shares Outstanding (Non-GAAP) 380.2
173
Leucadia – Tangible Book Value GAAP Reconciliation
(1) Dollar amounts are Leucadia’s net carrying amount as of 6/30/15 for each investment, for consolidated subsidiaries equal to their assets less liabilities.
(2) Reduced for payoff at maturity of 2015 8.125% Sr. Notes using Parent Company Cash.
Reconciliation of Book Value to Tangible Book Value($ Millions) Tangible
Book Value Goodwill and Book Value( GAAP) (1) Intangibles, Net (Non-GAAP)
Jefferies 5,533$ 1,951$ 3,582$
Leucadia Asset Management 548 - 548
FXCM 759 - 759
Home Fed 234 - 234
Berkadia 207 - 207
Foursight & Chrome 77 - 77
National Beef 766 667 99
HRG 606 - 606
Vitesse & Juneau 453 - 453
Garcadia 185 - 185
Linkem 146 - 146
Golden Queen 81 - 81
Conwed 115 64 51
Idaho Timber 74 - 74
Cash & Investments (2) 919 - 919
Deferred Tax Asset 1,152 - 1,152
Other 65 3 62
Corporate Other Liabilities, Net (152) - (152)
Debt and Preferred Equity (2) (1,113) - (1,113)
10,655 $ 2,685 $ 7,970$
174
Berkadia – GAAP Reconciliation
Reconciliation of Pre Tax Income to Cash Earnings (a non-GAAP measure)
YTD June 30, 2010 2011 2012 2013 2014 2014 2015 Pre Tax Income (GAAP) $ 31.0 $ 34.6 $ 103.8 $ 152.6 $ 191.3 $ 79.4 $ 108.1
Amortization, impairment and depreciation$ 88.1 $ 107.5 $ 112.7 $ 94.7 $ 105.5 $ 46.6 $ 53.8
Gains attributable to origination of MSR’s$ (42.4)$ (45.2)$ (93.1)$ (120.4)$ (117.2)$ (36.7)$ (70.1)
Loan loss reserves and guarantee liabilities, net of cash losses$ 3.1 $ 3.2 $ 18.8 $ 29.3 $ 28.8 $ 4.1 $ 21.7
Unrealized (gains) losses; and all other, net$ (9.1)$ 7.0 $ (7.7)$ (3.6)$ (35.0)$ (21.4)$ (28.5)
Cash Earnings (Non-GAAP)$ 70.7 $ 107.1 $ 134.5 $ 152.5 $ 173.3 $ 72.0 $ 85.0
($ Millions)
175
Jefferies – Bache Adjusted Earnings GAAP
Reconciliation
This presentation of Adjusted financial information is an unaudited non-GAAP financial measure. Adjusted financial information begins with information prepared in accordance
with U.S. GAAP and then those results are adjusted to exclude the operations of Jefferies’ Bache business. Management believes that the disclosed Adjusted measures and any
adjustments thereto, when presented in conjunction with comparable U.S. GAAP measures are useful to investors as they enable investors to evaluate Jefferies’ results in the
context of exiting the Bache business. These measures should not be considered a substitute for, or superior to, measures of financial performance prepared in accordance with
U.S. GAAP.
Accompanying footnotes on the following slide.
Reconciliation of Consolidated Adjusted Financial Information($ millions)
Nine Months Ended 8/31/2015 Full Year Ended 11/30/2014 LTM Ended 2/28/2014 GAAP Adjustments Adjusted GAAP Adjustments Adjusted GAAP Adjustments Adjusted Revenues Fixed Income 261 $ 81$ (1) 180$ 748$ 203$ (1) 545$ 790$ 207$ (1) 583$
Other -$ -$ -$ -$ -$ -$ 5$ -$ 5$
Net Revenues 1,962$ 81$ (1) 1,881$ 2,990$ 203$ (1) 2,787$ 3,040$ 207$ (1) 2,833$
Net Revenues After Preferred Interest 1,962 $ 81$ (1) 1,881$ 2,990$ 203$ (1) 2,787$ 3,036$ 207$ (1) 2,829$
Non-Compensation Expenses 675 115 (3) 560 989 250 (3)(5)(8)739 868 138 (3)(5)(7)730
Compensation and Benefits 1,182 81 (4) 1,101 1,699 99 (4) 1,600 1,722 111 (4) 1,611
Total Expenses 1,857 196 1,661 2,687 349 2,338 2,590 249 2,341
Earnings Before Tax & MI 105 (115) 220 303 (146) 449 447 (42) 489
Income Tax 29 (37) 66 142 (46) 188 162 (18) 180
Minority Interest - Equity 2 - 2 3 - 3 11 - 11
74$ (78)$ 152$ 158$ (100)$ 258$ 274$ (24)$ 298$
Full Year Ended 11/30/2012 Full Year Ended 11/30/2011 GAAP Adjustments Adjusted GAAP Adjustments Adjusted Revenues Fixed Income 1,253 $ 249$ (1) 1,004$ 743$ 118$ (1) 625$
Other 13$ -$ 13$ 74$ 53$ (2) 21$
Net Revenues 3,062 $ 249$ (1) 2,813$ 2,577 $ 170$ (1) (2)2,407$
Net Revenues After Preferred Interest 3,019$ 249$ (1) 2,770$ 2,573$ 170$ (1) (2)2,403$
Non-Compensation Expenses 756 135 (3)(6)621 671 56 (3)(6)615
Compensation and Benefits 1,771 120 (4) 1,651 1,483 34 (4) 1,449
Total Expenses 2,527$ 254$ 2,273$ 2,154$ 90$ 2,064$
Earnings Before Tax & MI 492$ (5)$ 497$ 419$ 80$ 339$
Income Tax 169 (2) 171 133 10 123
Minority Interest - Equity 41 - 41 2 - 2
282$ (3) $ 285$ 285$ 70$ 215$
Successor Net Earnings to Common
Shareholders/Member’s Equity Net Earnings to Common
Shareholders/Member’s Equity Predecessor
176
Jefferies – Bache Adjusted Earnings GAAP
Reconciliation (continued)
(1) Revenues generated by the Bache business, including commissions, principal transaction revenues and estimated net
interest revenue, for the presented period have been classified as a reduction of revenue in the presentation of Adjusted
financial information.
(2) In connection with the acquisition of the Bache business, a bargain purchase gain of $53.0 million was recognized as Other
revenue and has been classified as a reduction of revenue in the presentation of Adjusted financial information.
(3) Expenses directly related to the operations of the Bache business for the presented periods have been excluded from
Adjusted non-compensation expenses. These expenses include Floor brokerage and clearing fees, amortization of
capitalized software used directly by the Bache business in conducting its business activities, technology and occupancy
expenses directly related to conducting Bache business operations and business development and professional services
incurred by the Bache business as part of its client sales and trading activities, including estimates of certain support costs
dedicated to the Bache business. Estimates of certain support costs were derived based on direct support costs for the
presented period in relationship to the average head count of corporate support personnel with responsibilities associated
with operating the Bache business.
(4) Compensation expense and benefits, including salaries, benefits, cash bonuses, commissions, annual cash compensation
awards and the amortization of certain share-based and cash compensation awards, recognized during the presented period
for employees whose sole responsibilities pertain to the activities of the Bache business, including front office personnel and
dedicated support personnel, have been classification as a reduction of Compensation and benefits expense in the
presentation of Adjusted financial information. In addition, compensation and benefits for other corporate support personnel
with duties specific to the Bache operations included in this adjustment were estimated based on an average per person cost
applied to the average head count for this employee population type across the presented periods.
(5) Non- compensation expense includes amortization expense during the presented periods of intangible assets, which arose in
connection with the purchase accounting associated with the Leucadia transaction in the second quarter of fiscal 2013, which
has been classified as a reduction of Non-compensation expense in the presentation of Adjusted financial information.
(6) Non- compensation expense includes amortization expense during the presented periods of intangible assets, which arose in
connection with the purchase accounting for the acquisition of Bache in the third quarter of fiscal 2011, which has been
classified as a reduction of Non-compensation expense in the presentation of Adjusted financial information.
(7) Non- compensation expense for the purpose of the Adjusted financial information is adjusted for a loss incurred associated
with vacating certain office space previously dedicated for Bache operations.
(8) Non- compensation expense for the purpose of the Adjusted financial information is adjusted for goodwill and intangible asset
impairment losses of $59 million related to the Bache business.
177
Jefferies – Adjusted Leverage Ratio GAAP
Reconciliation
The leverage ratio presentation herein is an unaudited non-GAAP financial measure. This ratio should not be considered a substitute for, or superior to,
measures of financial performance prepared in accordance with U.S. GAAP.
Reconciliation of Leverage Ratio - Excluding Impacts of the Leucadia Transaction($ millions)
August 31, May 31, February 28, November 30, August 31, May 31, February 28, November 30, August 31, May 31, 2015 2015 2015 2014 2014 2014 2014 2013 2013 2013 Total assets 42,785$ 44,142$ 43,787$ 44,518$ 44,764$ 43,610$ 43,440$ 40,177$ 38,830$ 38,938$
(1,957) (1,957) (1,957) (1,957) (1,957) (1,957) (1,957) (1,957) (1,957) (1,957)
120 116 112 108 42 37 32 27 18 9
Total assets excluding the impact of the merger 40,948$ 42,301$ 41,942$ 42,669$ 42,849$ 41,690$ 41,515$ 38,247$ 36,891$ 36,990$
Total equity 5,514$ 5,520$ 5,466$ 5,463$ 5,602$ 5,527$ 5,462$ 5,422$ 5,241$ 5,183$
(1,426) (1,426) (1,426) (1,426) (1,426) (1,426) (1,426) (1,426) (1,426) (1,426)
125 125 125 125 125 125 125 125 125 125
(41) (31) (20) (9) (58) (48) (36) (25) (17) (8)
Total equity excluding the impact of the merger 4,172$ 4,188$ 4,145$ 4,153$ 4,243$ 4,178$ 4,125$ 4,096$ 3,923$ 3,874$
Leverage ratio - excluding merger impacts 9.8 10.1 10.1 10.3 10.1 10.0 10.1 9.3 9.4 9.5
Goodwill and acquisition accounting fair value adjustments on the merger with
Leucadia Net amortization to date on asset related purchase accounting adjustmentsEquity arising from merger consideration Preferred stock assumed by LeucadiaNet amortization to date of purchase accounting adjustments, net of tax
178
National Beef – Profit from Operations GAAP
Reconciliation
Reconciliation of Pre-Tax Income to Profit from Operations (a non-GAAP measure)
($ Millions)
Note: National Beef Profit From Operations represents pre-tax income exclusive of depreciation and amortization expenses, impairment charges and net
interest income/expense, which is a common metric used by many investors in its industry to evaluate operating performance from period to period.
(1) Prior to being acquired by Leucadia in December 2011, National Beef’s fiscal year ended in August. In addition, 2012 amounts are not comparable to prior
periods as they reflect the application of acquisition accounting for National Beef, principally resulting in greater depreciation and amortization expenses
during 2012.
FYE August, (1) FYE December, (1) 6 Months Ending June,
2009 2010 2011 2012 2013 2014 2014 2015 Pre-Tax Income (GAAP) 145.1$ 249.0$ 261.6$ 59.0$ (42.4)$ (40.3)$ (21.5)$ (43.0)$
Interest Expense / (Income), net 23.2 14.7 11.7 12.4 12.3 14.5 6.9 8.4
Depreciation & Amortization 44.4 49.6 51.2 83.1 88.5 85.3 42.0 43.9
Impairment of Long-Lived Assets— — 63.3 — -
Profit from Operations (Non-GAAP) 212.7$ 313.3$ 324.5$ 154.5$ 121.7$ 59.5$ 27.4$ 9.3$
179
Leucadia National Corporation
2015 Investor Day
October 8, 2015